A Spectroscopic Study of Solid-Phase Chitosan/Cyclodextrin-Based Electrospun Fibers


Abstract
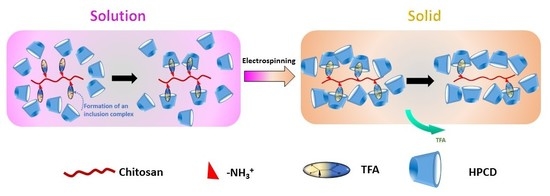
1. Introduction
2. Materials and Methods
2.1. Materials
2.2. Solution Preparation
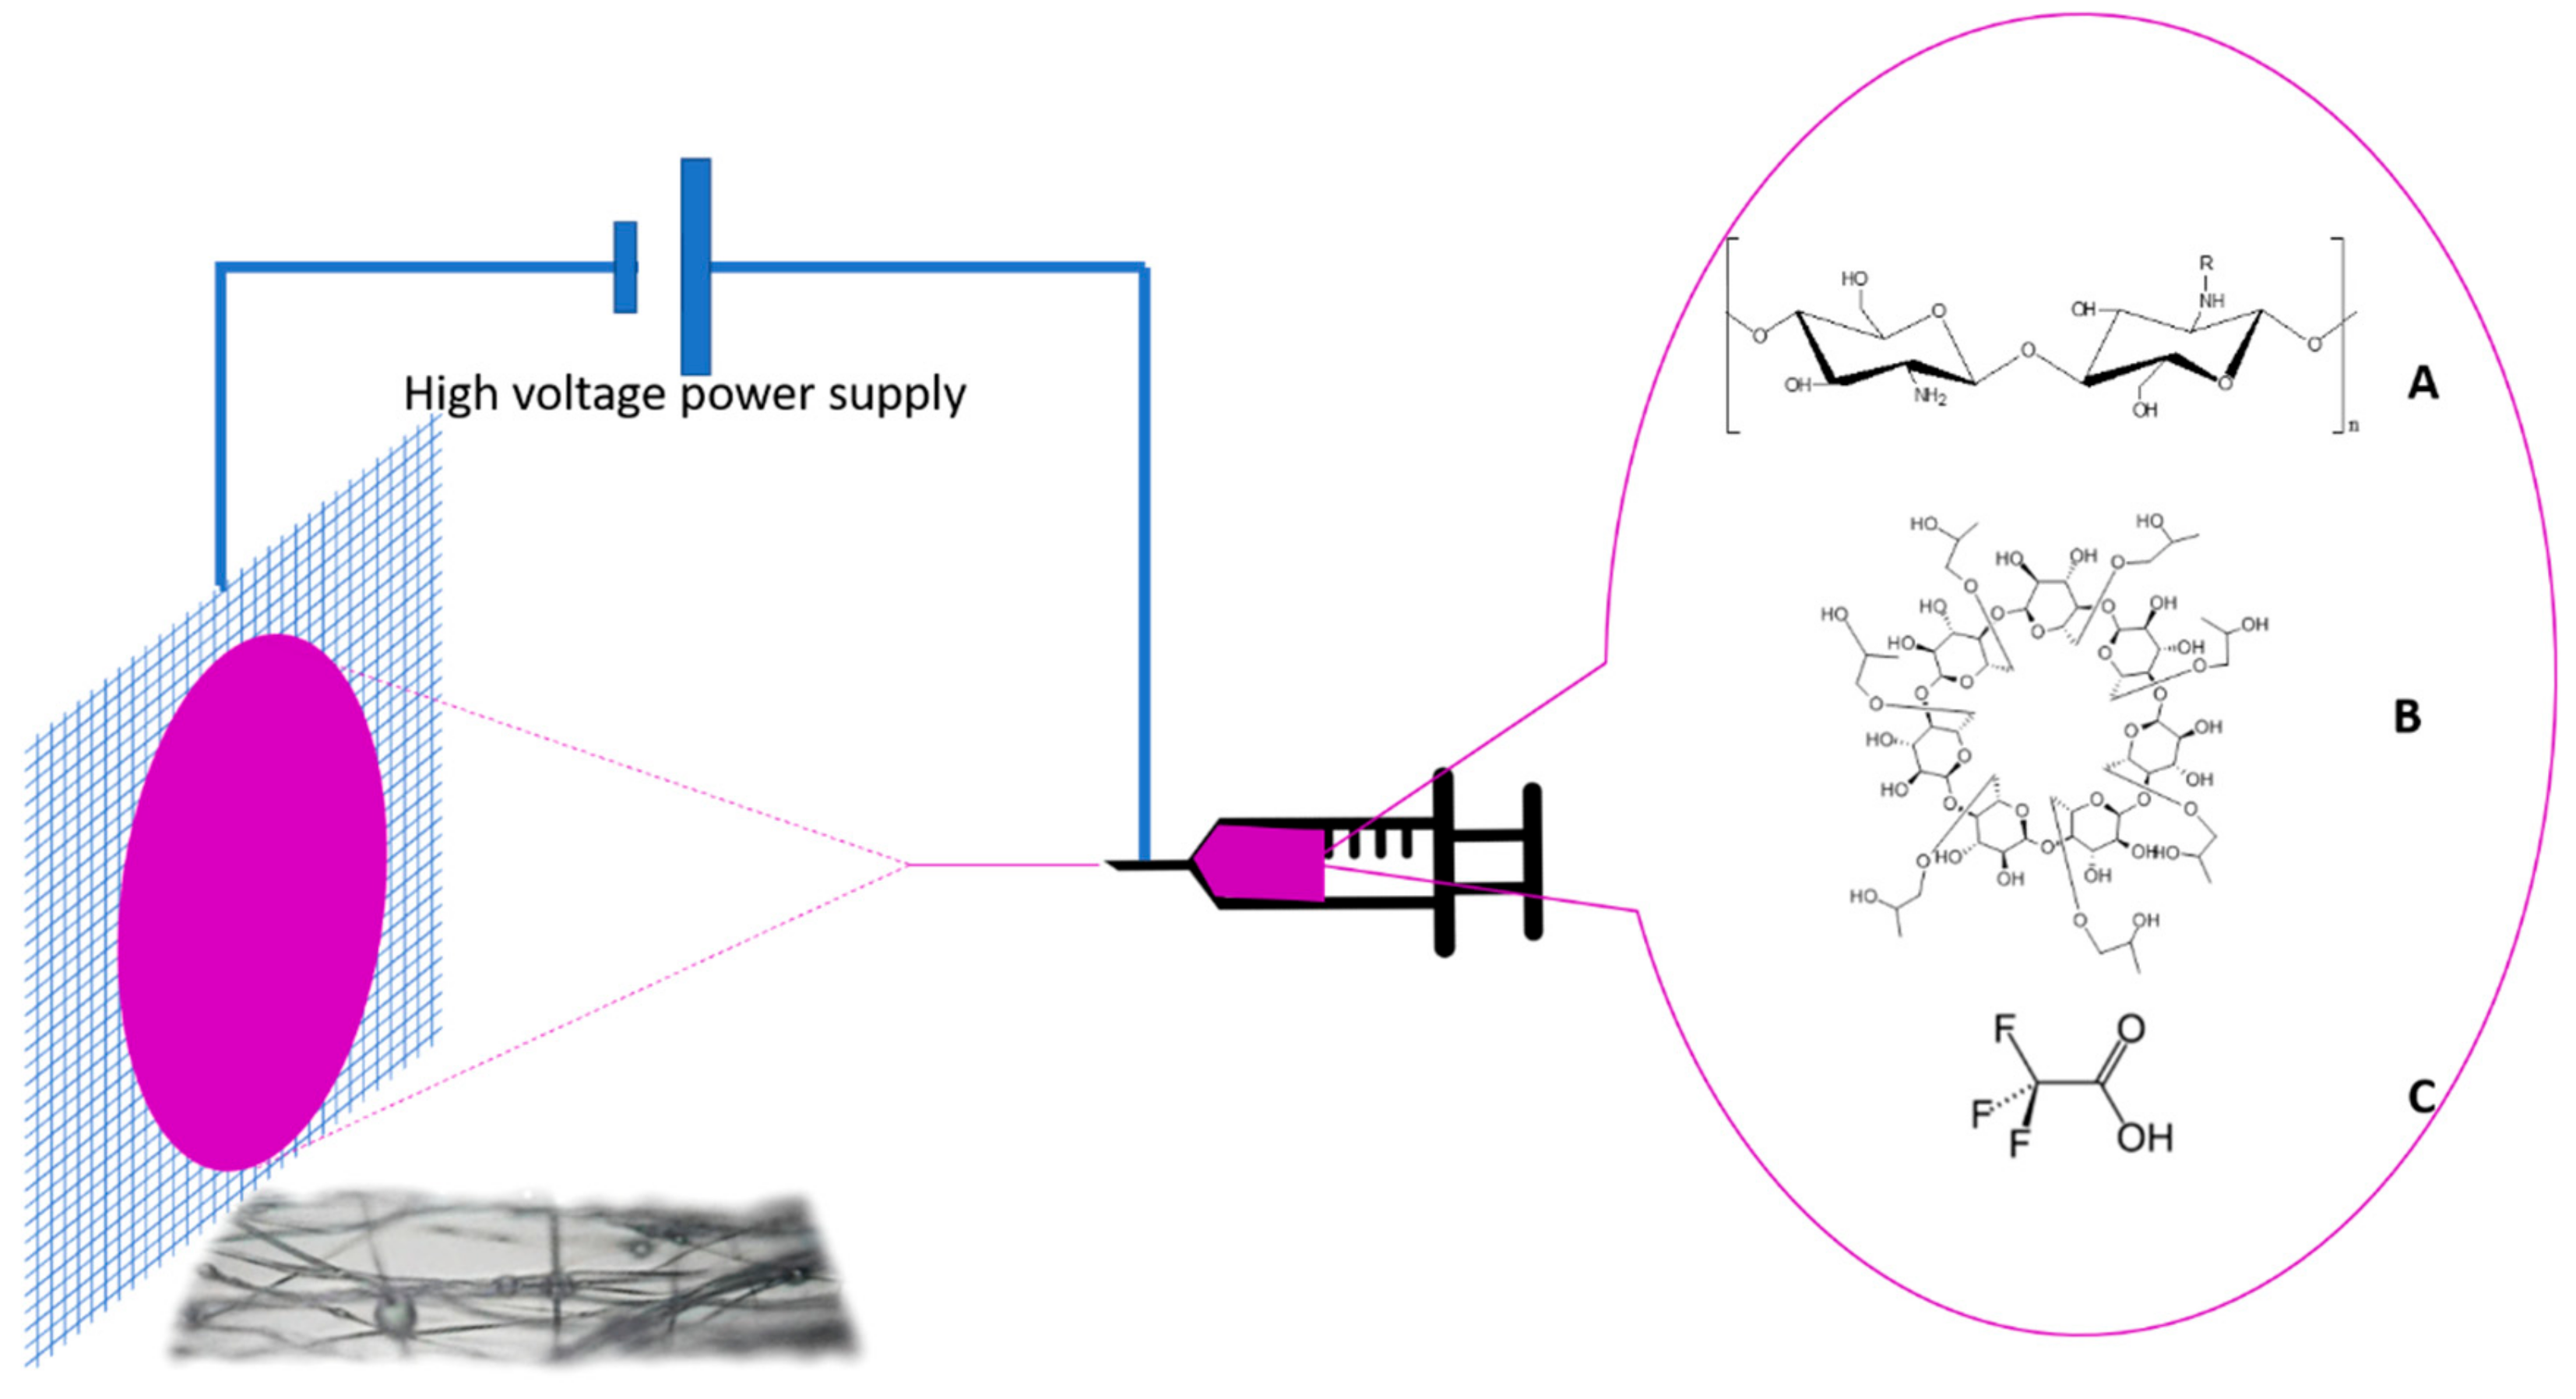
2.3. Electrospinning
2.4. 1H NMR Spectroscopy in Solution
2.5. FT-IR Spectroscopy
2.6. Raman Spectroscopy
2.7. Raman Imaging with Dye Probe
2.8. Differential Scanning Calorimetry (DSC)
2.9. Thermal Gravimetric Analysis (TGA)
2.10. Scanning Electron Microscopy (SEM)
3. Results and Discussion
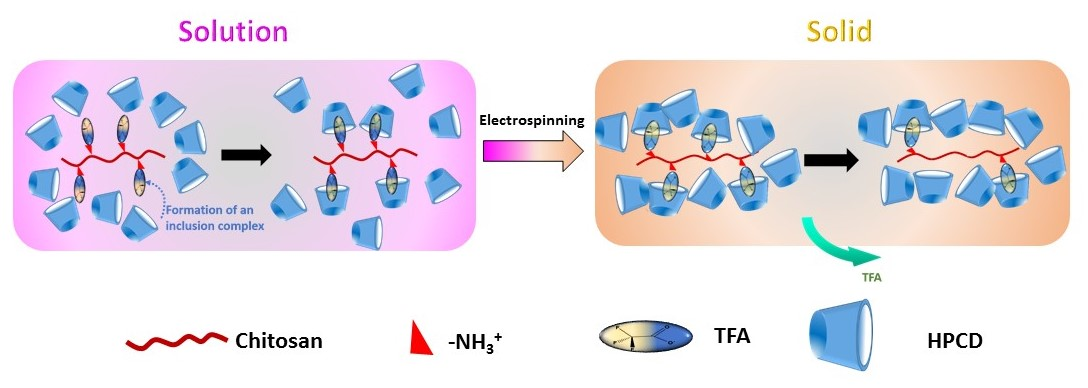
3.1. SEM Results
3.2. Determination of HPCD Content in the As-Spun Fibers
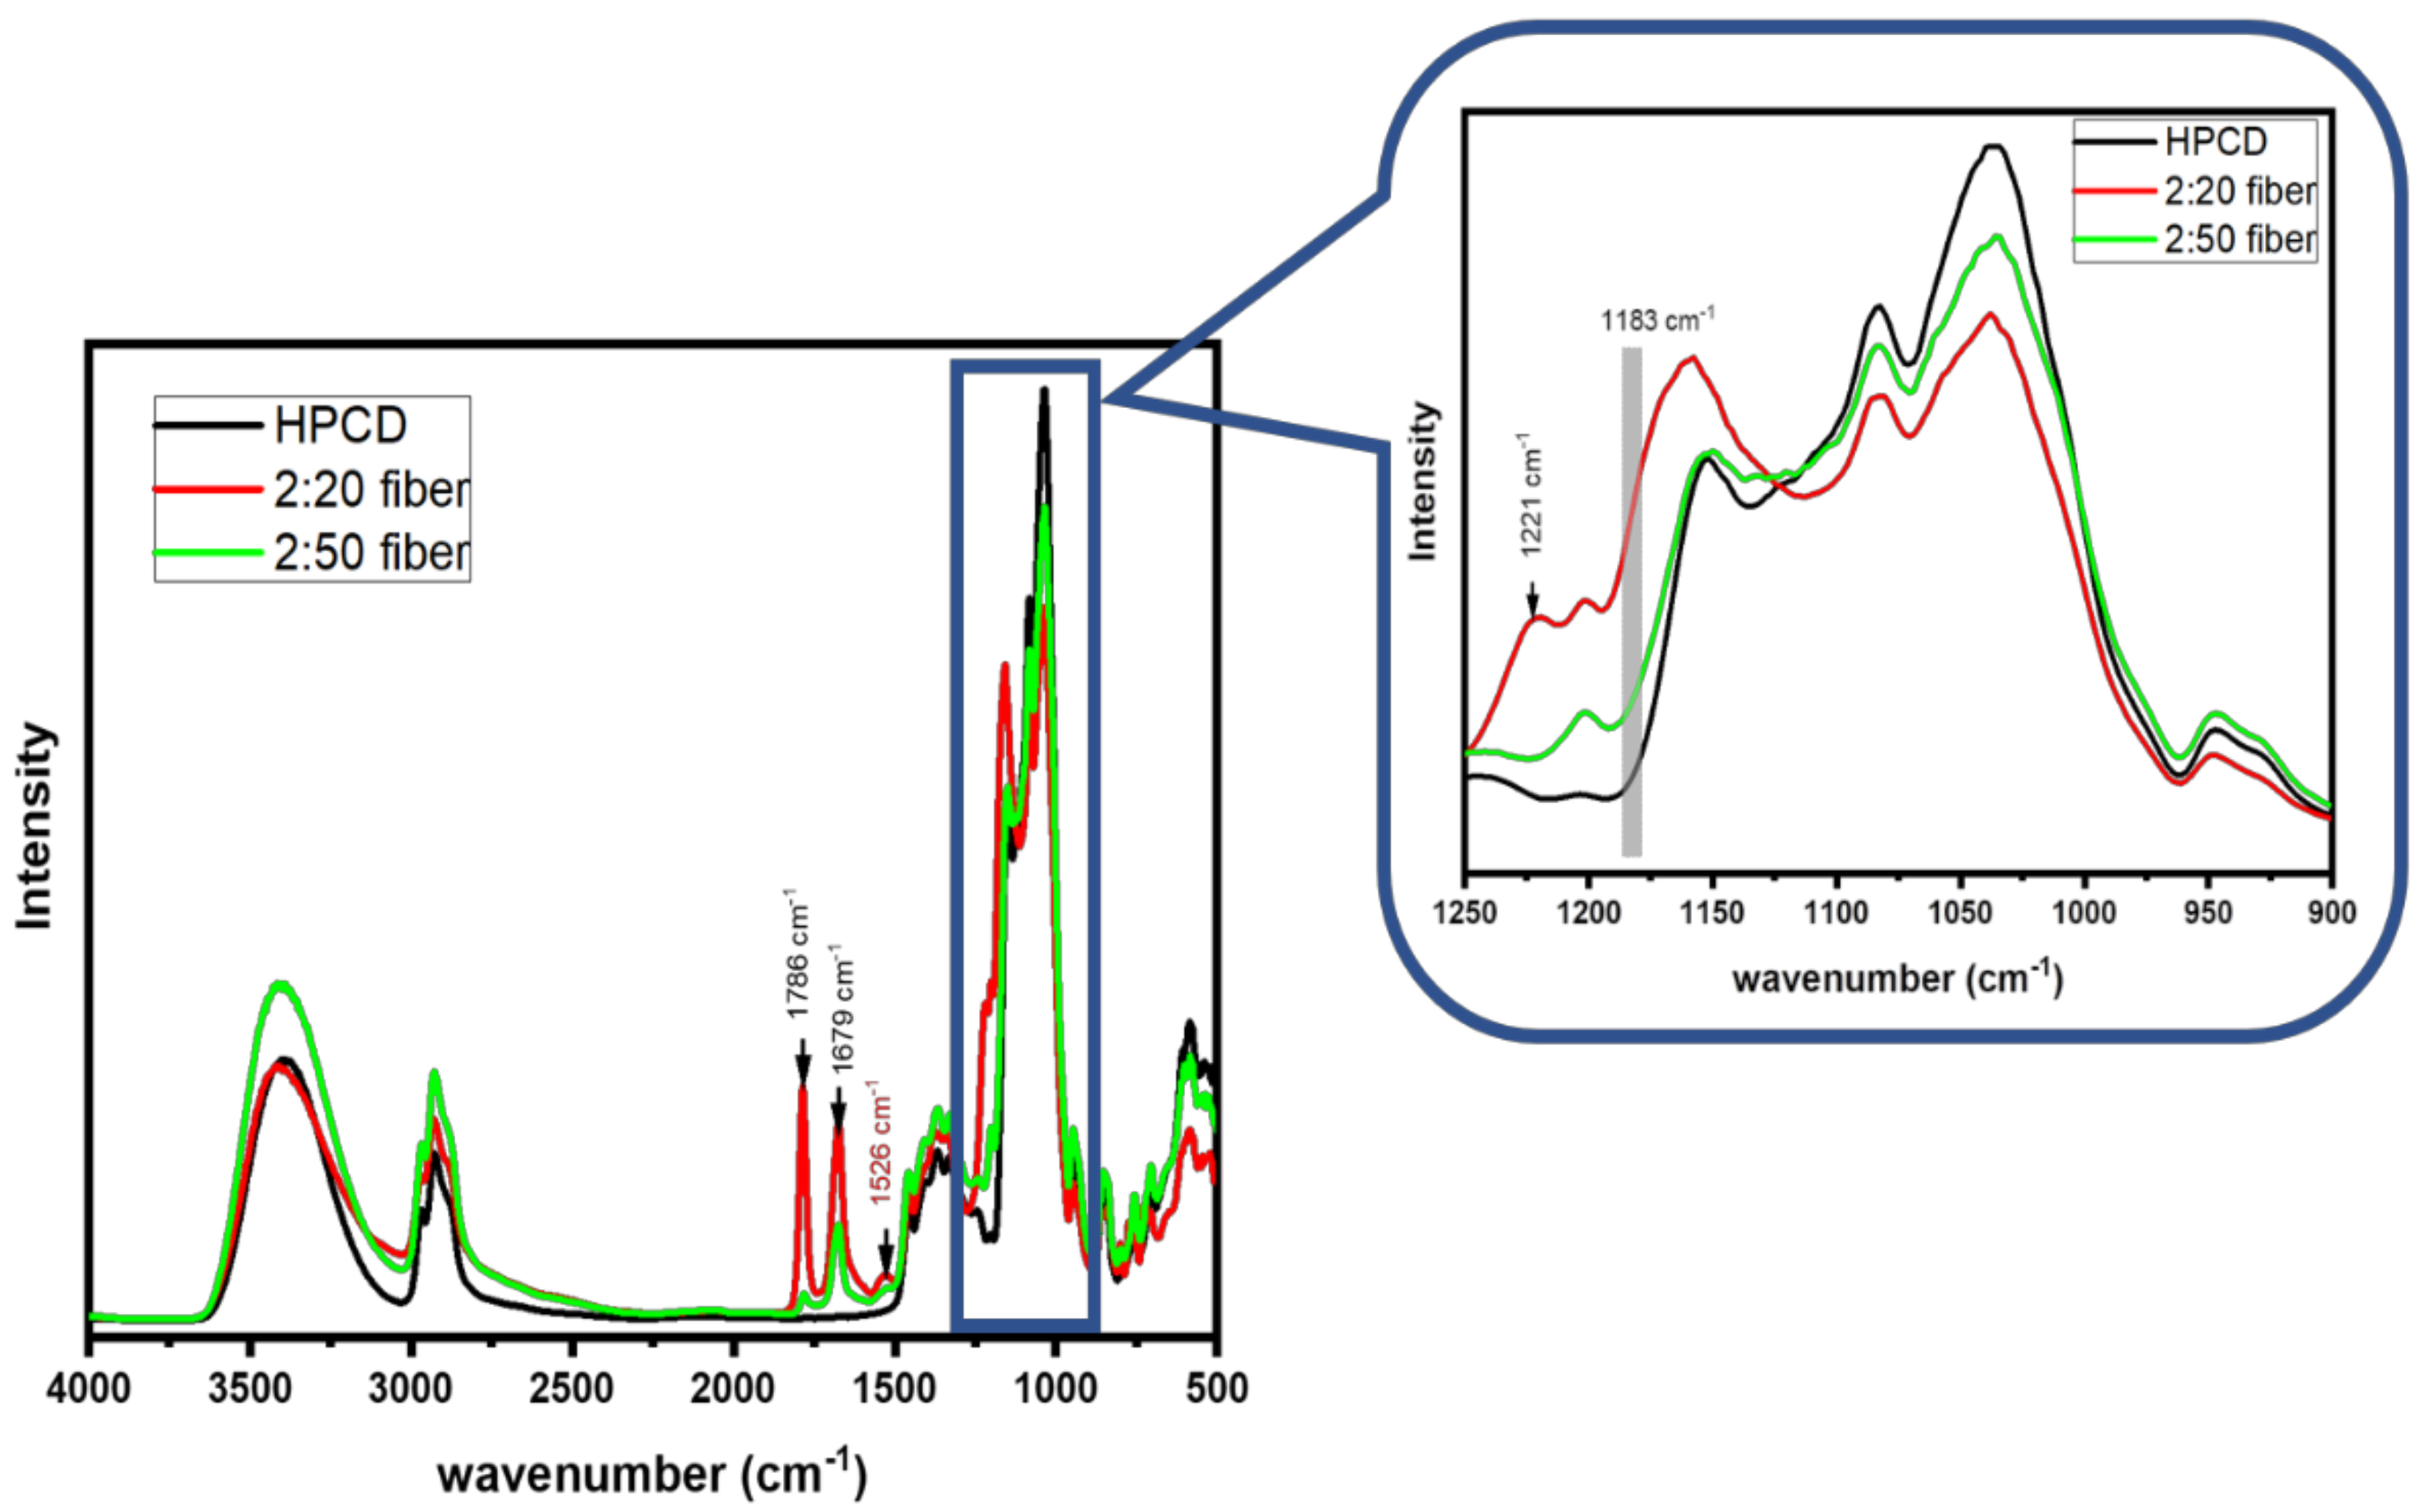
3.3. FT-IR Results of As-Spun Fibers
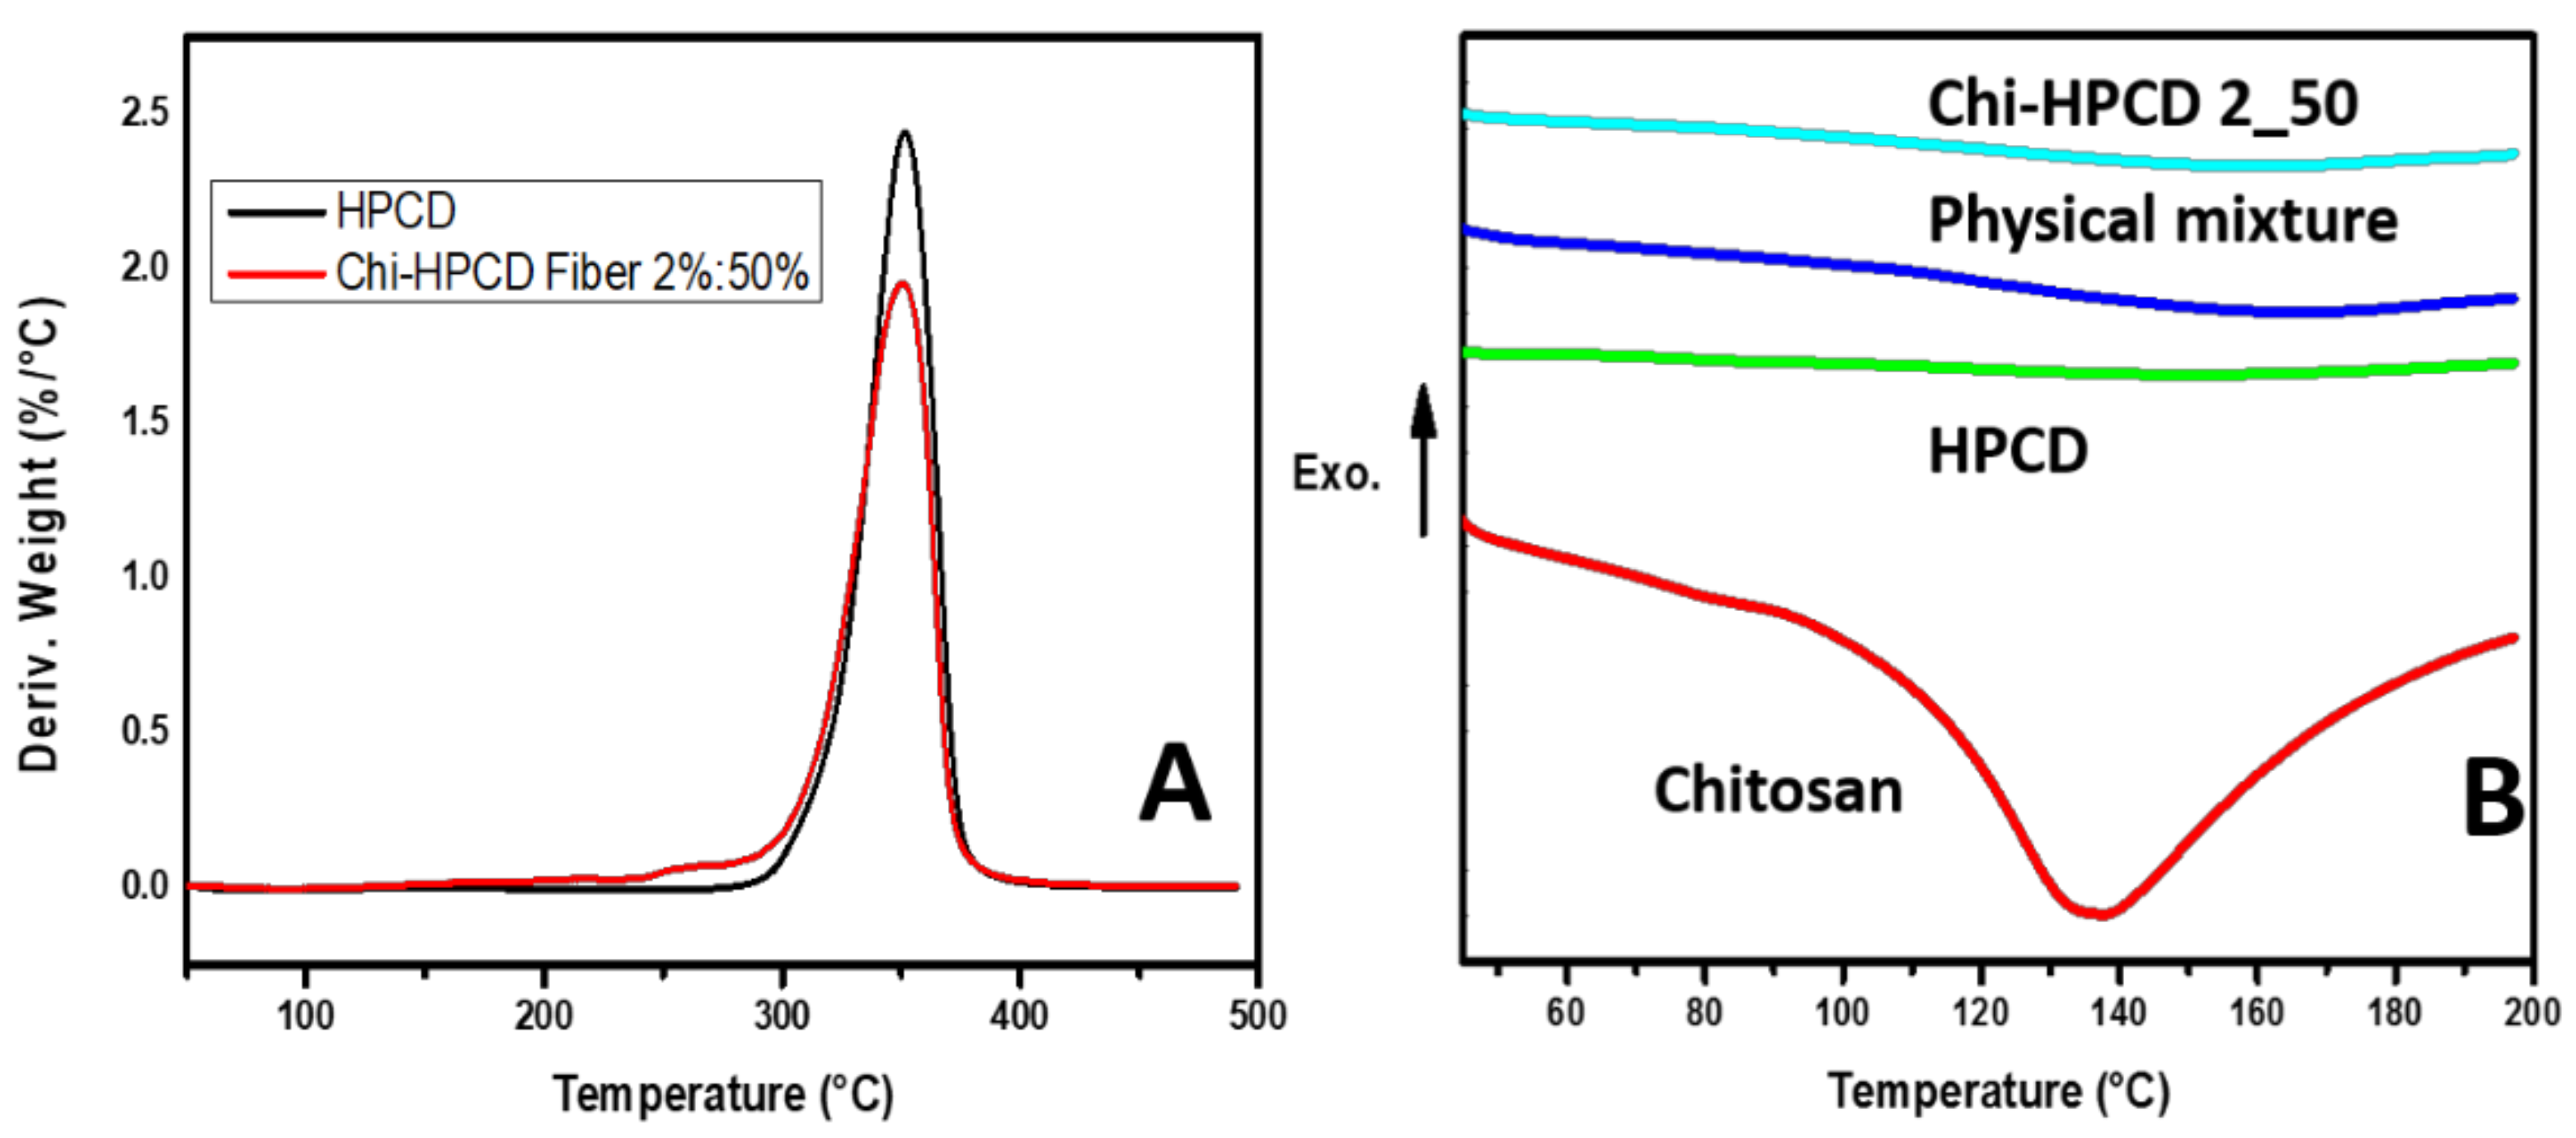
3.4. TGA and DSC Results of Chi:HPCD Fiber
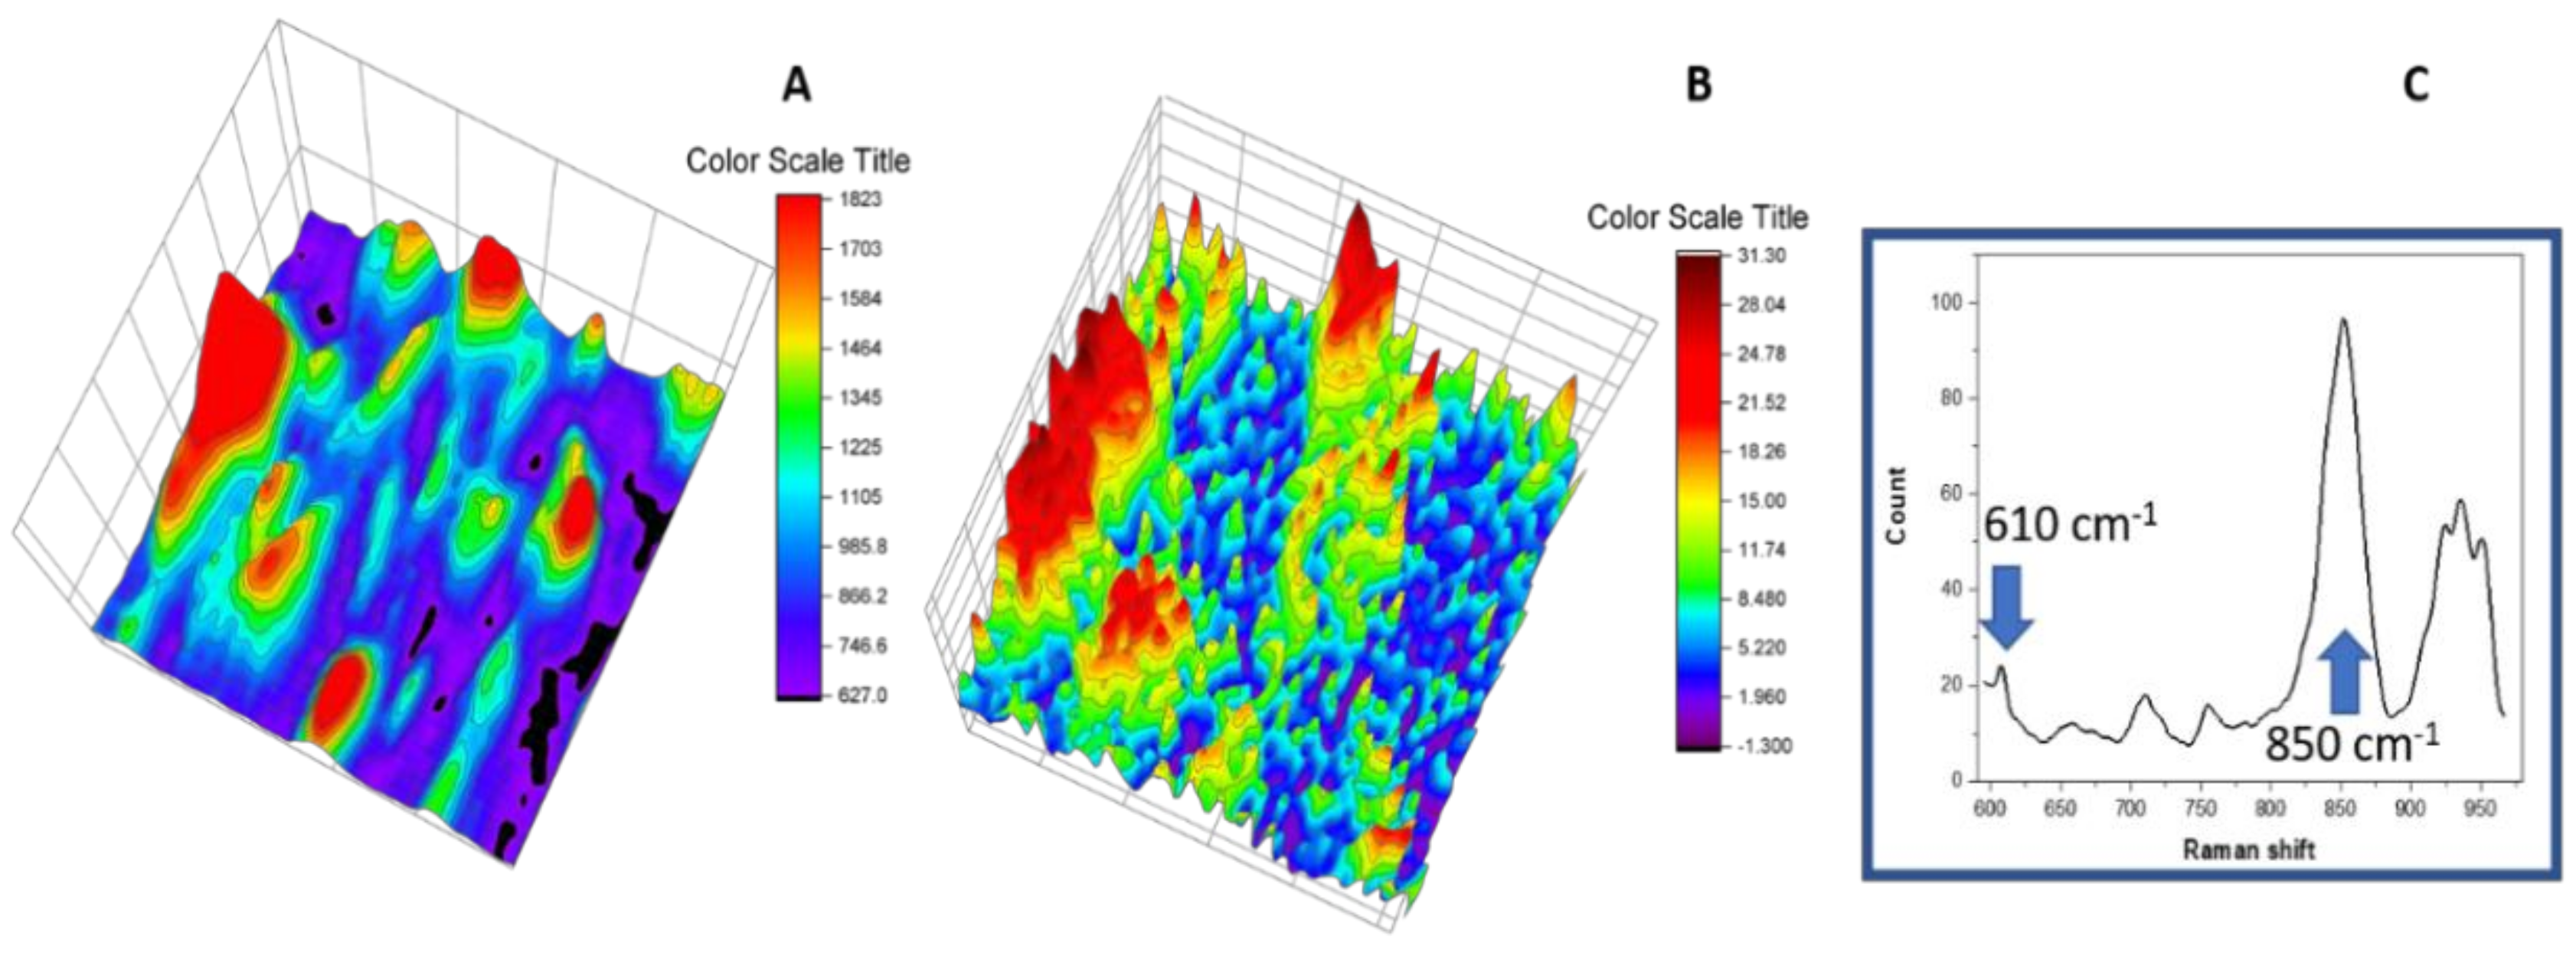
3.5. Raman Results
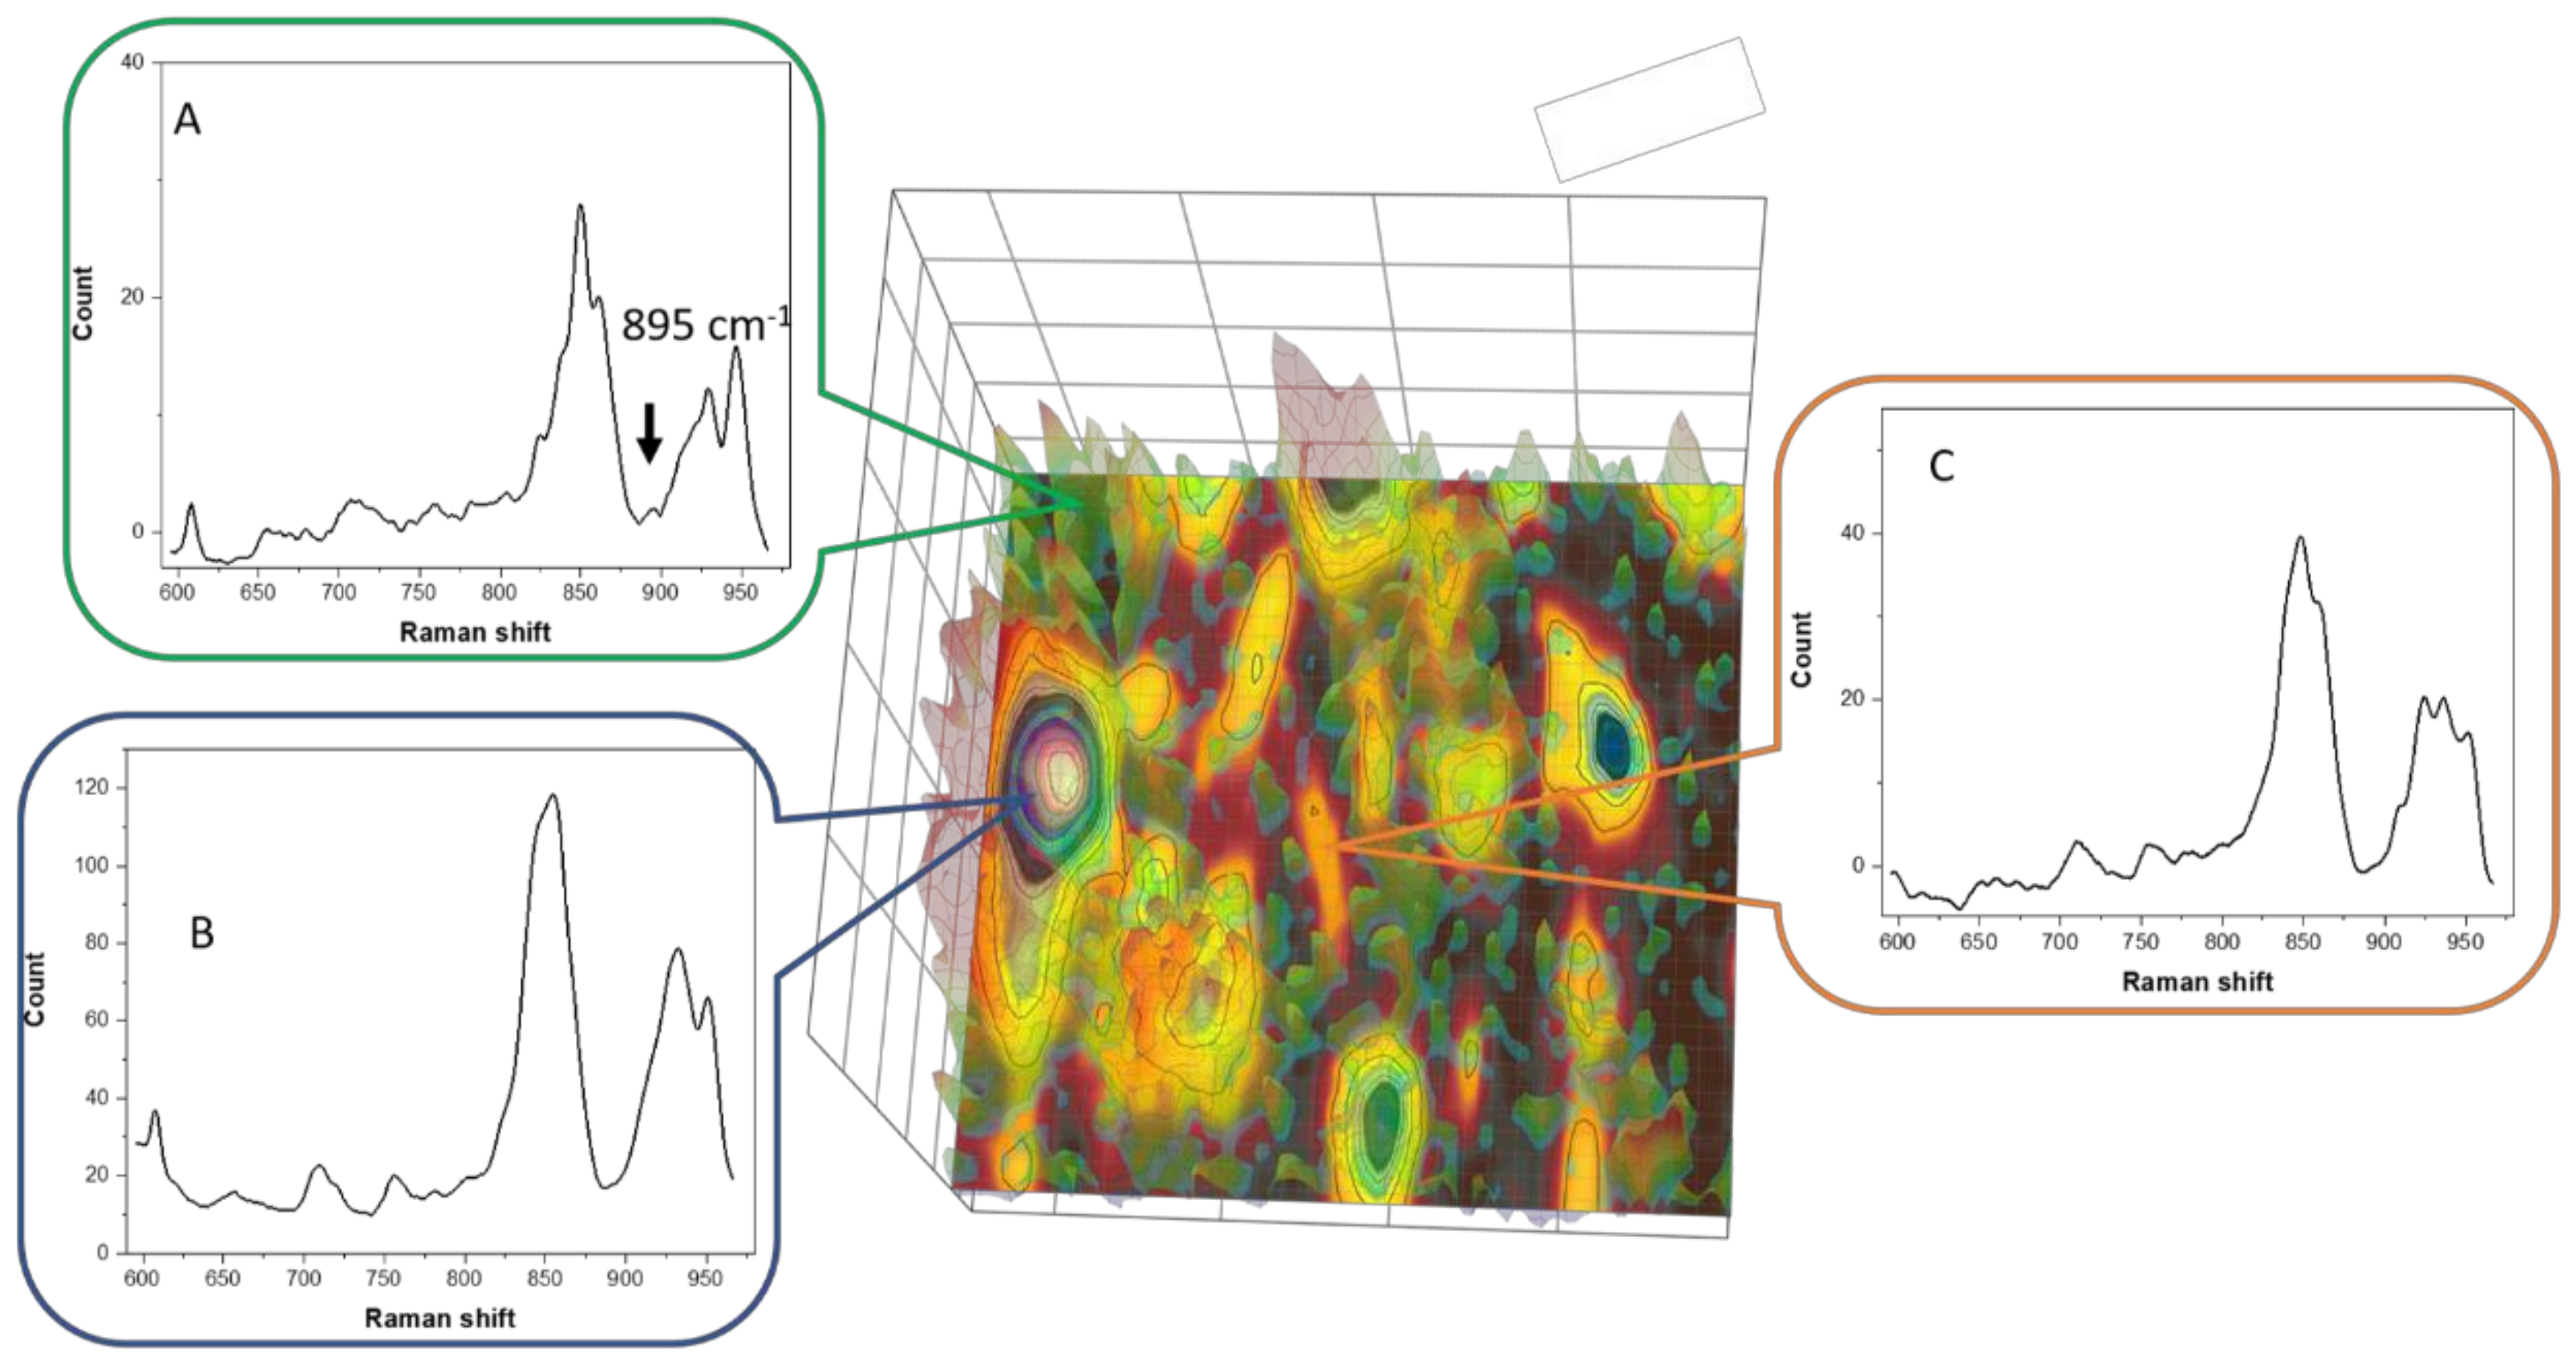
3.6. Raman Imaging with Dye Probe (Rhodamine 6G)
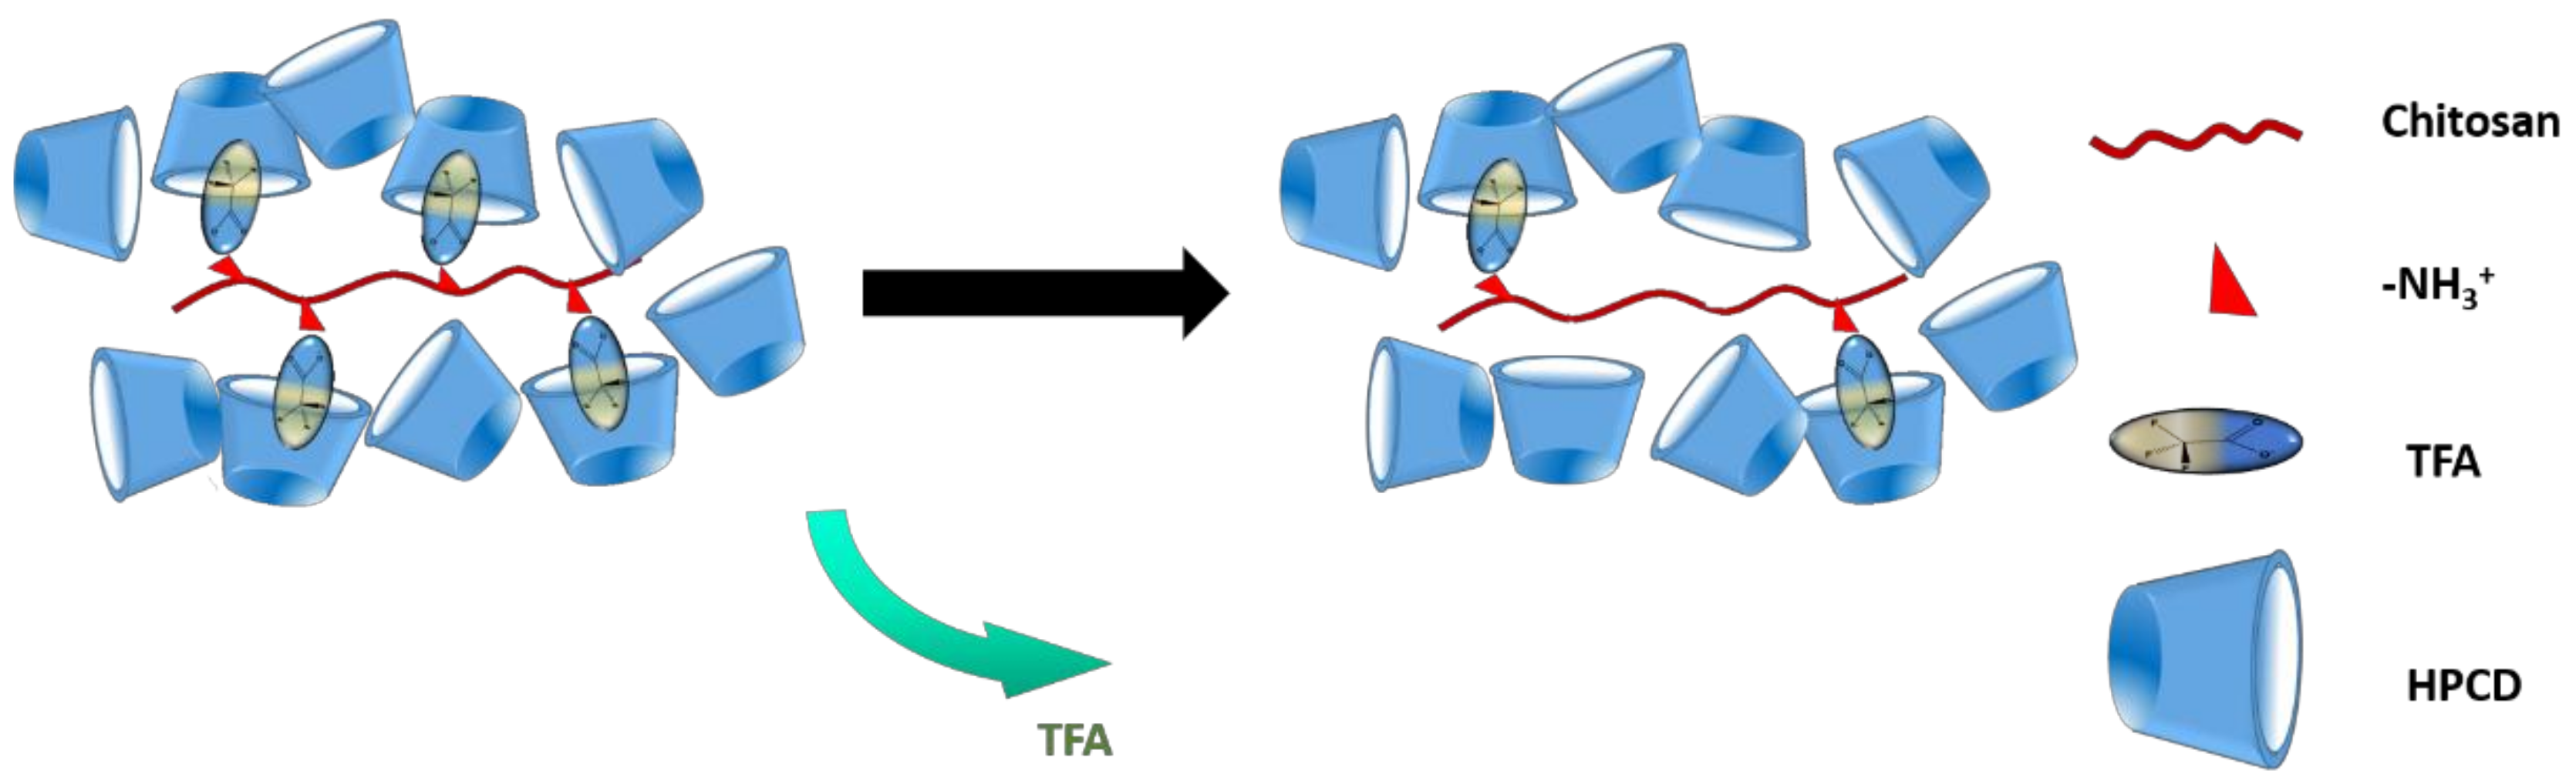
3.7. Composition of Chi:HPCD Electrospun Fiber and Its Component Interactions
4. Conclusions
Supplementary Materials
Author Contributions
Funding
Acknowledgments
Conflicts of Interest
References
- Lin, H.-Y.; Yeh, C.-T. Alginate-crosslinked chitosan scaffolds as pentoxifylline delivery carriers. J. Mater. Sci. Med. 2010, 21, 1611–1620. [Google Scholar] [CrossRef] [PubMed]
- Bhattarai, N.; Edmondson, D.; Veiseh, O.; Matsen, F.A.; Zhang, M.Q. Electrospun chitosan-based nanofibers and their cellular compatibility. Biomaterials 2005, 26, 6176–6184. [Google Scholar] [CrossRef] [PubMed]
- Jayakumar, R.; Prabaharan, M.; Nair, S.V.; Tamura, H. Novel chitin and chitosan nanofibers in biomedical applications. Biotechnol. Adv. 2010, 28, 142–150. [Google Scholar] [CrossRef] [PubMed]
- Min, B.M.; Lee, S.W.; Lim, J.N.; You, Y.; Lee, T.S.; Kang, P.H.; Park, W.H. Chitin and chitosan nanofibers: electrospinning of chitin and deacetylation of chitin nanofibers. Polymer 2004, 45, 7137–7142. [Google Scholar] [CrossRef]
- Kim, S.-K. Chitin, Chitosan, Oligosaccharides and Their Derivatives: Biological Activities and Applications; 2011; ISBN 9781439816035. Available online: https://www.vitalsource.com/products/chitin-chitosan-oligosaccharides-and-their-se-kwon-kim-v9781439816042 (accessed on 1 April 2019).
- Koide, S.S. Chitin-chitosan: Properties, benefits and risks. Nutr. Res. 1998, 18, 1091–1101. [Google Scholar] [CrossRef]
- Elsabee, M.Z.; Naguib, H.F.; Morsi, R.E. Chitosan based nanofibers, review. Mater. Sci. Eng. C Mater. Biol. Appl. 2012, 32, 1711–1726. [Google Scholar]
- Kumar, M.; Muzzarelli, R.A.A.; Muzzarelli, C.; Sashiwa, H.; Domb, A.J. Chitosan chemistry and pharmaceutical perspectives. Chem. Rev. 2004, 104, 6017–6084. [Google Scholar] [CrossRef] [PubMed]
- Kumar, M.N.V.R. A review of chitin and chitosan applications. React. Funct. Polym. 2000, 46, 1–27. [Google Scholar]
- Dash, M.; Chiellini, F.; Ottenbrite, R.M.; Chiellini, E. Chitosan-A versatile semi-synthetic polymer in biomedical applications. Prog. Polym. Sci. 2011, 36, 981–1014. [Google Scholar] [CrossRef]
- Crini, G.; Badot, P.-M. Application of chitosan, a natural aminopolysaccharide, for dye removal from aqueous solutions by adsorption processes using batch studies: A review of recent literature. Prog. Polym. Sci. 2008, 33, 399–447. [Google Scholar]
- Naseri-Nosar, M.; Ziora, Z.M. Wound dressings from naturally-occurring polymers: A review on homopolysaccharide-based composites. Carbohydr. Polym. 2018, 189, 379–398. [Google Scholar] [CrossRef] [PubMed]
- Verma, D.; Katti, K.S.; Katti, D.R. Polyelectrolyte-complex nanostructured fibrous scaffolds for tissue engineering. Mater. Sci. Eng. C 2009, 29, 2079–2084. [Google Scholar] [CrossRef]
- Li, L.; Hsieh, Y.L. Chitosan bicomponent nanofibers and nanoporous fibers. Carbohydr. Res. 2006, 341, 374–381. [Google Scholar] [CrossRef]
- Muzzarelli, R.A.A.; El Mehtedi, M.; Mattioli-Belmonte, M. Emerging Biomedical Applications of Nano-Chitins and Nano-Chitosans Obtained via Advanced Eco-Friendly Technologies from Marine Resources. Mar. Drugs 2014, 12, 5468–5502. [Google Scholar] [CrossRef] [PubMed]
- Rahimi, M.; Emamgholi, A.; Tabaei, S.J.S.; Khodadoust, M.; Taghipour, H.; Jafari, A. Perspectives of chitosan nanofiber/film scaffolds with bone marrow stromal cells in tissue engineering and wound dressing. Nanomed. J. 2019, 6, 27–34. [Google Scholar]
- Aranday-Garcia, R.; Saimoto, H.; Shirai, K.; Ifuku, S. Chitin biological extraction from shrimp wastes and its fibrillation for elastic nanofiber sheets preparation. Carbohydr. Polym. 2019, 213, 112–120. [Google Scholar] [CrossRef] [PubMed]
- Jamshidifard, S.; Koushkbaghi, S.; Hosseini, S.; Rezaei, S.; Karamipour, A.; Rad, A.J.; Irani, M. Incorporation of UiO-66-NH2 MOF into the PAN/chitosan nanofibers for adsorption and membrane filtration of Pb(II), Cd(II) and Cr(VI) ions from aqueous solutions. J. Hazard. Mater. 2019, 368, 10–20. [Google Scholar] [CrossRef] [PubMed]
- Li, L.; Li, Y.; Cao, L.; Yang, C. Enhanced chromium (VI) adsorption using nanosized chitosan fibers tailored by electrospinning. Carbohydr. Polym. 2015, 125, 206–213. [Google Scholar] [CrossRef]
- Habiba, U.; Siddique, T.A.; Talebian, S.; Lee, J.J.L.; Salleh, A.; Ang, B.C.; Afifi, A.M. Effect of deacetylation on property of electrospun chitosan/PVA nanofibrous membrane and removal of methyl orange, Fe(III) and Cr(VI) ions. Carbohydr. Polym. 2017, 177, 32–39. [Google Scholar] [CrossRef]
- Yihan, W.; Minato, W. Nanofiber Fabrication Techniques and Its Applicability to Chitosan. Prog. Chem. 2014, 26, 1821–1831. [Google Scholar]
- Megelski, S.; Stephens, J.S.; Chase, D.B.; Rabolt, J.F. Micro- and nanostructured surface morphology on electrospun polymer fibers. Macromolecules 2002, 35, 8456–8466. [Google Scholar] [CrossRef]
- Casasola, R.; Thomas, N.L.; Trybala, A.; Georgiadou, S. Electrospun poly lactic acid (PLA) fibres: Effect of different solvent systems on fibre morphology and diameter. Polymer 2014, 55, 4728–4737. [Google Scholar] [CrossRef]
- Khil, M.S.; Cha, D.I.; Kim, H.Y.; Kim, I.S.; Bhattarai, N. Electrospun nanofibrous polyurethane membrane as wound dressing. J. Biomed. Mater. Res. Part B Appl. Biomater. 2003, 67B, 675–679. [Google Scholar] [CrossRef] [PubMed]
- Zhao, X.; Chen, S.; Lin, Z.; Du, C. Reactive electrospinning of composite nanofibers of carboxymethyl chitosan cross-linked by alginate dialdehyde with the aid of polyethylene oxide. Carbohydr. Polym. 2016, 148, 98–106. [Google Scholar] [CrossRef] [PubMed]
- Chang, J.-J.; Lee, Y.-H.; Wu, M.-H.; Yang, M.-C.; Chien, C.-T. Preparation of electrospun alginate fibers with chitosan sheath. Carbohydr. Polym. 2012, 87, 2357–2361. [Google Scholar] [CrossRef]
- Ma, G.; Liu, Y.; Peng, C.; Fang, D.; He, B.; Nie, J. Paclitaxel loaded electrospun porous nanofibers as mat potential application for chemotherapy against prostate cancer. Carbohydr. Polym. 2011, 86, 505–512. [Google Scholar] [CrossRef]
- Haider, S.; Al-Zeghayer, Y.; Ali, F.A.A.; Haider, A.; Mahmood, A.; Al-Masry, W.A.; Imran, M.; Aijaz, M.O. Highly aligned narrow diameter chitosan electrospun nanofibers. J. Polym. Res. 2013, 20, 105. [Google Scholar] [CrossRef]
- Wu, C.; Su, H.; Tang, S.; Bumgardner, J.D. The stabilization of electrospun chitosan nanofibers by reversible acylation. Cellulose 2014, 21, 2549–2556. [Google Scholar] [CrossRef]
- Jia, Y.-T.; Gong, J.; Gu, X.-H.; Kim, H.-Y.; Dong, J.; Shen, X.-Y. Fabrication and characterization of poly (vinyl alcohol)/chitosan blend nanofibers produced by electrospinning method. Carbohydr. Polym. 2007, 67, 403–409. [Google Scholar] [CrossRef]
- Burns, N.A.; Burroughs, M.C.; Gracz, H.; Pritchard, C.Q.; Brozena, A.H.; Willoughby, J.; Khan, S.A. Cyclodextrin facilitated electrospun chitosan nanofibers. RSC Adv. 2015, 5, 7131–7137. [Google Scholar] [CrossRef]
- Wilson, L.D.; Verrall, R.E. A volumetric and NMR study of cyclodextrin-inhalation anesthetic complexes in aqueous solutions. Can. J. Chem. 2015, 93, 815–821. [Google Scholar] [CrossRef]
- Dehabadi, L.; Wilson, L.D. Nuclear Magnetic Resonance Investigation of the Fractionation of Water-Ethanol Mixtures with Cellulose and Its Cross-Linked Biopolymer Forms. Energy Fuels 2015, 29, 6512–6521. [Google Scholar] [CrossRef]
- Xue, C.; Wilson, L.D. A structural study of self-assembled chitosan-based sponge materials. Carbohydr. Polym. 2019, 206, 685–693. [Google Scholar] [CrossRef] [PubMed]
- Skrepleva, I.Y.; Voloshenko, G.I.; Librovich, N.B.; Maiorov, V.D.; Vishnetskaya, M.V.; Mel’nikov, M.Y. Infrared spectroscopic studies on interactions in trifluoroacetic acid-sulfur dioxide systems. Moscow Univ. Chem. Bull. 2011, 66, 232–234. [Google Scholar] [CrossRef]
- Valenti, L.E.; Paci, M.B.; De Pauli, C.P.; Giacomelli, C.E. Infrared study of trifluoroacetic acid unpurified synthetic peptides in aqueous solution: Trifluoroacetic acid removal and band assignment. Anal. Biochem. 2011, 410, 118–123. [Google Scholar] [CrossRef] [PubMed]
- Fuson, N.; Josien, M.L.; Jones, E.A.; Lawson, J.R. Infrared and raman spectroscopy studies of light and heavy trifluoroacetic acids. J. Chem. Phys. 1952, 20, 1627–1634. [Google Scholar] [CrossRef]
- Redington, R.L.; Lin, K.C. Infrared spectra of trifluoroacetic acid and trifluoroacetic anhydride. Spectrochim. Acta Part A Mol. Spectrosc. 1971, 27, 2445–2460. [Google Scholar] [CrossRef]
- Sun, W.; Chen, G.; Wang, F.; Qin, Y.; Wang, Z.; Nie, J.; Ma, G. Polyelectrolyte-complex multilayer membrane with gradient porous structure based on natural polymers for wound care. Carbohydr. Polym. 2018, 181, 183–190. [Google Scholar] [CrossRef]
- Kasaai, M. The Use of Various Types of NMR and IR Spectroscopy for Structural Characterization of Chitin and Chitosan. In Chitin, Chitosan, Oligosaccharides and Their Derivatives; CRC Press: Boca Raton, FL, USA, 2010; pp. 149–170. ISBN 9781439816042. [Google Scholar]
- Mosiadz, M.; Juda, K.L.; Hopkins, S.C.; Soloducho, J.; Glowacki, B.A. An in-depth in situ IR study of the thermal decomposition of yttrium trifluoroacetate hydrate. J. Therm. Anal. Calorim. 2012, 107, 681–691. [Google Scholar] [CrossRef]
- Robinson, R.E.; Taylor, R.C. Raman spectrum and vibrational assignments for the trifluoroacetate ion. Spectrochim. Acta 1962, 18, 1093–1095. [Google Scholar] [CrossRef]
- Frech, R.; Chintapalli, S.; Bruce, P.G.; Vincent, C.A. Crystalline and Amorphous Phases in the Poly(ethylene oxide)−LiCF3SO3 System. Macromolecules 1999, 32, 808–813. [Google Scholar] [CrossRef]
- Egyed, O. Spectroscopic studies on β-cyclodextrin. Anal. Chim. Acta 1990, 240, 225–227. [Google Scholar] [CrossRef]
- Li, W.; Lu, B.; Chen, F.; Yang, F.; Wang, Z. Host-guest complex of cypermethrin with β-cyclodextrin: A spectroscopy and theoretical investigation. J. Mol. Struct. 2011, 990, 244–252. [Google Scholar] [CrossRef]
- De Oliveira, V.E.; Almeida, E.W.C.; Castro, H.V.; Edwards, H.G.M.; Dos Santos, H.F.; De Oliveira, L.F.C. Carotenoids and β-cyclodextrin inclusion complexes: Raman spectroscopy and theoretical investigation. J. Phys. Chem. A 2011, 115, 8511–8519. [Google Scholar] [CrossRef] [PubMed]
- Vanamudan, A.; Pamidimukkala, P. Chitosan, nanoclay and chitosan-nanoclay composite as adsorbents for Rhodamine-6G and the resulting optical properties. Int. J. Biol. Macromol. 2015, 74, 127–135. [Google Scholar] [CrossRef]
- Serra-Gómez, R.; Tardajos, G.; González-Benito, J.; González-Gaitano, G. Rhodamine solid complexes as fluorescence probes to monitor the dispersion of cyclodextrins in polymeric nanocomposites. Dyes Pigment. 2012, 94, 427–436. [Google Scholar] [CrossRef]
- Bakkialakshmi, S.; Menaka, T. A study of the interaction between rhodamine 6g and hydroxy propyl β-cyclodextrin by steady state fluorescence. Spectrochim. Acta Part A Mol. Biomol. Spectrosc. 2011, 81, 8–13. [Google Scholar] [CrossRef] [PubMed]
- Dieringer, J.A.; Wustholz, K.L.; Masiello, D.J.; Camden, J.P.; Kleinman, S.L.; Schatz, G.C.; Van Duyne, R.P. Surface-enhanced Raman excitation spectroscopy of a single rhodamine 6G molecule. J. Am. Chem. Soc. 2009, 131, 849–854. [Google Scholar] [CrossRef] [PubMed]
- Black, P.N.; He, X.N.; Zhou, Y.S.; Mahjouri-Samani, M.; Mitchell, M.; Gao, Y.; Allen, J.; Lu, Y.F.; Xiong, W.; Jiang, L. Surface-enhanced Raman spectroscopy using gold-coated horizontally aligned carbon nanotubes. Nanotechnology 2012, 23, 205702. [Google Scholar]


| Material | Determined HPCD Content | Theoretical Value * |
|---|---|---|
| HPCD | 100% (4.47 mg) 1 | 100 ± 6.9% (4.80 mg) 1 |
| Chi:HPCD 2:20 Fiber | ~40% | ~91% |
| Chi:HPCD 2:50 Fiber | ~75% | ~96% |
© 2019 by the authors. Licensee MDPI, Basel, Switzerland. This article is an open access article distributed under the terms and conditions of the Creative Commons Attribution (CC BY) license (http://creativecommons.org/licenses/by/4.0/).
Share and Cite
Xue, C.; Wilson, L.D. A Spectroscopic Study of Solid-Phase Chitosan/Cyclodextrin-Based Electrospun Fibers. Fibers 2019, 7, 48. https://doi.org/10.3390/fib7050048
Xue C, Wilson LD. A Spectroscopic Study of Solid-Phase Chitosan/Cyclodextrin-Based Electrospun Fibers. Fibers. 2019; 7(5):48. https://doi.org/10.3390/fib7050048
Chicago/Turabian StyleXue, Chen, and Lee D. Wilson. 2019. "A Spectroscopic Study of Solid-Phase Chitosan/Cyclodextrin-Based Electrospun Fibers" Fibers 7, no. 5: 48. https://doi.org/10.3390/fib7050048
APA StyleXue, C., & Wilson, L. D. (2019). A Spectroscopic Study of Solid-Phase Chitosan/Cyclodextrin-Based Electrospun Fibers. Fibers, 7(5), 48. https://doi.org/10.3390/fib7050048