Article

Characterization of Serpentines from Different Regions by Transmission Electron Microscopy, X-ray Diffraction, BET Specific Surface Area and Vibrational and Electronic Spectroscopy

1
Laboratorium für Organische Chemie, ETH Zürich, Vladimir-Prelog-Weg 3, HCI, 809 Zürich, Switzerland
2
Departamento de Geología, Facultad de Ciencias, Universidad de Salamanca, Pl. de la Merced s/n, 37008 Salamanca, Spain
3
Departamento de Química Inorgánica, Facultad de Ciencias Químicas, Universidad de Salamanca, Pl. de la Merced s/n, 37008 Salamanca, Spain
4
Laboratorio de altas presiones, Departamento de Química Inorgánica I, Universidad Complutense de Madrid, Avd. Complutense, s/n, 28040 Madrid, Spain
*
Author to whom correspondence should be addressed.
Fibers 2019, 7(5), 47; https://doi.org/10.3390/fib7050047
Submission received: 26 March 2019 / Revised: 3 May 2019 / Accepted: 14 May 2019 / Published: 20 May 2019
(This article belongs to the Special Issue Mineral Fibres)

Abstract

:
Serpentinite powdered samples from four different regions were characterized using scanning electron microscopy (SEM), X-ray diffraction (XRD), SBET and porosity measurements, UV-Vis and Infrared Spectroscopy of the skeletal region and surface OH groups. SEM micrographs of the samples showed a prismatic morphology when the lizardite was the predominant phase, while if antigorite phase prevailed, the particles had a globular morphology. The few fibrous-shaped particles, only observed by SEM and weakly detected by XRD on MO-9C and MO13 samples, were characteristic of the chrysotile phase. All diffraction XRD patterns showed characteristic peaks of antigorite and lizardite serpentine phases, with crystallite sizes in the range 310–250 Å and with different degrees and types of carbonation processes, one derived from the transformation of the serpentine, generating dolomite, and another by direct precipitation of calcite. The SBET reached values between 38–24 m2∙g−1 for the samples less crystalline, in agreement with the XRD patterns, while those with a higher degree of crystallinity gave values close to 8–9 m2∙g−1. In the UV region all electronic spectra were dominated by the absorption edge due to O2− → Si4+ charge transfer transition, with Si4+ in tetrahedral coordination, corresponding to a band gap energy of ca 4.7 eV. In the visible region, 800–350 nm, the spectra of all samples, except Donai, presented at least two weak and broad absorptions centred in the range 650–800 and 550–360 nm, associated with the presence of Fe3+ ions from the oxidation of structural Fe2+ ions in the serpentinites ((MgxFe2+1−x)3Si2O5(OH)4). The relative intensity of the IR bands corresponding to the stretching modes of the OH’s groups indicated the prevalence of one of the two phases, antigorite or lizardite, in the serpentinites. We proposed that the different relative intensity of these bands could be considered as diagnostic to differentiate the predominance of these phases in serpentinites.

1. Introduction

Serpentine minerals are phyllosilicates with a large metamorphic stability field that is generally formed during the hydration of basic to ultrabasic rocks. They have a general formula (MgxFe1−x)3Si2O5(OH)4; 0 ≤ x ≤ 1 and are characterized by a 1:1 unit with a tetrahedral Si-centred layer and a trioctahedral Mg-centred layer. The different spatial arrangements of these layers result in three main polymorphs: Lizardite, chrysotile and antigorite. The sheets form flats layers in lizardite, fibrous cylinders in chrysotile and corrugated structures in antigorite [1]. Although it is known that lizardite and chrysotile are the main varieties that are present in serpentinites with low-grade metamorphic transformations [2,3] and antigorite is found in rocks with high-grade metamorphic transformation environments [4], the P-T conditions of their thermodynamic transition are poorly defined and sometimes it is difficult to evaluate to which conditions the rocks were exposed. On the other hand, the variety of chemical substitutions of mono-, di and tri-valent metals ions [5,6] makes it difficult to specify the composition and thermal stability of these phases.
Serpentinites are commonly used as raw materials for the production of a high purity of magnesium oxide, asbestos and as ornamental stone [7]. In spite of this, details of their physicochemical properties such as the crystal structure of the most common phase lizardite and antigorite are still a matter of controversy. The behaviour of these rocks seems to be dependent on the serpentine phase that is predominant in their composition [8,9] although sometimes it is not easy to identify them by traditional petrographic methods. Additionally, the application of serpentinites depends upon the mineralogical composition [10] and a specific analysis of the mineralogy of these rocks could provide appropriate information about their possible use in industry.
In this paper, we reported the results of a characterization study by SEM microscopy, XRD and IR and Vis-UV spectroscopy of six different serpentines, one from India, one from Portugal and the other four serpentinites from two different regions in Spain that had been the subject of other investigations. Our interest in this study was to deepen the understanding of the physicochemical properties of this important family of materials and propose a quick and easy method in order to discern each of the phases that were mixed in these serpentine minerals.

2. Materials and Methods

Six natural serpentinites were collected from four different massifs, where they were quarried and marketed with the following commercial names:
Verde Pirineos (MO-9C and MO13) from Moeche, in Cabo Ortegal, Galicia (Spain) [8,9].
Verde Macael (MA8 and MA-2B) from Macael in Andalucía (Spain) [11,12].
Rain Forest Green (FG1), from Udaipur Rajasthan (India). This rock was extracted in a bedrock quarry near the village of Vidhasar in the district of Bikaner, Rajasthan, India. This serpentinite is very resistant to different strengths, compared to others of the same nature, such as Verde Donai (Donai), from the Bragança-Morais massif (Portugal).
The rock samples were grounded and prepared to get homogeneous polycrystalline samples in the case of X-ray analyses.
Thin sections of the six serpentinites were studied for a first mineralogical analysis using a Leica DM2500P microscope with digital camera.
Scanning electron microscopy (SEM) studies were recorded with a Zeiss EM 900 instrument. Previously, the samples were prepared in aqueous suspension in an ultrasonic bath.
X-ray powder diffraction (XRD) patterns of the six serpentines tested were recorded on a Siemens D-500 (40 kV and 30 mA) diffractometer using CuKa radiation (λ = 1.5437 Å) Ni-filter, equipped with the Diffract ATV3 software package. The crystal size was determined using the Scherrer formula [12].
The BET surface areas and porosity were measured using N2 adsorption/desorption at 77 K determined both volumetrically with a Micromeritics Gemini 2380 instrument.
FT-IR studies were performed with a Nicolet Avatar 360 FT-IR spectrophotometer in the range 4000–400 cm−1, recording each spectrum from the same amount of sample pressed into thin wafers with KBr and in an air atmosphere. Vis-UV spectra were recorded using a Shimadzu UV-2401 PC spectrophotometer in the range 200–800 nm using the diffuse reflectance technique (DR-UV-VIS).

3. Results and Discussion

3.1. Petrographic Studies

From the petrographic studies, we observed that all samples presented a high percentage of serpentine phases (Figure 1a,b). Some of them were extremely carbonated. The origin of carbonation in each case is being investigated at present.

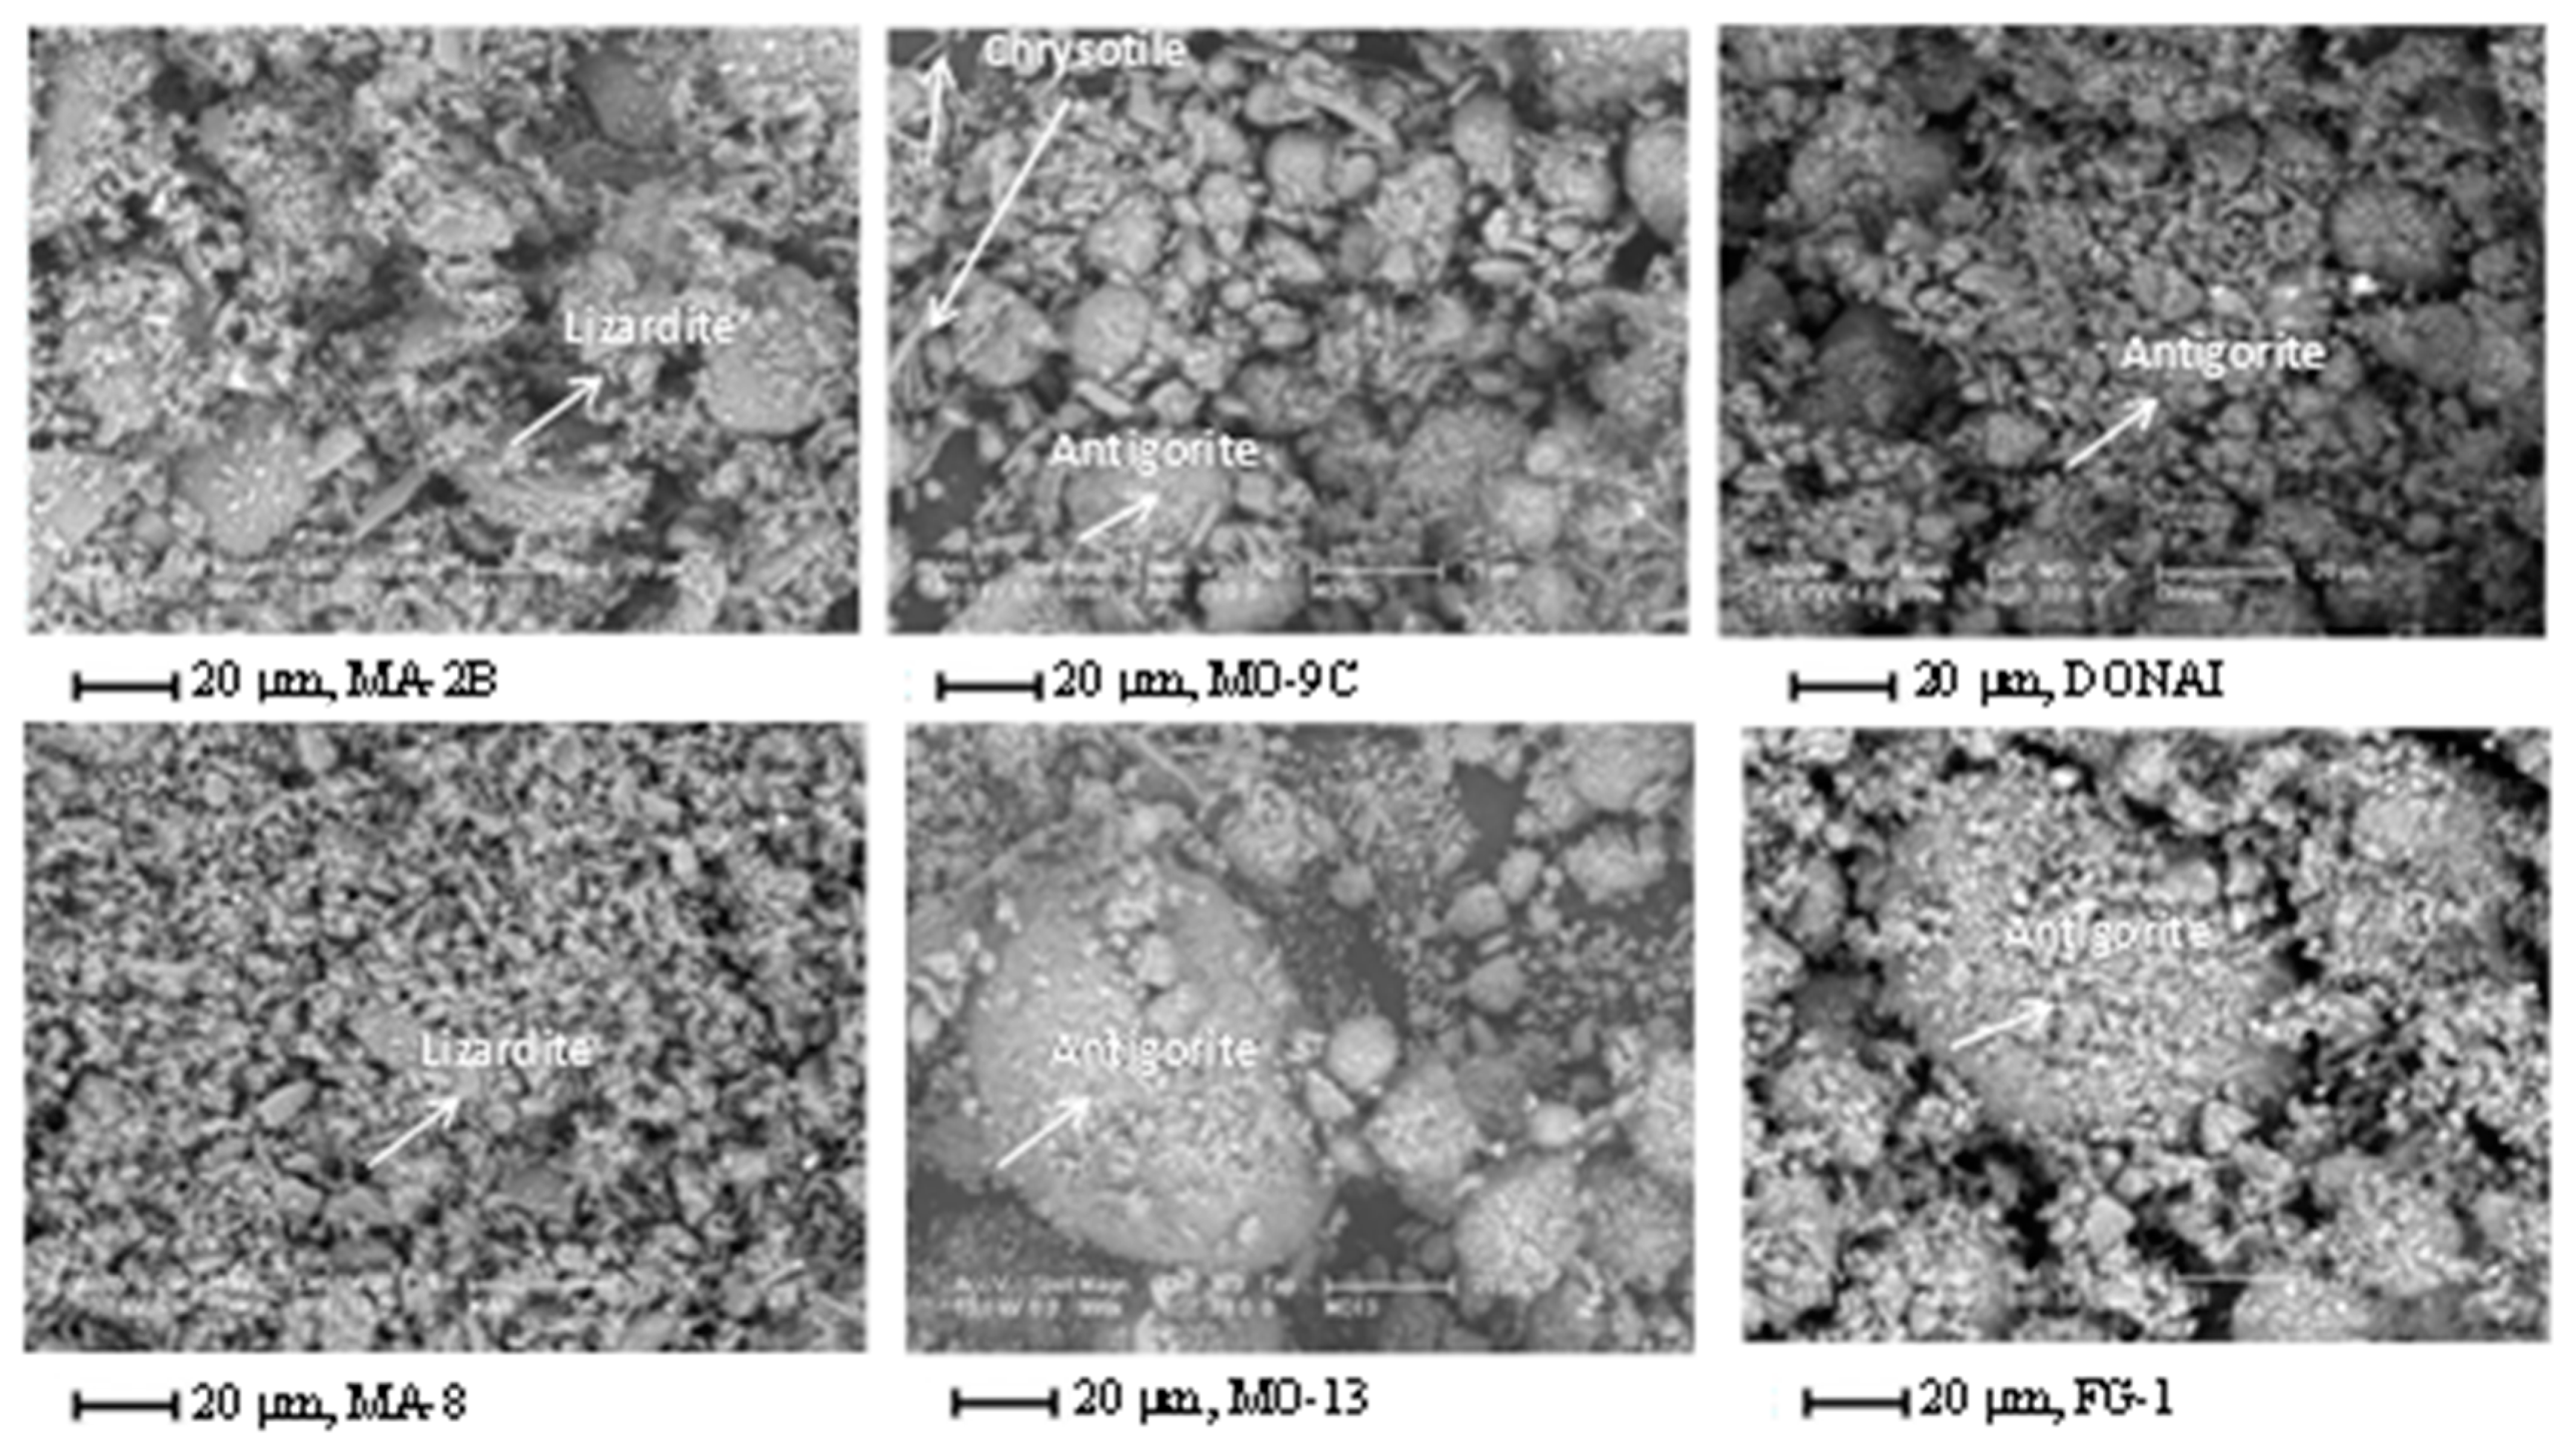
3.2. Scanning Electron Micrographs (SEM)

SEM of the serpentine samples are reported in Figure 2. The morphology of the MA-2B and MA8 samples was mainly prismatic, corresponding to the lizardite phase, while the other samples, Donai, FG1, MO-9C, MO13, showed quite a globular morphology, in agreement with the literature data [1,4], probably due to the high-grade of metamorphic transformation of these samples with respect to the first two ones. In addition, the few particles with fibrous shapes observed in MO-9C and MO13 samples were assigned to the chrysotile phase of the serpentines [6].

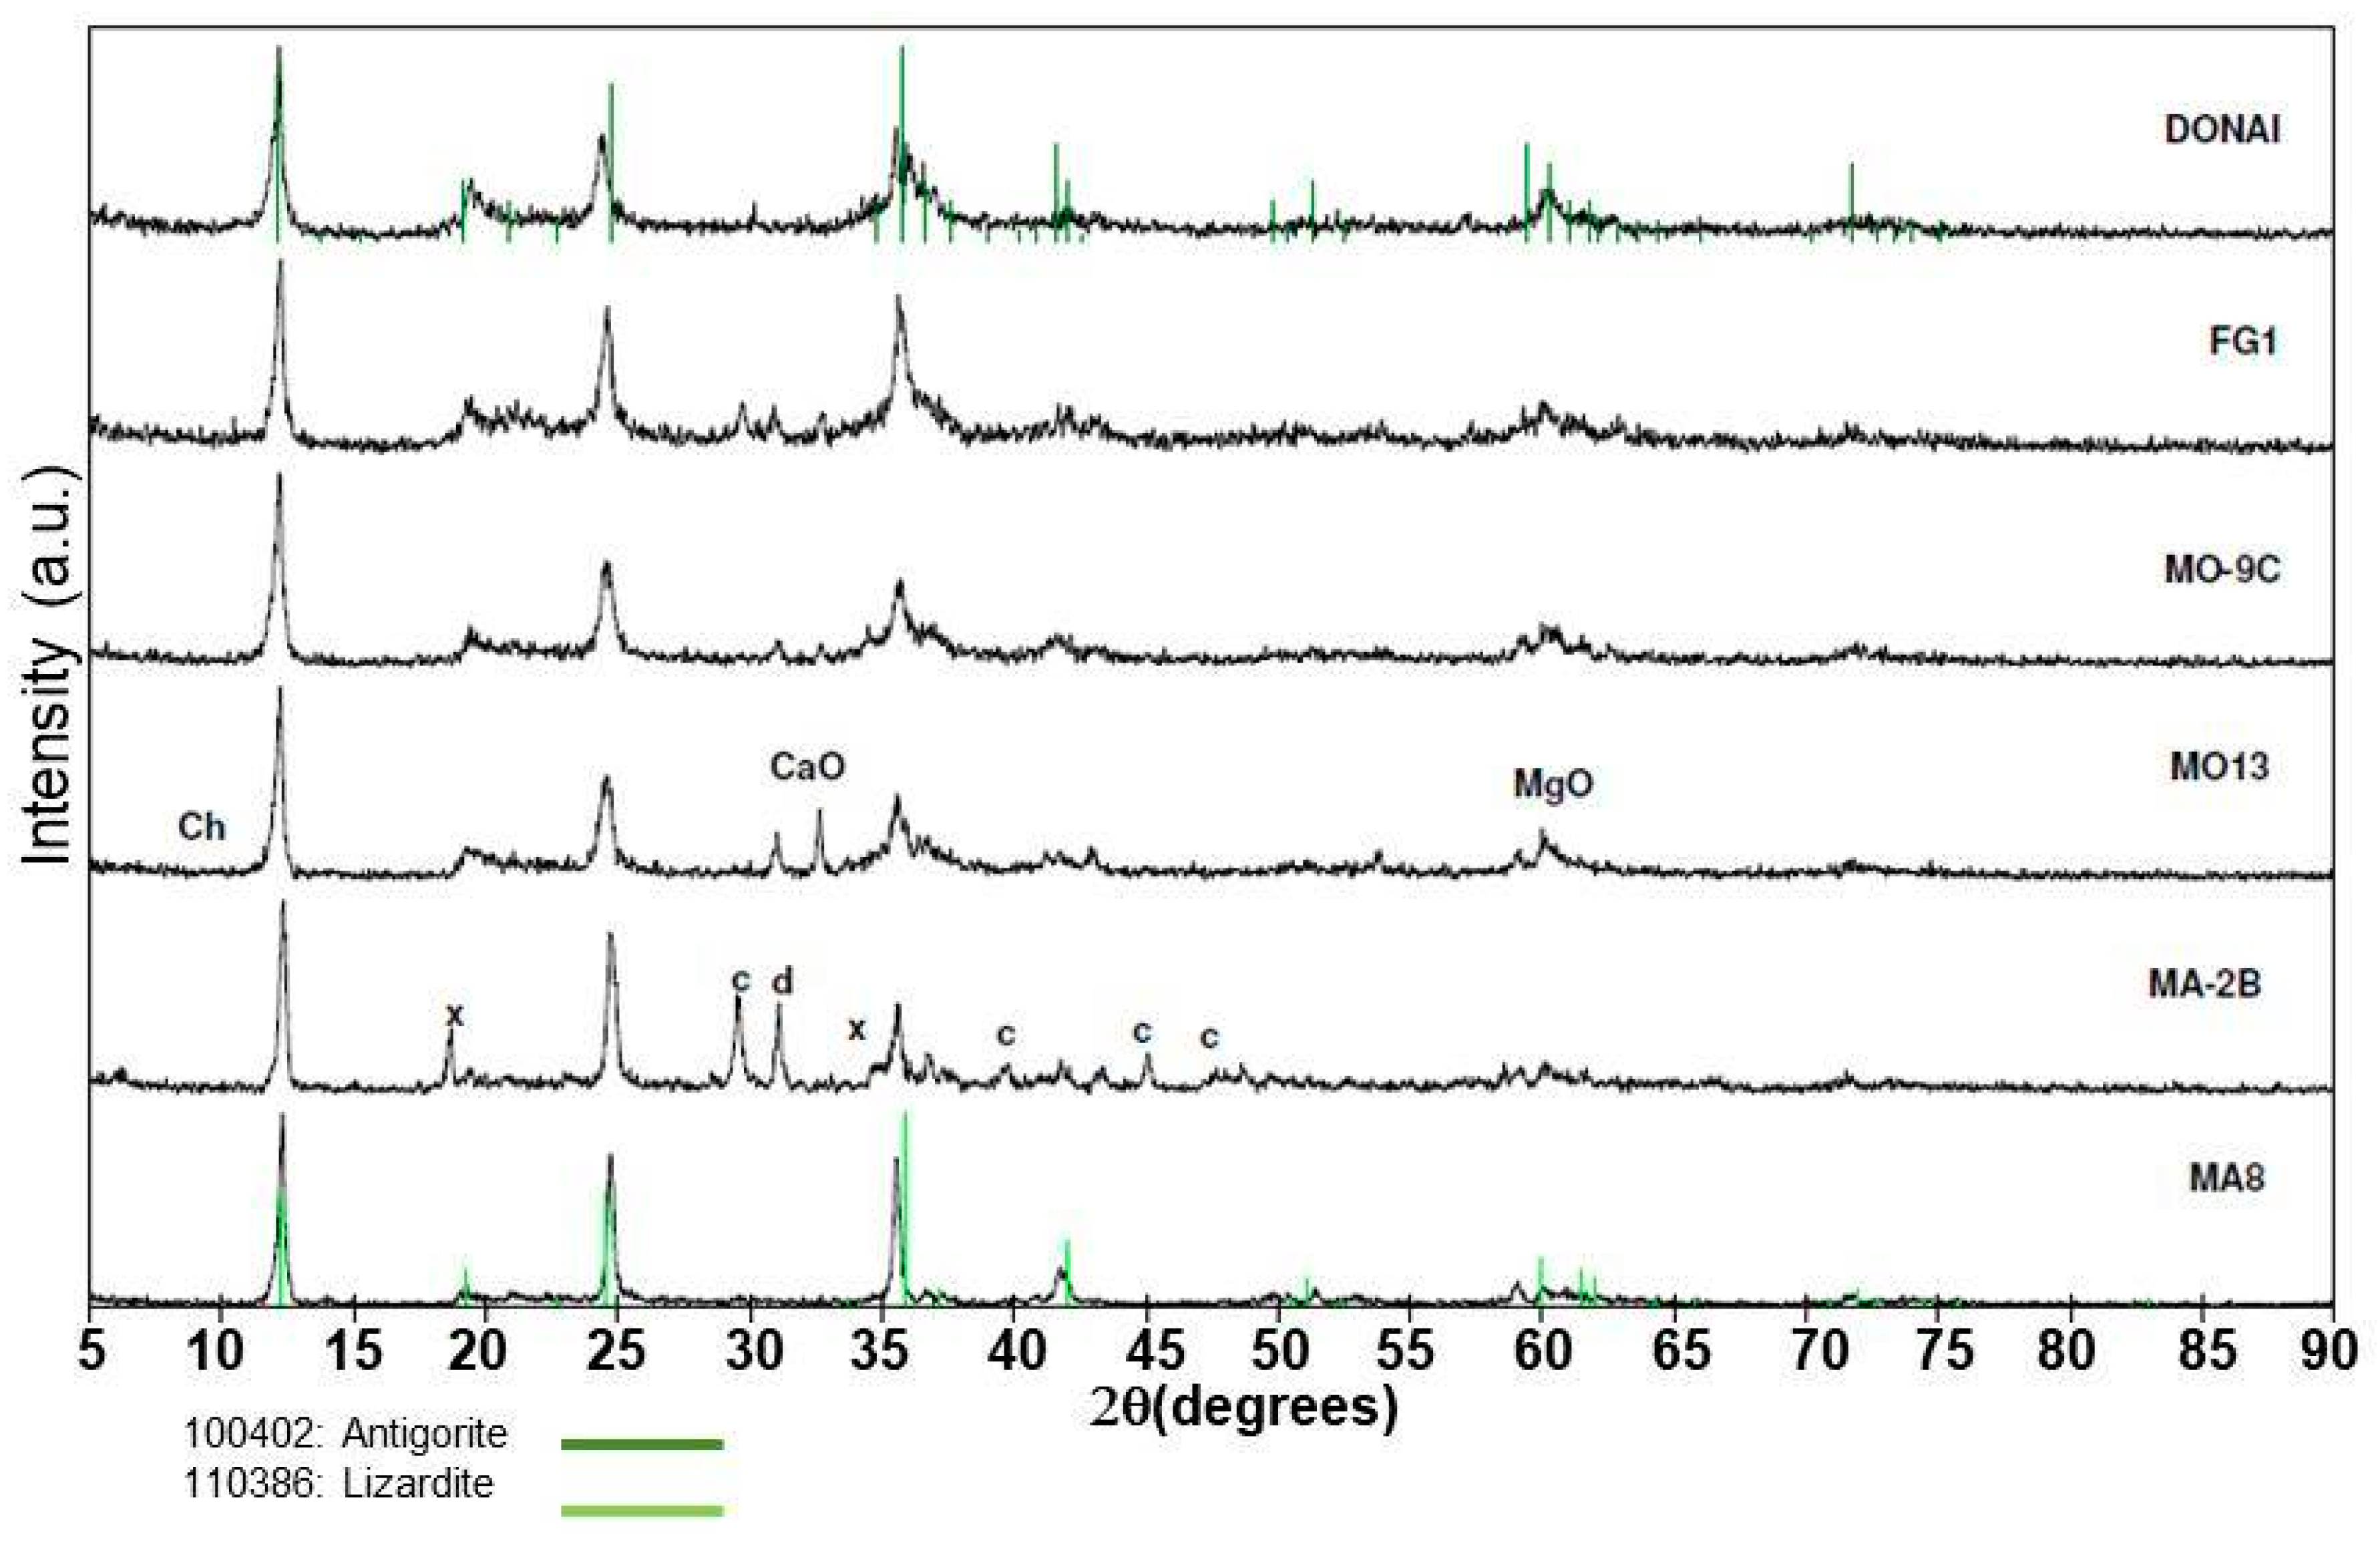
3.3. X-ray Diffraction

The diffraction patterns of the serpentine samples are compared in Figure 3 and their crystallographic parameters calculated by the Chekcell v.2. program of refinement software [13] is summarized in Table 1. All graphics showed characteristic peaks of serpentine-based structures with crystallite sizes calculated by the Scherrer method [14] in the range 310–250 Å. In MA8 and MA-2B samples the fundamental phase of the serpentines was lizardite (Z = 1, ICDD No. 11-0386) and their crystallographic parameters agreed with those reported in the ICDD card. The pattern for the MA8 sample corresponded mainly to the lizardite phase [12,13,14,15], with principal (h k l) reflections at 2θ values: 12.2 (0 0 1), 24.6 (0 0 2), 35.5 (1 1 1), 41.9 (1 0 3) and 61.5(1 1 1) while in MA-2B samples additional reflections were observed and its diffractions peaks were broader due to its lower crystallinity and crystallite size. In the case of the MA-2B sample the new peaks were assigned to Ca(OH)2 (ICDD No.78-0315, 2θ = 18.8 and 34.7), calcite (CaCO3), (ICDD No. 5-586, 2θ = 29.4, 39.6, 44.8, 47,6 and 48.3) and dolomite (Ca1−xMgx(CO3)), (ICDD No. 36-426, 2θ = 30.8). Taking into account the XRD analysis in these samples, it seemed that there were two types of carbonation processes, one derived from the transformation of the serpentine, generating dolomite, and another from direct precipitation of calcite. It should be noted that in the area of origin of Macael serpentinites some of them appeared sandwiched between sheets of carbonates. Ca2+ ions coming from these layers, combined with CO2 fluids circulating on fractures and produced calcite precipitates [11].
In samples MO-9C and MO13 from Cabo Ortegal (Galicia) as well as Donai from Bragança (Portugal) and FG1 from India, the predominant polymorph of serpentine was antigorite [16] (Z = 6, ICDD No. 10-0402); i.e., serpentine from the transformation of surface olivines and pyroxenes (probably due to the influence of meteoric water and mainly of sea water) whose crystallographic parameters agreed with those reported in the ICDD card. Four samples had a content higher than 75% of antigorite, but carbonation was greater in FG1 and MO13 and, as a result, besides the peaks corresponding to the antigorite, other small diffraction lines could be observed.
Patterns for MO-9C and Donai samples corresponded mostly to antigorite serpentine mineral with principal (h k l) reflections at 2θ values: 12.1 (0 0 6), 24.3 (0 0 12), 35.4 (1 3 4) and 60.1 (2 3 18). In the case of FG1, MO13 and MO-9C, in the latter with less intensity, additional reflections from dolomite (ICDD No. 36-426, 2θ = 30.8), CaO (ICDD No. 82-1691, 2θ = 32.3) and MgO (ICDD No. 78-0430, 2θ = 42.9) were observed.

3.4. Surface Area and Porosity

The surface area values for all serpentine samples are reported in Table 1. The nitrogen adsorption/desorption isotherms (Figure 4) corresponded to type II of the BDDT classification [17]. Desorption and adsorption branches were coincident, which showed the non-existence of mesopores but the presence of macropores (diameter, ø > 50 nm) in these materials [17].
The specific surface areas (SBET) reached values between 38–24 m2∙g−1 for the samples less crystalline (Donai, F1G and MO-9C and Mo-13), in agreement with XRD patterns, while those with values of 8–9 m2∙g−1 corresponded to the higher degree of crystallinity (MA8 and MA-2B) in accordance with its lower surface area.

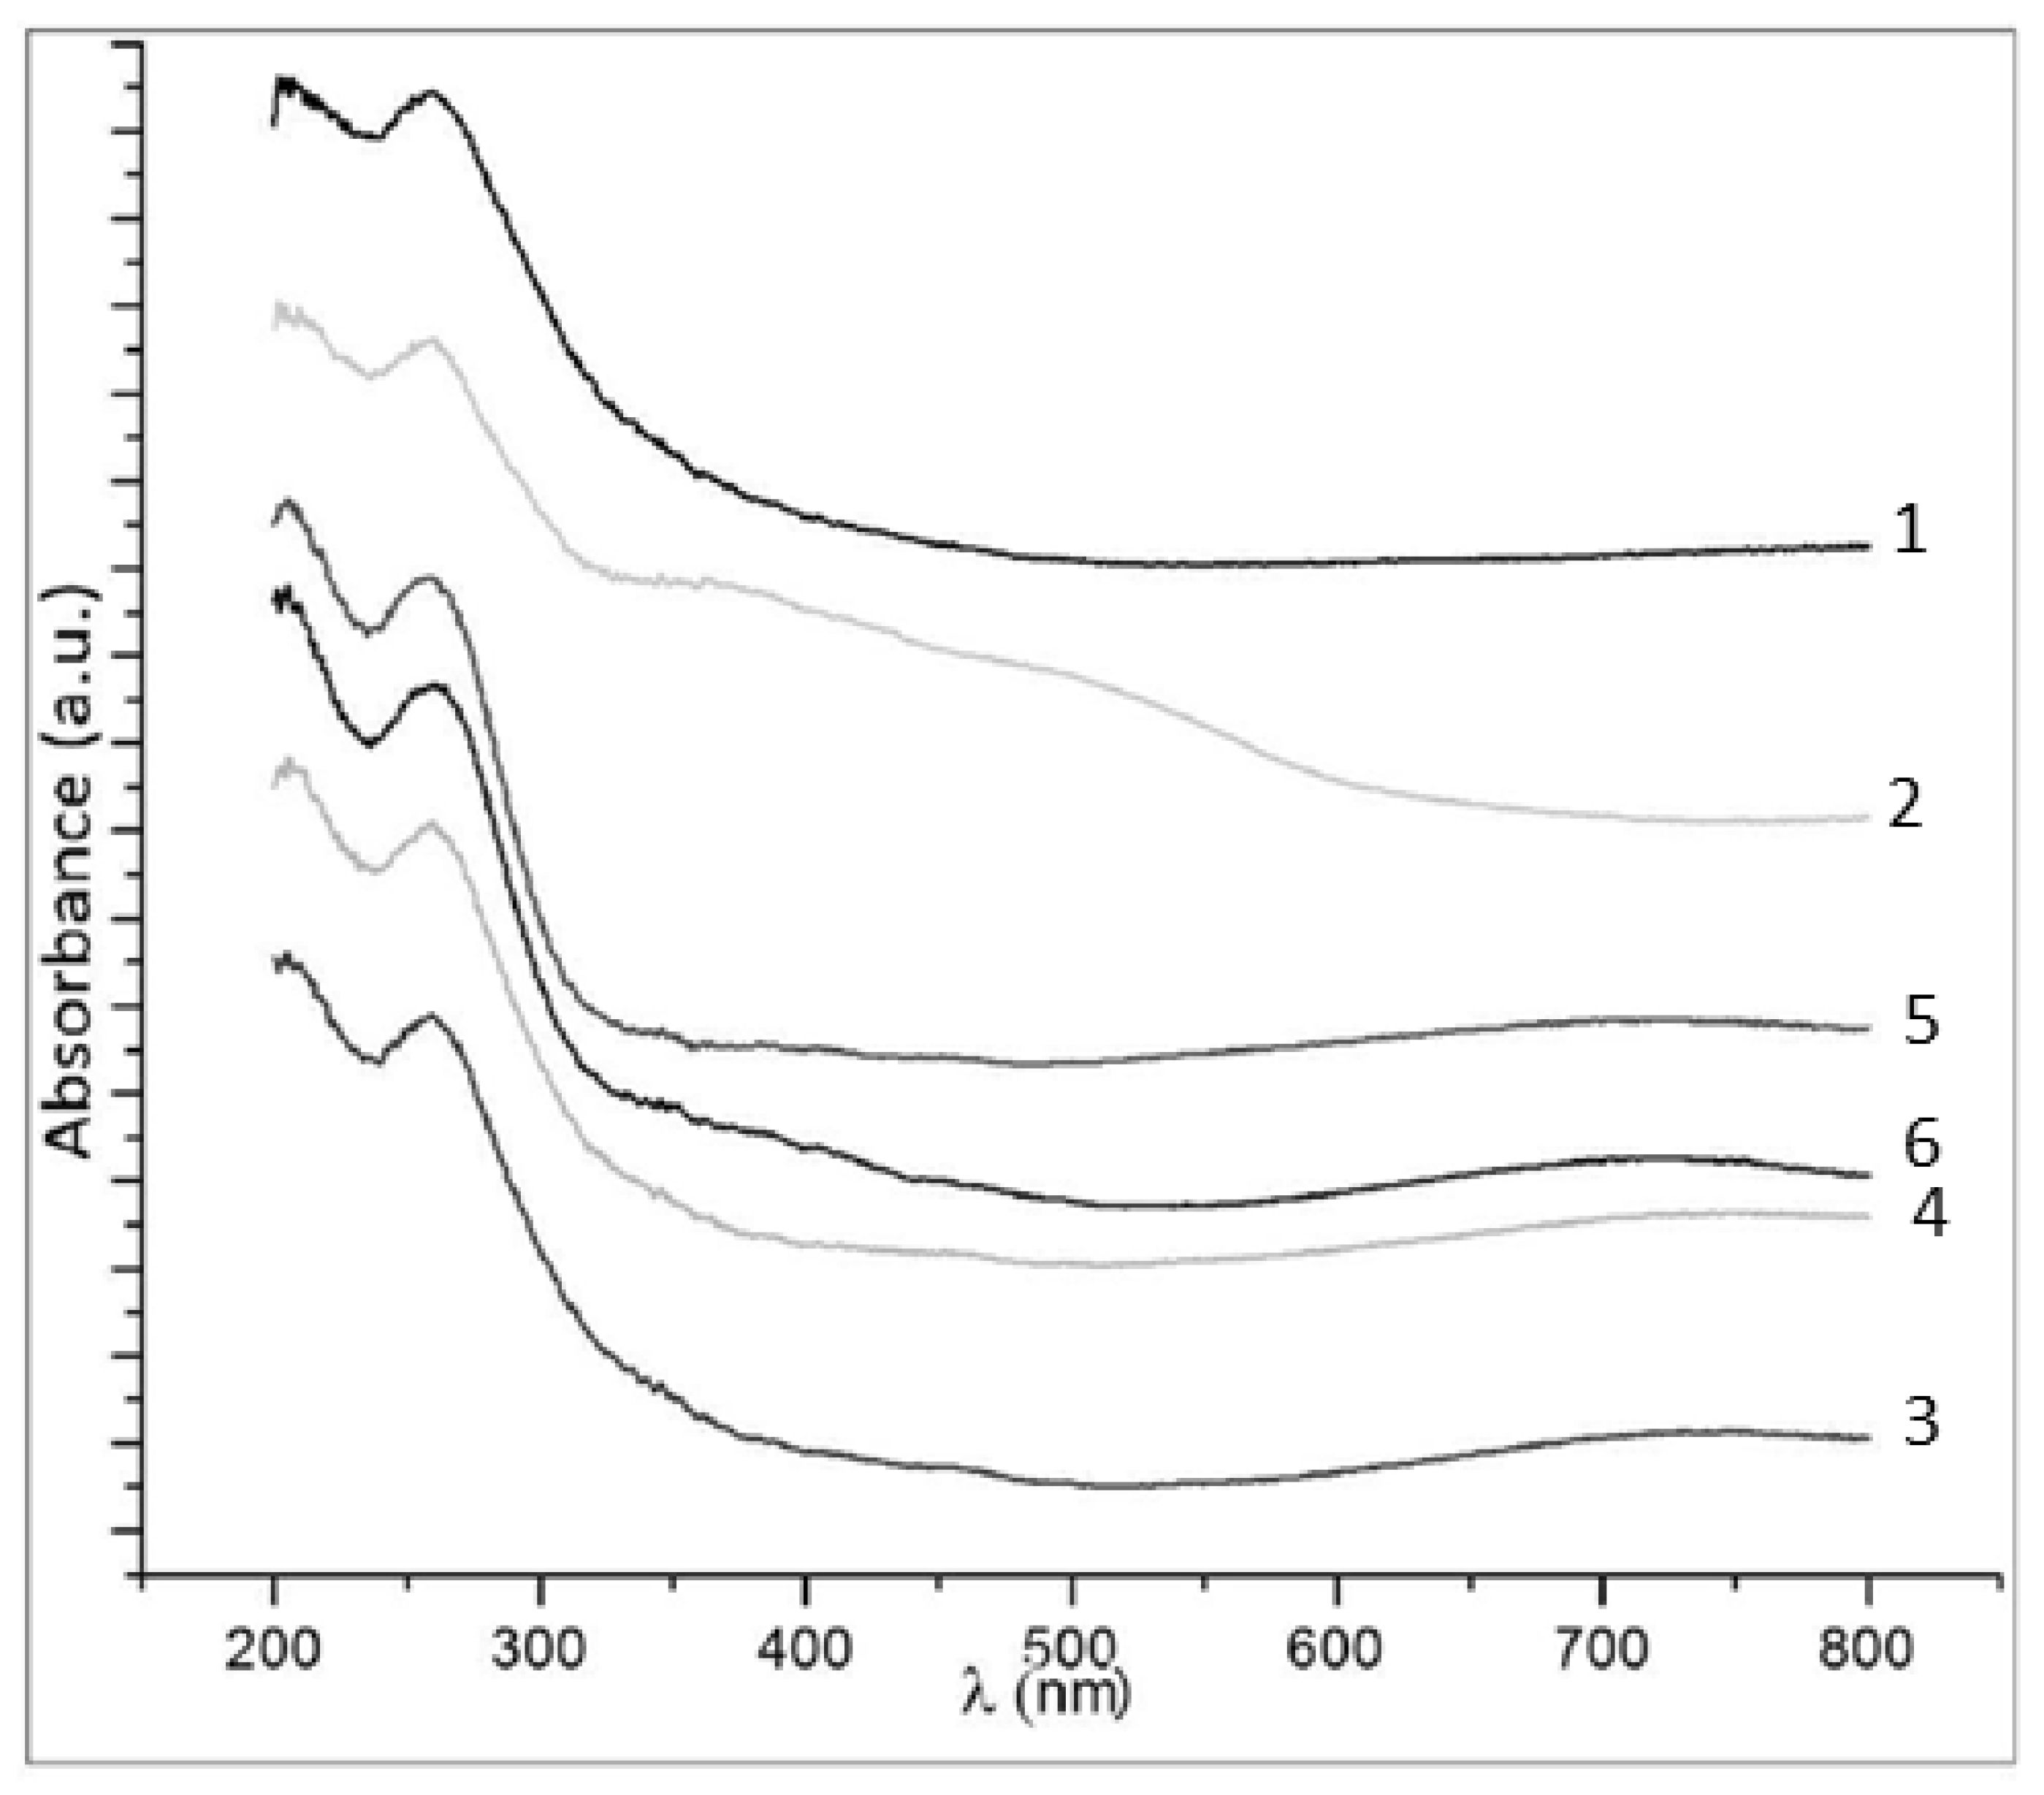
3.5. DR-UV-Vis Spectroscopy

The electronic spectra of the investigated samples are shown in Figure 5. All spectra were dominated by the absorption edge associated with O2− (2p) → Si4+ (3p) charge transfer transition, with Si4+ in tetrahedral coordination, in the range 350–265 nm, corresponding to a band gap energy of ca 4.7 eV. The Eg energy gap of MgO corresponded to charge transfer O2− → Mg2+ was reported [18] to be of ca. 8 eV, corresponding to a wavelength of 155 nm, which was just below the lower wavelength limit of our instrument.
In the visible region, 800–350 nm, all spectra, except Donai, presented at least two weak and broad absorptions centred in the regions 650–800 and 550–360 nm. According to previous studies [19,20,21] the first band could be associated with the 6A14T1 (4G) crystal-field d → d transition of octahedral Fe3+ ions, while the second was due to an oxygen-to-metal charge-transfer transition (O2− → Fe3+). The absence of absorption bands in the visible region in the Donai sample indicated that it either lacked Fe2+ replacing Mg2+ ions or it had not been oxidized to Fe3+.
The UV-VIS spectrum of the FG1 sample presented the same absorptions described above, although in this case the bands due to O2− → Si4+ charge-transfer transition and d-d transition of octahedral Fe3+ ions, showed lower intensity than in the other ones. However, the absorption in the 500–350 nm range, where the intensity was higher than in the other samples, had two of the most intense components with maxima at 500 and 370 nm attributed to a charge-transfer transition (O2− → Fe3+) and metal-to-metal charge-transfer transition, which could be schematized as 2Fe3+ → Fe2+ + Fe4+, respectively [22,23]. These data, according to XRD patterns, indicated a higher structural degradation of the FG1 sample with respect to the other ones and, as a result, an increase in the concentration of Fe3+ ions, due to oxidation of structural Fe2+ ions (Mgx,Fe2+1−x)3Si2O5(OH)4) to Fe3+, and a decrease in the concentration of Si4+ ions tetrahedrally coordinated in the serpentinite.

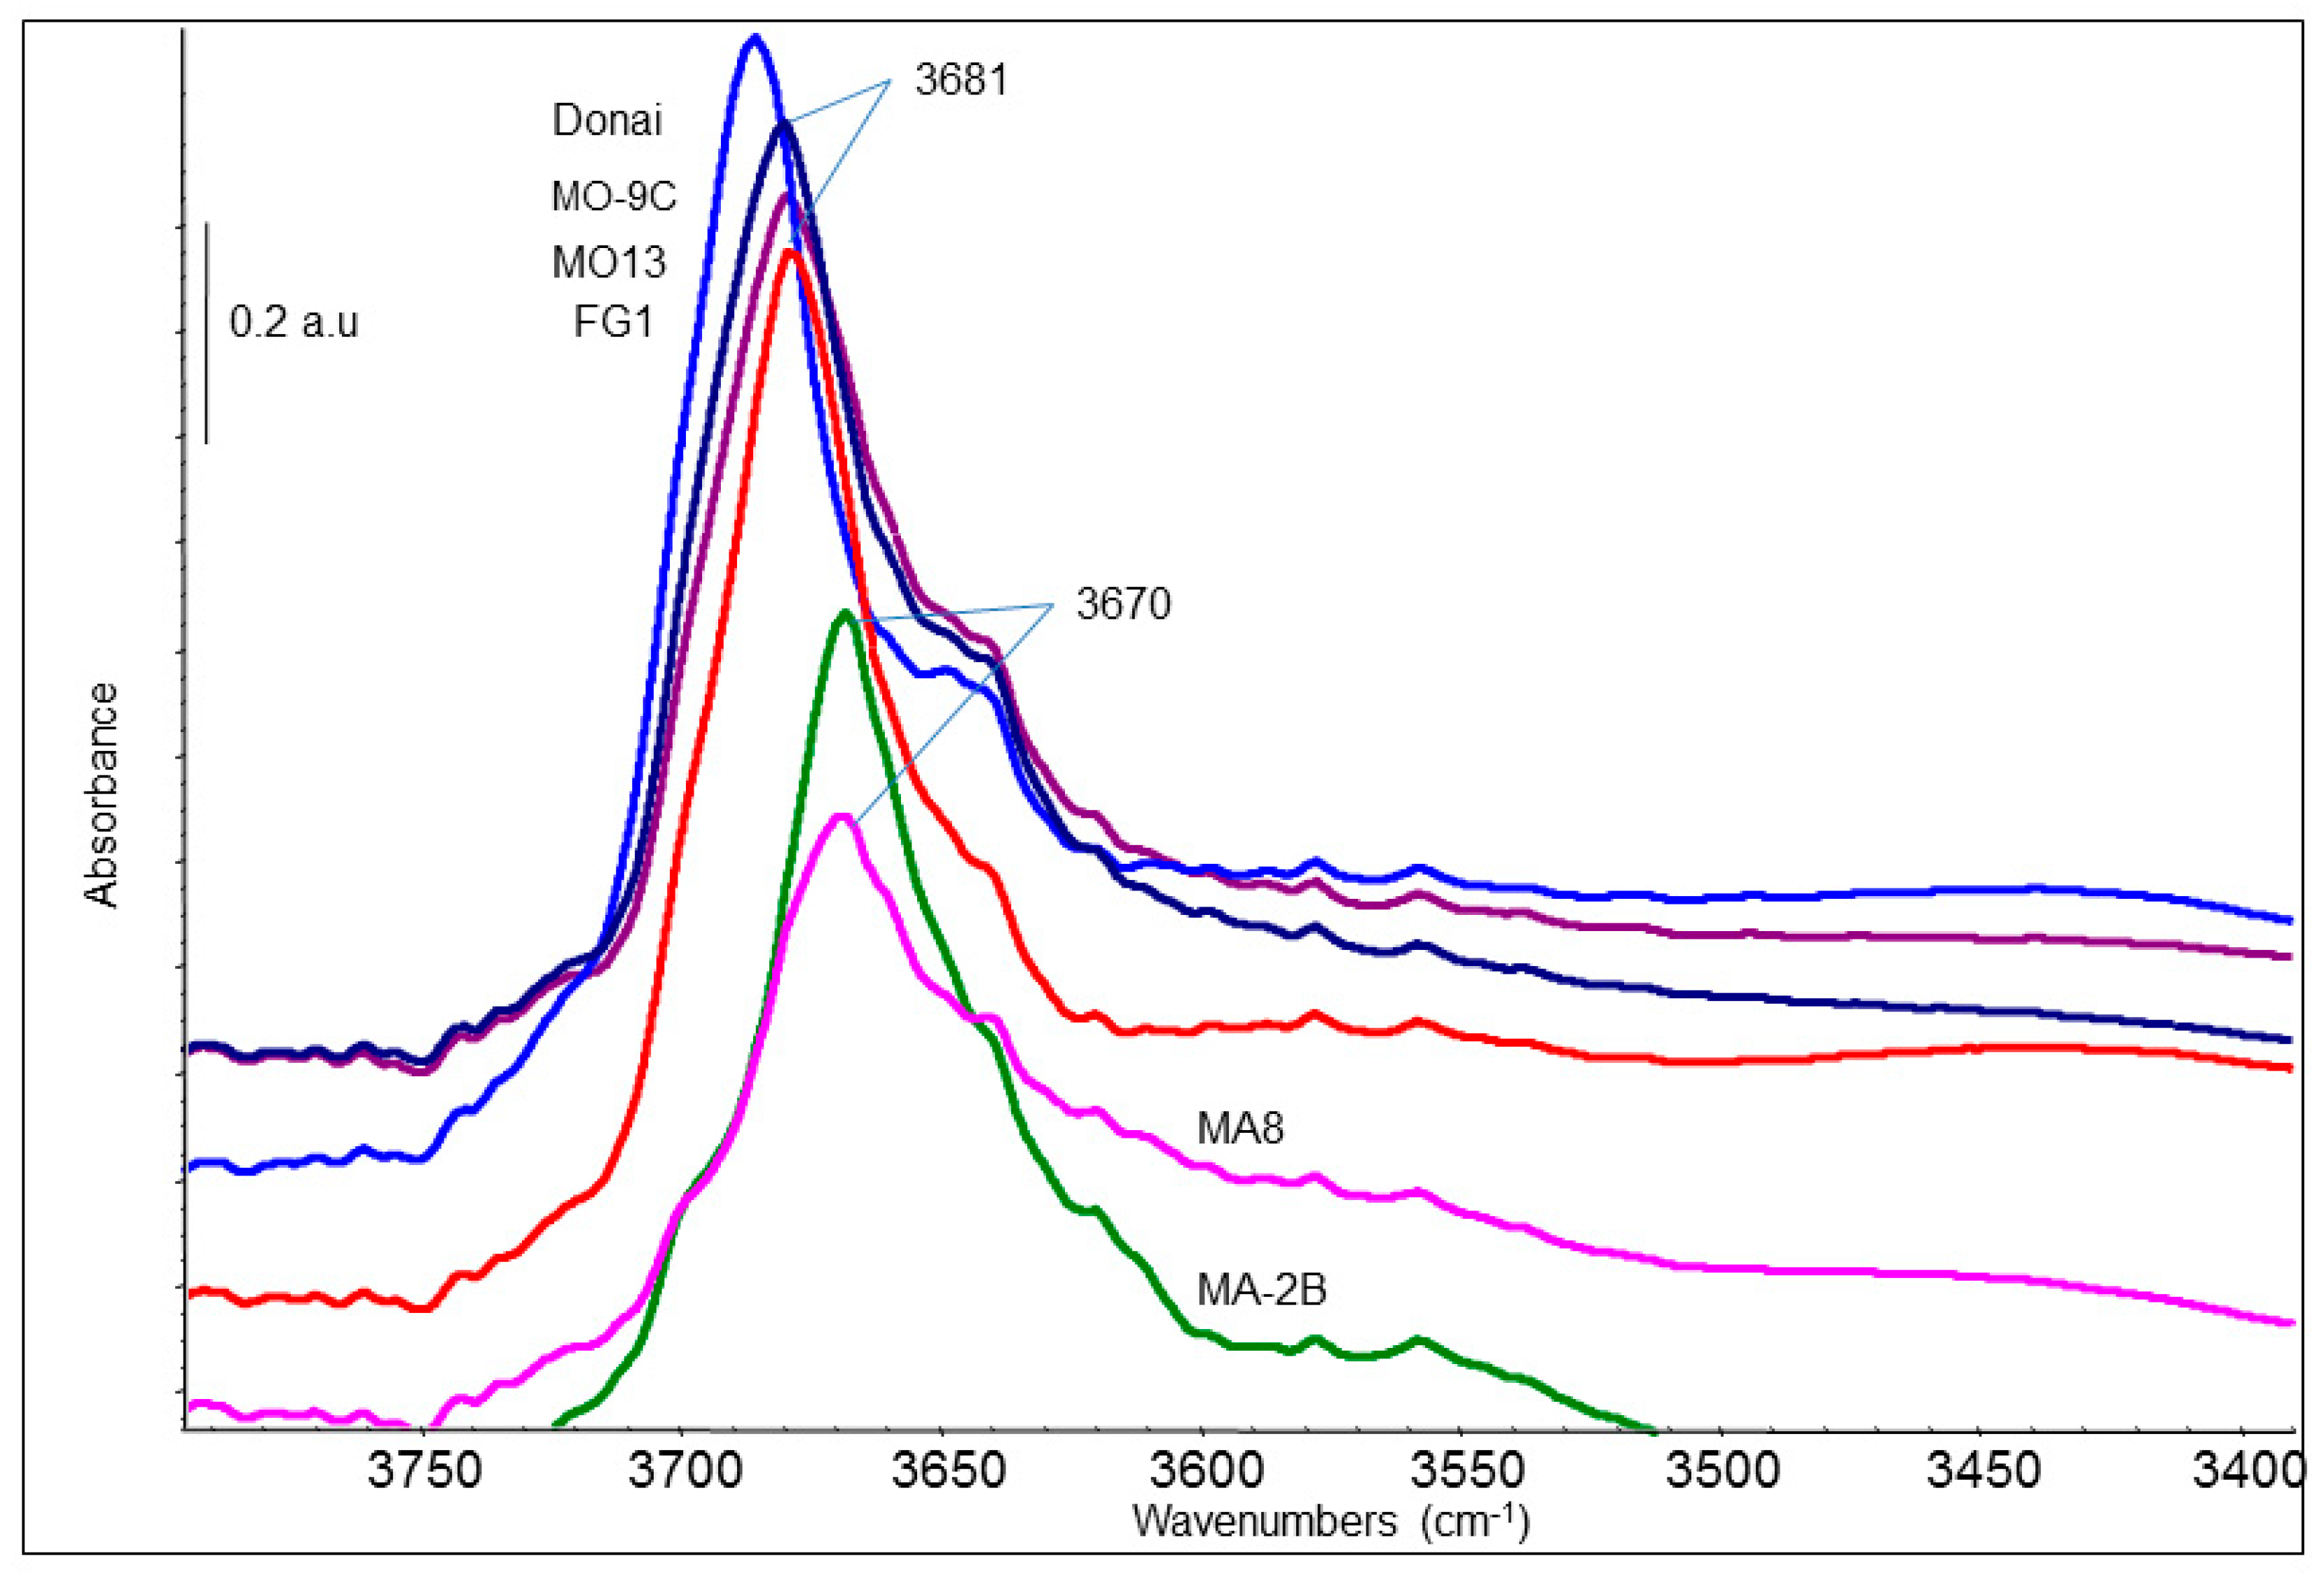
3.6. FT-IR Spectroscopy

The IR spectra of the serpentine samples, in the 4000–400 cm−1 range, were characterized by three groups of bands: (i) Strong absorption bands in the range 3800–3500 cm−1 (Figure 6), due to MO–H (M = Fe2+ or Mg2+) stretching vibrations modes; (ii) a very strong complex of bands in the range 1200–600 cm−1 (Figure 7), due to asymmetric and symmetric Si–O–Si stretching modes and (iii) one or more strong bands in the region 600–400 cm−1 (Figure 7) assigned to M–OH stretching (M = Fe2+ or Mg2+) and Si-O-Si deformation modes [24]. Moreover, all the samples, except the so-called Donai, presented absorption bands characteristic of carbonate species [25] of varying intensity, near 1440 cm−1 and 880 cm−1, due to symmetric stretching and bending modes, respectively (Figure 7).
The IR spectra of the six serpentinites in the region of the surface hydroxyl is recorded in Figure 6. All spectra were dominated by a broad absorption band with a maximum and shoulders of different relative intensities. In the case of Donai, MO-9C, FG1 and MO13, maxima at 3685 (for Donai) and 3681 cm−1 and shoulders at 3704, 3693 and 3670 cm−1 were observed. These bands are characteristic of the stretching modes of the isolated surface OH’s over MgO6 octahedra [26,27]. The spectra of the MA-2B and MA8 samples showed the same bands but the relative intensities differed significantly from the preceding ones. In particular, the spectra clearly showed a maximum at 3670 cm−1 and evident shoulders at 3704, 3693 and 3685 cm−1 i.e., the maximum at 3685 cm−1 and the shoulder at 3670 cm−1 in the former samples and in the two latter ones were observed as a shoulder and a maximum, respectively. The IR spectra corresponding to OH’s stretching modes we reported here for serpentinite samples agreed with those reported in the literature [25,26]. However, in the case of our serpentinites, we observed clearly a shift in the maximum of absorption to lower wavenumbers from 3685–3681 cm−1 for Donai, FG1, MO13 and MO9C samples, in which the prevalent phase was antigorite, down to 3670 cm−1 for MA-8 y Ma-2B samples, where the prevalent phase was lizardite. We considered that this shift of the maximum of absorption, corresponded to the isolated surface OH’s groups over MgO6 octahedra, which was related to the structural effect of the antigorite or lizardite phases. In fact, the lower values of cell parameters in lizardite compared to antigorite corresponded to a lower Mg–O bond length, therefore in lizardite O–H bond length increased and as a result, the OH’s stretching modes of the two rich in lizardite samples, MA-8 and MA-2B, were observed at a lower frequency than in the case of the other ones in which the predominant phase was antigorite.
The IR spectra in the skeletal region of all samples reported in Figure 7 could be interpreted on the basis of the known IR spectra of the silica polymorphs, where any oxygen atom in a tetrahedral-based SiO2 polymorph was bonded with two tetrahedral cations (Si4+) and has a point group of symmetry C2V [28,29,30].
The spectra of MA8, MA-2B samples were composed of sharp bands, indicating a high ion ordering in the structure. These spectra showed the very strong Si–O–Si asymmetric stretching mode with a maximum at 985 cm−1 and shoulders at 1068 cm−1 (pronounced) and 966 cm−1. The higher vibration mode, according to the literature [24,31], was due to the in-phase coupling of the asymmetric stretching modes of the nearest Si–O–Si groups. The spectra of the samples FG1, MO13, MO-9C, and Donai (Figure 7) were similar to the samples MA8 and MA-2B, although with less intense bands and different relative intensities. Thus, the sharp band observed on MA8 and MA-2B at 985 cm-1, associated to asymmetric stretching of the Si–O–Si bridges decreased consecutively in intensity in FG1, MO13, MO-9C and Donai samples and, in parallel, the shoulder observed on the MA8 and MA-2B samples to 966 cm−1 increased its intensity up to be observed as an absolute maximum in the latter four samples. Considering that the absorption maxima corresponding to the O–Si–O asymmetric stretching mode were related to the value of cell parameters of the lizardite and antigorite phases, we associated the higher vibration frequency of the MA8 and MA-2B samples, i.e, lower Si–O–Si bond length, to the predominance of lizardite over antigorite and, on the contrary, the lower vibration frequency observed for the other four samples where antigorite predominated over lizardite, was in agreement with the SEM and DRX analysis.
In the 700–500 cm−1 region, two bands were observed, the first one, of medium strength with two components at 646 and 624 cm−1, corresponded to the symmetric Si–O–Si stretching mode, which also had a Si–O–Si in-plane bending character, while the other one was observed at ca. 564 cm−1 was assigned to stretching Mg–OH(νM-O) in octahedral sites [24].
The first component at 646 cm-1 appeared as a maximum in samples MA8 and MA-2B, where the predominant phase was lizardite, while the second at 624 cm−1 was a maximum when the prevalent phase was antigorite. The maximum at 564 cm−1 observed for the MA8 and MA-2B samples shifted down (up to 555 cm−1) for the F1G, MO13, MO-9C and Donai samples due to the higher Mg–OH bond energy of the two former samples with respect to the latter ones.
Considering a tetrahedral symmetry for SiO4, the two components observed on the lowest frequency sharp band at 459 and 445 cm−1 were associated to the Si–O–Si out-of-plane bending vibration (δSiOSi) and rocking mode of the Si–O–Si bridges [31], respectively.
The broad absorption band with maxima between 1430 and 1450 cm−1 and the sharp band at 876 cm−1 corresponding to the carbonate groups, decreased in intensity in the order: MA-2B, FG1 and MO13 samples, agreeing with the diffractograms of these samples, where, in addition to the antigorite and lizardite phases, diffraction peaks corresponding to the calcite and dolomite carbonates were also observed.
Particularly, in the MA8 sample the presence of two bands at 1445 and at ca. 1220 cm−1 (weak) characteristic of surface hydrogen carbonates [32] (C–O symmetric stretching and COH deformation modes, respectively), confirmed the formation of these species, more soluble than the carbonates, by reaction of carbonate species with excess CO2 circulating through the fractures of the rocks, according to the reaction:
MCO3(s) + H2O(ac) + CO2(g) ↔ M(HCO3)2(s) → (M = Ca, Mg)

4. Implications of the Serpentinites

Many different tools have been used in the study of serpentinites and their mineralogy. Most of them are confusing when trying to differentiate the different polymorphs. However, the proper mineralogical characterization of these rocks is important when used in different applications, from materials for construction to materials for insulation and as ornamental stone. Some fibrous minerals have been proven to be related to specific health problems such as asbestosis. It has been reported that rigid fibers such as those identified with acicular amphiboles (e.g., actinolite, tremolite) can cause tissue damage that can degenerate into mesothelioma [33,34]. It has not been fully proven that serpentine polymorphs are related to health issues, but it is very important to present a complete and reliable characterization of stones when they are commercialised in a quality demanding market. The easy methods we proposed in this paper for the analysis of serpentinites such as Vibrational and Electronic spectroscopy can save a lot of time in the characterization of these rocks, with the implications in the advance of petrogenetic research of them, but also the economic implications related to different economic areas, from natural stone exploitation to the use of serpentine phases in new ceramic products, avoiding acicular/fibrous and suspicious phases.
The presence of Fe3+ cations, from the transformation of serpentinites, may be detected by Vis-UV spectroscopy. Thus, the presence of two broad absorptions bands at 800 and 350 cm, due to 6A14T1 (4G) crystal-field d → d transition of octahedral Fe3+ ions, and oxygen-to-metal charge-transfer transition (O2- → Fe3+) was indicative of the presence of Fe3+ ions from the oxidation of octahedral Fe2+ ions, partially replacing Mg2+ ions, in the serpentine phase.
We proposed that the two bands of the IR spectrum assigned to terminals OH’s groups on octahedral Mg2+ ions of serpentinites, with maxima at ca. 3685–3681 cm−1 for samples whose predominant phase was antigorite and 3670 cm−1 for those whose predominant phase was lizardite, could be considered diagnostic in order to differentiate the predominance of these phases in serpentinites.

Author Contributions

All authors have been involved in the analytical work, the writing and editing of the manuscript.

Funding

This research was partially funded by University of Salamanca, grant Ref: ref. KAW9/463AC01.

Acknowledgments

The authors thank the University of Salamanca under Grant ref. KAW9/463AC01 for partial financial support as well as the Electronic Microscopy Service of this university. Authors acknowledge the comments and advice of two anonymous reviewers that helped to enrich the original paper.

Conflicts of Interest

The authors declare no conflicts of interest.

References

  1. Wicks, F.J.; O’Hanley, D.S. Serpentine Mineral: Structure and petrology. Reviews in Mineralogy. In Hydrous Phylosilicates; Baley, S.W., Ed.; Mineralogical Society of America: Chantilly, VA, USA, 1988; pp. 91–167. [Google Scholar]
  2. Andreani, M.; Mevel, C.; Boulier, A.M.; Escertín, J. Dynamic control on serpentine crystallisation in veins: Contrainints on hydration process in oceanic peridotites. Geochem. Geophys. Geosyst. 2007, 8. [Google Scholar] [CrossRef]
  3. Dicchico, M.C.; Paternoster, M.; Rizzo, G.; Sinisi, R. Mineralogical Asbesto Assessment in the Southern Appenines (Italy): A review. Fibers 2019, 7, 24. [Google Scholar] [CrossRef]
  4. Auzende, A.L.; Devouard, B.S.; Danile, I.; Baronnet, A.; Lardeaux, J.M. Serpentines from Central Cuba: Petrology and HRSEM study. Eur. J. Mineral. 2002, 14, 905–914. [Google Scholar] [CrossRef]
  5. Evans, B.W. The serpentinite multisysSEM revisited: Chrysotile is metastable. Int. Geol. Rev. 2004, 46, 479–506. [Google Scholar] [CrossRef]
  6. Cressey, B.A.; Whittaker, E.J.W. Five-fold symmetry in chrysotile asbestos revealed by transmission electron microscopy. Mineral. Mag. 1993, 5, 729–732. [Google Scholar] [CrossRef]
  7. Pereira, D.; Yenes, M.; Blanco, J.A.; Peinado, M. Characterization of serpentinites to define their appropriate use as dimension stone. Geol. Soc. Lond. Spec. Publ. 2007, 271, 55–62. [Google Scholar] [CrossRef] [Green Version]
  8. Pereira, D.; Peinado, M.; Blanco, J.A.; Yenes, M. Geochemical characterization of a serpentinization process at Cabo Ortegal (NW Spain). Can. Mineral. 2008, 46, 317–327. [Google Scholar] [CrossRef]
  9. Pereira, D.; Peinado, M.; Yenes, M.; Monterrubio, S.; Nespereira, J.; Blanco, J.A. Serpentinites from Cabo Ortegal (Galicia, Spain): A search for correct use as ornamental stones. Geol. Soc. Lond. Spec. Publ. 2010, 333, 81–85. [Google Scholar] [CrossRef]
  10. Post, J.L.; Borer, L. High-resolution infrared spectra, physical properties, and micromorphology of serpentines. Appl. Clay Sci. 2000, 16, 73–85. [Google Scholar] [CrossRef]
  11. Navarro, R.; Pereira, D.; Gimeno, A.; del Barrio, S. Verde Macael: A serpentinite wrongly referred to as a marble. Geosciences 2013, 3, 102–113. [Google Scholar] [CrossRef]
  12. Navarro, R.; Pereira, D.; Rodríguez-Navarro, C.; Sebastián Pardo, E. The Sierra Nevada Serpentinites: The serpentinites most used in Spanish Heritage buildings. Geol. Soc. Lond. Spec. Publ. 2015, 407, 38–44. [Google Scholar] [CrossRef]
  13. CHEKCELL.v.2. Program of Refinement Software by Jean Lauguier et Bernard Bochu. Available online: http://www.inpg.fr/LMGP or Http://www.ccp14.ac.uk/tutorial/Imgp/ (accessed on 29 April 2019).
  14. West, A.R. Solid State Chemistry and Its Applications; Wiley: Chichester, UK, 1996; p. 174. [Google Scholar]
  15. Liu, K.; Chen, Q.; Hu, H.; Yin, Z. Characterization and leaching behaviour of lizardite in Yuanjiang laterite ore. Appl. Clay Sci. 2010, 47, 311–316. [Google Scholar] [CrossRef]
  16. Li, W.; Huang, Z.; Liu, Y.; Fang, M.; Ouyang, X.; Huang, S. Phase behavior of serpentine mineral by carbothermal reduction nitridation. Appl. Clay Sci. 2012, 57, 86–90. [Google Scholar] [CrossRef]
  17. Gregg, S.J.; Sing, K.S.W. Adsorption Surface Area and Porosity; Academic Press: London, UK, 1991. [Google Scholar]
  18. Barry, C.; Norton, M.G. Ceramic Materials: Science and Engineering; Springer: New York, NY, USA, 2007. [Google Scholar]
  19. Haar De, L.G.J.; Blase, G. Photoelectrochemical properties of MgTiO3 and other titanates with the ilmenite structure. J. Electrochem. Soc. 1985, 132, 2933. [Google Scholar] [CrossRef]
  20. Willey, R.J.; Oliveri, S.A.; Busca, G. Structure and magnetic properties of magnesium ferrite fine powdersStructure and magnetic properties of magnesium ferrite fine powders. J. Mater. Res. 1993, 8, 1418–1427. [Google Scholar] [CrossRef]
  21. Prieto García, M.C.; Gallardo Amores, J.M.; Sánchez Escribano, V.; Busca, G. Characterization of coprecipitated Fe2O3-Al2O3 powders. J. Mater. Chem. 1994, 4, 1123–1130. [Google Scholar] [CrossRef]
  22. Kennedy, J.H.; Frese, K.W. Photooxidation of water at α-Fe2O3 electrodes. J. Electrochem. Soc. 1978, 125, 709. [Google Scholar] [CrossRef]
  23. Busca, G.; Ramis, G.; Prieto García, M.C.; Sánchez Escribano, V. Preparation and characterization of Fe2−xCrxO3 mixed oxide powders. J. Mater. Chem. 1993, 3, 665–673. [Google Scholar] [CrossRef]
  24. Mazza, D.; Lucco-Borlera, M.; Busca, G.; Delmastro, A. High-quartz solid-solution phases from xerogels with composition 2MgO.2Al2O3.5SiO2 μ-cordierite. J. Eur. Ceram. Soc. 1993, 11, 299–308. [Google Scholar] [CrossRef]
  25. Bellamy, L.J. The Infrared Spectra of Complex Molecules, 3rd ed.; John Wiley and Sons, Inc.: New York, NY, USA, 1975. [Google Scholar]
  26. Foresti, E.; Formaro, E.; Lesci, I.G.; Zuccheri, R.T.; Roveri, N. Asbestos health hazard: A spectroscopic study of synthetic geoinspired Fe-doped chrysotile. J. Hazard. Mater. 2009, 167, 1070–1079. [Google Scholar] [CrossRef]
  27. Frost Ray, L.; Jagannadha Reddy, B.; Bahfenne, S.; Graham, J. Mid-infrared and near-infrared spectroscopic study of selected magnesium carbonate minerals containing ferric iron-Implications for the geosequestration of greenhouse gases. Spectrochem. Acta Part A Mol. Biomol. Spectrosc. 2009, 72, 597–604. [Google Scholar] [CrossRef]
  28. Gadsden, J.A. Infrared Spectra of Minerals and Related Inorganic Compounds; Butterworths: London, UK, 1975. [Google Scholar]
  29. Griffith, W.P. Spectroscopy of Inorganic-Based Materials; Clark, R.J.H., Hester, R.E., Eds.; Wiley: Hoboken, NZ, USA, 1987. [Google Scholar]
  30. Astorino, E.; Peri, J.B.; Willey, R.J.; Busca, G. Spectroscopic characterization of silicate-1 and titanium silicate-1. J. Catal. 1995, 157, 482–500. [Google Scholar] [CrossRef]
  31. Kamitsos, E.I.; Patsis, A.P.; Kordas, G. Infrared-reflectance spectra of heat-treated sol-gel-derived silica. Phys. Rev. B 1993, 48, 12499. [Google Scholar] [CrossRef]
  32. Montanari, T.; Gastaldi, L.; lietti, L.; Busca, G. Basic catalysis and catalysis assisted by basicity: FT-IR and TPD characterization of potassium-doped alumina. Appl. Catal. A Gen. 2011, 400, 61–69. [Google Scholar] [CrossRef]
  33. Dicchico, M.C.; de Bonis, A.; Mongelli, G.; Rizzo, G.; Sinisi, R. μ-Raman spectroscopy and X-ray diffraction of asbestos minerals for geoenvironmental monitoring: The case of the southern Appenines natural sources. Appl. Clay Sci. 2017, 141, 292–299. [Google Scholar] [CrossRef]
  34. Dicchico, M.C.; Laurita, S.; Sinisi, R.; Battiloro, R.; Rizzo, G. Environmental and Health: The importance of tremolite occurence in the Pollino Geopark (Southern Italy). Geosciences 2018, 8, 98. [Google Scholar] [CrossRef]
Figure 1. (a) Serpentinite from Macael: Most original minerals have been replaced by serpentine. The latter was replaced by carbonates in a later stage and acicular crystals of amphibole were cutting the serpentine in a final metamorphic transformation. Cross Nichols microphotograph. (b) Serpentinite from Cabo Ortegal (Moeche). The original ultramafic rock completely transformed into serpentine. Fibrous chrysotile could be identified by cutting the other serpentine phases of the rock. Cross Nichols microphotograph.
Fibers 07 00047 g001
Figure 2. Scanning electron microscopy micrographs of serpentinites.
Fibers 07 00047 g002
Figure 3. XRD patterns of serpentinites: “ch” chrysotile, “x” Ca(OH)2, “c” calcite and “d” dolomite. The position and intensities of the peaks were reported according to the ICDD cards.
Fibers 07 00047 g003
Figure 4. Nitrogen adsorption isotherms on serpentinite samples at 77 K.
Fibers 07 00047 g004
Figure 5. DR-UV–vis spectra of the different serpentinites: (1) DONAI, (2) FG1, (3) MO-13, (4) MO-9C, (5) MA-2B and (6) MA8.
Fibers 07 00047 g005
Figure 6. FT-IR spectra of the serpentinites in the 3800–3350 cm−1 range.
Fibers 07 00047 g006
Figure 7. FT-IR spectra of the serpentinites in the 1700–400 cm−1 range.
Fibers 07 00047 g007
Table 1. Mineralogic composition, crystallographic data, calculated from the XRD patterns and specific surface area.
SampleMineral PhaseCell Paramaters(Å)V(Å3)D(Å)SBET (m2∙g−1)
A(Å)B(Å)C(Å)
MA8Lizardite, calcite, dolomite, magnetite5.335(3)5.335(3)7.335(3)180.8(3)3088
MA-2BLizardite, calcite, dolomite, clorite, tremolite5.329(3)5.329(3)7.339(2)180.5(2)2579
MO-9CAntigorite, magnesite, dolomite5.2999(4)9.217(1)42.910(4)2096.2(6)28032
MO13Antigorite, chrysotile, magnesite, dolomite5.2892(6)9.204(2)42.862(6)2086.7(9)30725
FG1Antigorite, calcite, dolomite5.2919(6)9.214(2)42.786(5)2086.3(9)38025
DonaiAntigorite5.301(1)9.2064(2)42.726(6)2085.1(9)23738
Lizardite ICDD file No. 18-0779: a = 5.73172; monoclinic, SG: P31m (157), Z = 1. Antigorite ICDD file No. 12-0583: a = 5.305, b = 9.189, c = 42.75, orthorombic, SG: (O), Z = 6. Predominant phase is marked in italics.

