Abstract
A fiber-optic strain sensor that can show strain via color change and which can be viewed using human eyes has demand in the civil engineering field for alerting purposes. A previous sensor was fabricated using PMMA (Poly(methyl methacrylate)), which had the exceeding hardness to exhibit satisfactory sensor performance. In this research, an elastomer-based fiber-optic structure was fabricated to enhance the elastic response of such sensors and to enlarge the waveguide cross section. Various organic fluorophores were added to the core and cladding regions of the elastic waveguide to induce energy flow from the core to the cladding when stress is applied to the waveguide. Elastomer pairs suitable for the core and cladding were selected from among several candidate materials having high transparency. A method of dispersing fluorophores to each host elastomer and constructing an excellent core–cladding interface using the selected materials was proposed. To investigate the time-dependent changes in the fluorescence of the doped elastomer waveguide, the absorption and emission spectra were monitored after the host elastomers were cured.
1. Introduction
Much of the Japanese infrastructure that was built in the era of high economic growth in the 1960s is now at risk of collapse owing to natural hazards that could strike the region unpredictably at any time [1,2]. As a result, various types of structural monitoring are necessary in Japan. Fiber-optic (FO) structural monitoring can be used to monitor large areas using one device; hence, it is recognized to be suitable for monitoring the deformation of a structure. The fiber Bragg grating and Brillouin optical-domain reflectometer are well-known FO strain sensors that exhibit highly reliable performance [3]. However, the overall cost of the mechanical and/or electrical transducers required to construct these systems, which can include spectral analysis systems, well-tuned light sources, or signal processing systems, often exceed the repair cost of the structure itself.
With the goal of producing an FO strain sensor with fewer components, we previously reported a strain sensor made from a polymeric optical fiber (POF) that works with environmental white light and inspection by eye [4]. The POF contains rhodamine 6G (R6G) and coumarin 540A in its cladding and core, respectively. When the fiber is deformed, emission from coumarin 540A is used to excite the R6G, and the stress is indicated by a color change in the cross-section of the end of the POF. Figure 1 shows the excitation and emission spectra of this fluorophore pair. This type of energy flow can be obtained using a fluorophore pair that has sufficient overlap in the emission and excitation peaks of the two components. A polymeric system is typically suitable for this purpose for two reasons. First, the low processing temperature of polymers conserves the structure of the doped fluorophores. Second, polymers are more elastic and have a higher elastic limit than silica, the most typical material for an optical fiber [5,6,7,8,9,10].
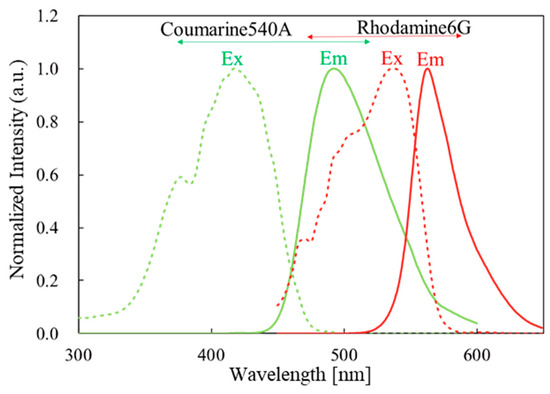
Figure 1.
Excitation and emission spectra of donor/acceptor fluorophore.
Here, we report a fluorophore-doped FO sensor structure using polydimethylsiloxane (PDMS) elastomers. Previously reported sensor had PMMA (Poly(methyl methacrylate)) as the fiber material [4]. Poly(methyl methacrylate) was a proper material to demonstrate the sensor principle but had shown poor sensitivity on its own due to its hardness. Most elastomers have hardness (Rockwell scale) below 80 whereas the hardness of PMMA ranges from 80 to 100. Polydimethylsiloxanes are even more elastic than acrylate polymers, so enhanced sensitivity and the ability to fabricate sensors with larger cross sections can be expected for the same fluorophore-doped structure. We selected a PDMS pair that forms an excellent core–cladding interface and is also capable of hosting fluorophores.
2. Materials and Methods
2.1. Dispersal of Fluorophore in an Elastomer Bulk
To optimize the dispersion of the fluorophores into an elastomer bulk, R6G was dispersed in an elastomer before waveguide fabrication. The R6G was purchased from TCI Chemicals and used as received. A highly transparent elastomer (sample A) with an undisclosed chemical structure was provided by Shin-Etsu Chemical Co. (Tokyo, Japan). Sample A is the most typical material among the series of transparent elastomers Shin-Etsu produces. Rhodamine 6G is a typical dopant fluorophore that has been used in POFs for various purposes [4,8,9]. It was dispersed in cyclopentanone before use. This solvent was later dispersed in the precursor mixture and was distributed uniformly by a spatula and simultaneously degassed using a planetary centrifugal mixer (AR-100, THINKY, Tokyo, Japan). The two precursors, which appeared viscous, were mixed at a recommended ratio before use. Four doped bulks with various dopant concentrations and curing conditions were obtained, as listed in Table 1. To measure the emission spectra of these samples using a spectrofluorometer (FP-6300, JASCO, Tokyo, Japan), samples were cured in a disposable cell that fits the cell holder of the spectrofluorometer. Light at a wavelength of 525 nm was selected for excitation of the doped sample according to the datasheet for R6G.

Table 1.
Samples of fluorophore-doped elastomer A.
2.2. Refractive Index and Elasticity Measurement for Selecting a Core–Cladding Pair
Table 2 lists the highly transparent elastomers that Shin-Etsu Chemical produces. To select a combination that is most suitable for constructing a core–cladding interface, the temperature-dependent refractive index and hardness of each material were tested. A and D have multiple choices for curing conditions. The temperature-dependent refractive index of each cured sample at the D line was obtained using a multi-wavelength refractometer (AbbeMAT-WR/MW, Anton Paar, Styria, Austria). Samples were polymerized on the surface of a substrate with a thickness of no less than 50 µm. The cured elastomers, which had been cut to fit the holder of the refractometer, were removed from the substrate. In addition, the rubber elasticity of each cured elastomer was evaluated using a durometer.
Table 2.
Series of transparent elastomers and their properties.
2.3. Density and Atomic Characterizations of Selected Elastomers
To clarify whether the curing process affects the density of the final product, the volume of each cured product was measured. To fabricate a good core–cladding interface, it is best to use core and cladding materials with similar shrinkage rates. Either 3 or 5 g of the precursors was prepared in a Petri dish (32 mm in diameter, 15 mm in height). The precursors were cured at room temperature, 60 °C or 150 °C. The surface of the Petri dish was pretreated using a silane coupling agent so that the sample could be removed from the dish without damage. The thickness of each sample was measured at five points after it was removed from the dish. Figure 2 shows the approximate locations at which the thickness was measured.
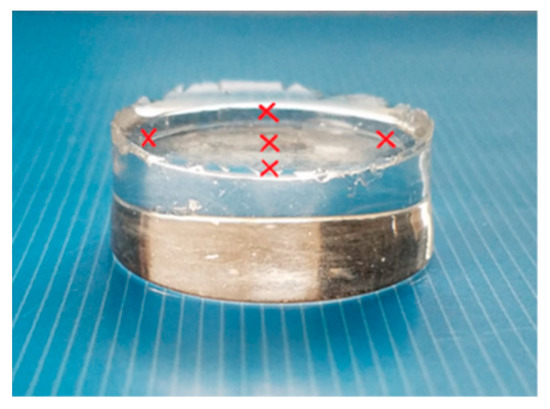
Figure 2.
Five points at which the thickness of the fabricated elastomer samples was measured. Red crosses represent the measured location.
To characterize the effect of the host material on the fluorescence, the atomic composition of the precursors and cured bulks of the selected core and cladding materials was analyzed using X-ray fluorescence (XRF) spectrometry (EDX-GP, Shimadzu Co., Kyoto, Japan). Samples with film and rod structures were prepared for comparison.
3. Results and Discussion
3.1. Emission Spectrometry of the Fluorophore-Doped Elastomer
Figure 3 shows the excitation and emission spectra of Samples 1 and 2 (Table 1) at three times: before, immediately after, and 50 days after curing. These samples have different concentrations of the R6G fluorophore, and both samples were cured at room temperature. A wavelength of 525 nm was used for excitation. Sample properties are listed in Table 1. The fluorescence activity decayed remarkably in Sample 1 with curing. The excitation and emission spectra of Sample 2, which had a lower R6G concentration than Sample 1, at these three times did not differ greatly.
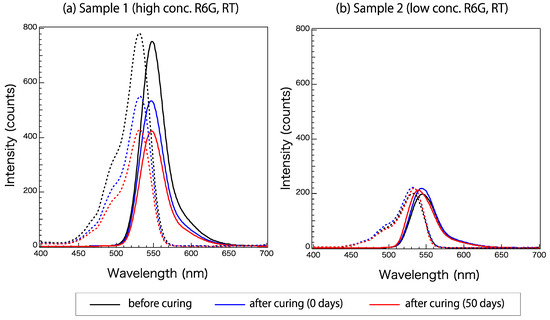
Figure 3.
Excitation (broken line) and emission (solid line) spectra of Samples (a) 1 and (b) 2 before, immediately after, and 50 days after curing.
To understand the decay mechanism, the fluorescence magnitudes of a wider variety of samples over approximately 30 days were plotted. Figure 4 shows the time-dependent fluorescence changes in samples 1–6 (Table 1). The intensity of the emission peak around 546 nm was plotted over a period of time. The samples with low R6G concentrations (samples 2, 4, and 6) did not show notable differences depending on the curing conditions. These samples showed a gradual decay of the maximum fluorescence intensity over 30 days, which stabilized around day 16. On the other hand, samples with high R6G concentrations (samples 1, 3, and 5) showed a different trace that could be related to their curing temperatures. Sample 1, which was cured at the lowest temperature, showed a gradual decay over 30 days. Sample 5, which was cured at the highest temperature, showed increasing fluorescence after 24 days of monitoring. Sample 3, which was cured at an intermediate condition, showed a trace that is also intermediate. At around day 16, the high-concentration samples also appeared to be reaching the stable state, after which the fluorescence did not change dramatically compared to the earlier changes.
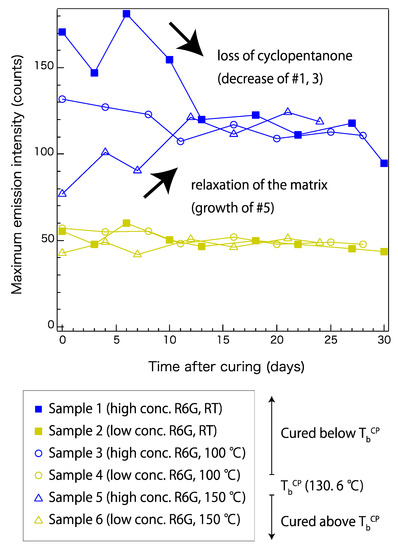
Figure 4.
Time-dependent fluorescence changes in samples cured at room temperature (RT), 100 °C, and 150 °C. Samples with high and low R6G concentrations (conc.) are plotted in blue and yellow, respectively. Sample properties are listed in Table 1. TbCP represents boiling point of cyclopentanone.
The trend observed in Figure 4 can be explained by the presence of cyclopentanone in each sample. Cyclopentanone was used to disperse the R6G uniformly in the precursors. As shown in Table 1, the high-concentration samples initially contained more cyclopentanone than the low-concentration samples. In addition to the initial content, the curing conditions and time period after curing also affect the final cyclopentanone content. Because the boiling point of cyclopentanone is 130.6 °C, most of it is removed during curing of samples 5 and 6. However, it should remain in the matrix for samples 1–4, but the samples cured at room temperature are expected to have a higher content than those cured at 100 °C. This explains why the low-concentration samples held its fluorescence at a similar level after approximately 30 days, and also why samples cured at different temperatures showed similar trends. The solvent was also expected to gradually vaporize with time, and this explains the stabilization of all the samples observed after day 16. This evidence suggests that the presence of cyclopentanone may affect the R6G fluorescence, possibly by facilitating local dispersal of R6G molecules inside the siloxane network. In contrast, when it vaporizes, R6G may form an aggregated structure that no longer emits fluorescence in the original wavelength region. On the other hand, the gradual increase observed in sample 5 was not likely to be related to cyclopentanone. It may be caused by internal relaxation of the siloxane network. Sample 5, which was cured at 150 °C, should have a higher internal stress than samples cured at lower temperatures. Such relaxation of the siloxane network may contribute to making the local distribution of R6G more uniform.
3.2. Selecting Elastomer Pair with Similar Characteristics for Core and Cladding
Figure 5 shows the temperature-dependent refractive indices of elastomers A–D (Table 2) measured at the D line. The refractive indices of all the elastomers exhibited a linear relationship with temperature in the range of 20 to 60 °C. Because all the candidate elastomers exhibited a similar linear trend, changes in temperature are not likely to strongly affect the waveguide conditions for any combination of core and cladding materials. These gradients are expected to be maintained even at the lower and higher temperature ranges as long as the elastomer maintains its material phase. Because elastomers A and C have almost the same refractive index, they should not be chosen as core and cladding materials for each other. They can be used either as a cladding in combination with a core of elastomer D, or as a core with a cladding of elastomer B. A combination of elastomers B and D would exhibit the largest numerical aperture (NA) of approximately 0.72, which is quite high compared to those of optical fibers. Elastomer B is a suitable cladding material with any core material.
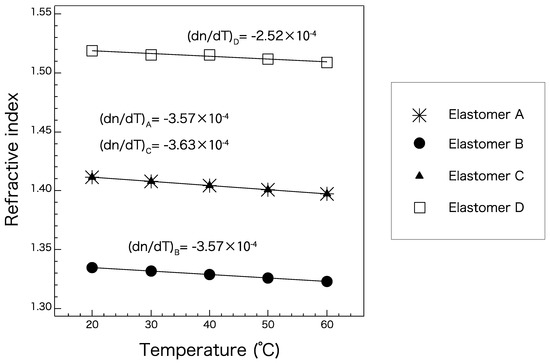
Figure 5.
Absolute refractive indices of elastomers A–D at the D line at selected temperatures.
Table 3 and Table 4 show the rubber hardness of elastomers A–D and possible core–cladding pairs, respectively. Elastomer D had the highest rubber hardness and significant shrinkage after curing compared to the other materials. Fabrication of optical fiber structures using elastomers employs a method similar to interfacial gel polymerization of acrylic optical fibers, in which the core is polymerized inside the cladding tube, which is solidified in advance [10]. Photographs of the cladding and the rotational motor that were used to form the tube structure are shown in Figure 6a–c. Figure 6d shows the prototype using elastomer D for the core. Significant haze was observed at the core–cladding boundary, which is not desired in an optical waveguide. This haze was attributed to the large difference between the volumetric properties of elastomer D and those of all the possible cladding materials. The pair of elastomers A and B was concluded to be the optimal choice because of its good interface and adequate numerical aperture (NA).
Table 3.
Rubber hardness of the transparent elastomers.
Table 4.
Possible core–cladding pairs and their numerical aperture (NA) and difference in rubber hardness values (∆RH).
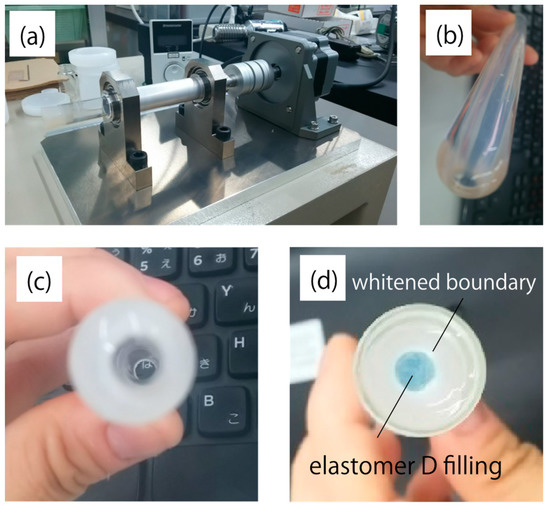
Figure 6.
Photographs of (a) the rotational motor attachment for cladding fabrication, (b) side and (c) top views of the cured elastomer tube, and (d) the core filled with elastomer D. Alumina was added to the cladding so that its shape could be observed more clearly.
3.3. Dependence of Volumetric Properties on Curing Conditions
To enhance the quality of the core–cladding interface, the volumetric properties of elastomers A and B were further investigated. Figure 7 shows the density of elastomer samples of various weights after curing at various temperatures. Under any curing condition, the cladding material (elastomer B) had a higher density than the core material (elastomer A). A lower curing temperature and higher weight yielded a higher density. This result can be attributed to the opportunity for the microstructure to relax and become self-organized. For this pair, the curing conditions were not shown to significantly affect the relationship between the densities of the core and cladding. However, it is desirable to match their properties in order to obtain an excellent interface. To obtain a similar density of the two elastomers, curing of elastomers A and B at room temperature and 150 °C, respectively, is recommended.
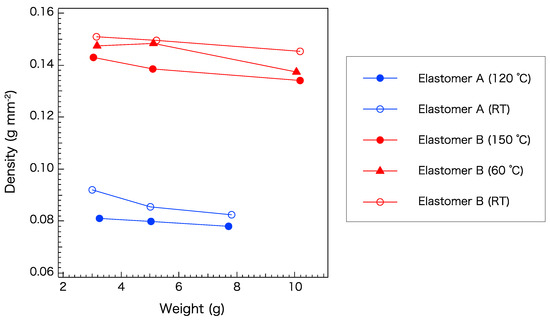
Figure 7.
Density of elastomers A and B cured at different temperatures. RT: Room temperature.
3.4. Elemental Analysis of the Elastomer and Precursors
The XRF results of elastomers A and B are shown in Table 5 and Table 6, respectively. V and α represent the absolute counts and dispersion, respectively. Two precursors and bulks with different shapes and curing temperatures were tested. Samples with disk and film shapes were measured for accurate interpretation of the data. The Cu peak was prominent in all the precursors and bulks of the two elastomers. The Fe peak was observed for some samples of both elastomers. Because it was observed only for some samples, it was considered to be the escape peak of Cu. The presence of the metal element may quench the fluorescence. However, Cu was not considered to greatly affect the decay of fluorescence shown in Figure 3a, because the decay was not observed in the low-concentration sample (Figure 3b) which should have a similar Cu concentration.
Table 5.
Components of elastomer A. V and α correspond to absolute volume and dispersion of each element, respectively. Bulk 1: disk cured at room temperature, Bulk 2: rod cured at room temperature, Bulk 3: rod cured at 100 °C. ND stands for not detected.
Table 6.
Components of elastomer B. V and α correspond to absolute volume and dispersion of each element, respectively. Bulk 1: disk cured at room temperature, Bulk 2: rod cured at 150 °C.
4. Conclusions
An elastomer pair suitable for creating an FO structure with core and cladding regions was selected from among prototype elastomers provided by Shin-Etsu Chemical Co. A pair with satisfactory transparency matching, refractive-index matching, and rubber-hardness matching was selected. The dependence of the density on the curing conditions of the selected pair showed that the cladding material has higher density and that the density can be tuned slightly by selecting the appropriate curing conditions. The fluorescence of the R6G-doped elastomer was monitored for 30 days. The fluorescence of some samples was observed to decay, probably owing to the presence of cyclopentanone instead of Cu, which was found to be present using XRF analysis. The obtained information is considered to be useful for designing a new type of fluorescent FO strain sensor using elastomers that can respond to stress with high sensitivity compared to previous PMMA system and can display an easy-to-read signal.
Author Contributions
C.H., T.S., K.I., N.F., and R.F. conceived and designed the experiments; the experiments were performed primarily by C.H.; T.O. planned and analyzed the XRF measurements; C.H. and R.F. wrote the paper.
Funding
This research was funded by the MLIT Program for Promoting Technological Development of Transportation and Accurate maintenance for secure transportation infrastructures against aging and natural hazards, Development of robust transportation system against natural hazards, and Development of organic-waveguide strain-sensor for health monitoring of shield tunneling process, grant number 2015-2”.
Acknowledgments
NF thanks Yasuyuki Kusaka of AIST for providing information about the properties of the elastomers and Sakae Manaka of AIST for technical support. The authors thank Editage for the grammar check service.
Conflicts of Interest
The authors declare no conflict of interest. The founding sponsors had no role in the design of the study; in the collection, analyses, or interpretation of data; in the writing of the manuscript, and in the decision to publish the results.
References
- Cimellaro, G.P.; Solari, D.; Bruneau, M. Physical Infrastructure Interdependency and Regional Resilience Index after the 2011 Tohoku Earthquake in Japan. Earthq. Eng. Struct. Dyn. 2014, 43, 1763–1784. [Google Scholar] [CrossRef]
- Matsuda, I. Verifying Vulnerability to Natural Disasters in Tokyo. J. Geogr. (Chigaku Zasshi) 2013, 122, 1070–1087. [Google Scholar] [CrossRef][Green Version]
- Glisic, B.; Inaudi, D. Fibre Optic Methods for Structural Health Monitoring; John Wiley & Sons, Ltd.: Hoboken, NJ, USA, 2007. [Google Scholar]
- Kamimura, S.; Furukawa, R. Strain Sensing Based on Radiative Emission-Absorption Mechanism Using Dye-Doped Polymer Optical Fiber. Appl. Phys. Lett. 2017, 111, 063301:1–063301:4. [Google Scholar] [CrossRef]
- Furukawa, R.; Tagaya, A.; Iwata, S.; Koike, Y. Polarization-Maintaining Mechanism of a Birefringence-Reduced Plastic Optical Fiber Fabricated Using Poly(methyl methacrylate/benzyl methacrylate) Copolymer. J. Phys. Chem. C 2008, 112, 7946–7952. [Google Scholar] [CrossRef]
- Paek, U.C.; Runk, R.B. Physical Behavior of the Neck-Down Region during Furnace Drawing of Silica Fibers. J. Appl. Phys. 1978, 49, 4417–4422. [Google Scholar] [CrossRef]
- Lotters, J.C.; Olthuis, W.; Veltink, P.H.; Bergveld, P. The Mechanical Properties of the Rubber Elastic Polymer Polydimethylsiloxane for Sensor Applications. J. Micromech. Microeng. 1997, 7, 145–147. [Google Scholar] [CrossRef]
- Zubia, J.; Arrue, J. Plastic Optical Fibers: An Introduction to Their Technological Processes and Applications. Opt. Fiber Technol. 2001, 7, 101–140. [Google Scholar] [CrossRef]
- Kurian, A.; George, N.A.; Paul, B.; Nampoori, V.P.N.; Vallabhan, C.P.G. Studies on Fluorescence Efficiency and Photodegradation of Rhodamine 6G Doped PMMA Using a Dual Beam Thermal Lens Technique. Laser Chem. 2002, 20, 99–110. [Google Scholar] [CrossRef]
- Ishigure, T.; Sato, M.; Takanashi, O.; Nihei, E.; Nyu, T.; Yamazaki, S.; Koike, Y. Formation of the Refractive Index Profile in the Graded Index Polymer Optical Fiber for Gigabit Data Transmission. J. Lightw. Technol. 1997, 15, 2095–2100. [Google Scholar] [CrossRef]


© 2019 by the authors. Licensee MDPI, Basel, Switzerland. This article is an open access article distributed under the terms and conditions of the Creative Commons Attribution (CC BY) license (http://creativecommons.org/licenses/by/4.0/).