Abstract
For the first time, dense nanofibers of yttria-stabilized tetragonal zirconia with diameter of ca. 140 nm were prepared by calcination of electrospun zirconium acetylacetonate/yttrium nitrate/polyacrylonitrile fibers at 1100–1300 °C. Ceramic filaments were characterized by scanning electron microscopy, X-ray diffractometry, and nitrogen adsorption. With a rise in the calcination temperature from 1100 to 1300 °C, the fine-grain structure of the nanofibers transformed to coarse-grain ones with the grain size equal to the fiber diameter. It was revealed that fully tetragonal nanofibrous zirconia may be obtained at Y2O3 concentrations in the range of 2–3 mol% at all used calcination temperatures. The addition of 2–3 mol% yttria to zirconia inhibited ZrO2 grain growth, preventing nanofibers’ destruction at high calcination temperatures. Synthesized well-sintered, non-porous, yttria-stabilized tetragonal zirconia nanofibers can be considered as a promising material for composites’ reinforcement, including composites with ceramic matrix.
1. Introduction
Pure zirconia (ZrO2) is a polymorphic material which may exist in three crystalline forms: Monoclinic (m-ZrO2), tetragonal (t-ZrO2), and cubic (c-ZrO2). The m-ZrO2 is stable at temperatures up to 1170 °C, t-ZrO2 in the range of 1170–2370 °C, and c-ZrO2 at over 2370 °C [1]. A noticeable ~4% increase in the volume of sintered pure zirconia ceramic during the cooling process associated with t-ZrO2 → m-ZrO2 transformation was accompanied by the material microcracking [2]. Therefore, m-ZrO2 ceramic with poor mechanical properties is hardly ever used for applications requiring mechanical strength. To stabilize t-ZrO2 and c-ZrO2 at room temperatures and to prevent ceramic volume expansion during the cooling process, zirconia was doped by different oxides (Y2O3, CeO2, CaO, MgO, and others). An important feature of zirconia ceramics is that varying t-ZrO2 and c-ZrO2 content by changing the dopant concentration it is possible to produce materials for different applications. Herein, c-ZrO2 content increased with the rise in dopant concentration. For example, introduction of 3 mol% Y2O3 in zirconia allows the preparation of engineering ceramics with high values of bending strength and fracture toughness [1]. Such characteristics as thermal expansion coefficient close to that of super alloys, low thermal conductivity, and high erosion resistance make zirconia ceramics with Y2O3 content in the range of 6–8 mol% very suitable materials for thermal barrier coatings [3]. Ceramics containing 8–10 mol% of Y2O3 are used in solid fuel cells as electrolyte material due to the high oxygen ion conductivity [4].
Stabilized zirconia ceramics can be used not only as bulk materials or coatings, but also in the form of fibers, too, for example, for composites’ reinforcement. Microfibers of yttria-stabilized tetragonal zirconia with tensile strength up to 2.6 GPa were fabricated in [5]. Due to the size effects, nanofibers show remarkable properties compared to microfibers, namely, high surface-to-mass ratio, flexibility in surface functionalization, and high mechanical strength [6]. In [7], electrospun alumina nanofibers with the tensile strength average value ca. 11 GPa were obtained, while commercial alumina microfibers only reached a strength value of 3.3 GPa (Nextel™ 610, 3M, Saint Paul, MN, USA).
Among a number of nanofibers’ fabrication techniques, electrospinning is the most commonly used method due to its simplicity, adaptability, cost-efficiency, versatility, and capability to control the diameter, composition, and morphology of nanofibers. Besides, electrospinning is the only method applicable for the large-scale fabrication of nanofibers [6].
Previously, 8 mol% Y2O3—stabilized zirconia nanofibers were prepared by electrospinning and calcination at elevated temperatures with zirconium acetate hydroxide and zirconium propoxide as zirconia precursors [8,9]. These nanofibers of c-ZrO2 can be used as a part of an electrode of solid oxide fuel cells for improved electrode performance, as was shown in [10]. In [11], 3 mol% Y2O3—stabilized zirconia nanofibers composed of t-ZrO2 grains were obtained. The electrospun macroporous membranes of t-ZrO2 nanofibers providing efficient gas transport are prospective for catalytic applications, for example, in hydrogenation [12] and oxidation [13] processes. Besides, nanofibers of t-ZrO2 are more preferred for reinforcement than similar microfibers, mentioned above, due to their expected higher strength and better matrix-fiber adhesion which improves load transfer from the matrix to the reinforcing fibers.
It is well known that porosity reduces strength in nanofibers. In [9,14], it was revealed that a rise in calcination temperature led to zirconia nanofibers’ densification. In this study we examined the opportunity for controlling dense zirconia nanofibers’ phase composition to fabricate non-porous t-ZrO2 nanofibers, which can be considered as a promising material for composite reinforcement via varying dopant content on an example of a commonly used stabilizer, Y2O3. As far as we know, there is no information about the range of Y2O3 concentrations to obtain t-ZrO2 nanofibers.
2. Materials and Methods
Ten identical 10 wt.% polymer solutions were prepared by adding 1 g polyacrylonitrile (PAN) (molecular weight Mw = 150,000, Sigma-Aldrich, Saint Louis, MO, USA) into 9 g dimethylformamide (DMF) with periodic stirring by hand for 2 h at 50 °C. To synthesize nanofibers of yttria-stabilized zirconia, zirconium acetylacetonate Zr(C5H7O2)4 (hereinafter referred to as ZrAA) (Sigma-Aldrich, Saint Louis, MO, USA) as zirconia precursor and yttrium nitrate hexahydrate Y(NO3)3·6H2O (Sigma-Aldrich, Saint Louis, MO, USA) as yttria precursor were added into polymer solutions under stirring in the ultrasonic bath for 6 min at 42 kHz at room temperature to prepare ten transparent electrospinning solutions. The ZrAA/PAN mass ratio in all solutions was 0.3 to 1. Yttrium nitrate hexahydrate was added to solutions in amounts to obtain 0–9 mol% Y2O3 concentration in zirconia nanofibers. Herein, insignificant change of solutions’ viscosity was observed. It was important since viscosity of the electrospinning solution significantly affects the diameter and morphology of the obtained nanofibers [15]. The dynamic viscosity of all electrospinning solutions was measured using the rotational viscometer DV2T (AMETEK Brookfield, Middleborough, MA, USA).
Each prepared composite solution was transferred into a 10 mL plastic syringe and electrospun using the electrospinning machine NANON-01A (MECC, Fukuoka, Japan) at a feeding rate of 1.2 mL/h through a 21 G blunt-tip needle. The distances between the needle tip and the flat collector of 21 cm and the accelerating voltage of 23 kV were chosen as operative parameters to fabricate bead-free and smooth composite fibers. The flat collector was covered by aluminum foil. The fibers were collected on aluminum foil as non-woven mats.
As-spun mats were calcined at temperatures in the range of 1100–1300 °C for 1 h using two-stage heating: Heating to 500 °C with a heating rate of 1 °C/min, and then further heating to the target temperature with a heating rate of 5 °C/min. According to the thermogravimetric (TG) analysis, composite fibers transformed to ZrO2 fibers at 500 °C (Figure 1a) and there was no further weight loss of filaments observed at higher temperature. To prevent fiber destruction, a low heating rate at the first annealing stage was chosen to ensure delicate removal of the decomposition products of the ceramic precursor, the stabilizer precursor, and binding polymer.
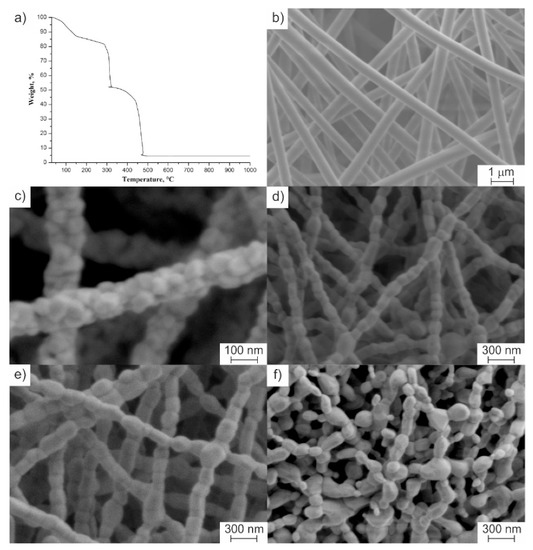
Figure 1.
(a) Thermogravimetric (TG) curve of electrospun composite fibers. Microstructure of (b) as-spun composite fibers, (c) 2 mol% Y2O3–ZrO2 fibers calcined at 1100 °C, (d) 2 mol% Y2O3–ZrO2 fibers calcined at 1300 °C, (e) 8 mol% Y2O3–ZrO2 fibers calcined at 1300 °C, and (f) undoped ZrO2 fibers calcined at 1300 °C.
The fibers’ surface texture was analyzed using a scanning electron microscope (SEM) Merlin (Carl Zeiss, Oberkochen, Germany). The average diameter of the fibers and the average grain size were determined from the SEM images. X-ray diffraction (XRD) patterns were registered in the 20–80° 2 θ range by an X-ray diffractometer D2 Phaser (Bruker AXS, Karlsruhe, Germany) using CuKα1 monochromatic radiation. XRD patterns were identified using the PDF-2 Diffraction Database File of the International Centre for Diffraction. The TOPAS software (Bruker AXS, Karlsruhe, Germany) was used to determine nanofibers’ quantitative phase composition by the Rietveld method. SEM and XRD measurements were carried out at room temperature. Nitrogen adsorption-desorption isotherms at 77 K were registered with a gas sorption analyzer, Autosorb iQ-C (Quantachrome Instruments, Boynton Beach, FL, USA). Before nitrogen adsorption measurements, the samples were evacuated at 300 °C for 3 h under vacuum to remove contaminants. Specific surface areas of the nanofibers were determined with the Brunauer–Emmett–Teller (BET) method. Total pore volume was calculated through the quantity of adsorbed N2 at the relative pressure of 0.995. The TG analysis was performed on the thermal analyzer EXSTAR TG/DTA7200 (SII Nano Technology, Tokyo, Japan) in air atmosphere with a heating rate of 10 °C/min.
3. Results and Discussion
As shown in Figure 1b, as-spun composite fibers were uniform in shape with a smooth surface and the average diameter of 544 ± 38 nm. Randomly distributed, cylindrical, bead-free fibers formed a macroporous non-woven mat, typical for electrospinning. The transformation of composite fibers to ZrO2 ones was accompanied with the decrease in their thickness due to residual solvent removal and ZrAA and PAN decomposition (Figure 1a).
After calcination at 1100 °C, the average diameter of fibers decreased distinctly to ca. 140 nm (Figure 1c). The obtained nanofibers had rough surfaces and were characterized by grain structure. Zirconia nanofibers with 2–3 mol% of Y2O3 possessed the smallest grain size of ca. 60 nm among all the ceramic fibers prepared at 1100 °C. With a rise in the calcination temperature from 1100 °C to 1300 °C, fine-grain structure of 2–3 mol% yttria-stabilized zirconia nanofibers (Figure 1c) transformed to coarse-grain ones (Figure 1d) and an insignificant decrease within the measurement error was detected in the nanofibers’ average diameter. At a calcination temperature of 1300 °C, a chain-like structure was formed when the grains with the average size of ca. 130 nm reached the size equal to the nanofiber diameter. The observed grain growth was associated with the recrystallization rate increase induced by temperature rising. As in [9], it was noted that, at calcination temperature of 1300 °C, the grain size of 8 mol% Y2O3–ZrO2 nanofibers exceeded 200 nm (Figure 1e). The grain growth of 8 mol% yttria-stabilized zirconia being fully cubic zirconia [9] is well known to be accelerated during sintering above 1100 °C, and grains reached micrometer size [16]. Comparing SEM images both of 2 mol% Y2O3–ZrO2 nanofibers and undoped ZrO2 nanofibers calcined at 1300 °C (Figure 1d,f) it can be concluded that the addition of a small amount of yttria to zirconia inhibited ZrO2 grain growth at high calcination temperatures. Creating a diffusion barrier prevented nanofibers’ destruction. Cracking along the grain boundaries due to t-ZrO2 → m-ZrO2 transition upon cooling in undoped zirconia nanofibers may also have contributed to their destruction, presented in Figure 1f.
The evolution of the crystalline structure of zirconia nanofibers doped with various amounts of yttrium oxide is shown in Figure 2 and the phase analysis results in the whole range of studied Y2O3 concentrations are presented in Figure 3.
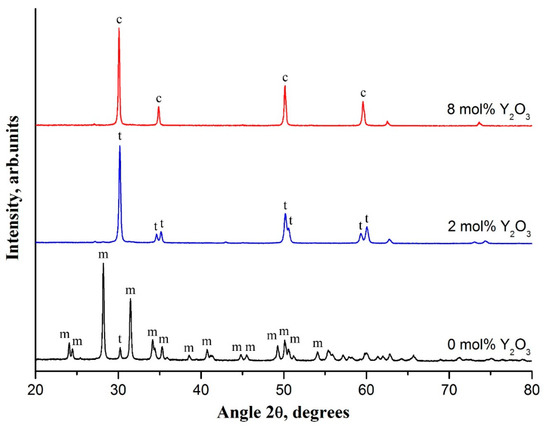
Figure 2.
XRD patterns of zirconia nanofibers with different yttria content calcined at 1100 °C, m–monoclinic phase, t–tetragonal phase, and c–cubic phase.
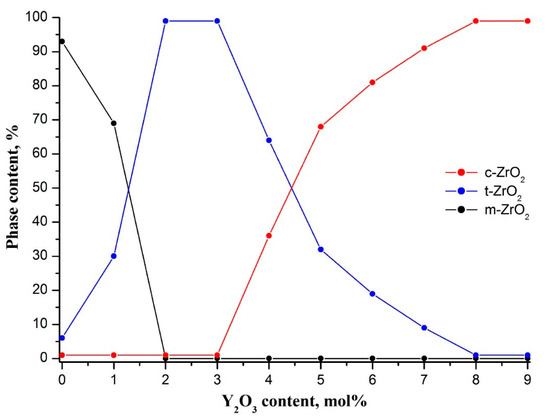
Figure 3.
Phase composition of zirconia nanofibers with different dopant concentration. The content of m-ZrO2, t-ZrO2 and c-ZrO2 phases in nanofibers is marked in color dots (black, blue, and red dots, correspondingly). The lines are given for eye guidance.
Filaments prepared at 1100 °C were selected for investigation of phase composition variation in zirconia nanofibers, since undoped zirconia nanofibers cease to be fibers at a calcination temperature of 1300 °C (Figure 1f). The XRD pattern of undoped zirconia nanofibers contained two intensive peaks at 28.2° and 31.5° and a large number of low-intensity peaks in the 2 θ range of 20–80° which belong to m-ZrO2 (Figure 2). A low-intensity peak of t-ZrO2 at 30.2° was observed, too. The content of m-ZrO2 was determined as 93%. So, undoped zirconia nanofibers calcined at 1100 °C mostly consisted of m-ZrO2 grains. Previously, nanofibers of m-ZrO2 were also detected when intermediate composite fibers with zirconium oxychloride [17] and zirconium acetate [18] as zirconia precursors and containing no stabilizing agent were heat-treated at elevated temperatures. From the reflection at 28.2° via the Scherrer equation, the average m-ZrO2 grain size was estimated to be about 70 nm. According to Garvie’s theory, stabilizer-free t-ZrO2 grains with size not exceeding 30 nm may be stable at room temperature [19]. Otherwise, they are subject for t-ZrO2 → m-ZrO2 transition.
Introduction of yttria into zirconia nanofibers led to a dramatic decrease in m-ZrO2 content to 0% at 2 mol% Y2O3 (Figure 3). Fully tetragonal zirconia was observed in the yttrium oxide concentration range of 2–3 mol%. XRD patterns contained only characteristic reflections of t-ZrO2. Main t-ZrO2 peaks localized at 30.2°, 34.6°, 35.2°, 50.2°, 50.7°, 59.3°, and 60.2° (Figure 2). Further increase in yttria concentration caused a monotonic decrease in volume fraction of t-ZrO2 to 0% at 8 mol% Y2O3. A sharp drop in t-ZrO2 content from 100% to 32% occurred in the interval of 3–5 mol% Y2O3. At the same time, a corresponding monotonic rise in c-ZrO2 content attaining saturation at 8 mol% Y2O3 was observed. Yttria-stabilized zirconia nanofibers were composed of t-ZrO2 and c-ZrO2 grains in the interval of 3–8 mol% Y2O3. At 8 mol% Y2O3 XRD pattern contained only intensive reflections of c-ZrO2 at 30.1°, 35.0°, 50.2°, and 59.7° that indicated fully cubic nanofibrous zirconia (Figure 2).
For t-ZrO2 nanofibers of interest, the effect of calcination temperature on their phase composition was investigated. Comparison of the XRD patterns obtained for the samples calcined at 1100 °C and 1300 °C (Figure 4) revealed that a rise in heat treatment temperature makes t-ZrO2 peaks sharper and narrower, indicating grain size growth confirmed by SEM (Figure 1c,d).
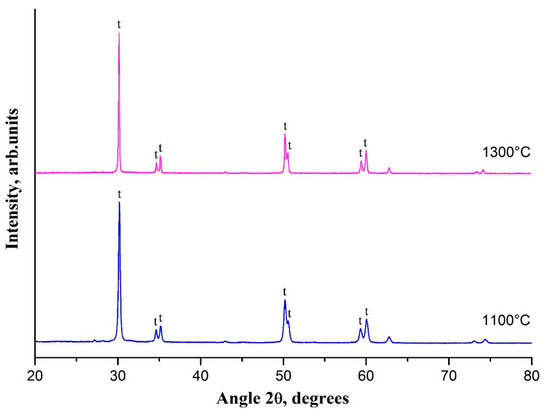
Figure 4.
XRD patterns of 2 mol% Y2O3–ZrO2 nanofibers calcined at 1100 °C and 1300 °C.
No additional reflections of another zirconia phase were detected in the XRD pattern of the sample calcined at 1300 °C. The observed essential increase in t-ZrO2 grain size from ca. 60 nm to ca. 130 nm unaccompanied by t-ZrO2 → m-ZrO2 transition indicated phase stability of the nanofibers of yttria-stabilized tetragonal zirconia at sufficiently high heat treatment temperatures and revealed that the grain size of 130 nm is not yet critical for t-ZrO2 retention in nanofibers of yttria-stabilized zirconia at room temperature.
The porous structure of nanofibers of yttria-stabilized tetragonal zirconia calcined at 1100 °C and 1300 °C was examined by nitrogen adsorption measurements (Figure 5). In both cases nanofibers showed type II isotherms. According to the International Union of Pure and Applied Chemistry (IUPAC), classification type II isotherms are inherent in non-porous materials. In our case, that was confirmed by small total pore volume values of 0.019 cm3/g and 0.013 cm3/g for zirconia nanofibers calcined at 1100 °C and 1300 °C, correspondingly. Feebly marked type H4 hysteresis loops by IUPAC classification are associated with narrow slit-like pores, few in number. In our case, the slit-like pores were most likely formed by the boundaries of adjacent ZrO2 grains. An observed slight decrease of total pore volume (porosity reduction) is due to higher sintering efficiency at higher temperature. The rise in calcination temperature also led to a decrease in zirconia nanofibers’ specific surface area from 9.9 m2/g at 1100 °C to 5.0 m2/g at 1300 °C.
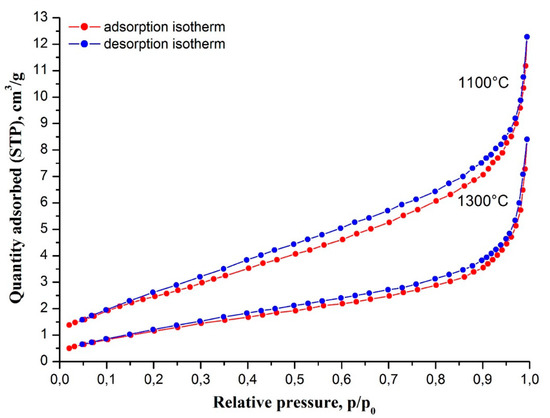
Figure 5.
Nitrogen adsorption-desorption isotherms at 77 K of 2 mol% Y2O3–ZrO2 nanofibers calcined at 1100 °C and 1300 °C.
4. Conclusions
Dense nanofibers of yttria-stabilized tetragonal zirconia with a diameter of ca. 140 nm were fabricated by calcination of electrospun zirconium acetylacetonate/yttrium nitrate/polyacrylonitrile fibers at 1100–1300 °C. With a rise in the calcination temperature from 1100 to 1300 °C, the fine-grain structure of the nanofibers transformed to a coarse-grain one with the grain size equal to the fiber diameter. It was revealed that fully tetragonal nanofibrous zirconia may be obtained at Y2O3 concentrations in the range of 2–3 mol% at all the used calcination temperatures. The addition of 2–3 mol% yttria to zirconia inhibited ZrO2 grain growth, thus preventing nanofibers’ destruction at high calcination temperatures. Since we considered synthesized, well-sintered, non-porous, yttria-stabilized tetragonal zirconia nanofibers as a promising material for composites’ reinforcement, including composites with ceramic matrix, the aim of further investigations will be their strength testing by nanoindentation method.
Author Contributions
Writing—Original draft preparation, editing, V.V.R.; investigation, S.S.R., A.I.T., A.O.Z.; supervision, Y.I.G.
Funding
The reported study was funded by the Russian Foundation for Basic Research (RFBR), according to the research project No. 18-29-17047.
Conflicts of Interest
The authors declare that they have no conflict of interest.
References
- Gautam, C.; Joyner, J.; Gautam, A.; Rao, J.; Vajtai, R. Zirconia based dental ceramics: Structure, mechanical properties, biocompatibility and applications. Dalton Trans. 2006, 45, 19194–19215. [Google Scholar] [CrossRef] [PubMed]
- Hannink, R.H.J.; Kelly, P.M.; Muddle, B.C. Transformation toughening in zirconia-containing ceramics. J. Am. Ceram. Soc. 2000, 83, 461–487. [Google Scholar] [CrossRef]
- Saravanan, S.; Srinivas, G.H.; Jayaram, V.; Manidurai, P.; Asokan, S. Synthesis and characterization of Y3Al5O12 and ZrO2–Y2O3 thermal barrier coatings by combustion spray pyrolysis. Surf. Coat. Technol. 2008, 202, 4653–4659. [Google Scholar] [CrossRef]
- Revankar, S.T.; Majumdar, P. Fuel Cells: Principles, Design, and Analysis; CRC Press: Boca Raton, FL, USA, 2014; p. 748. [Google Scholar]
- Marshall, D.B.; Lange, F.F.; Morgan, P.D. High-strength zirconia fibers. J. Am. Ceram. Soc. 1987, 70, C187–C188. [Google Scholar] [CrossRef]
- Liu, Y.; Wang, C. Advanced Nanofibrous Materials Manufacture Technology Based on Electrospinning; CRC Press: Boca Raton, FL, USA, 2019; p. 370. [Google Scholar]
- Sun, W. Fabrication and Characterization of Electrospun Alumina Nanofibre Reinforced Polycarbonate Composites. Ph.D. Thesis, Queen Mary University, London, UK, 2017; p. 201. [Google Scholar]
- Koo, J.Y.; Hwang, S.; Ahn, M.; Choi, M.; Byun, D.; Lee, W. Controlling the diameter of electrospun yttria-stabilized zirconia nanofibers. J. Am. Ceram. Soc. 2016, 99, 3146–3150. [Google Scholar] [CrossRef]
- Castkova, K.; Maca, K.; Sekaninova, J.; Nemcovsky, J.; Cihlar, J. Electrospinning and thermal treatment of yttria doped zirconia fibres. Ceram. Int. 2017, 43, 7581–7587. [Google Scholar] [CrossRef]
- Koo, J.Y.; Lim, Y.; Kim, Y.B.; Byun, D.; Lee, W. Electrospun yttria-stabilized zirconia nanofibers for low-temperature solid oxide fuel cells. Int. J. Hydrog. Energy 2017, 42, 15903–15907. [Google Scholar] [CrossRef]
- Sun, G.-X.; Liu, F.-T.; Bi, J.-Q.; Wang, C.-A. Electrospun zirconia nanofibers and corresponding formation mechanism study. J. Alloys Compd. 2015, 649, 788–792. [Google Scholar] [CrossRef]
- Grabowski, R.; Słoczyński, J.; Śliwa, M.; Mucha, D.; Socha, R.P.; Lachowska, M.; Skrzypek, J. Influence of polymorphic ZrO2 phases and the silver electronic state on the activity of Ag/ZrO2 catalysts in the hydrogenation of CO2 to methanol. ACS Catal. 2011, 1, 266–278. [Google Scholar] [CrossRef]
- Campa, M.C.; Ferraris, G.; Gazzoli, D.; Pettiti, I.; Pietrogiacomi, D. Rhodium supported on tetragonal or monoclinic ZrO2 as catalyst for the partial oxidation of methane. Appl. Catal. B Environ. 2013, 142–143, 423–431. [Google Scholar] [CrossRef]
- Rodaev, V.V.; Razlivalova, S.S.; Zhigachev, A.O.; Vasyukov, V.M.; Golovin, Y.I. Preparation of zirconia nanofibers by electrospinning and calcination with zirconium acetylacetonate as precursor. Polymers 2019, 11, 1067. [Google Scholar] [CrossRef] [PubMed]
- Ramakrishna, S.; Fujihara, K.; Teo, W.-E.; Lim, T.-C.; Ma, Z. An Introduction to Electrospinning and Nanofibers; World Scientific Publishing: Singapore, 2005; p. 396. [Google Scholar]
- Pouchly, V.; Maca, K. Sintering kinetic window for yttria-stabilized cubic zirconia. J. Eur. Ceram. Soc. 2016, 36, 2931–2936. [Google Scholar] [CrossRef]
- Rodaev, V.V.; Zhigachev, A.O.; Golovin, Y.I. Fabrication and characterization of electrospun ZrO2/Al2O3 nanofibers. Ceram. Int. 2017, 43, 16023–16026. [Google Scholar] [CrossRef]
- Saligheh, O.; Khajavi, R.; Yazdanshenas, M.E.; Rashidi, A. Production and characterization of zirconia (ZrO2) ceramic nanofibers by using electrospun poly(vinyl alcohol)/zirconium acetate nanofibers as a precursor. J. Macromol. Sci. B 2016, 55, 605–616. [Google Scholar] [CrossRef]
- Garvie, R.C. The occurrence of metastable tetragonal zirconia as a crystallite size effect. J. Phys. Chem. 1965, 69, 1238–1243. [Google Scholar] [CrossRef]
© 2019 by the authors. Licensee MDPI, Basel, Switzerland. This article is an open access article distributed under the terms and conditions of the Creative Commons Attribution (CC BY) license (http://creativecommons.org/licenses/by/4.0/).