Capillary Polypropylene Membranes for Membrane Distillation


Abstract
:1. Introduction
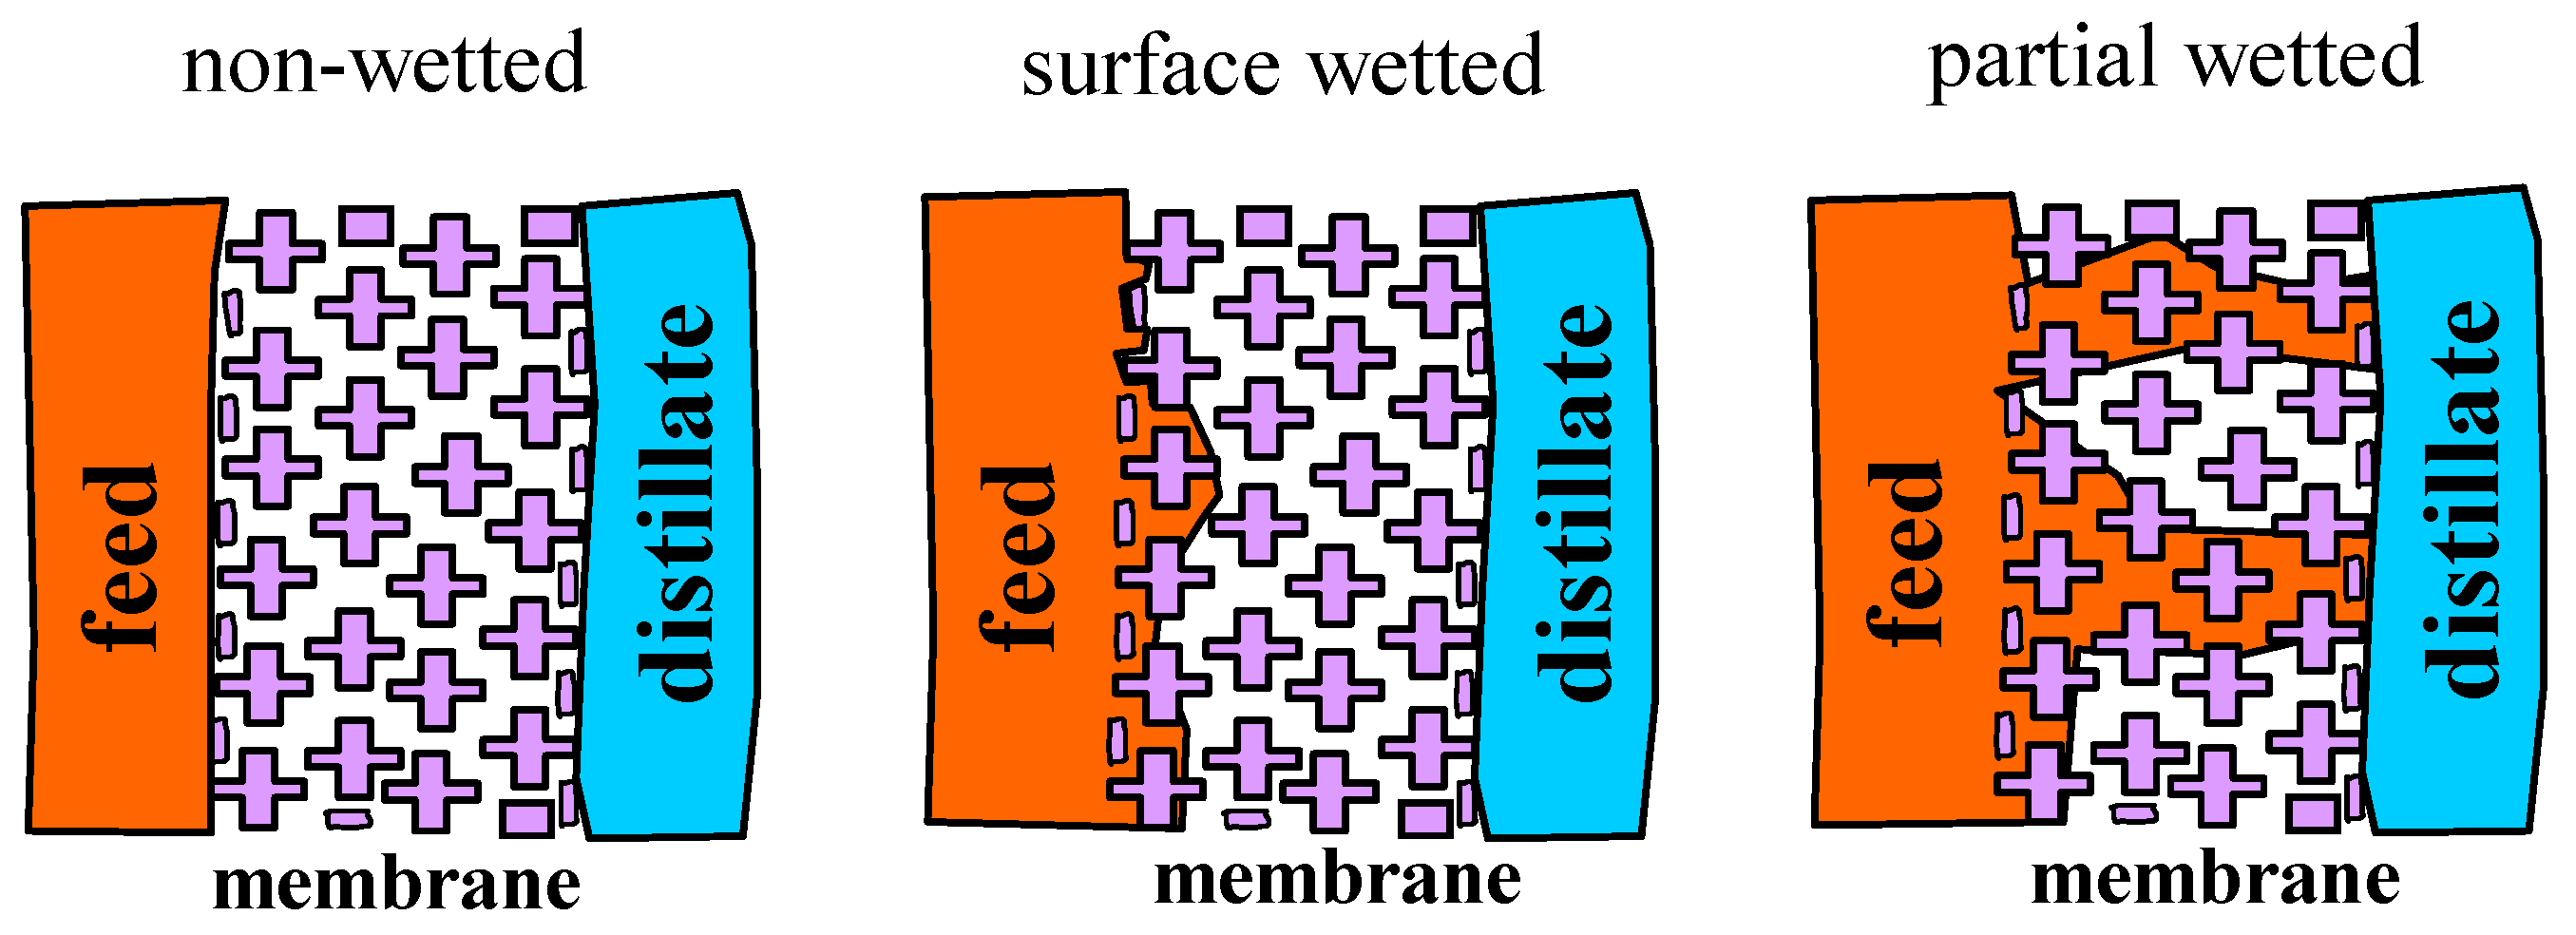
2. Membrane Wetting
3. Materials and Methods
3.1. Polypropylene Membranes
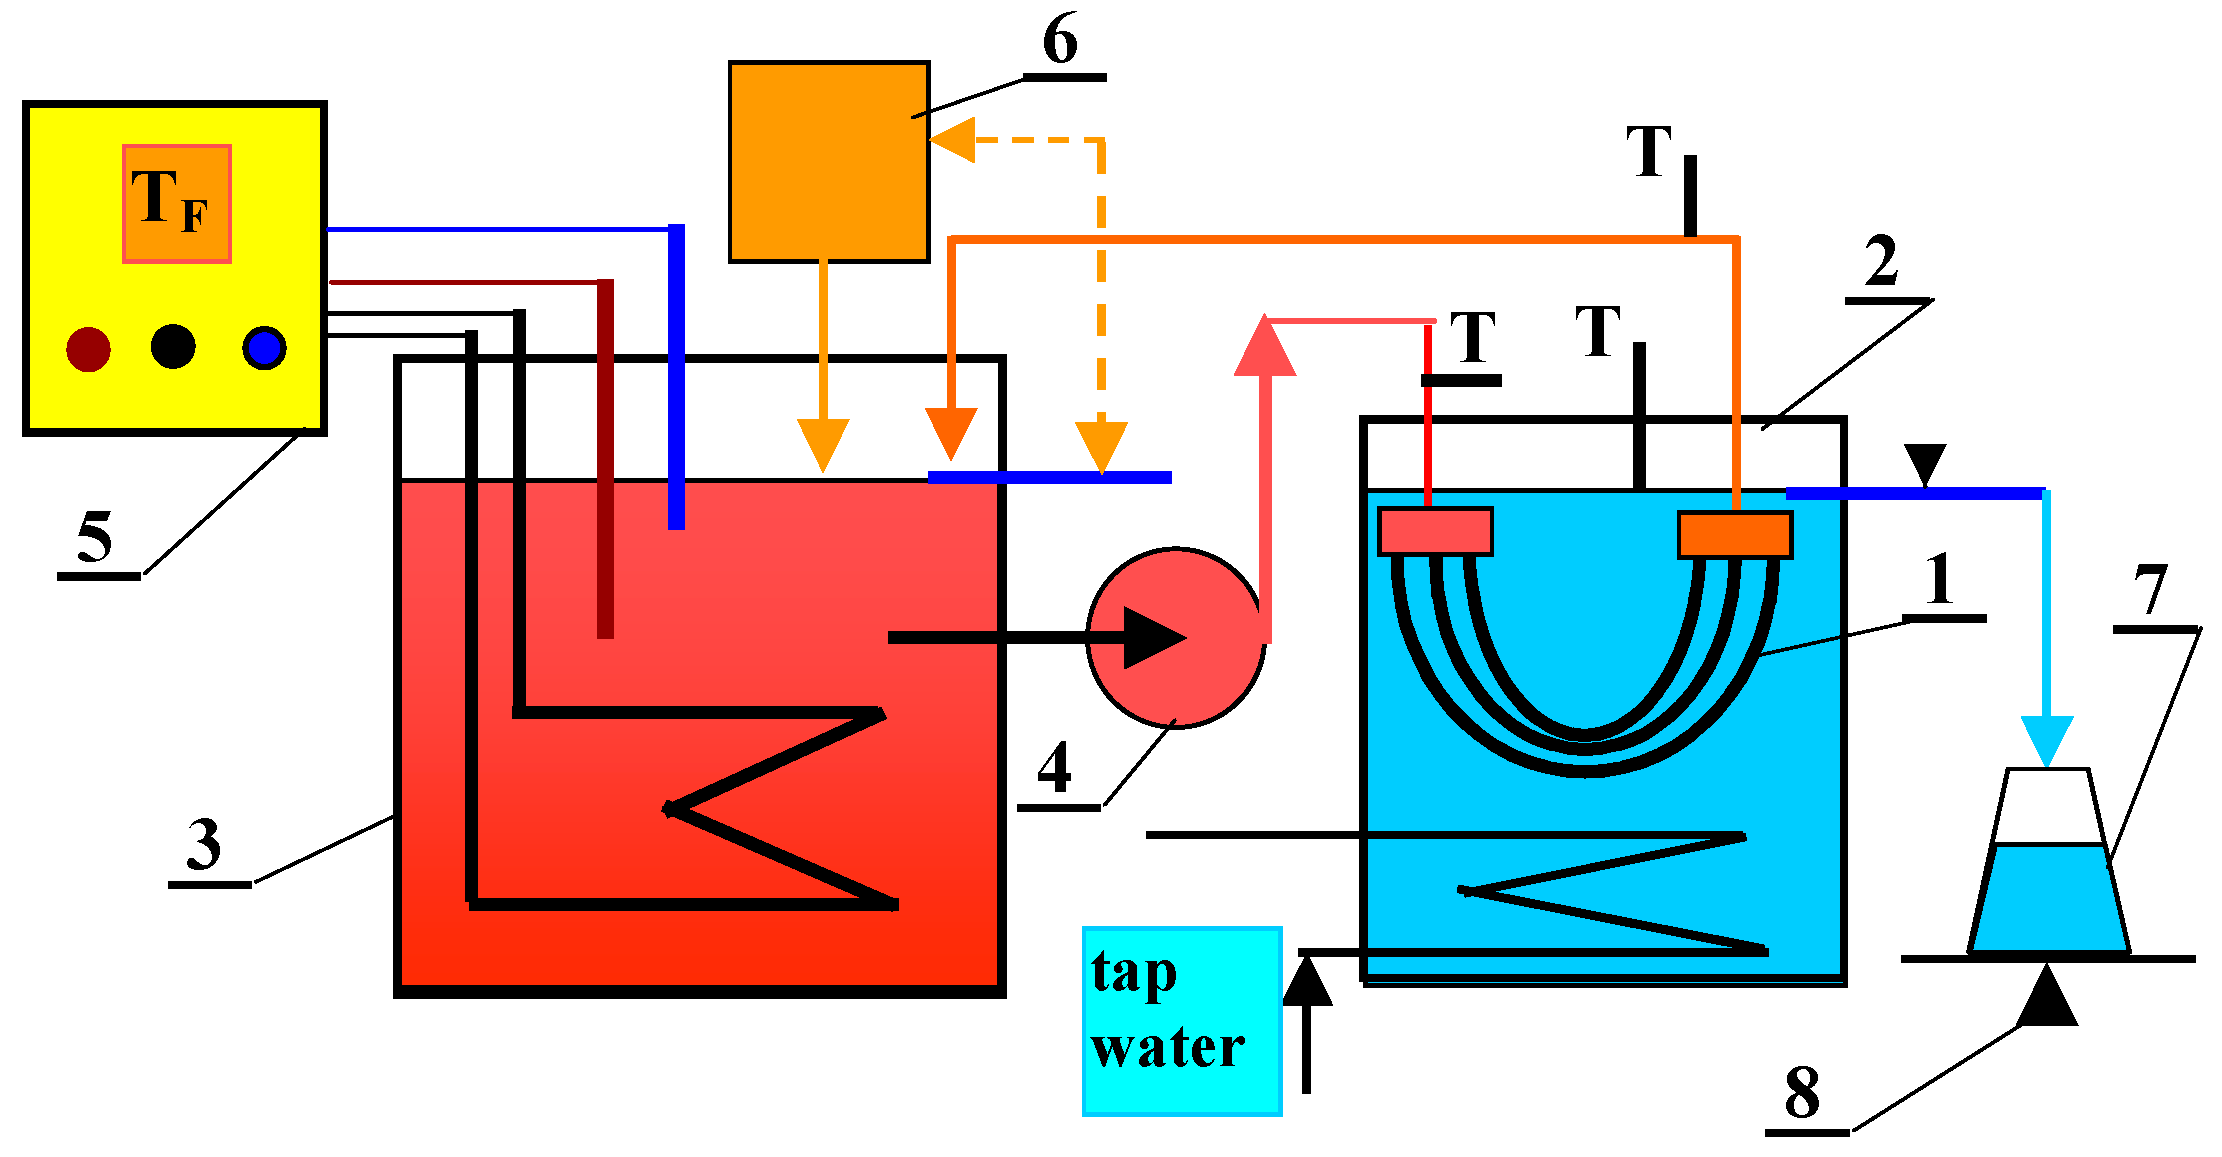
3.2. Membrane Distillation Studies
3.3. Analytical Methods
4. Results and Discussion
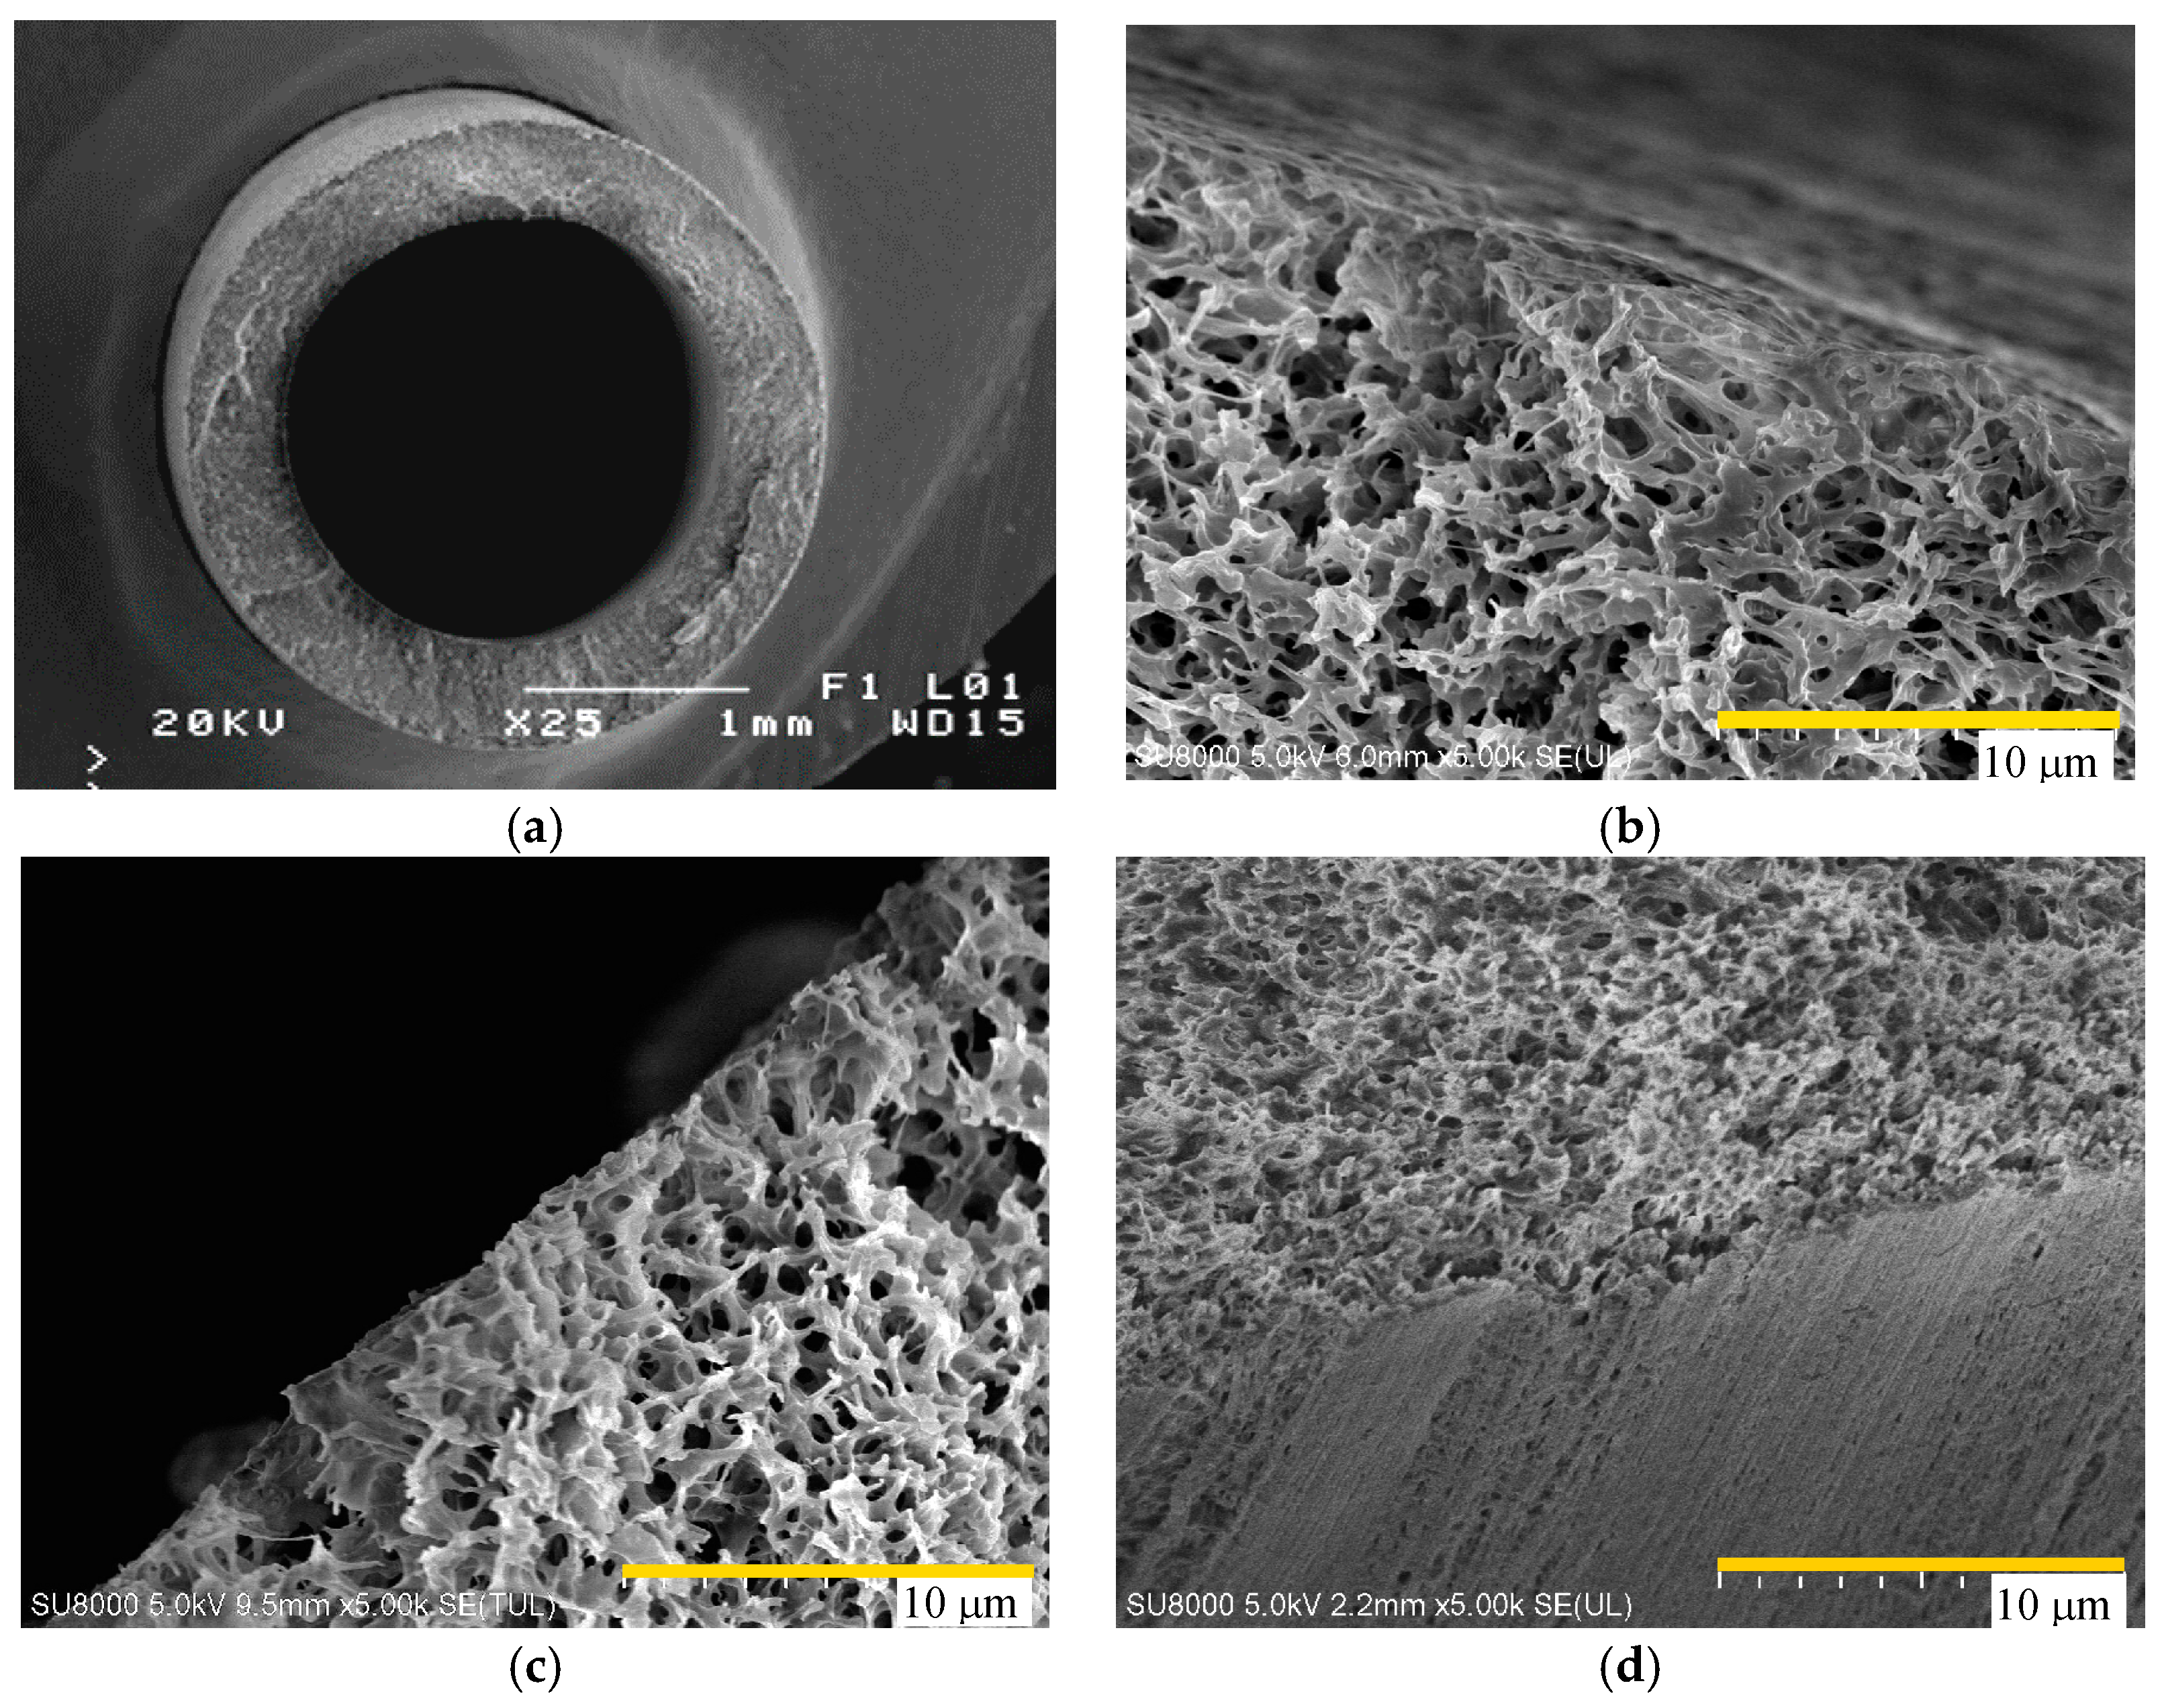
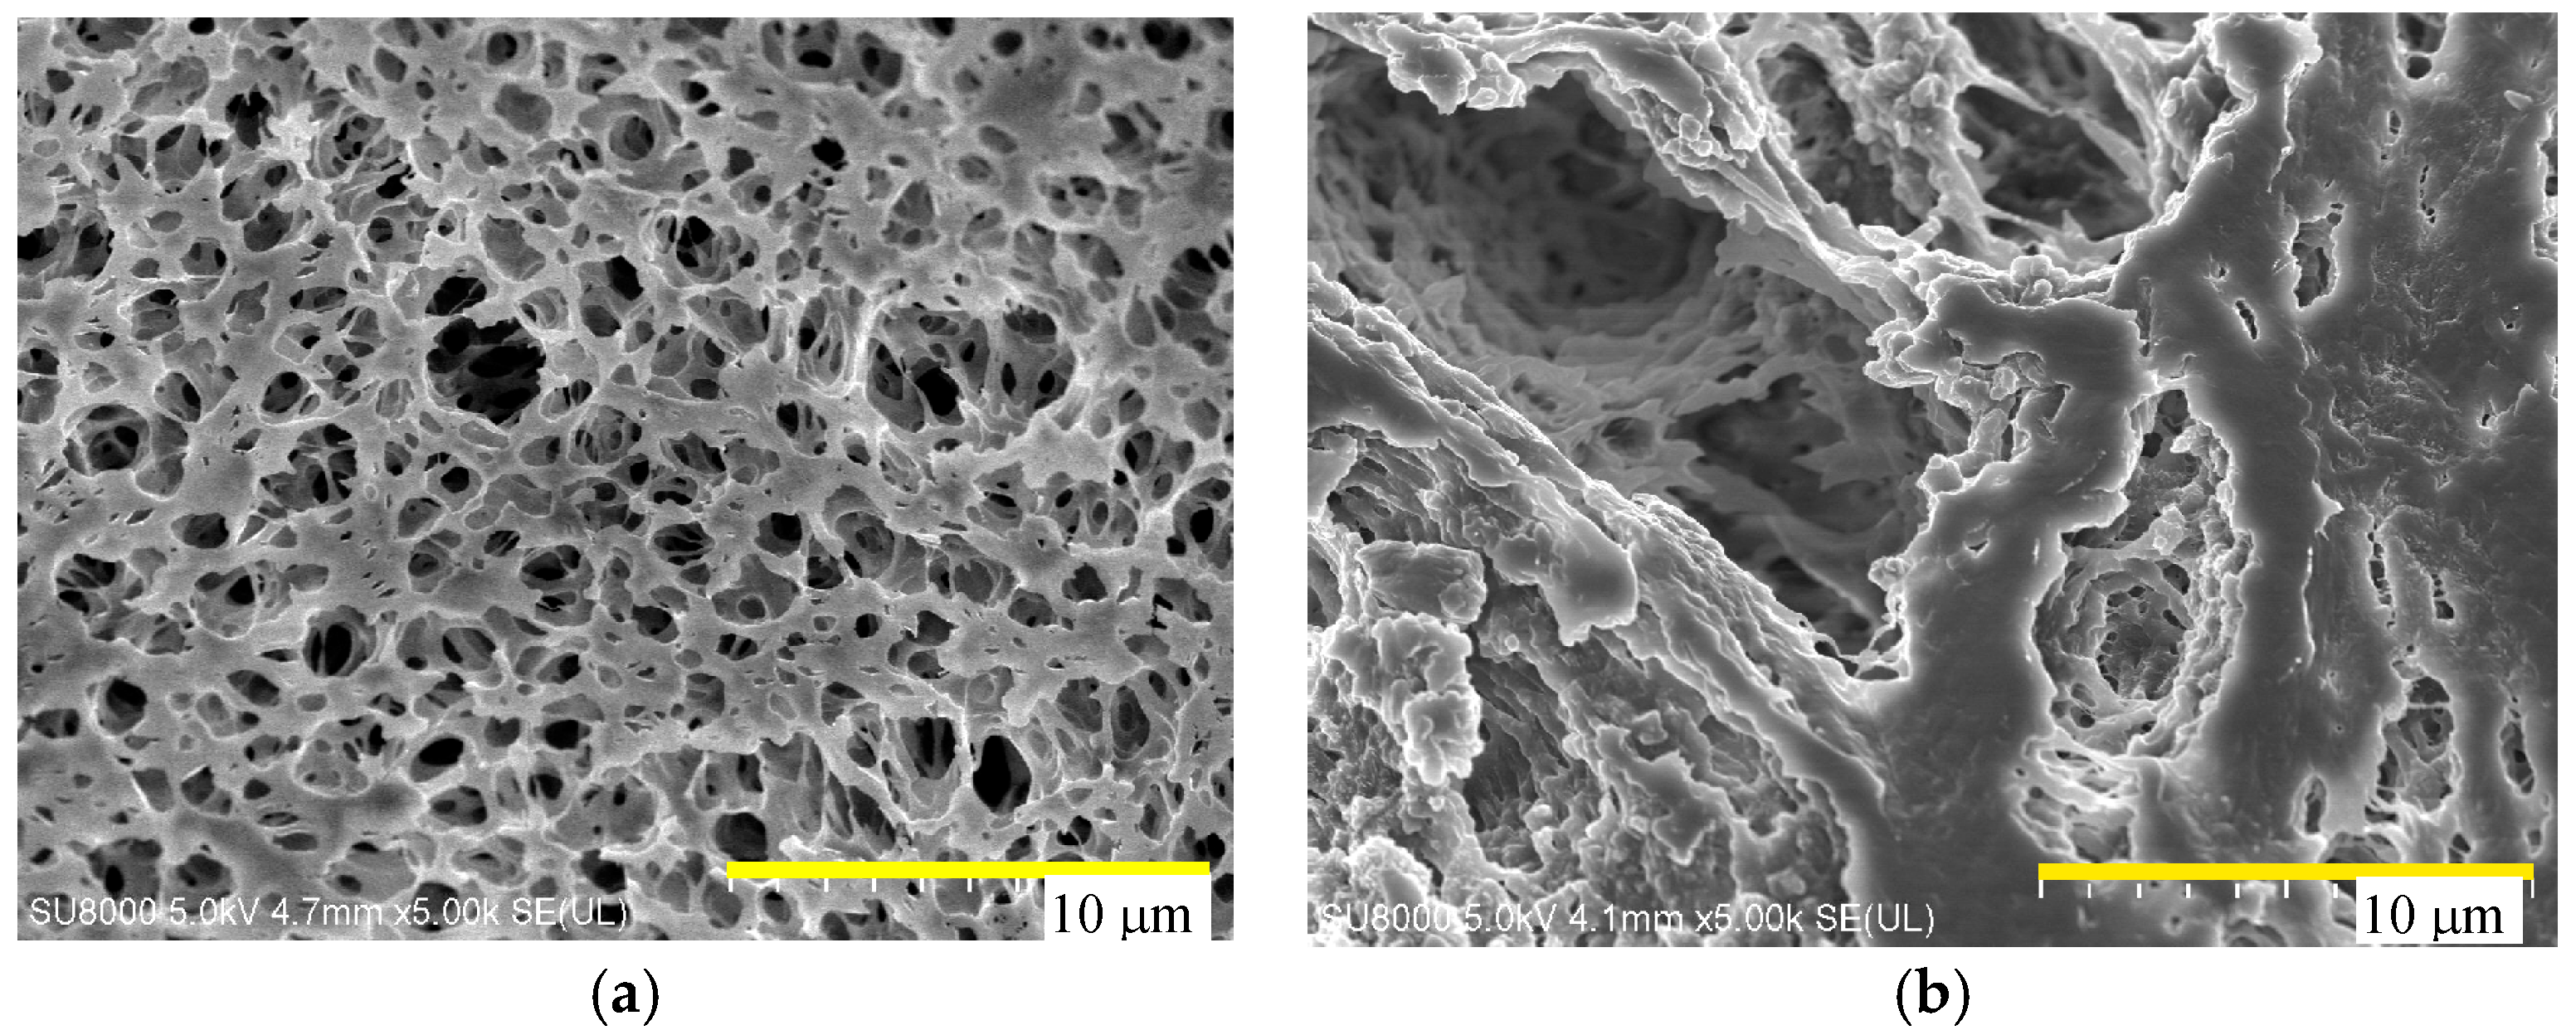
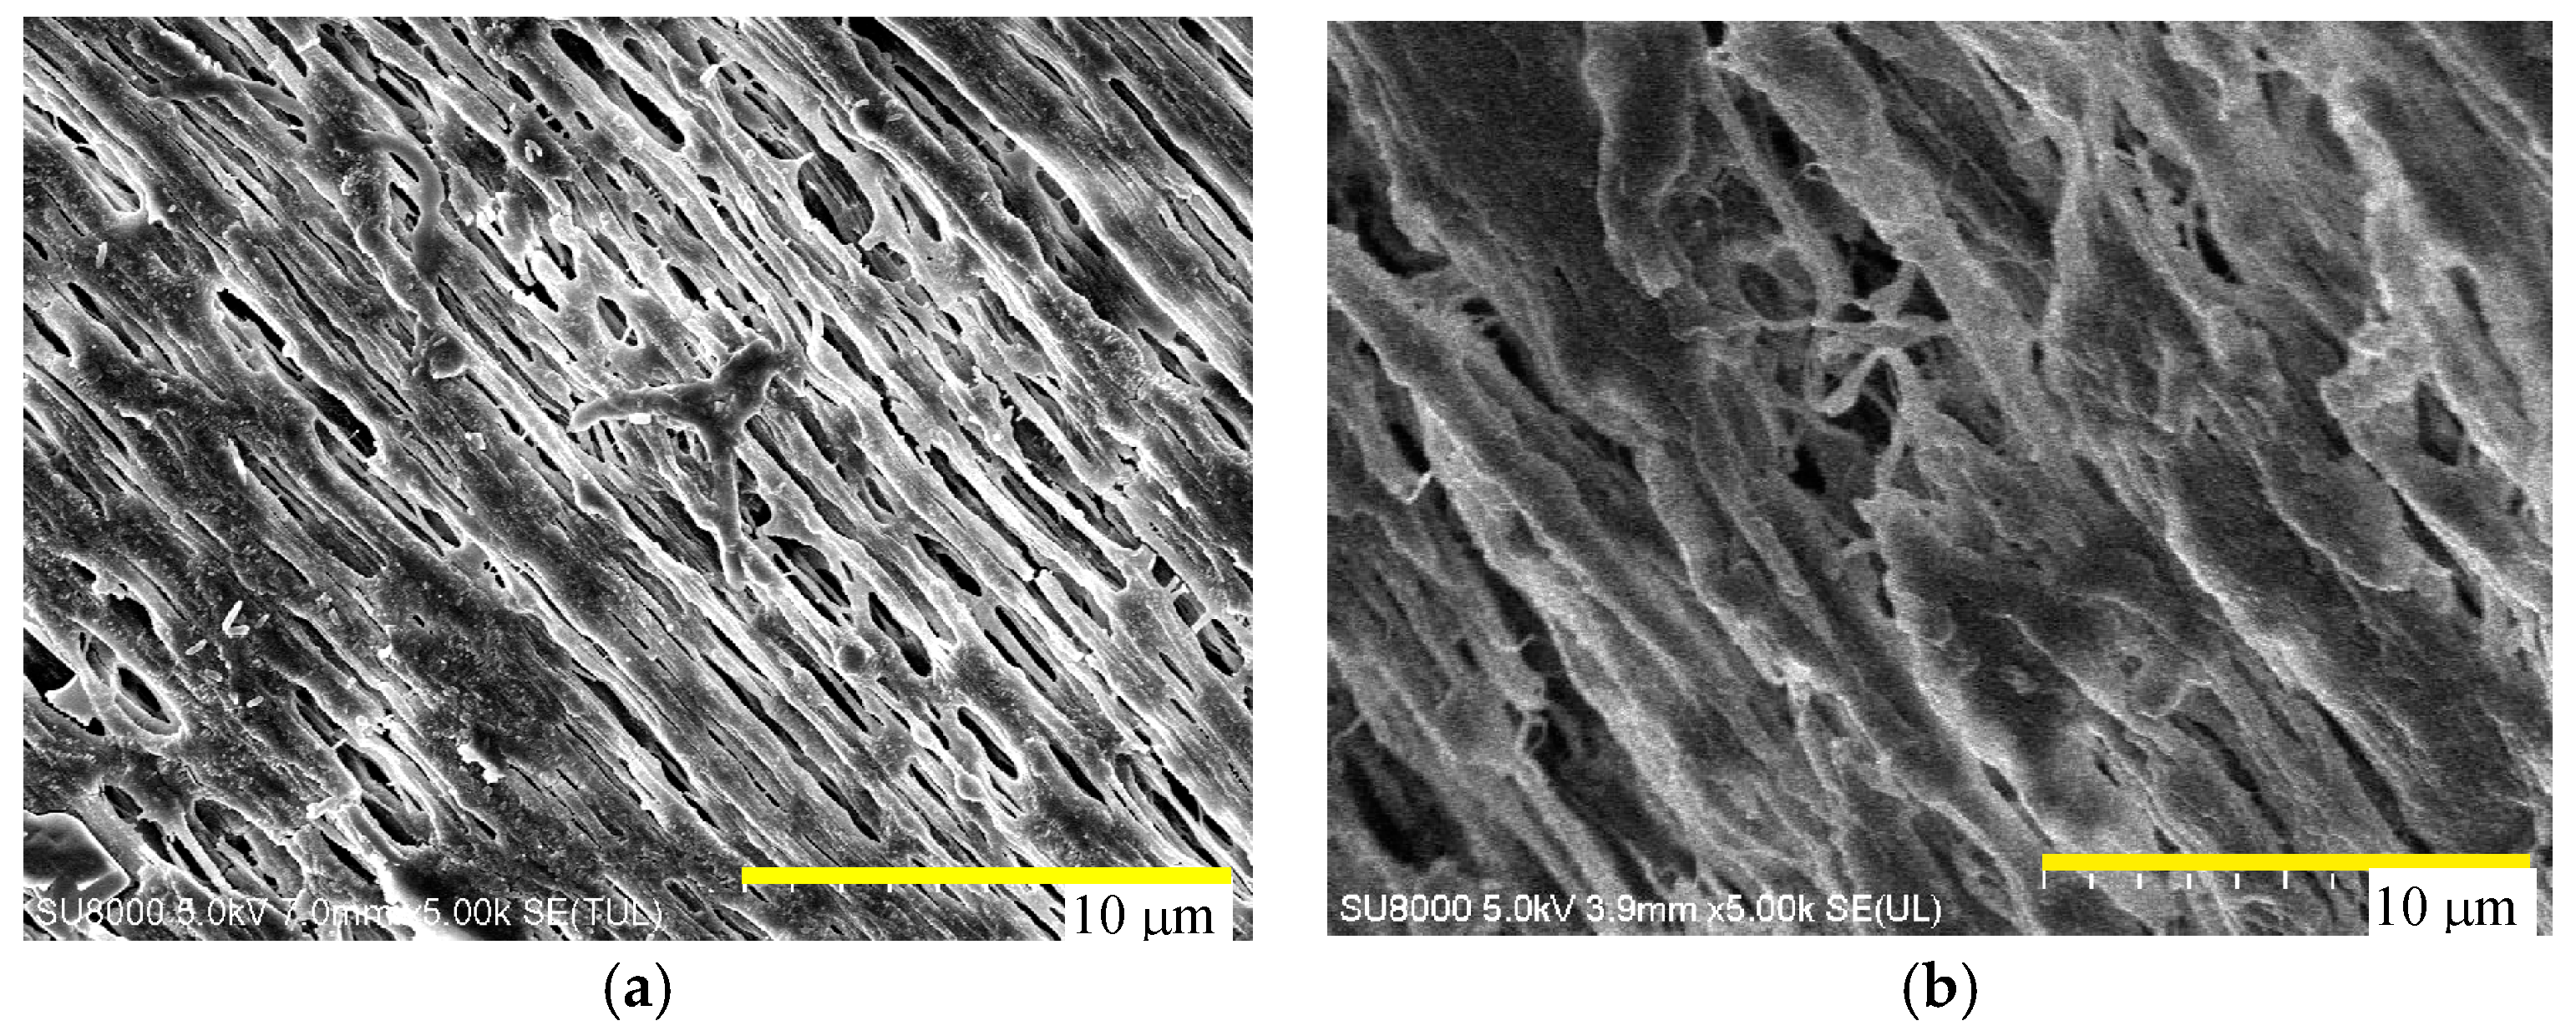
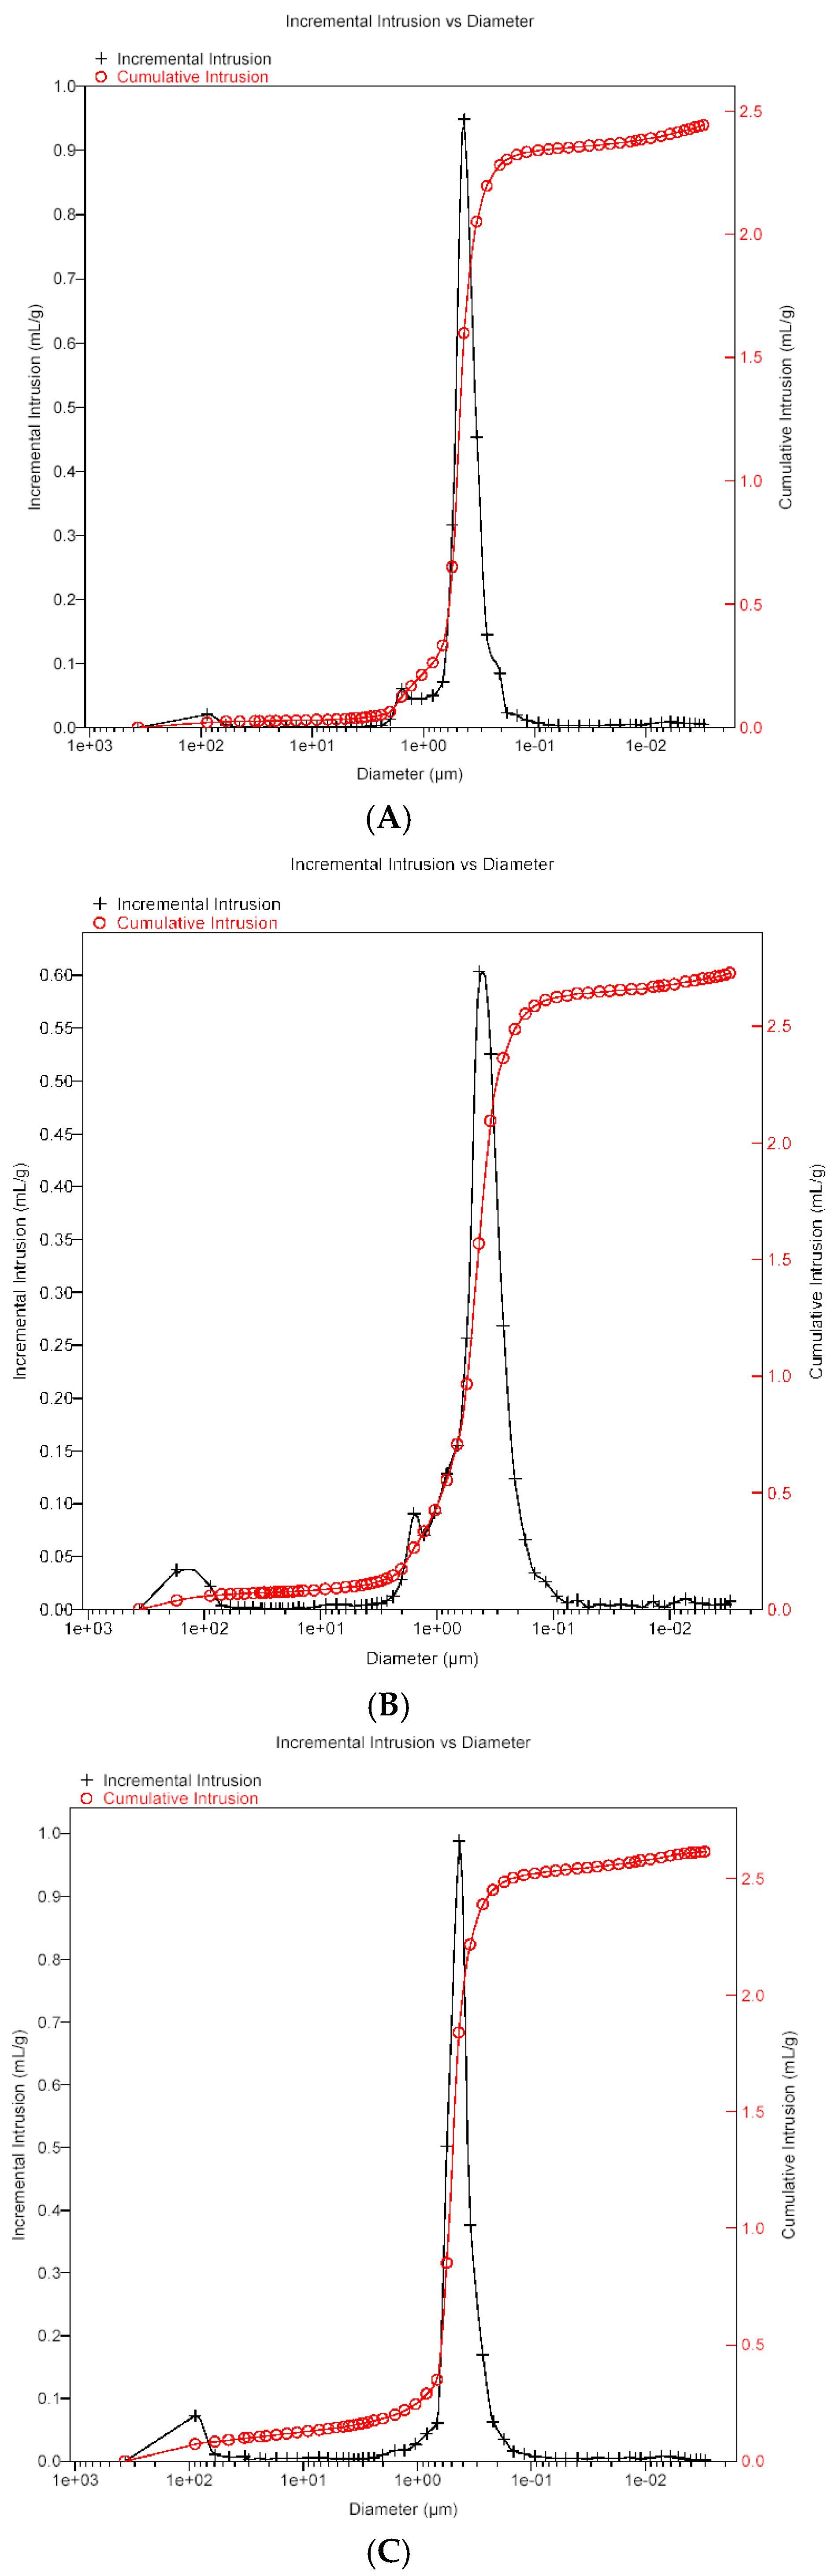
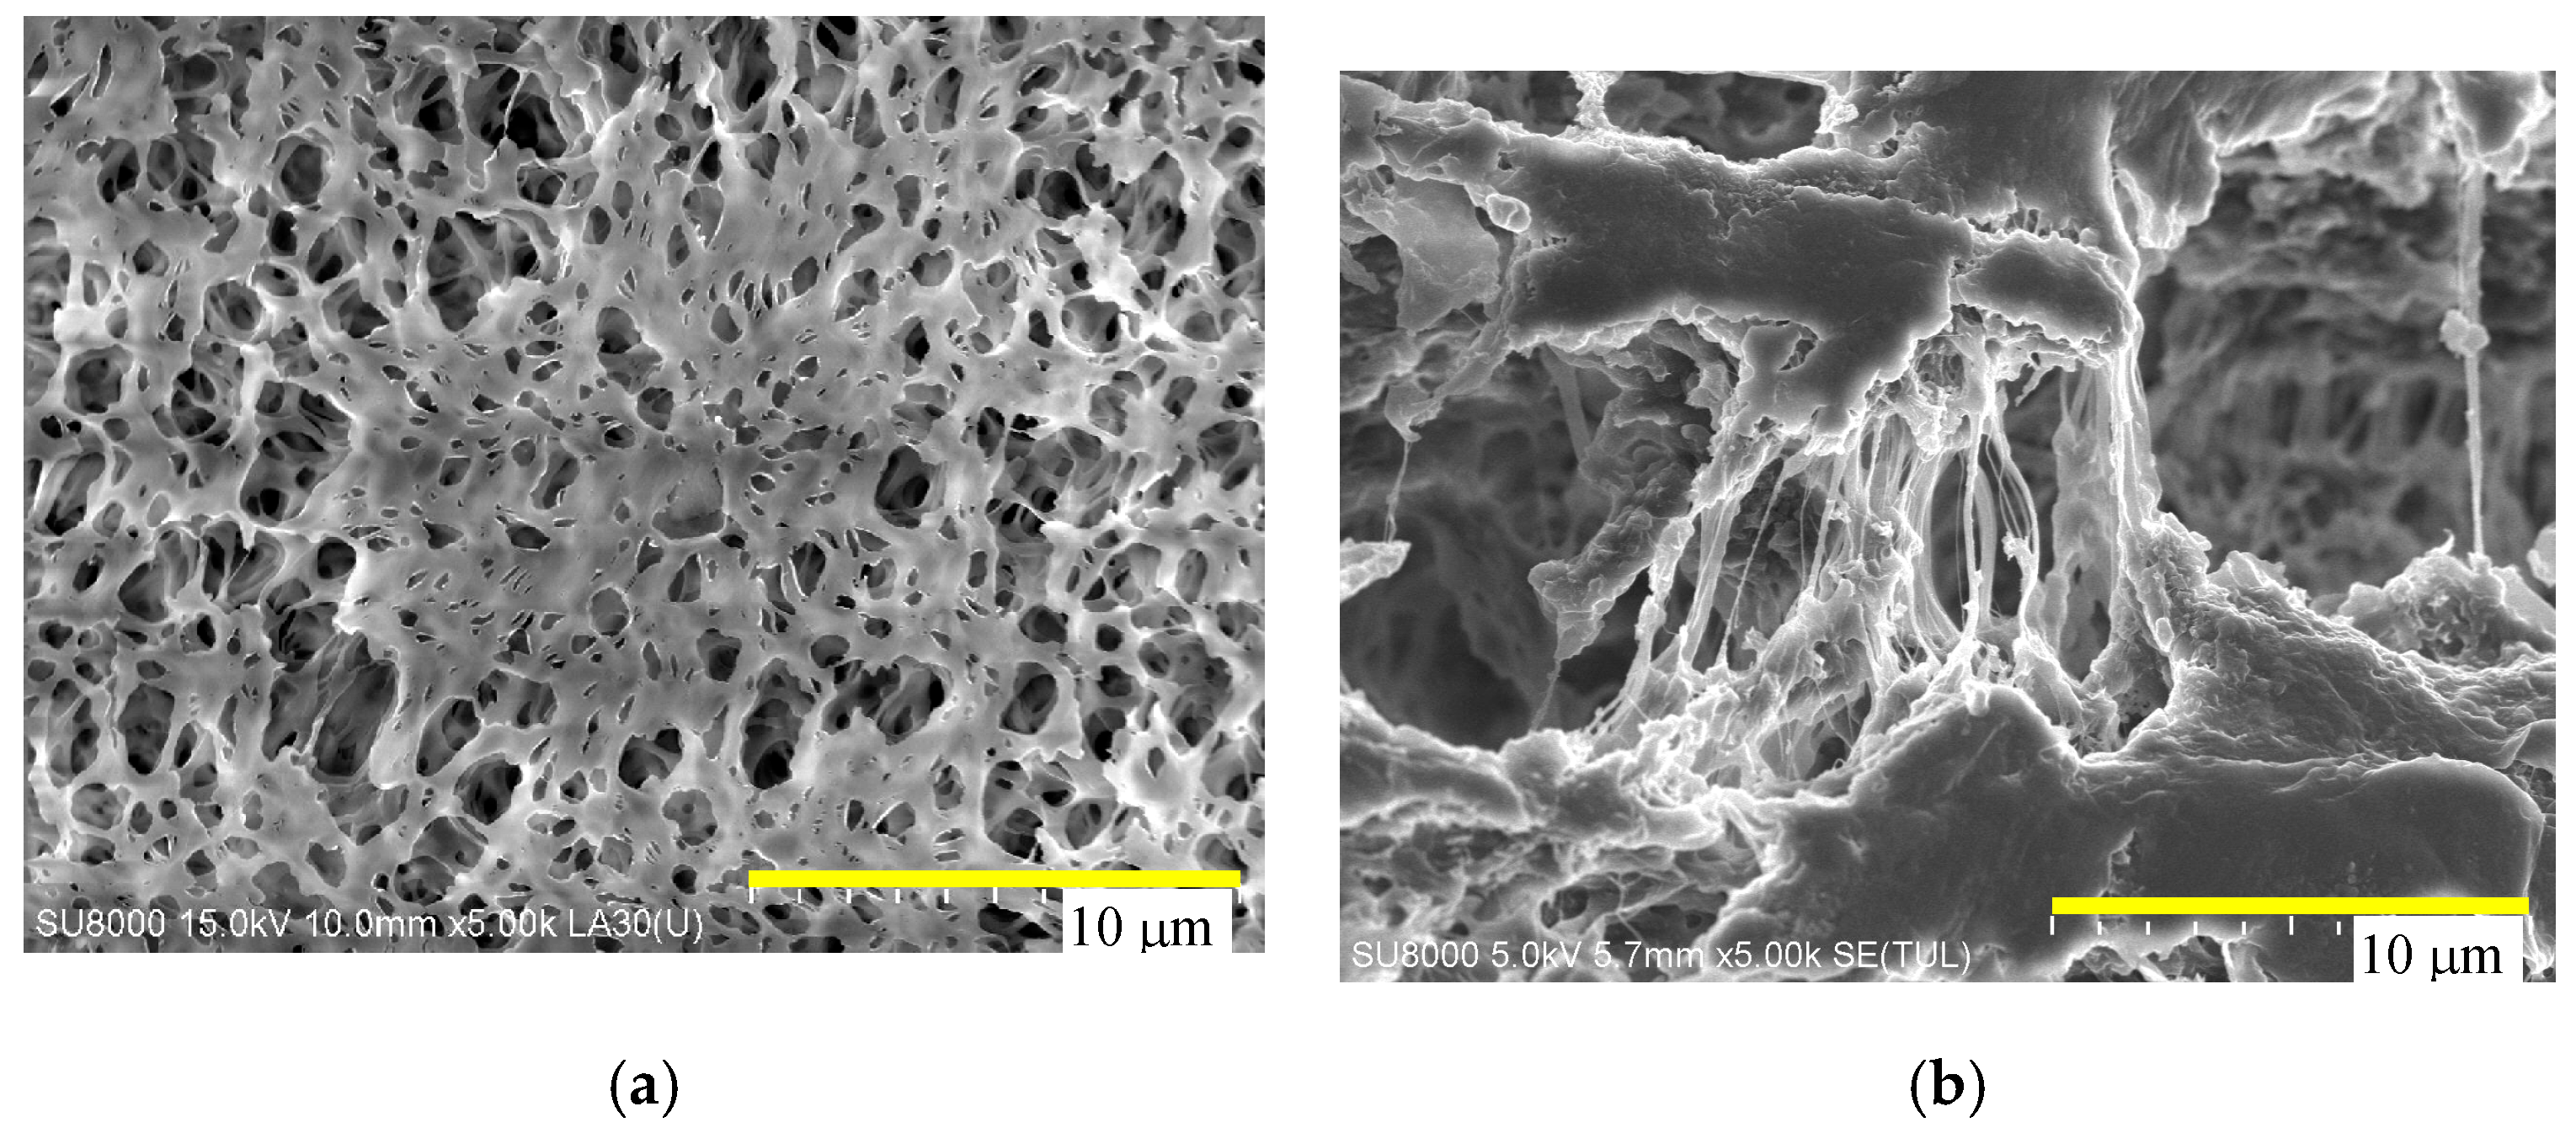
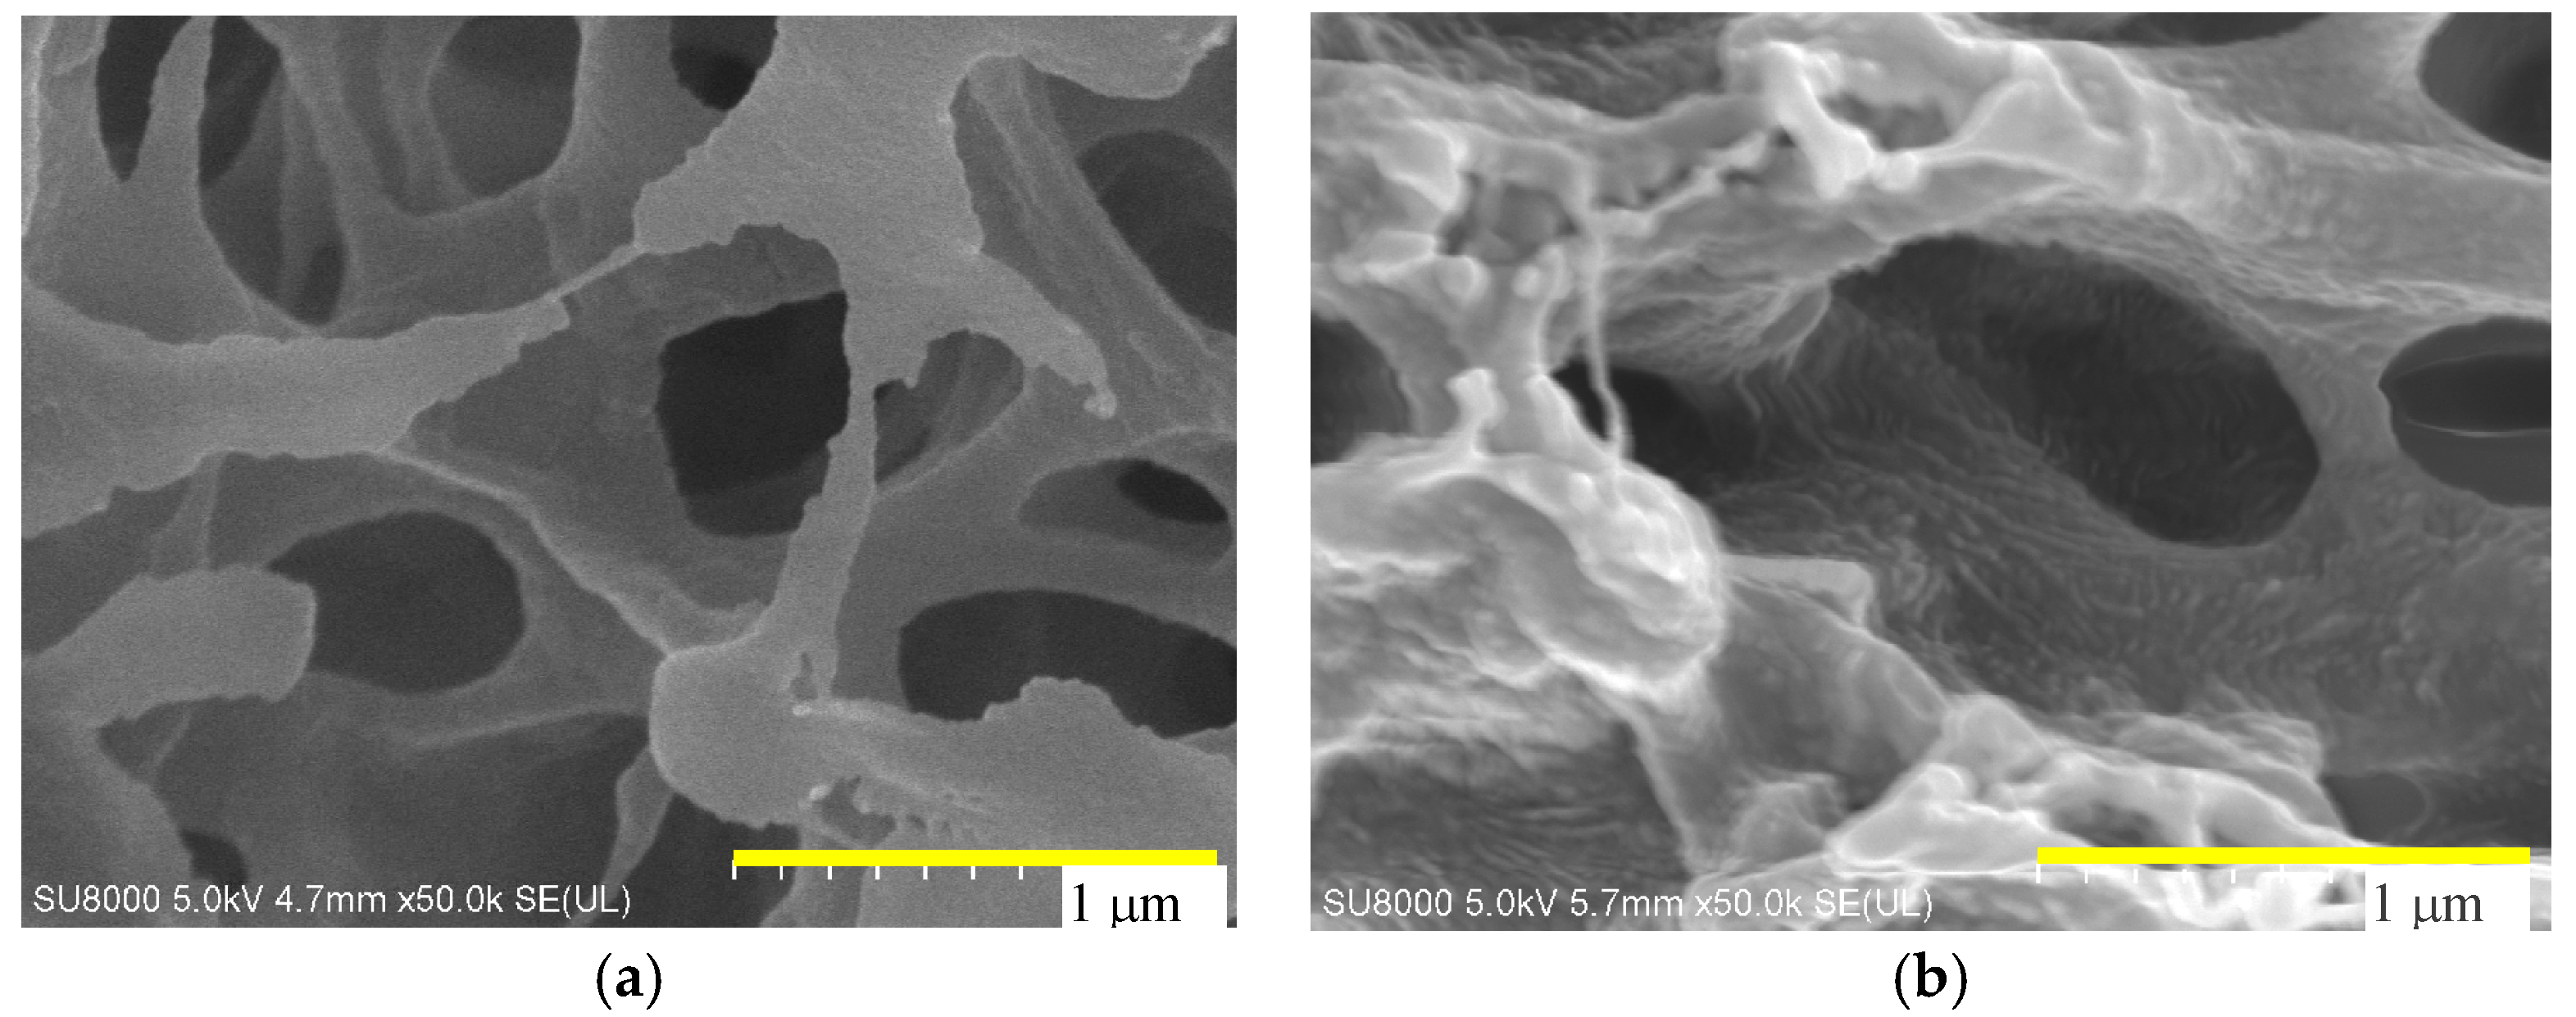
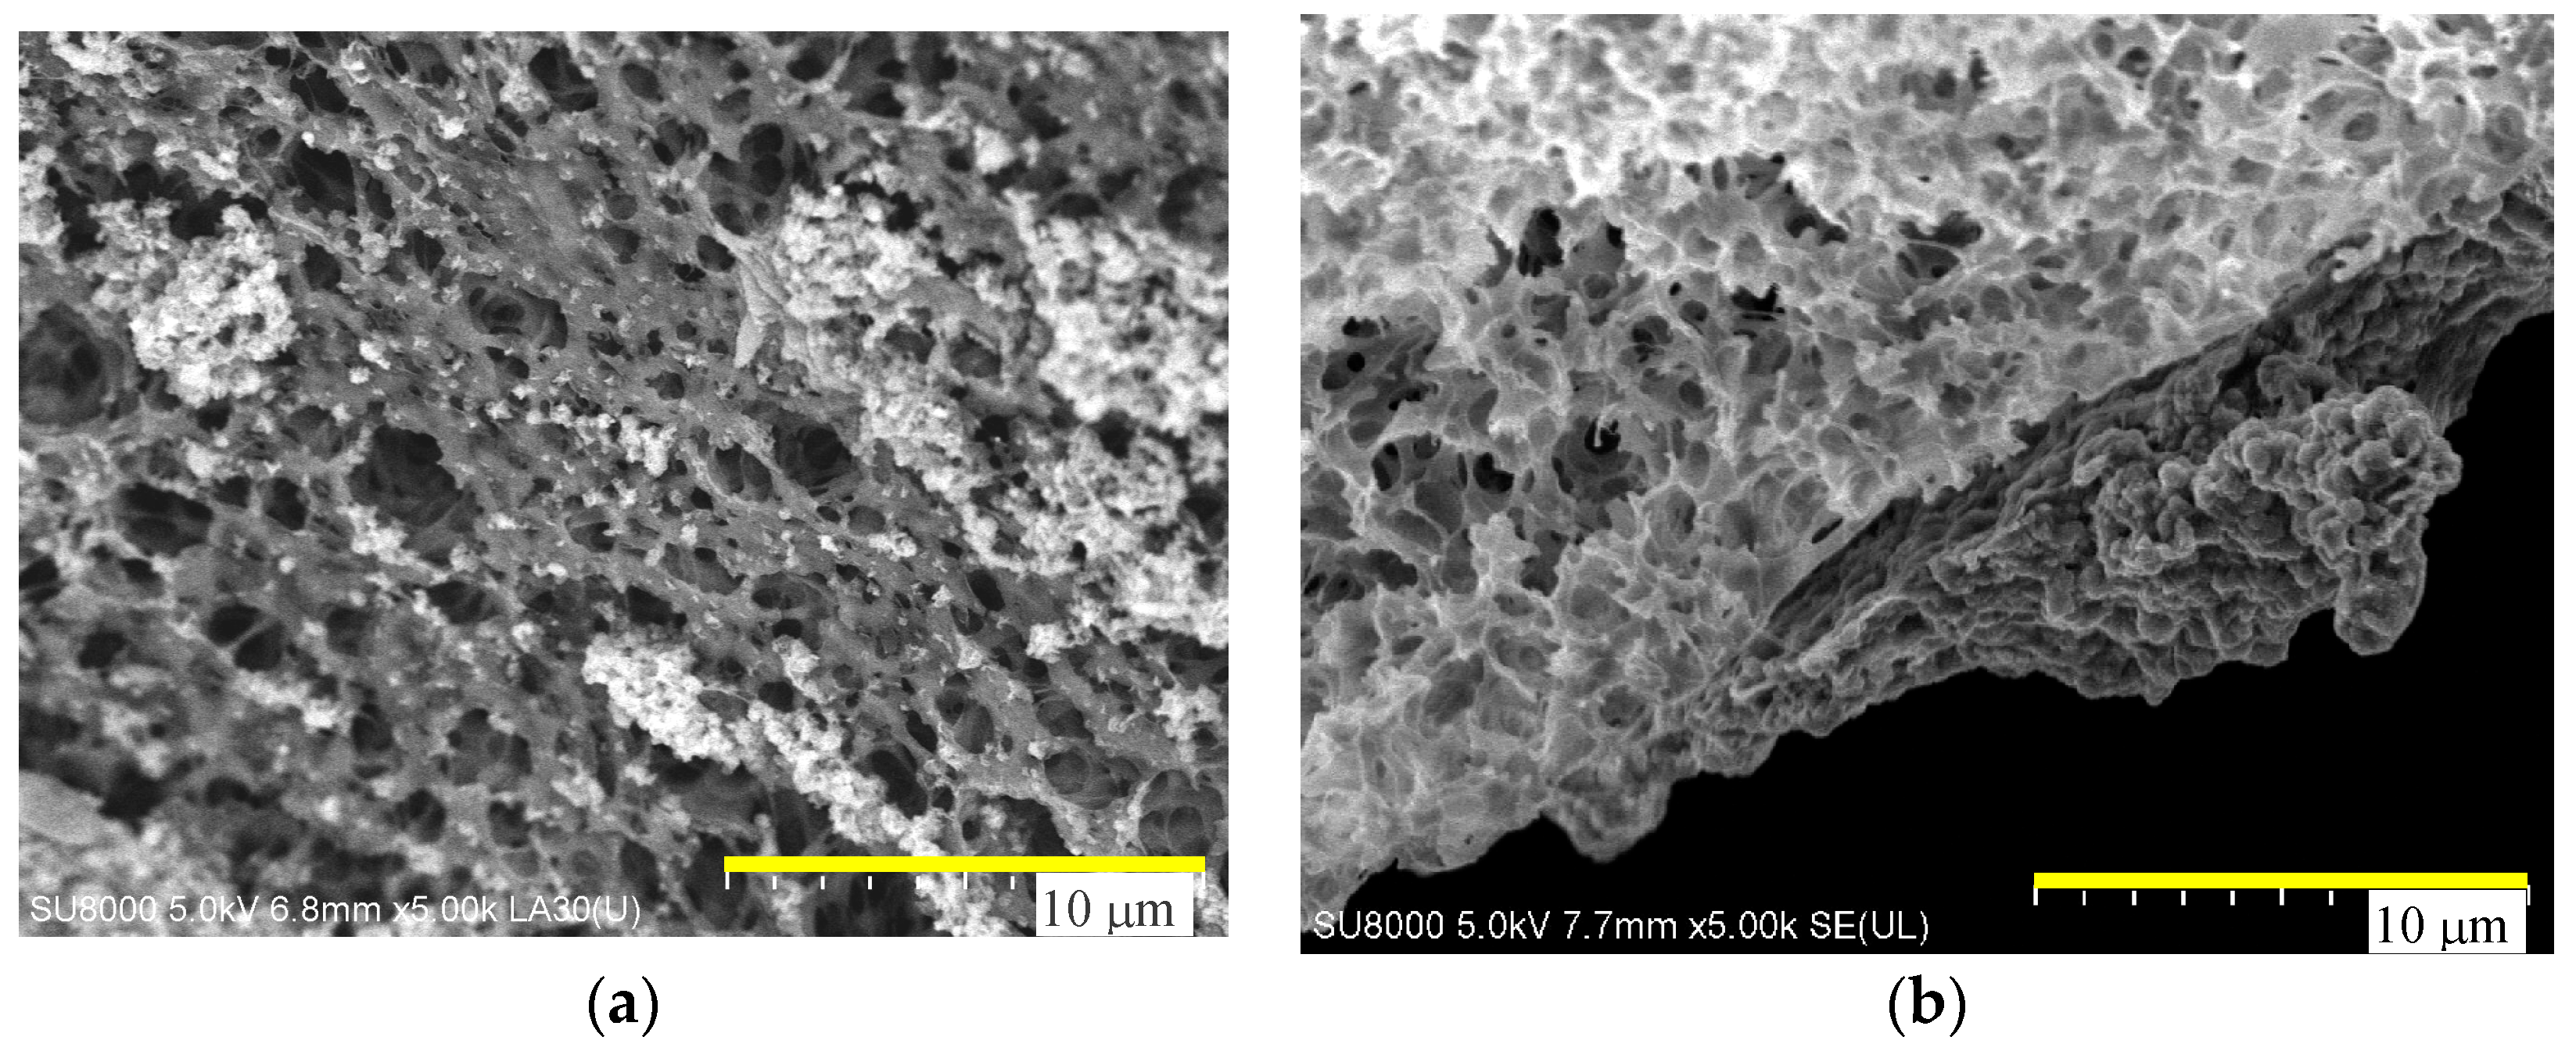
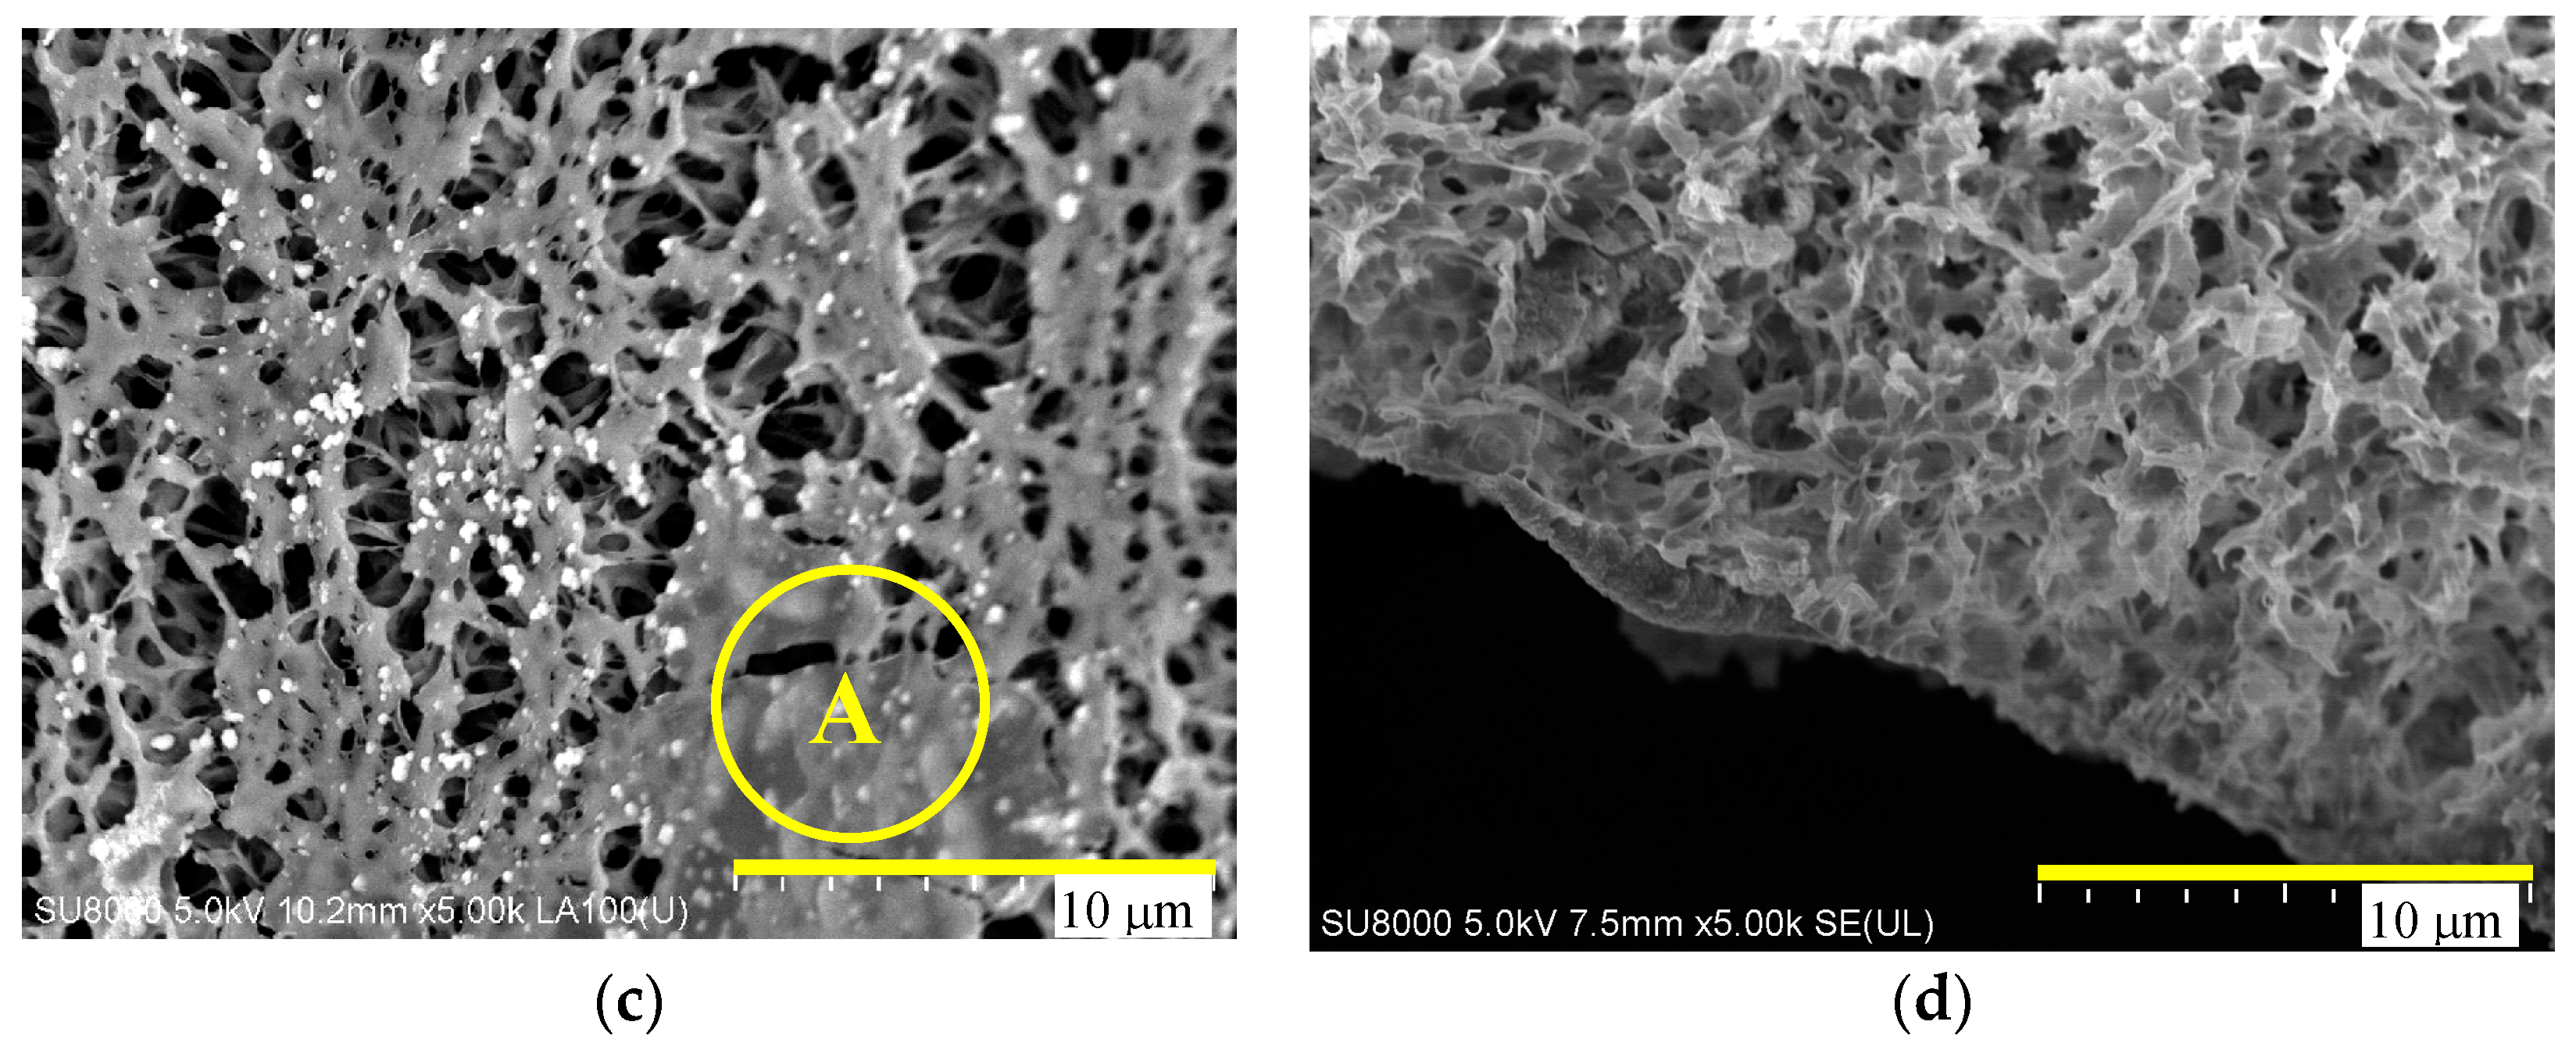
4.1. Membrane Morphology
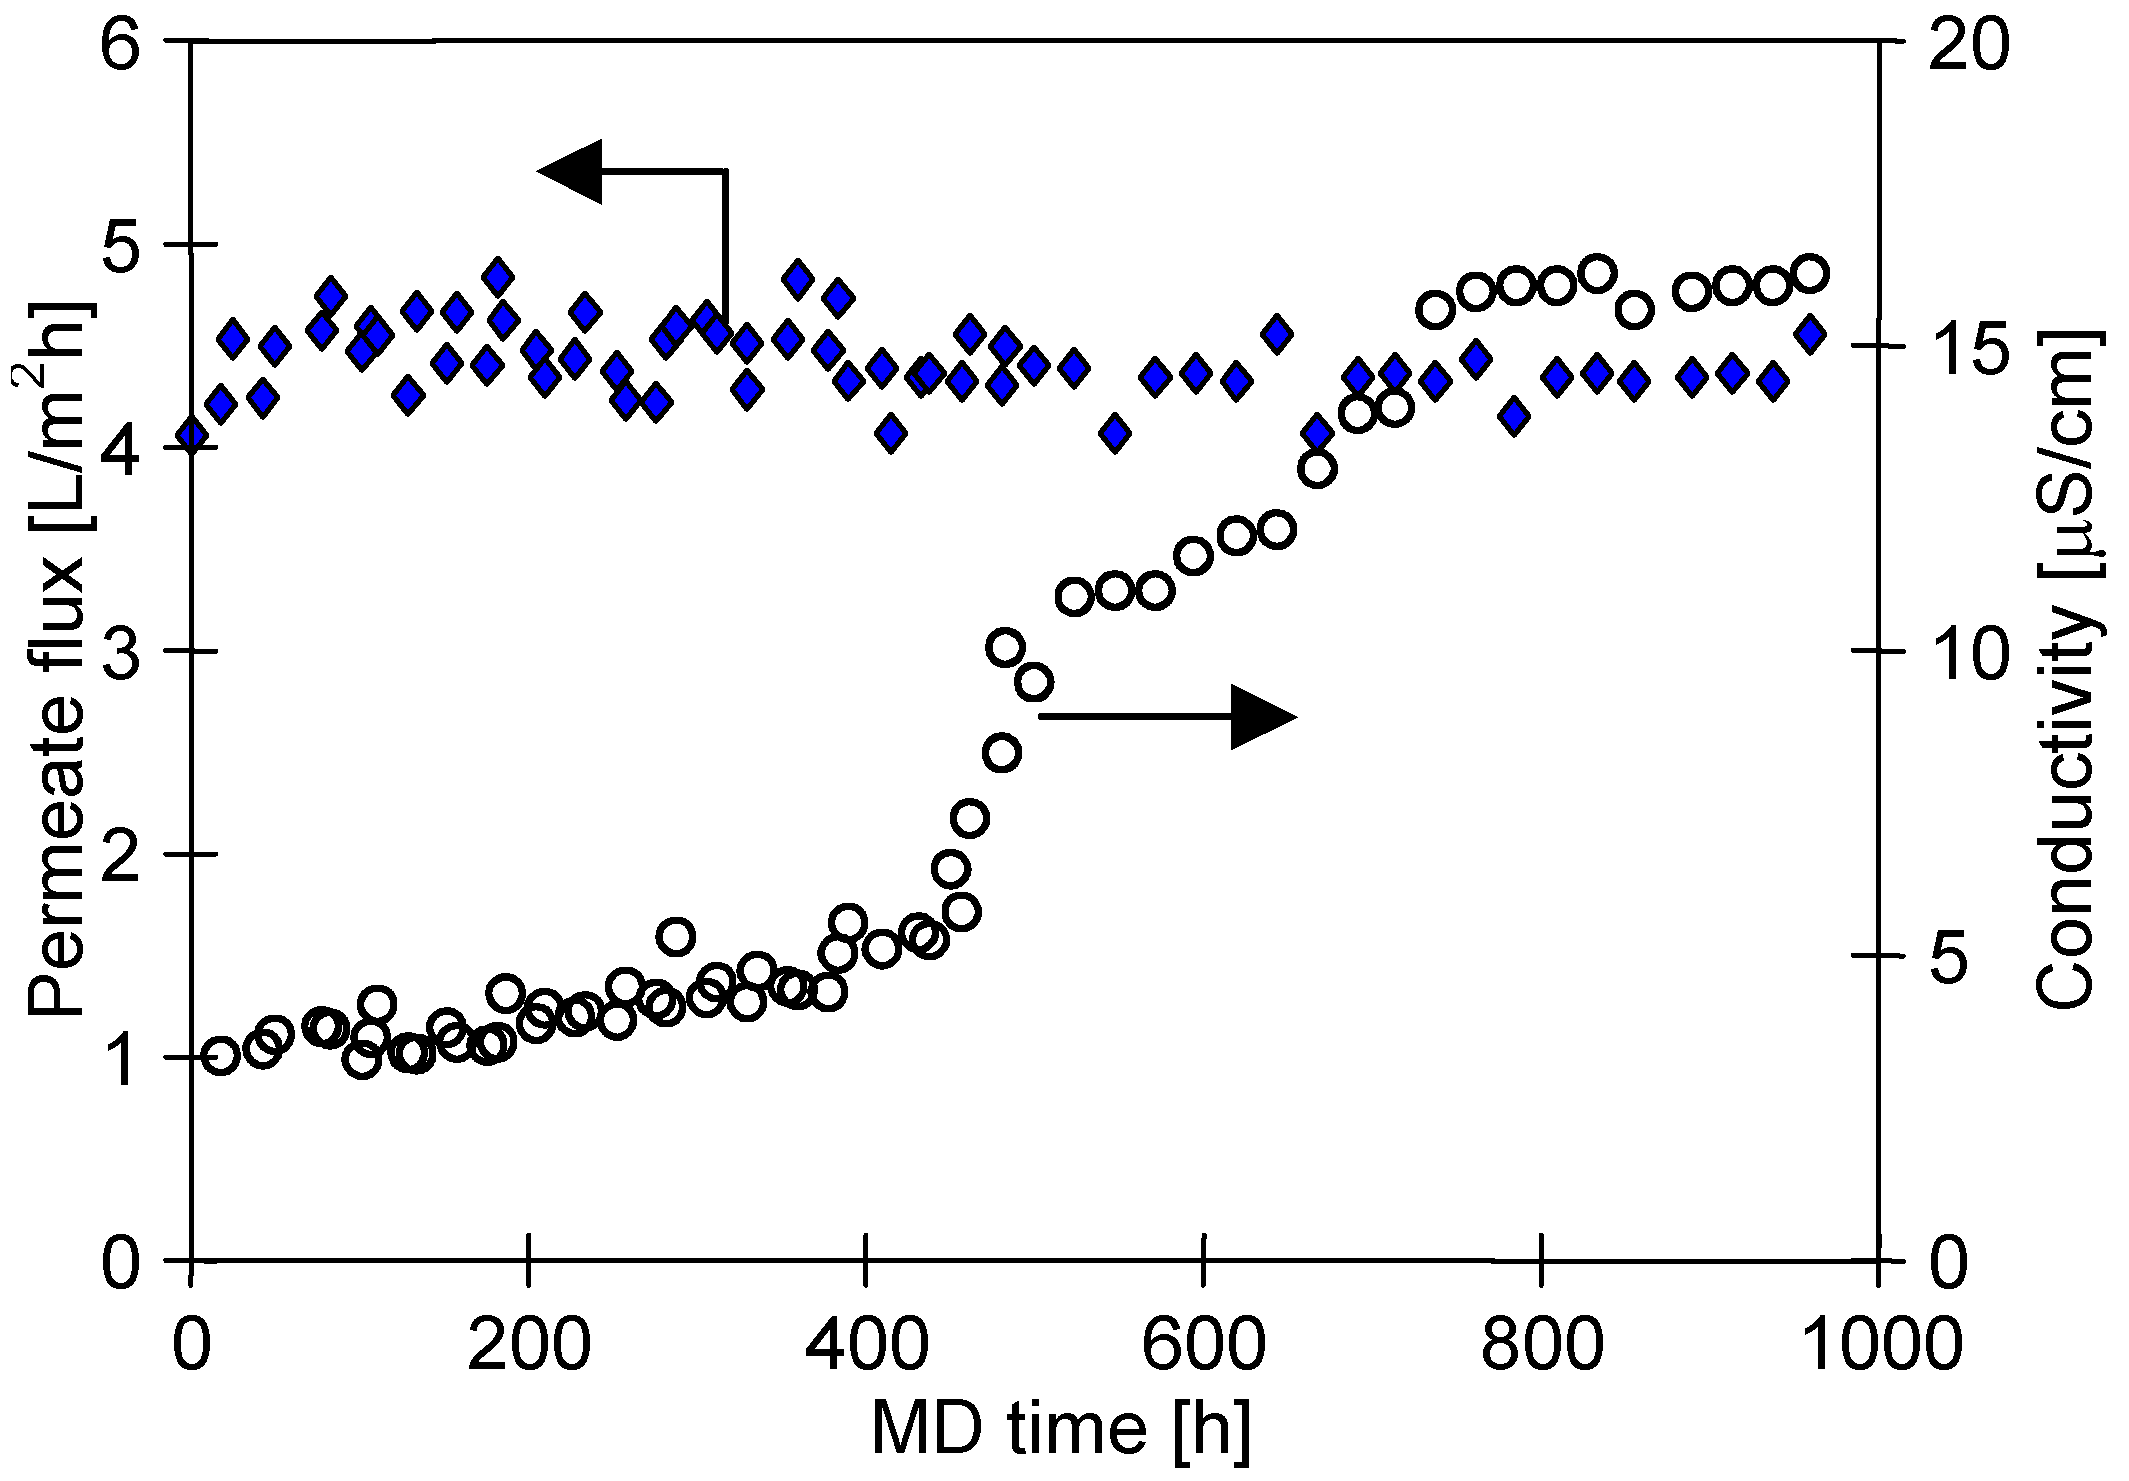
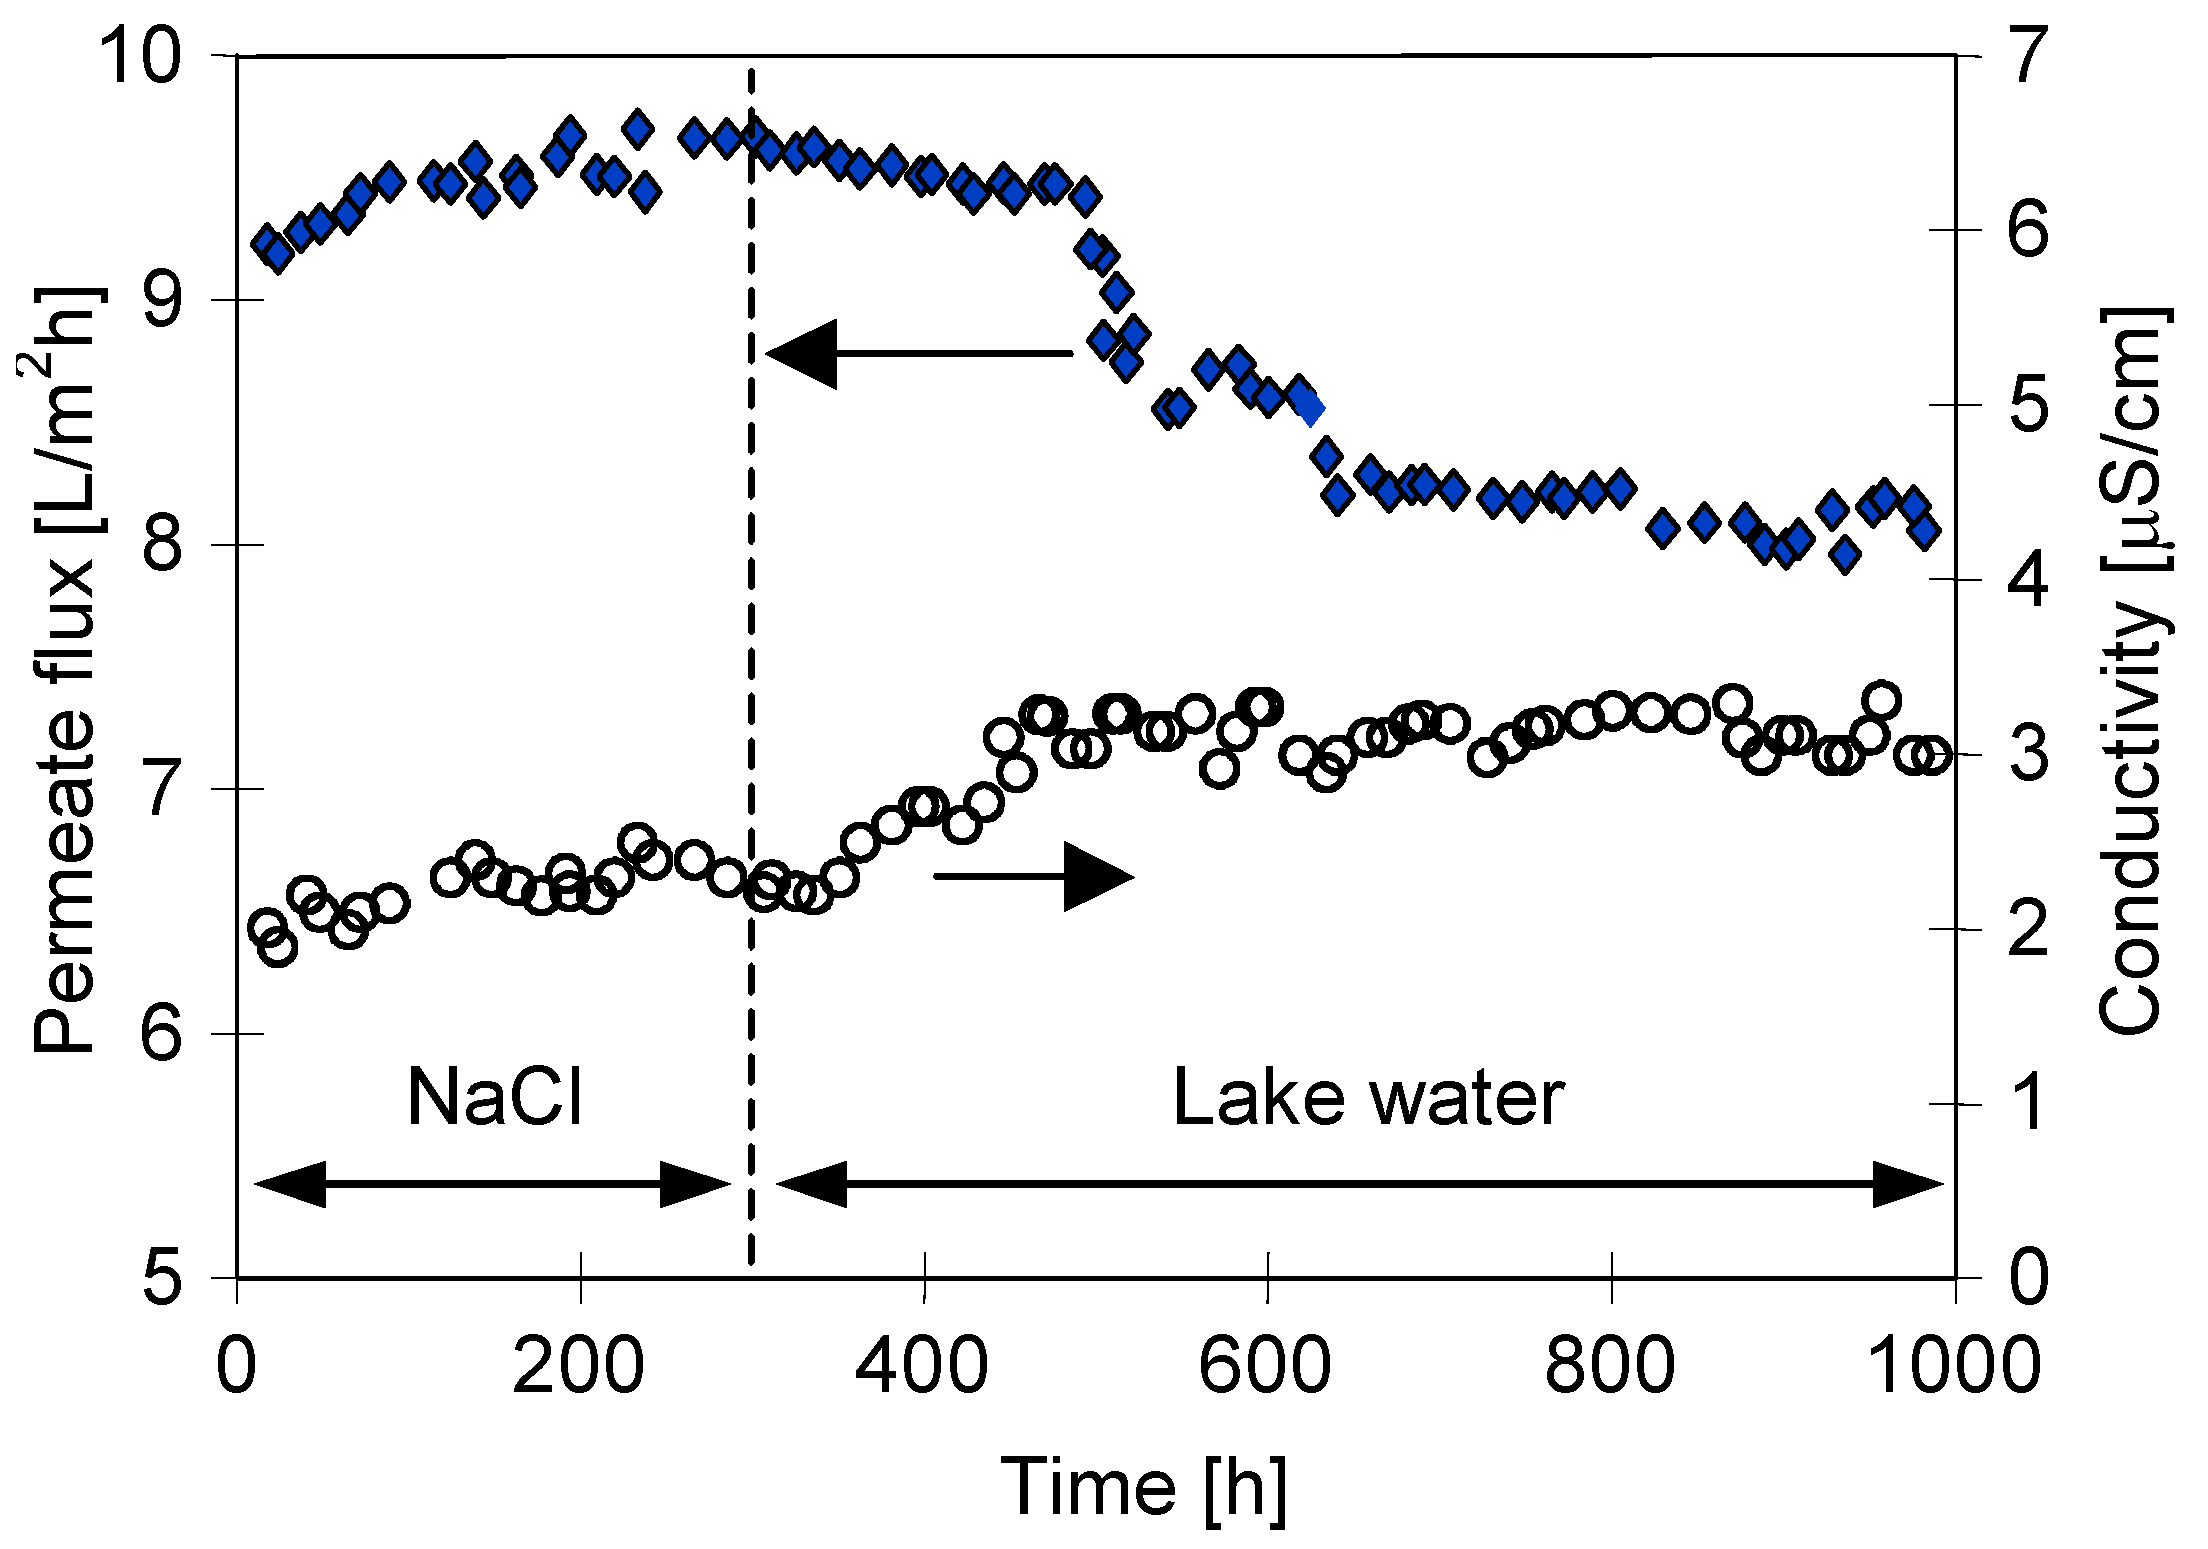
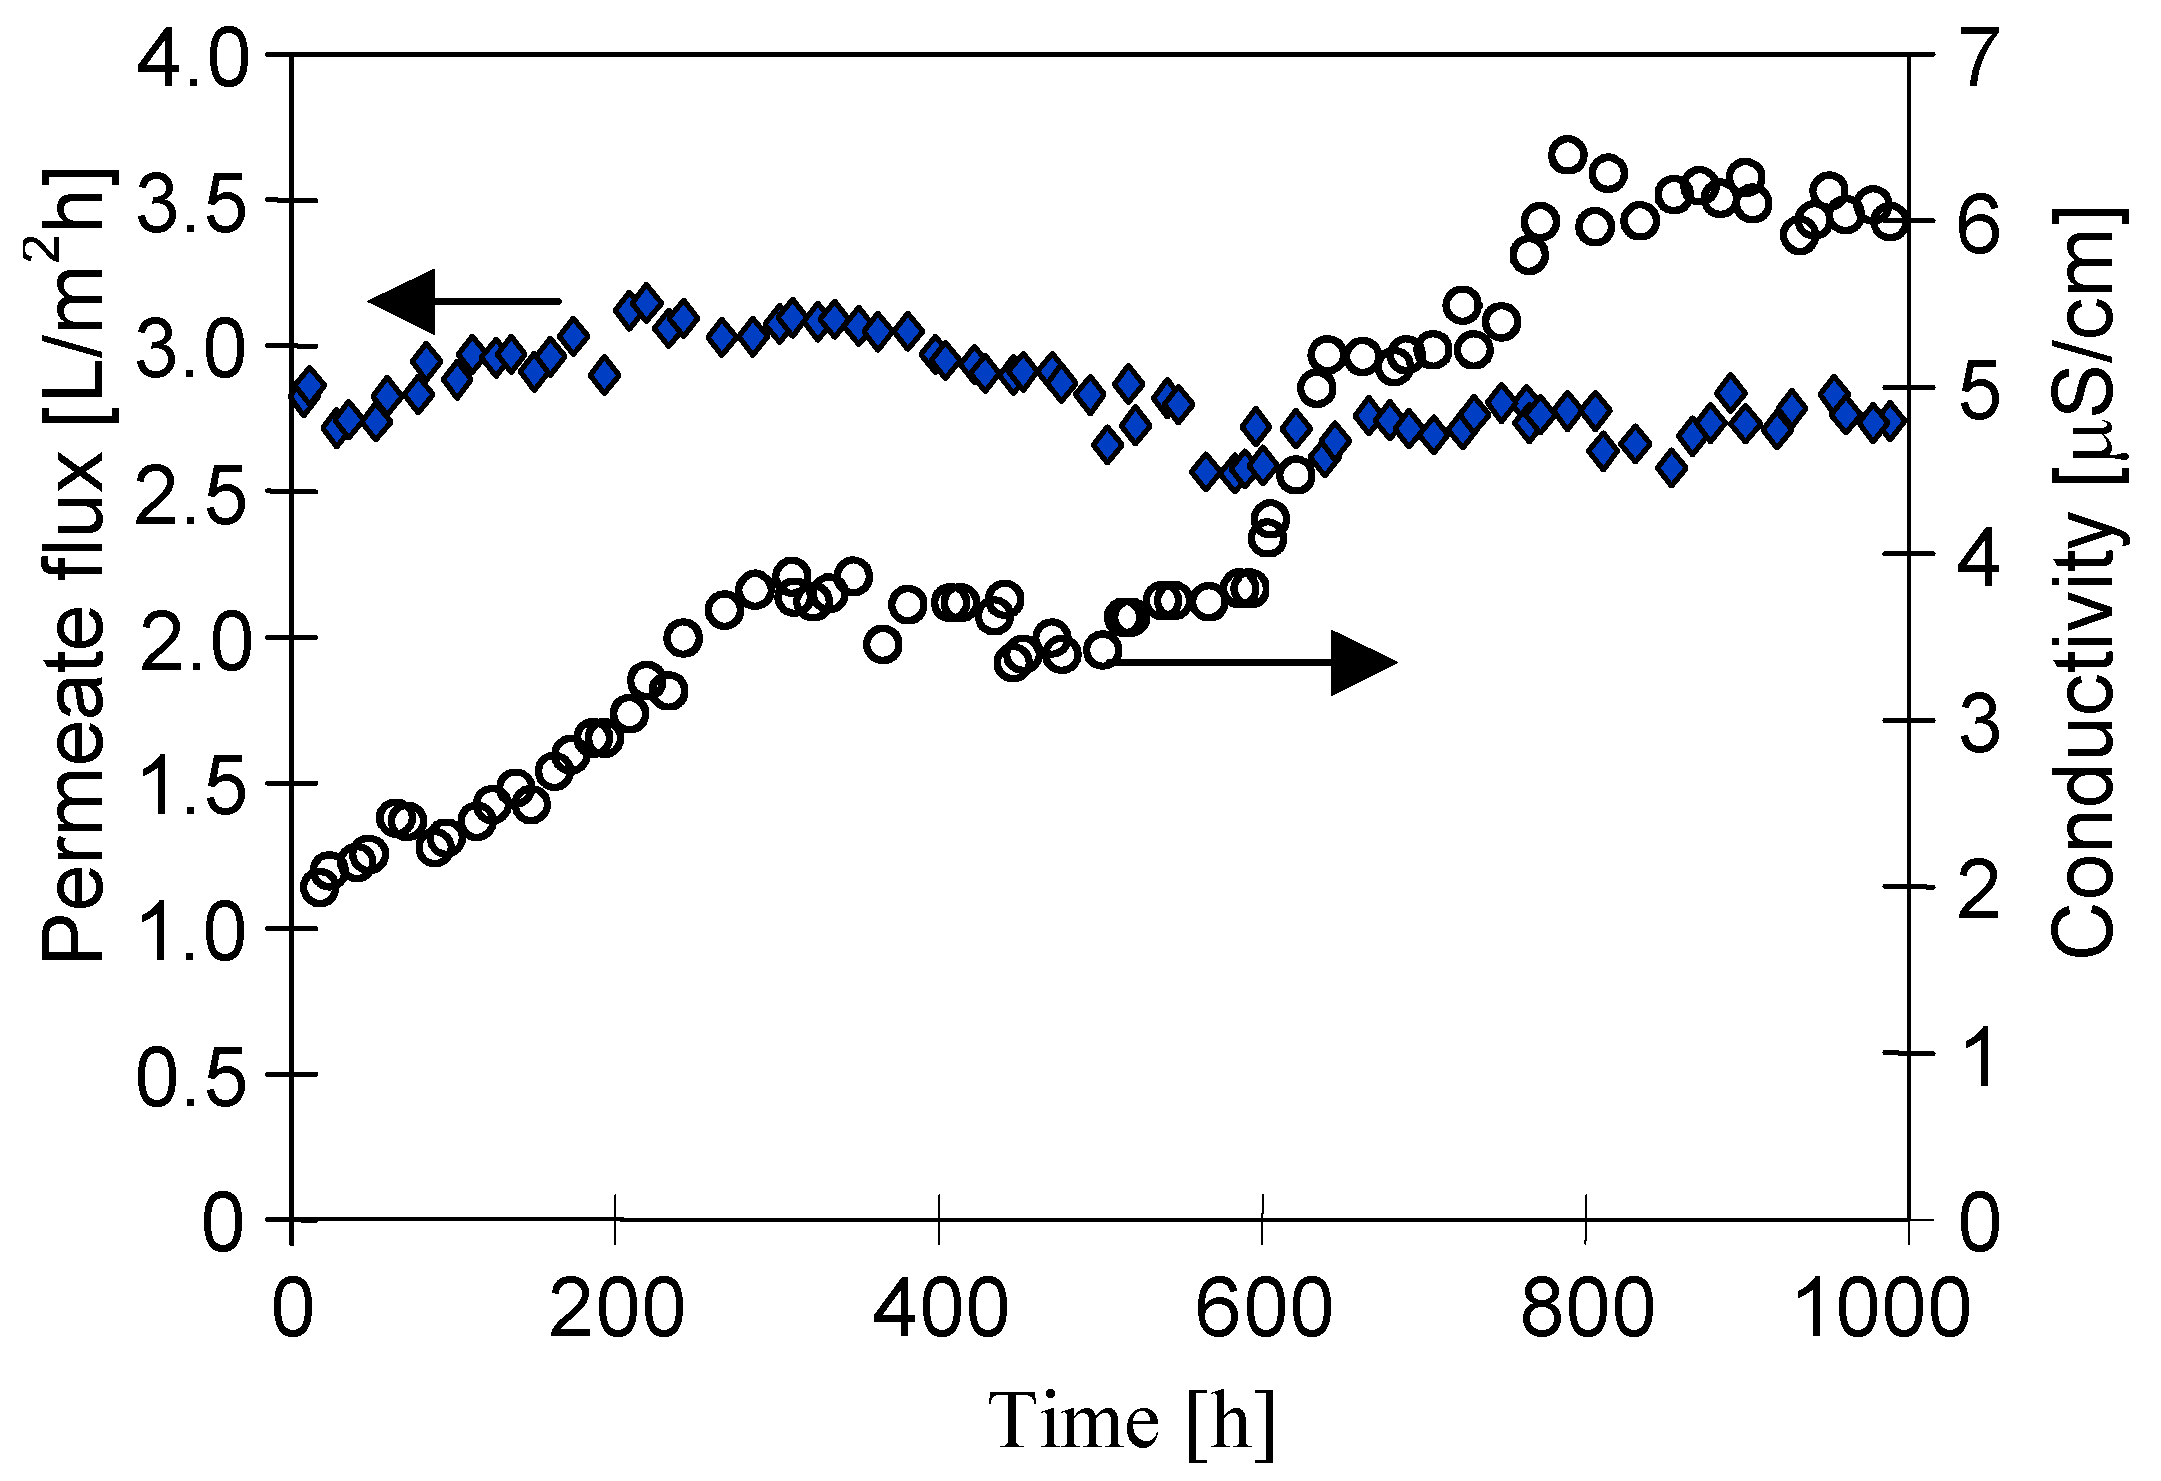
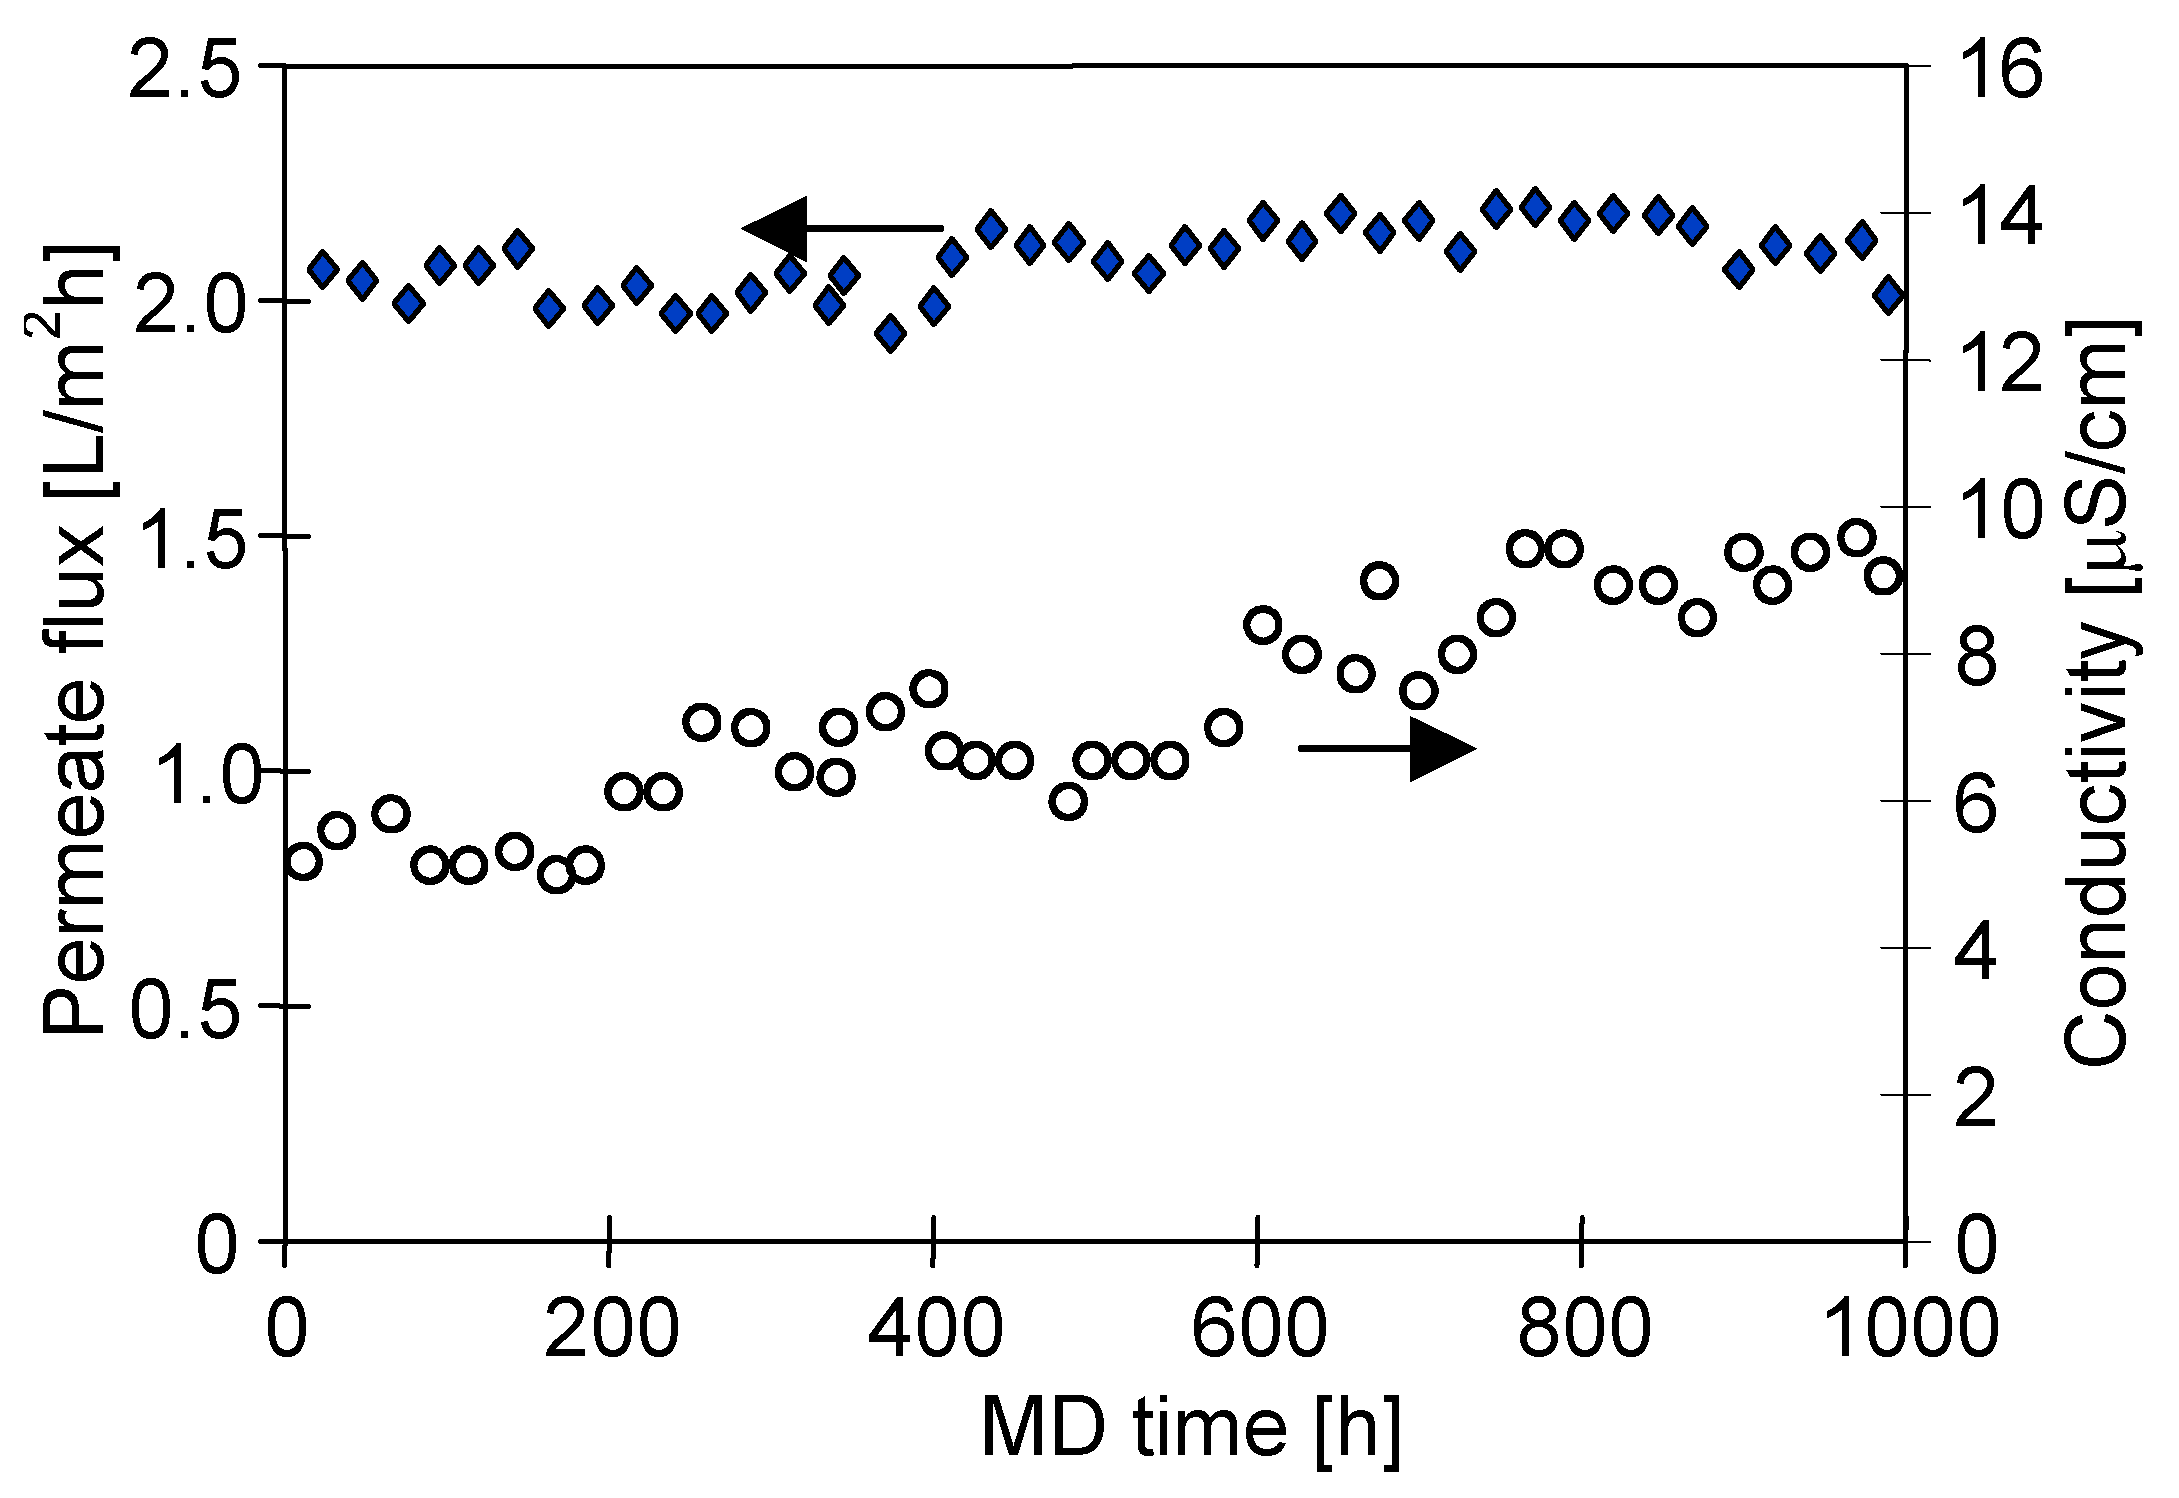
4.2. Water Desalination by MD
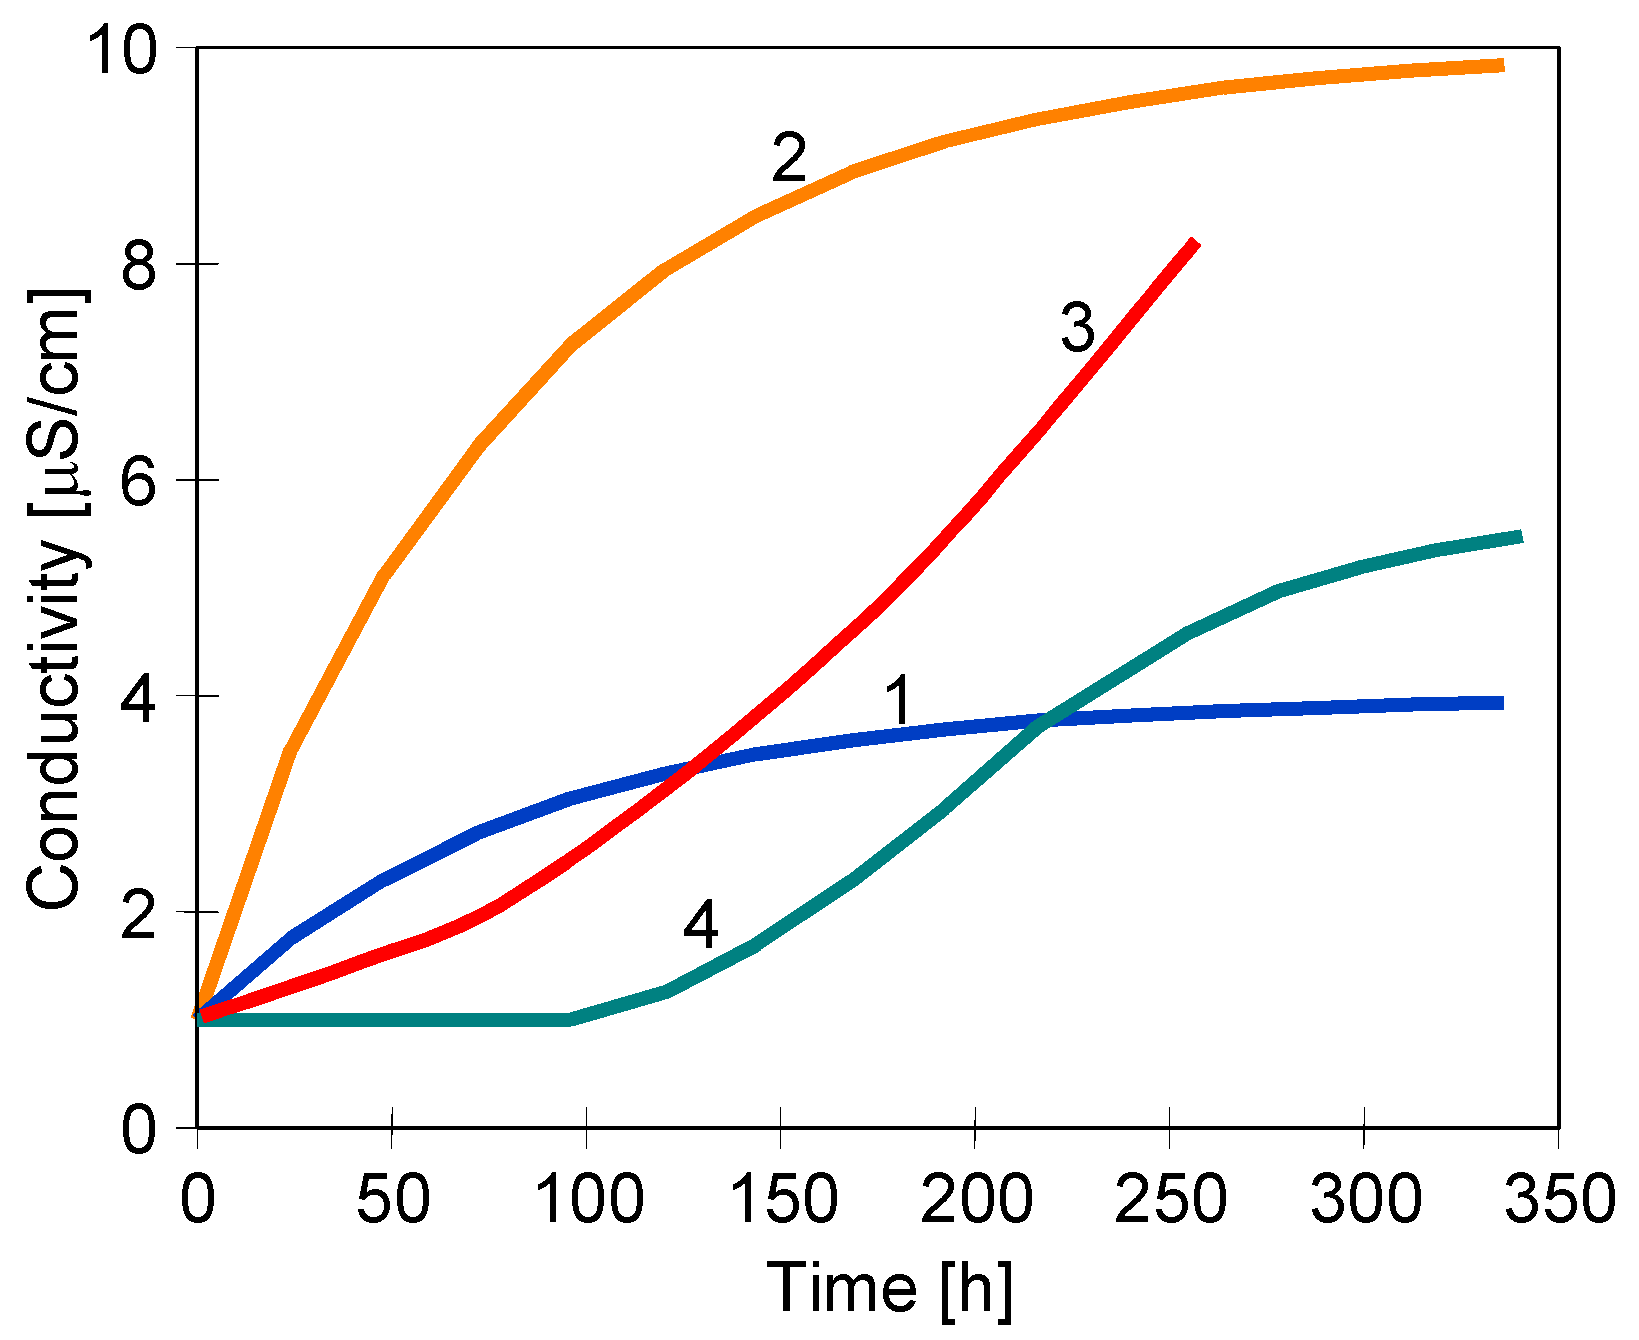
4.3. Membrane Scaling
5. Conclusions
Funding
Conflicts of Interest
References
- Edwie, F.; Chung, T.S. Development of hollow fiber membranes for water and salt recovery from highly concentrated brine via direct contact membrane distillation and crystallization. J. Membr. Sci. 2012, 421–422, 111–123. [Google Scholar] [CrossRef]
- Rezaei, M.; Warsinger, D.M.; Lienhard V, J.H.; Duke, M.C.; Matsuura, T.; Samhaber, W.M. Wetting phenomena in membrane distillation: Mechanisms, reversal, and prevention. Water Res. 2018, 139, 329–352. [Google Scholar] [CrossRef] [PubMed] [Green Version]
- Winter, D.; Koschikowski, J.; Wieghaus, M. Desalination using membrane distillation: Experimental studies on full scale spiral wound modules. J. Membr. Sci. 2011, 375, 104–112. [Google Scholar] [CrossRef]
- Duong, H.C.; Gray, S.; Duke, M.; Cath, T.Y.; Nghiem, L.D. Scaling control during membrane distillation of coal seam gas reverse osmosis brine. J. Membr. Sci. 2015, 493, 673–682. [Google Scholar] [CrossRef] [Green Version]
- Qtaishat, M.R.; Banat, F. Desalination by solar powered membrane distillation systems. Desalination 2013, 308, 186–197. [Google Scholar] [CrossRef]
- Khalifa, A.; Ahmad, H.; Antar, M.; Laoui, T.; Khayet, M. Experimental and theoretical investigations on water desalination using direct contact membrane distillation. Desalination 2017, 404, 22–34. [Google Scholar] [CrossRef]
- Guillén-Burrieza, E.; Blanco, J.; Zaragoza, G.; Alarcón, D.C.; Palenzuela, P.; Ibarra, M.; Gernjak, W. Experimental analysis of an air gap membrane distillation solar desalination pilot system. J. Membr. Sci. 2011, 379, 386–396. [Google Scholar] [CrossRef]
- Bush, J.A.; Vanneste, J.; Cath, T.Y. Membrane distillation for concentration of hypersaline brines from the Great Salt Lake: Effects of scaling and fouling on performance, efficiency, and salt rejection. Sep. Purif. Technol. 2016, 170, 78–91. [Google Scholar] [CrossRef] [Green Version]
- Warsinger, D.M.; Swaminathan, J.; Guillen-Burrieza, E.; Arafat, H.A.; Lienhard V, J.H. Scaling and fouling in membrane distillation for desalination applications: A review. Desalination 2015, 356, 294–313. [Google Scholar] [CrossRef] [Green Version]
- Tijing, L.D.; Woo, Y.C.; Choi, J.-S.; Lee, S.; Kim, S.-H.; Shon, H.K. Fouling and its control in membrane distillation—A review. J. Membr. Sci. 2015, 475, 215–244. [Google Scholar] [CrossRef] [Green Version]
- Guillen-Burrieza, E.; Mavukkandy, M.O.; Bilad, M.R.; Arafat, H.A. Understanding wetting phenomena in membrane distillation and how operational parameters can affect it. J. Membr. Sci. 2016, 515, 163–174. [Google Scholar] [CrossRef]
- Khan, M.A.M.; Rehman, S.; Al-Sulaiman, F.A. A hybrid renewable energy system as a potential energy source for water desalination using reverse osmosis: A review. Renew. Sustain. Energ. Rev. 2018, 97, 456–477. [Google Scholar] [CrossRef]
- Naidu, G.; Jeong, S.; Choi, Y.; Vigneswaran, S. Membrane distillation for wastewater reverse osmosis concentrate treatment with water reuse potential. J. Membr. Sci. 2017, 524, 565–575. [Google Scholar] [CrossRef]
- El-Abbassi, A.; Kiai, H.; Hafidi, H.; García-Payo, M.C.; Khayet, M. Treatment of olive mill wastewater by membrane distillation using polytetrafuoroethylene membranes. Sep. Purif. Technol. 2012, 98, 55–61. [Google Scholar] [CrossRef]
- Jansen, A.E.; Assink, J.W.; Hanemaaijer, J.H.; van Medevoort, J.; van Sonsbeek, V. Development and pilot testing of full-scale membrane distillation modules for deployment of waste heat. Desalination 2013, 323, 55–65. [Google Scholar] [CrossRef]
- Eykens, L.; De Sitter, K.; Dotremont, C.; Pinoy, L.; Van der Bruggen, B. Membrane synthesis for membrane distillation: A review. Sep. Purif. Technol. 2017, 182, 36–51. [Google Scholar] [CrossRef]
- Tang, N.; Feng, C.; Han, H.; Hua, X.; Zhang, L.; Xiang, J.; Cheng, P.; Du, W.; Wang, X. High permeation flux polypropylene/ethylene vinyl acetate co-blending membranes via thermally induced phase separation for vacuum membrane distillation desalination. Desalination 2016, 394, 44–55. [Google Scholar] [CrossRef]
- Eykens, L.; De Sitter, K.; Dotremont, C.; Pinoy, L.; Van der Bruggen, B. Coating techniques for membrane distillation: An experimental assessment. Sep. Purif. Technol. 2018, 193, 38–48. [Google Scholar] [CrossRef]
- Roy, S.; Bhadra, M.; Mitra, S. Enhanced desalination via functionalized carbon nanotube immobilized membrane in direct contact membrane distillation. Sep. Purif. Technol. 2014, 136, 58–65. [Google Scholar] [CrossRef]
- Bhadra, M.; Roy, S.; Mitra, S. Desalination across a graphene oxide membrane via direct contact membrane distillation. Desalination 2016, 378, 37–43. [Google Scholar] [CrossRef]
- Gryta, M. Investigations of a membrane distillation pilot plant with a capillary module. Desalin. Water Treat. 2017, 64, 279–286. [Google Scholar] [CrossRef]
- Wang, Y.-J.; Zhao, Z.-P.; Xi, Z.-Y.; Yan, S.-Y. Microporous polypropylene membrane prepared via TIPS using environment-friendly binary diluents and its VMD performance. J. Membr. Sci. 2018, 548, 332–344. [Google Scholar] [CrossRef]
- Luo, B.; Zhang, J.; Wang, X.; Zhou, Y.; Wen, J. Effects of nucleating agents and extractants on the structure of polypropylene microporous membranes via thermally induced phase separation. Desalination 2006, 192, 142–150. [Google Scholar] [CrossRef]
- Lin, Y.K.; Chen, G.; Yang, J.; Wang, X.L. Formation of isotactic polypropylene membranes with bicontinuous structure and good strength via thermally induced phase separation method. Desalination 2009, 236, 8–15. [Google Scholar] [CrossRef]
- Matsuyama, H.; Maki, T.; Teramoto, M.; Asano, K. Effect of polypropylene molecular weight on porous membrane formation by thermally induced phase separation. J. Membr. Sci. 2002, 204, 323–328. [Google Scholar] [CrossRef]
- Wang, P.; Chung, T.S. Recent advances in membrane distillation processes: Membrane development, configuration design and application exploring. J. Membr. Sci. 2015, 474, 39–56. [Google Scholar] [CrossRef]
- Macedonio, F.; Ali, A.; Poerio, T.; El-Sayed, E.; Drioli, E.; Abdel-Jawad, M. Direct contact membrane distillation for treatment of oilfield produced water. Sep. Purif. Technol. 2014, 126, 69–81. [Google Scholar] [CrossRef]
- Gryta, M. The application of polypropylene membranes for production of fresh water from brines by membrane distillation. Chem. Pap. 2017, 71, 775–784. [Google Scholar] [CrossRef]
- Schneider, R.; Hölz, W.; Wollbeck, R.; Ripperger, S. Membranes and modules for transmembrane distillation. J. Membr. Sci. 1988, 39, 25–42. [Google Scholar] [CrossRef]
- McGaughey, A.L.; Gustafson, R.D.; Childress, A.E. Effect of long-term operation on membrane surface characteristics and performance in membrane distillation. J. Membr. Sci. 2017, 543, 143–150. [Google Scholar] [CrossRef]
- Naidu, G.; Jeong, S.; Vigneswaran, S. Interaction of humic substances on fouling in membrane distillation for seawater desalination. Chem. Eng. J. 2015, 262, 946–957. [Google Scholar] [CrossRef]
- Intrchom, W.; Roy, S.; Humoud, M.S.; Mitra, S. Immobilization of Graphene Oxide on the Permeate Side of a Membrane Distillation Membrane to Enhance Flux. Membranes 2018, 8, 63. [Google Scholar] [CrossRef] [PubMed]
- Barbe, A.M.; Hogan, P.A.; Johnson, R.A. Surface morphology changes during initial usage of hydrophobic, microporous polypropylene membranes. J. Membr. Sci. 2000, 172, 149–156. [Google Scholar] [CrossRef]
- Duong, H.C.; Cooper, P.; Nelemans, B.; Cath, T.Y.; Nghiem, L.D. Optimising thermal efficiency of direct contact membrane distillation by brine recycling for small-scale seawater desalination. Desalination 2015, 374, 1–9. [Google Scholar] [CrossRef] [Green Version]
- Adham, S.; Hussain, A.; Matar, J.M.; Dores, R.; Janson, A. Application of membrane distillation for desalting brines from thermal desalination plants. Desalination 2013, 314, 101–108. [Google Scholar] [CrossRef]
- Gryta, M. Long-term performance of membrane distillation process. J. Membr. Sci. 2005, 265, 153–159. [Google Scholar] [CrossRef]


| Manufacture | Membrane | Contact Angle | Module | Area (cm2) |
|---|---|---|---|---|
| Membrana GmbH Germany | Accurel PP S6/2 | 98 | MK1 MK1B | 34.0 34.1 |
| PolyMem Poland | K1800 | 96 | MK2 | 33.5 |
| EuroSep Poland | EuroSep PP | 94 | MK3 | 34.2 |
| Ions | Na+ | Cl− | Mg2+ | Ca2+ | K+ | NO3− | SO42− |
|---|---|---|---|---|---|---|---|
| Lake water | 24 | 48 | 18 | 64 | 4.5 | 1.5 | 93 |
| Baltic brackish water | 2396 | 3088 | 278 | 135 | 84.5 | 11.1 | 460 |
| Parameter | Unit | Miedwie Lake | Baltic Brackish Water |
|---|---|---|---|
| Conductivity | μS/cm | 573 | 12,240 |
| TDS | mg/L | 392 | 6804 |
| Turbidity | NTU | 0.566 | 0.248 |
| pH | - | 7.62 | 7.46 |
| TOC | mg/L | 8.7 | 30.2 |
| IC | mg/L | 32.1 | 19.9 |
| Absorbance UV254 | cm−1 | 0.17 | 0.08 |
| SUVA | L/mg m | 1.95 | 0.26 |
| Membrane | Total Pore Area (m2) | Median Pore Diameter (μm) | Average Pore Diameter (μm) | Porosity (%) |
|---|---|---|---|---|
| Accurel PP S6/2 | 75.01 | 0.473 | 0.131 | 70.6 |
| K1800 | 74.99 | 0.466 | 0.147 | 69.8 |
| EuroSep PP | 74.03 | 0.471 | 0.129 | 67.1 |
© 2018 by the author. Licensee MDPI, Basel, Switzerland. This article is an open access article distributed under the terms and conditions of the Creative Commons Attribution (CC BY) license (http://creativecommons.org/licenses/by/4.0/).
Share and Cite
Gryta, M. Capillary Polypropylene Membranes for Membrane Distillation. Fibers 2019, 7, 1. https://doi.org/10.3390/fib7010001
Gryta M. Capillary Polypropylene Membranes for Membrane Distillation. Fibers. 2019; 7(1):1. https://doi.org/10.3390/fib7010001
Chicago/Turabian StyleGryta, Marek. 2019. "Capillary Polypropylene Membranes for Membrane Distillation" Fibers 7, no. 1: 1. https://doi.org/10.3390/fib7010001
APA StyleGryta, M. (2019). Capillary Polypropylene Membranes for Membrane Distillation. Fibers, 7(1), 1. https://doi.org/10.3390/fib7010001