Article

Characterization of a Y-Coupler and Its Impact on the Performance of Plastic Optical Fiber Links

1
GTF, Aragon Institute of Engineering Research (i3A), University of Zaragoza, María de Luna 1, E-50018 Zaragoza, Spain
2
Department of Engineering and Environmental Science, College of Staten Island, The City University of New York, Staten Island, NY 10314, USA
*
Author to whom correspondence should be addressed.
Fibers 2018, 6(4), 96; https://doi.org/10.3390/fib6040096
Submission received: 18 October 2018 / Revised: 14 November 2018 / Accepted: 28 November 2018 / Published: 10 December 2018
(This article belongs to the Special Issue Plastic Optical Fibers)

Abstract

:
Couplers and splitters are common devices in single-mode and multi-mode glass fibers applications, where they perform a variety of functions. However, when switching to plastic optical fibers (POFs), there is a shortage of commercial devices, which are usually custom-made. The problem with these devices is that modal power distribution in POFs is easily modified by spatial disturbances that produce a localized strong power transfer between modes, thus changing their transmission properties. In this work, a commercial Y-coupler designed for POFs is experimentally characterized. Measurements of its spectral, spatial and temporal characteristics have been performed, including insertion loss as a function of wavelength, angular power distribution, and frequency response. The obtained results show that this device has an equalizing effect over the power spatial distribution that reduces the fiber bandwidth, demonstrating the importance of considering the impact of this type of devices on the transmission properties of any POF system.

1. Introduction

In the last few years, plastic optical fibers (POFs) are penetrating and gaining interest in different communications scenarios, including home networks and avionics, where they exhibit competitive advantages over glass fibers. As a result, the need to design and manufacture POF-specific components, and particularly passive devices, arises. In this context, multi-port couplers are key elements to implement different layouts that require combining or splitting optical signals, whereas similar designs are needed for sensor applications and for power monitoring in network management and testing [1,2,3]. Thus, depending on their function, several coupler designs based on different technologies have been developed: waveguide plates, injection molding, fused-tapered, thermally bended/glued or misaligned fibers and beam-splitter cubes [4,5,6,7,8]. The main issue when these devices are introduced in a POF link is that they can modify the fiber modal power distribution, changing the transmission performance so that it is necessary to assess and quantify their impact [9].
The study presented here is focused on a particular three-port device that splits power asymmetrically. Its main application is power monitoring by enabling the system designer to obtain the optical power value at specific points of a communications link without affecting its operation. This device has been experimentally characterized through the measurement of spectral insertion loss, angular power distribution extracted from far-field patterns (FFPs) and frequency response. The paper is organized as follows. First, the device under consideration is presented and described. Next, the experimental set-ups adapted to POFs that have been used to obtain the spectral, spatial and temporal characteristics of the device are presented together with the corresponding measurements. Particularly, the effect of the device over the transmission properties of POF-based communications links of several lengths is analyzed. Finally, the conclusions of the work are drawn.

2. Methods and Results

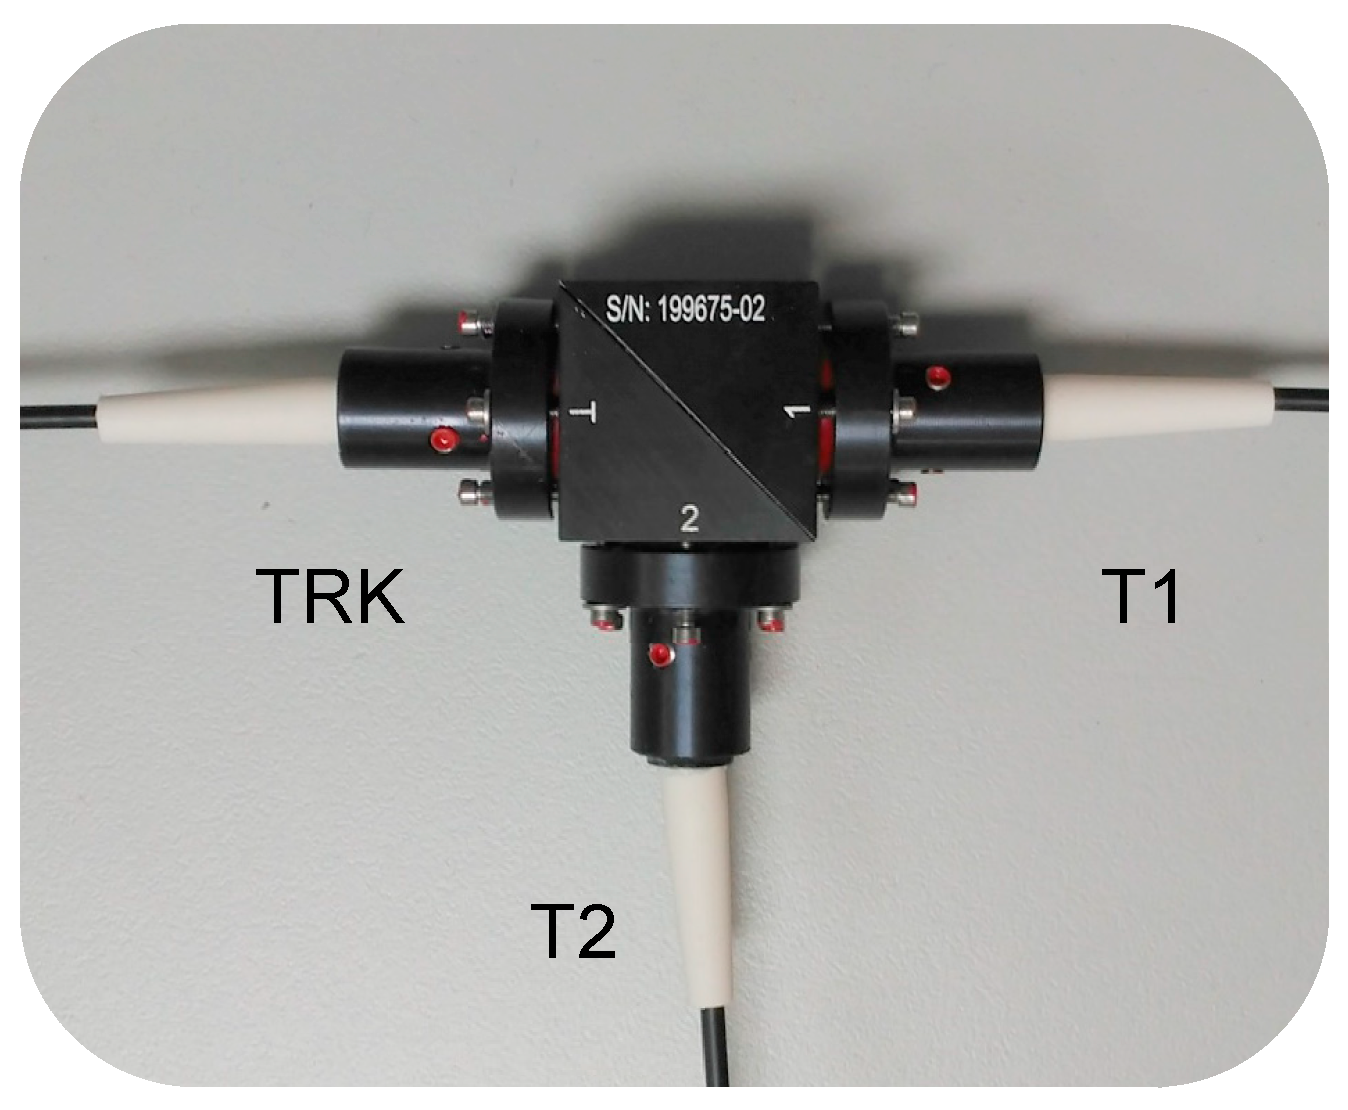
The device under test was a custom-made pigtail-style POF Y-coupler (FOBS-12P-111) from OZ Optics Ltd. (Ottawa, ON, Canada) designed to act as a “tap” that splits off a small portion of light [8]. The port interfaces consisted of three 1-m pigtails of step-index polymethyl-methacrilate (PMMA) 1-mm core fiber: GH4002 (GH in the following) from Mitsubishi Rayon Co., Ltd. (Tokio, Japan). Figure 1 shows a photograph of the actual device. Light from the input fiber (TRK port) is collimated by a lens, and then sent through a beam-splitter cube with a 95/5 split ratio (0.22/13 dB). The two resultant beams are then focused back into the output fibers at the T1 and T2 ports.

2.1. Spectral Attenuation Measurements

To measure the spectral attenuation, the method described in the Japanese Industrial Standard (JIS) was implemented [10]. 
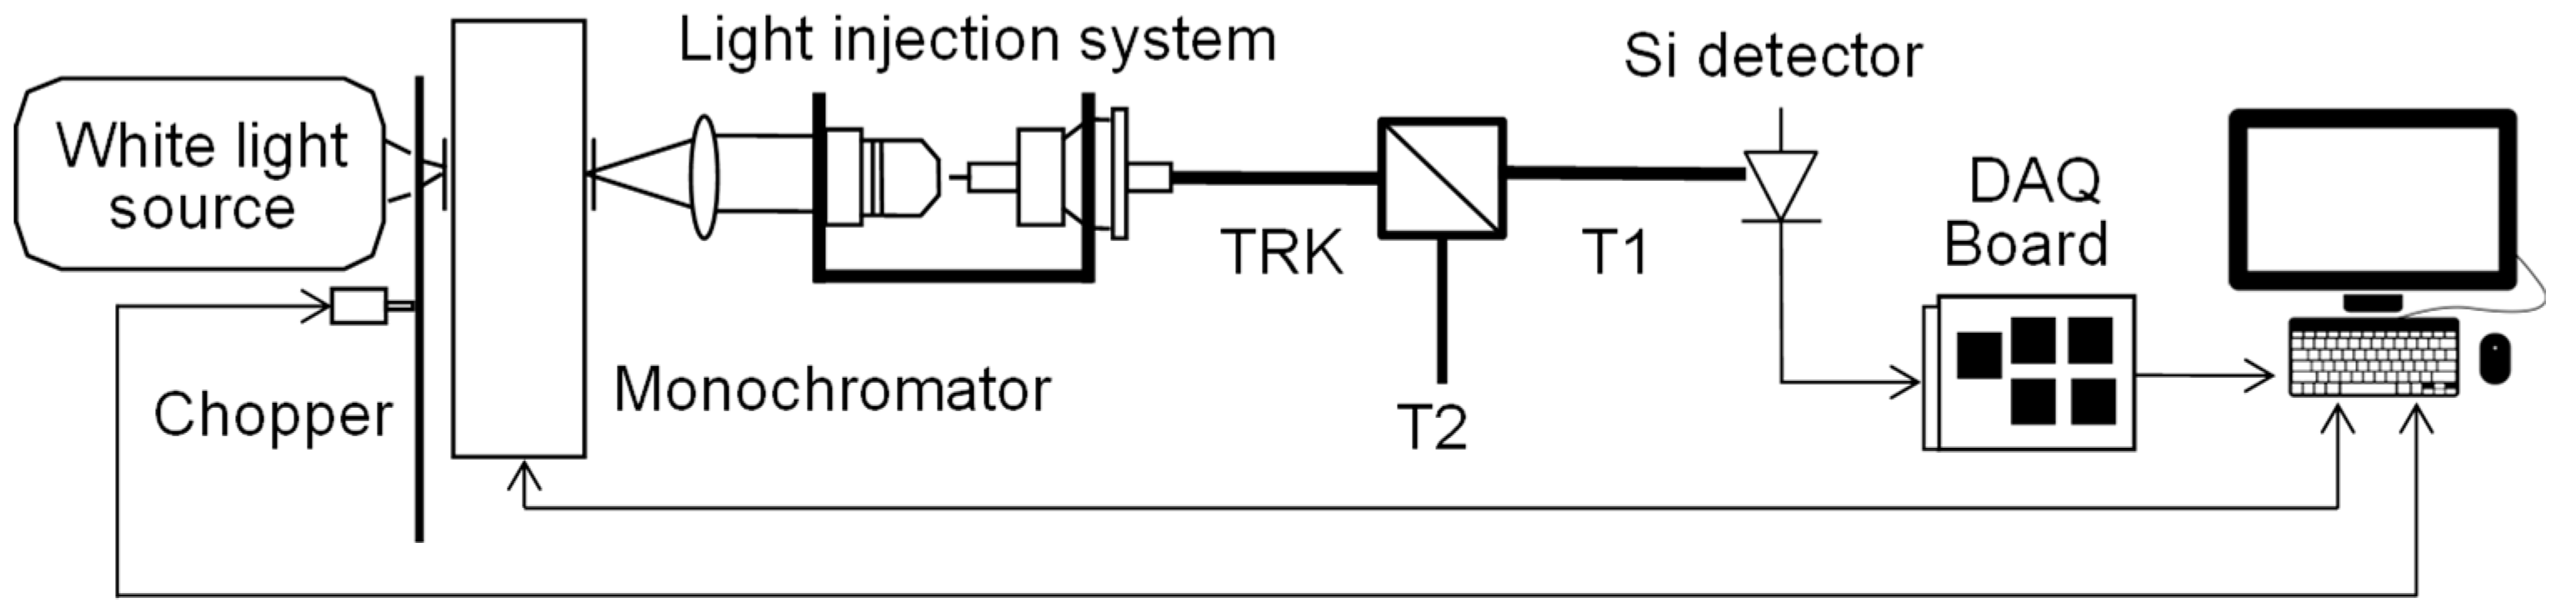
Figure 2 shows the experimental set-up that was based on a white light source followed by a monochromator to scan the wavelength with a built-in step-motor. This beam was focused onto the input end of the fiber to optimize light injection, while the other end was centered over a Si photodiode (FDS010 from Thorlabs, Newton, NJ, USA) of which the output signal was processed to reduce spurious noise using a software lock-in amplifier based on a data acquisition (DAQ) board and data processing by a computer.
Measurements of spectral attenuation were performed by obtaining the power transmitted by the Y-coupler as a function of wavelength when injecting light into the pigtail fiber at the common input port (TRK) and detecting the power both at output T1 (95%) and output T2 (5%). From these measurements, the spectral attenuation for both outputs, coupling ratio and excess loss were obtained, as explained in the following. A 2 m segment of GH fiber was used as a reference so that the average insertion loss (ILTRK,Ti) for each output port Ti was obtained as expressed in Equation (1).
I L T R K , T i ( λ ) = 10 log 10 ( P T R K ( λ ) / P T R K , T i ( λ ) ) ,
where PTRK(λ) is the power at the output of the reference fiber and PTRK,Ti(λ) is the power measured at the output of port Ti. The corresponding insertion losses for each output port are represented as a function of wavelength in 
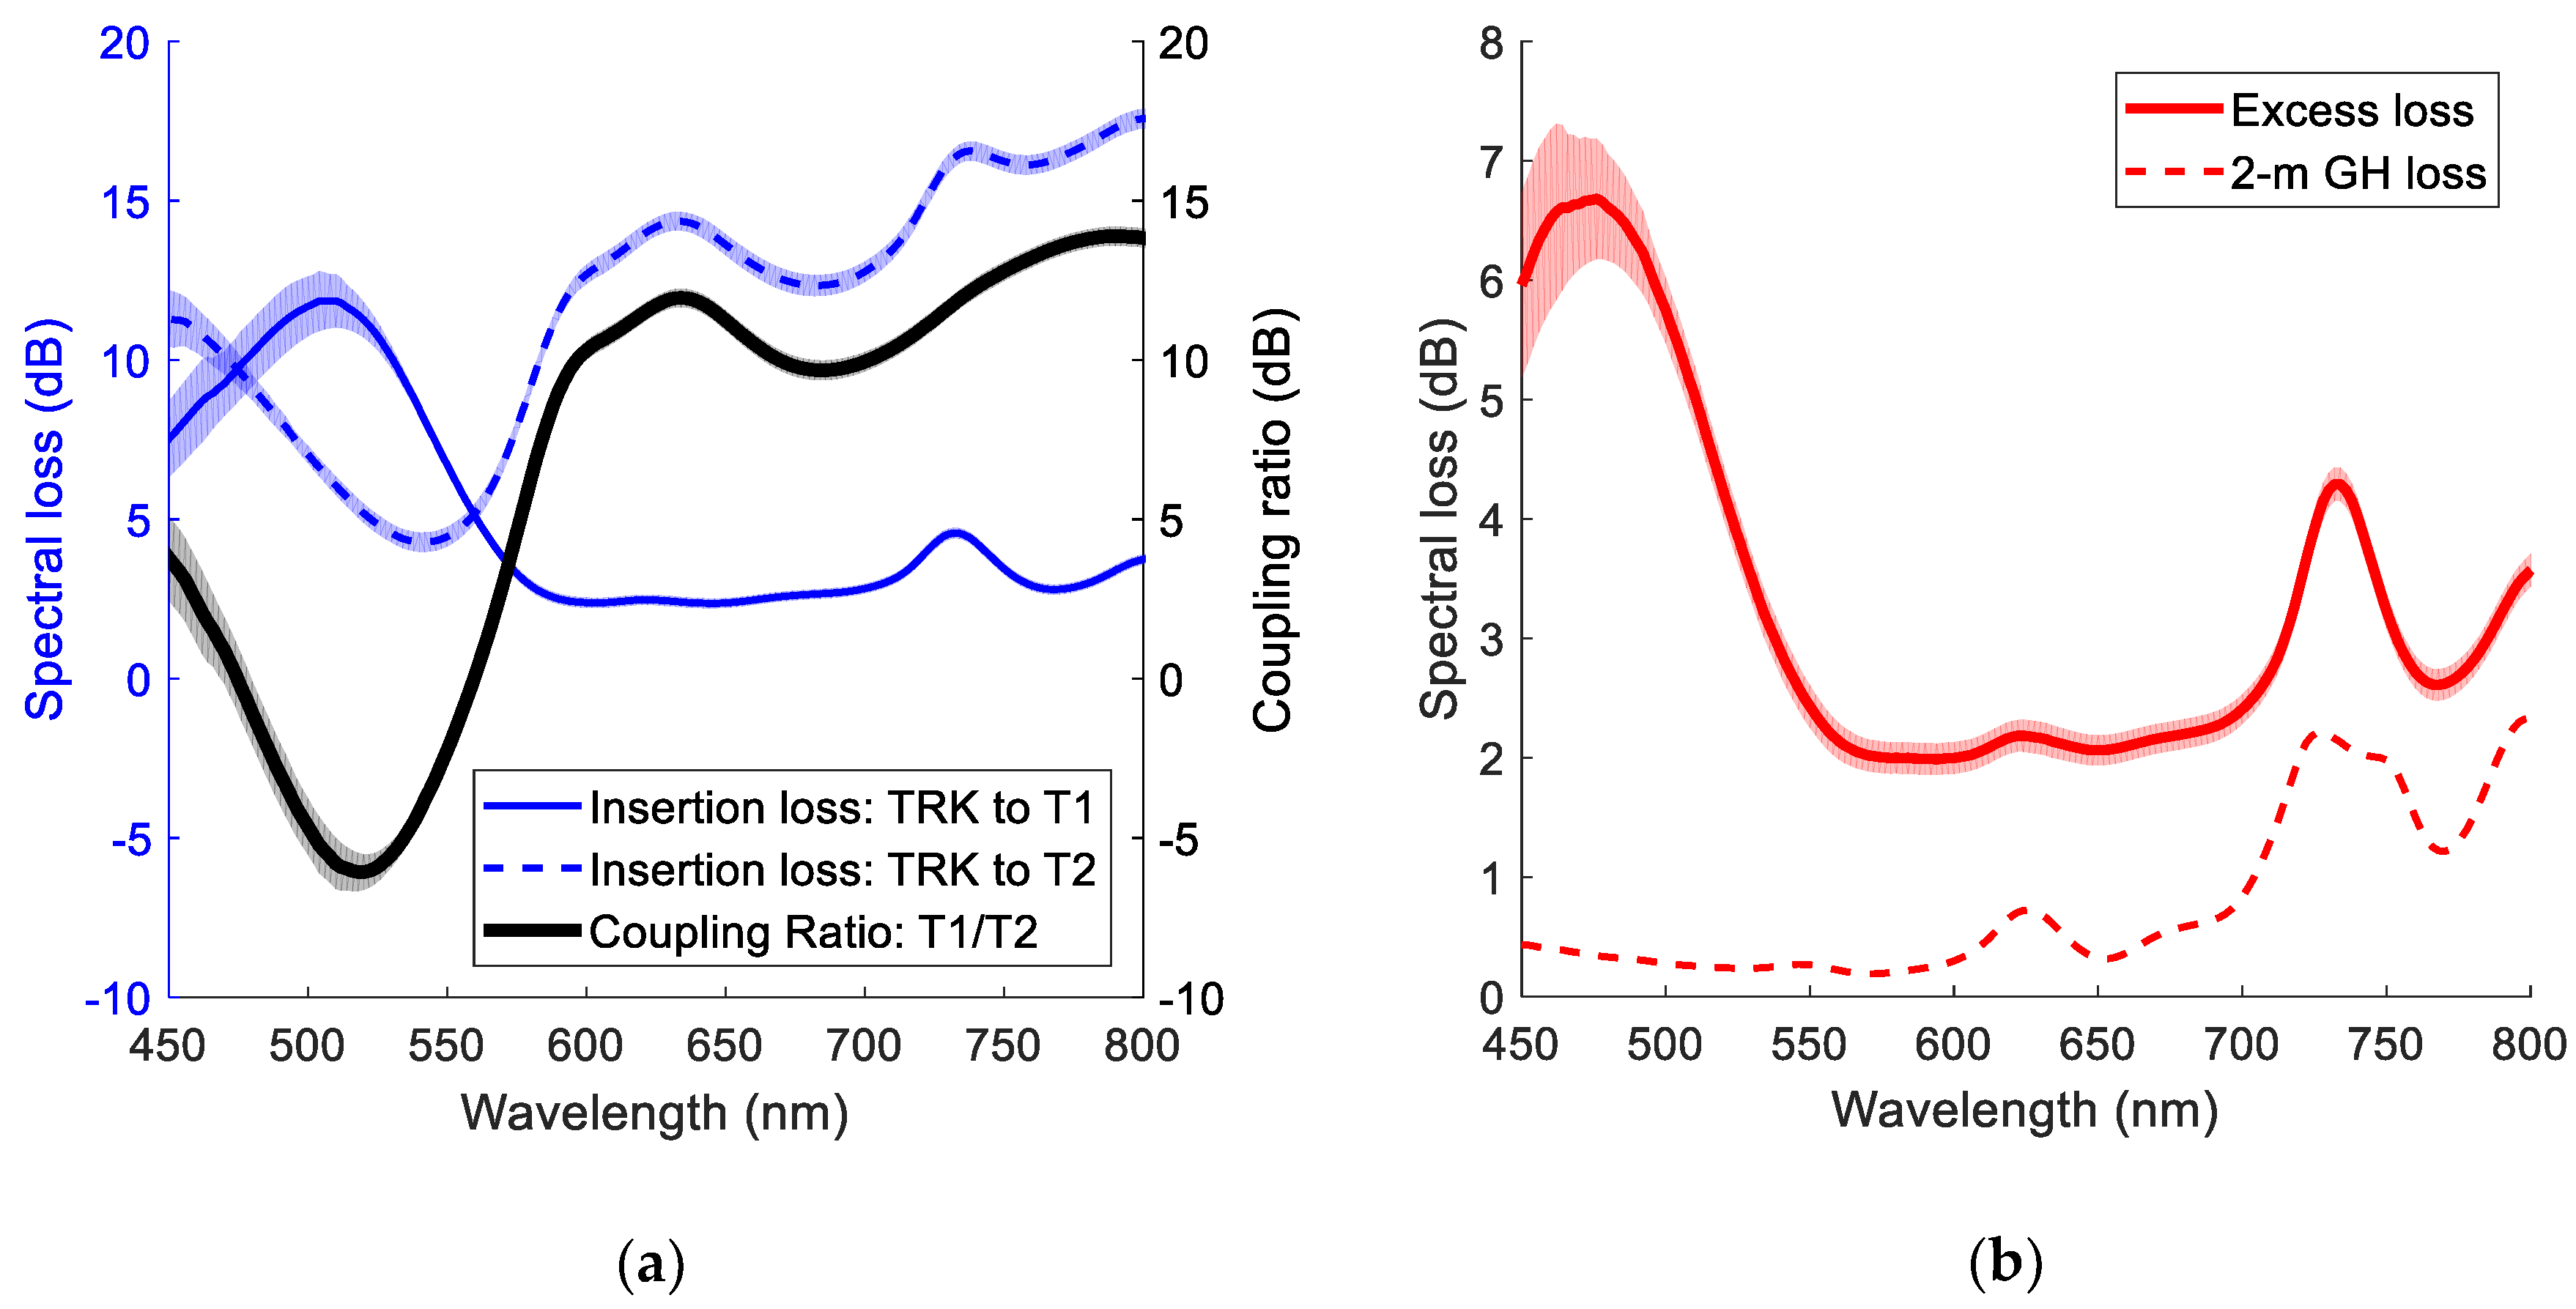
Figure 3a along with their standard deviations, shown as shadowed bands. The black line in the plot represents the coupling ratio as a function of wavelength (ILTRK,T2(λ) − ILTRK,T1(λ)). On the other hand, the excess loss (ELTRK) was obtained as Equation (2):
E L T R K ( λ )   =   10 log 10   ( P T R K ( λ )   P T R K , T 1 ( λ )   +   P T R K , T 2 ( λ ) )
Figure 3b shows the measured values that are represented along with the loss for a 2 m GH fiber to visualize the extra loss introduced by the optical components of the coupler.
As shown in Figure 3a, the splitting ratio values strongly fluctuate with wavelength in the range from −6 dB to 14 dB due to the transmission–reflection properties of the beam-splitter cube. At 650 nm, the measured split ratio is 11.25 dB, which agrees with the value given at this wavelength in the manufacturer’s datasheet. Although the excess loss also has steep variations in the visible spectrum, it is relatively flat from 560 to 690 nm where its value is close to its minimum of approximately 2 dB. Apart from the insertion losses that are represented in Figure 3b, the total loss introduced by the Y-coupler in a POF link should also include the insertion loss of the double connector needed to join the coupler to the fiber [11].

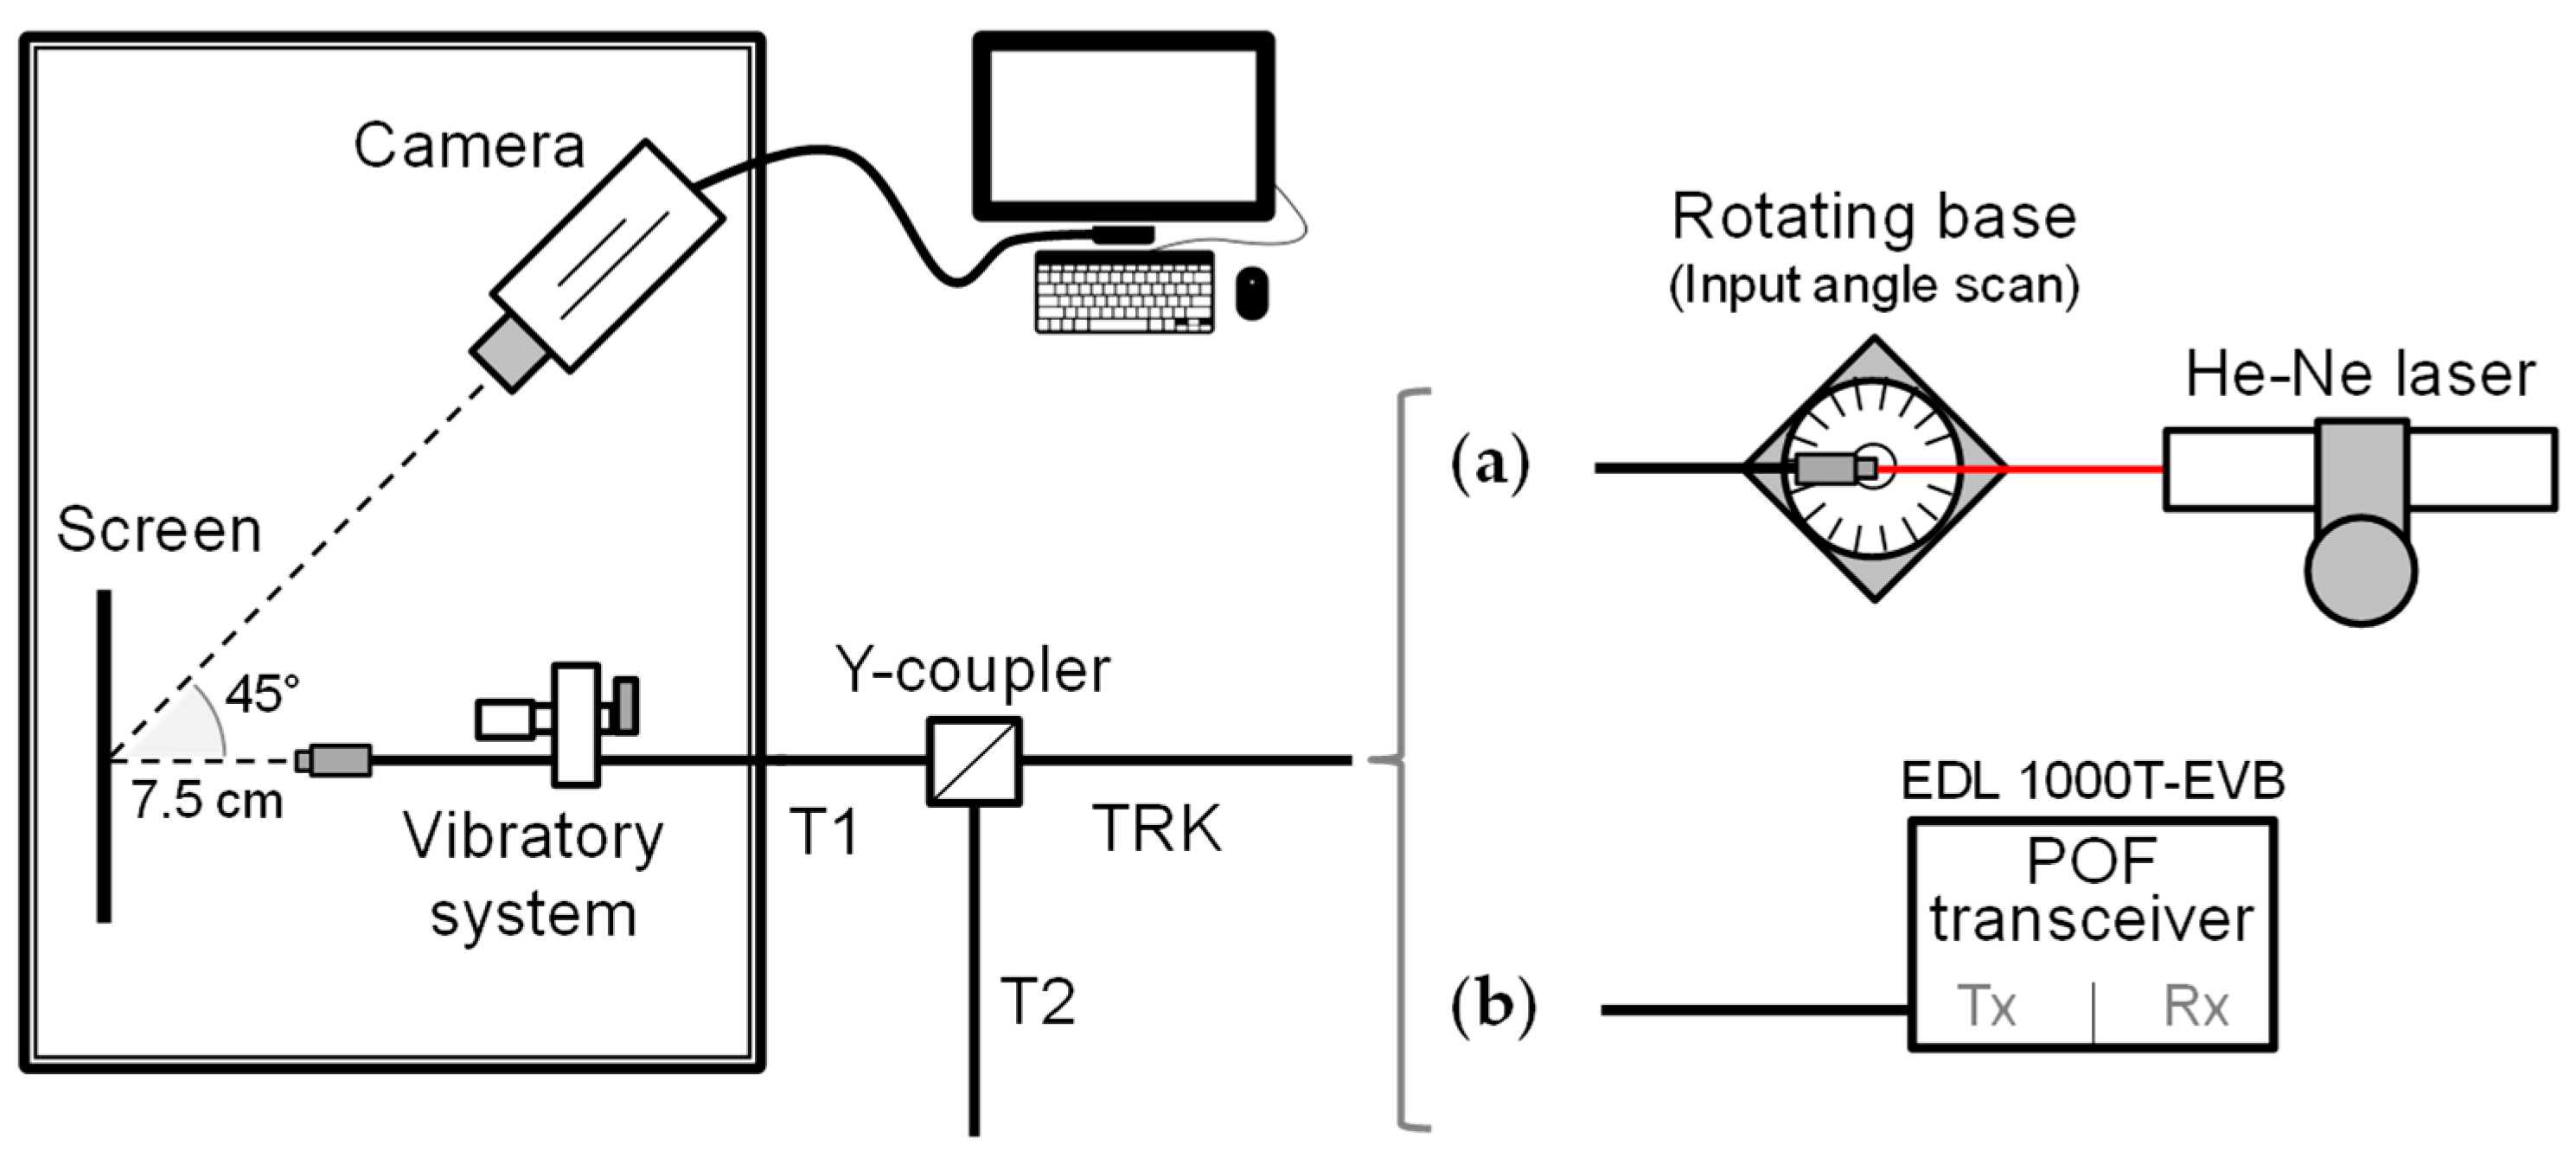
2.2. Measurements of Spatial Power Distribution

The impact of the Y-coupler over the spatial characteristics of the optical signal was experimentally assessed. For this purpose, the FFP at the output port T1 was obtained by recording the image reflected on a white screen placed opposite the fiber at 7.5 cm from its output end using a 12-bit monochrome cooled camera (QICAM FAST 1394CCD from QImaging, Burnaby, BC, Canada), which has been thoroughly described elsewhere [12]. The radial profile extracted from this pattern and expressed as a function of the propagation angle provides a good representation of the optical power distribution at the output of the fiber. Figure 4 shows the experimental set-up used for these measurements. Light was injected into the fiber pigtail of the TRK port while the output FFP from the fiber pigtail of port T1 was registered. At least 15 measurements of each condition were taken to assess variability, so that average results as well as standard deviations could be obtained. Two different sources were employed: a He-Ne laser working at 635 nm directly injected into the fiber (see Figure 4a) and the emitter side of a POF commercial transceiver for Gigabit Ethernet (EDL1000T EVB from FirecommsTM, Cork, Ireland) that is based on a vertical-cavity surface-emitting laser (VCSEL) at 665 nm and is provided with an Optolock® connector (see Figure 4b). Moreover, in order to have a more complete picture of the effects of the device over the spatial characteristics of the input signal, FFP measurements as a function of the launching angle were performed using a rotating base to control the relative angle between the fiber input and the light beam from the He-Ne laser (see Figure 4a). This procedure has been done before for characterization purposes of fibers and other POF-related passive devices [13,14].
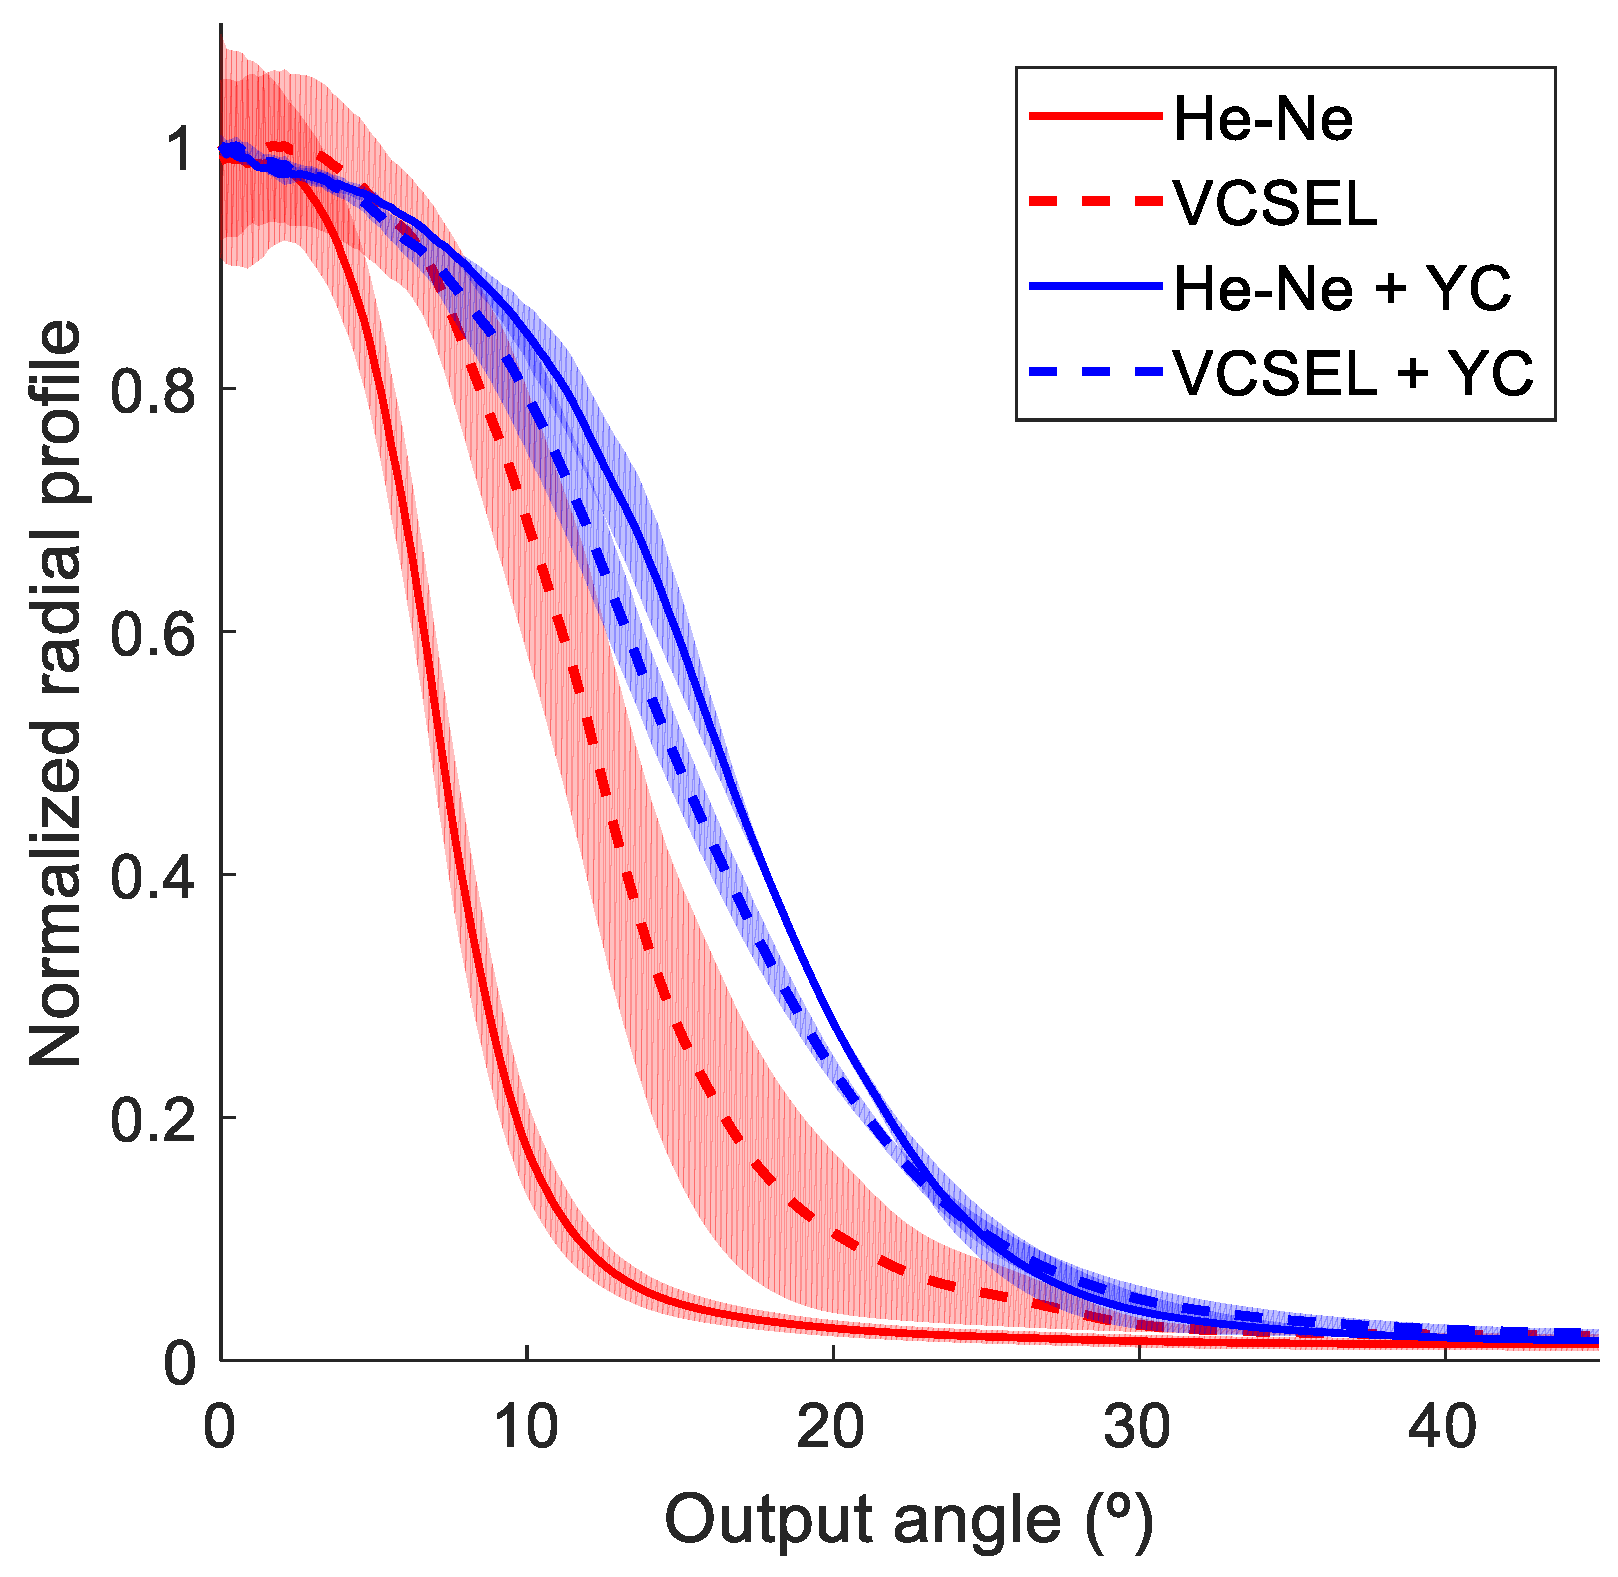
Figure 5 shows the results on normalized angular power distribution obtained for the two different light sources considered. Radial profiles extracted from FFP measurements for a GH fiber with a length of 2 m and for the Y-coupler are represented together, so that the changes introduced by this device can be observed. The mean and the standard deviation of the measurements were computed, and are shown in the plot as lines and patches, respectively.
As illustrated by the results, the overall effect of the Y-coupler is to widen the spatial distribution induced by mode coupling. In addition, the changes introduced to the shape of the power distribution produce output patterns that are very similar for both sources, as the reduced standard deviation for the measurements with the coupler also confirms. To have a more complete characterization, 
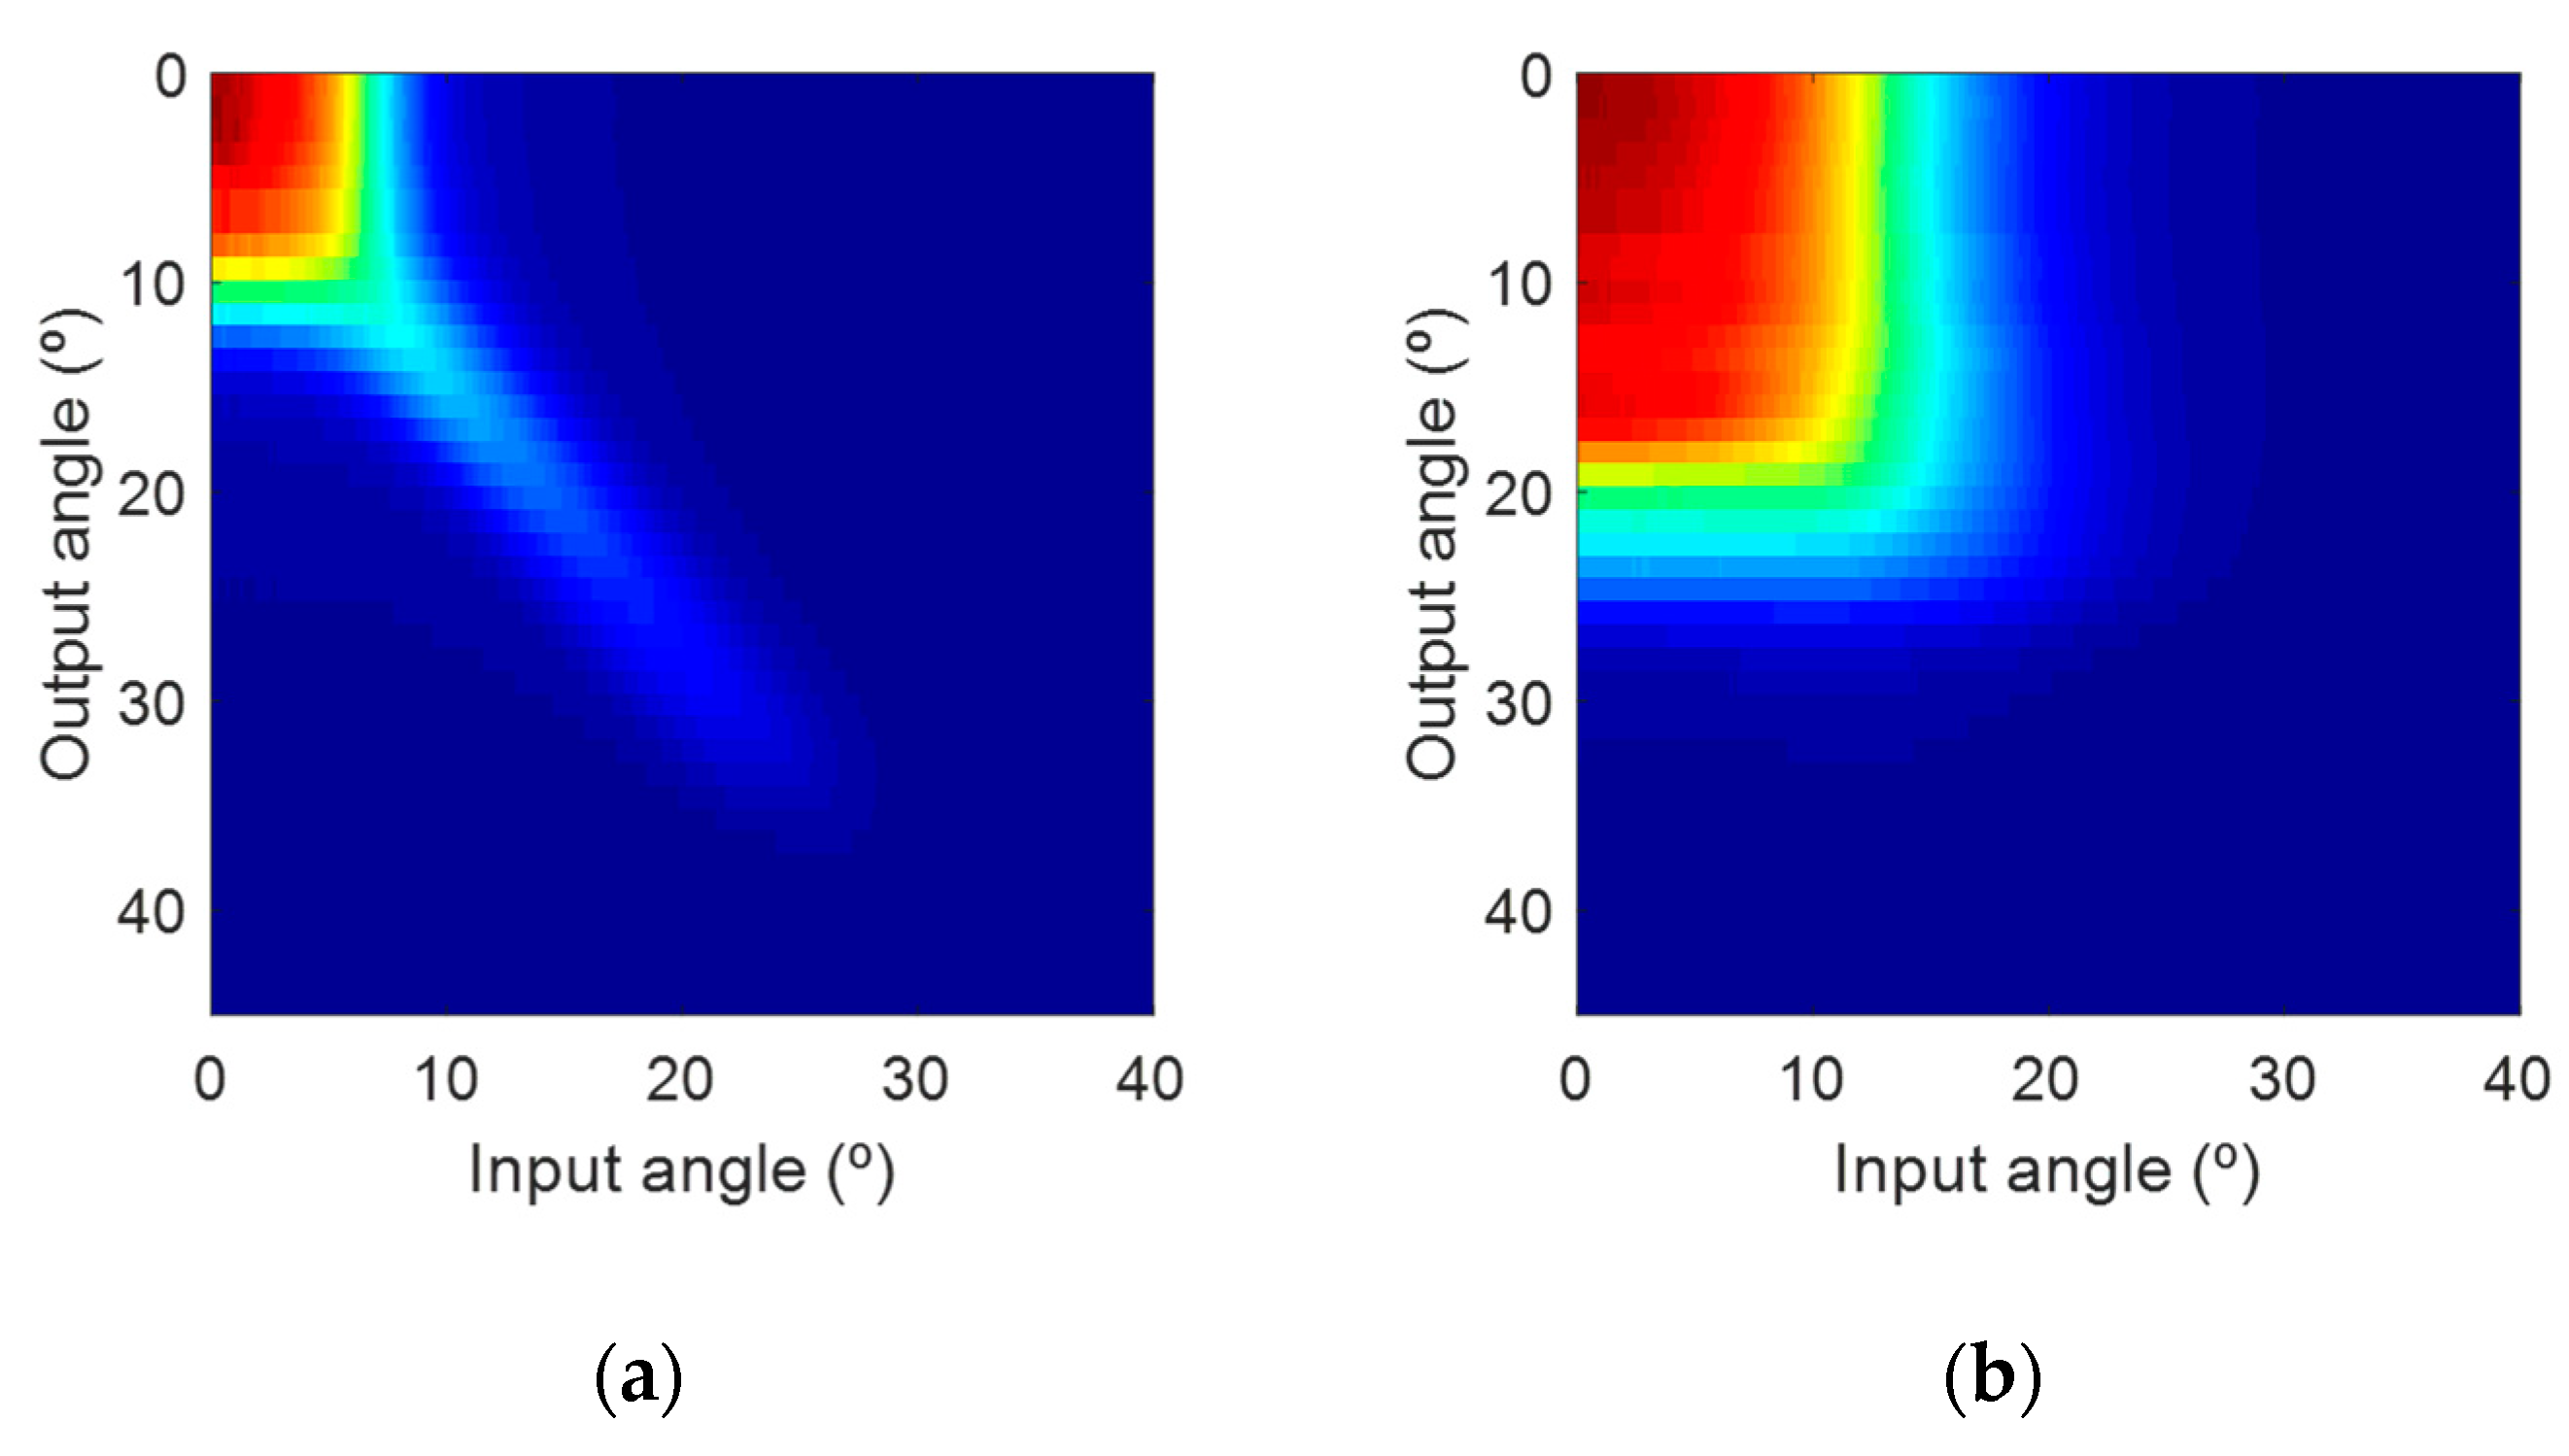
Figure 6 shows the output radial profiles as a function of the launching or input angle when scanning this parameter, as has been explained before and is depicted in Figure 4a.
Figure 6a represents the input–output power distribution for a 2 m GH fiber, while Figure 6b corresponds to the measurements using the Y-coupler. Both images are normalized to their respective maximum values. Again, the measurements reveal the broadening effect of the device, while they also demonstrate that this effect is independent of the launching angle.

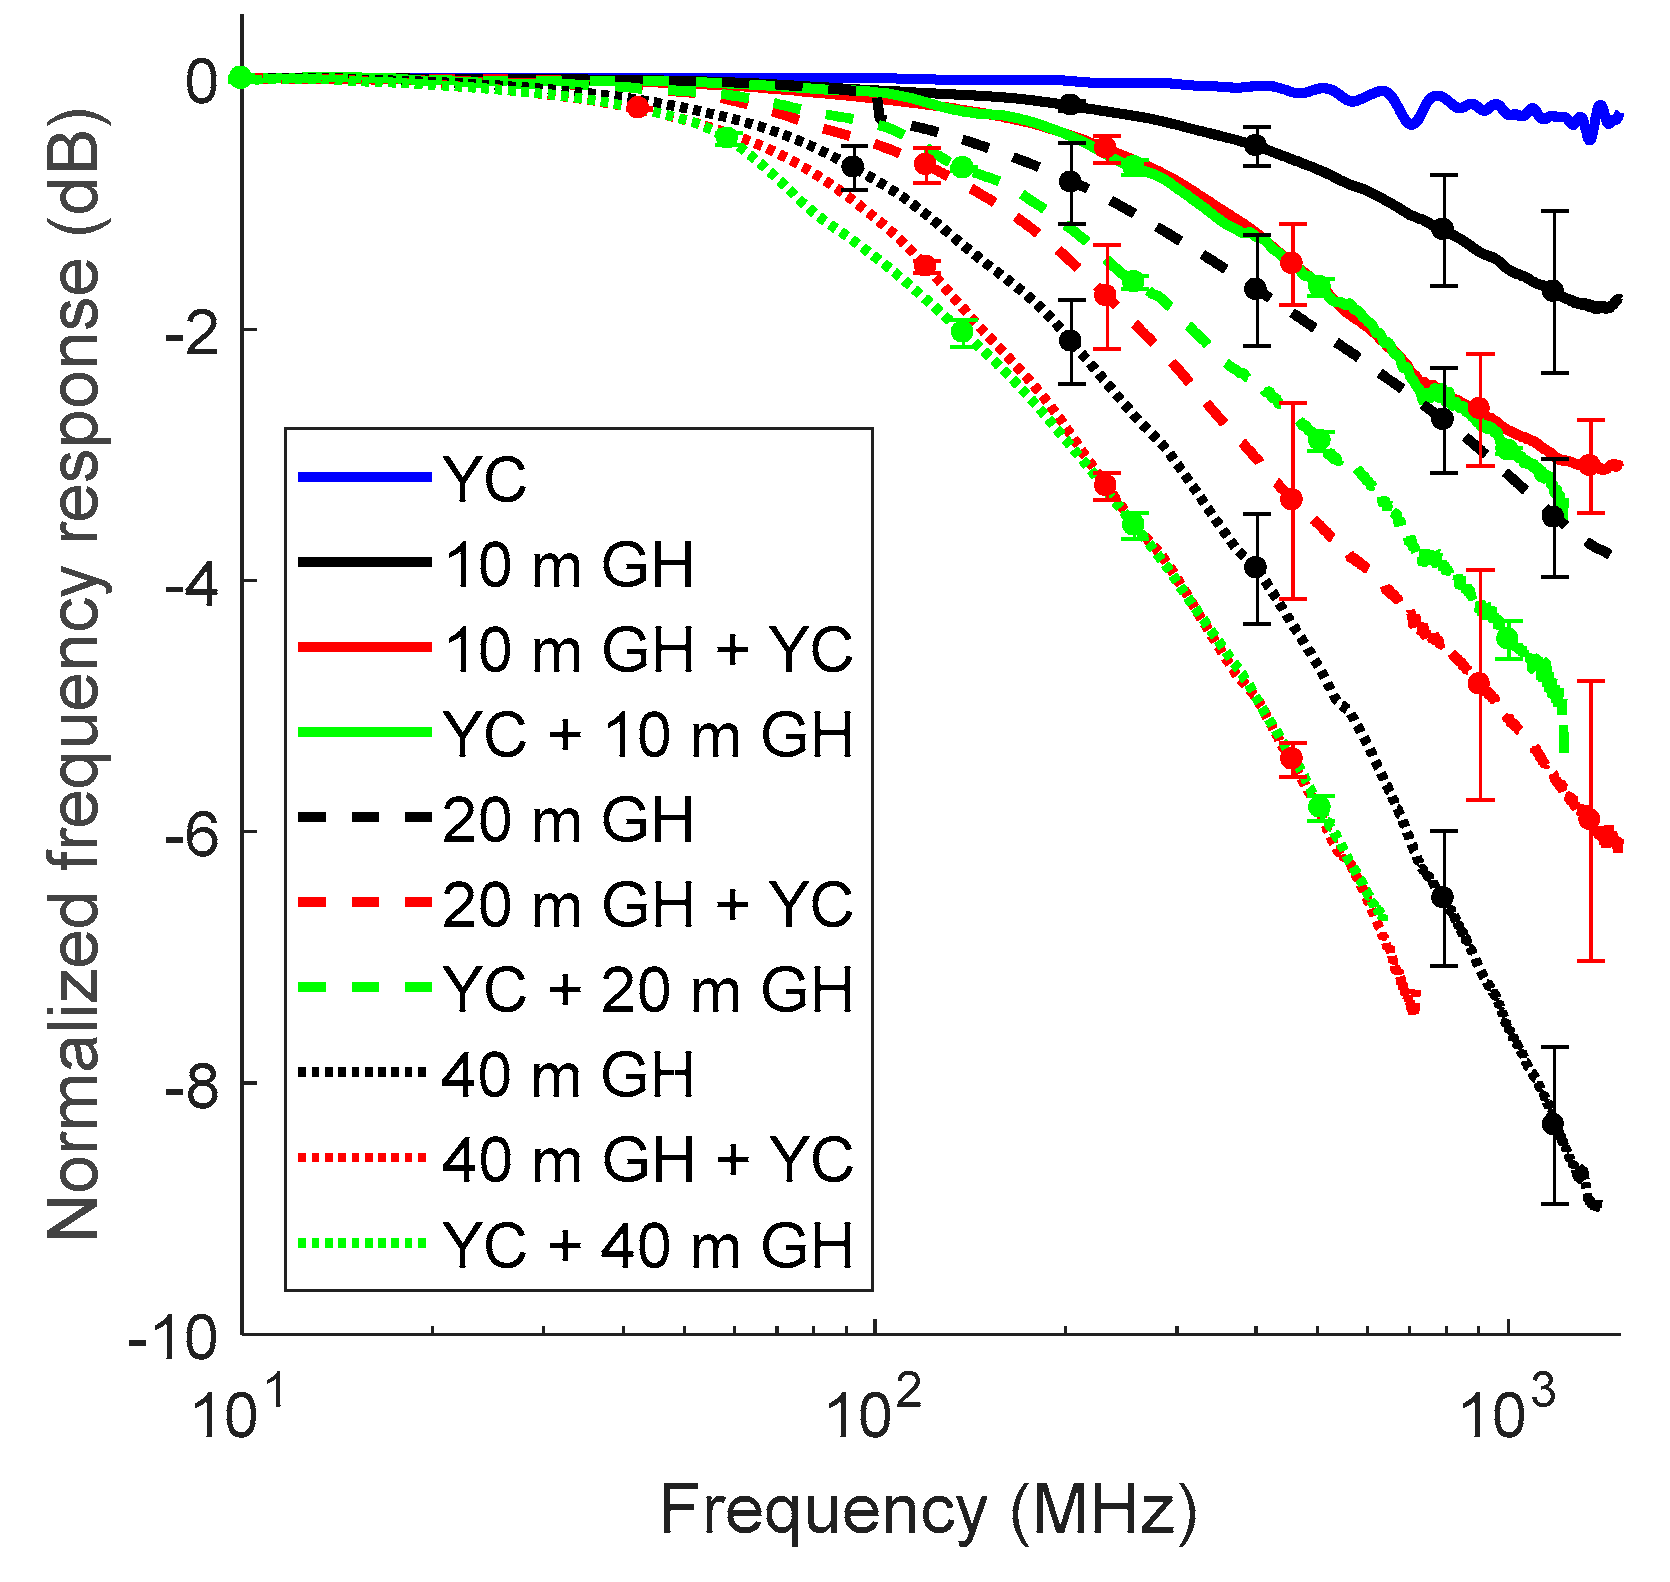
2.3. Frequency Response Measurements

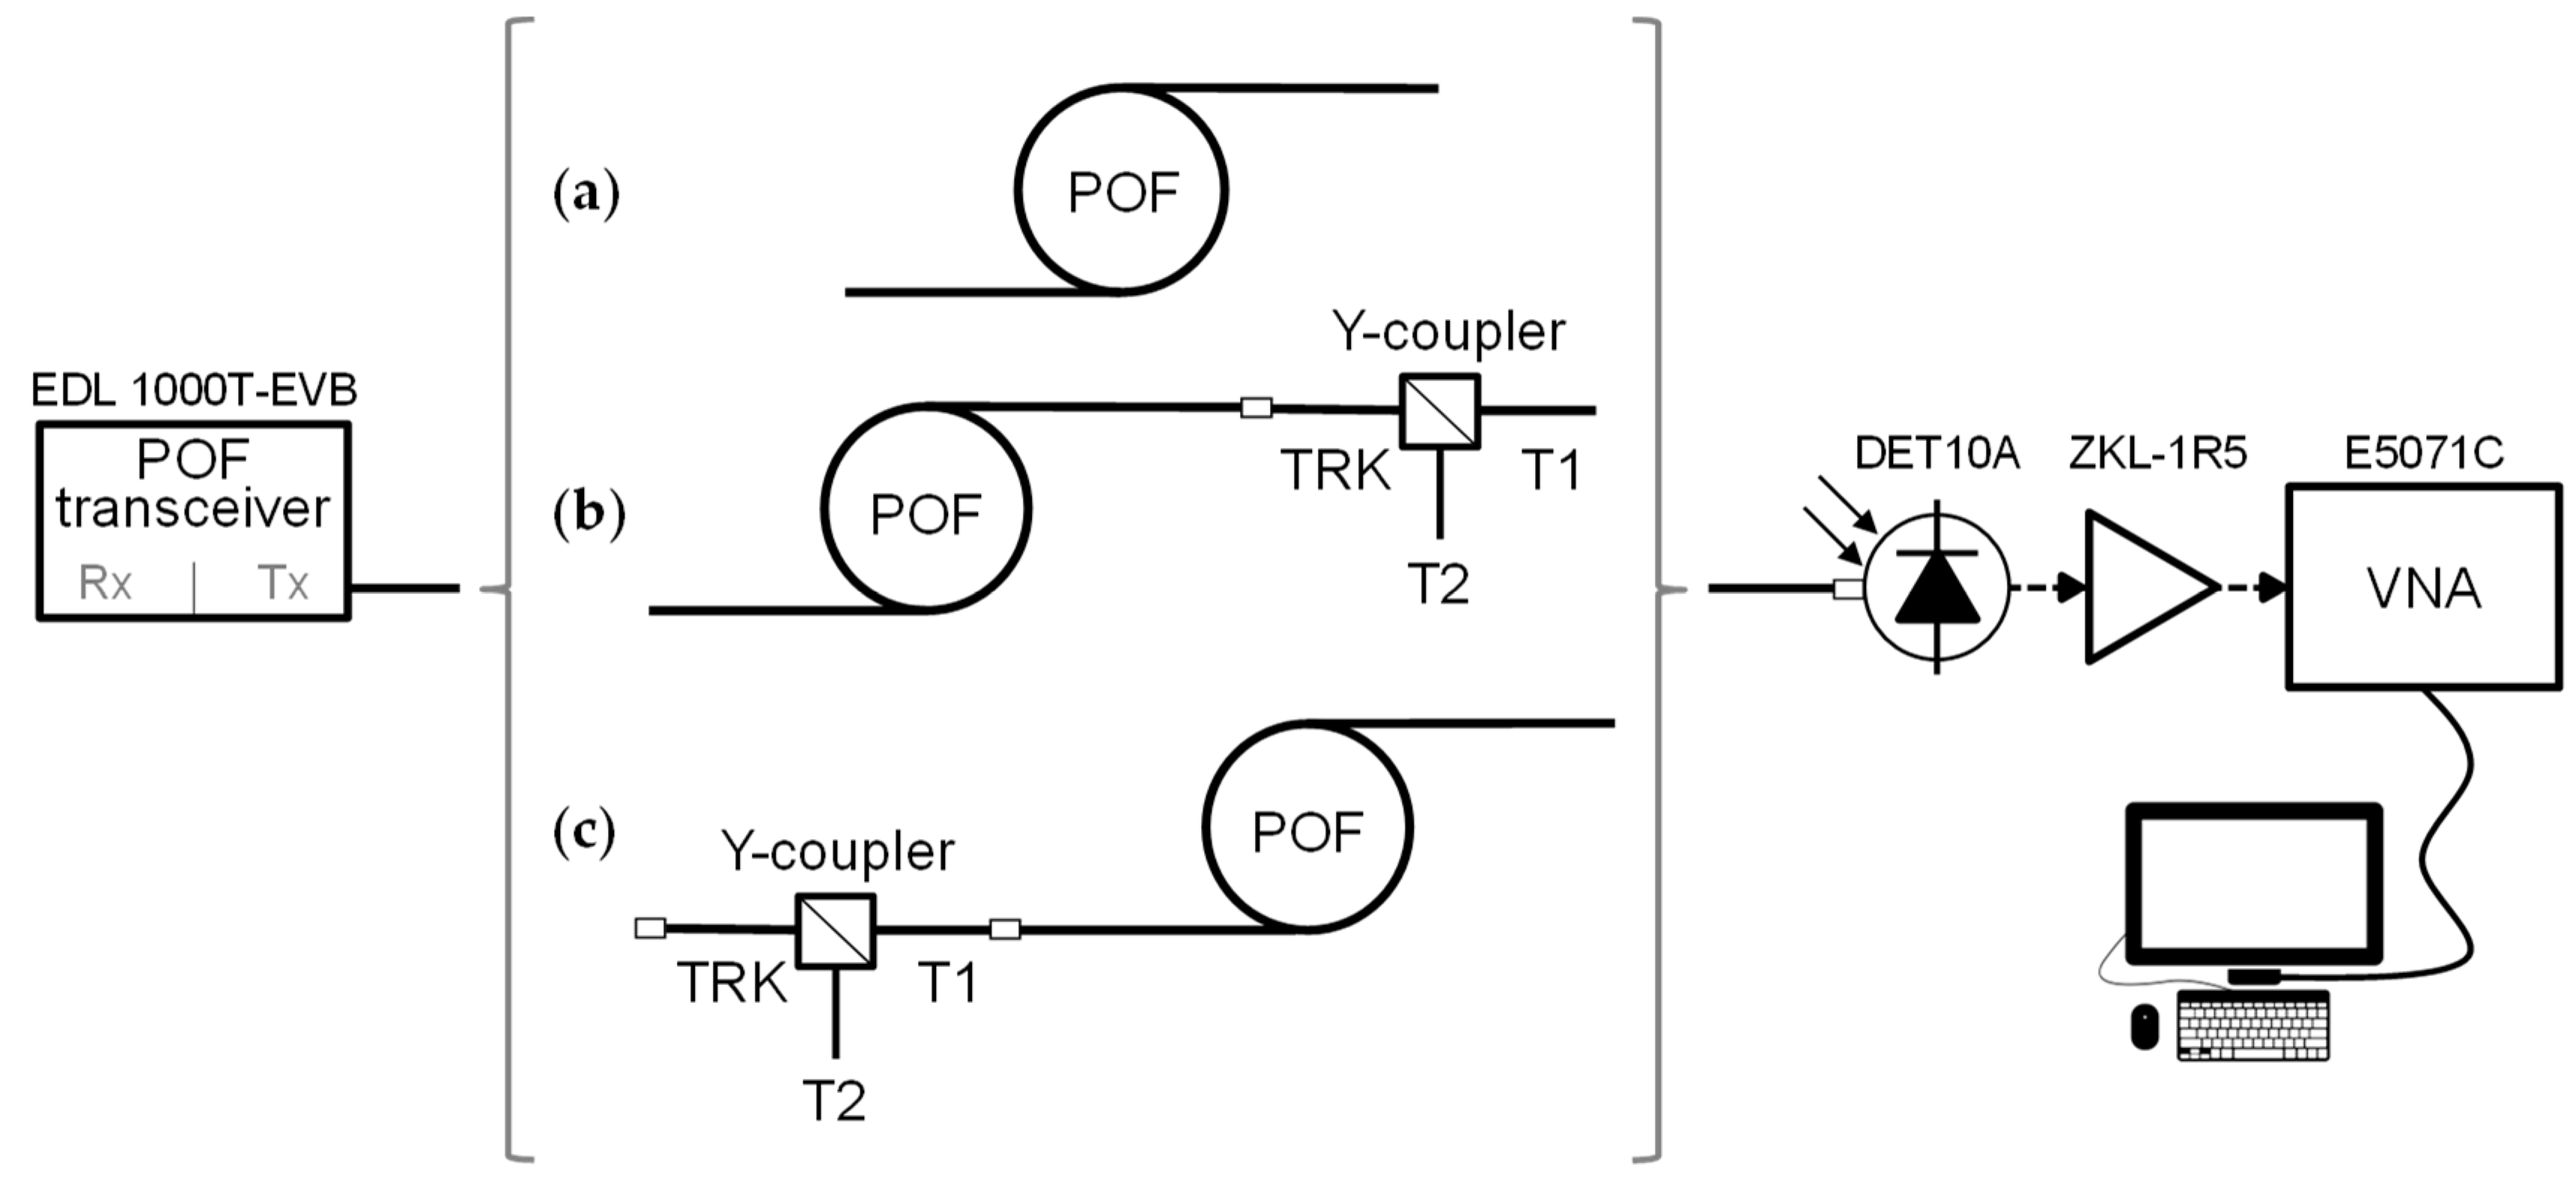
Measurements of frequency response were performed using a set-up based on a vector network analyzer (VNA E5071C from Agilent, Santa Rosa, CA, USA), as shown in Figure 7. For this purpose, an optical link was built, modulating directly the emitter in the EDL1000T EVB transceiver. The receiver was based on a 0.8 mm2 Si photodetector (DET10A from Thorlabs, Newton, NJ, USA) followed by an electrical amplifier (ZKL-1R5 from Mini Circuits, Brooklyn, NY, USA) [15].
In order to disregard the effect of the measuring system on the results, the frequency response of a 20 cm fiber segment was first measured to serve as a reference that was used to normalize all subsequent measurements. The response for the Y-coupler was obtained by connecting the TRK pigtail to the optical source through the Optolock® and the port T1 to the detector through an ST connector. Since the coupler is a passive device, it introduces by itself no effect on the frequency response. However, when it is placed within a POF-based communications link, after or before a fiber segment, it will change the optical power distribution that reaches the detector, and thus modify the fiber frequency response. Therefore, for evaluating this effect, several frequency response measurements were performed, taking into account different link lengths and varying the position of the coupler (near the emitter or the receiver), as is shown inside the brackets of Figure 7. In particular, the analysis was focused on GH fibers of three different lengths: 10, 20 and 40 m that were taken from the same reel and tested avoiding small curvatures. First, the frequency responses of the links without the Y-coupler (see Figure 7a) were measured by connecting each fiber end directly to the emitter and the receiver and obtaining the normalized frequency responses that are shown in Figure 8 (the black solid line is for the 10 m fiber, the black dashed line is for the 20 m fiber and the black dotted line is for the 40 m fiber).
Then, the Y-coupler was introduced at the output of the fiber by using a VersaLink (VL) double connector to join the TRK port to the fiber output end and inserting the T1 pigtail of the Y-coupler into the receiver with an ST connector (see Figure 7b). These results are shown by red lines (the solid, dashed and dotted lines for the three fiber lengths) in Figure 8. Another useful configuration was also tested by placing the Y-coupler directly after the emitter and connecting it to the TRK port, as shown in Figure 7c. The fibers with different lengths were then connected to the T1 pigtail using the VL connector. This last set of measurements is shown in green in Figure 8. To complete the results, the blue line represents the normalized frequency response of the coupler itself. The error bars show the standard deviations of the measurements as the frequency responses plotted in the graph were obtained by computing the average of at least 10 measurements. The relatively large bars reflect the impact of the changes in the connections needed for each particular measurement and are added to the high variability usually found for POFs [16].
Results show that the presence of the Y-coupler downshifts the fiber frequency response, as measurements with the coupler exhibit lower bandwidth values than those obtained with the fiber only. This effect can be explained by taking into account the changes in spatial power distribution introduced by the coupler. As it has been demonstrated, the fiber modal distribution at the output of the Y-coupler is quite independent of the input pattern. Moreover, the radial profile measurements presented reveal that the effect of the device is to widen the angular power distribution, increasing power particularly at middle angles (15°–30°). Thus, when the Y-coupler is placed at the emitter, it transforms the optical source into an over-filled input power distribution that deteriorates the frequency response of the link. On the other hand, when the Y-coupler is near the receiver, it acts as a mode mixer that also has the same degrading effect.

3. Conclusions

In this paper, a detailed characterization of a commercial Y-coupler designed for the POF has been presented. The measured average split ratio is 10.72 ± 0.81 dB in the wavelength region from 600 to 700 nm with a maximum excess loss of 2.41 dB. Although the insertion loss of the Y-coupler for port T1 is relatively low, the presence of the device in a POF-based communications link degrades considerably the fiber frequency response, regardless of its position. This degradation can be explained by the equalizing effect of the Y-coupler over the power distribution. In fact, the changes imposed by the coupler over the modal distribution preclude its use in an experimental set-up designed to obtain the actual value of any fiber property. However, these devices can still be used for power monitoring purposes in comparative characterization measurements, provided their impact is carefully considered.

Author Contributions

Conceptualization, A.L., M.Á.L., J.M., N.A., X.J. and D.R.; formal analysis, A.L., M.Á.L. and J.M.; investigation, A.L. and M.Á.L.; methodology, A.L., M.Á.L. and J.M.; resources, N.A., X.J. and D.R.; visualization, A.L. and J.M.; writing of the original draft, A.L. and M.Á.L.; writing of review and editing, A.L., M.Á.L., J.M., N.A., X.J. and D.R.

Funding

This work has been funded by the Fondo Europeo de Desarrollo Regional (FEDER) and by the Spanish Ministerio de Economía y Competitividad under project TEC2015-63826-C3-3-R (MINECO/FEDER). This work was also partially supported by the Diputación General de Aragón under grant T20_17R.

Conflicts of Interest

The authors declare no conflict of interest.

References

  1. Yeong, Y.; Bae, S.; Oh, K. All fiber NxN fused tapered plastic optical fiber (POF) power splitters for photodynamic therapy applications. Curr. Appl. Phys. 2009, 9, 273–275. [Google Scholar]
  2. Richards, D.; Antoniades, N.; Truong, T.K. Performance modeling and analytical verifications of POF transmissive star coupler for avionics system applications. In Proceedings of the IEEE Avionics, Fiber-Optics and Photonics Technology Conference, San Diego, CA, USA, 4–6 October 2011; pp. 77–78. [Google Scholar]
  3. Ehsan, A.; Shaari, S.; Abd-Rahman, M.K. Acrylic-based asymmetric and variable coupling ratio Y-branch plastic optical fiber coupler. Opt. Rev. 2012, 19, 13–19. [Google Scholar] [CrossRef]
  4. Kruszewski, J.; Borecki, M.; Beblowska, M. Design and performance of the asymmetrical coupler of plastic optical fibers. In Proceedings of the Lightguides and their Applications II, Krasnobród, Poland, 9–11 October 2003. [Google Scholar]
  5. Kim, K.T.; Han, B.J. High-Performance Plastic Optical Fiber Coupler Based on Heating and Pressing. IEEE Photon. Technol. Lett. 2011, 23, 1848–1850. [Google Scholar] [CrossRef]
  6. Haupt, M.; Fischer, U.H.P. Injection Molded Coupler for POF-Systems. In Proceedings of the 21st International Conference of Plastic Optical Fibers, Atlanta, GA, USA, 10–12 September 2012; pp. 110–115. [Google Scholar]
  7. Mohamed Kassim, N.S.; Abd-Rahman, M.K. High-resolution tunable POF multimode power splitter. Opt. Commun. 2017, 400, 136–143. [Google Scholar] [CrossRef]
  8. Oz Optics Ltd. Fiber Optic Beam Splitters. Available online: https://www.ozoptics.com/ALLNEW_PDF/DTS0095.pdf (accessed on 12 June 2018).
  9. López, A.; Losada, M.A.; Mateo, J.; Antoniades, N.; Jiang, X.; Richards, D. Characterization of a Y-coupler for POF. In Proceedings of the 26th International Conference on Plastic Optical Fibers, Aveiro, Portugal, 13–15 September 2017. [Google Scholar]
  10. Japanese Standards Association. Test Methods for Attenuation of All Plastic Multimode Optical Fibres; JIS C6861; Japanese Standards Association: Tokyo, Japan, 1992. [Google Scholar]
  11. Richards, D.H.; Losada, M.A.; Antoniades, N.; López, A.; Mateo, J.; Jiang, X.; Madamopoulos, N. Methodology for Engineering SI-POF and Connectors in an Avionics System. J. Lightw. Technol. 2013, 31, 468–475. [Google Scholar] [CrossRef]
  12. Mateo, J.; Losada, M.A.; Garcés, I. Global characterization of optical power propagation in step-index plastic optical fibres. Opt. Express 2006, 14, 9028–9035. [Google Scholar] [CrossRef] [PubMed]
  13. Losada, M.A.; Mateo, J.; Martínez-Muro, J.J. Assessment of the impact of localized disturbances on SI-POF transmission using a matrix propagation model. J. Opt. 2011, 13, 055406. [Google Scholar] [CrossRef]
  14. Losada, M.A.; López, A.; Mateo, J. Attenuation and diffusion produced by small-radius curvatures in POFs. Opt. Express 2016, 24, 15710–15720. [Google Scholar] [CrossRef] [PubMed]
  15. López, A.; Ramón, S.; Chueca, M.; Losada, M.A.; Domínguez-Chapman, F.A.; Mateo, J. Experimental Characterization of Transmission Properties in Multi-Core Plastic Optical Fibers. In Proceedings of the 18th International Conference on Transparent Optical Networks, Trento, Italy, 10–14 July 2016. [Google Scholar]
  16. López, A.; Losada, M.A.; Mateo, J.; Zubia, J. On the Variability of Launching and Detection in POF Transmission Systems. In Proceedings of the 20th International Conference on Transparent Optical Networks, Bucharest, Romania, 1–5 July 2018. [Google Scholar]
Figure 1. Custom-made pigtail-style Y-coupler designed for plastic optical fibers. The three ports are labeled as TRK (common port), T1 (95% of output power) and T2 (5% of output power), respectively.
Fibers 06 00096 g001
Figure 2. Experimental set-up to measure spectral attenuation.
Fibers 06 00096 g002
Figure 3. Y-coupler spectral loss measurements: (a) insertion losses for output ports T1 and T2, and coupling ratio; (b) total excess loss and its comparison with fiber loss.
Fibers 06 00096 g003
Figure 4. Experimental set-up to measure far-field patterns: (a) measurements as a function of the launching angle; (b) measurements using the optical source of a commercial transceiver.
Fibers 06 00096 g004
Figure 5. Radial profiles from far-field patterns for two different optical sources at the output of 2 m GH4002 (GH) fiber (red lines) and at the output of the Y-coupler (blue lines).
Fibers 06 00096 g005
Figure 6. Input–output optical power spatial distributions obtained from far-field pattern scans: (a) 2 m GH fiber; (b) Y-coupler.
Fibers 06 00096 g006
Figure 7. Experimental set-up to measure frequency response: (a) measurements of fiber frequency response; (b) measurements with the Y-coupler at the receiver end; (c) measurements with the Y-coupler at the transmitter end.
Fibers 06 00096 g007
Figure 8. Normalized frequency responses for the Y-coupler (blue), GH-fiber segments of different lengths (black) and several link configurations (i.e., the coupler at the receiver end (red), and the coupler at the emitter end (green)).
Fibers 06 00096 g008

