3.1. Mapping of Storage Modulus across the Interphase Region
Two polymer blocks, 5 × 13 × 25 mm
3, each with 15 unidirectional fibers (mean diameter 19 µm) embedded in polyester resin, were fabricated using unsized and commercially sized GFs to examine the interphase region with Modulus Mapping. The commercial sizing based on silane coupling agents was designated by the GF manufacturer for GF/polyester composites. After polishing, the metallographic specimen with GFs placed normally to the surface was scanned in a 3 × 3 µm
2 area using a cube corner indenter with a radius of 40 nm. The storage modulus across the fiber/polymer interface for the unsized GF is shown in
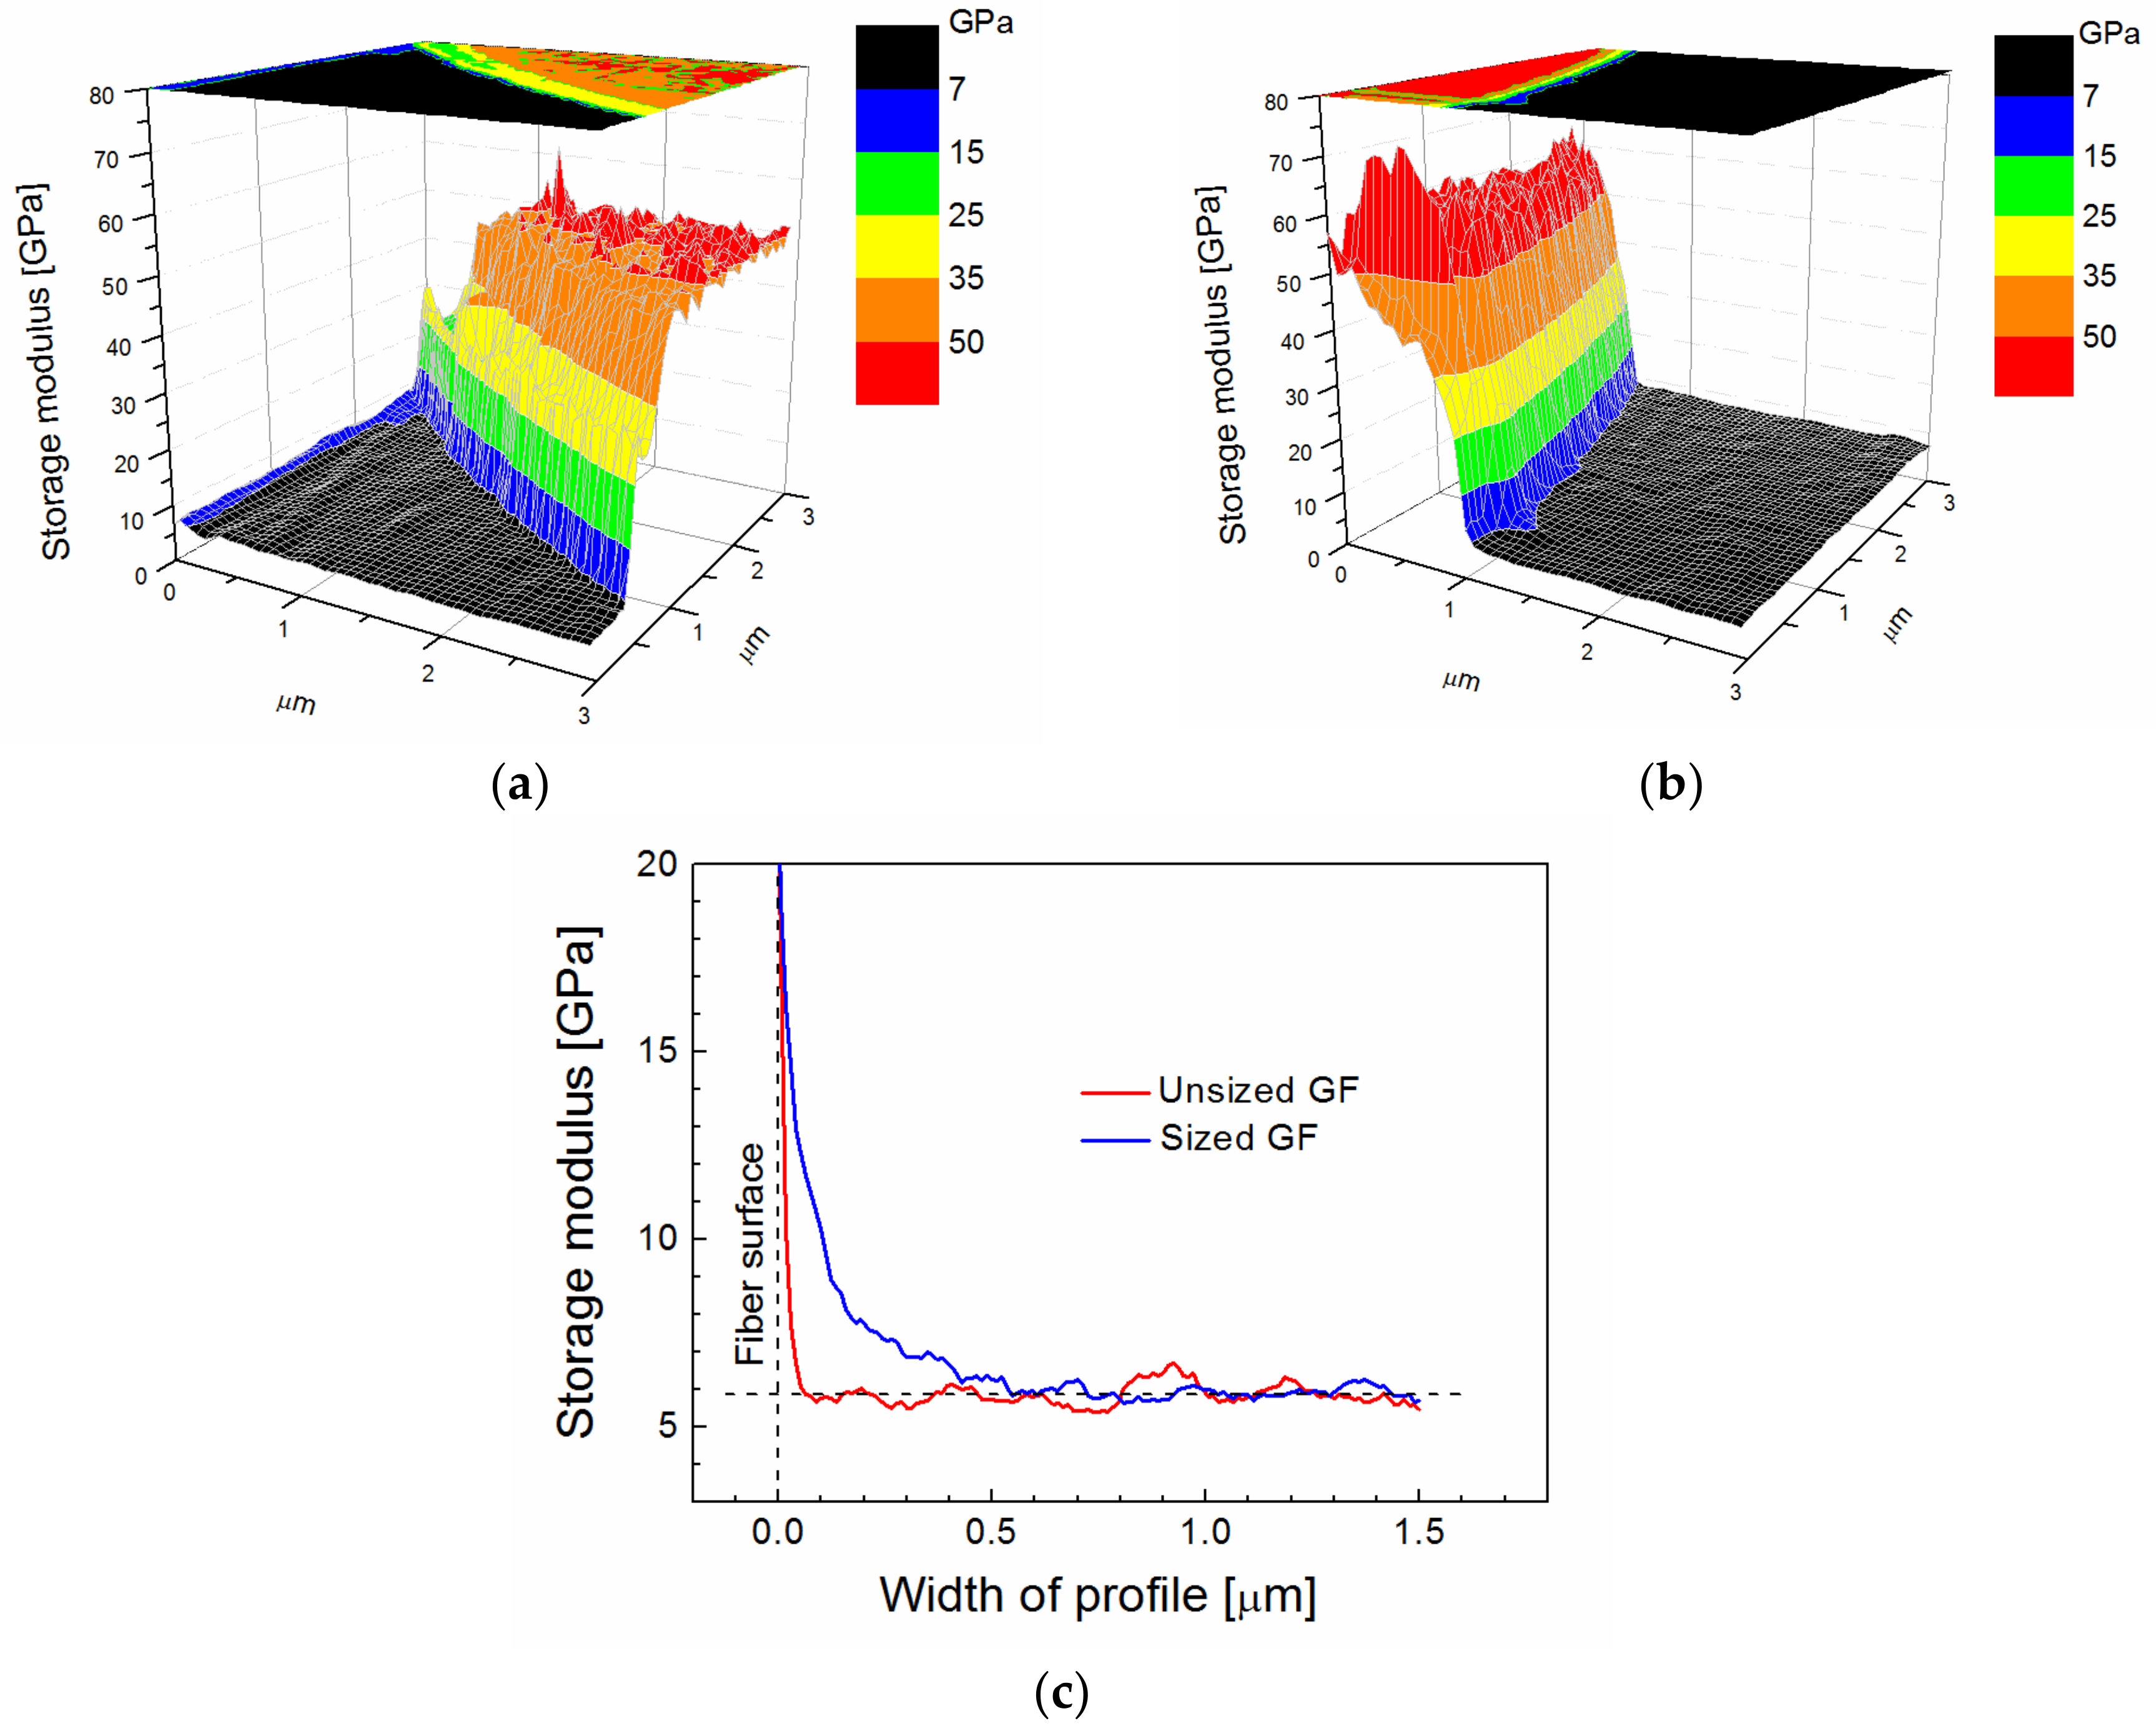
Figure 1a. A three-dimensional (3D) image with a storage modulus in a color scale, which is used for better orientation, shows the black area corresponding to the polymer matrix and a part of the fiber with a sharply raised modulus at the fiber/polymer interface. The 2D projection of the storage modulus is visible at the top of
Figure 1a. A similar image of the storage modulus was obtained for the commercially sized GF (
Figure 1b). The detailed profile of the storage modulus close to the fiber/polymer interface (
Figure 1c) enabled the finding of characteristic differences. The red line for the unsized GF rises in the immediate vicinity of the fiber surface, and the 0.07-µm-thick area on which the modulus was changed corresponds to the fiber constraint area rather than the interphase region. However, the blue line corresponding to the commercially sized GF indicates the wider area of the modulus change that can be assigned to the interphase region with a thickness of 0.5 µm. The interphase region around the commercially sized GF was non-regular, and the thickness varied from 0.1 (GF without sizing) to 0.5 µm. The storage modulus for the polyester resin outside the interphase region was approximately 6 GPa, as shown in
Figure 1c, which appears to be a little overvalued because a Young’s modulus of 4 GPa was evaluated from the quasi-static tensile test of the polyester resin. An increased storage modulus was found in the subsurface layer up to a depth of 40 nm of metallographic specimen, probably due to resin polishing.
The polymer-like a-CSi:H film was deposited (68.7 nm/min) on single GFs and silicon wafers at an effective power of 2.0 W (time-on pulse, period, and total power were 1 ms, 5 ms, and 10 W, respectively) from a pure TVS precursor using the plasma reactor with plan-parallel electrodes. The film thickness was 895 nm, which was determined from the ellipsometric spectrum of the film on the silicon wafer, and we expect that approximately the same thickness of the film was deposited on the GFs. A Young’s modulus of 10.0 ± 0.5 GPa was evaluated for the film on the silicon wafer using cyclic nanoindentation measurements. RBS/ERDA spectra of a-CSi:H film allowed determining the chemical composition and calculating the element ratios to the silicon concentration, resulting in a stoichiometric formula a-C
5.6Si:H
5.0. The high concentration of hydrogen (43 atom%) that is bonded to silicon and carbon atoms is responsible for the relatively low cross-linking of the mainly carbon network in the a-CSi:H film, resulting in the low Young’s modulus that corresponds to a polymer-like material. GFs coated with this interlayer (a-C
5.6Si:H
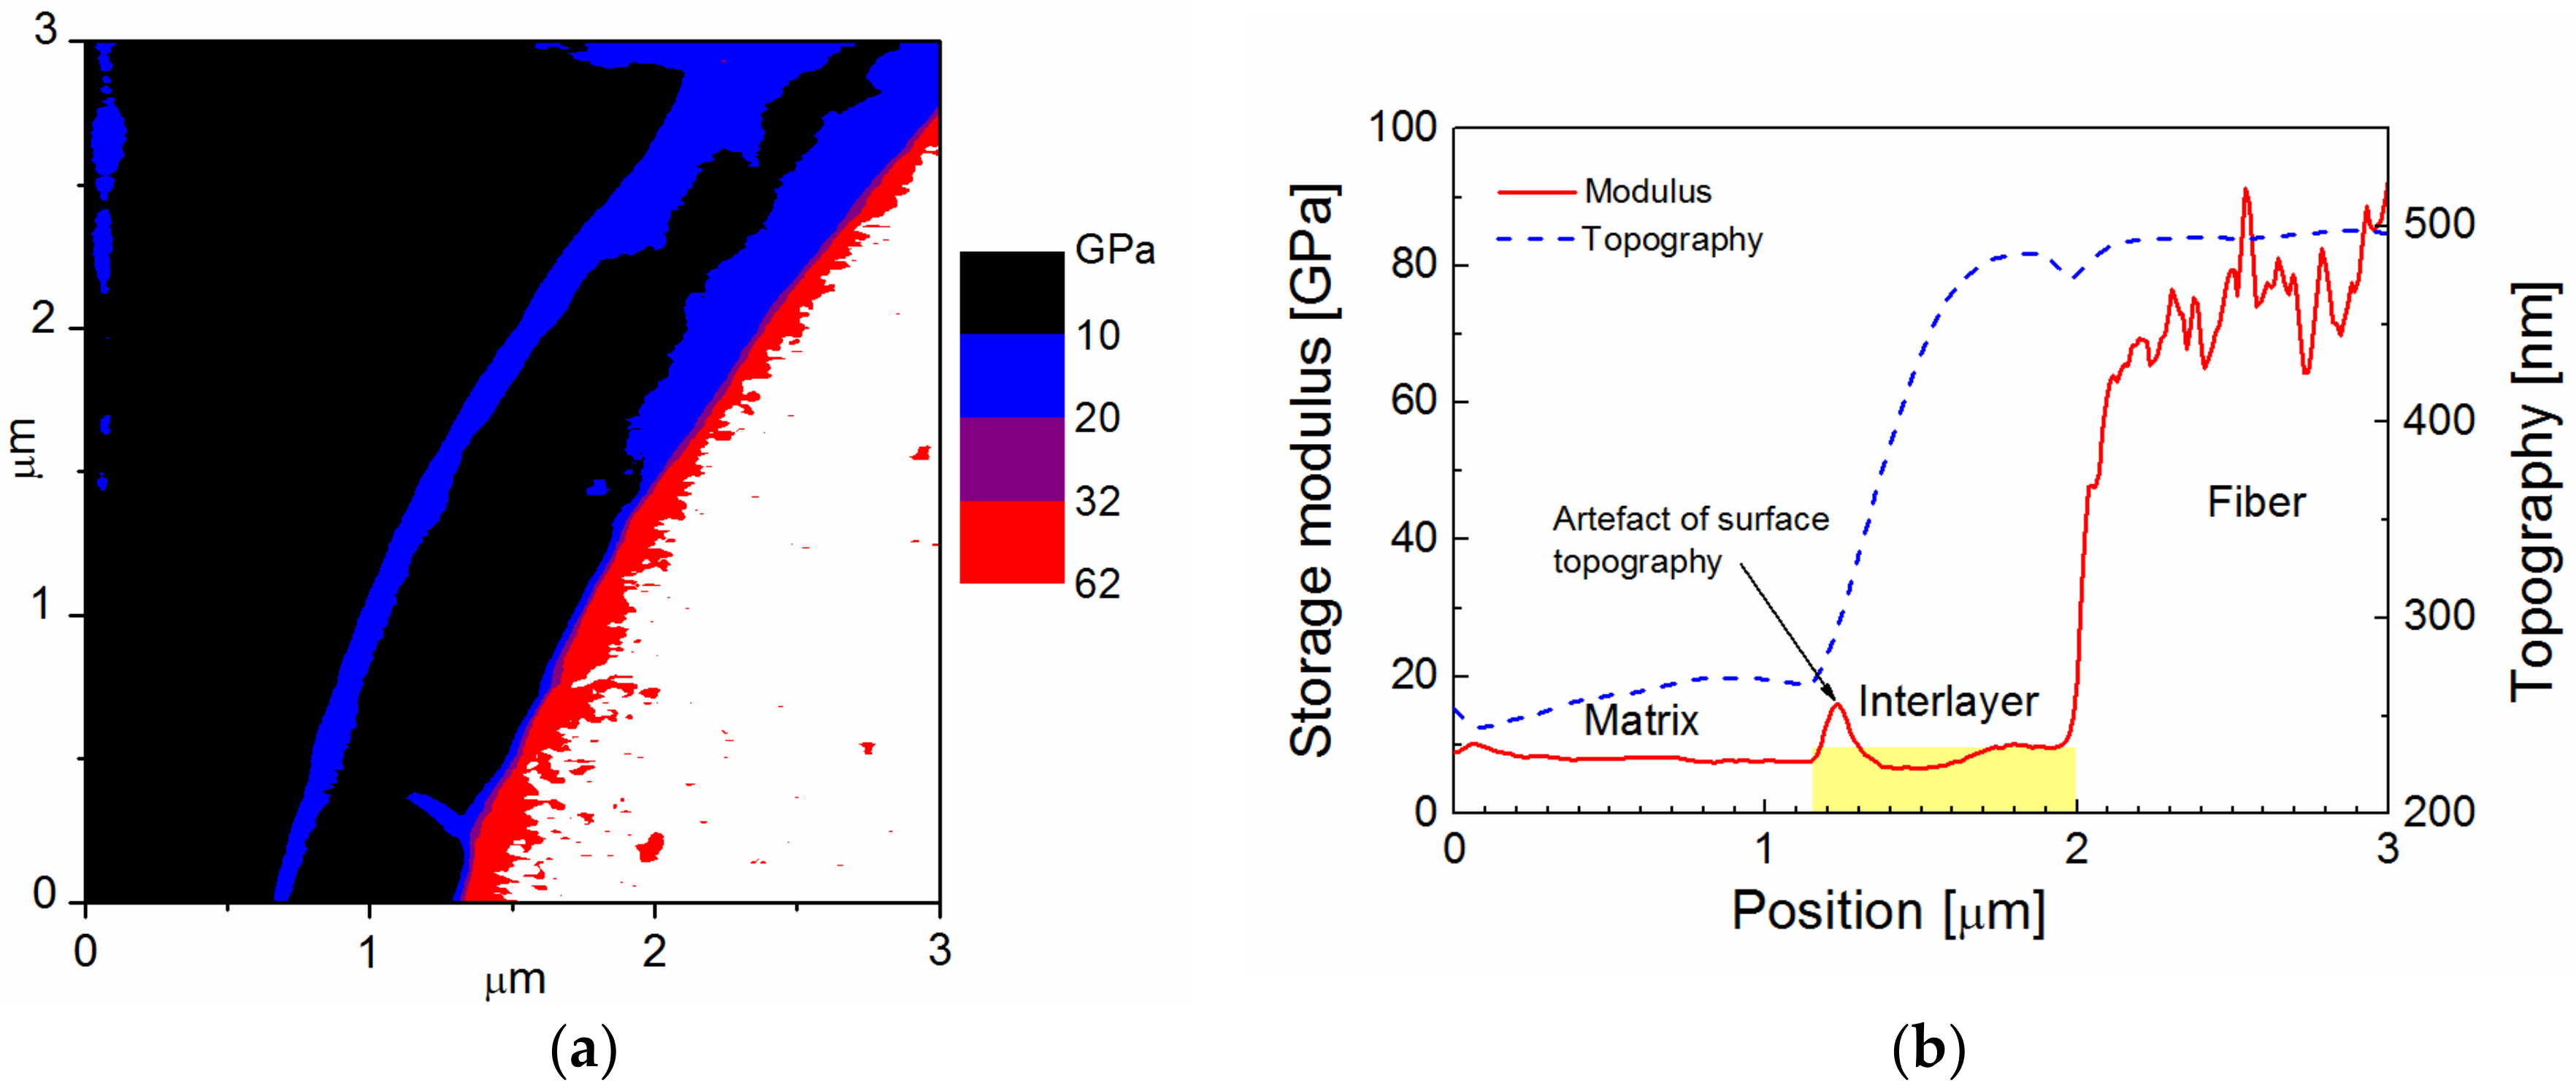
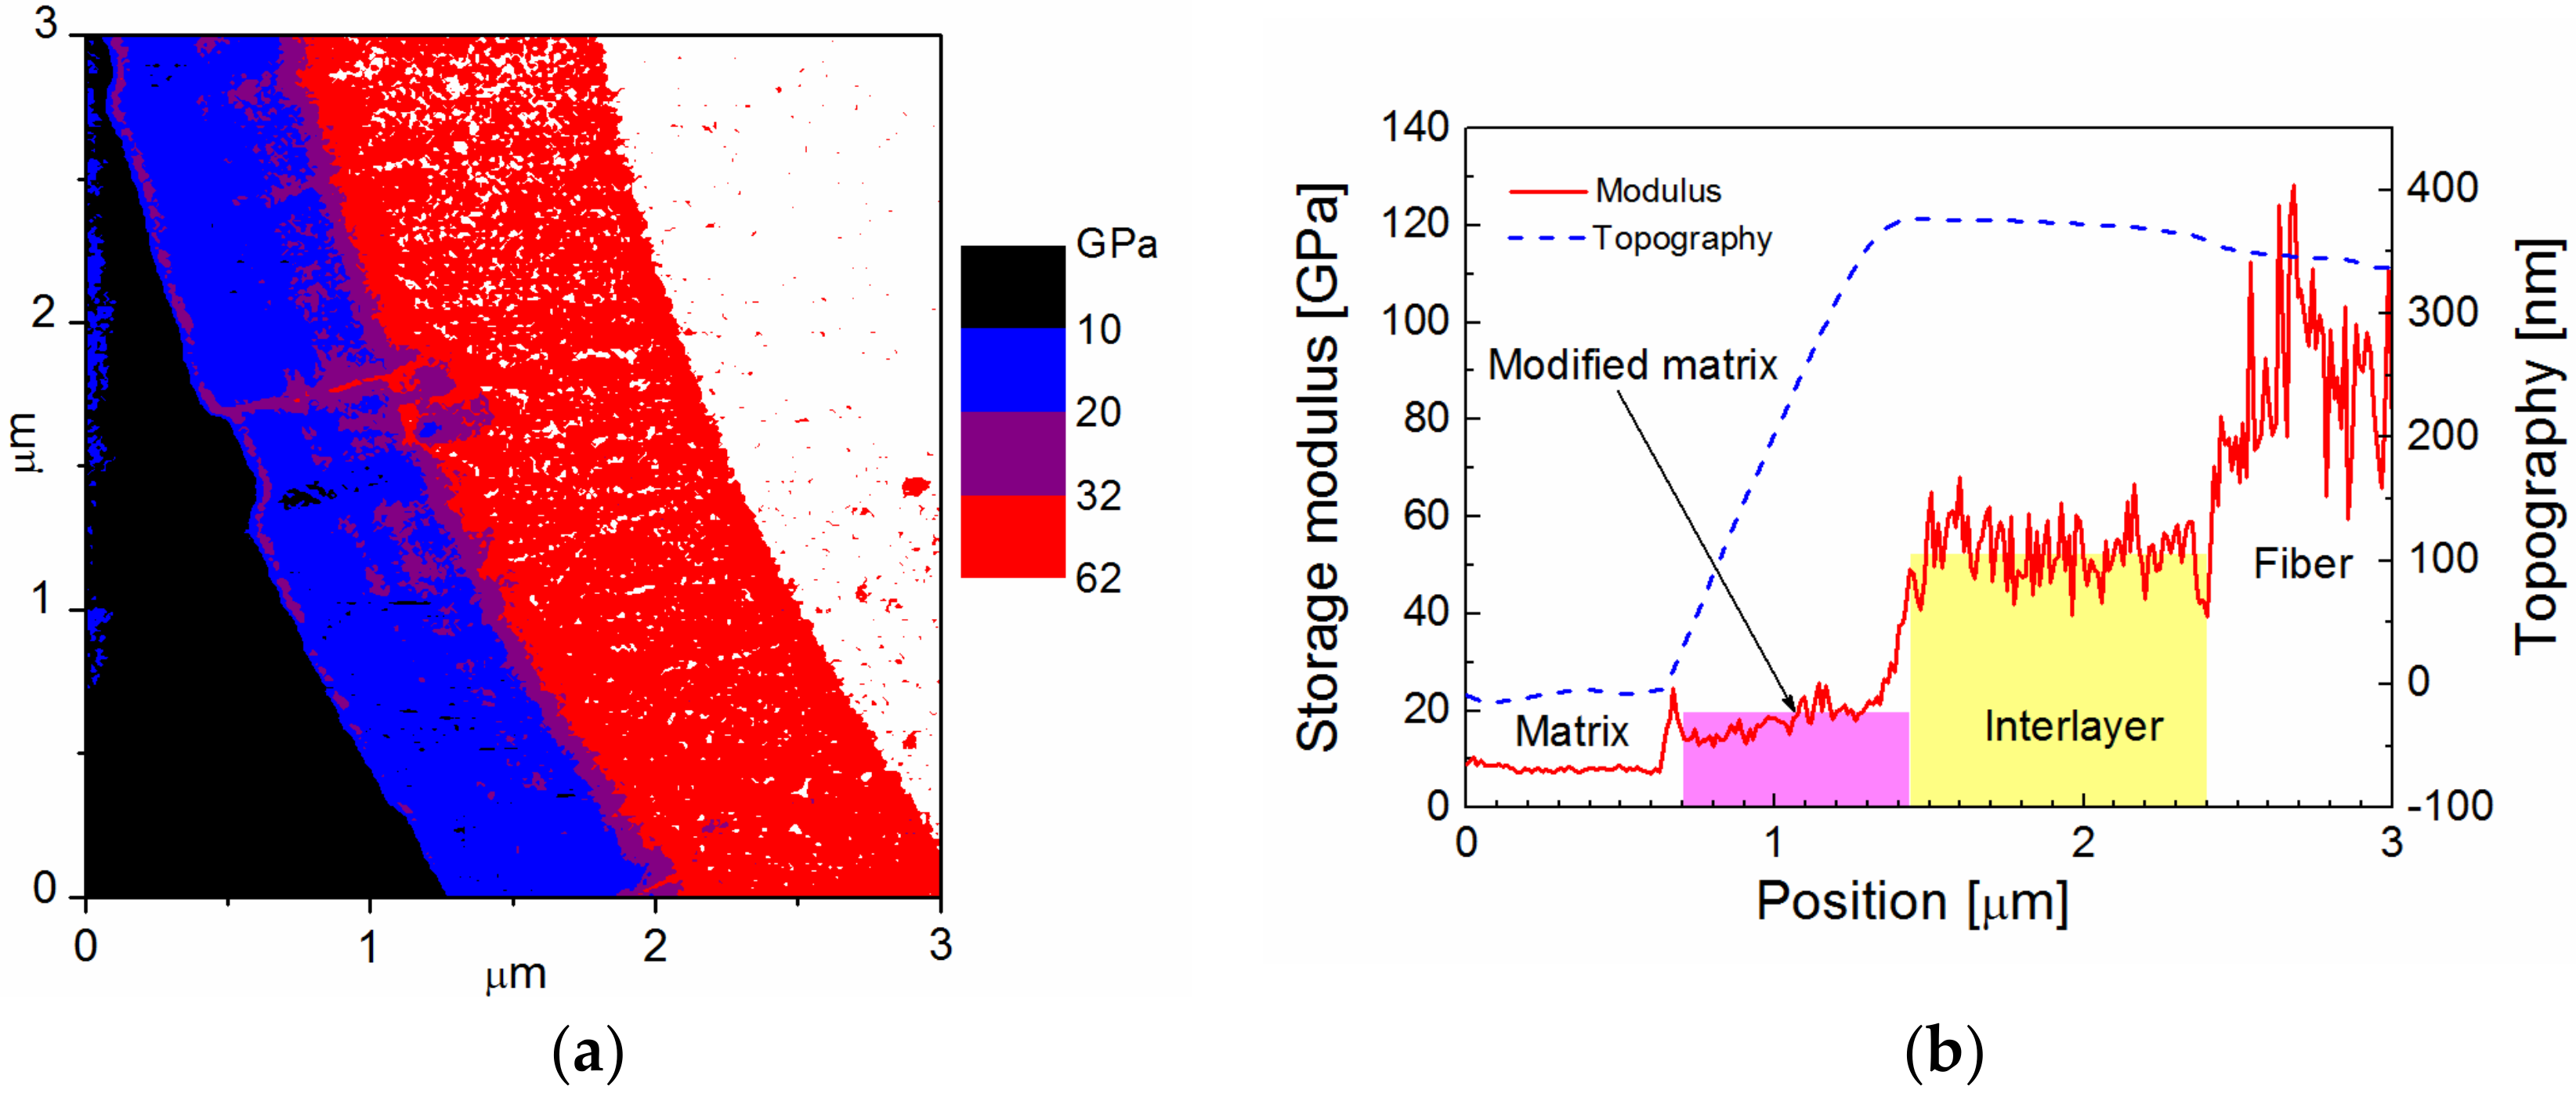
5.0 film) were inserted in polyester resin to fabricate a model composite, whose cross-section was analyzed with Modulus Mapping to distinguish the interlayer between the fiber and the polymer matrix, and to characterize its mechanical properties. The storage modulus in a color scale across the interphase region in a model GF/polyester composite is shown in
Figure 2a. The lateral resolution of this map is 11.7 nm. The scan area of 3 × 3 µm
2 shows the white area with a modulus above 62 GPa corresponding to GF surrounded by a ring with a modulus similar to the polymer matrix (black area on the left) with a blue contour. Profiles of the storage modulus (red line) and surface topography (blue line), corresponding to the GF with the polymer-like interlayer, are plotted in
Figure 2b. Interpretation of mechanical properties is not easy due to the surface topography of the composite sample marked with a blue dashed line. Generally, the indentation measurement analysis is based on the assumption that the process is initiated by penetrating the indenter into a flat surface. The influence of surface roughness on nanoindentation measurements was interpreted using model simulations [
22]. The polymer composite is a hybrid material, and its polished surface exhibits roughness in the interphase region due to the different mechanical properties of the composite phases. Based on the thickness of the interlayer, its position is expected at the GF surface, indicated by the yellow area in
Figure 2b. At the interface between the interlayer and the polymer matrix, there is an elevated modulus, but it is an artefact due to the side contact of the indenter with the rough surface of the composite sample. In this case, the measured contact stiffness is higher than that corresponding to the flat surface, and the projected contact area is underestimated, resulting in an overestimated storage modulus. The slope of the surface across the interlayer provides a slightly underestimated modulus, corresponding to model simulations [
22], but part of the interlayer close to the interlayer/fiber interface corresponds to the correct value of the storage modulus of 10 GPa. The surface roughness of the interphase region complicates the differentiation between the polymer-like interlayer and the polymer matrix with similar mechanical properties.
An interlayer with a higher Young’s modulus of 16.3 ± 0.8 GPa was deposited (9.7 nm/min) on single GFs at an effective power of 2.0 W (1 ms, 5 ms, and 10 W) from TVS in a mixture with oxygen gas with a 0.92 oxygen fraction. Oxygen atoms (34 atom%) were incorporated into the thin film, but carbon (29 atom%) and hydrogen (24 atom%) concentrations were reduced in the a-C
2.2SiO
2.6:H
1.8 film with a thickness of 966 nm, unlike the polymer-like a-C
5.6Si:H
5.0 film. Cross-linking of the carbon-silicon oxide network is still relatively low due to Si–H, Si–OH, C–H, C–OH, and C=O bonding species. The results of Modulus Mapping across the interphase region in a model GF/polyester composite with a-C
2.2SiO
2.6:H
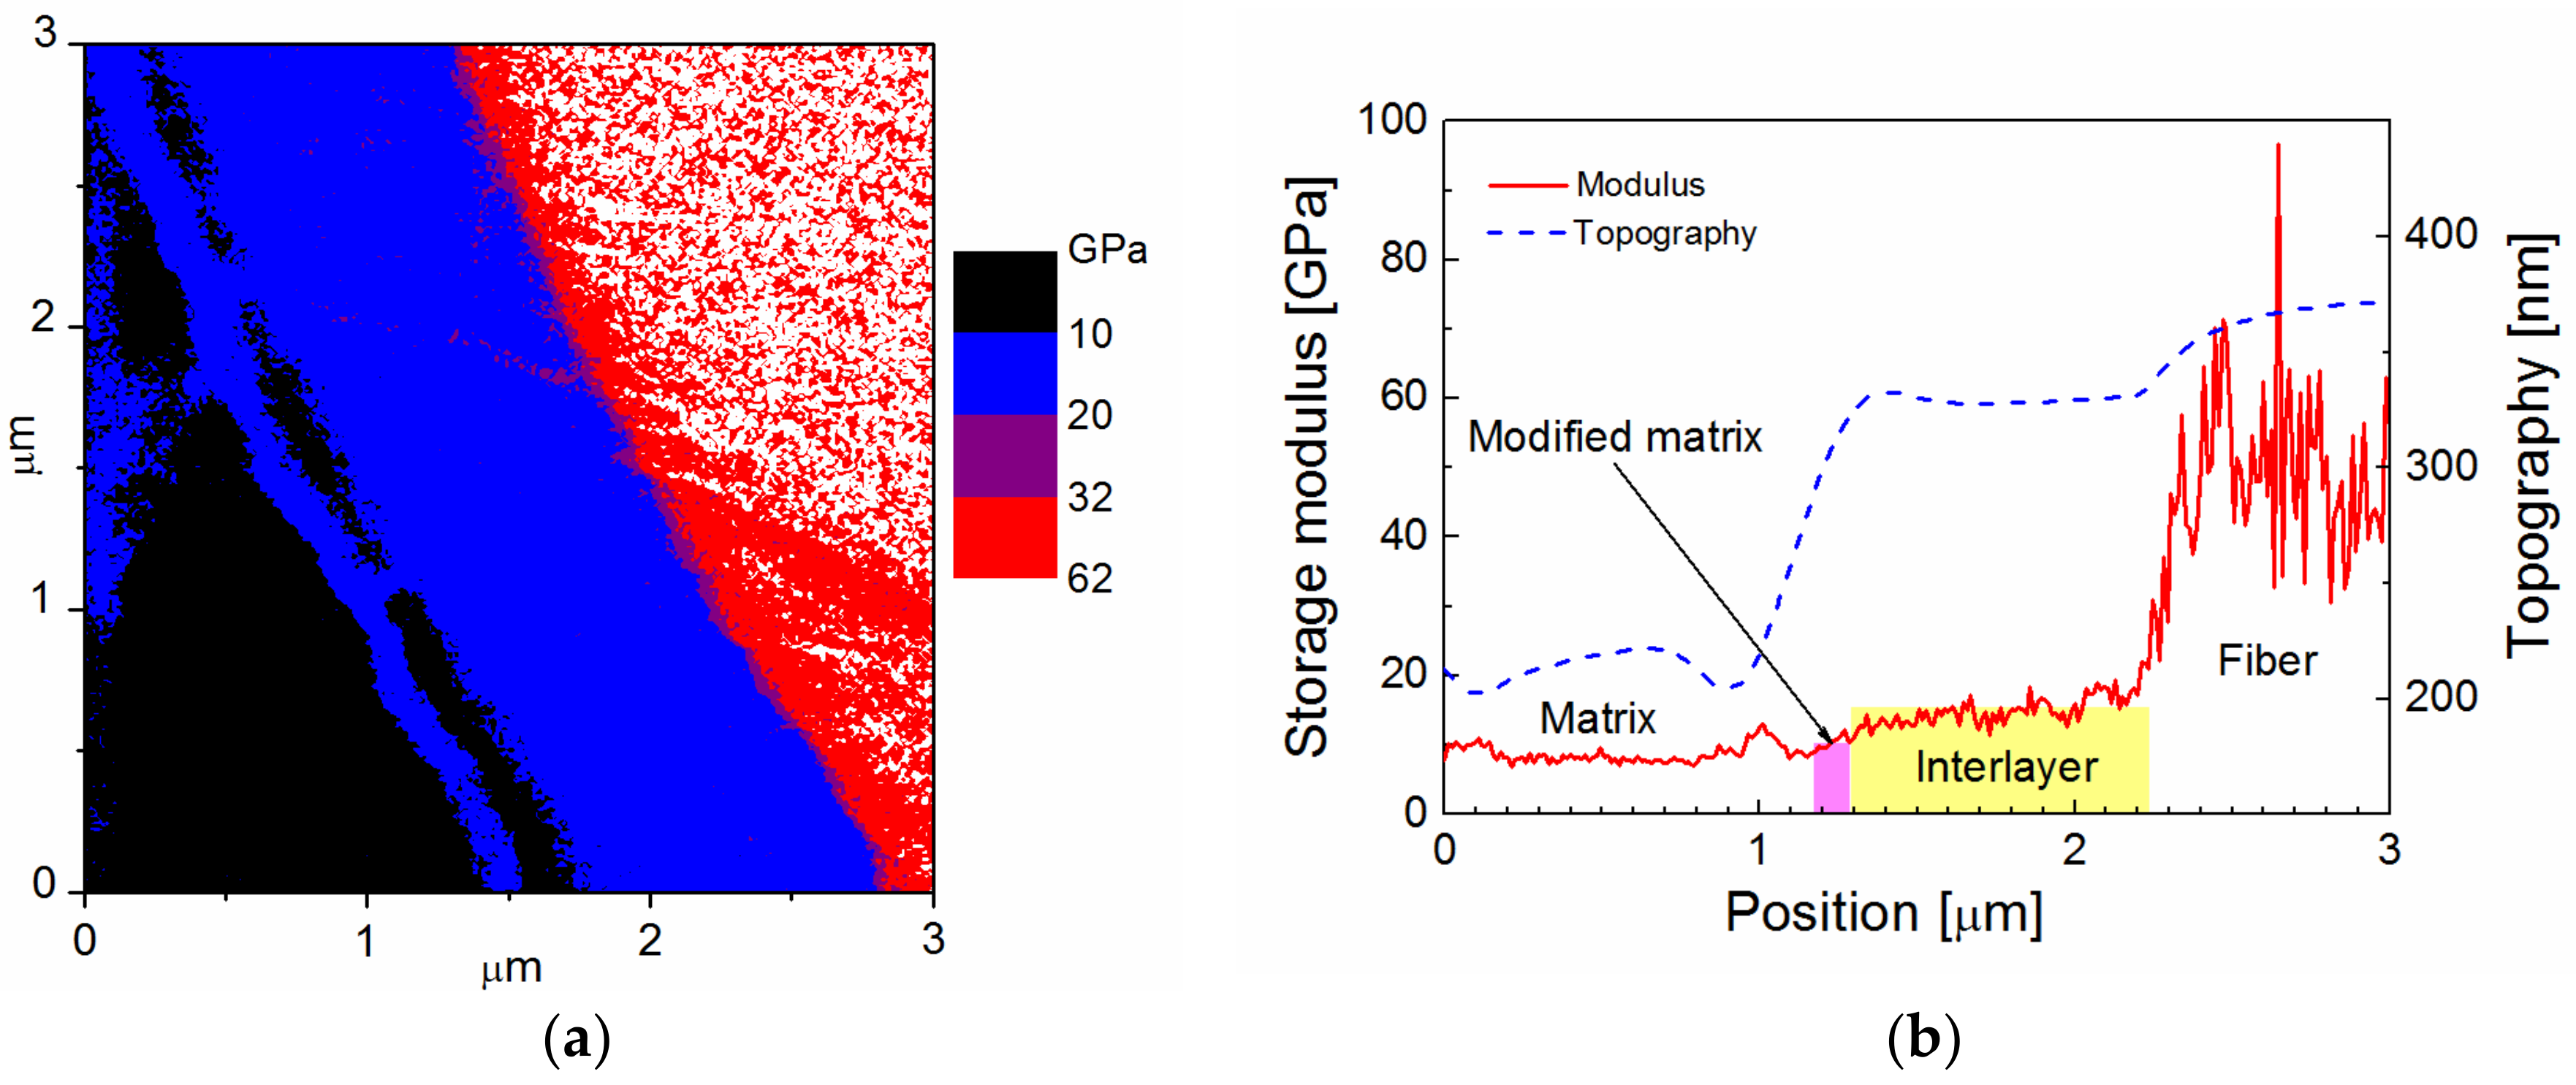
1.8 interlayer are plotted in
Figure 3. The map of the storage modulus in
Figure 3a provides easy orientation in specific composite phases; the red/white area corresponds to a fiber, surrounded by a blue belt, indicating an interlayer with a higher modulus than the polymer matrix that is marked with a black area. The surface topography across the interlayer, marked by the yellow area, was flat, and was, therefore, favorable for determining the correct value of the storage modulus (
Figure 3b). The storage modulus of the interlayer slightly increased from the interface between the interlayer and the polymer matrix to the interlayer/fiber interface, but the mean value was 16 GPa. A small portion of the interphase region with a thickness of 0.1–0.2 µm between the interlayer and the polymer matrix had a slightly elevated modulus, and could, therefore, correspond to the modified matrix.
Another interlayer in the form of a silicon oxide film with a carbon concentration of 16 atom% was deposited (7.5 nm/min) at 4.5 W (1 ms, 11 ms, and 50 W) from TVS in a mixture with oxygen gas with a 0.92 oxygen fraction. The a-C
0.7SiO
2.1:H
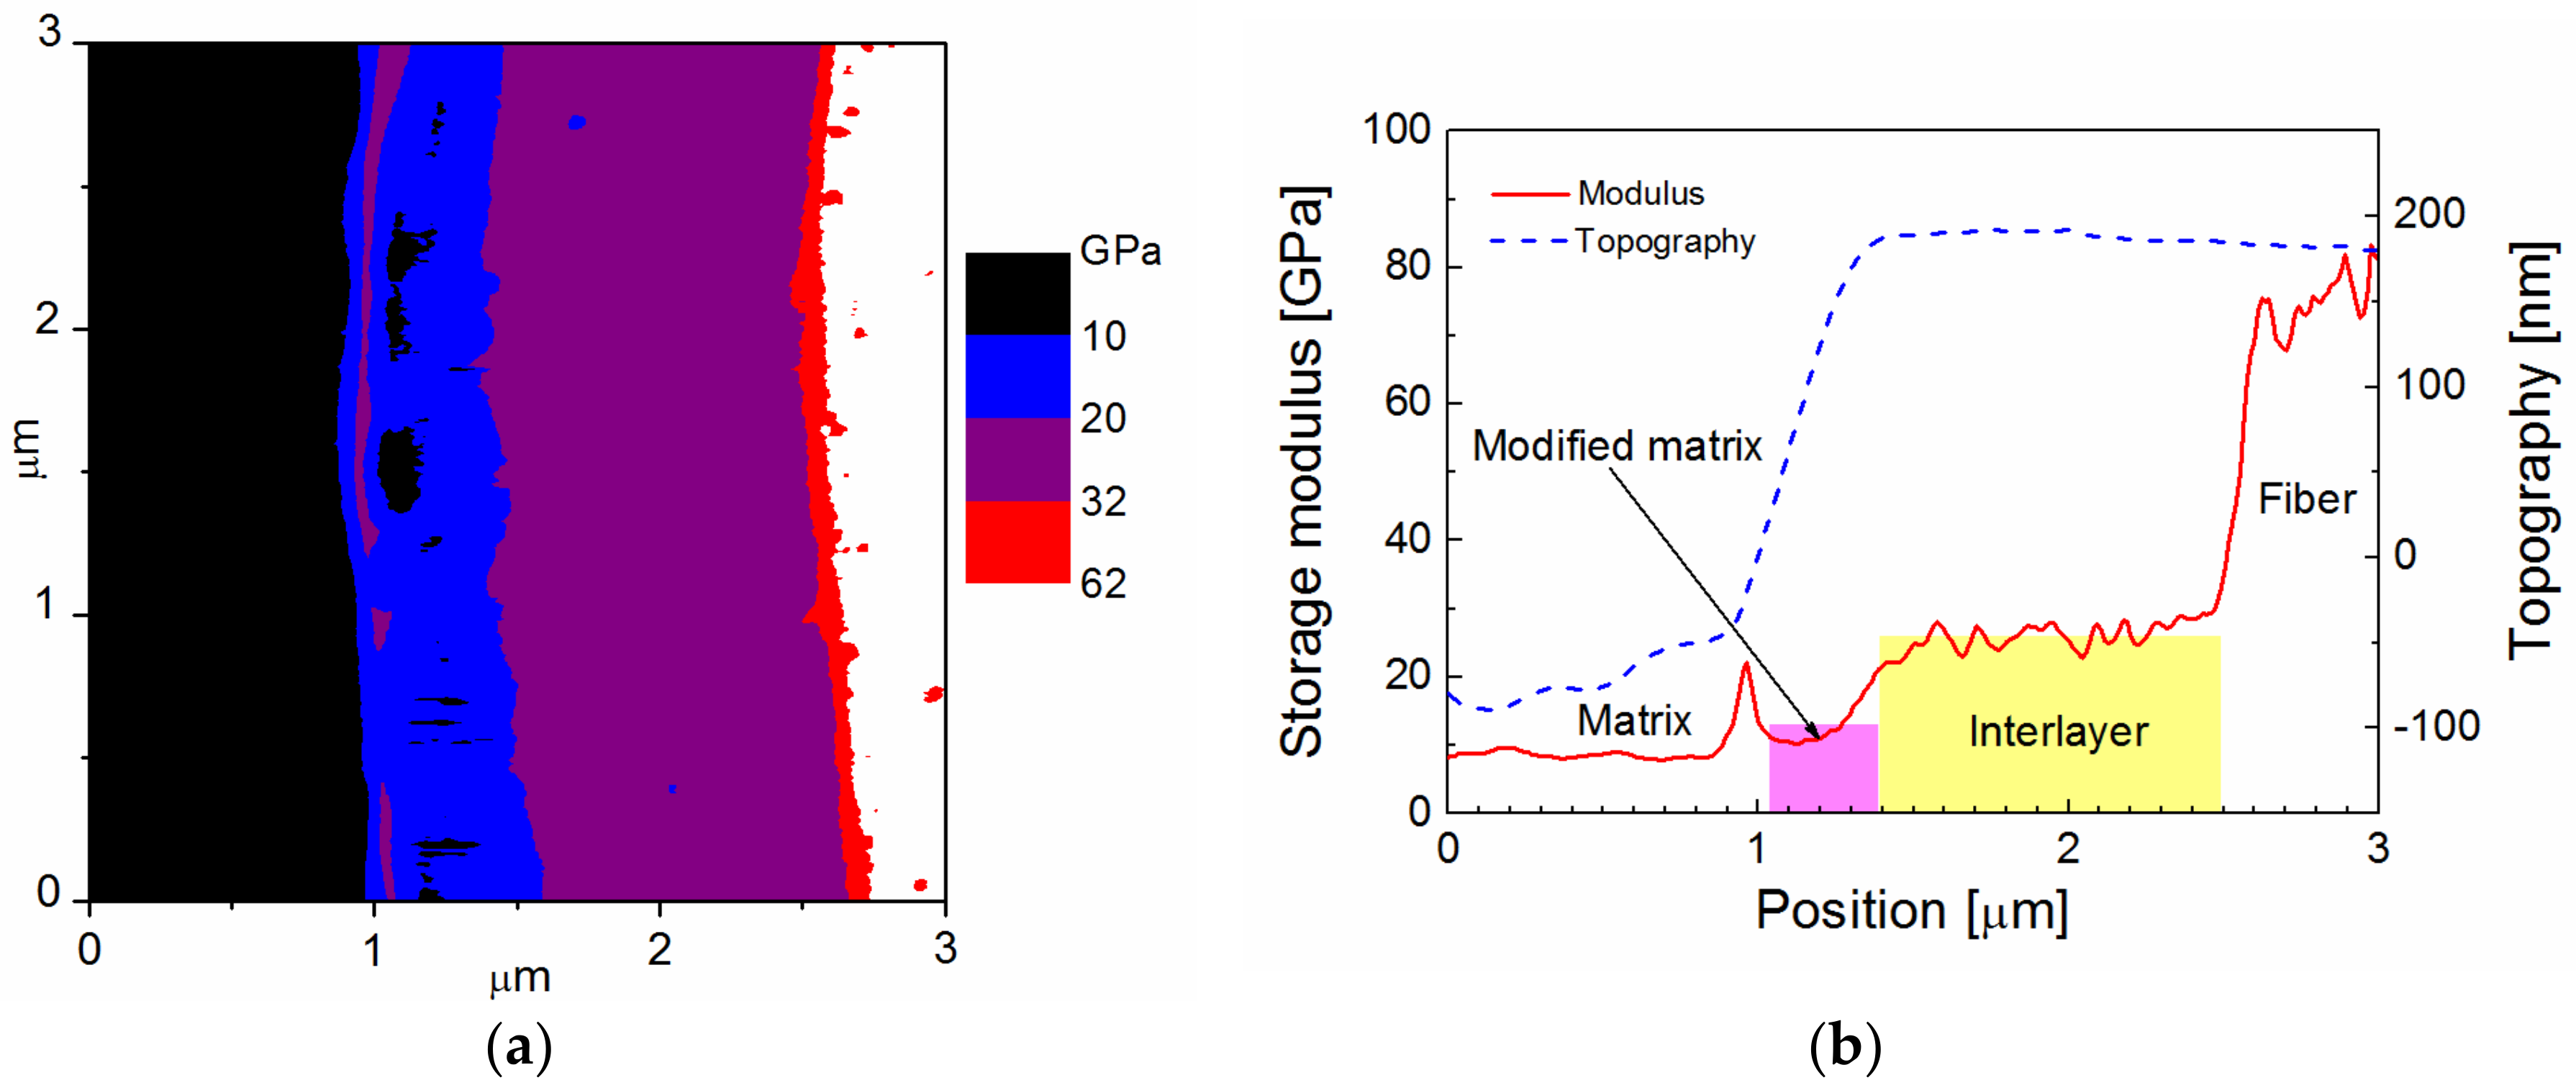
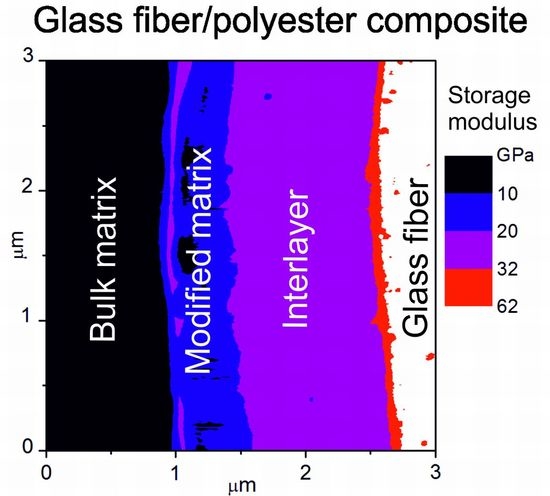
0.8 interlayer with a thickness of 1109 nm was more cross-linked, with a Young’s modulus of 29.6 ± 1.5 GPa. Modulus Mapping in
Figure 4a distinguished the fiber (white area) from the interlayer (purple area) and the polymer matrix (black area). A part of the blue belt with a thickness of 0.3 to 0.4 μm between the interlayer and the polymer matrix may represent a modified matrix region characterized by a gradually increasing modulus. The beginning of the step in the surface topography between the modified and the bulk matrix was responsible for the elevated modulus, which is an artefact caused by a specific surface topography, and can be seen as a purple contour in the blue belt (
Figure 4b). In this case, the mechanical properties of the interlayer were sufficiently high to avoid any surface roughness between the fiber and the interlayer. This means that the surface topography was flat for the interlayer, delineated with the yellow area, and the storage modulus of the interlayer increased from 21 to 31 GPa at the interlayer/fiber interface at a mean value of 26 GPa.
An SiO
2-like interlayer with a small concentration of carbon (3 atom%) and hydrogen (11 atom%) was deposited (5.5 nm/min) at 10 W (1 ms, 5 ms, and 50 W) from TVS in a mixture with oxygen gas with a 0.92 oxygen fraction. The a-C
0.1SiO
1.9:H
0.4 interlayer with a thickness of 950 nm was highly cross-linked resulting in a Young’s modulus of 51.7 ± 3.3 GPa.
Figure 5a shows a map of the storage modulus corresponding to the fiber (white area), interlayer (red area), modified matrix (blue area), and the bulk matrix (black area). The same deposition time resulted in consistent film thickness for films deposited on planar and fibrous substrates. The thickness of the modified matrix was increased for the SiO
2-like interlayer, and varied from 0.5 to 0.7 µm. The mean value of the storage modulus for the flat surface of the interlayer was 52 GPa (
Figure 5b), as expected from cyclic nanoindentation. The storage modulus across the interlayer varied like across the GF surface. This means that the interlayer material was as brittle as the glass, and the composite surface was specifically modified (slightly scratched) with 50-nm alumina nanoparticles, which were used to polish composite samples. The root-mean-square (RMS) roughness of the composite surface was 30 nm for a scan area of 100 × 100 µm
2 measured by AFM. The varying modulus was caused by surface topography. Nanoindentation measurements of the material with a higher modulus are more sensitive to surface roughness [
22]. The wide region of the modified matrix with the elevated modulus between the interlayer and the bulk matrix is evident for the SiO
2-like interlayer in
Figure 5b. We can assume that the modified matrix region was created as a result of a chemical bonding at the interface between the interlayer and the polymer matrix, unlike the unsized GF (
Figure 1c). The polymer network was firmly anchored onto the surface of the interlayer, which increased the rigidity of the polymer network. The interlayer/polymer matrix interface was sharp, and no interpenetrating network between the interlayer and the polymer matrix can be expected, unlike commercially sized GFs that are surface-modified by silane coupling agents [
33]. Analysis of the depth profile for the interlayers and GFs revealed that the subsurface layer, up to a depth of 5–10 nm, showed an increase in the storage modulus due to the mechanical modification of the material during the polishing procedure. Therefore, the storage modulus in the maps may be overestimated by up to 10% for the SiO
2-like interlayer and GFs, as the average displacement of the indenter was approximately 5 nm, but it cannot affect the polymer-like interlayer with an average displacement of 15 nm. The differences in storage modulus among the composite phases were significantly higher compared to the differences in loss modulus, and were, therefore, more appropriate for the distinction of the specific phase.
3.2. Selected Interlayers for GF/Polyester Composite
As shown in
Section 3.1, a wide range of materials from polymer-like to SiO
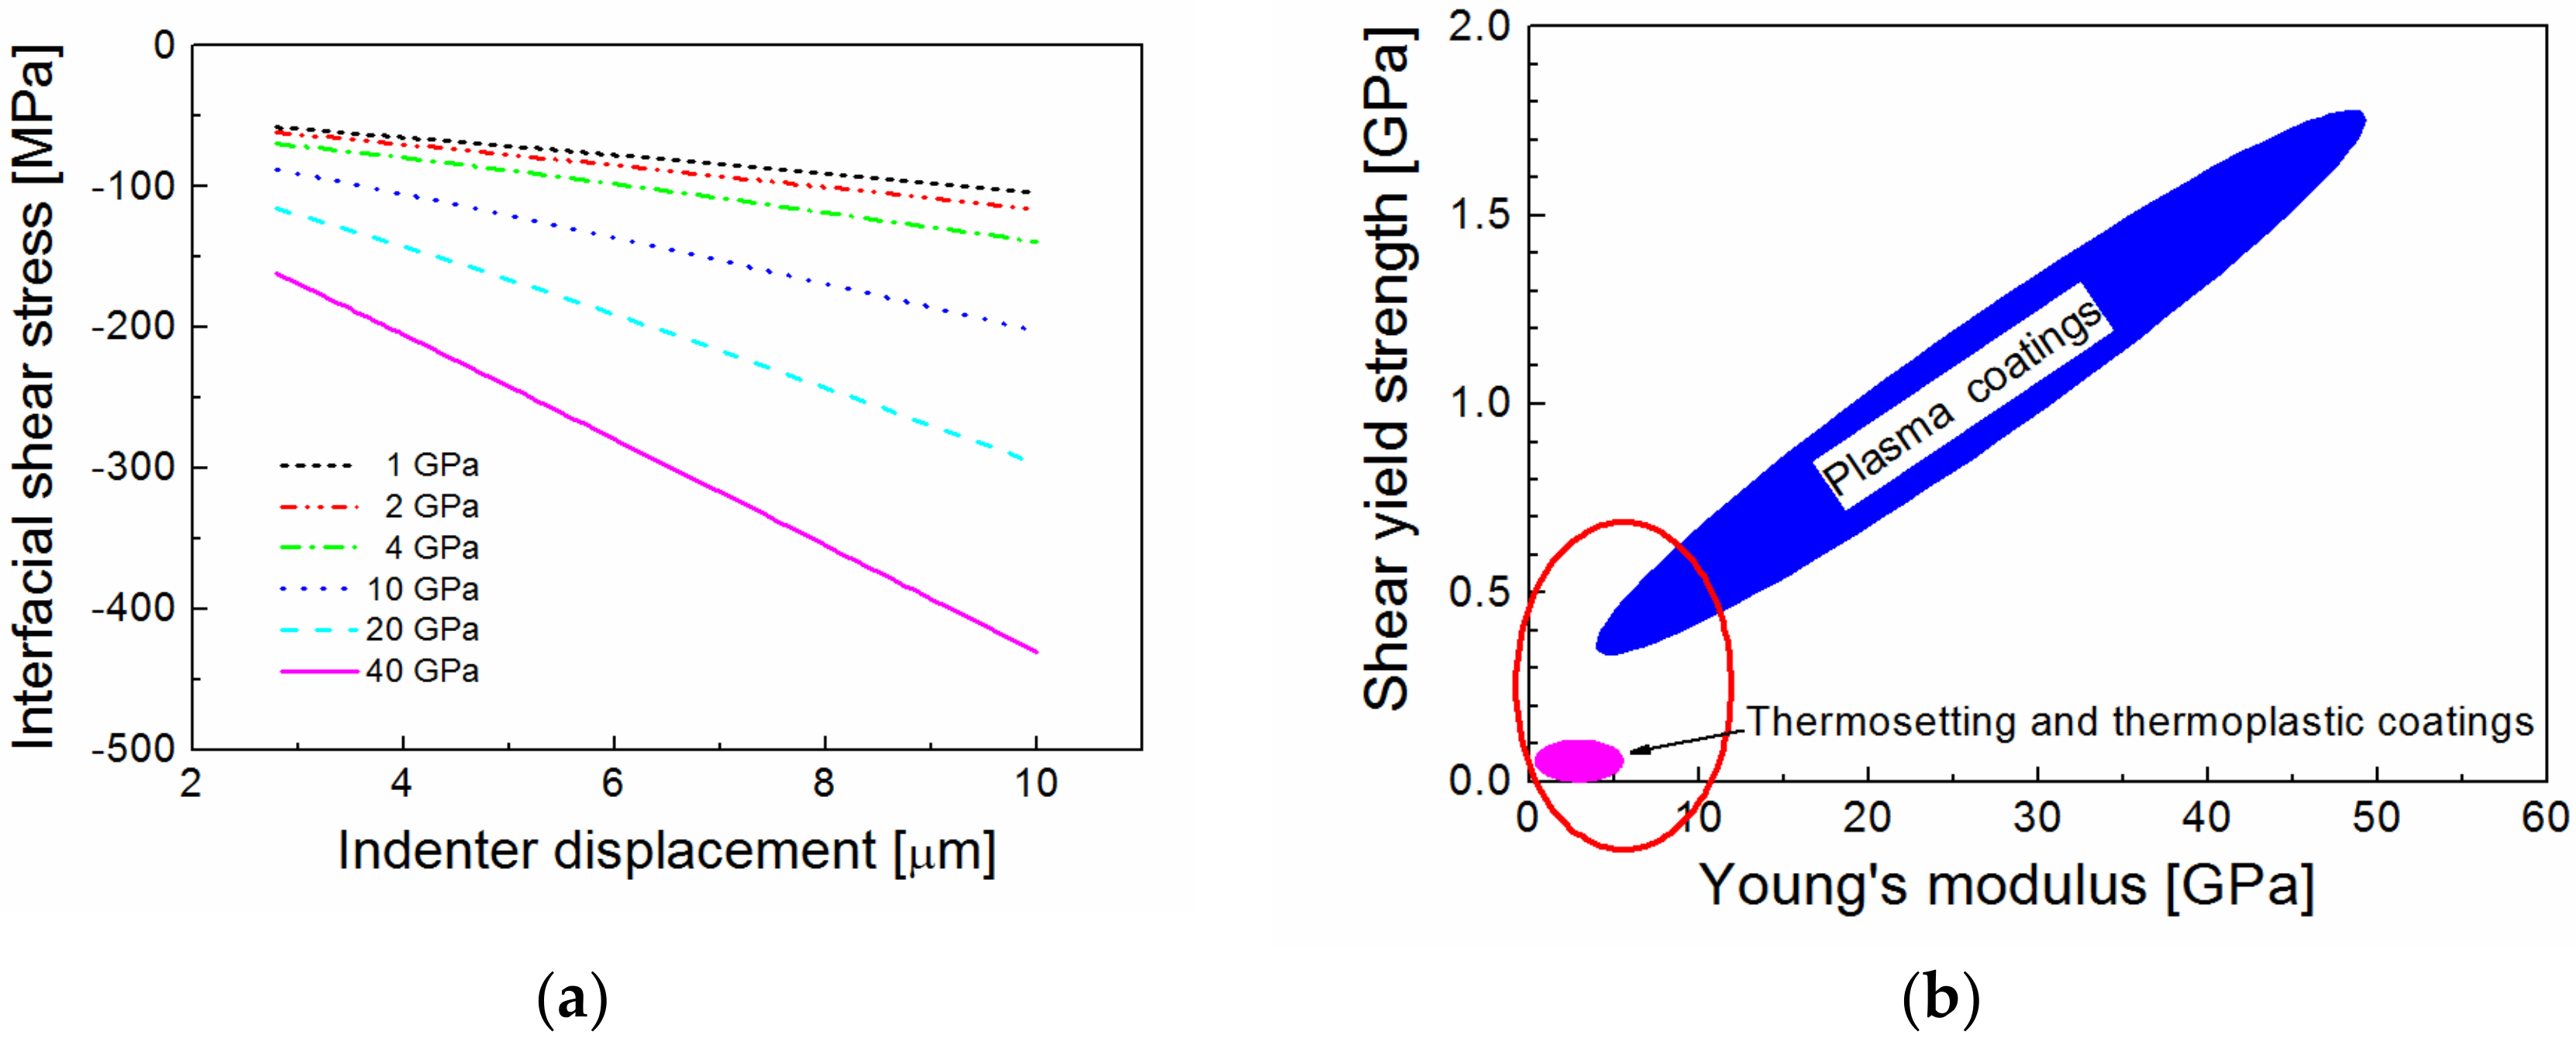
2-like films with a Young’s modulus of 10 to 52 GPa can be used as interlayers for GF/polyester composites. The chemical and physical compatibility of the interlayer and the polymer matrix was increased for the polymer-like interlayers with the lower (≤16 GPa) Young’s modulus as the thickness of the modified matrix region was decreased. Model simulations (finite element analysis) enabled calculating the interfacial stress fields in a GF/polyester composite during the microindentation test. The simulation showed that inserting a suitable interlayer between the fiber and the polymer matrix resulted in a significant reduction in shear stress across the interphase region when the polymer composite was under mechanical or thermal loading. If the indenter pushed the individual fiber into the polyester resin during the microindentation test, the interfacial shear stress at the interlayer/fiber interface increased with the raised Young’s modulus of the interlayer [
34]. The interfacial shear stress as a function of the indenter displacement for the interlayer Young’s modulus in the range of 1 to 40 GPa is shown in
Figure 6a. As can be seen from
Figure 6a, the use of the interlayer with the higher modulus means that the interlayer/fiber interface must be stronger in order to avoid interphase shear failure. Also, the shear yield strength of the interlayer must be higher than the applied shear stress. Thermosetting or thermoplastic coatings are poor in shear [
35], and are, therefore, unsuitable for use as functional interlayers in high-performance fiber-reinforced polymer composites. However, the plasma coatings deposited (PECVD) from organosilicon precursors have a sufficiently high shear yield strength at a relatively low Young’s modulus [
25], as opposed to thermosetting or thermoplastic coatings (see the schematic comparison in
Figure 6b). Therefore, the plasma coatings may be more suitable as functional interlayers.
In our previous work, an oxygen-free TVS was successfully used for plasma coating of GFs in the RF helical coupling system to enhance the interfacial adhesion in GF/polyester composites [
36]. In that case, the Young’s modulus of the interlayer was increased from 9.4 to 23 GPa, reducing the vinyl concentration with an enhanced power of 0.1–5.0 W, but the adhesion of the interlayer to the GF did not significantly improve. In another study, therefore, a mixture of TVS precursor in gaseous oxygen was used to deposit plasma coatings onto GFs. Incorporating oxygen atoms into plasma coatings can increase interfacial adhesion, not only on the GF surface, but also at the interface with the polyester matrix due to better wettability and higher density of interfacial bonds. Indeed, the IFSS for oxidized plasma coatings was up to 21% higher than that for the non-oxidized interlayer, indicating the direct chemical effect of oxygen atoms on the interphase properties [
34]. A nanoscratch test was used to measure the interlayer adhesion on a flat glass substrate, as well as on a single GF. For a given film, consistent interlayer adhesion was identified for both fibrous and planar glass substrates [
37]. The work of adhesion was used as the right parameter for the characterization of the interlayer adhesion measured by a nanoscratch test. A strong correlation was found between the IFSS in GF/polyester composites and the interlayer adhesion for the same plasma coating [
38]. Model and experimental data showed that the shear strength at the interlayer/fiber interface is the key factor affecting the mechanical response of the plasma-coated fibers in a GF/polyester composite at microindentation testing.
Further enhancement of the adhesion of oxidized plasma coatings deposited at higher power was our motivation to test an improvement of IFSS for GF/polyester composites. A set of interlayers was deposited onto silicon wafers and GF bundles at a constant effective power of 5.0 W, but the various oxygen fractions in the TVS/O
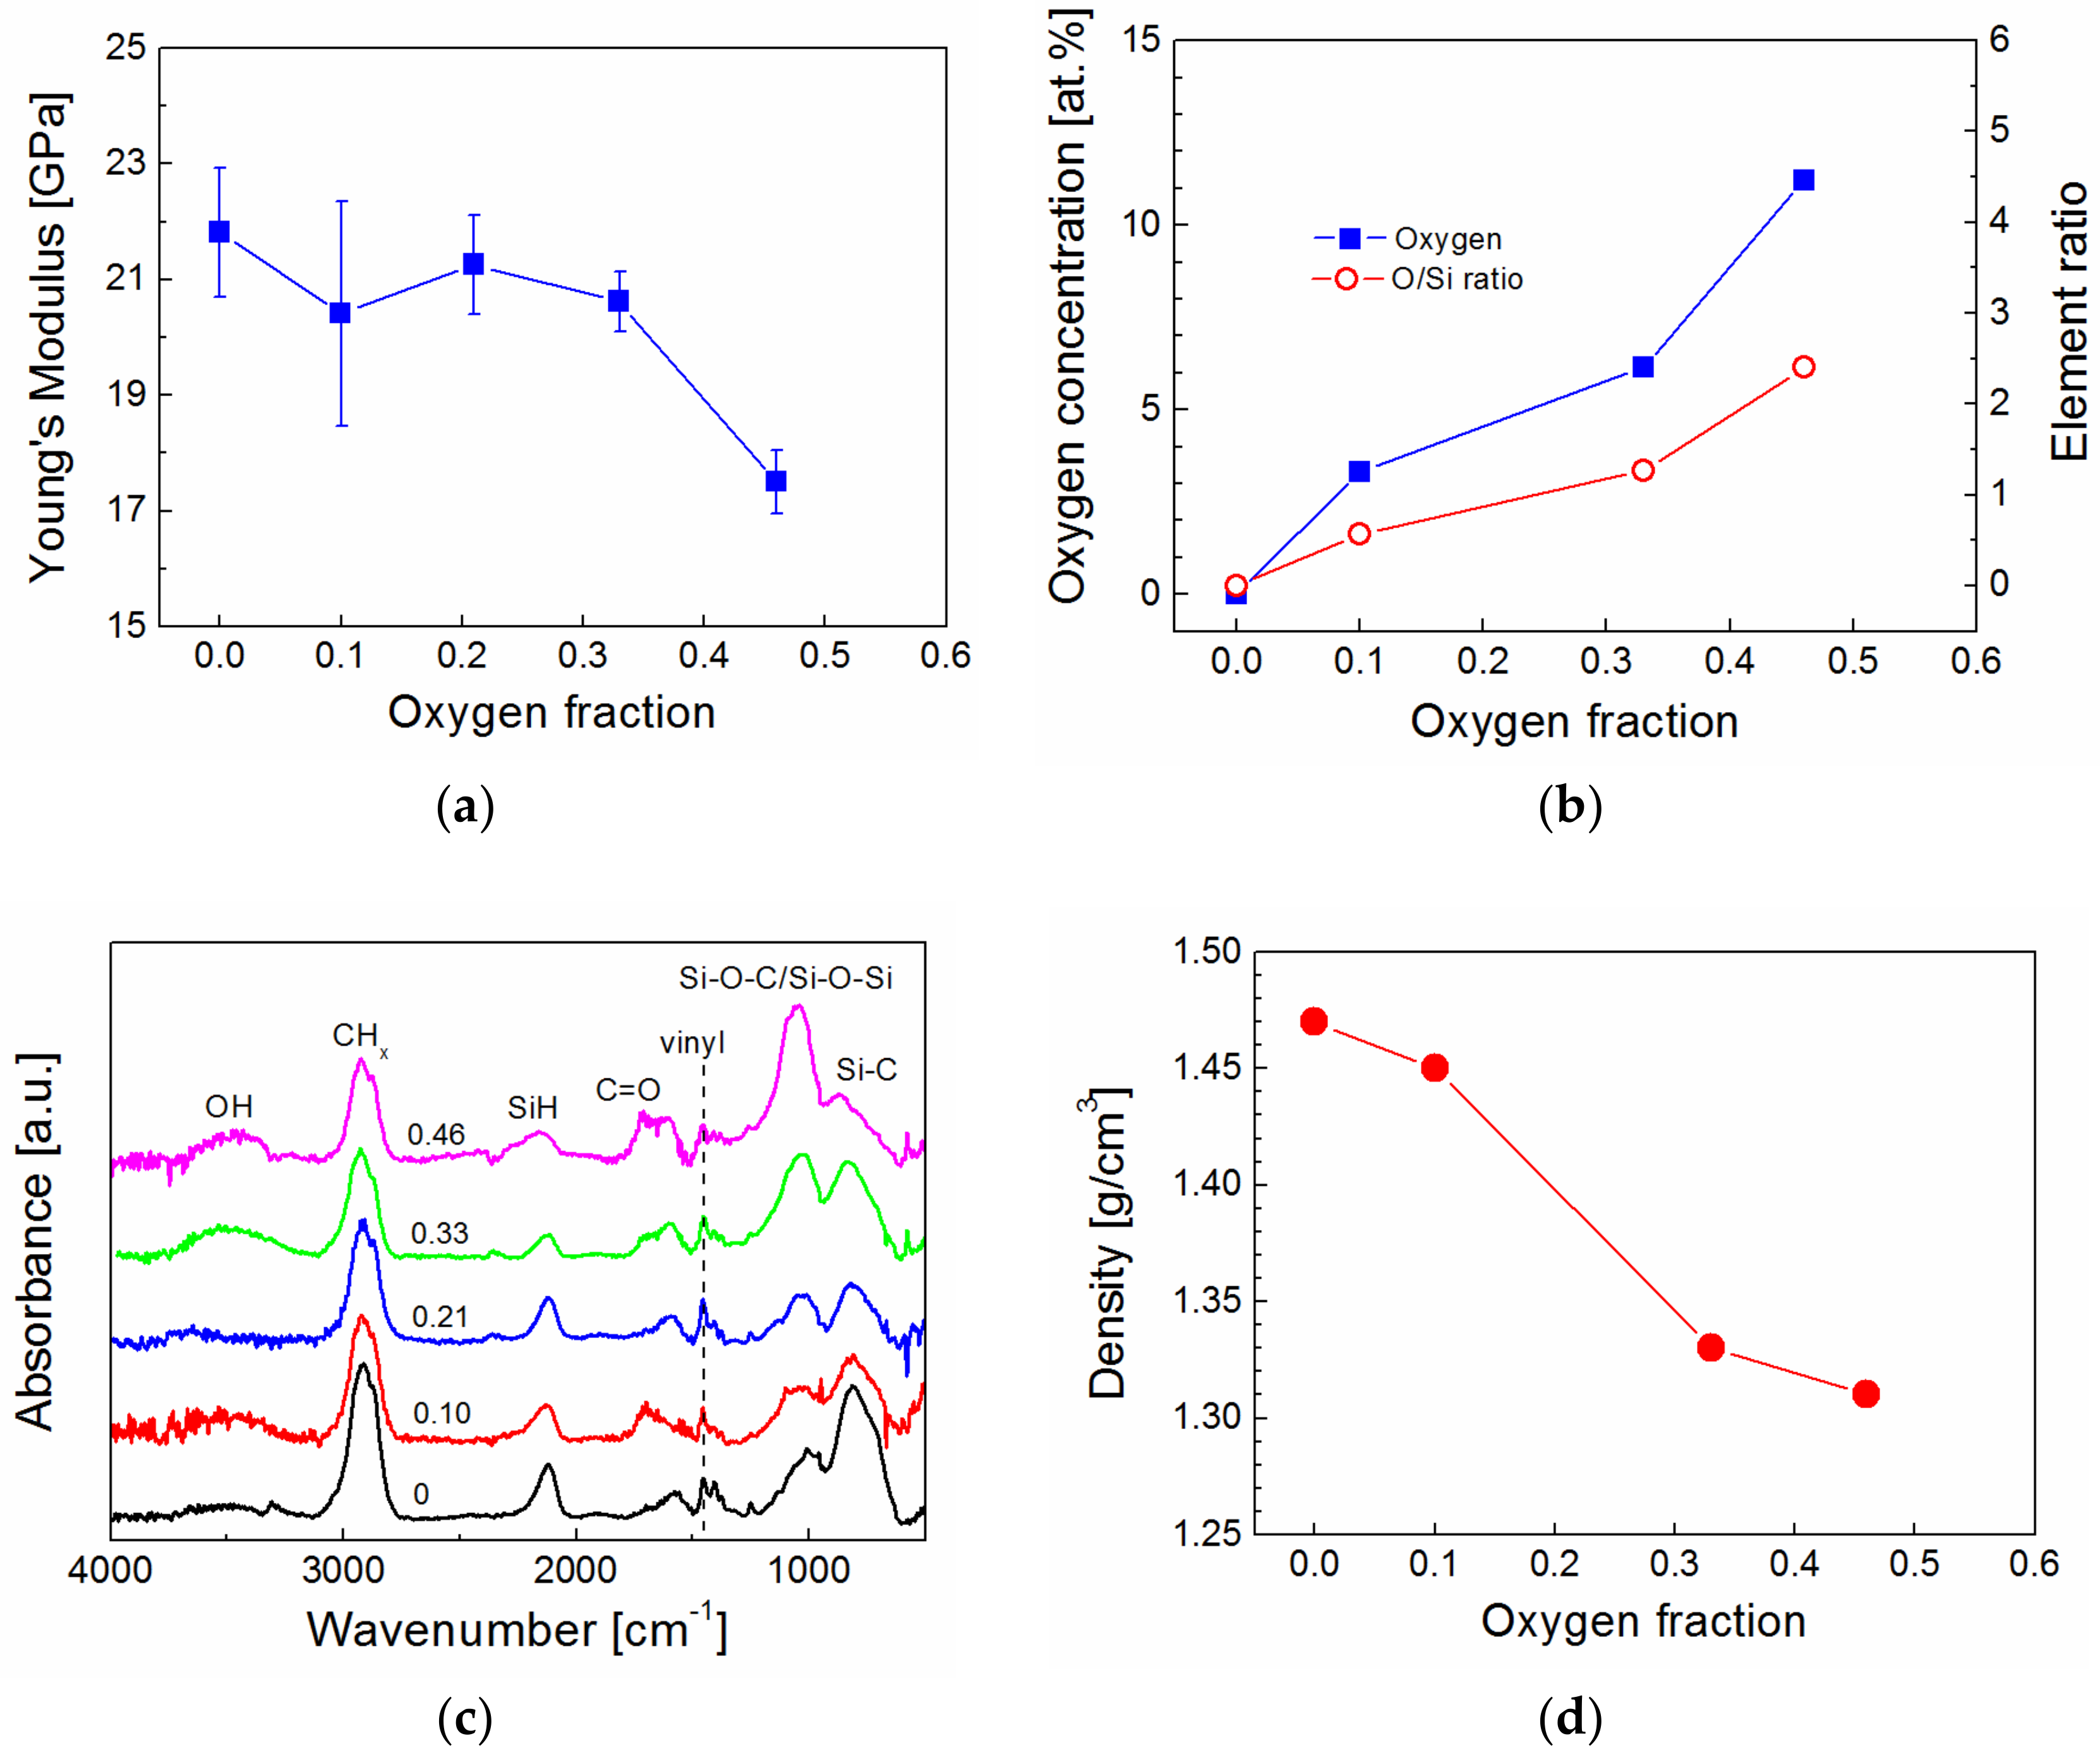
2 mixture varied from 0 to 0.46 (0, 0.10, 0.21, 0.33, and 0.46) in the RF helical coupling system. Using the same power, the power density in the RF helical coupling system was significantly lower, due to a higher volume of plasma discharge, compared to the plasma reactor equipped with parallel electrodes. This means that plasma coatings synthetized in the RF helical coupling system contain a higher concentration of hydrogen atoms and are less cross-linked. The Young’s modulus of plasma coatings deposited on silicon wafers was determined from nanoindentation measurements for various oxygen fractions in the TVS/O
2 mixture (
Figure 7a). The Young’s modulus decreased from 22 to 18 GPa as a result of an increase in oxygen concentration from 0 to 11 atom% in a-CSiO:H films (
Figure 7b). Chemical analysis (RBS/ERDA) showed that the C/Si and H/Si ratios in all films were approximately 7.1 and 10, respectively, but the O/Si ratio increased from 0 to 2.4 with the enhanced oxygen fraction (
Figure 7b). FTIR spectra indicate that oxygen atoms were incorporated into hydroxyl, carbonyl, and Si–O–C/Si–O–Si species, and the intensity and area of the absorption bands increased with enhanced oxygen fraction (
Figure 7c). This trend is consistent with the previous analysis [
39]. This means that the number of Si–C species in the a-CSi:H film deposited from pure TVS were reduced at the expense of the newly formed Si–O–C species in a-CSiO:H films synthetized from TVS in a mixture with oxygen gas. An increase in the number of Si–O–C/Si–O–Si species was important for increased adhesion at the interlayer/glass interface due to chemical reactions of plasma species with hydroxyl groups on the surface of the glass. By increasing the oxygen fraction, only a slight reduction of the vinyl groups in the film can be expected (
Figure 7c). The vinyl groups on the interlayer surface are responsible for chemical bonding with the polyester resin during the curing process. The formation of hydroxyl and carbonyl groups eliminates one and two bonds, respectively, from each carbon atom that could potentially be used for cross-linking the network. Therefore, decreased cross-linking of the carbon-silicon oxide network with an increased oxygen fraction resulted in a film density reduction of 1.47 to 1.31 g/cm
3 (
Figure 7d), as determined from the RBS spectra, and also resulted in a reduced Young’s modulus (
Figure 7a).
Interlayers with the properties shown in
Figure 7 were also deposited on an unsized GF bundle of 1600 single filaments. The GF bundle was positioned along the axis of the axially symmetric plasma, resulting in the deposition of a uniform and homogeneous coating around the fibers [
36]. TVS molecules were fragmented during the plasma process to form free radicals, and these highly reactive radicals recombined on the surface of the GFs to form an interlayer. Because of the low pressure (1.4 Pa) during the plasma process, free radicals diffuse into the central part of the GF bundle and form an interlayer even on the surface of the central fibers. The thickness of the interlayer is controlled by deposition time at a known deposition rate, which is constant during deposition. However, the interlayer on the central fibers is thinner than that on the fibers at the edge of the bundle, because the deposition rate decreases radially into the GF bundle due to the shadow effect of the surrounding fibers. We found that the thickness of the film deposited on the silicon wafer under a single GF was reduced by a factor of 0.9, due to the shadow effect, after the deposition process with plan-parallel electrodes. Multiple shielding can be expressed in a geometric series as
tn =
ts qn − 1, where
ts is the film thickness on the fiber at the edge of the bundle,
tn is the film thickness on the
n-th fiber in the direction toward the center of the bundle shielded by
n − 1 fibers, and
q is the shielding factor. For the GF bundle with a circular cross-section of 1600 single filaments, 22 is the order of the fiber in the center of bundle, and for
ts = 1.0 µm,
q = 0.9, the film thickness is
t22 = 109 nm on the central GF. The thickness of the interlayer on the central GF is, therefore, ten times smaller than the thickness of the interlayer on the fiber at the edge of the bundle. The expected thickness of the interlayer varied between 1.0 and 0.1 µm across the GF bundle for all tested GFs. The plasma-coated GF bundle was embedded in the polyester resin, and was cured to form a unidirectional GF/polyester composite. The polished cross-section of the composite sample was subjected to microindentation testing for the IFSS evaluation. The mean value and its standard deviation were calculated from measurements of ten fibers selected from different parts of the bundle cross-section. No evident differences between IFSS values for central and edge fibers were observed, which corresponds to the previous results [
34]. The dependence of IFSS on the oxygen fraction in the TVS/O
2 mixture for plasma-coated GFs with an interlayer thickness of 1.0 μm (edge fibers) at an effective power of 5.0 W is given in
Figure 8a. The IFSS (blue square) ranged from 130 to 139 MPa at a fiber volume fraction of approximately 0.53 in the GF/polyester composite. The maximum IFSS at a 0.33 oxygen fraction corresponds to the highest adhesion of the interlayer on glass substrate characterized by the work of adhesion (red circle) [
38]. A 3.4-fold increase in the adhesion of the a-CSiO:H film (0.33 oxygen fraction), due to a raised concentration of Si–O–C/Si–O–Si bonding species at the interlayer/glass interface, compared to the a-CSi:H film (zero oxygen fraction) was promising for using the adhesive film as a functional interlayer in the GF/polyester composite. The IFSS trend corresponds to the adhesion trend (
Figure 8a), but the statistical significance of the maximum IFSS is not entirely convincing. Although there are differences between the microindentation test and the nanoscratch test in the specimen loading and failure mechanics, and both the IFSS and the work of adhesion are calculated based on simplified assumptions, the interlayer adhesion on the glass surface was shown to control the shear strength in the GF/polyester composite [
38].
The effect of GF pretreatment and post-treatment of plasma-coated GFs on IFSS is demonstrated for the same Interlayer A (type A: 0.33 oxygen fraction, 5.0 W) in
Figure 8b. The strong adhesion at the interlayer/fiber interface was primarily achieved by pretreatment of GFs with O
2 plasma, which cleans and activates the fiber surface due to physical and chemical etching before the interlayer is deposited. The deposition of Interlayer A on GFs without pretreatment resulted in a significant reduction of IFSS to 83 MPa compared to 139 MPa for GFs pretreated with O
2 plasma at 25 W for 60 min (
Figure 8b). Ar gas (4.0 sccm) was mixed with O
2 gas (0.5 sccm) to increase the degree of ionization during the pretreatment of GFs, but the IFSS of 139 GPa was the same as in the pretreatment with O
2 plasma using the same Interlayer A. The IFSS value was reduced to 123 GPa when Ar/O
2 plasma was applied for 45 min followed by O
2 plasma for 15 min during the pretreatment procedure. This means that the cleaning and activation of the GF surface was not so effective, probably because of the interruption of the pretreatment process to change the gas mixture. This pretreatment method, however, was used for the other two samples, where, after the deposition of Interlayer A, the plasma-coated GFs were left in the reactor filled with TVS vapor for 10 s or 60 min without RF discharge. During this post-treatment procedure, the TVS molecules are not only physisorbed, but also chemisorbed on the chemically active surface of the interlayer that contains free radicals. An ultrathin overlayer, rich in vinyl groups, is formed on the interlayer surface during the application of TVS vapor. This layer may be important for improved adhesion at the polymer matrix/interlayer interface due to chemical bonding of vinyl groups with polyester resin during the curing process. Progress in the IFSS of 8 and 20 MPa (up to 143 MPa) was found for the interlayer, post-treated for 10 s and 60 min, respectively.
Interlayer B, deposited from pure TVS at an effective power of 0.1 W, contains no polar groups, but contains a higher concentration of vinyl groups compared to Interlayer A, as evident from the FTIR spectra (
Figure 9a). Interlayer B could, therefore, be used to improve chemical bonding between the polymer matrix and the interlayer, similar to the ultrathin overlayer deposited from TVS vapor during the post-treatment procedure. In addition, Interlayer B has a lower Young’s modulus of 9.4 GPa [
36], which is beneficial for decreasing shear stress across the interphase region (
Figure 6a). Interlayer B was combined with Interlayer A to form a bilayer that was tested to improve the IFSS in GF/polyester composites. Interlayer A, containing 6.1 atom% of oxygen, was deposited on the GF bundle followed by the oxygen-free Interlayer B in three thickness variations: 0.9 µm (Interlayer A) + 0.1 µm (Interlayer B), 0.1 µm (Interlayer A) + 0.9 µm (Interlayer B), and 0.05 µm (Interlayer A) + 0.05 µm (Interlayer B). The resulting IFSS values were compared with the single Interlayer A in
Figure 9b. All the results in
Figure 9b correspond to GFs pretreated with Ar/O
2 plasma for 45 min, followed by O
2 plasma for 15 min. The IFSS for bilayers was slightly higher by 1 to 4 MPa, which was statistically insignificant. The bilayer thickness was only 0.1 µm on edge fibers for the third bilayer, meaning that the bilayer thickness was only 0.01 µm on the central fibers. The final bilayer was prepared from the C and D interlayers by diluting the deposition plasma by adding 1.0 sccm of Ar gas to increase the ionization degree, and the total flow rate was, therefore, 1.8 sccm. Interlayer C was deposited from a TVS/O
2/Ar mixture with a 0.15 oxygen fraction and a 0.55 argon fraction at an effective power of 5.0 W, but Interlayer D was synthesized from a TVS/Ar mixture with a 0.55 argon fraction at 0.1 W. The deposition rates for this bilayer were not known, but a significantly reduced IFSS value of 47 MPa indicates that the bilayer thickness was not sufficient for a uniform fiber coating, probably <0.1 µm (edge fibers). This means that part of the GF surface was not covered by the interlayer.
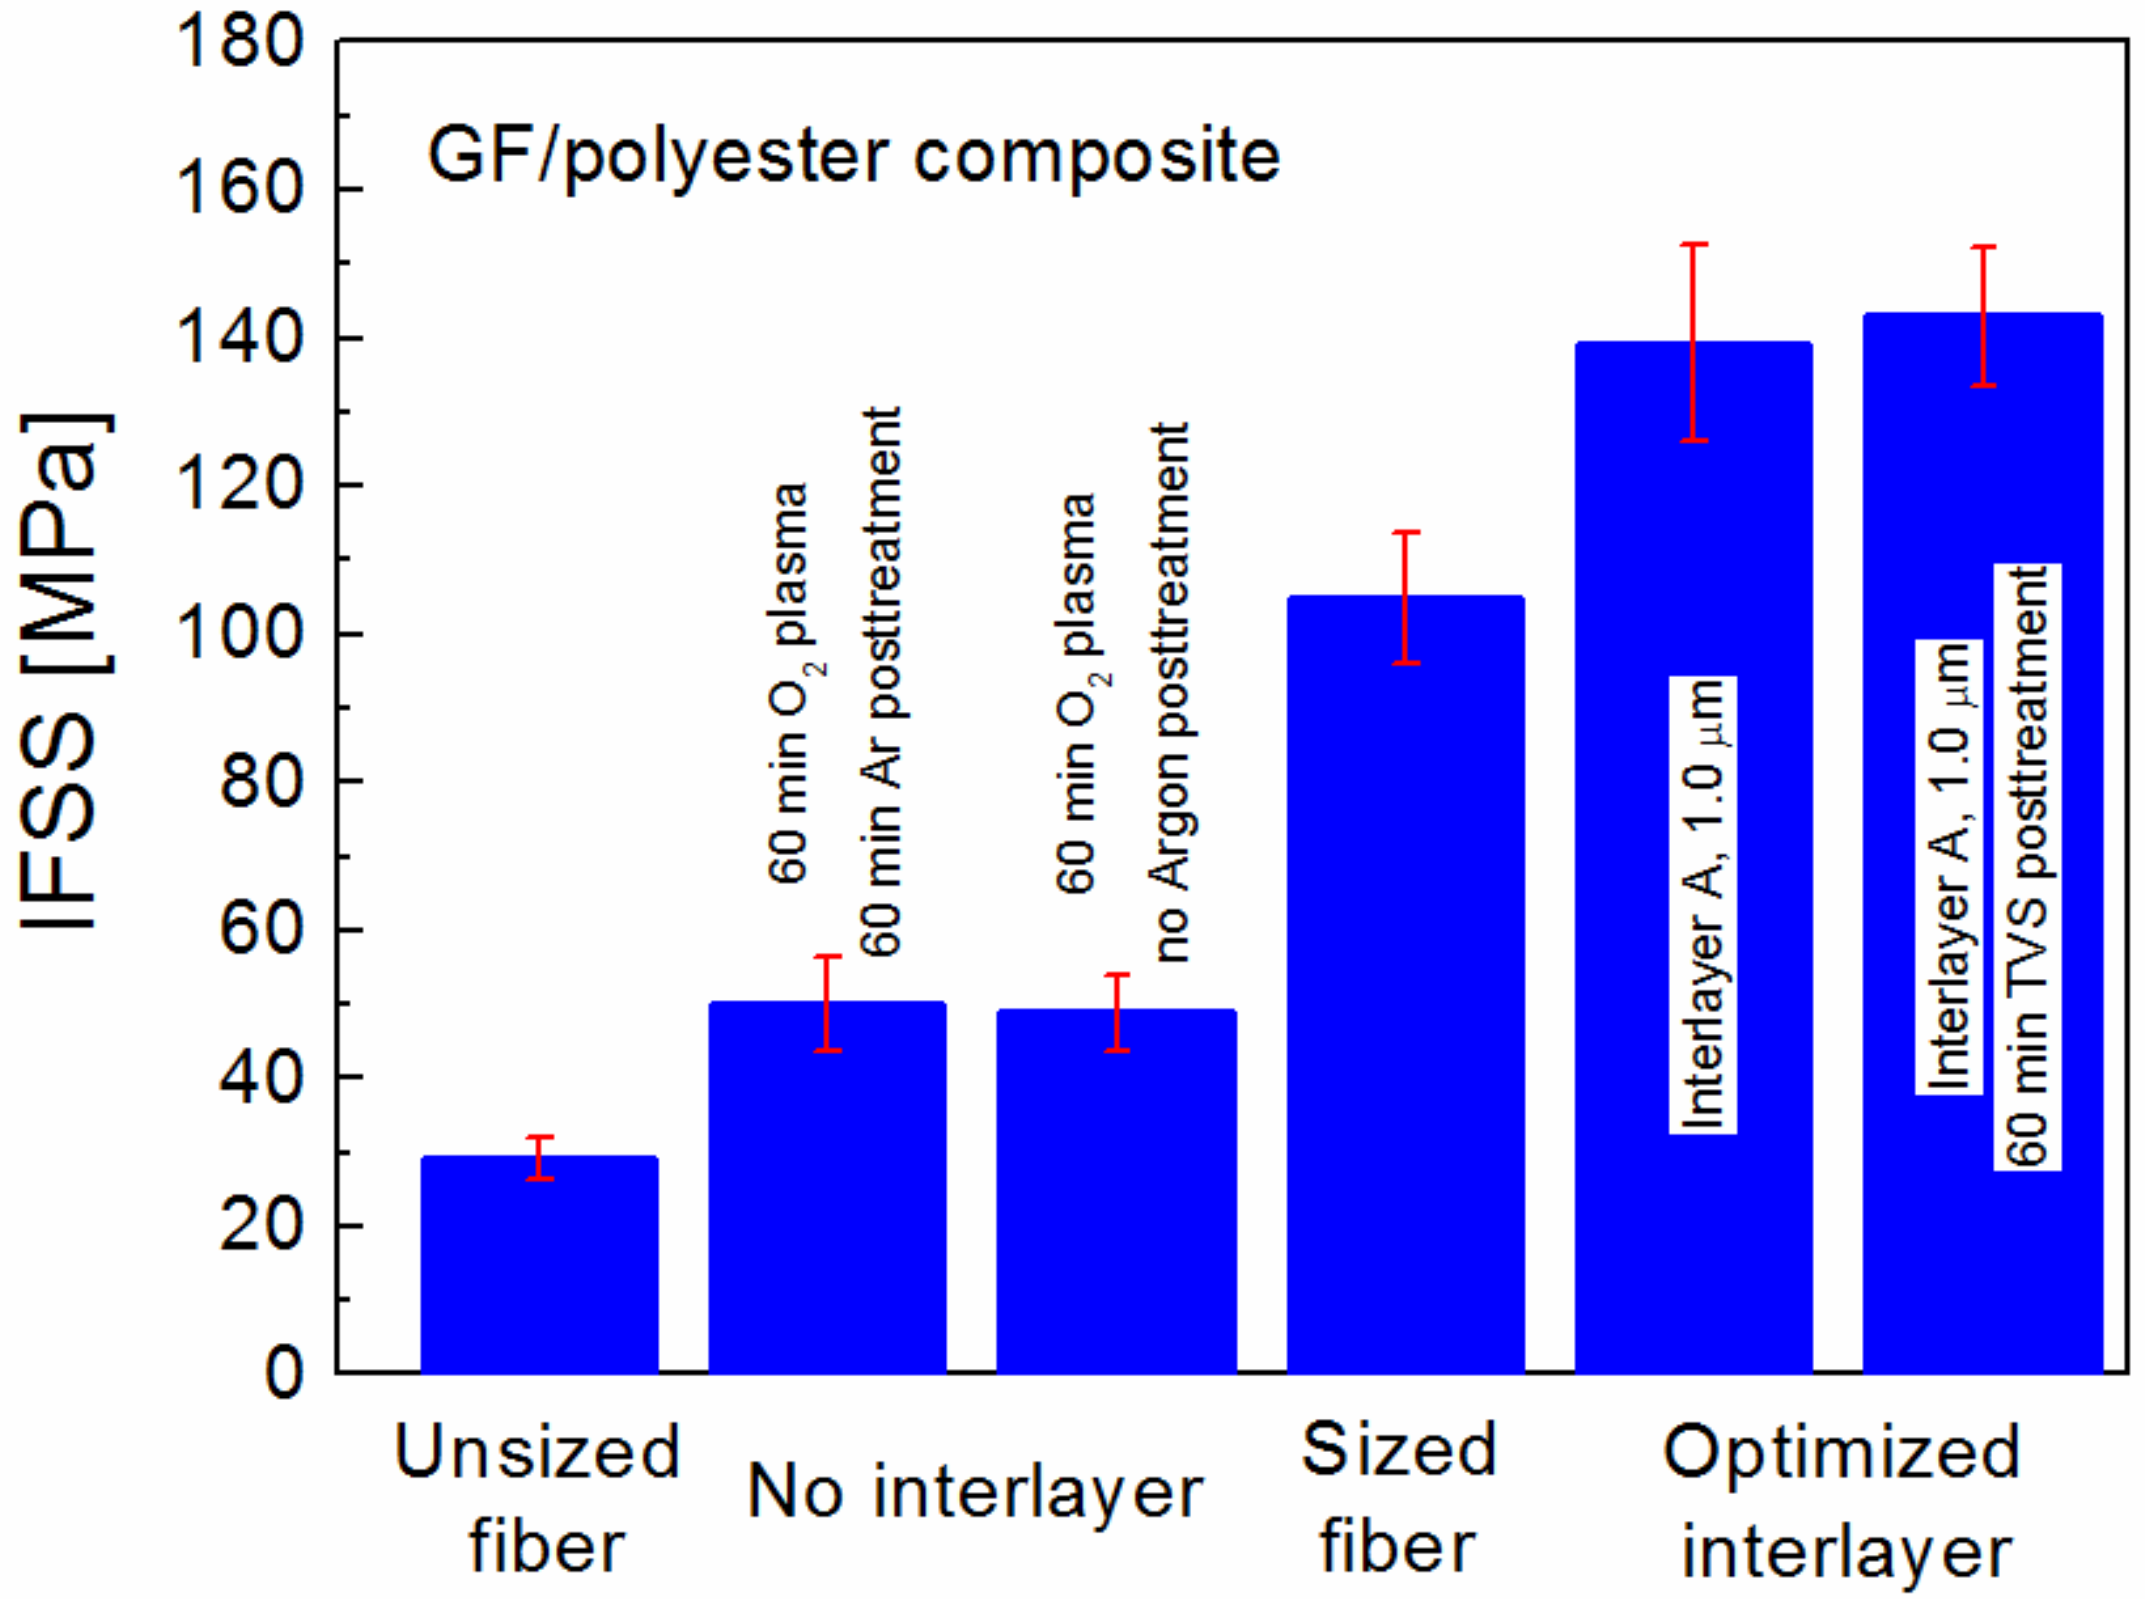
The final comparison of IFSS values for the GF/polyester composite in
Figure 10 includes unsized, O
2-plasma pretreated but uncoated, commercially sized, and optimized plasma-coated GFs. No chemical bonding at the polymer matrix/fiber interface for unsized GFs with an IFSS of 29 MPa is expected. O
2-plasma pretreatment of GFs without deposition of an interlayer resulted in improved interfacial adhesion at the polymer matrix/fiber interface, but the IFSS at 49–50 MPa was limited by the shear failure of the matrix, as demonstrated by model simulations [
34]. The IFSS of 105 MPa for commercially sized GFs was twice as high compared to GFs pretreated with O
2 plasma. However, the optimized Interlayer A deposited on O
2- or Ar/O
2-plasma pretreated GFs resulted in an IFSS of 139 MPa. A further increase in IFSS to 143 MPa was achieved by the subsequent post-treatment of Interlayer A in TVS vapor for 60 min.
Plasma coatings of tailored physicochemical properties have potential applications in high-performance polymer composites with a controlled interphase. Plasma nanotechnology is a promising technique for the construction of gradient interlayers needed for the new concept of composites without interfaces [
40].
