Article

Investigation of Transcrystalline Interphases in Polypropylene/Glass Fiber Composites Using Micromechanical Tests

Leibniz-Institut für Polymerforschung Dresden, e.V. (IPF) Hohe Str. 6, D-01069 Dresden, Germany
*
Author to whom correspondence should be addressed.
Fibers 2018, 6(1), 16; https://doi.org/10.3390/fib6010016
Submission received: 20 December 2017 / Revised: 26 January 2018 / Accepted: 30 January 2018 / Published: 12 March 2018
(This article belongs to the Special Issue Glass Fibers 2018)

Abstract

:
In composites, a strong interphase between the components is essential for mechanical properties. By using a suitable sizing (i.e., surface modification) of the fiber, the interphase may be varied, e.g., by suppressing or promoting heterogeneous nucleation of a thermoplastic matrix. In the latter case, three-dimensional transcrystallized interphases with properties differing from those of the bulk matrix are formed. Polypropylene-glass fiber composites are prepared as single-fiber model composites with (a) sizings either inducing or suppressing a transcrystalline interphase, (b) different amounts of modifier maleic acid anhydride grafted polypropylene, and (c) different molecular weights of the matrix polymer. These are studied in quasi-static or cyclic load tests. Static tests permit insights in the interfacial characteristics such as critical interface energy release rate, adhesion strength and frictional stress. Cyclic tests on these model composites can be used to study the nature of dissipative processes and the damage behavior. Atomic Force Microscopy (AFM) investigations of the fiber fracture surfaces provide supplementary information. The transcrystalline layer can indeed improve the mechanical parameters (a 70–100% increase of strength and a 25 or 125% increase in toughness, depending on the molecular weight (MW) of the matrix polymer at low modifier concentration). However, the effect is partially neutralized by an opposing effect: high nucleation in the bulk in samples with commonly used concentrations of modifier.

1. Introduction

Semicrystalline thermoplastics crystallize in spherulites. In absence of external nuclei, the homogeneous crystallization can only occur at temperatures below the crystallization temperature Tcr. The nucleation rate is material-dependent, it generally increases with the temperature difference Tcr-T [1]. Once nucleated, the growth of spherulites in the bulk occurs in all directions until it reaches the neighboring spherulites, which impede further growth. On surfaces, the nucleation may occur by heterogeneous nucleation at the surface and can be significantly higher than in the bulk. In this case, the impedation by neighboring crystallites occurs almost immediately in the lateral directions, leaving only the outward direction for crystal growth. Thus, a so-called transcrystalline (TC) layer at the surface is formed. Transcrystallization is a nucleation controlled crystallization process which can occur in a semicrystalline polymer in contact with a second material [2,3]. The growth mechanism itself, as well as the growth rate, is identical in the bulk and within the TC layer [4,5,6,7]. The thickness of the TC layer is therefore determined by the different rates of the two nucleation processes in the bulk and at the surface, in relation to the growth rate [5,8,9]. These three quantities depend on a number of thermodynamic and physicochemical conditions, such as the surface free energy, the nucleation density and the sample temperature.
In the case of a semicrystalline thermoplastic/glass fiber (GF) composite, the fiber surface may be sized with the aim to induce a high nucleation density. The closely packed nuclei enforce a primarily outward growth of the crystallites. This leads to a TC interphase layer between the fiber surface and the semicrystalline bulk. Since early reports of transcrystallization [10,11], much effort has been put into the topic and there is still a controversial discussion, as the existence and structure of a TC layer have significant influence on the mechanical properties of the composite [1,4,5,6,12,13,14,15,16,17].
The surface free energy is determined by the type of fiber and the sizing or finish components, especially the coupling agent. The nucleation density can be increased by appropriate sizing components at the surface or by matrix additives for the bulk [18,19,20]. The roughness of the fibers can play a role [5,14,18], especially if epitaxial ordering at the surface is possible [21,22]. The sample temperature influences the nucleation rate at the interface and in the bulk, and the crystallization kinetics [23,24]. Due to the memory effect of incompletely melted polymer crystals, the “temperature history” since the last complete melting plays a role.
Occasionally, the term „transcrystallization“ is used in the literature in connection with another phenomenon [25,26]. By applying a shear stress along the fiber axis, a columnar superstructure is formed even at T > Tcr,trans which resembles a TC layer. It was even supposed that TC layers only occur as a result of shearing. However, Wu et al. [27] observed that shear leads to a cylindric crystallization. Varga and Karger-Kocsis [28] determined that this structure does not lead to increased adhesion strength, as the cylindric crystallites are nucleated homogeneously, unlike the heterogeneous nucleation of the TC layer, so no physical coupling occurs.

1.1. Structure of the TC Interphase

According to Pompe und Mäder [20], three different sections of the TC layer can be specified (Figure 1), which are influenced by the above mentioned parameters.
Section 1, the nucleation region, includes the interface between fiber and the TC part of the matrix. It is here the nucleation takes place. A TC layer is only formed if the nucleation rate at the surface is higher than in the bulk, e.g., if the crystallization temperature of the interface induced nucleation is higher than that of the bulk crystallization, Tcr,bulk < Tcr,TC. The thickness of Section 1 is determined by the roughness of the interface. The crystal morphology within a layer of the thickness of around the distance of two nuclei is less well ordered compared to the TC layer beyond, where the crystal growth direction is primarily perpendicular to the surface. Within the surface layer, the nuclei grow in a hemisphere, until they are impeded by the neighboring nuclei. For some fiber/matrix combinations, the nuclei themselves have a preferred crystal orientation.
The adjacent Section 2 is the homogeneous part of the TC layer. Its extension is delimited by the impeding bulk spherulites. When its thickness δi,2 is bigger, therefore, the more the TC layer can grow in the time interval between the nucleation at the interface and (a mean point in time of) bulk nucleation. These parameters can be adjusted via a sizing/finish with high nucleating ability, or by nucleating agents/nucleation suppressants within the polymer matrix. The crystal growth rate is determined by the temperature resp. the cooling rate. In the case of slow cooling or isothermal annealing at temperatures T with Tcr,bulk < T < Tcr,trans, an extended TC layer is formed [4,5,6,8,29]. In samples with high fiber density, the bulk spherulite region can even be fully suppressed [20].
Section 3 (cf. Figure 1) encloses the interface between the TC region and the surrounding bulk, i.e., between the TC and the spherulitic morphology. The thickness δi,3 of this section as well as the specific surface area of the interface are determined by the size of the bordering spherulites [12].

1.2. The TC Interphase and Its Impact on the Micromechanics and Composite Properties

The influence of a TC interphase on the mechanical properties of the composite is actively and controversially discussed in the literature [26,28,29,30,31,32]. Clark et al. [16] report on polyamide (PA)/GF or PA/carbon fiber (CF) composites with higher strength but lower toughness in the case of transcrystallinity. In another experiment [29,33], PA/GF-composites were cooled at different rates, resulting in TC layers of different thicknesses. The slowly cooled samples with thicker TC layers had a Young’s modulus increased by 30% and a bending modulus increased by 70%. However, slowing the cooling rate not only increased the TC layer thickness, but also the degree of crystallization of the matrix and the fraction of α-crystallized PA, making a comparison more difficult.
An intermediate step to study the interplay between the local crystal morphology and the composite properties is the micromechanical study of the influence of transcrystallization on the adhesion strength. The results so far are controversial. Bessel et al. [11] determined a reduced adhesion strength for TC samples. In a fragmentation test, Folkes and Wong [34] determined an increase in the critical fiber length, i.e., also a decrease of the adhesion strength due to TC layers in PP/GF composites. Similar results have been reported by Rolel et al. [35] for polyethylene (PE) matrix composites. In contrast, Carvalho and Bretas [36], Huson and McGill [31] as well as Feldman et al. [14] observed an increase in the adhesion strength due to transcrystallinity, for a number of different fibers in different thermoplastic matrices such as polypropylene (PP), polyethylene (PE) und polyamide (PA). Similarly, Clark et al. [15,16] found high interfacial shear strength and cohesive failure in TC samples, in contrast to adhesive failure of the interface in absence of a TC layer. Hsiao and Chen [30] observed that transcrystallinity had no significant effect on the adhesion strength for a number of composites. The situation is obviously complex, due to interaction and superposition of a number of parameters, influencing the interphase and the adhesion strength. The following paragraphs will discuss these parameters according to the scheme in Figure 1.
Section 1: this section is determined by the fiber interface, i.e., generally by the sizing or finish of the fiber. Sizings (on GF) or finishes (on CF) are used to increase the interfacial strength. Considering transcrystallinity, it is of importance if the surface can induce nuclei for heterogeneous crystallization. The resulting TC layers should act as a “physical coupling” between fiber and matrix [15], increasing the shear strength of this first section. This has been experimentally confirmed [37]. However, usually the TC is reached via a sizing, which also influences the adhesion. In the present work, GF composites are compared whose sizings are identical except for the film former, with the aim to modify the nucleating properties at comparable adhesion strengths.
Section 2: The homogeneous region of the TC layer influences the composite properties via the properties of the TC morphology as compared to that of the bulk. The degree of crystallization is often higher than in the spherulitically crystallized regions [38]. Karger-Kocsis proposes that in an extended Section 2 the crystallization shrinkage might lead to a weak interface [39]. In the TC layer, the crystallites are smaller and radially aligned in reference to the fiber direction.
There are few experimental results focusing on this region in fiber-reinforced systems. By using specific scanning probe microscopic techniques (phase imaging, nanoindentation), the extension and the Young’s modulus of the interphase between GF and PP matrix could be determined [40]. Within a TC layer, the local modulus is higher than in the bulk. Folkes and Hardwick [41] found an increase of storage modulus E’ by a factor of 2 and higher shear and tensile strengths for a TC layer compared to a finely spherulitic layer. Marom et al. [38] confirmed these results by dynamic mechanical studies of microtomed sections containing predominantly TC polymer. The TC layer forming samples were more brittle and the fracture energy was smaller than comparable bulk samples. Microbeam synchrotron measurements of TC PP showed that under small load, no change in the microstructure is visible [42]. The authors attribute this to an “anchoring” of the TC layer lamella, confining the strain mainly to the amorphous phase.
Section 3: At the contact of the two crystallization fronts, a second interface is formed in Section 3. This interface is mechanically weak, due to the enrichment of low molecular weight species [43,44] as well as due to low entanglement density [45].
Transcrystallinity occurs in many technically relevant thermoplastics. It has a great influence on composite properties. The existence of a TC layer depends on a number of parameters, on the combination of the materials used as well as on processing conditions. More often than not, the resulting effect of TC morphology is an improvement, but this is by no means unequivocal. The aim of the present work is to study the effect of adhesion strength in PP/GF microcomposites where the fiber sizings are as similar as possible while either inducing a TC crystallization or suppressing it.

2. Experimental

2.1. Methods

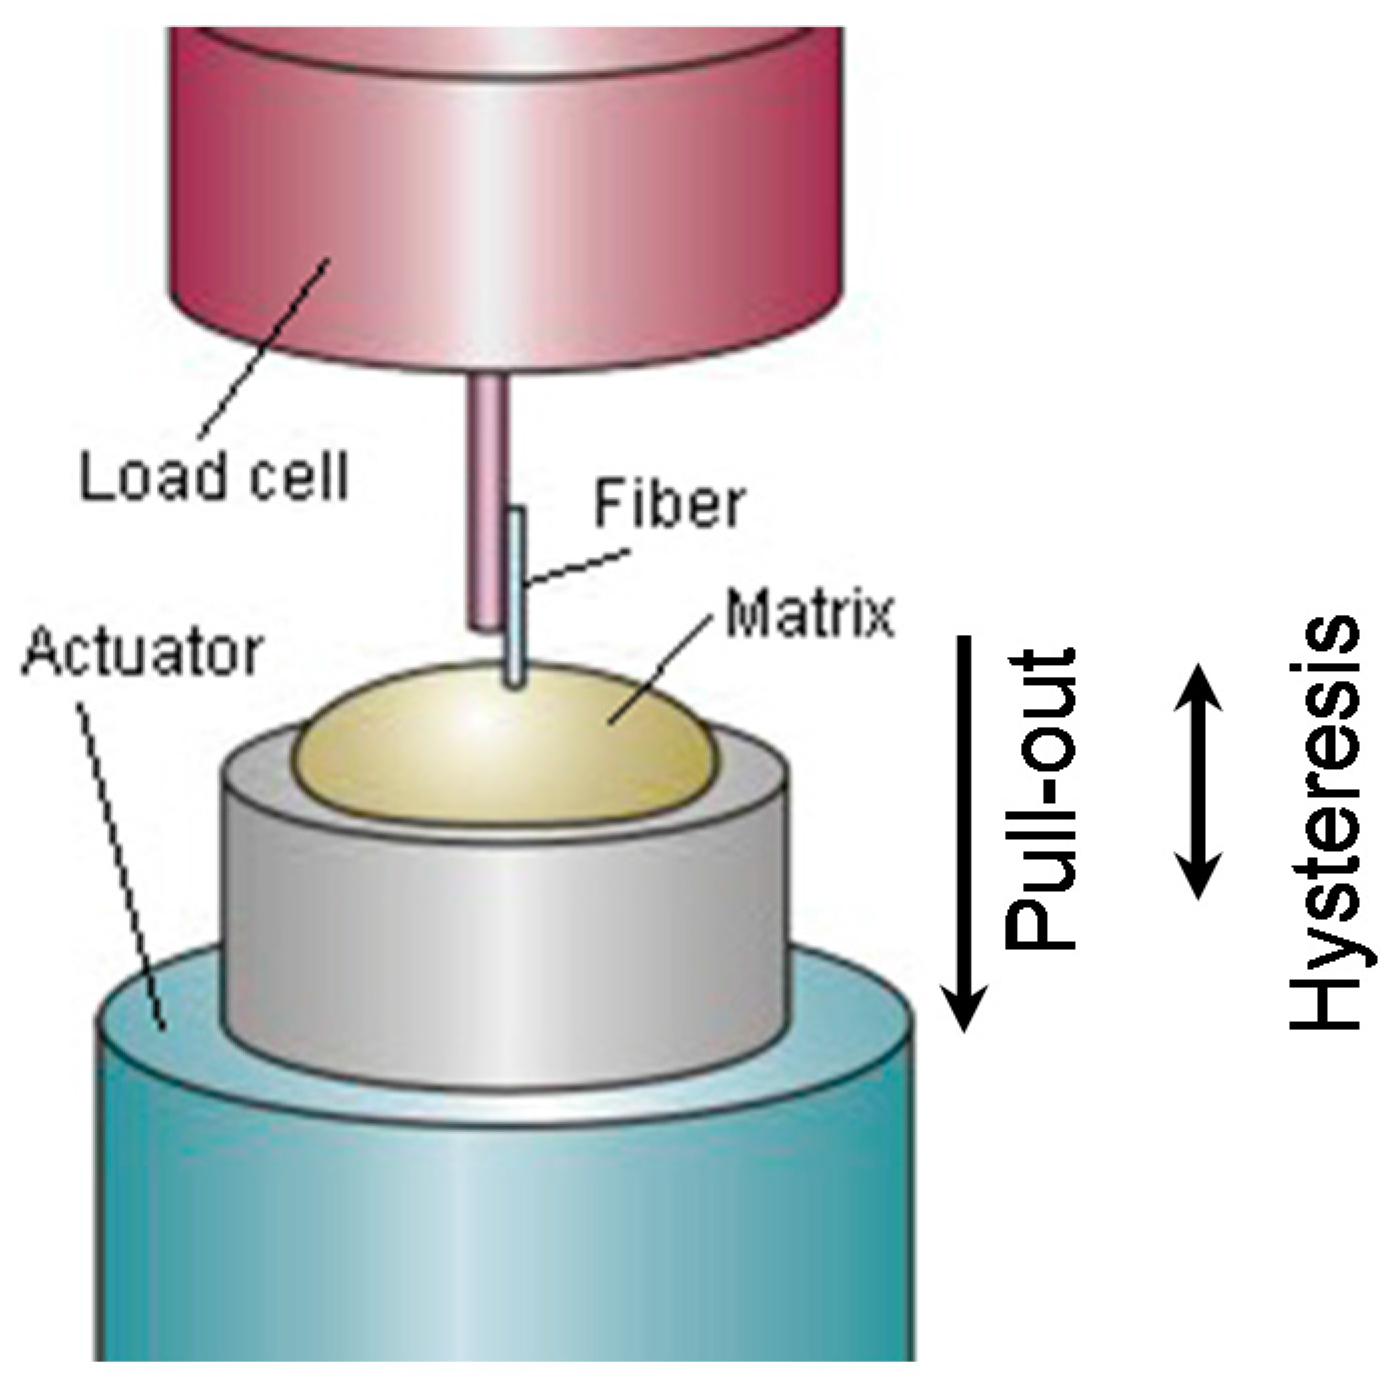
In the last decade, several pieces of micromechanical equipment have been developed and set up at the IPF to investigate the interphase characteristics between fiber and matrix in composites. The micromechanical experiments include quasi-static pull-out tests, a hysteresis/micro-fatigue test as well as a dynamic test with sinusoidal loads up to 350 Hz. Figure 2 presents a scheme of the experiments. A vessel with matrix and an end-embedded fiber is clamped on an actuator that generates the displacement. The fiber end protruding out of the matrix is glued onto a mandrel that is fixed to a force sensor.
The investigation of the adhesion strength parameters between fiber and polymer matrix is carried out with the pull-out setup [46]. Force-displacement curves are obtained by quasi-statically pulling a single fiber out of a polymer matrix. One distinctive feature of the device is the extremely low pull-out speed down to 10 nm/s. Forces between 1 mN to 5 N can be detected by a load cell. The experiment as well as data acquisition, analysis and statistical evaluation are performed by means of a “traditional approach” [47,48].
For the hysteresis and long-term loading test, the fiber is periodically loaded and the hysteresis loop is analyzed for the failure behavior [49]. The general setup (cf. Figure 2) is optimized for hysteresis measurements (low frequency range: 0–10 Hz) of single-fiber model composites, especially for long-term tests. A piezotranslator in combination with a piezoresistive load cell provides a zero backlash deflection and a long-term stable force measurement. Measurement data are the amplitude of the measured value, hysteresis, root point drift as well as elastic and loss energy. In long-term load tests (e.g., Wöhler, relaxation or load increase tests), the periodic change of the phase angle between force and elongation and the periodic change of stiffness and damping are analyzed.
An atomic force microscope AFM (Bruker, dimension) was used in the tapping mode to characterize the fiber surface and fracture surfaces.
Polarization microscopy is used to study the crystallization behavior of the PP matrix. Matrix material and separated single fibers are sandwiched between two glass plates. The thickness of the layer is determined by spacers (150 µm). The sandwiches are observed by polarization microscopy (Scope A1, Carl Zeiss, Oberkochen, Germany) using a hot plate (LTS350, Linkam, Tadworth, UK). The sandwich structures were heated to 192 °C for five minutes to fully melt the matrix. Then they are cooled to the crystallization temperature at 60 K/min.

2.2. Materials

GF were spun at the IPF spinning device. Yarns of 204 filaments were spun and sized with aqueous sizings. Two sizings are compared:
On the one hand APS-PP containing gamma aminopropyl triethoxisilane (APS) as coupling agent, and a PP film former (maleic acid anhydride grafted PP, MaPP), and on the other hand APS-PU with the coupling agent APS and a polyurethane (PU) film former. They are referred to as APS-PP and APS-PU fibers, respectively. As matrix PP, HD 120MO PP homopolymer (Borealis, MFR 8 g/10 min), a typical injection molding grade, and HH 450 PP homopolymer (Borealis MFR 37 g/10 min) a typical grade for fiber spinning applications were used, and are referred to as hiMW and lowMW PP. The two matrices were functionalized by either 0.5 or 2.1 wt % MaPP Exxelor PO 1020 (ExxonMobil Corp., Irving, TX, USA).
Fibers and matrix were compounded on a twin screw extruder and injection molded into standardized dog bone shaped specimens. The average fiber length was approx. 500 µm in all samples.
Tensile tests were conducted on the Universal Testing Machine Zwick 1456 (Zwick-Roell, Ulm, Germany), according to ISO 527-2/1A/50. Unnotched Izod impact tests were conducted with HIT 50P, Zwick/Roell, Germany according to ISO 179/1eU at room temperature and 50% relative humidity. Each value obtained represents the average of ten specimens.
The single-fiber model composites for quasi-static pull-out, hysteresis and cyclic loading investigations are all prepared in the same manner by using the IPF-made fiber embedding device [50] An 80 mg drop of matrix is melted. The pneumatically held fiber is positioned above the matrix with the aid of two long-distance microscope optics, monitoring the xy-positioning resp. the z-coordinate of the fiber above the matrix. The fiber is embedded with a micro drive (embedding length: 20–1000 µm with 0.1 µm accuracy—however, due to the formation of a meniscus, the embedding length may vary and is therefore optically determined after each pull out test). The complete temperature pattern is controlled by a PC (room temperature (RT) to 400 °C with 1 K accuracy). The chamber may be flushed with Argon.

3. Results

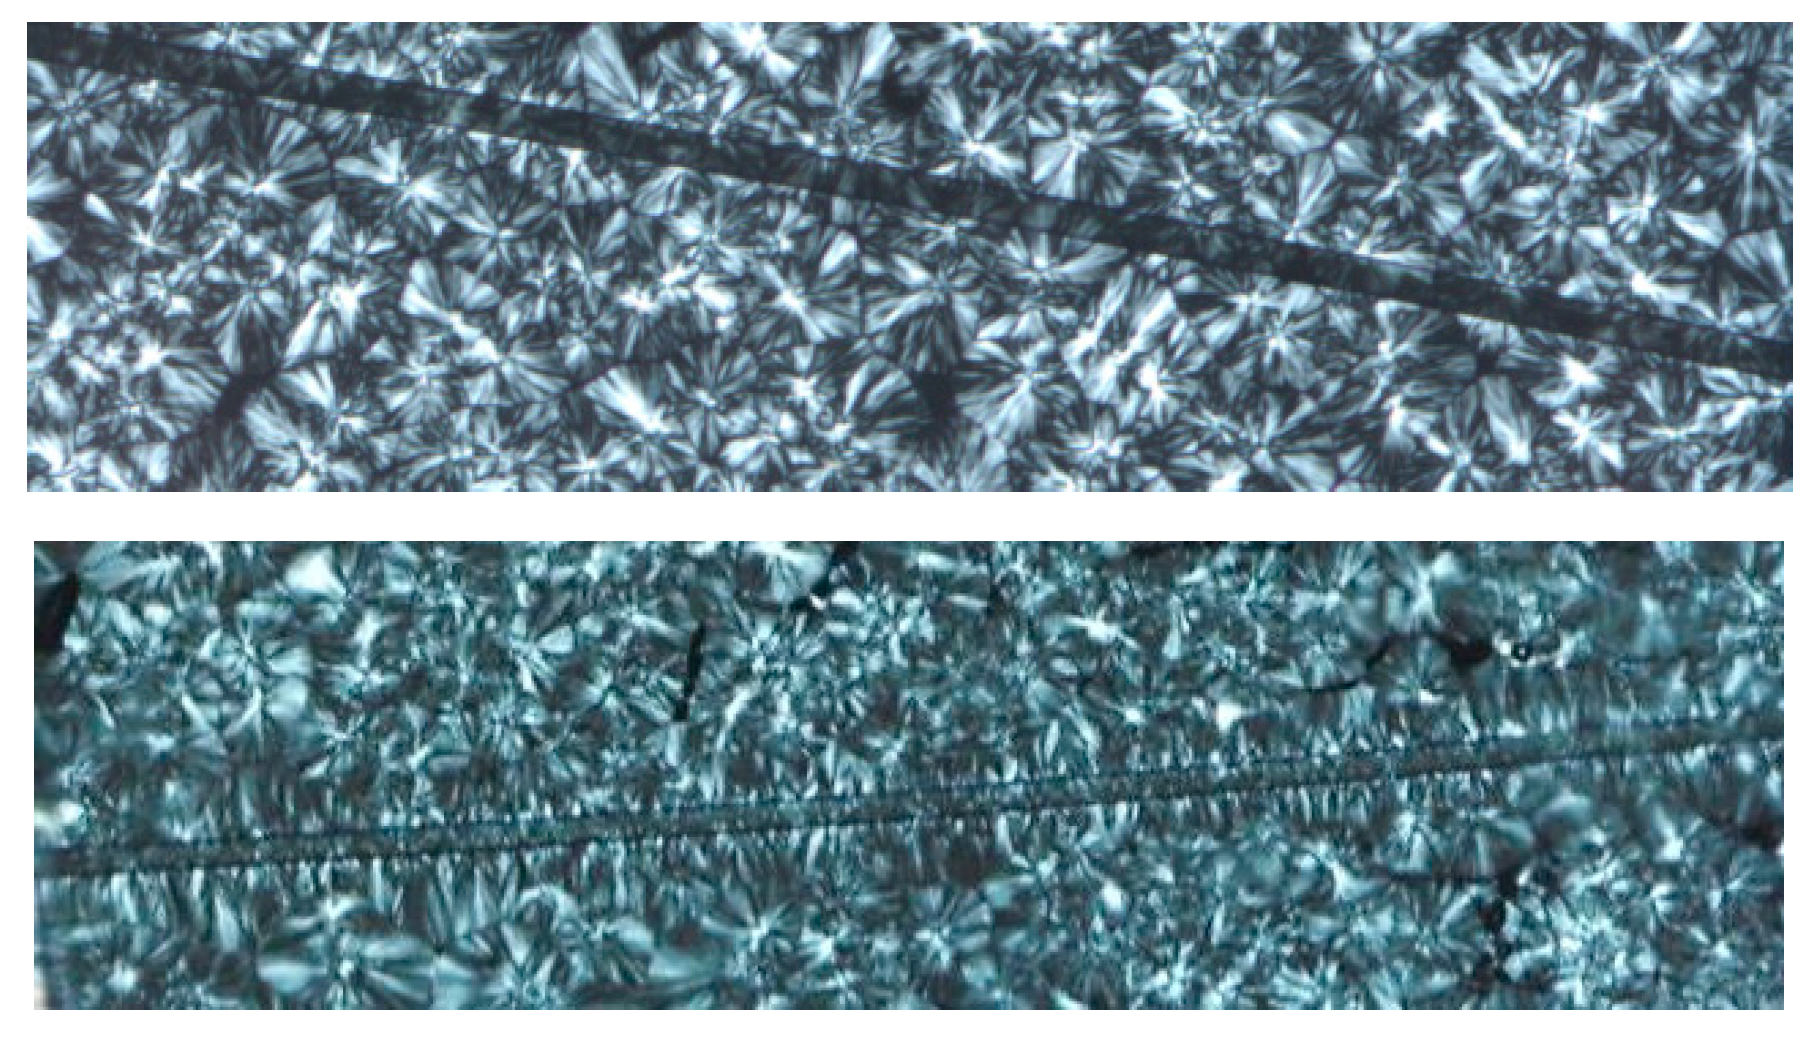
Figure 3 shows polarization micrographs of the single fiber in a neat HH450 PP film. Fibers were heated (10 K/min) to 210 °C for 0.50 min, then cooled at 200 K/min to the isothermal temperature Tiso = 135 °C, at which the crystallization behavior was observed.
Between crossed polarizers, the spherulites in the bulk PP film are clearly visible. Around the APS-PP sized fiber, a TC film of about 3 µm thickness is formed. This confirms an earlier differential scanning calorimetry study of the two sized fibers in PP, which showed that the APS-PU sized fiber induces no TC layer, whereas the APS-PP sized fiber induces a distinct TC layer [20].
The size of the spherulites for the two neat polymers is comparable. Adding 2% MaPP increases the nucleation density and therefore reduces the spherulite size, the crystallization is speeded up: the half time t50% is reduced by 15%.
A series of GF/PP composites were compounded and injection molded with varying MaPP content, with fiber sizing known to induce or suppress a TC layer and differing PP molecular weight. Table 1 shows the mechanical properties of injection molded GF/PP specimens. In GF/PP composites, usually a small percentage of MaPP is added to improve adhesion as the maleic moieties form covalent bonds with the APS or weaker bonds with the OH on the glass surface. A side effect of MaPP is the nucleation of spherulites in the bulk. This side effect reduces the thickness of the TC layer. Therefore, the mechanical properties are determined at two concentrations of MaPP, a technically relevant 2% and a low 0.5%. For both PP grades, there is a slight improvement of tensile strength due to the TC in the 2% MaPP samples. In the case of 0.5% MaPP specimens, the effect of the TC layer is far more pronounced (albeit at a lower mechanical level). The toughness is doubled in the case of the TC interphase in high MW PP. The Young’s modulus is increased strongly upon addition of GF, but does not depend on the TC interphase.
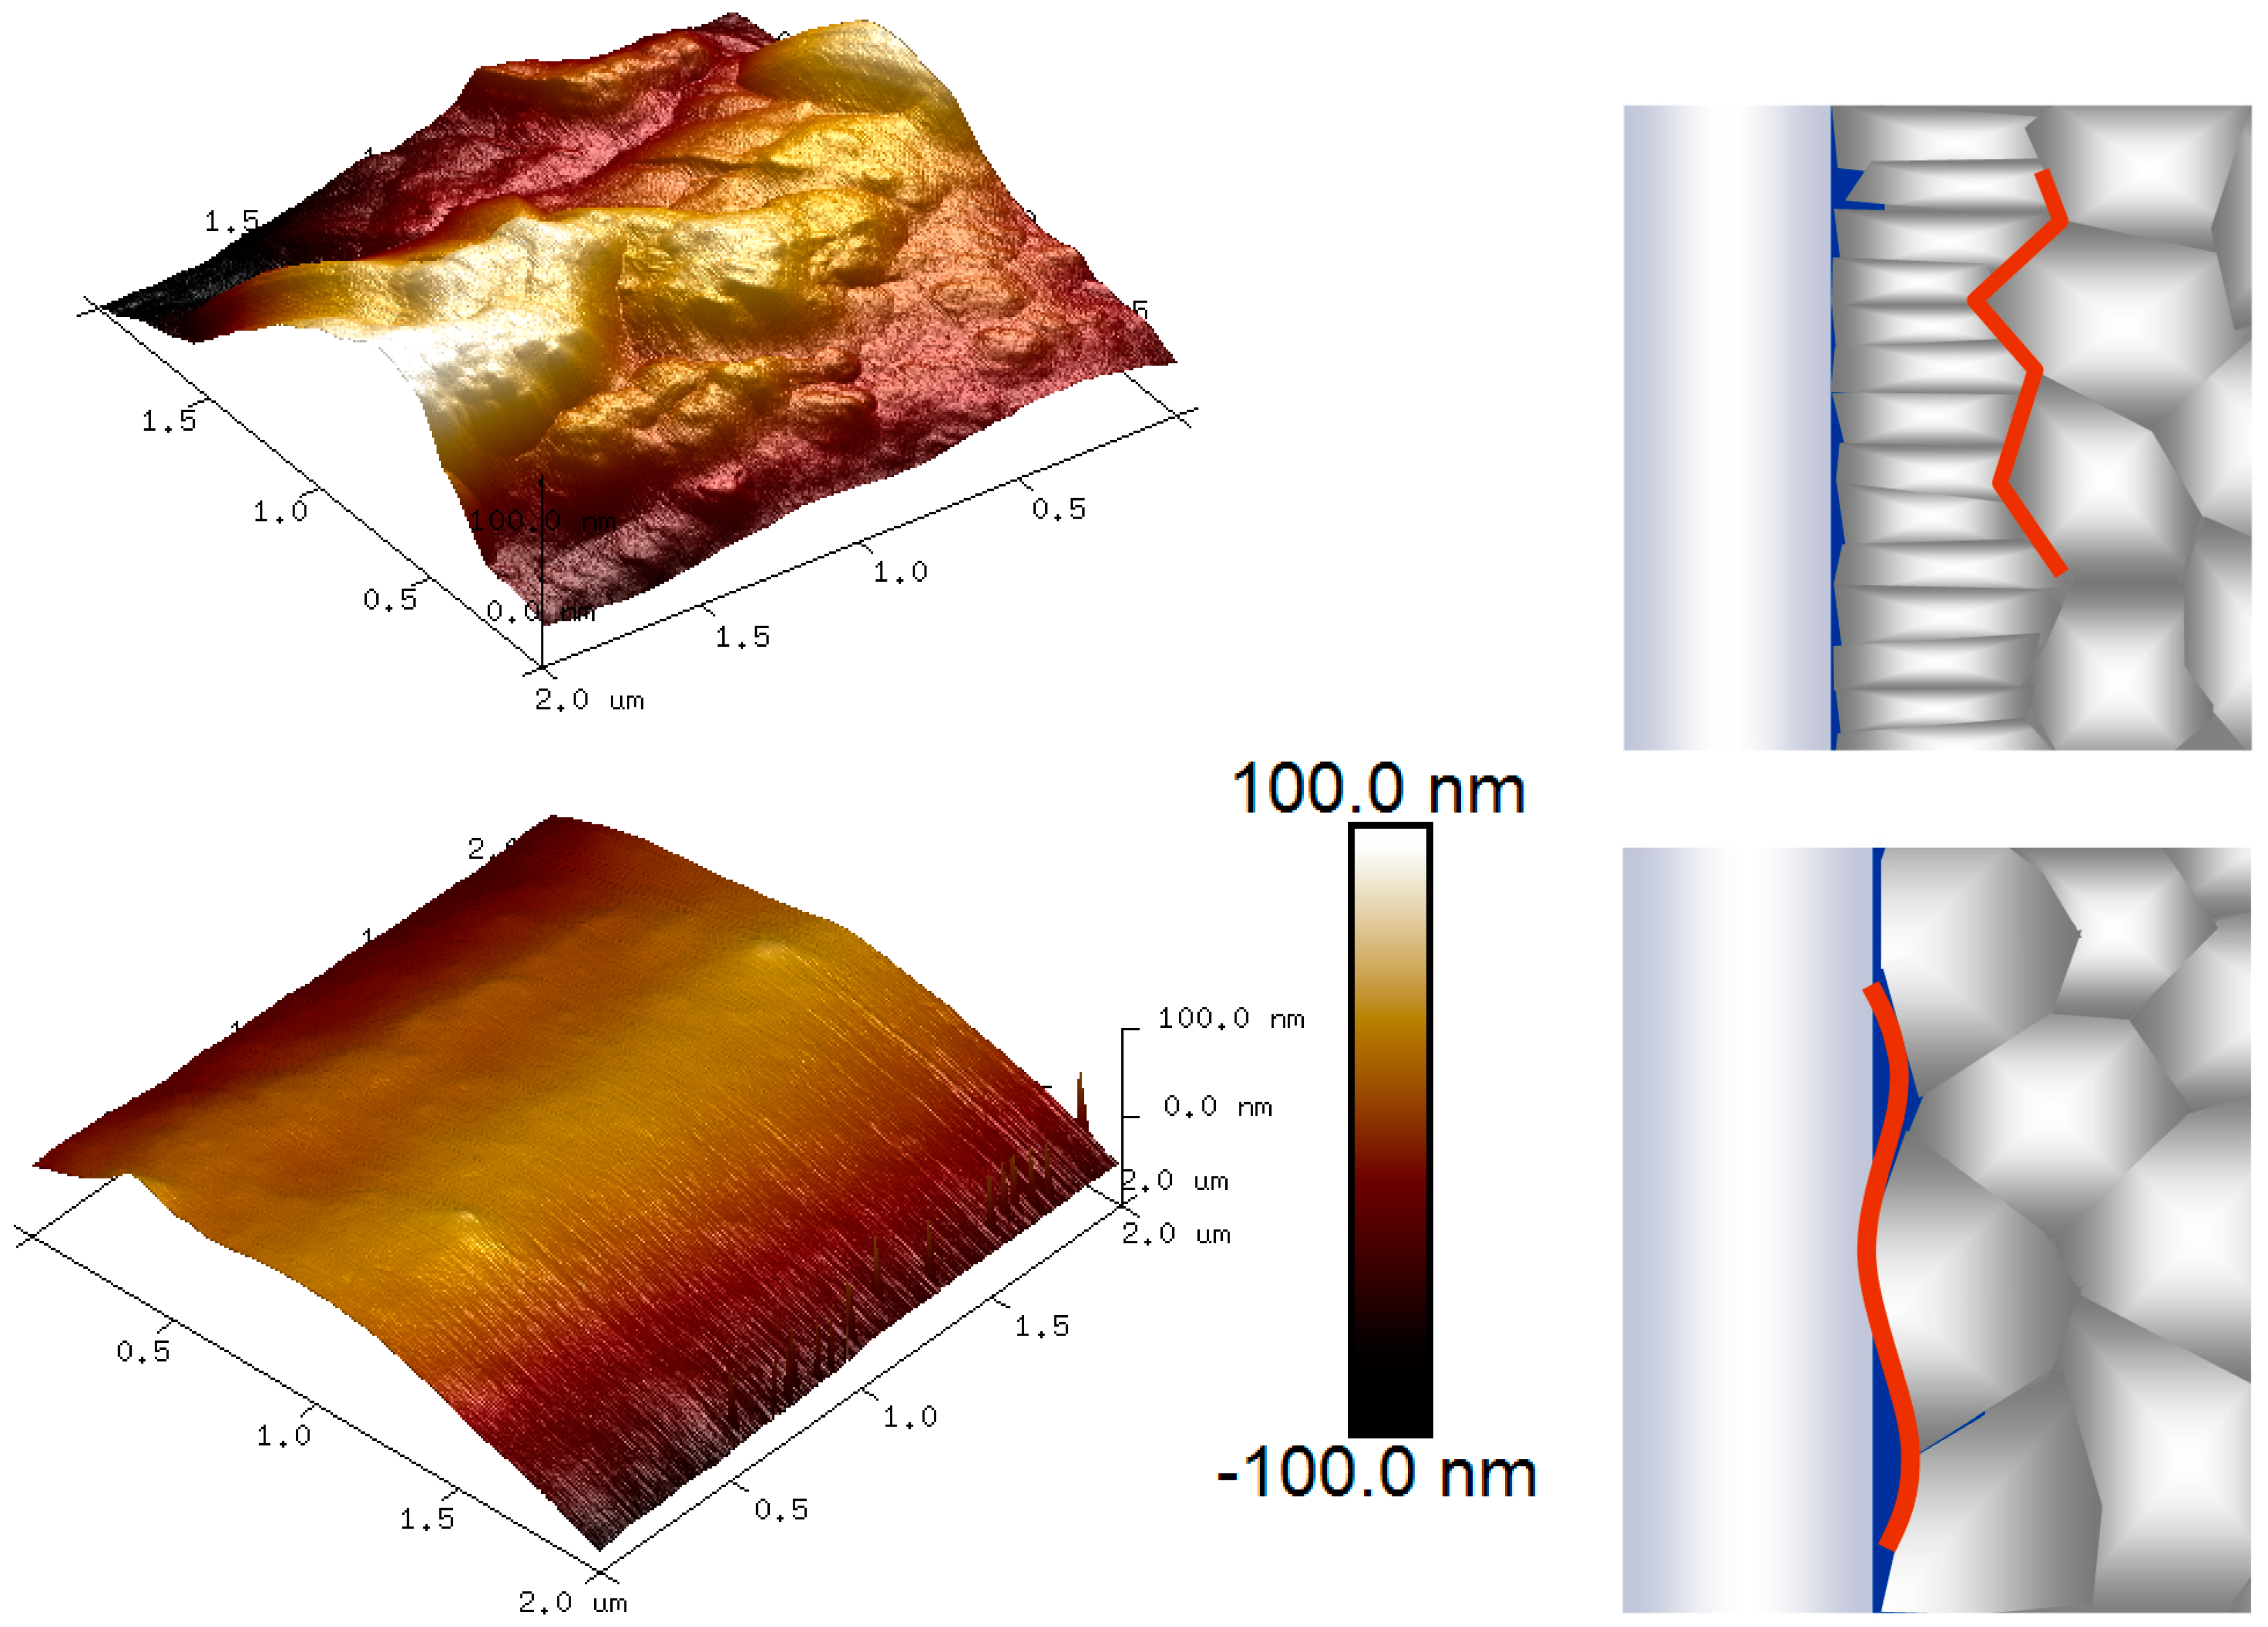
Table 2 shows the results of micromechanical tests on single-fiber model composites. For both matrix PP grades, the local shear strength τd, the critical energy release rate of the interface, Gic and the frictional shear stress after debonding, τf, are greater for the TC composites. In this interphase sensitive method, the effect is clearly seen even in composites with 2% MaPP. AFM images of the pulled out fibers show clear differences in the fiber fracture surface, cf. Figure 4. For a TC interphase, the fracture surface is rough, with 500 nm structures dominating the surface morphology. In absence of a TC layer, no such structures are seen. These structures are interpreted as either the outer surface of the TC layer (Section 3 in Figure 1) or the sized fiber surface. A model for the fracture is proposed (right hand sind in Figure 4) where in the case of a TC interphase, the failure occurs outside the TC layer whereas without TC layer it occurs at the fiber surface.
In addition, micromechanical dynamical [51] and micromechanical hysteresis measurements [49] were performed on single-fiber model composites at two different embedded lengths, (200 µm, 600 µm).
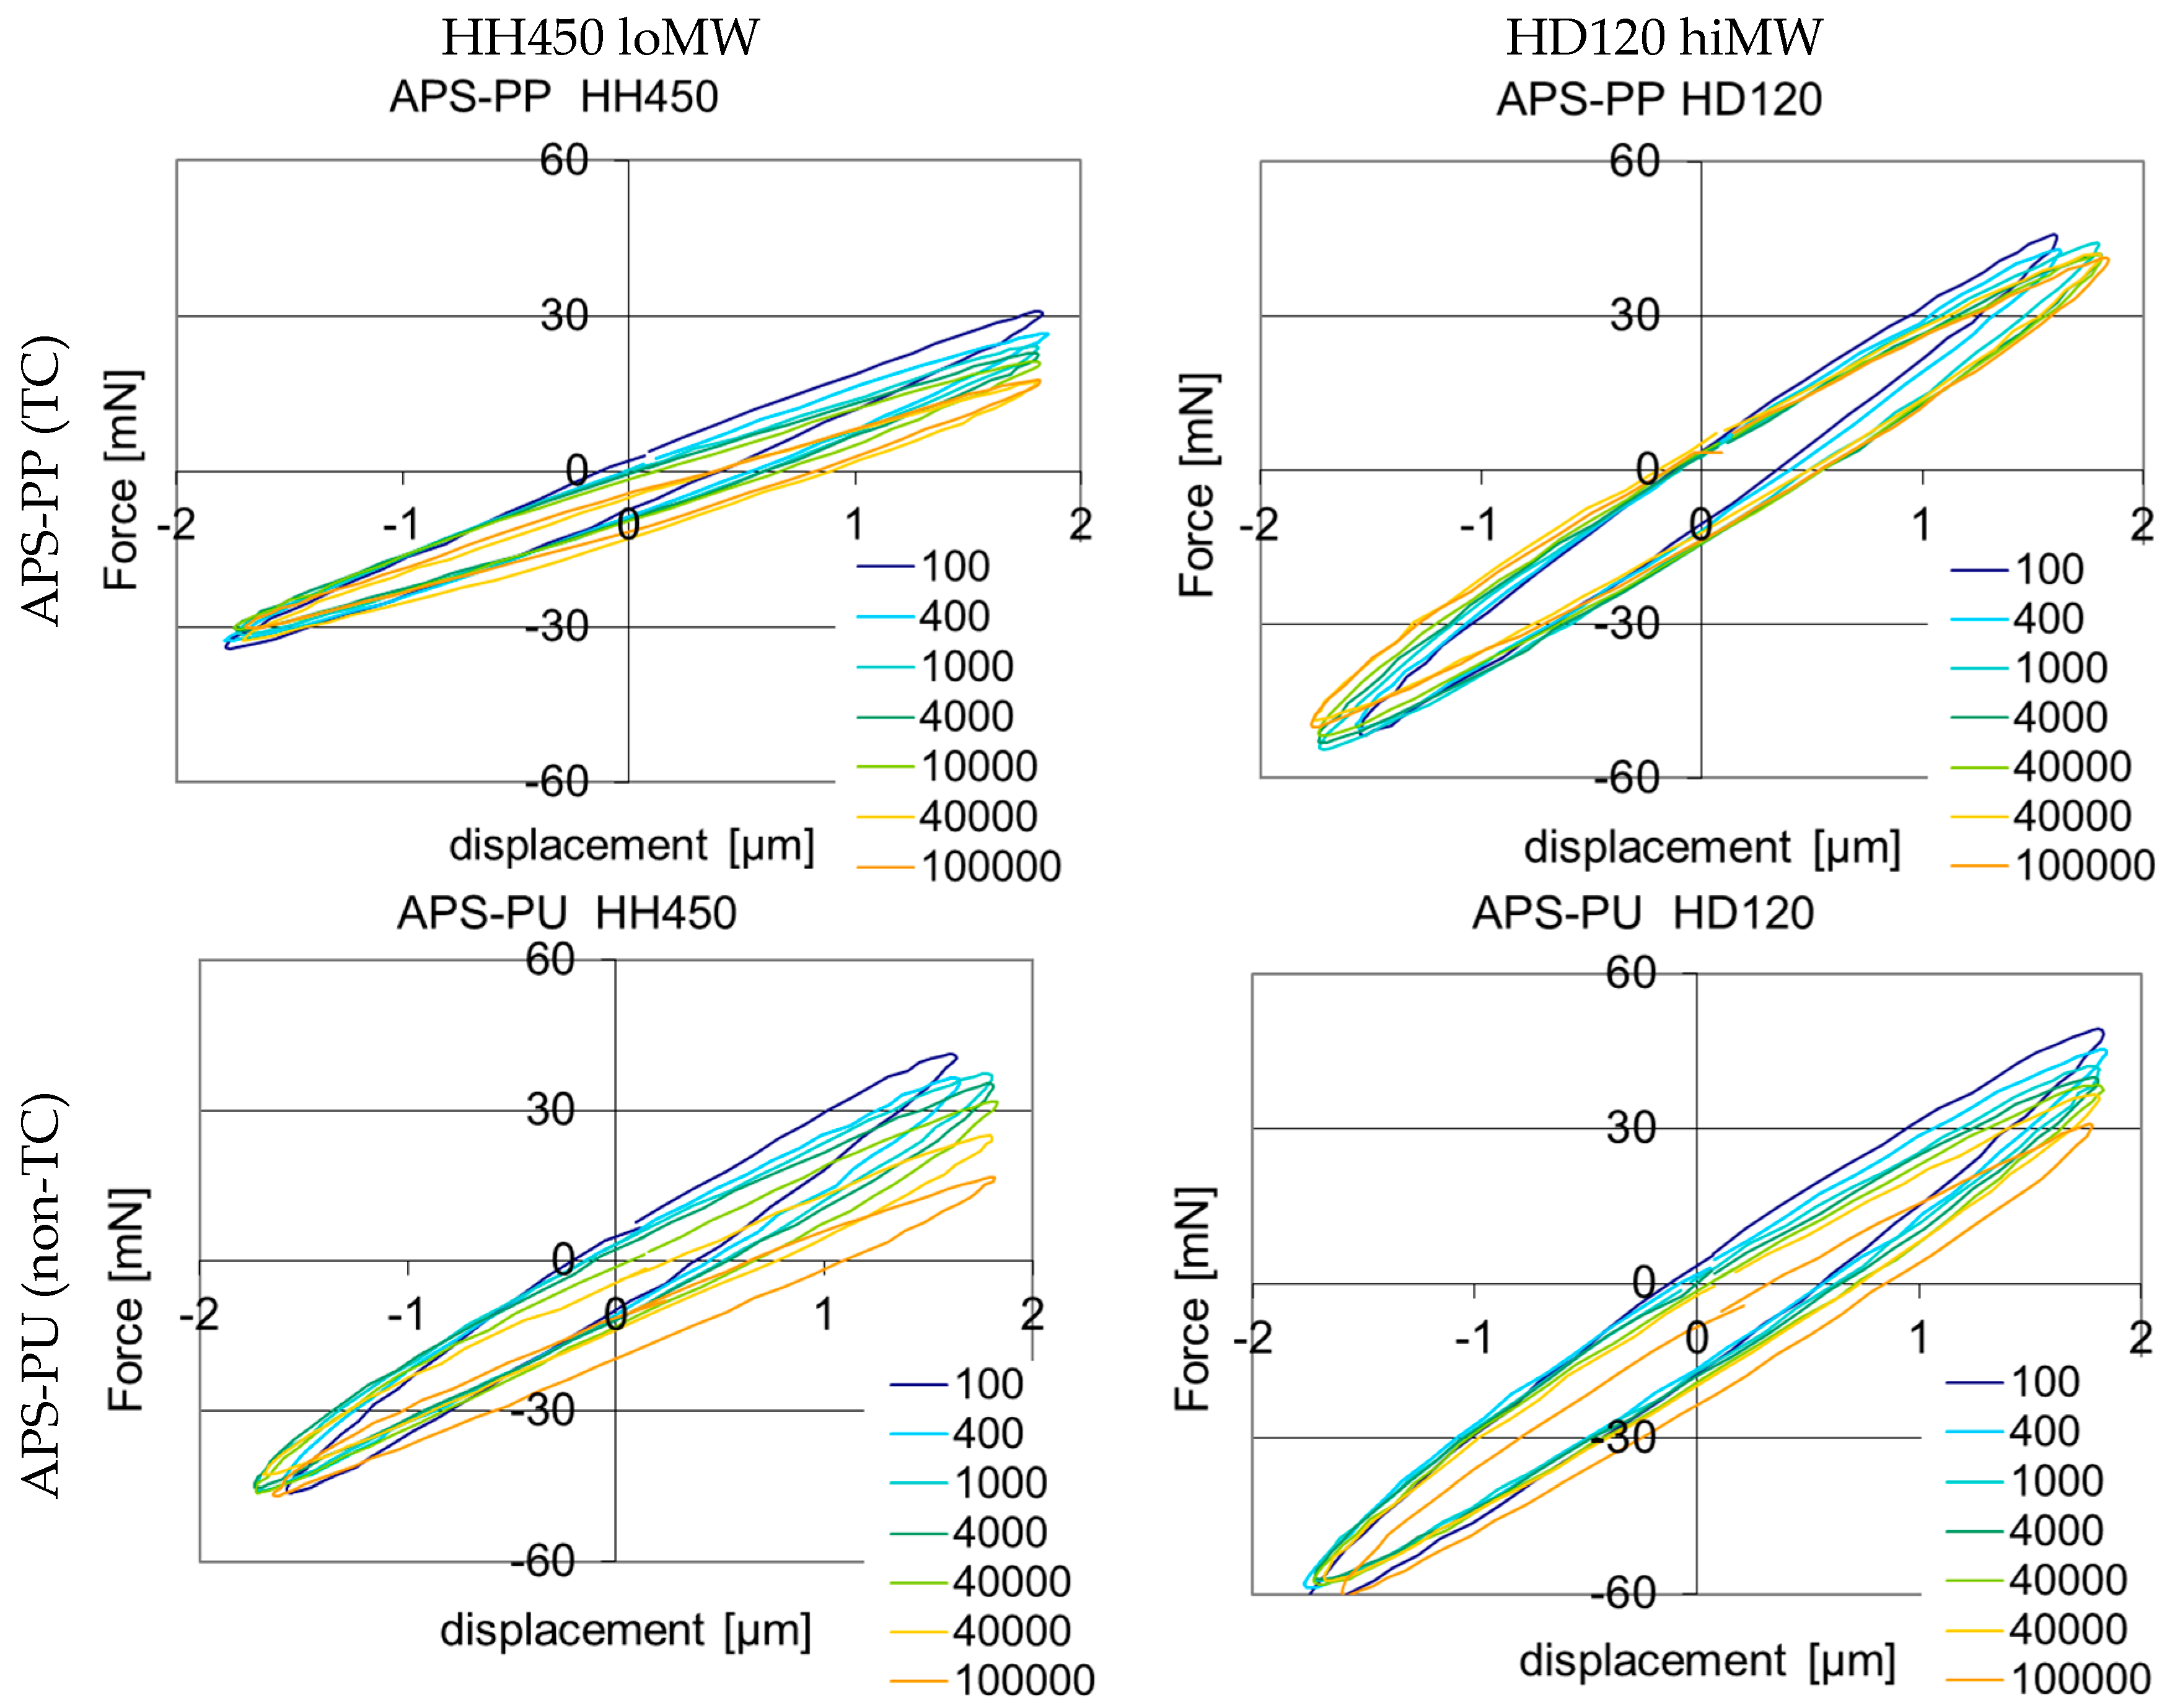
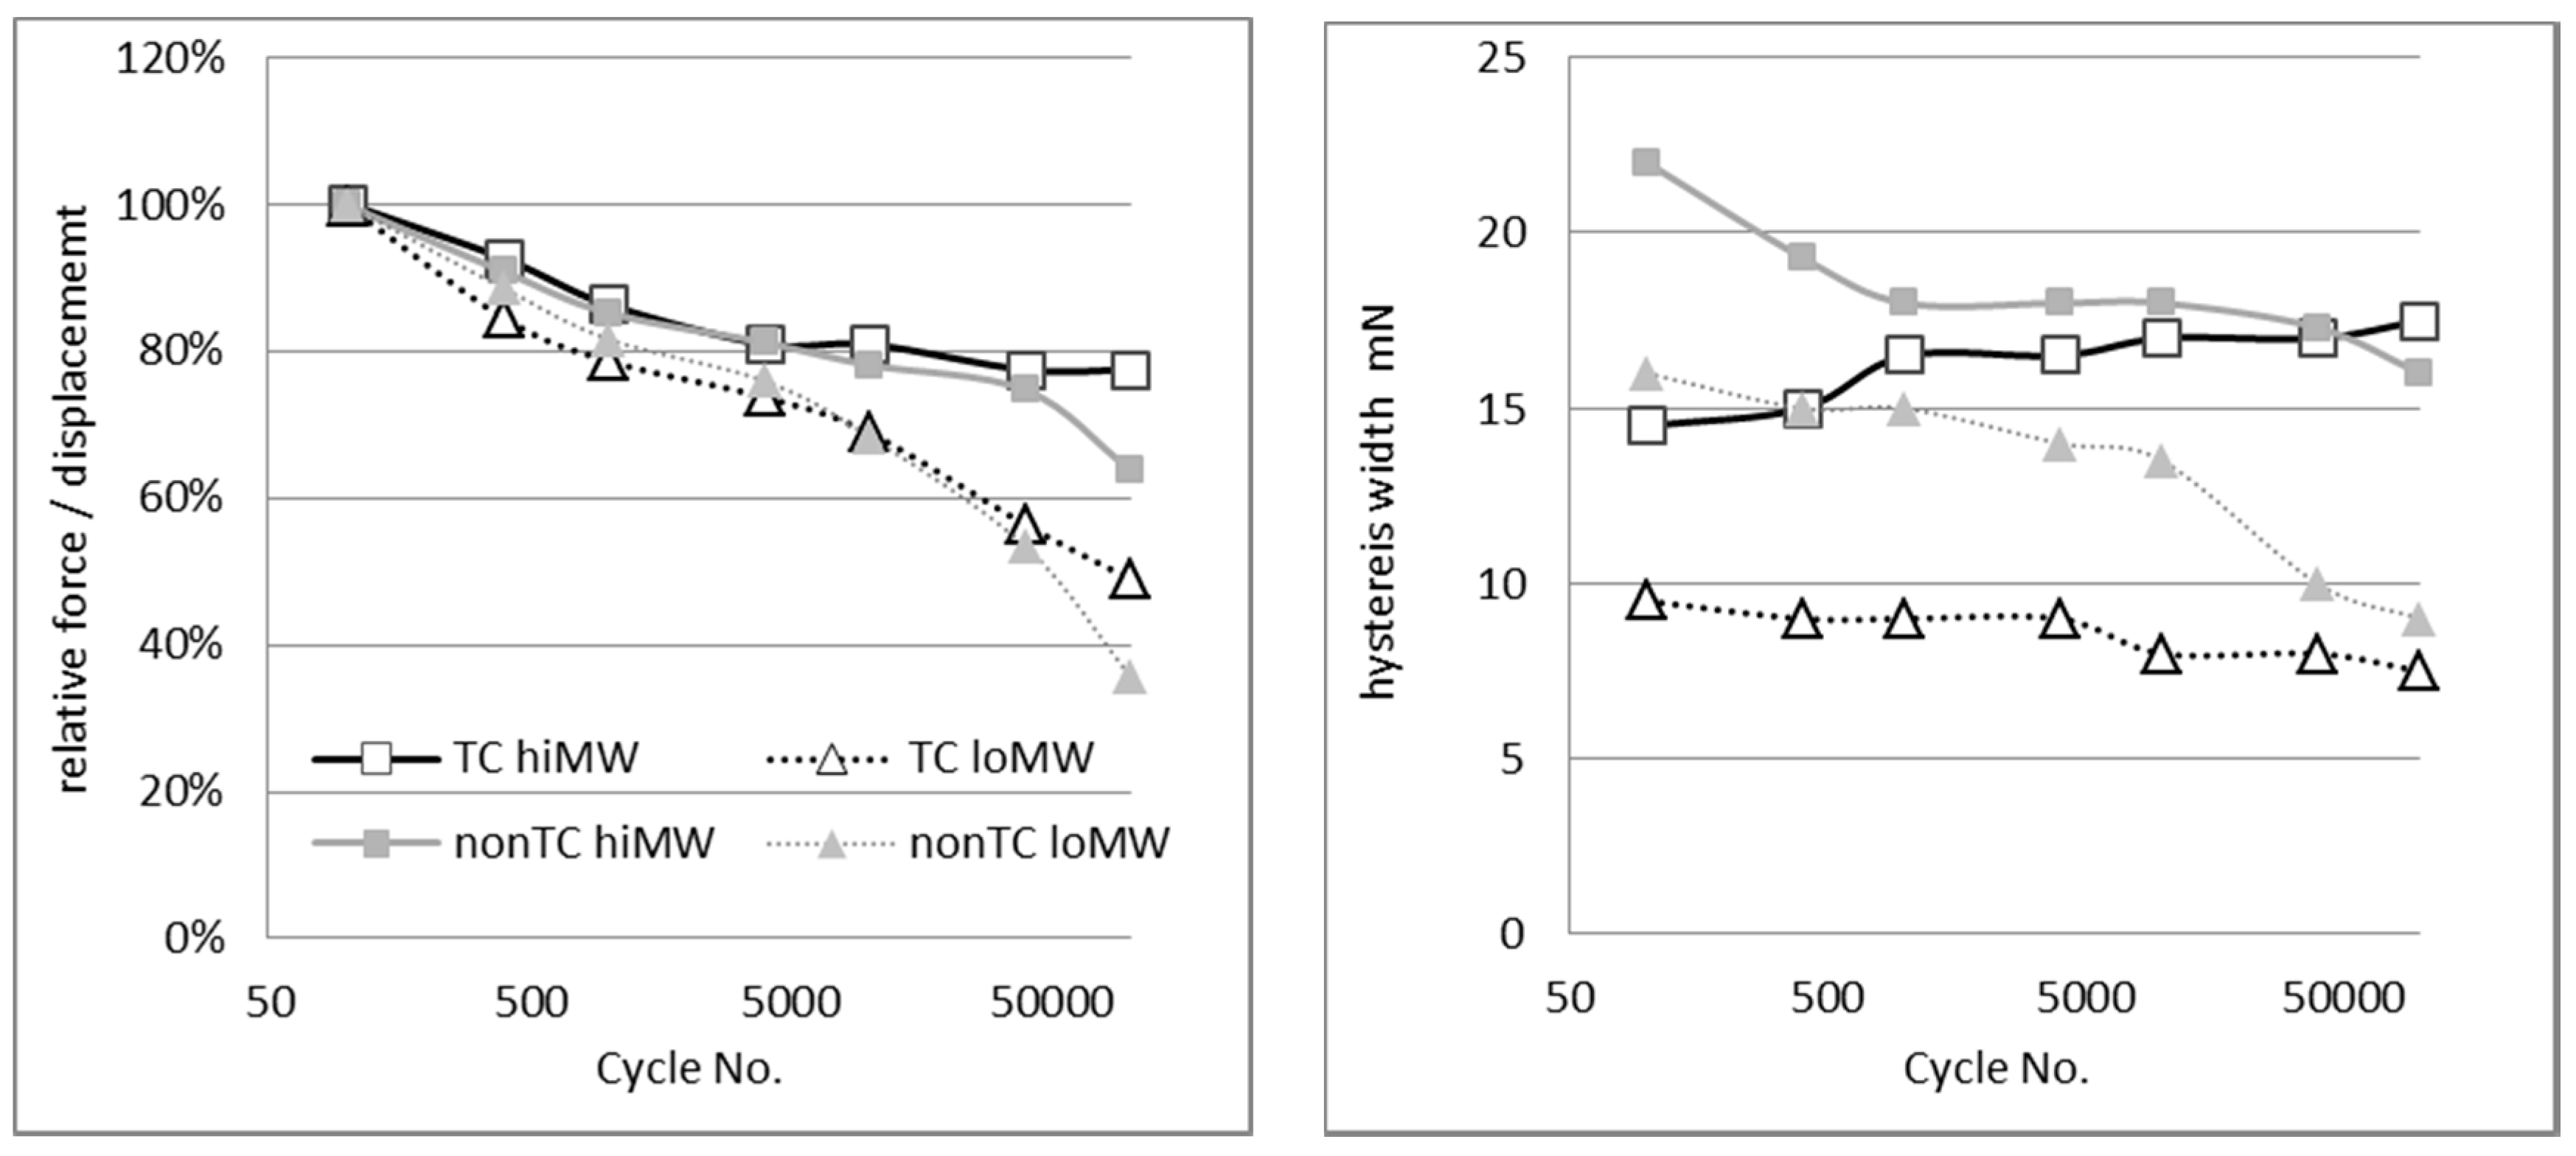
Figure 5 shows the results of the hysteresis measurements for the four fiber matrix combinations high vs. low MW and TC vs. non-TC interphase for 600 µm embedded length. All samples remain intact with only some degradation. As the embedded length and fiber diameter vary, the value of the force as well as the stiffness (force/displacement) is subjected to error. However, the variation of stiffness with cycle number provides information on the degradation of the interphase, as well as the width of the hysteresis curve or the area included in the hysteresis loop, which is equal to the inelastic energy loss during the cycle (Figure 6). The stiffness of the high MW interphases is reduced by 20%, whereas the stiffness of the low MW samples is reduced by 40% at 40,000 cycles. This is independent on the interphase crystallization. The width of the hysteresis loop at zero force is initially higher for high MW than for lower MW, and for non-TC interphase samples than for the TC ones. Energy loss processes are higher for high MW and in the non-TC interphase. With cycle number, the non-TC samples hysteresis decreases whereas the TC interphases have a constant hysteresis width. Some interphase deterioration processes seem to occur in non-TC samples that are suppressed in samples with a TC interphase.
If a smaller embedding length of 200 µm is chosen, the non-TC samples fail, whereas the transcrystalline samples remain intact up to 400,000 cycles.
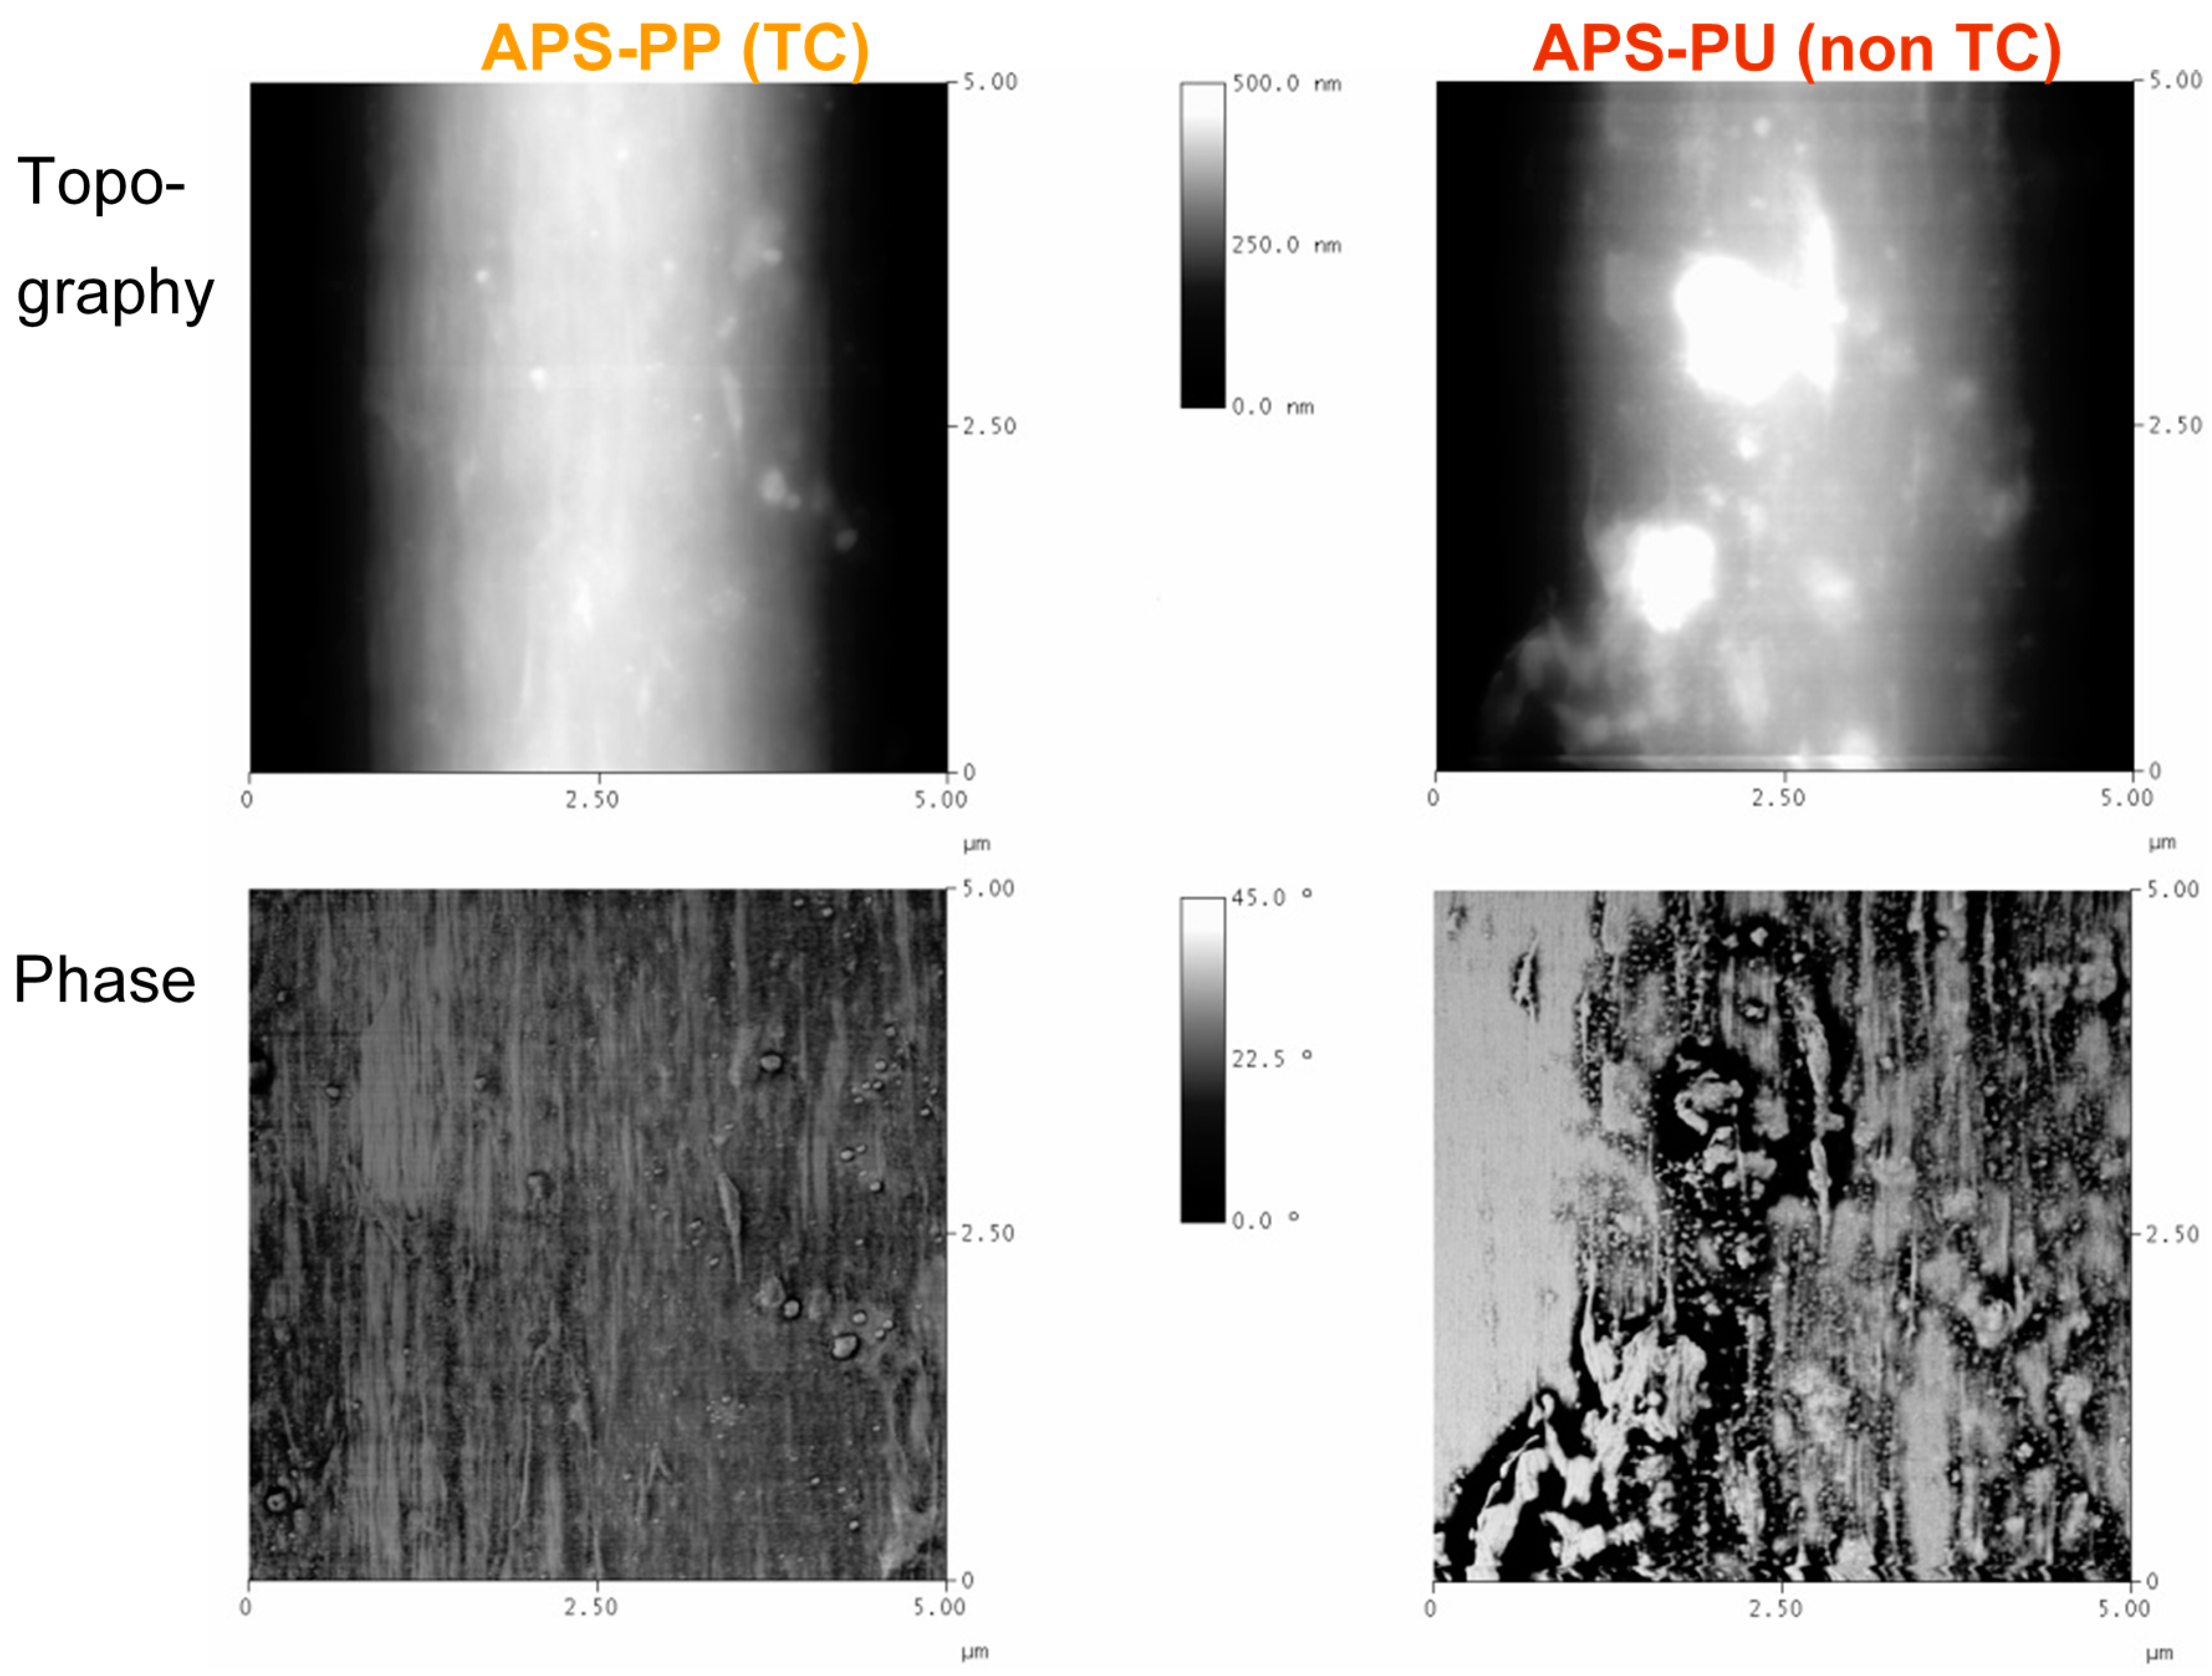
The AFM images of either APS-PP or APS-PU fibers before embedding show a relatively smooth, homogeneous surface (Protrusions height <30 nm, diameter <100 nm, phase difference <15°). When the fiber is pulled out of the matrix after cyclic loading, the fracture surfaces are significantly more inhomogeneous (Figure 7). On the APS-PP surfaces, structures of the order of magnitude of 500 nm are found that are strongly oriented along the fiber (=load) axis. This longitudinal alignment is also found in the phase image. In the APS-PU sized fiber, the structures are significantly larger (2 µm), and the contrast in the phase image is much higher.
For the APS-PP sized fibers, a TC structure is expected, leading to a fine-grained structure on the surface. The crystals are strongly deformed under load, but there is no material contrast, so the fracture surface is within the PP. In the APS-PU, an alignment of the crystallites is also observed, mainly in the phase image. The phase image also indicates a surface with varying material parameters, i.e., a fracture surface that is located partially in the PP/PU interphase and partially within the PP matrix: a number of larger spherulites adhere to the surface. They might be the cause for the higher friction seen in the micromechanical measurements.

4. Conclusions

A transcrystalline interphase has in the past been observed to improve ]mechanical properties, but contradictory results have also been observed. In the present study, an enhancing effect of the transcrystalline layer is shown. However, it may be reduced due to the effect of additives such as MaPP, which is added as a coupling agent between fiber and PP matrix. As MaPP will also induce nucleation in the bulk, it reduces the effect of the transcrystalline layer. For standard MaPP concentration (2%), the effect of the remaining TC layer is weak, tensile strength and toughness are only increased by 5 to 10%. If only 0.5% of MaPP are added, the TC layer is more pronounced, leading to a 70–100% increase of strength and a 25 or 125% increase in toughness, depending on the MW of the matrix polymer. In single-fiber model composite interface-specific tests, such as the single-fiber pull out test or single fiber hysteresis test, the interphase enhancement due to the transcrystallization is evident even at 2% MaPP. For both matrix PP grades, the local shear strength, τd, the critical energy release rate of the interface, Gic, and the frictional shear stress after debonding, τf, are greater for the TC composites. AFM images reveal a failure at the sizing layer for non-TC samples and failure at the outside of the TC layer in TC model composites.

Acknowledgments

The authors are indebted to Steffi Pressler and Alma Rothe for technical assistance, and to Wolfgang Jenschke for helpful discussions and for improving the micromechanical test setups. The authors thank the German Research Foundation DFG for financial support (Project MA 2311/1-1).

Author Contributions

Hanna Brodowsky and Edith Mäder studied the literature, conceived and designed the experiments. Hanna Brodowsky performed the experiments and analyzed the data; Hanna Brodowsky and Edith Mäder discussed the results, Hanna Brodowsky wrote the paper.

Conflicts of Interest

The authors declare no conflict of interest.

References

  1. Ishida, H.; Bussi, P. Surface induced crystallization in ultrahigh-modulus polyethylene fiber-reinforced polyethylene composites. Macromolecules 1991, 24, 3569–3577. [Google Scholar] [CrossRef]
  2. Billon, N.; Magnet, C.; Haudin, J.; Lefebvre, D. Transcrystallinity effects in thin polymer films. Experimental and theoretical approach. Colloid Polym. Sci. 1994, 272, 633–654. [Google Scholar] [CrossRef]
  3. Wu, C.-M.; Chen, M.; Karger-Kocsis, J. Transcrystallization in syndiotactic polypropylene induced by high-modulus carbon fibers. Polym. Bull. 1998, 41, 239–245. [Google Scholar] [CrossRef]
  4. Thomason, J.; Van Rooyen, A. Transcrystallized interphase in thermoplastic composites. J. Mater. Sci. 1992, 27, 897–907. [Google Scholar] [CrossRef]
  5. Wang, C.; Liu, C.-R. Transcrystallization of polypropylene composites: Nucleating ability of fibers. Polymer 1999, 40, 289–298. [Google Scholar] [CrossRef]
  6. Thomason, J.; Van Rooyen, A. The transcrystallised interphase in thermoplastic composites. In Controlled Interphases in Composite Materials; Springer: Dordrecht, The Netherlands, 1990; pp. 423–430. [Google Scholar]
  7. Wang, C.; Hwang, L. Transcrystallization of ptfe fiber/pp composites (I) crystallization kinetics and morphology. J. Polym. Sci. Part B Polym. Phys. 1996, 34, 47–56. [Google Scholar] [CrossRef]
  8. Wang, C.; Hwang, L. Transcrystallization of ptfe fiber/pp composites. II. Effect of transcrystallinity on the interfacial strength. J. Polym. Sci. Part B Polym. Phys. 1996, 34, 1435–1442. [Google Scholar] [CrossRef]
  9. Assouline, E.; Pohl, S.; Fulchiron, R.; Gerard, J.-F.; Lustiger, A.; Wagner, H.; Marom, G. The kinetics of α and β transcrystallization in fiber-reinforced polypropylene. Polymer 2000, 41, 7843–7854. [Google Scholar] [CrossRef]
  10. Jenckel, E.; Teege, E.; Hinrichs, W. Transkristallisation in hochmolekularen stoffen. Colloid Polym. Sci. 1952, 129, 19–24. [Google Scholar] [CrossRef]
  11. Bessell, T.; Hull, D.; Shortall, J.B. Interface morphology and mechanical properties of unidirectional fiber reinforced nylon 6. Faraday Spec. Discuss. Chem. Soc. 1972, 2, 137–143. [Google Scholar] [CrossRef]
  12. Raimo, M. On the origin of transcrystalline morphology in polymers and their composites: Re-evaluation of different views. Mater. Today Commun. 2015, 3, 137–140. [Google Scholar] [CrossRef]
  13. Varga, J.; Karger-Kocsis, J. The occurence of transcrystallization or row-nucleated cylindritic crystallization as a result of shearing in a glass-fiber-reinforced polypropylene. Compos. Sci. Technol. 1993, 48, 191–198. [Google Scholar] [CrossRef]
  14. Feldman, A.; Gonzalez, M.F.; Marom, G. Transcrystallinity in surface modified aramid fiber reinforced nylon 66 composites. Macromol. Mater. Eng. 2003, 288, 861–866. [Google Scholar] [CrossRef]
  15. Clark, R.L.; Kander, R.G.; Sauer, B.B. Nylon 66/poly (vinyl pyrrolidone) reinforced composites: 1. Interphase microstructure and evaluation of fiber–matrix adhesion. Compos. Part A Appl. Sci. Manuf. 1999, 30, 27–36. [Google Scholar] [CrossRef]
  16. Clark, R.L.; Craven, M.D.; Kander, R.G. Nylon 66/poly (vinyl pyrrolidone) reinforced composites: 2: Bulk mechanical properties and moisture effects. Compos. Part A Appl. Sci. Manuf. 1999, 30, 37–48. [Google Scholar] [CrossRef]
  17. Levitus, D.; Kenig, S.; Kazanci, M.; Harel, H.; Marom, G. Effect of transcrystalline interface on the mechanical properties of polyethylene/polyethylene composites. Adv. Compos. Lett. 2001, 10, 61–65. [Google Scholar]
  18. Chou, S.; Chen, S.-H. Effect of high temperature nucleating agent on adhesion of glass fibers to nylon 6-6. Polym. Polym. Compos. 2000, 8, 333–343. [Google Scholar]
  19. Clark, R.; Kander, R.; Srinivas, S. Morphological changes in polyamide/pvp blends. Polymer 1998, 39, 507–516. [Google Scholar] [CrossRef]
  20. Pompe, G.; Mäder, E. Experimental detection of a transcrystalline interphase in glass-fiber/polypropylene composites. Compos. Sci. Technol. 2000, 60, 2159–2167. [Google Scholar] [CrossRef]
  21. Assouline, E.; Wachtel, E.; Grigull, S.; Lustiger, A.; Wagner, H.; Marom, G. Lamellar orientation in transcrystalline γ isotactic polypropylene nucleated on aramid fibers. Macromolecules 2002, 35, 403–409. [Google Scholar] [CrossRef]
  22. Shi, H.; Zhao, Y.; Dong, X.; He, C.; Wang, D.; Xu, D. Transcrystalline morphology of nylon 6 on the surface of aramid fibers. Polym. Int. 2004, 53, 1672–1676. [Google Scholar] [CrossRef]
  23. Hoffman, J.D.; Miller, R.L. Kinetic of crystallization from the melt and chain folding in polyethylene fractions revisited: Theory and experiment. Polymer 1997, 38, 3151–3212. [Google Scholar] [CrossRef]
  24. Strobl, G. A new approach to polymer crystallization used in an analysis of data of syndiotactic polypropylene. Acta Polym. 1997, 48, 562–570. [Google Scholar] [CrossRef]
  25. Schoolenberg, G.; Van Rooyen, A. Transcrystallinity in fiber-reinforced thermoplastic composites. Compos. Interfaces 1993, 1, 243–252. [Google Scholar]
  26. Beehag, A.; Ye, L. Fiber/Matrix Adhesion in Thermoplastic Composite: Is Transcrystallinity a Key. In Proceedings of the Eleventh International Conference Composite Materials (ICCM-11), Gold Coast, Australia, 14–18 July 1997; pp. 723–730. [Google Scholar]
  27. Wu, C.-M.; Chen, M.; Karger-Kocsis, J. Micromorphologic feature of the crystallization of isotactic polypropylene after melt-shearing. Polym. Bull. 1998, 41, 493–499. [Google Scholar] [CrossRef]
  28. Varga, J.; Karger-Kocsis, J. Interfacial morphologies in carbon fiber-reinforced polypropylene microcomposites. Polymer 1995, 36, 4877–4881. [Google Scholar] [CrossRef]
  29. Cartledge, H.C.; Baillie, C.A. Studies of microstructural and mechanical properties of nylon/glass composite part i the effect of thermal processing on crystallinity, transcrystallinity and crystal phases. J. Mater. Sci. 1999, 34, 5099–5111. [Google Scholar] [CrossRef]
  30. Chen, E.J.; Hsiao, B.S. The effects of transcrystalline interphase in advanced polymer composites. Polym. Eng. Sci. 1992, 32, 280–286. [Google Scholar] [CrossRef]
  31. Huson, M.; McGill, W. The effect of transcrystallinity on the behavior of fibers in polymer matrices. J. Polym. Sci. Part B Polym. Phys. 1985, 23, 121–128. [Google Scholar] [CrossRef]
  32. Wagner, H.; Lustiger, A.; Marzinsky, C.; Mueller, R. Interlamellar failure at transcrystalline interfaces in glass/polypropylene composites. Compos. Sci. Technol. 1993, 48, 181–184. [Google Scholar] [CrossRef]
  33. Cartledge, H.C.; Baillie, C.A. Studies of microstructural and mechanical properties of nylon/glass composite part ii the effect of microstructures on mechanical and interfacial properties. J. Mater. Sci. 1999, 34, 5113–5126. [Google Scholar] [CrossRef]
  34. Folkes, M.; Wong, W. Determination of interfacial shear strength in fiber-reinforced thermoplastic composites. Polymer 1987, 28, 1309–1314. [Google Scholar] [CrossRef]
  35. Rolel, D.; Yavin, E.; Wachtel, E.; Wagner, H. Experimental study of transcrystallinity in uhmwpe/lldpe composites. Compos. Interfaces 1993, 1, 225–242. [Google Scholar]
  36. Carvalho, W.S.; Bretas, R.E. Thermoplastic/carbon fiber composites: Correlation between interphase morphology and dynamic mechanical properties. Eur. Polym. J. 1990, 26, 817–821. [Google Scholar] [CrossRef]
  37. Lopez-Manchado, M.; Arroyo, M. Crystallization kinetics of polypropylene part 4: Effect of unmodified and azide-modified pet and pa short fibers. Polymer 1999, 40, 487–495. [Google Scholar] [CrossRef]
  38. Klein, N.; Marom, G.; Pegoretti, A.; Migliaresi, C. Determining the role of interfacial transcrystallinity in composite materials by dynamic mechanical thermal analysis. Composites 1995, 26, 707–712. [Google Scholar] [CrossRef]
  39. Karger-Kocsis, J. Interphase with lamellar interlocking and amorphous adherent—A model to explain effects of transcrystallinity. Adv. Compos. Lett. 2000, 9, 225–230. [Google Scholar]
  40. Gao, S.-L.; Mäder, E. Characterisation of interphase nanoscale property variations in glass fiber reinforced polypropylene and epoxy resin composites. Compos. Part A Appl. Sci. Manuf. 2002, 33, 559–576. [Google Scholar] [CrossRef]
  41. Folkes, M.; Hardwick, S. Direct study of the structure and properties of transcrystalline layers. J. Mater. Sci. Lett. 1987, 6, 656–658. [Google Scholar] [CrossRef]
  42. Assouline, E.; Grigull, S.; Marom, G.; Wachtel, E.; Wagner, H. Morphology of α-transcrystalline isotactic polypropylene under tensile stress studied with synchrotron microbeam X-ray diffraction. J. Polym. Sci. Part B Polym. Phys. 2001, 39, 2016–2021. [Google Scholar] [CrossRef]
  43. Schultz, J.; Nardin, M. Interfacial adhesion, interphase formation and mechanical properties of single fiber polymer-based composites. In Controlled Interphases in Composite Materials; Springer: Dordrecht, The Netherlands, 1990; pp. 561–567. [Google Scholar]
  44. Teishev, A.; Marom, G. The effect of transcrystallinity on the transverse mechanical properties of single-polymer polyethylene composites. J. Appl. Polym. Sci. 1995, 56, 959–966. [Google Scholar] [CrossRef]
  45. Folkes, M.; Hardwick, S. The mechanical properties of glass/polypropylene multilayer laminates. J. Mater. Sci. 1990, 25, 2598–2606. [Google Scholar] [CrossRef]
  46. Mäder, E.; Grundke, K.; Jacobasch, H.-J.; Wachinger, G. Surface, interphase and composite property relations in fiber-reinforced polymers. Composites 1994, 25, 739–744. [Google Scholar] [CrossRef]
  47. Zhandarov, S.; Mäder, E. Characterization of fiber/matrix interface strength: Applicability of different tests, approaches and parameters. Compos. Sci. Technol. 2005, 65, 149–160. [Google Scholar] [CrossRef]
  48. Mäder, E.; Mörschel, U.; Effing, M. Quality assessment of composites. JEC Compos. Mag. 2016, 102, 49–51. [Google Scholar]
  49. Brodowsky, H.M.; Jenschke, W.; Mäder, E. Characterization of interphase properties: Microfatigue of single fiber model composites. Compos. Part A Appl. Sci. Manuf. 2010, 41, 1579–1586. [Google Scholar] [CrossRef]
  50. Mäder, E.; Gao, S.-L.; Plonka, R.; Wang, J. Investigation on adhesion, interphases, and failure behavior of cyclic butylene terephthalate (cbt®)/glass fiber composites. Compos. Sci. Technol. 2007, 67, 3140–3150. [Google Scholar] [CrossRef]
  51. Brodowsky, H.M.; Jenschke, W.; Mäder, E. Characterization of interphase properties by frequency-dependent cyclic loading of single fiber model composites. J. Adhes. Sci. Technol. 2010, 24, 237–253. [Google Scholar] [CrossRef]
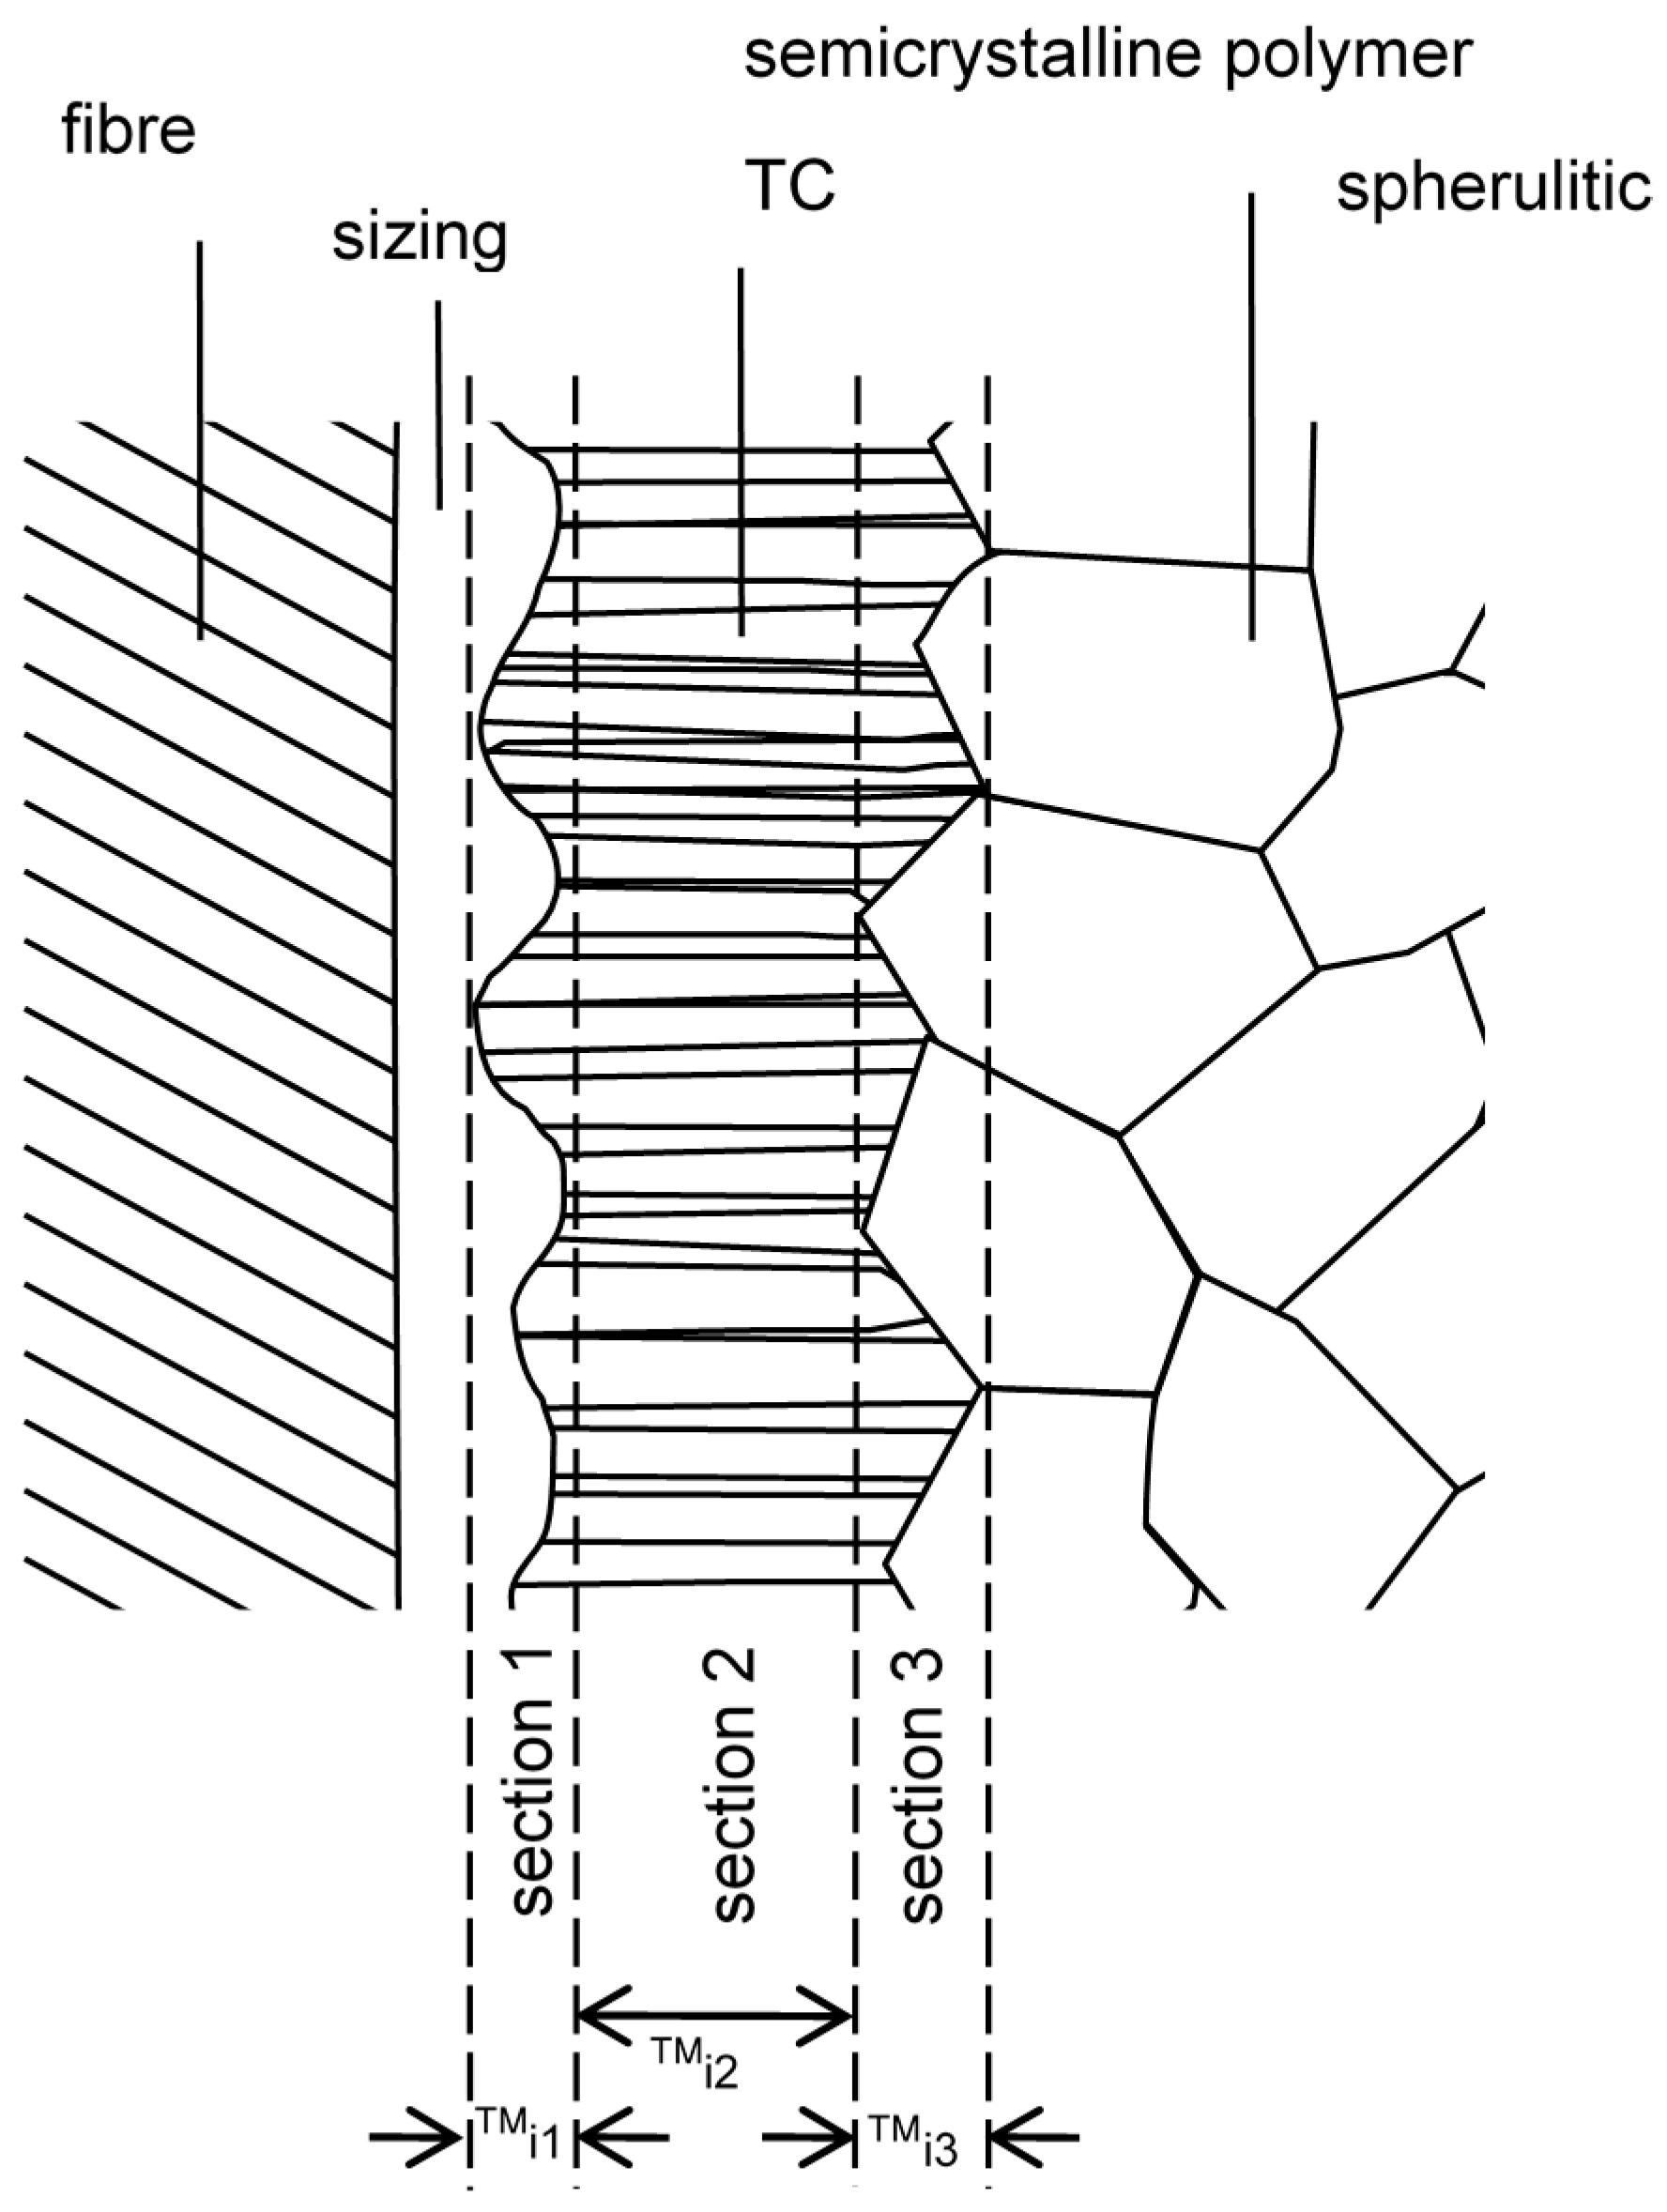
Figure 1. Scheme of the interphase between the fiber and a semicrystalline matrix forming a TC-layer.
Fibers 06 00016 g001
Figure 2. General scheme of used micromechanic tests: quasi-static pull out test and hysteresis tests.
Fibers 06 00016 g002
Figure 3. Polarization micrographs of single glass fibers in PP, Tiso = 135 °C, scalebar 100 µm. Top image: APS-PU sized fiber, bottom image: APS-PP sized fiber in HH450 PP matrix. The APS-PP sized fiber induces a TC layer.
Fibers 06 00016 g003
Figure 4. AFM height images of the fracture surfaces of single-fiber model composites after pull-out with HH450, Top: fibers inducing TC interphase, bottom: fibers suppressing a TC interphase. The height and size of the protrusions is 400 nm × 30 nm for the TC fracture surface and 50 nm × 8 nm for the non-TC fracture surface. A model for the fracture (right) is proposed where in the case of a TC interphase, the failure occurs outside the TC layer whereas without TC layer it occurs at the fiber surface.
Fibers 06 00016 g004
Figure 5. Hysteresis loops of single-fiber model composites loaded with amplitudes of ±1.8 µm at a frequency of 10 Hz (sized glass fibers APS/PP- or APS-PU-embedded in either PP HD120M or PP HH450) after the given number of cycles.
Fibers 06 00016 g005
Figure 6. Data evaluated from the hysteresis curves: Relative stiffness (left) and width (right) of the hysteresis loops. Lines are guide to the eye.
Fibers 06 00016 g006
Figure 7. Tapping mode AFM images of fiber surfaces fractured after cyclic tests on single-fiber model composites.
Fibers 06 00016 g007
Table 1. Mechanical parameters of injection-molded specimens of GF reinforced PP.
PP HD 120 hiMW PP HH450 loMW
E (GPa)σm (MPa)acU (J/m²)E (GPa)σm (MPa)acU (J/m²)
0.5% MaPPAPS-PP TC6100793849006821
APS-PU Non-TC5700371654003817
no fiber125027142130027121
2% MaPPAPS-PP TC6500935558008755
APS-PU non-TC6200834461008344
no fiber1500 1071300 87
Table 2. Micromechanical pull out tests results on GF /PP samples with 2.0% MaPP, parameters local shear strength, τd, the critical energy release rate of the interface, Gic, and the frictional shear stress after debonding, τf .
SizingτdGicτf
HH450APS-PU9.03.04.4
APS-PP15.78.36.1
HD120APS-PU10.03.45.4
APS-PP13.47.06.4