Abstract
This study investigated the evolution of the density, gas permeability, and thermal conductivity of sugar maple wood during the thermo-hygro-mechanical densification process. The results suggested that the oven-dry average density of densified samples was significantly higher than that of the control samples. However, the oven-dry density did not show a linear increase with the decrease of wood samples thickness. The radial intrinsic gas permeability of the control samples was 5 to 40 times higher than that of densified samples, which indicated that the void volume of wood was reduced notably after the densification process. The thermal conductivity increased by 0.5–1.5 percent for an increase of one percent moisture content for densified samples. The thermal conductivity of densified wood was lower than that of the control samples. The densification time had significant effects on the oven-dry density and gas permeability. Both densification time and moisture content had significant effects on thermal conductivity but their interaction effect was not significant.
1. Introduction
The heat and mass transfer properties of wood or wood-based materials are essential characteristics required for a variety of purposes, including the heat and mass transfer modeling during the densification process and characterization of densified wood as a building material. Among others, typical properties required are density, permeability, and thermal conductivity. A proper characterization of these properties is crucial for increasing the accuracy of model predictions. However, during the thermo-hygro-mechanical (THM) densification process, density, permeability, and thermal conductivity of wood are all time-dependent, which makes the characterization of these parameters difficult.
Bulk flow is the principal mechanism for the transport of fluids through wood, which occurs through the voids of the wood under a static or capillary pressure gradient [1]. The bulk flow rate of fluids is determined by wood permeability. During the hot-pressing process of wood composite materials, the gas permeability controls the convective heat transfer from surface layers to the core layer and impacts the movement of the vapor from the core to the edges [2]. Since gas permeability depends largely on the pore structure of the fiber or particle mat, the densification treatment should have a direct effect on the permeability. Comstock [3] reported that the arrangement of wood principal directions has more impact on its gas permeability than any other parameter. In some species, the longitudinal permeability could be 106 higher than in the transverse direction, due to the arrangement of the wood cells.
A few researchers investigated the gas permeability of wood based panels using experimental methods [4,5,6,7,8]. Almost all the methods described in the literature are based on measuring the amount of gas flow at a given pressure gradient applied across the sample. Defo et al. [9] measured radial and tangential gas permeability values of sugar maple wood at 12% of moisture content (MC) (oven-dry density varied from 587 to 676 kg/m3) between 2.04 × 10⁻¹⁷ and 2.84 × 10⁻¹⁷ . Von Haas et al. [6] reported that the MC had almost no effect on gas permeability for low density samples and a slight effect on samples with a density above 900 kg/m3. Moreover, air permeability was at least two orders of magnitude higher than steam permeability, which might be due to the swelling of wood and the viscosity of the fluid on the superficial permeability [4,10].
Thermal conductivity is an important material property in determining the heat transfer rate [11]. The thermal conductivity of wood is affected by several basic factors: density, temperature, MC, extractive content, grain direction, structural irregularities, such as checks, and knots and microfibril angle, among which density and MC are predominant [12]. Troppová et al. [13] found that higher temperatures resulted in larger differences between the thermal conductivity values of wood-based fiberboards in the oven dry condition and at 14.2% MC. Thermal conductivity in the radial direction was reported to be about 5% to 10% higher than in the tangential direction [14]. Thermal conductivity along the grain has been reported to be 1.5 to 2.8 times higher than across the grain but the reported values vary widely. For example, Maclean [15] found that the thermal conductivity along the longitudinal direction is about 2.25 to 2.75 times higher than transverse thermal conductivity with an average of approximately 2.5.
The steady-state method is normally applied to measure the thermal conductivity of wood [16]. A large number of empirical equations could be found in the literature, to describe the relationship between wood thermal conductivity, density, and MC [1,10,15,17]. However, these empirical equations are applicable only within a limited range of MC and density levels. Hence, these relations may not be appropriate to describe the variation of the thermal conductivity of wood undergoing THM densification because both MC and density vary continuously during the process. In addition, little empirical data were found for the thermal conductivity of sugar maple wood at different density levels. Therefore, the objective of the current study was to investigate the variation of density, gas permeability, and thermal conductivity of sugar maple wood during the THM densification process.
2. Materials and Methods
Sugar maple (Acer saccharum Marsh) wood was selected for this study. This species is a diffuse-porous hardwood normally used for in-door applications such as flooring and furniture [18]. Thin sawn strips of sugar maple wood were provided by a hardwood flooring plant (Lauzon, Distinctive Hardwood Flooring Inc., Papineauville, QC, Canada). Their average apparent density (20 °C and 65% relative humidity (RH)) was 734 (standard deviation: 8.4) kg/m3 and their dimensions were 5.7 mm (radial) × 84.0 mm (tangential) × 695.0 mm (longitudinal). When they were received, the strips were stored in a conditioning room at 20 °C and 65% RH until an equilibrium moisture content of approximately 12% was achieved. Ten groups of 8 strips were densified for 0 min (control sample), 5 min, 10 min, 15 min, 20 min, 25 min, 30 min, 35 min, 40 min, and 45 min, respectively. The strips were used for experimental determination of the evolution with time of density, gas permeability, and thermal conductivity during the THM densification process.
2.1. Thermo-Hygro-Mechanical Densification Process
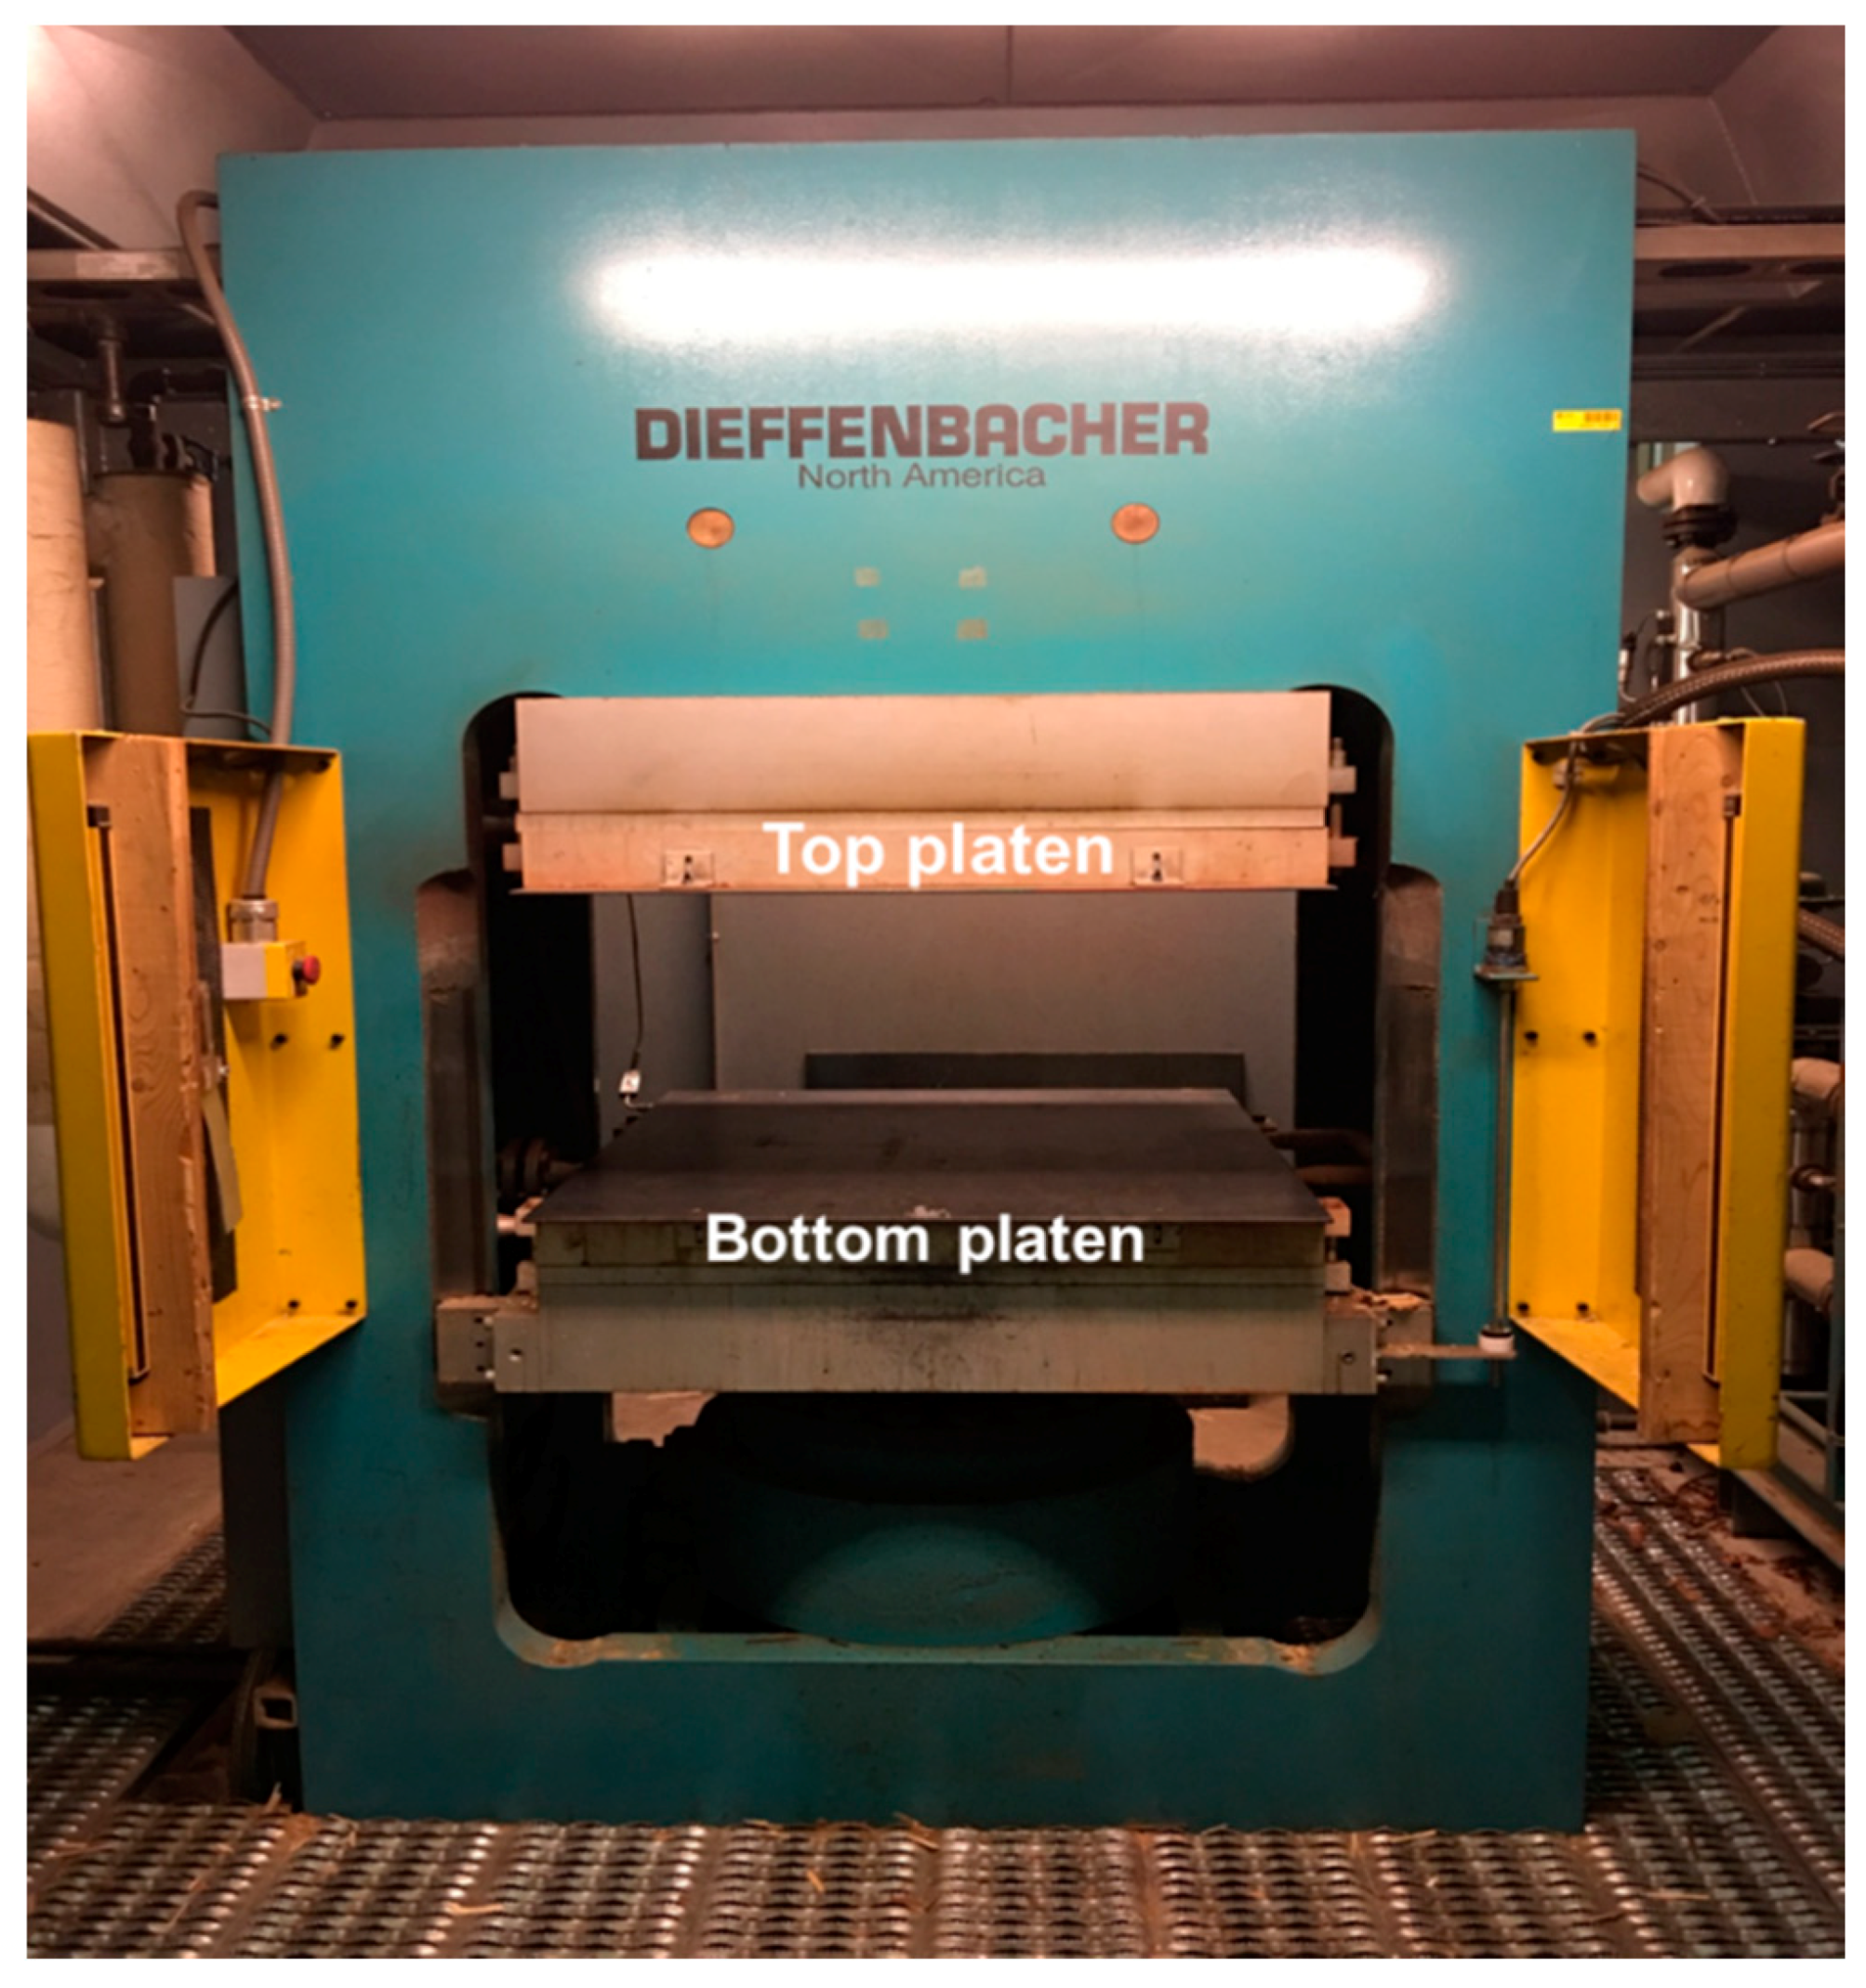
A steam injection press (Dieffenbacher, Alpharetta, GA, USA) with dimensions of 862 mm × 862 mm was used for the densification treatment (Figure 1). Steam injection holes with a diameter of 1.5 mm were distributed uniformly at 32 mm intervals on both the top and bottom platens of the press. To reduce wood surface carbonization and distribute the steam uniformly, both surfaces of the specimens were covered with a thin heat-resistant fabric permeable to steam made of Nomex® Ш A manufactured by Dupont™ [19]. The two press platens were preheated to the target temperature (200 °C) before treatment. The upper platen reached the specimens within 86 s during press closing.

Figure 1.
Steam injection hot press used for THM densification treatment.
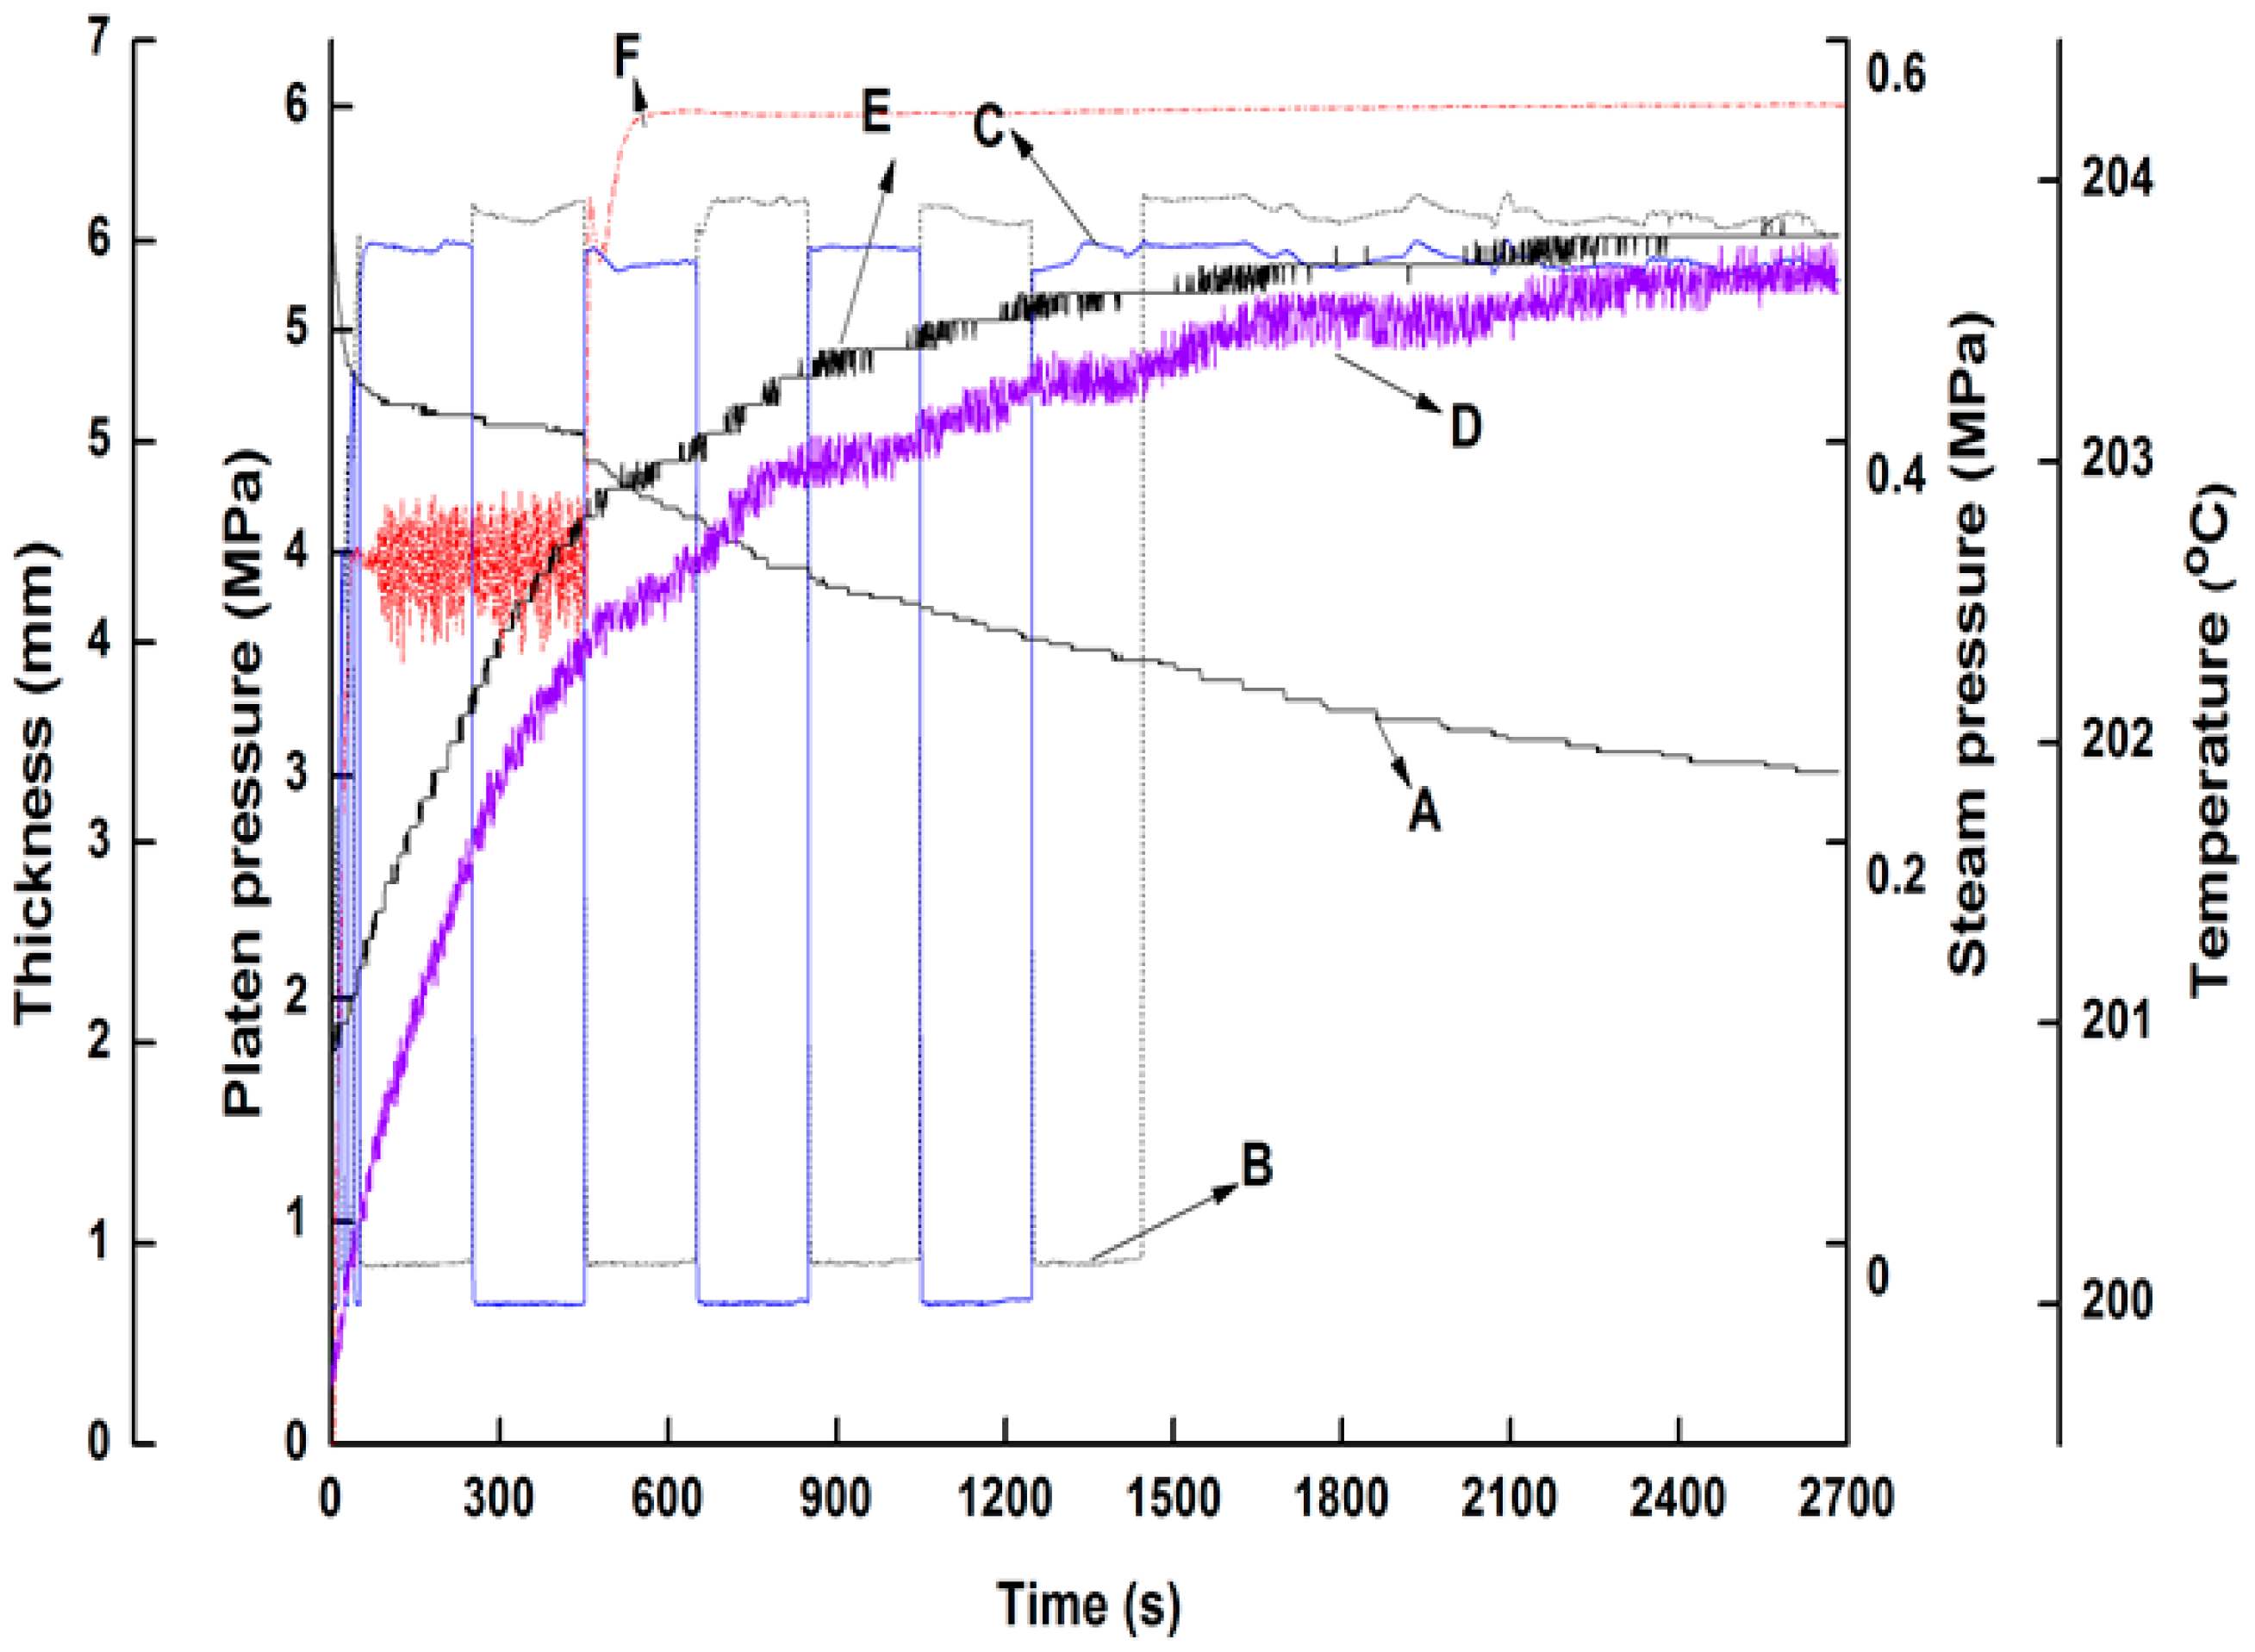
For all of the treatments except for the control group, the densification process was pre-set in the computer control system. Steam was continuously injected during the whole process at a maximum manometer pressure of 550 kPa, while the specimens were pressed under an increasing mechanical manometer platen pressure up to 6 MPa [20]. The evolution of steam pressure and platen pressure during the whole process is presented in Figure 2 [20]. The whole densification process was divided into ten steps according to the treatment time (0 min, 5 min, 10 min, 15 min, 20 min, 25 min, 30 min, 35 min, 40 min, and 45 min). The density, gas permeability, and thermal conductivity of all samples were determined for each treatment time in order to track their variation during the THM densification process. For the samples densified for 5 min, the control system stopped the process 5 min after the two hot platens closed, even though the maximum platen pressure had not been reached [20]. For the other treatments, the control system stopped the process after 10 min, 15 min, 20 min, 25 min, 30 min, 35 min, 40 min, 45 min respectively. In these cases, both the maximum steam pressure and platen pressure were reached. All the treated samples were then stored in a conditioning room at 20 °C and 65% RH until their equilibrium moisture content was reached prior to their properties determination.
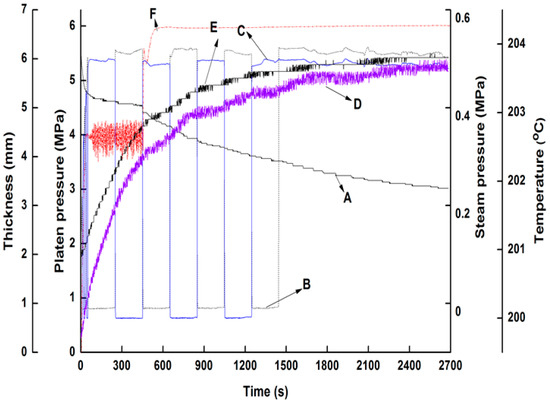
Figure 2.
Thermo-hygro-mechanical densification process. A: Thickness; B, C: top and bottom platen steam pressure, respectively; D, E: top and bottom platen temperature; F: platen load.
2.2. Properties Determination—Oven-Dry Average Density
Three specimens for each densification time with dimensions 50 mm × 50 mm were oven-dried and used to measure the density using an X-ray densitometer (Quintek Measurements Systems model QDP-01X, Knoxville, TN, USA) at intervals of 0.02 mm through the thickness. The average value (n = 3) was used as the final oven-dry density of each group.
2.3. Permeability Measurement
Three discs of 50 mm in diameter for each densification time were prepared for the gas permeability measurement. A special device developed in our laboratory by Lihra et al. [7] was used to measure the transverse gas permeability of the wood samples. The gas permeability was measured in this study with air using the apparatus shown in Figure 3. A cylinder of compressed air equipped with a pressure regulator was used to regulate the flow of gas at the desired pressure. In addition, a silicon seal was used on the edge of each disc in order to make a tight seal with a rubber sleeve surrounding it. A pressure of 600 kPa was applied to the rubber sleeve to prevent air leaks through the specimen edge. Two basswood discs (Tilia americana) with high longitudinal gas permeability were placed both in the inlet and outlet sides of the specimen to distribute the air flow [8]. Five flowmeters (Figure 3) with increasing range were installed to measure the gas flow rate through the samples. For each measurement, the flowmeter with a larger range (flowmeter 5) was firstly used. If there was no value provided, it was closed and the next one was used. This procedure was repeated until the gas flow rate could be measured. Each disc (n = 3 for each group) was measured at four pressure levels (∆P—values measured from pressure gage B): 200 kPa, 250 kPa, 300 kPa, and 350 kPa, respectively.
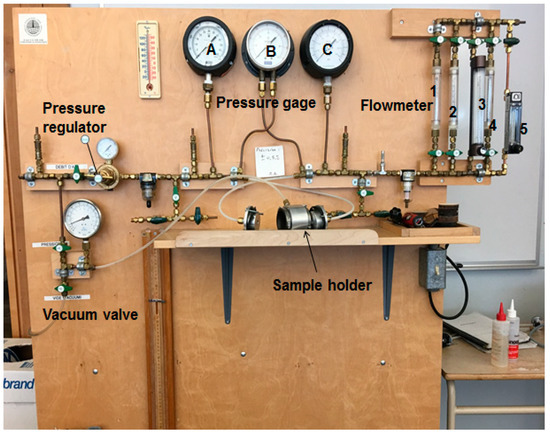
Figure 3.
Apparatus used for gas permeability measurements.
The steady-state gas flow through wood can be characterized by Darcy’s law. It could be stated as:
where is apparent gas permeability with slip flow (), Qg is the volumetric gas flow rate (m3/s), L is the length in the flow directioncorresponding to the thickness of the sample (m), As is gas flow area (m2), ∆P is the pressure differential between the inlet side and outlet side (Pa) (∆P = P1 − P2), P1 is the inlet air pressure (Pa), P2 is the outlet air pressure (Pa), P is the pressure at which Qg was measured (Pa), is the arithmetic average pressure (Pa), .
The apparent gas permeability from Equation (1) includes Knudsen diffusion, also called slip flow. When a gas flows through a capillary whose diameter is in the same order of magnitude as the average free path between the gas molecules, slip flow becomes significant and must be considered in the permeability measurement. The gas permeability corrected for slip flow could be obtained from the Klinkenberg equation [21]:
where is the apparent gas permeability corrected for slip flow (Pa), s is the slip flow factor, λ is the average free path between gas molecules (m), r is the diameter of the capillary, R is the universal gas constant (8.31 J/mol/K), T is the absolute temperature (K), is the molecular weight of air (kg/mol). K is the intrinsic gas permeability (), µ is viscosity of fluid (Pa∙s) (for air at room temperature µ = 1.845 × 10⁻⁵ Pa∙s). kp represents the “true” gas permeability corrected for slip flow and can be determined graphically from the intercept of a plot of against the reciprocal average pressure (1/[7,21].
2.4. Thermal Conductivity Measurement
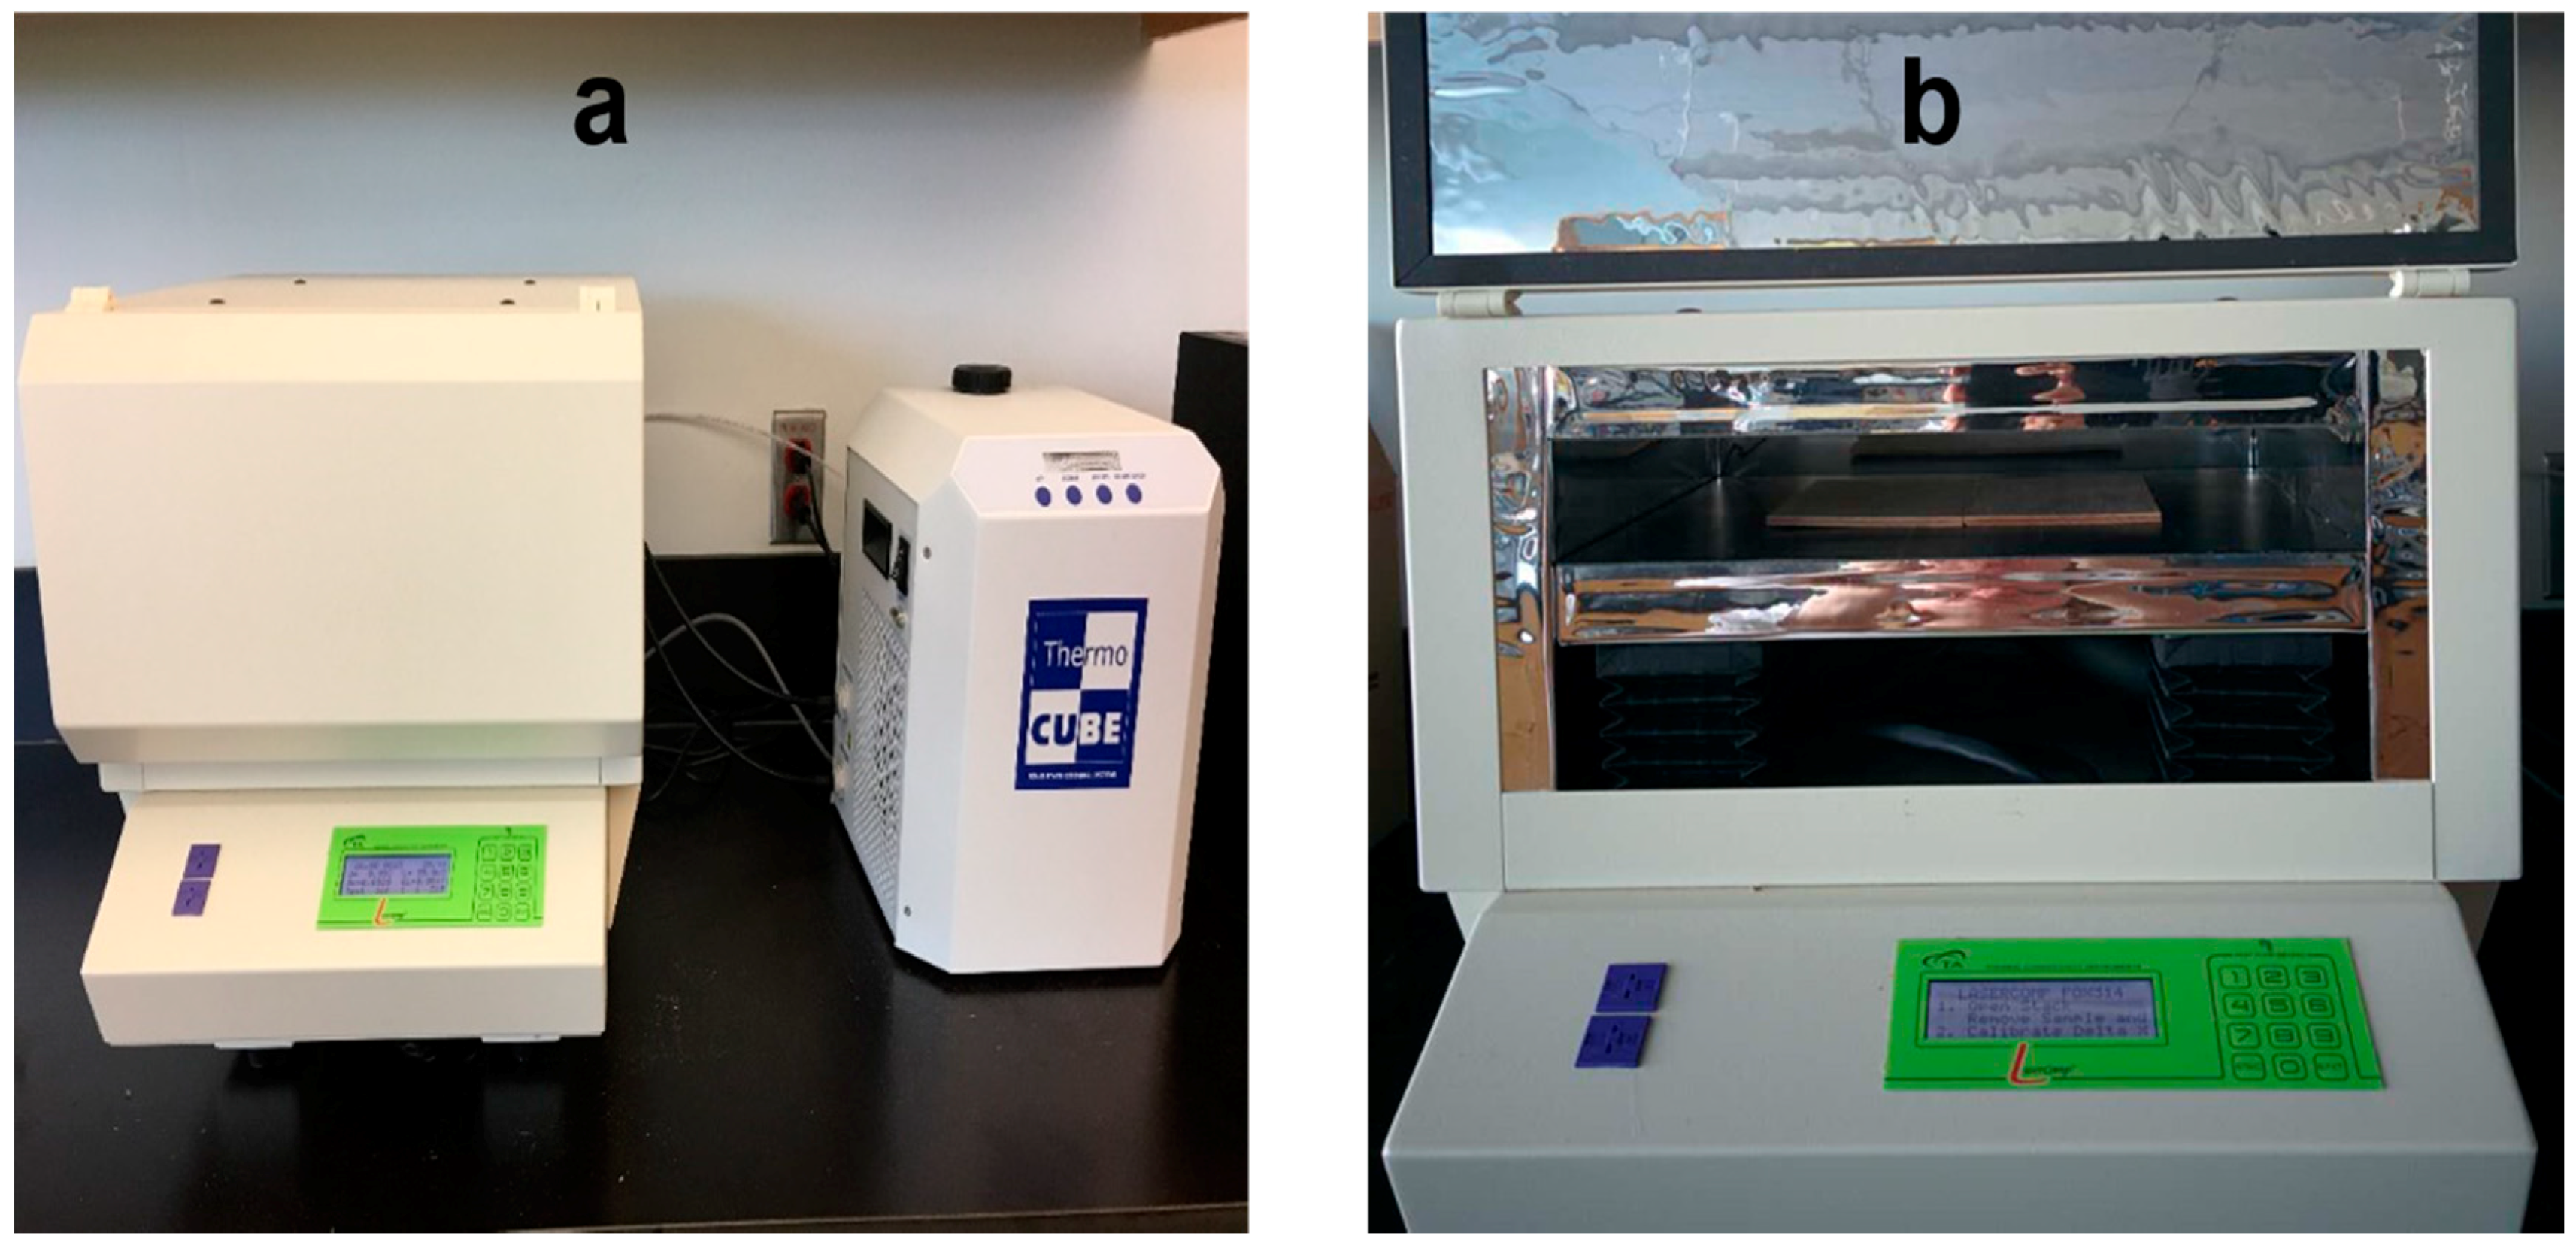
Four specimens for each densification time with dimensions 152.4 mm × 170.0 mm were prepared for thermal conductivity measurement using the apparatus LaserComp Fox 314 (TA instruments, New Castle, DE, USA) shown in Figure 4a. The Fox 314 instrument was designed according to the ASTM C518-04 standard test method for steady-state thermal transmission properties by means of the heat flow meter apparatus. The specimen was placed between two heating plates (Figure 4b) with different temperature for a sufficient length of time to obtain a uniform temperature gradient throughout the sample. The temperature of the upper heating plate was set at 10 °C and that of the base heating plate was set at 35 °C. The temperature equilibrium of the system is considered to be reached when the temperatures of the two plates are stable within ±0.2 °C after the set point has been reached. During the test, the auto thickness mode was selected, and the sample’s thickness was determined automatically by the instrument’s digital thickness measurement system.

Figure 4.
(a) Thermal conductivity testing apparatus; (b) Position of the sample and two heating plates.
The thermal conductivity is significantly affected by MC. To investigate the influence of MC on the thermal conductivity, each specimen (n = 4 for each group) was measured at three moisture content levels (0%, 6%, and 12%), respectively. Finally, the thermal conductivity was described as a function of densification time and MC.
2.5. Statistical Analysis
An analysis of variance (ANOVA) was performed to investigate the effect of densification time on the oven-dry density and gas permeability, and the effects of the densification time and MC on the thermal conductivity of densified sugar maple wood using SAS 9.4 (SAS Institute Inc., Cary, NC, USA) at significance level α = 0.05. Duncan’s test was conducted for multiple comparisons between average values obtained under different treatments.
3. Results
3.1. Density Profile and Oven-Dry Density
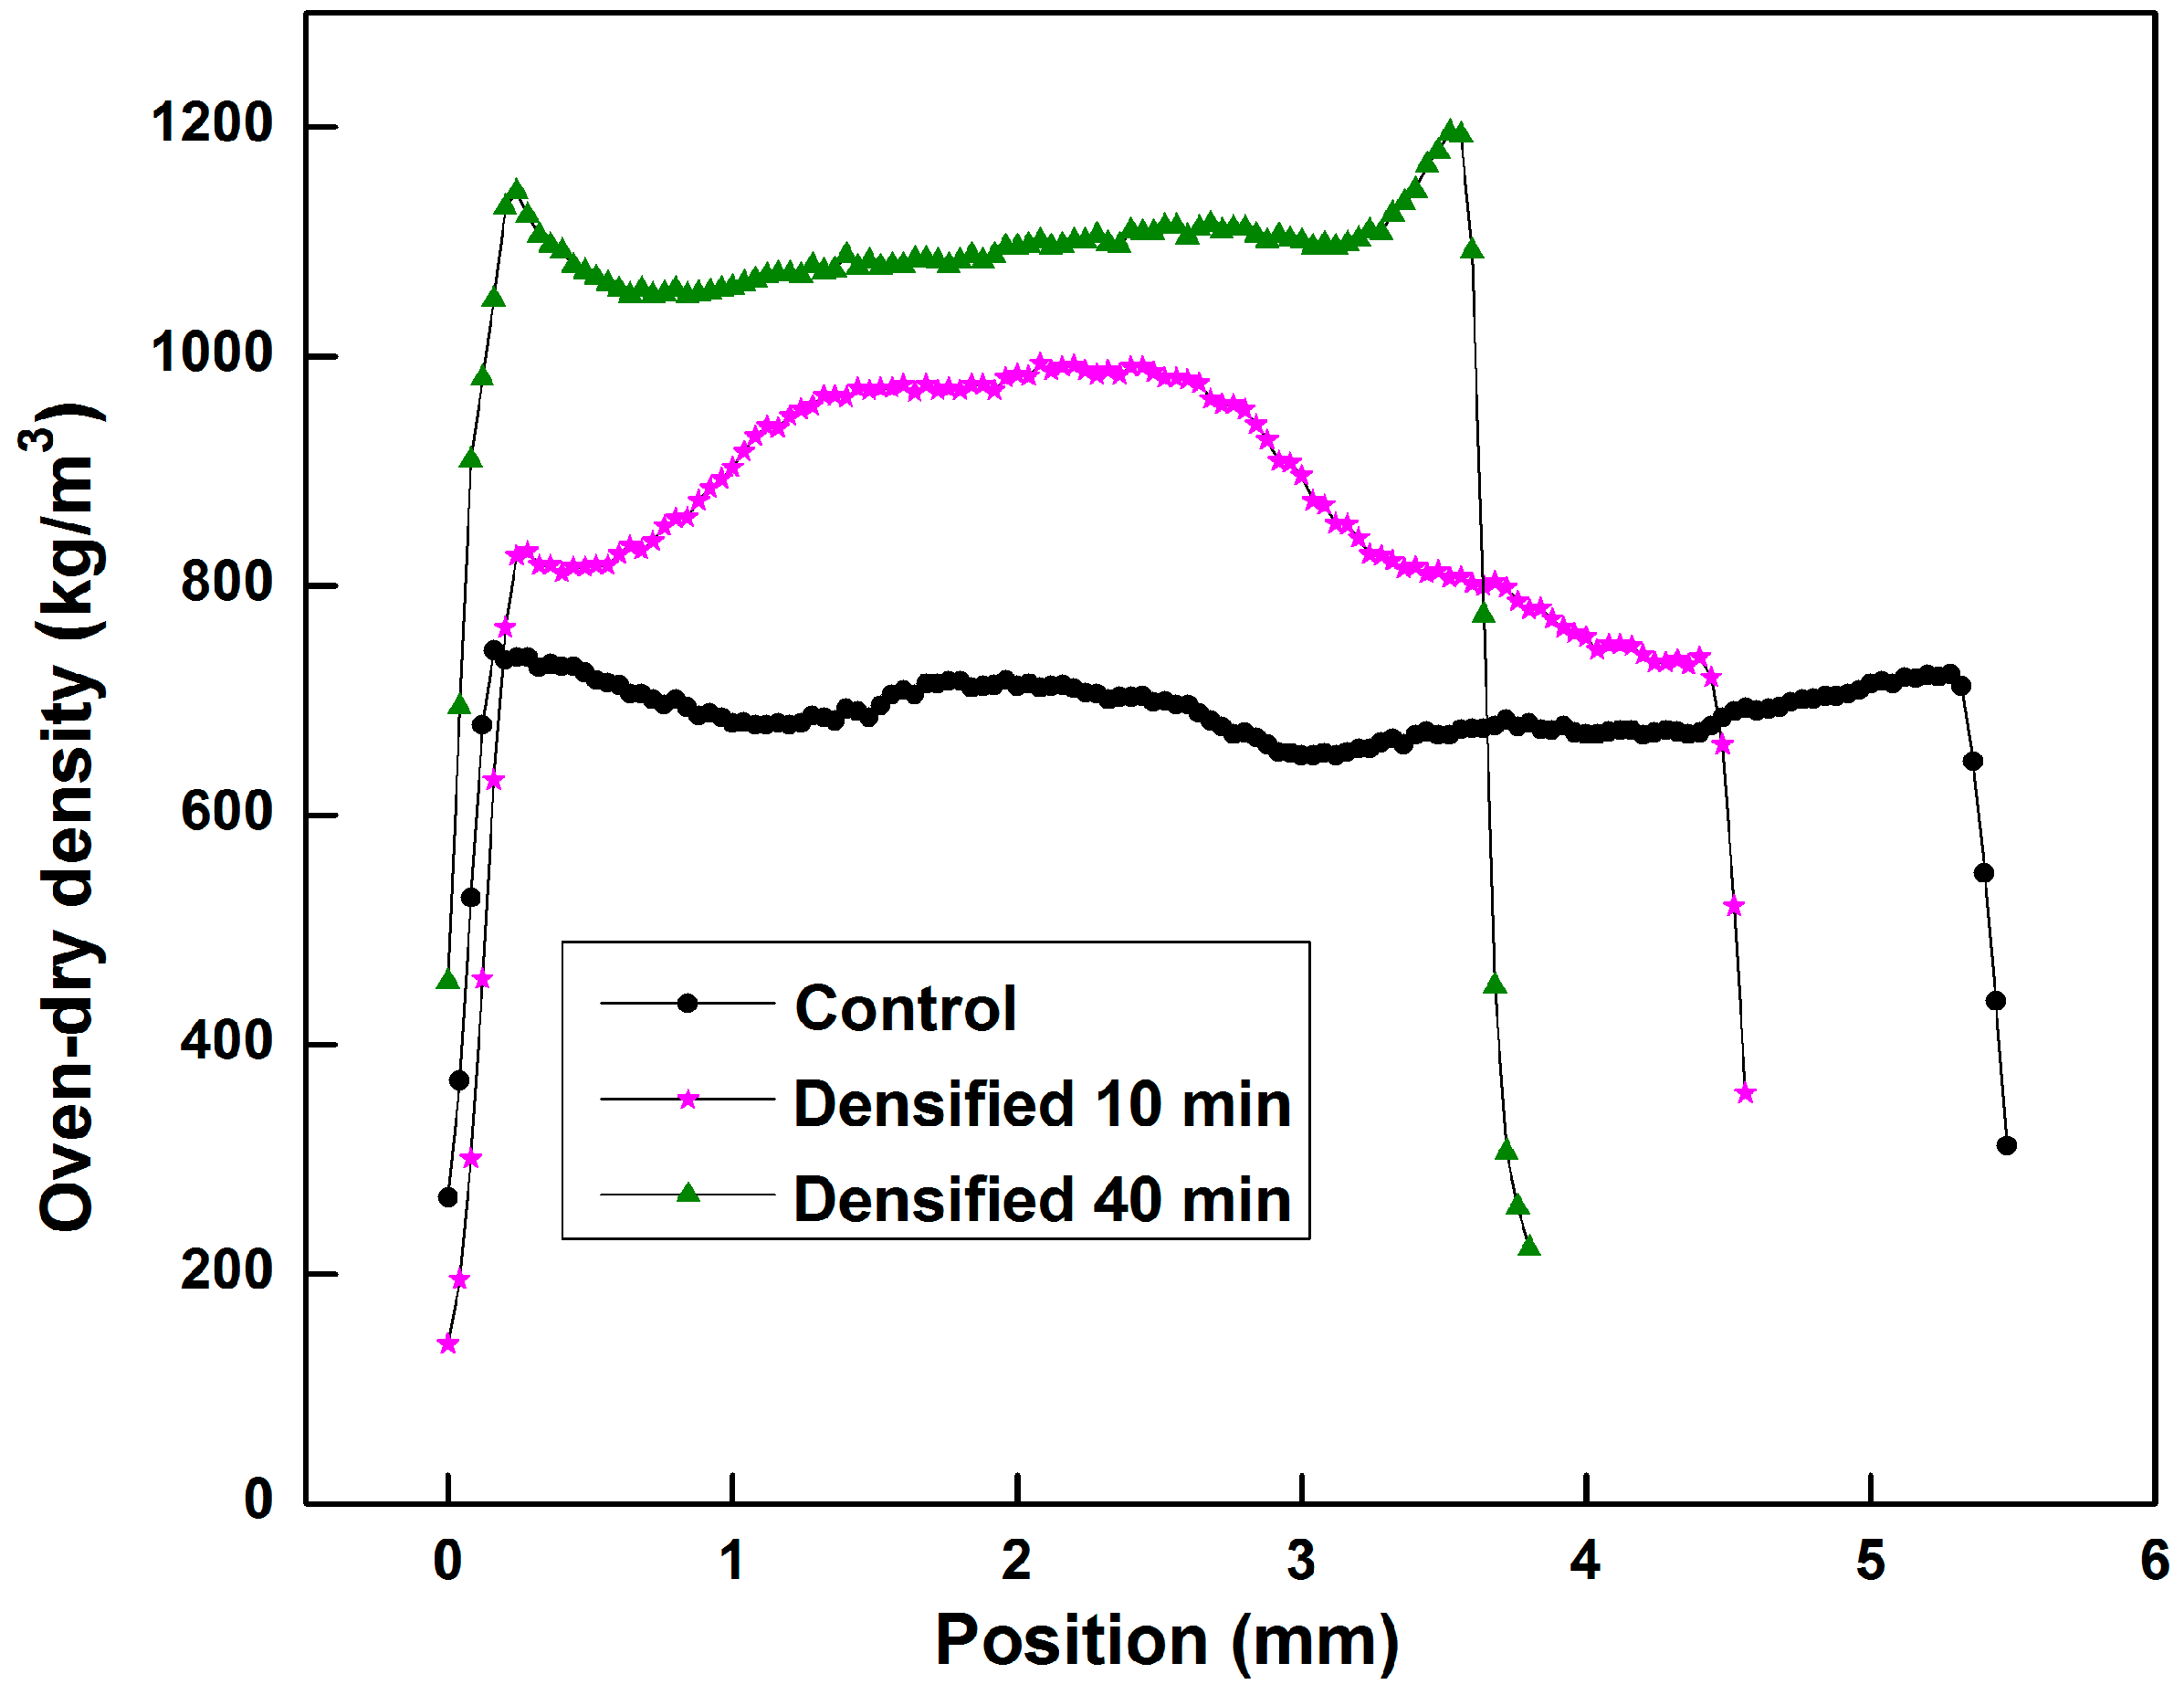
Typical density profiles of the control sample (densification time = 0 min) and samples densified for 10 min and 40 min, respectively, were selected to investigate the density distribution of sample through its thickness undergoing different densification time treatments. As shown in Figure 5, the density of the control sample was almost constant throughout the thickness, with the exception of the lower density values observed on both surfaces. The samples densified for 10 min showed a higher density in the core than at the surface, this might have been caused by the large spring back after the press opening. In our previous research [22], the density profile of the samples densified at lower temperatures (180 °C and 190 °C) without steam showed similar tendency. This result also suggested that densification for 10 min was not enough, as the compressed deformation was not stable. The compressed sample surface experienced large springback, resulting in a non-homogeneous density distribution. The density was more homogeneous in the core for the samples densified for 40 min, and a higher density at the surface than in the core was found. These observations were the same for samples densified at 200 °C with steam [22]. The heat distribution across the transverse direction was likely more homogeneous for samples densified for longer time with steam.
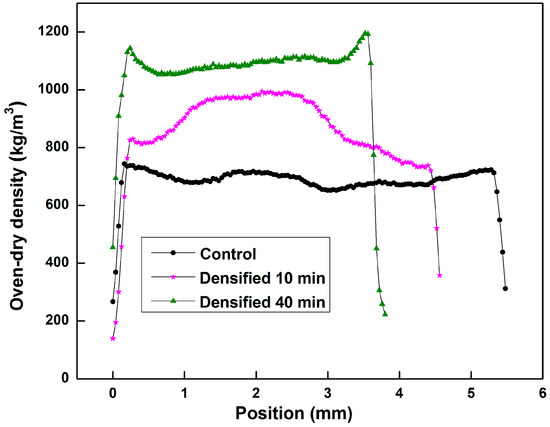
Figure 5.
Typical density profile of wood samples densified at different time.
Analysis of variance results of average oven-dry density versus densification time are presented in Table 1. The results show that the densification time had a significant effect on the oven-dry density (p = 0.0002). Table 2 presents the evolution of the oven-dry density and thickness of the samples during the THM densification process. It can be seen that the thickness of the samples decreases in general with densification time. Most of the thickness reduction occurred within the first 5–15 min. This main reduction of thickness may be caused by the decrease of the void volume, and consequently resulted in an increase of the oven-dry density. However, the oven-dry density did not present a linear increase with the decrease of thickness. When the densification time is over 40 min, the oven-dry density decreased, which might be due to the degradation of wood components for longer densification time at 200 °C, resulting in a decrease in the overall density [19].

Table 1.
Analysis of variance results of oven-dry density versus densification time.
Table 2.
Oven-dry density of the control and samples densified at different time.
3.2. Gas Permeability
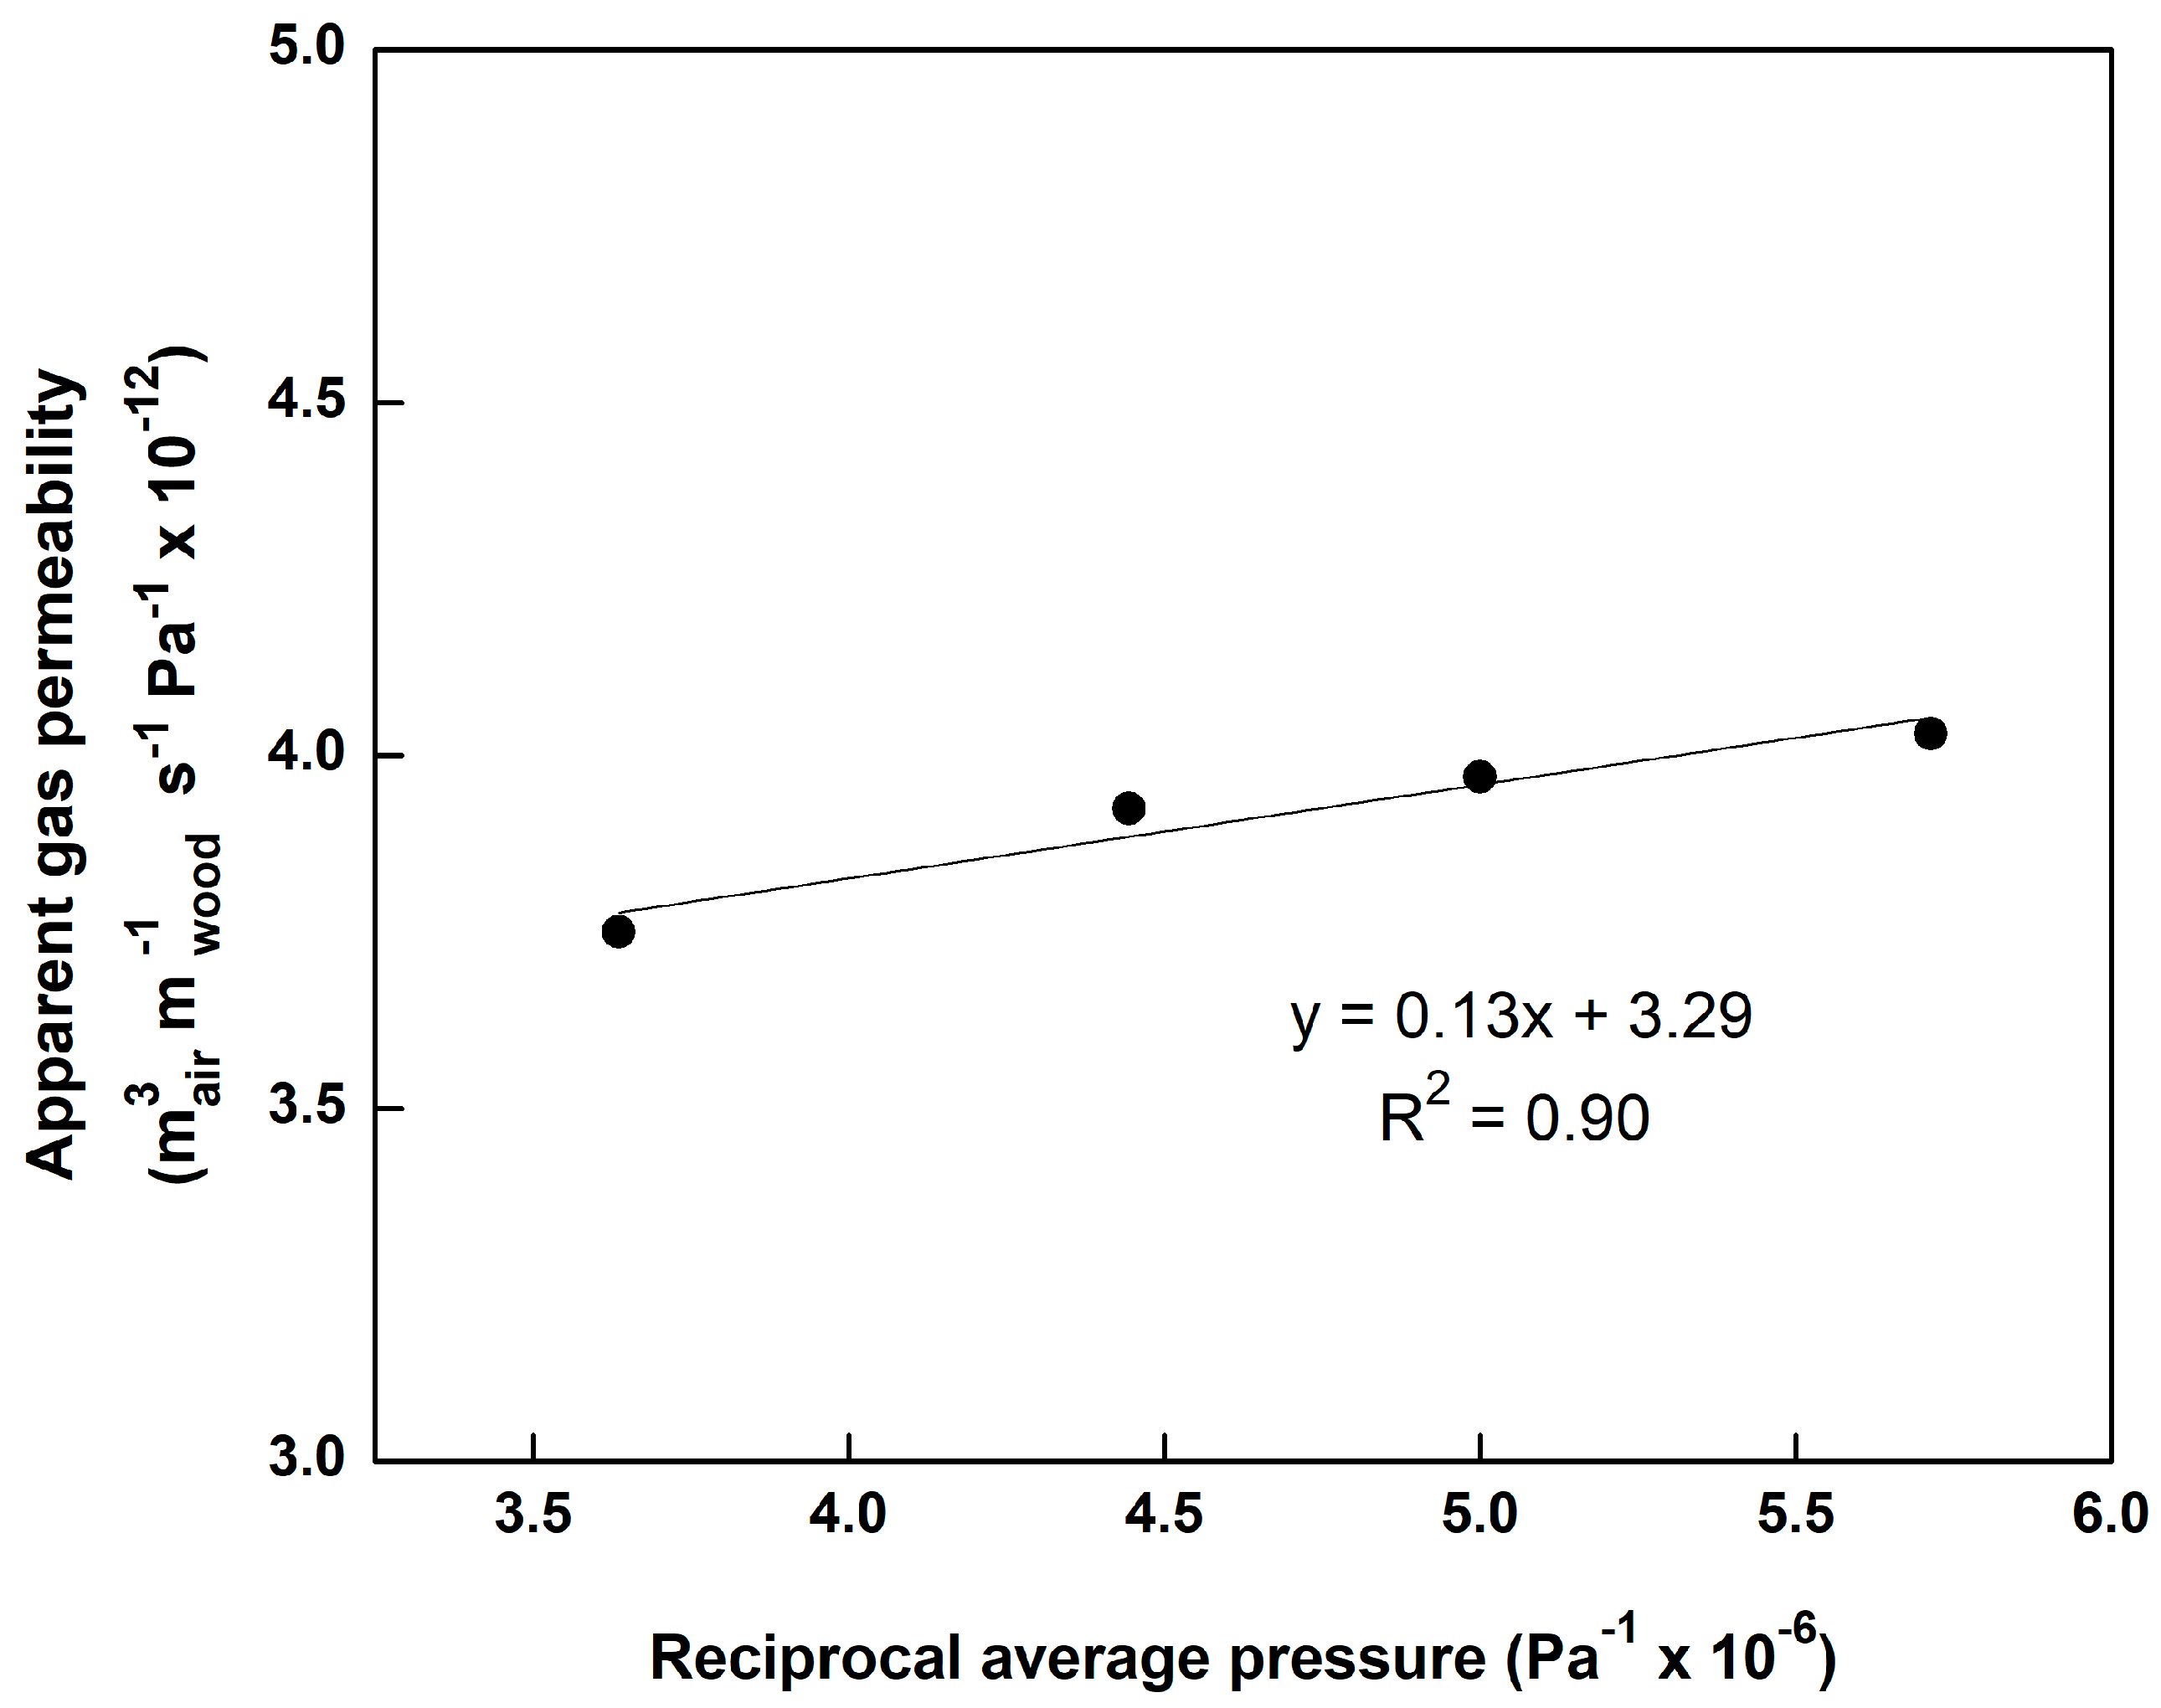
A plot of against 1/ was made for each sample to correct the effect of slip flow. Figure 6 presents a typical relationship of against 1/ for radial flow in a control sample. A linear relationship can be observed in Figure 6 with a small but significant slope indicating the occurrence of slip flow. Therefore, the measured values of should be corrected for slip flow to obtain the gas permeability from the intercept of the plot of against 1/ [7,21].
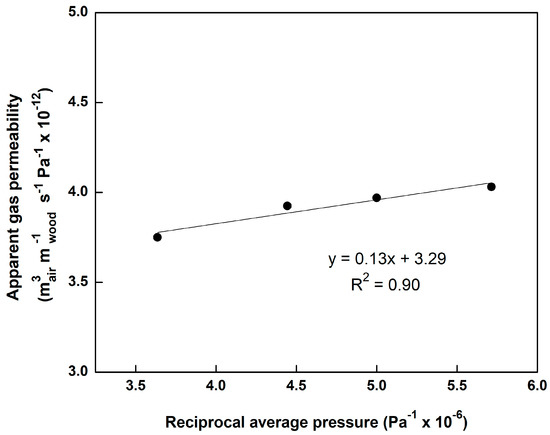
Figure 6.
Typical relationship of the apparent gas permeability against the reciprocal average pressure for radial flow of the control sample.
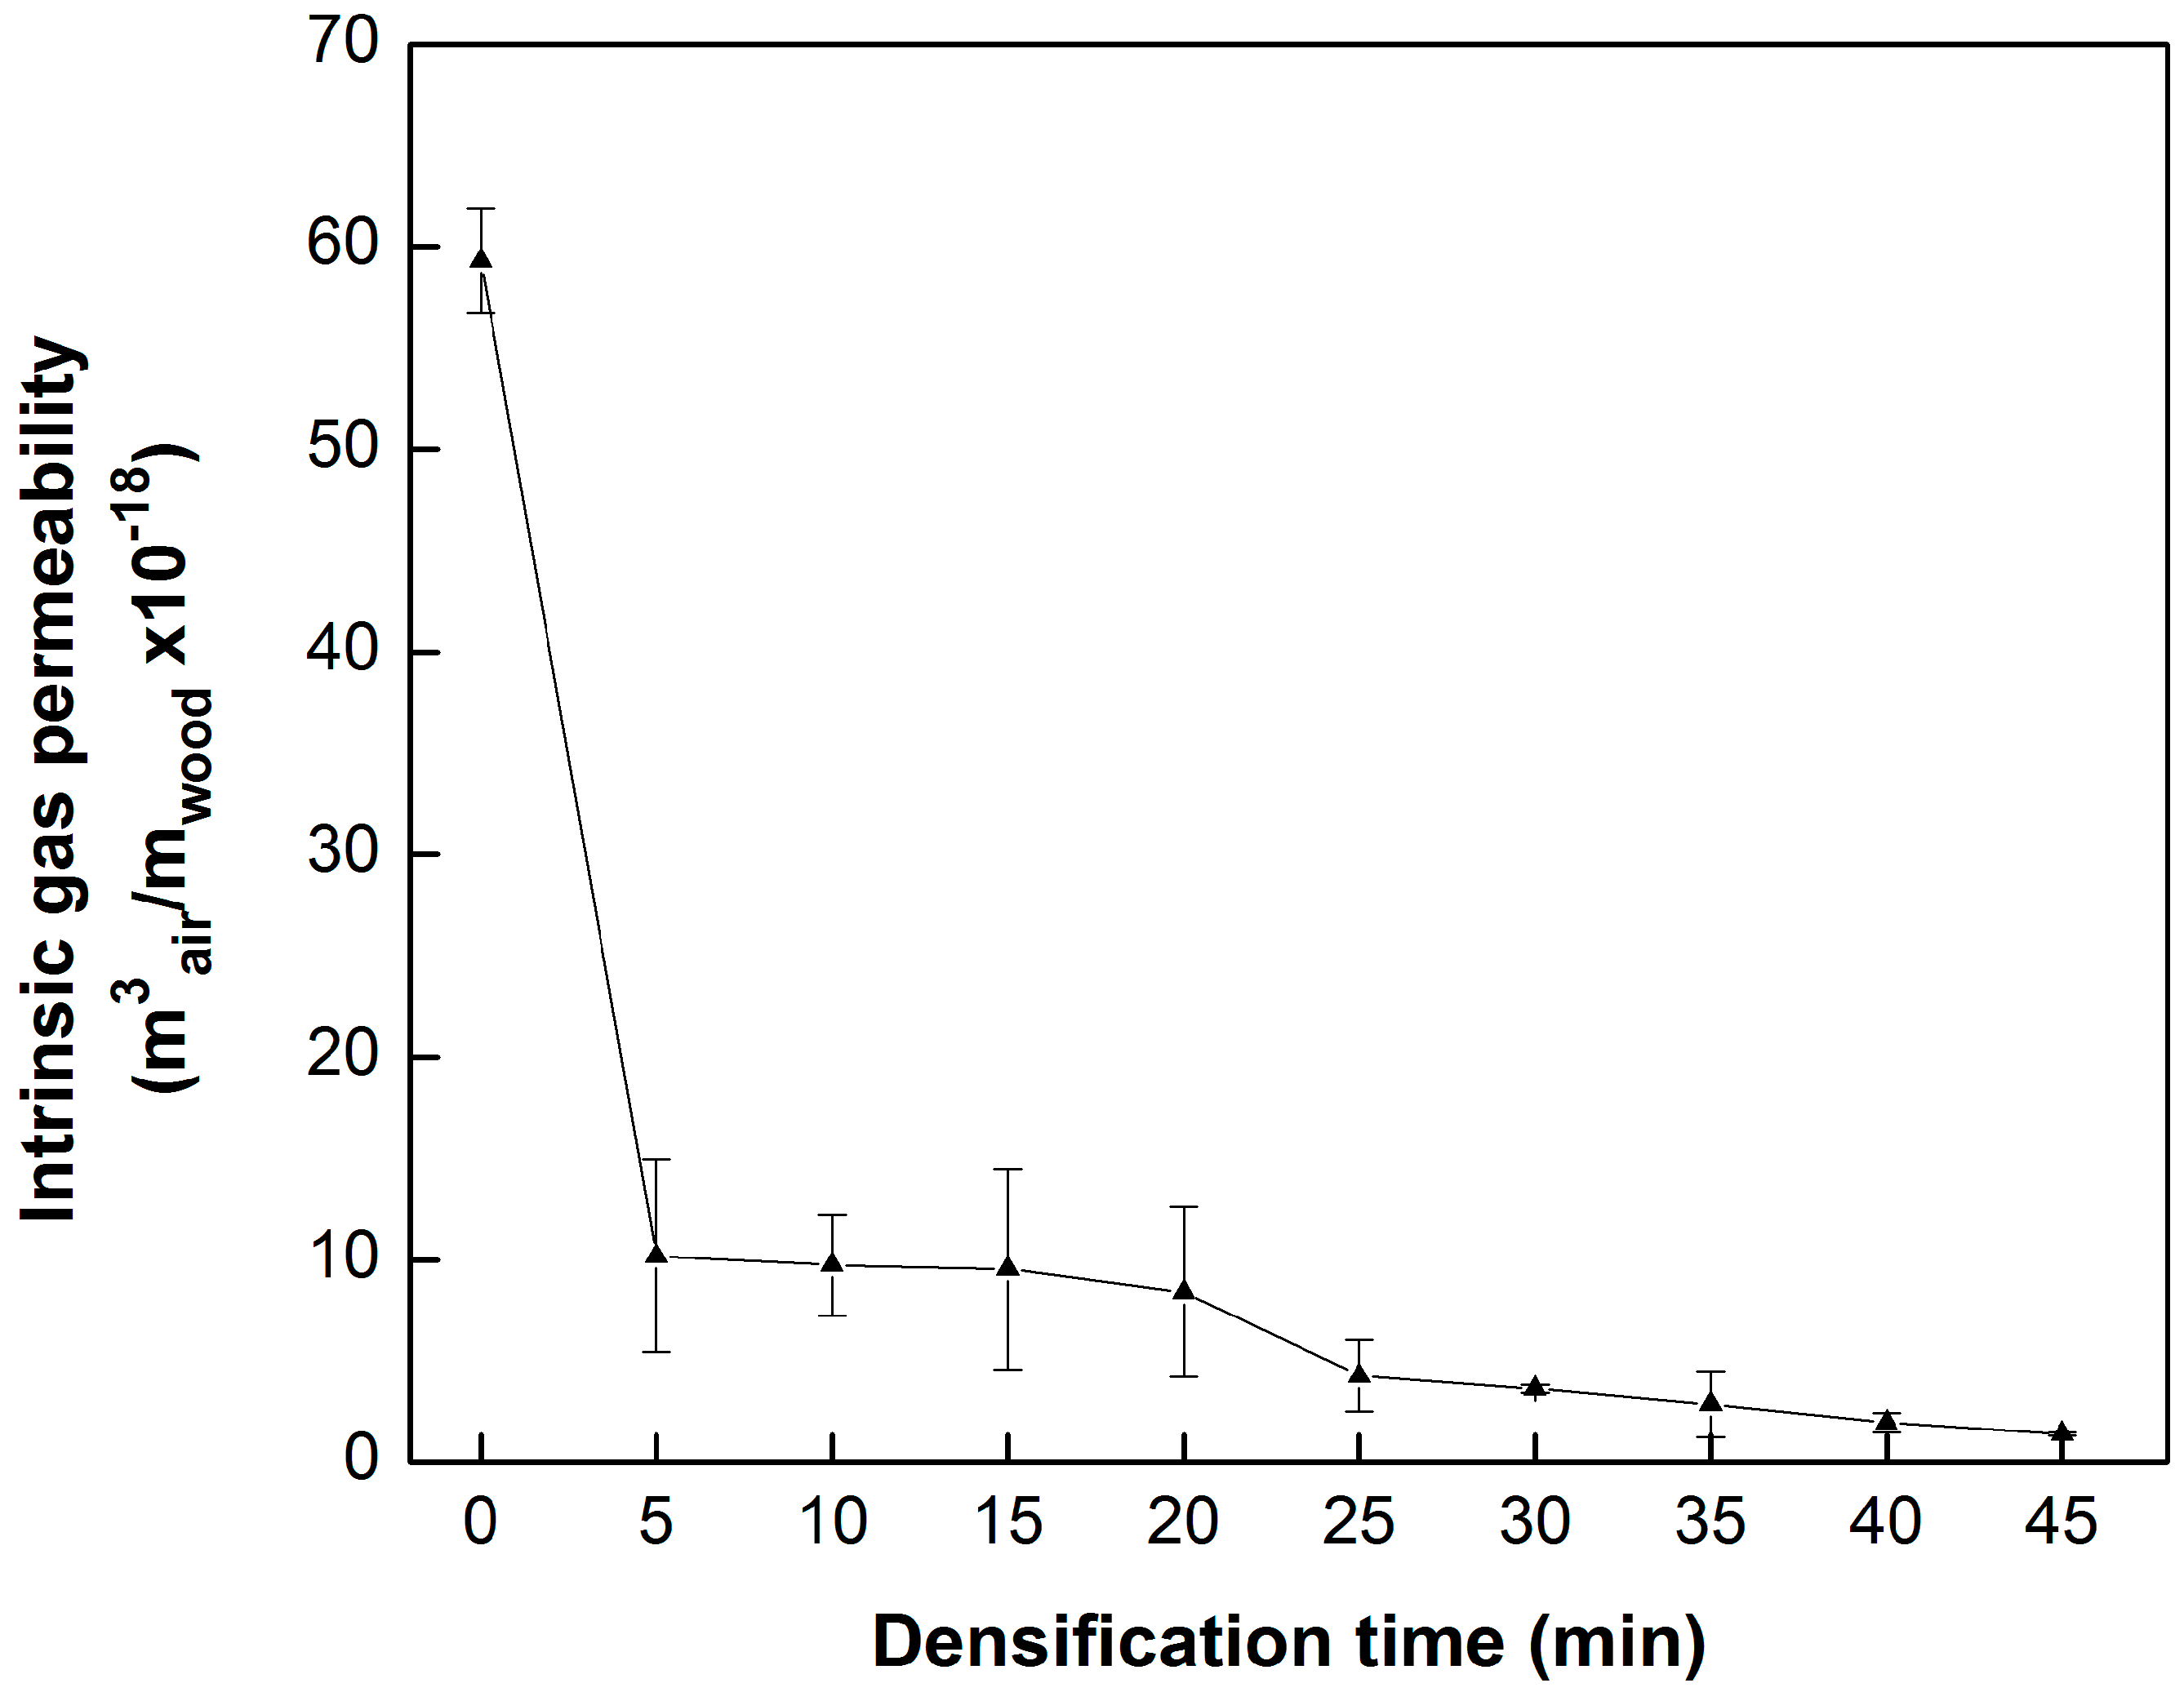
The evolution of radial intrinsic gas permeability during the THM densification process is presented in Figure 7. Analysis of variance results of intrinsic gas permeability versus densification time are presented in Table 3. Table 4 presents the intrinsic gas permeability values of the control and densified samples, and the results of Duncan’s test for all of the treatments.
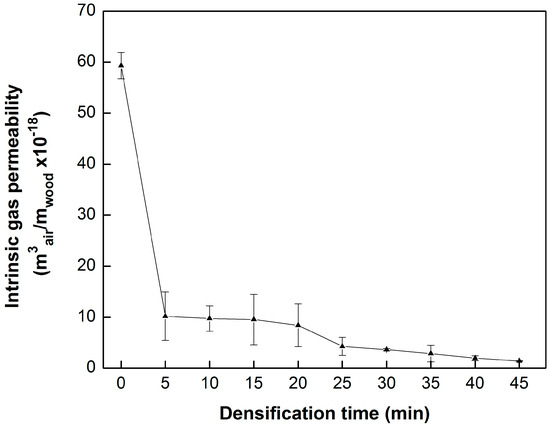
Figure 7.
Evolution of the radial intrinsic gas permeability during the densification process.
Table 3.
Analysis of variance results of the radial intrinsic gas permeability versus densification time.
Table 4.
Radial intrinsic gas permeability of the control and samples densified for different times.
The radial intrinsic gas permeability of the control sugar maple wood sample with an average oven-dry density of 694.3 kg/m3 is 5.93 × 10⁻¹⁷ . As shown in Figure 7 and Table 4, the intrinsic gas permeability of wood decreased rapidly at the beginning of the densification treatment compared with that of the control sample. However, no statistical difference was found between the intrinsic gas permeability of samples densified at 5, 10, and 15 min, which might be due to their densities which were not significantly different. From 20 to 45 min, the intrinsic gas permeability decreased with increasing of densification time. The intrinsic gas permeability of the control sample could be 5 to 40 times higher than for densified samples, which suggested that the void volume of wood reduced notably after densification. This might be due to the large difference between the radial intrinsic gas permeability of the control and densified samples, the whole data did not meet the assumption of a normal distribution. After performing normality test using SAS, it was found that a logarithm transformation (log10) was needed. Table 3 revealed that the densification time had also a significant effect on wood permeability (p < 0.0001).
3.3. Thermal Conductivity
Table 5 shows the analysis of variance results of thermal conductivity versus densification time and MC. The thermal conductivity values of the control samples and densified samples are presented in Table 6. Table 5 reveals that both densification time and MC had significant effect on the thermal conductivity, but the interaction between the densification time and MC was not significant.
Table 5.
Analysis of variance results of thermal conductivity versus densification time and moisture content.
Table 6.
Thermal conductivity of the control and samples densified at different time.
There is a common agreement that MC has an important effect on wood thermal conductivity. As shown in Table 6, for all of treatment times, thermal conductivity increased with increasing MC. It could be found that the thermal conductivity increased by 0.5–1.5 percent for an increase of one percent MC for densified sugar maple wood. In particular, it can be noticed that the thermal conductivity of densified samples is slightly lower than that of the control samples. This was not expected given that wood thermal conductivity generally increases with increasing density [1,12]. However, according to ThermoWood Handbook [23], the thermal conductivity of heat treated wood (230 °C, 3–5 h) is reduced by 20–25% compared with normal untreated softwoods (pine and spruce). The underlying reasons for the decrease in thermal conductivity after densification treatment are not entirely clear. It might be due to the alteration of the crystalline structure of cellulose chains at higher treatment temperature, resulting in strength loss and changes in its ability to conduct heat at the cellular level [16].
4. Discussion and Conclusions
THM is a feasible process to increase significantly the density of maple wood in a relatively short time. Most of the oven-dry density increase occurred within the first 5–15 min of treatment. However, the oven-dry density did not show a linear increase with the decrease of thickness. The samples, densified for 10 min, showed a higher density in the core than at the surface, which might have been caused by the large springback after the press opening. The heat distribution across the transverse direction was more homogeneous for samples densified for a longer time with steam. The intrinsic gas permeability of the control samples was 5 to 40 times higher than that of densified wood. This indicated that the void volume of wood reduced notably after the densification treatment. The thermal conductivity increased by a 0.5–1.5% increase of moisture content for densified sugar maple wood. The thermal conductivity of densified samples was lower than that of the control samples. The densification time had significant effects on oven-dry density and gas permeability. Both densification time and moisture content had significant effects on thermal conductivity, but their interaction effect was not significant.
Author Contributions
Q.F. carried out the experimental tests and prepared the manuscript. A.C. and A.L. contributed to the experimental design and revised the manuscript. All authors read, discussed and approved the final manuscript.
Funding
This research was funded by the Natural Sciences and Research Council of Canada (NSERC) for funding this research under Discovery Grant No. 121954-2012.
Acknowledgments
The authors thank David Lagueux for technical assistance with the densification process.
Conflicts of Interest
The authors declare no conflict of interest.
References
- Siau, J.F. Transport Processes in Wood; Springer: Heidelberg, Germany, 1984; ISBN 13:978-3-642-69215-4. [Google Scholar]
- Dai, C.P.; Yu, C.M.; Zhou, X.Y. Heat and mass transfer in wood composite panels during hot pressing. Part II. Modeling void formation and mat permeability. Wood Fiber Sci. 2005, 37, 242–257. [Google Scholar]
- Comstock, G.L. Directional permeability of softwoods. Wood Fiber Sci. 2007, 1, 283–289. [Google Scholar]
- Denisov, O.B.; Anisov, P.P.; Zuban, P.E. Untersuchung der permeabilität von spanvliesen. Holztechnologie 1975, 16, 10–14. [Google Scholar]
- Hata, T.; Kawai, S.; Ebihara, T.; Sasaki, H. Production of particleboards with steam-injection press. Press V. Effects of particle geometry on temperature behaviors in particle mats and on air permeabilities of boards. Mokuzai Galdcaishi 1993, 39, 161–168. [Google Scholar]
- Von Haas, G.; Steffen, A.; Frühwald, A. Permeability of fibre, particle and strand mats for gas. Holz Roh Werkst. 1998, 56, 386–392. [Google Scholar]
- Lihra, T.; Cloutier, A.; Zhang, S.Y. Longitudinal and transverse permeability of balsam fir wetwood and normal heartwood. Wood Fiber Sci. 2000, 32, 164–178. [Google Scholar]
- García, R.A.; Cloutier, A. Characterization of heat and mass transfer in the mat during the hot pressing of MDF panels. Wood Fiber Sci. 2005, 37, 23–41. [Google Scholar]
- Defo, M.; Cloutier, A.; Fortin, Y. Modeling vacuum-contact drying of wood: The water potential approach. Dry. Technol. 2000, 18, 1737–1778. [Google Scholar] [CrossRef]
- Thömen, H. Modeling the Physical Processes in Natural Fiber Composites during Batch and Continuous Pressing. Ph.D. Thesis, Oregon State University, Corvallis, OR, USA, May 2000. [Google Scholar]
- Gu, H.M.; Zink-Sharp, A. Geometric model for softwood transverse thermal conductivity. Part I. Wood Fiber Sci. 2005, 37, 699–711. [Google Scholar]
- Simpson, W.; TenWolde, A. Physical properties and moisture relations of wood. In Wood Handbook: Wood as an Engineering Material; Ross, R.J., Ed.; USDA Forest Service, Forest Products Laboratory: Madison, WI, USA, 1999; pp. 3–17. [Google Scholar]
- Troppová, E.; Švehlík, M.; Tippner, J.; Wimmer, R. Influence of temperature and moisture content on the thermal conductivity of wood-based fibreboards. Mater. Struct. 2015, 48, 4077–4083. [Google Scholar] [CrossRef]
- Griffiths, E.; Kaye, G.W.C. The measurement of thermal conductivity. Proc. R. Soc. A 1923, 104, 71–98. [Google Scholar] [CrossRef]
- MacLean, J.D. Thermal conductivity of wood. Heat. Pip. Air Cond. 1941, 13, 380–391. [Google Scholar]
- Suleiman, B.M.; Larfeldt, J.; Leckner, B.; Gustavsson, M. Thermal conductivity and diffusivity of wood. Wood Sci. Technol. 1999, 33, 465–473. [Google Scholar] [CrossRef]
- Haselein, C.R. Numerical Simulation of Pressing Wood-Fiber Composites. Ph.D. Thesis, Oregon State University, Corvallis, OR, USA, January 1998. [Google Scholar]
- De Moura, L.F.; Hernández, R.E. Evaluation of varnish coating performance for two surfacing methods on sugar maple wood. Wood Fiber Sci. 2005, 37, 355–366. [Google Scholar]
- Fang, C.H.; Mariotti, N.; Cloutier, A.; Koubaa, A.; Blanchet, P. Densification of wood veneers by compression combined with heat and steam. Eur. J. Wood Wood Prod. 2012, 70, 155–163. [Google Scholar] [CrossRef]
- Fu, Q.; Cloutier, A.; Laghdir, A. Optimization of the thermo-hygromechanical (THM) process for sugar maple wood densification. BioResources 2016, 11, 8844–8859. [Google Scholar] [CrossRef]
- Siau, J.F. Wood: Influence of Moisture on Physical Properties; Department of Wood Science and Forest Products, Virginia Polytechnic Institute and State University: Blacksburg, VA, USA, 1995; ISBN 13:9780962218101-10:0962218103. [Google Scholar]
- Fu, Q.; Cloutier, A.; Laghdir, A. Effects of heat and steam on the mechanical properties and dimensional stability of thermo-hygromechanically densified sugar maple wood. BioResources 2017, 12, 9212–9226. [Google Scholar] [CrossRef]
- Finnish ThermoWood Association. ThermoWood Handbook; Finnish ThermoWood Association: Helsinki, Finland, 2003. [Google Scholar]

© 2018 by the authors. Licensee MDPI, Basel, Switzerland. This article is an open access article distributed under the terms and conditions of the Creative Commons Attribution (CC BY) license (http://creativecommons.org/licenses/by/4.0/).