Article

Optimising Mechanical Performance of Additive Manufactured Composites for Biomedical Applications

by
Abdul Qadir
1,2,
Amadi Gabriel Udu
3,4,* and
Norman Osa-uwagboe
1,4
1
Wolfson School of Mechanical, Electrical, and Manufacturing Engineering, Loughborough University, Loughborough LE11 3TU, UK
2
The Benazir Bhutto Shaheed University of Technology and Skill Development Khairpur Mirs, Khairpur 66020, Sindh, Pakistan
3
School of Engineering, University of Leicester, Leicester LE1 7RH, UK
4
Air Force Research and Development Centre, Nigerian Air Force Base, Kaduna PMB 2104, Nigeria
*
Author to whom correspondence should be addressed.
Fibers 2025, 13(6), 79; https://doi.org/10.3390/fib13060079
Submission received: 28 February 2025 / Revised: 22 April 2025 / Accepted: 6 June 2025 / Published: 13 June 2025

Abstract

The mechanical properties of additive manufactured (AM) short-fibre reinforced polymer (SFRP) composites are significantly influenced by infill patterns, fibre orientation, and fibre-matrix interactions. While previous studies have explored the role of process parameters in optimising AM components, the impact of infill geometry on anisotropy and mechanical performance remains underexplored, particularly in the context of machine learning (ML). This study develops an ML-driven framework to predict the tensile and flexural properties of AM SFRP composites with different infill patterns, including triangular, hexagonal, and rectangular. AM structures were fabricated and subjected to tensile and flexural tests, with the data used to train ML models, including LightGBM, XGBoost, and artificial neural networks (ANN). The results showed that the triangular infill pattern had the highest tensile strength and stiffness, the hexagonal infill had the lowest flexural properties, and the rectangular infill exhibited performance levels that fell between those of the triangular and hexagonal patterns. The ML models demonstrated high prediction accuracy, with R-squared values exceeding 0.95. XGBoost performed best for predicting tensile properties of hexagonal infill, while ANN excelled with triangular and rectangular configurations. This study demonstrates the potential of machine learning to enhance the mechanical performance of additively manufactured SFRP composites by capturing the complex interplay between infill geometry and fibre-matrix interactions. Thus, providing additional data for the design of high-performance materials in applications such as biomedical devices.

1. Introduction

Additive Manufacturing (AM), such as Fused Filament Fabrication (FFF), enables complex geometries unachievable via traditional methods, offering design flexibility and material efficiency. Recent advancements integrate short-fibre-reinforced polymers (SFRPs) into AM, where embedded fibres enhance stiffness and strength compared to unreinforced polymers, mitigating structural weaknesses in 3D-printed parts [1]. These properties have enabled the use of these materials in a variety of applications such as aerospace, defence, automobile, and bioengineering [2,3]. The mechanical performance of SFRPs in AM is influenced by multiple parameters: fibre type (carbon, glass) and loading [4], matrix material (PLA, ABS) compatibility [5], and printing parameters such as layer height, nozzle temperature, and raster orientation, which govern fibre alignment and interfacial bonding [6,7,8]. Beyond these factors, infill patterns (triangular, hexagonal, rectilinear, etc.) critically optimise the weight-to-strength ratio by balancing material distribution and structural integrity [9,10]. For example, Al Rashid et al. [11] demonstrated that triangular and hexagonal patterns exhibit superior performance at lower infill densities (18–40%), whereas rectangular patterns achieve greater mechanical strength and elongation at higher densities (55–62%), however, if the material saving is the priority hexagonal patterns are preferred. Similarly, Martulli et al. [12] found that while triangular and rectangular patterns showed comparable bending performance, hexagonal patterns underperformed by 13–25%. Further analysis by Yasa et al. [13] on fracture behaviour in 3D-printed composites revealed that optimising infill patterns can enhance tensile strength and stiffness by improving load distribution. However, patterns that introduce voids or promote fibre pullout may compromise ductility, increasing brittleness and reducing overall structural resilience. Additionally, infill orientation plays a critical role in failure modes: certain patterns exhibit superior resistance to crack propagation due to their alignment with stress distribution pathways. While traditional experimental and simulation-based approaches have been instrumental in understanding the interplay of fibre type, matrix selection, and printing parameters on SFRP performance, the inherent complexity of these interactions, particularly the anisotropic behaviour induced by layer-wise fabrication, poses significant challenges for predictive modelling. Recent advances in machine learning (ML) have emerged as a powerful tool to decode these multifaceted relationships [14]. Artificial Neural Networks (ANNs) have been used to predict composite properties in different mechanical case studies [15,16]. For instance, Gayatri et al. [17] demonstrated the efficacy of Artificial Neural Networks (ANNs) in predicting tensile properties of AM composites by correlating fibre loading and process parameters, while Huang et al. [18] combined finite element analysis with ML to predict the transverse modulus of unidirectional fibre composites. These studies highlight the capacity of ML to bridge experimental data with computational efficiency, enabling rapid property prediction without exhaustive trial-and-error iterations.
A growing body of work has also leveraged ML to optimise AM process parameters, such as nozzle temperature and print speed, to enhance interlayer adhesion and reduce porosity in composites [19,20]. However, infill patterns, which critically govern the weight-to-strength ratio and structural efficiency of AM components, remain underexplored in ML frameworks. Furthermore, Meiabadi et al. [21] employed a hybrid ANN-genetic algorithm (ANN-GA) to model toughness, part thickness, and production cost, achieving 7.5–11.5% higher accuracy than standalone ANN. Their work highlights the efficacy of ML in reducing experimental iterations and optimising parameters like infill percentage, extruder temperature, and layer thickness. However, while infill percentage has been studied, the role of infill geometry (e.g., triangular, hexagonal) in tailoring anisotropy and mechanical properties remains underexplored. Similarly, Agarwal et al. [22] employed ML models to predict the compressive strength of FDM-printed PLA cortical screws, identifying Random Forest (RF) as the most accurate predictor (R2 = 0.96). Their study emphasises the significance of process parameters such as infill pattern and layer height in achieving mechanical reliability for load-bearing implants. However, it overlooks the anisotropic fibre-matrix interactions characteristic of SFRPs. This omission underscores the necessity for ML models specifically designed to address infill-induced anisotropy in additively manufactured composites, where fibre orientation, interfacial bonding, and infill geometry jointly influence mechanical performance. Building on these foundations, this work proposes an ML-driven framework to systematically characterise how infill patterns modulate the mechanical properties of AM short-fibre composites. By integrating experimental data from tensile and flexural tests with features such as infill patterns, the model aims to predict anisotropic stiffness and strength. It is worth noting that while a variety of characterisation techniques would provide more data for the ML, this study will be limited to the tensile and flexural tests. This approach advances beyond prior ML studies by explicitly addressing the synergy between infill design and fibre-matrix behaviour, offering a pathway to optimise lightweight, high-performance SFRP structures.

2. Materials and Experimental Methodology

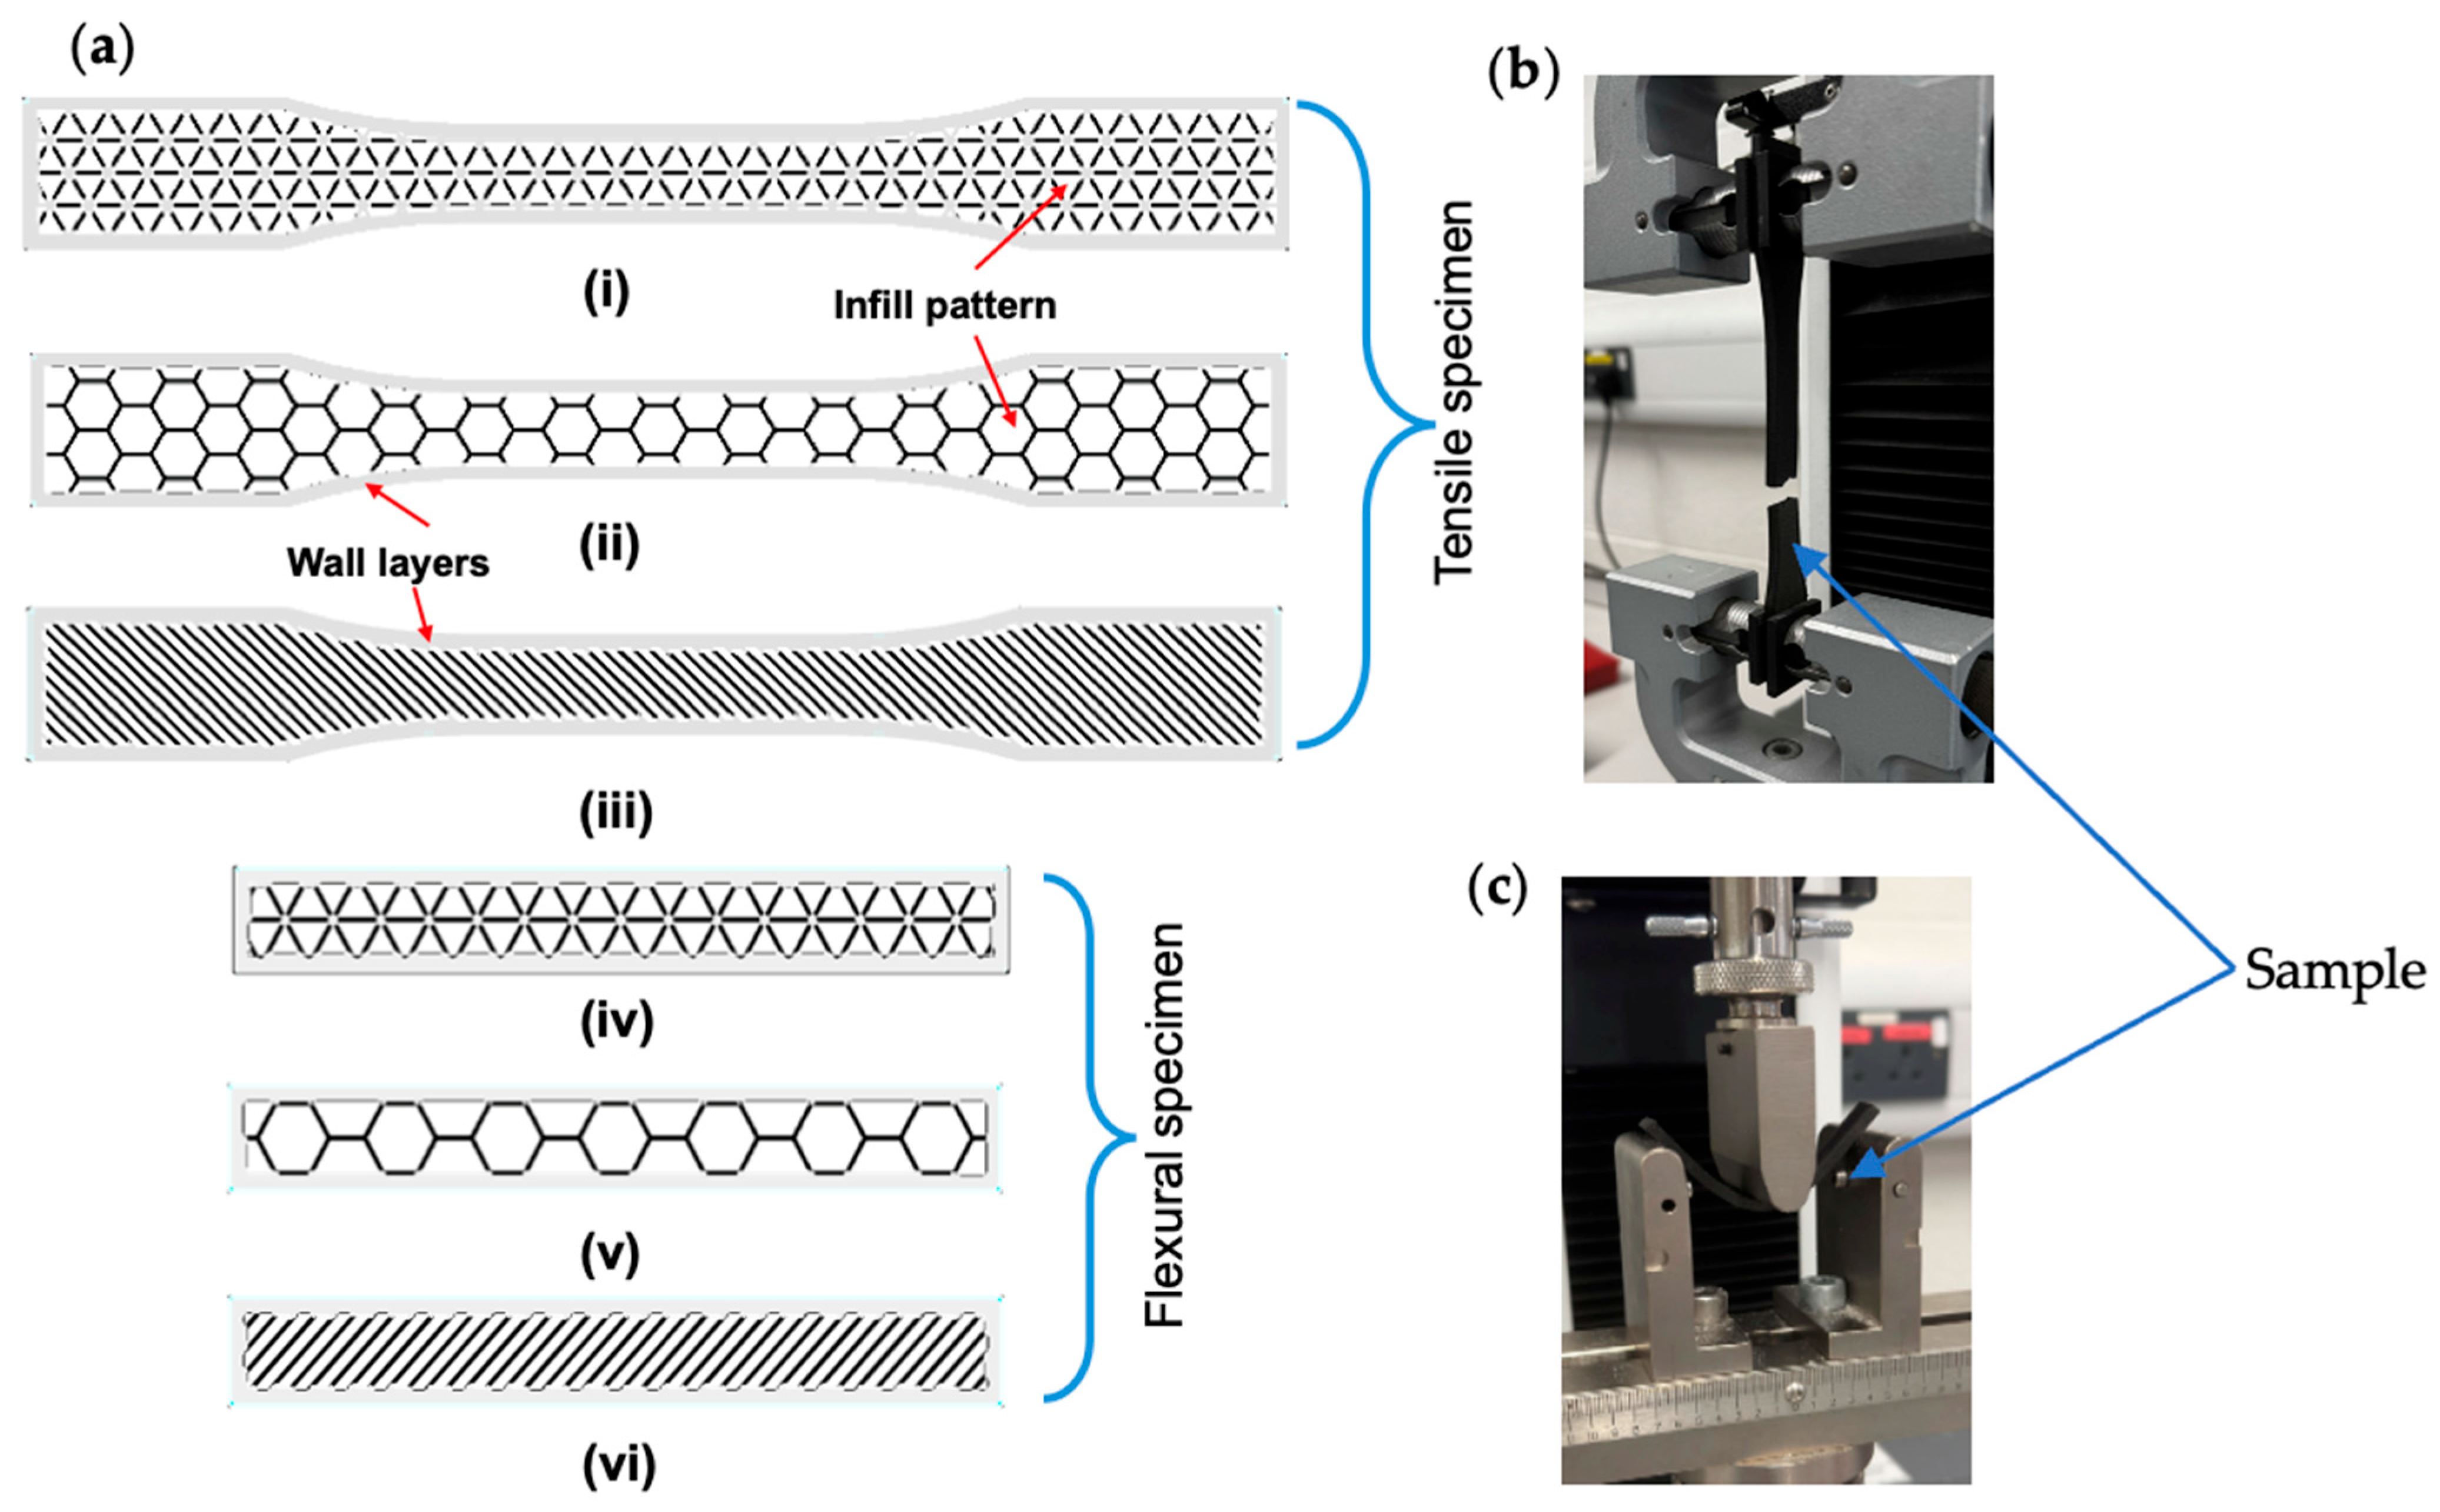
2.1. Materials and Manufacturing Methods

This study investigates the mechanical properties of components printed using Onyx material, a 1.75 mm diameter nylon (polyamide 6) based filament impregnated with 10–20% short carbon fibres by volume, as specified in the Markforged material data sheet. According to Nikiema et al. [23], the carbon fibres within Onyx exhibit lengths ranging from 7.03 to 44.60 μm and are predominantly aligned along the deposition direction during printing. The Oynx is widely preferred due to its lightweight strength and improved chemical resistance. The mechanical properties provided in the datasheet by the manufacturer are shown in Table 1. For this study, tensile and flexural specimens were fabricated using a Markforged Mark II desktop printer with different infill types to optimise structural integrity. To investigate the effects of the infill types on the mechanical properties of the resulting SFRCs, the printing configurations are planned by adjusting the infill pattern in Markforged Eiger software (v4.10.4). There are three infill types selected for this study, which are Triangular, Hexagonal, and Rectangular, as shown in Figure 1; each one offers distinct advantages in the resulting specimen. The percentage infill is kept at 28% for all samples, and details of other parameters are given in Table 2. To ensure consistency, these parameters were maintained throughout the fabrication of all samples. In terms of testing, the tensile samples had dimensions 160 mm × 20 mm × 3 mm. Tensile tests were conducted on an Instron Universal Testing machine with a 55 mm gauge length at a crosshead speed of 2 mm/m, producing a total of 184,037 paired displacement–stress measurements across the nine specimens. The flexural specimen had dimensions of 80 mm × 10 mm × 3 mm. Flexural tests were performed in 3-point bending with a span of 120 mm at a crosshead speed of 5 mm/min on the same machine, yielding 131,670 paired displacement–stress measurements across nine specimens. The standardised tests assured the reliability and repeatability of the results.

2.2. ML Metrics and Assessment

The ML methodology comprises several key stages that underpin the development of effective predictive models. These stages include data preprocessing, the selection of regression algorithms, model training, and hyper-parameter optimisation, as well as model evaluation. Each of these steps is critical to ensuring the accuracy, reliability, and robustness of the proposed ML framework. The raw time-series data from the tensile and flexural experiments were assembled into two separate ML datasets of 184,037 and 131,670 paired observations, respectively.

2.2.1. Data Preprocessing

Data preprocessing, which includes feature scaling (such as normalisation or standardisation), is a crucial step in the ML framework. By rescaling the feature values to a standard range or distribution, this process eliminates the risk of feature dominance, minimises the influence of outliers, and enhances the compatibility and convergence of ML algorithms. In this study, the dataset features, denoted as X = [x1, x2,..., xM]TRNxM, where N is the total number of observations and M represents the number of features, were normalised to lie within the range [0, 1]. This transformation was performed using the formula.
X s c a l e d = X X m i n X m a x X m i n
where X s c a l e d is the scaled feature value, while X m a x and X m i n represent the maximum and minimum values of the respective feature across the dataset. This scaling ensures that all feature values are proportionally adjusted, enabling a fair comparison and improved performance during model training. Notably, no additional preprocessing techniques were applied to the dataset, as this study prioritised preserving the inherent patterns and distributions in the data while retaining the potential influence of outliers. By avoiding further transformations, the approach focused on developing a predictive model that remains robust in the presence of outliers, thereby reflecting real-world complexities more accurately [25]. This methodology supports the creation of ML models capable of effectively handling datasets with diverse and potentially irregular feature distributions.

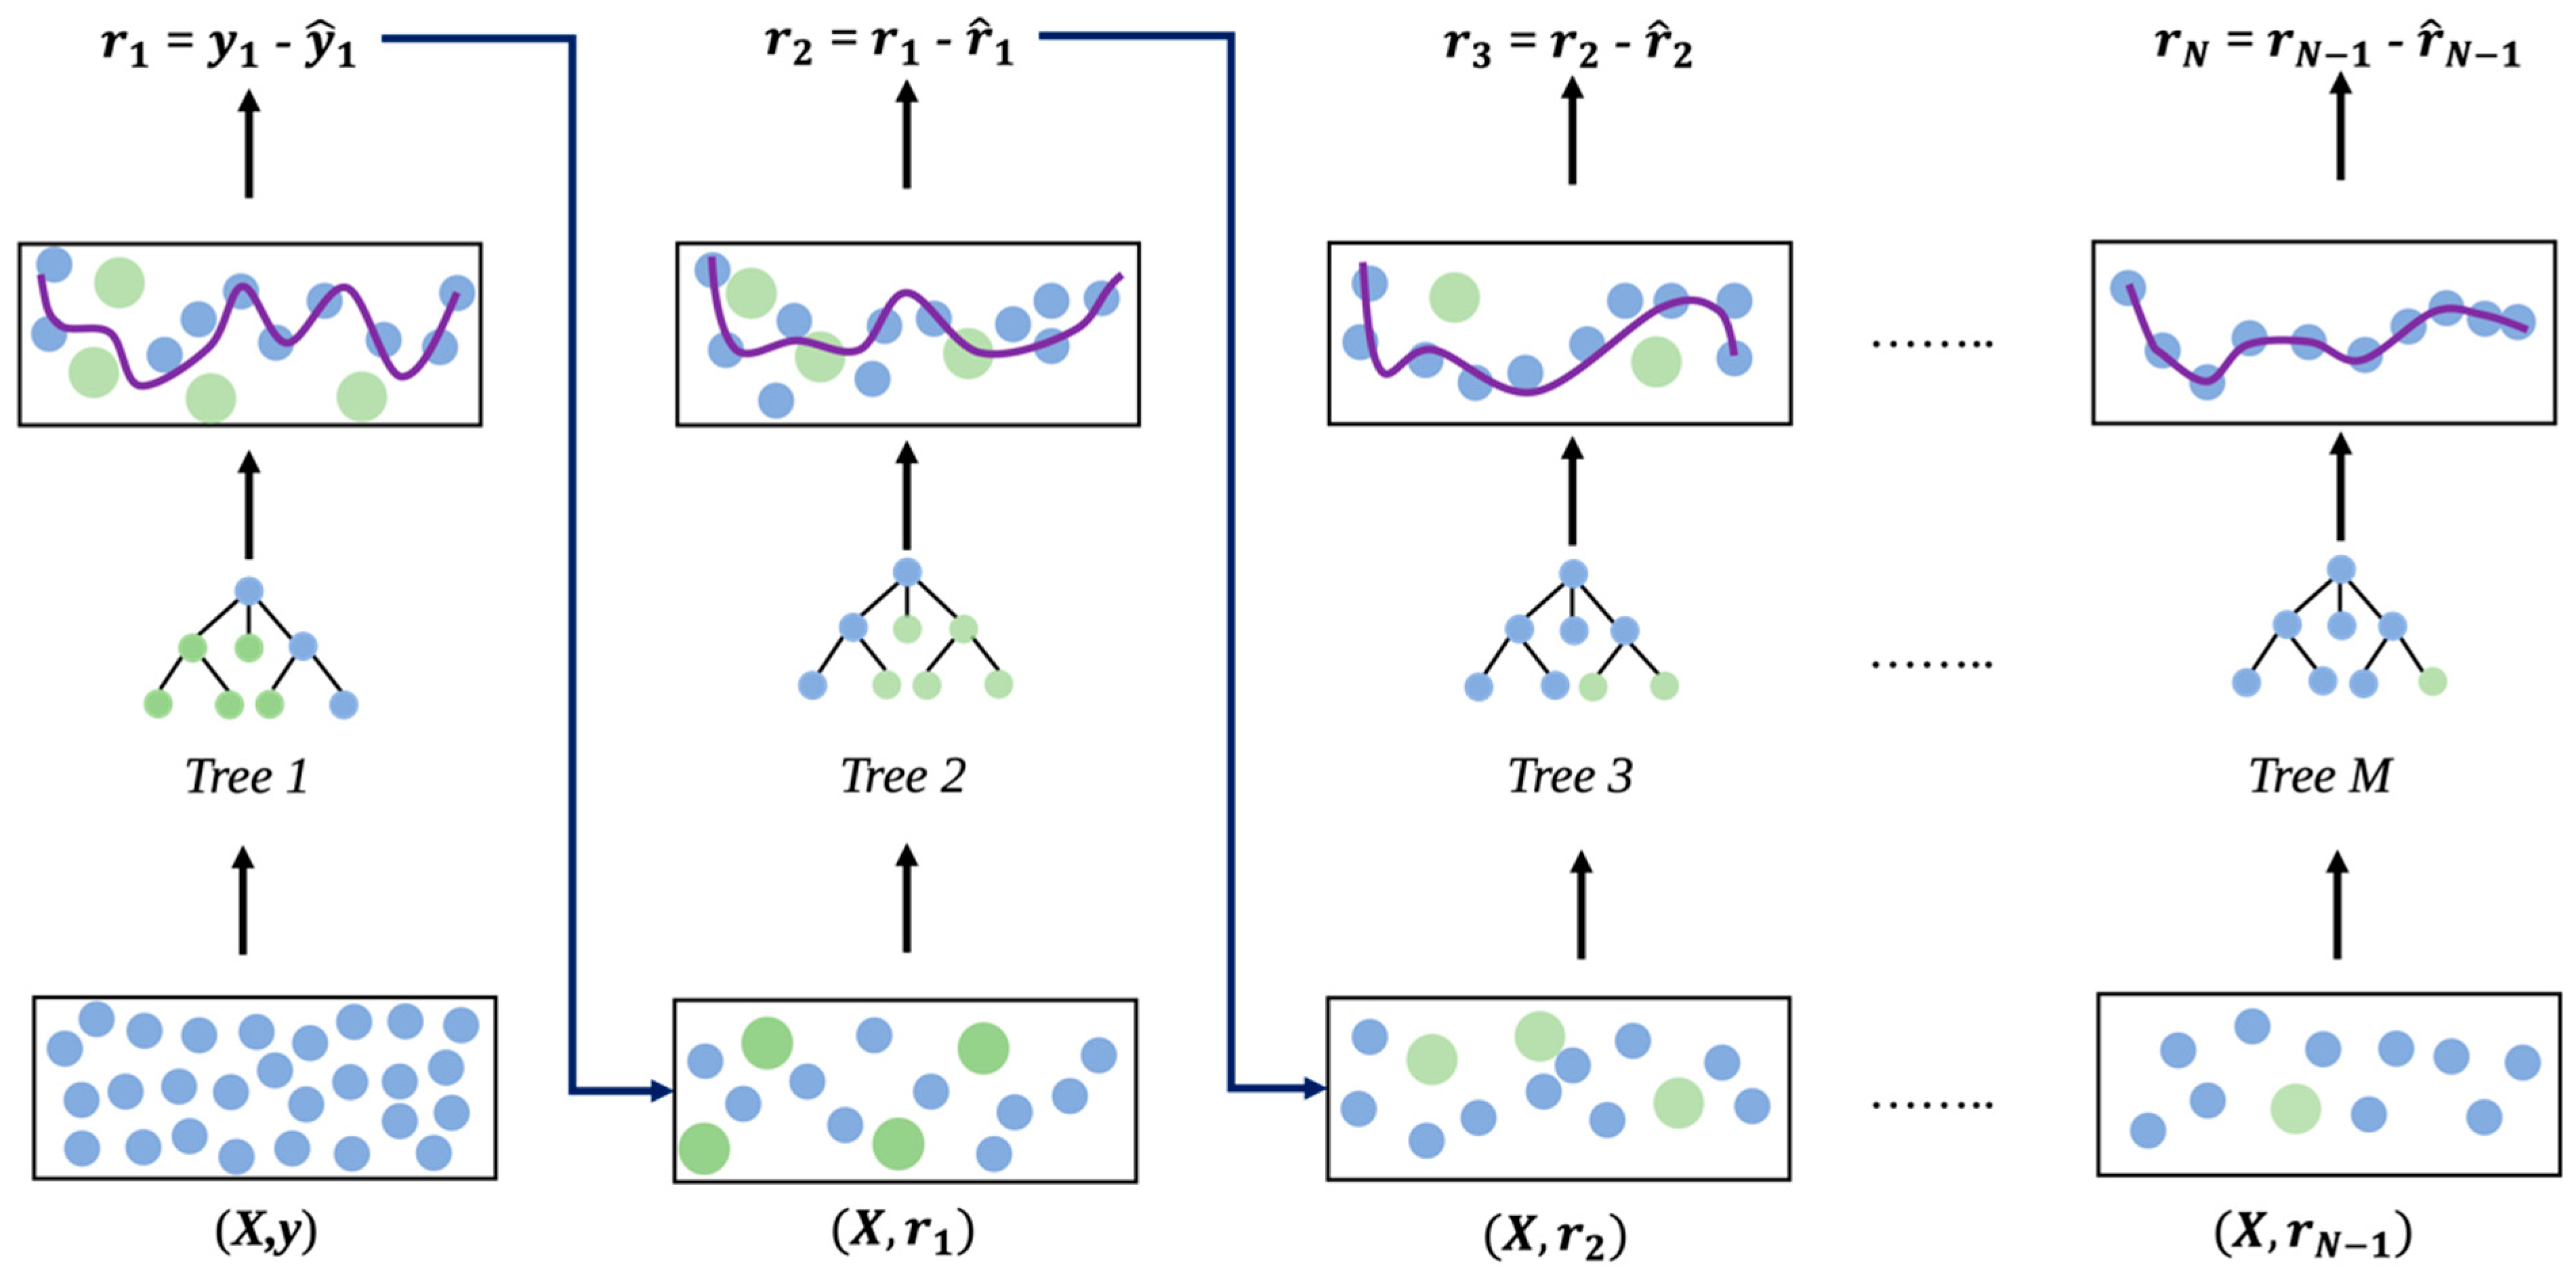
2.2.2. Selection of Regression Algorithms

This study utilised the Lazy Predict Python library (v0.2.12) to efficiently train and evaluate a wide range of ML regression models using their default configurations and hyperparameters. The library facilitated the prediction of tensile and flexural material properties for composite materials with triangular, hexagonal, and rectangular infill patterns. A total of thirty-five regression algorithms were evaluated across multiple datasets with 10 independent random shuffles, providing a comprehensive assessment of their performance. To identify the most suitable models for further analysis, a majority voting approach was implemented on the 10 performance results. Only regressors achieving a minimum R-squared value of 0.85 in predicting the target variables across all datasets were retained. This ensured that the selected models were both reliable and accurate in their predictions. The evaluation results guided the selection of algorithms with robust generalisation capabilities. A variety of predictive algorithms featured in the regressor pool included artificial neural networks (ANN), ensemble methods such as XGBoost, and k-Nearest Neighbour (k-NN) regressors.
XGBoost, in particular, which is based on Gradient Boosting (illustrated in Figure 2), improves model performance by iteratively correcting the residuals of previous models. In each iteration, the residuals r are computed as the difference between the true values, y and the predictions, y ^ . As shown in Figure 2, XGBoost follows the boosting process where multiple trees are sequentially trained, each one focusing on correcting the residuals from the previous tree. After each iteration, the predicted values are updated, and the r are recalculated. The figure demonstrates how r evolves and how each new tree refines the model based on the residuals, enhancing predictive accuracy. The feature set X and target variables are used to train the model, while residuals, r (and their corresponding predictions, r ^ ) are iteratively improved. Leveraging domain knowledge, models with consistently high R-squared values—above 0.95—were selected, with XGBoost emerging as one of the most reliable regressors. Other models, unable to maintain such high accuracy, were excluded from further consideration. In this way, Lazy Predict, paired with a systematic regressor selection approach, ensured that only the most promising and high-performing algorithms were retained for the detailed modelling of tensile and flexural properties across the triangular, hexagonal, and rectangular infill patterns [26,27].

3. Results and Discussion

3.1. Tensile Results

Figure 3 describes the significant differences in mechanical performance across the three infill patterns (triangular, hexagonal, rectangular) at a constant 28% infill density. The mechanical performance of the infill patterns revealed significant variations in both tensile strength and elastic modulus. From Figure 3a–c), the triangular pattern exhibited superior tensile strength (37.01 ± 1.44 MPa) and stiffness (0.728 ± 0.018 GPa), outperforming rectangular (33.40 ± 2.40 MPa; 0.661 ± 0.020 GPa) and hexagonal (31.35 ± 1.30 MPa; 0.541 ± 0.037 GPa) configurations. This dominance can be attributed to its interconnected geometry, which promotes uniform stress distribution and enhances resistance to deformation [9]. The fracture image in Figure 3(c1) suggests that the sample failed in a brittle mode by stretching from outer walls and transferring stress into triangular struts of the infill. Conversely, the hexagonal pattern displayed the weakest tensile strength and lowest stiffness, coupled with the highest variability in both properties (tensile SD = 1.30 MPa; stiffness SD = 0.037 GPa). These shortcomings likely arise from its nodal junctions, which are prone to failure under stress caused by stretching and bending of struts, which lead to sudden brittle failure, as shown in Figure 3(c2). The rectangular pattern demonstrated intermediate tensile strength and stiffness, with moderate variability in tensile performance (SD = 2.40 MPa) but lower variability in stiffness (SD = 0.020 GPa). While its unidirectional raster alignment allows for predictable mechanical behaviour, it limits stress redistribution capacity, resulting in inconsistent load transfer and hence sudden brittle fracture, as depicted in Figure 3(c3). These observations align with the previous studies in [28,29].

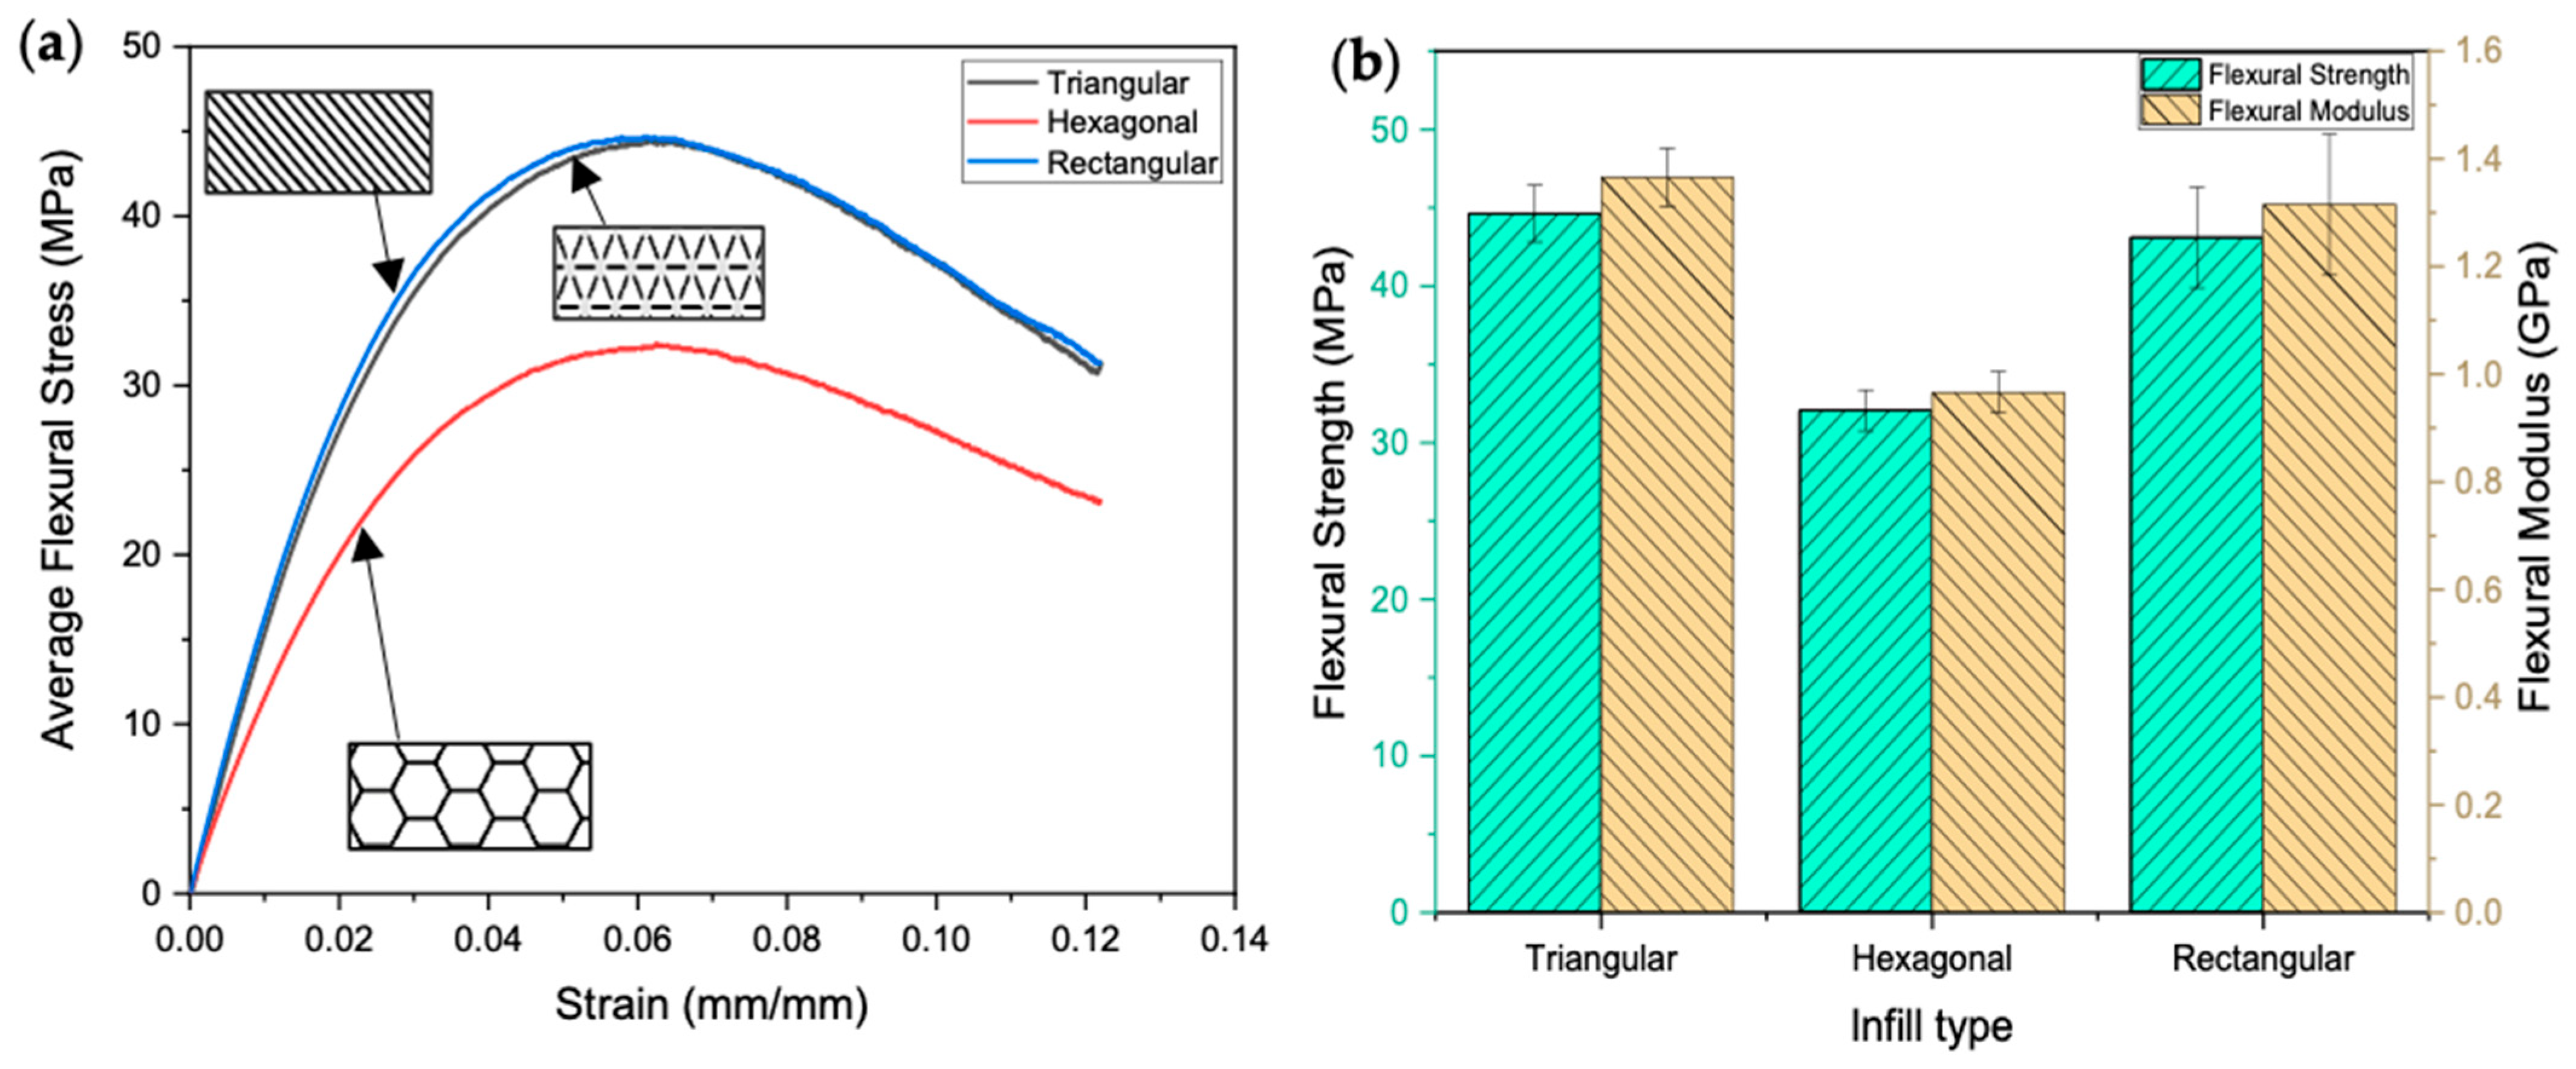
3.2. Flexural Results

Similarly, Figure 4 depicts the flexural results of the tested samples, revealing the distinct differences in the effect of infill direction on the bending performance of Onyx. From Figure 4a,b, it can be seen that the triangular infill exhibited the highest bending strength (44.63 ± 1.80 MPa) and flexural modulus (1.37 ± 0.05 GPa), attributed to its efficient load distribution and structural integrity. In contrast, the hexagonal infill demonstrated the lowest bending strength (32.07 ± 1.30 MPa) and flexural modulus (0.97 ± 0.03 GPa), indicating potential limitations in structural applications. The rectangular infill provided intermediate values (43.1 ± 3.21 MPa for strength and 1.31 ± 0.13 GPa for modulus), though it showed greater variability in performance. This can be attributed to the presence of less continuous walls oriented in the direction of the stress along the length than the triangular pattern. A similar finding was recorded by Martulli et al. [12]. The flexural strength achieved in this study surfaces that of commonly used composites for biomedical applications, including PLA-CF (23.51 MPa), PA12-CF (35.81 MPa) and ABS-CF (31.43 MPa) [30,31]. These findings highlight the critical role of infill design in optimising the mechanical properties of 3D-printed structures. For the flexural tests, the nine specimens varied by less than 5 % in both bending strength and modulus, showing highly repeatable results with virtually no outliers. Such reliable data reduces the risk of outlier bias when training the ML models (see Section 3.3.5 for the overfitting analysis).

3.3. ML Set-Up, Results, and Discussion

3.3.1. ML Data Set up

The study utilised the Python programming language and a range of libraries, including Pandas, NumPy, Scikit-learn, Seaborn (v0.12.2), and Matplotlib (v3.7.2), as foundational tools for developing the ML framework. Additionally, TensorFlow and its Keras API were employed for the design and implementation of ANN models. These libraries facilitated essential tasks such as numerical computations, data preprocessing, pipeline creation, and model development. For each Infill type (triangular, hexagonal, and rectangular) in both tensile and flexural material properties, the experimental data were loaded into Pandas DataFrames. A normalisation step was performed to scale each feature to a range of 0 to 1. In the data preparation process, Displacement (mm) was designated as the predictor variable, while Stress (MPa) was defined as the response variable. To initiate the initial model evaluation, the Lazy Predict algorithm was employed to assess the performance of 35 ML regressors. For each material property, the dataset was reshuffled 10 times, using the NumPy random state generator, ensuring consistent reproducibility across the different random shuffling. Lazy Predict provided a preliminary evaluation by generating predictions across multiple regressors. To further analyse the results, Friedman statistics were applied to determine the significance of the outcomes obtained from the Lazy Predict algorithm across 10 trials. This step enabled the identification of the top-performing models. From these results, seven regressors were selected based on their majority voting scores across the 10 random shuffles on all material properties, retaining only those models that consistently achieved an R-squared score of 0.9 or higher. The seven selected algorithms comprised five ensemble tree methods—AdaBoost, Gradient Boosting, Hist Gradient Boosting, LightGBM, and XGBoost regressors—alongside the ANN (multi-layer perceptron) and K-NN regressors. Each dataset was randomly divided into training (80%) and testing (20%) sets to ensure robust model evaluation. Grid search cross-validation (CV) was applied exclusively to the training data, employing 5-fold cross-validation and R-squared as the scoring metric to optimise the hyperparameters for each model. The adoption of a five-fold grid search CV on the training set alone guarded against overfitting while assessing model generalisability. The ANN was implemented in TensorFlow/Keras with two hidden layers (50 neurons each, ReLU activation), linear output, Adam optimiser (learning rate 0.001), mean squared error loss, and early stopping (patience 20). Final model performance was assessed on the held-out test sets using R-squared, mean absolute error (MAE), and median absolute error (MedAE). All top models achieved test R-squared > 0.95 and low error metrics (MedAE  <  0.02, MAE  <  0.03), confirming that our dataset size provides sufficient statistical power for robust training and validation.

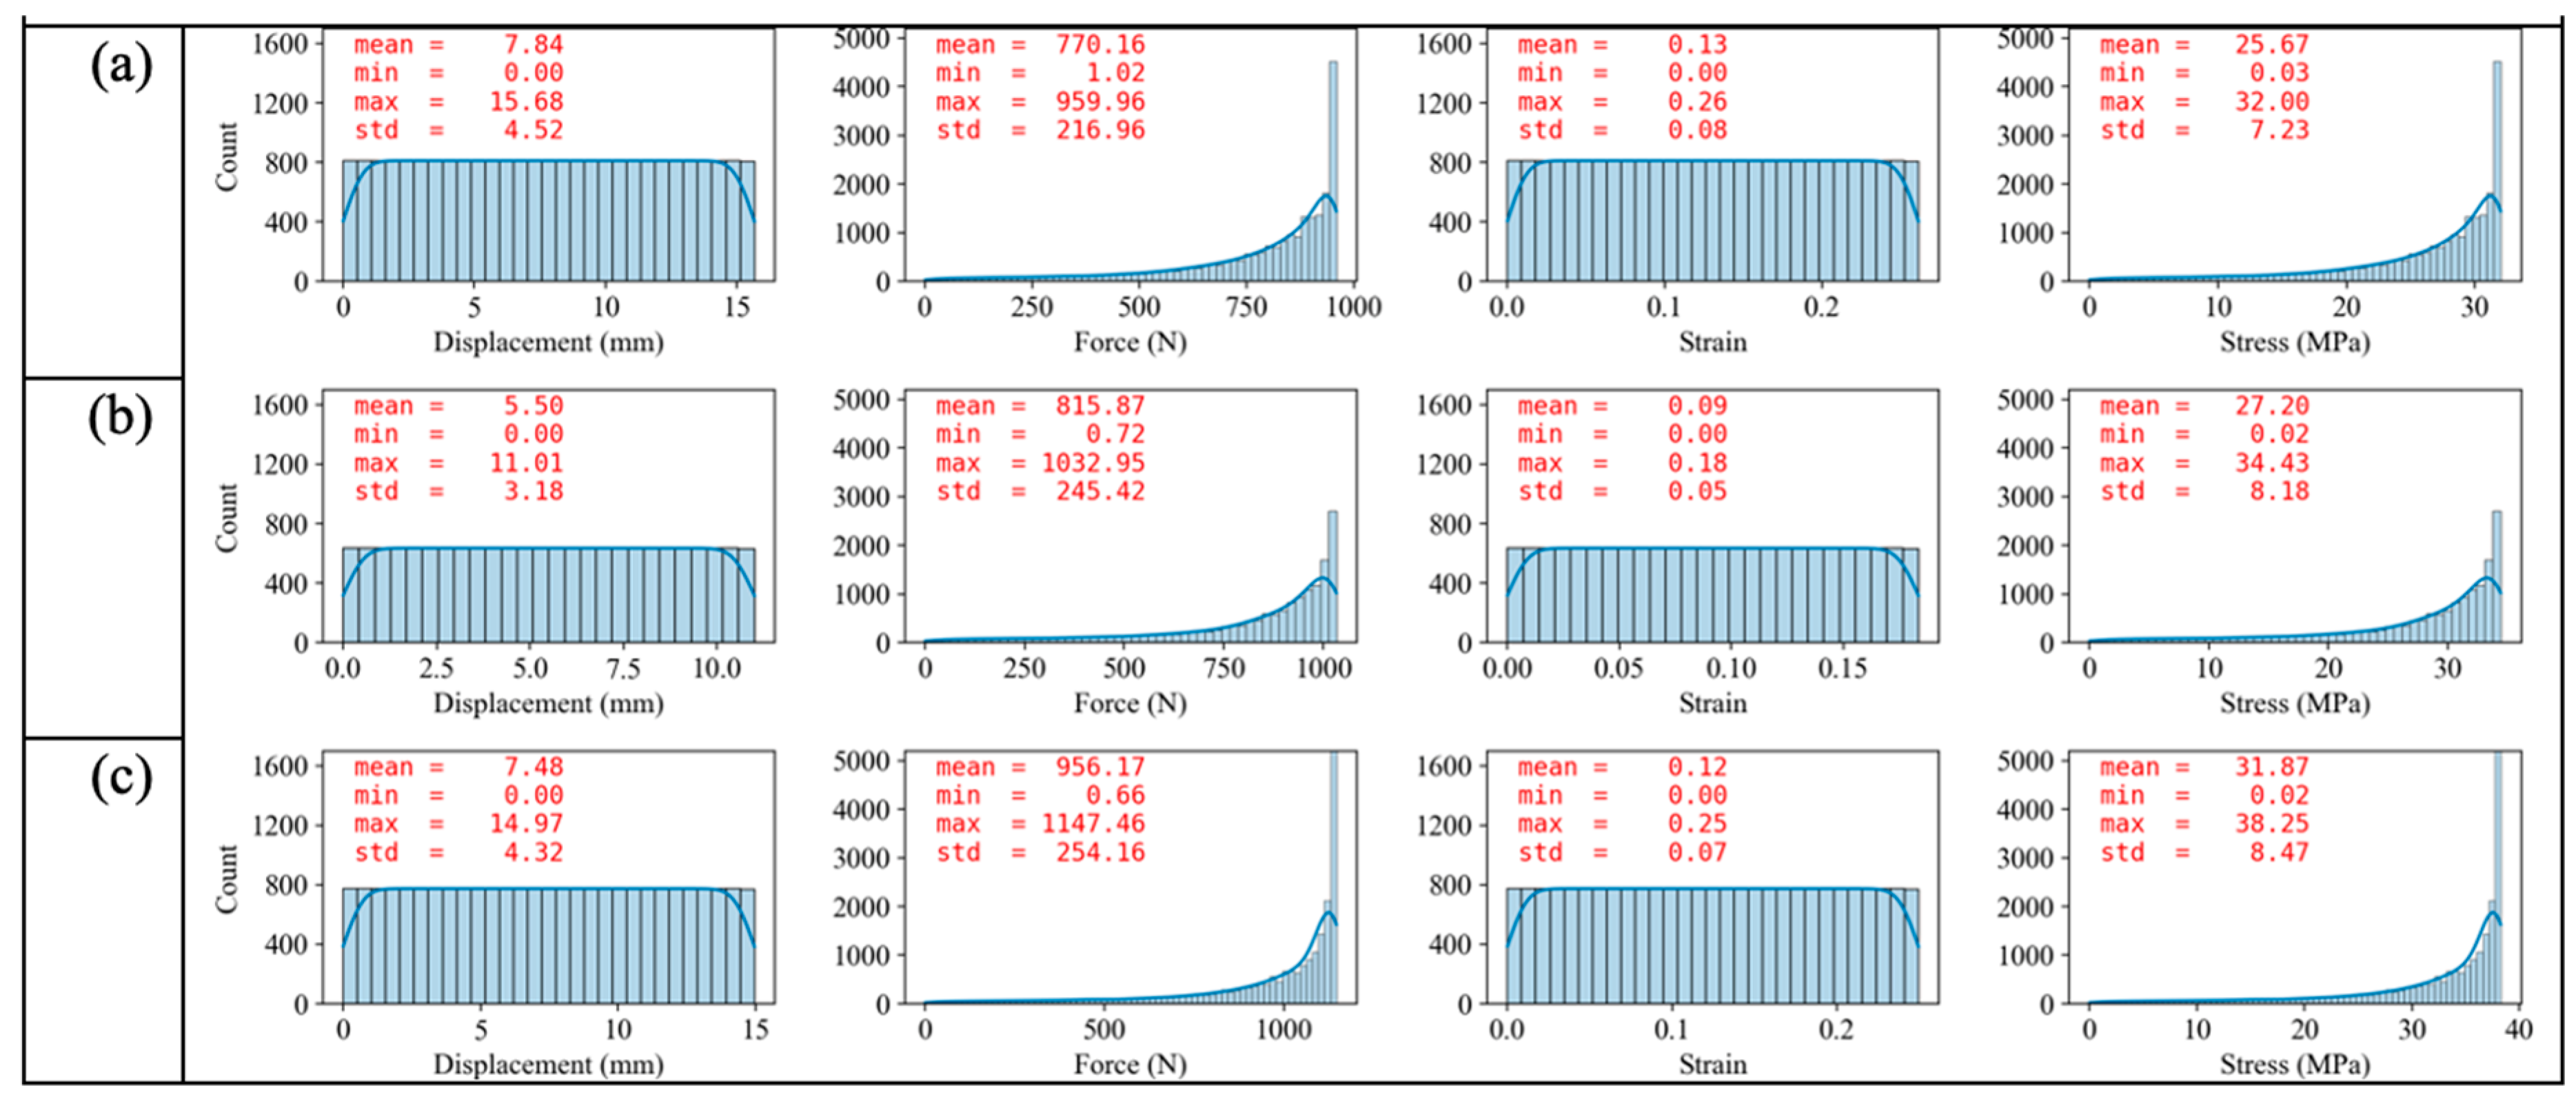
3.3.2. Data Assessment of Mechanical Properties

The assessment of mechanical properties through data analysis provides a cost-effective and autonomous approach, enhancing repeatability and improving efficiency. This enables more reliable evaluations of material behaviour under different conditions. As stated earlier, the distributed data from the tensile experiment was shown in Figure 3, with the dataset generated used to develop the predictive ML model. In assessing the mechanical properties, histograms of the displacement, force, strain, and stress final datasets for tensile material properties across the three tested Infill types: (a) hexagonal, (b) rectangular, and (c) triangular were computed as illustrated in Figure 5. It was observed that the displacement data across all stacking sequences exhibited relatively uniform distributions. For example, the hexagonal infill shows a mean displacement of 7.84 mm within a range of 0.84 mm to 14.68 mm. Similar trends are observed for the rectangular and triangular infills, suggesting consistent deformation characteristics, with minor variations in mean values reflecting differences in infill configurations. Strain distributions are also consistent across all sequences, with mean values close to 0.13, further indicating uniform deformation behaviour despite slight differences in variability. In contrast, force and stress distributions are skewed, showing greater variability across infill types. For instance, the hexagonal infill has a mean force of 770.16 N and a maximum load of 959.96 N, while the rectangular and triangular infill showed higher means and broader ranges, with the triangular infill exhibiting the highest tensile force. Stress distributions follow a similar trend, with the triangular infill achieving the highest mean stress, exceeding 30 MPa, alongside the broadest range. These variations in force and stress reflect the influence of infill type on the load-bearing capabilities of the structures. Similarities in these material properties should be expected, considering that the sample dimensions were kept constant, and thus, the lad acted on relatively the same cross-sectional area. Similarly, as expected, while displacement and strain datasets remain relatively uniform across all samples, the triangular infill specimen demonstrated superior tensile performance, albeit with increased variability at higher forces and stresses.
Figure 6 is the histogram of displacement, force, strain, and stress for flexural material properties across three stacking sequences for the flexural properties of the samples, i.e., (a) hexagonal, (b) rectangular, and (c) triangular, respectively. Displacement data across all infill exhibited relatively uniform distributions, with a mean displacement of approximately 12.21 mm in the hexagonal infill Figure 6a and similar values in the rectangular and triangular infill. This uniformity suggests consistent flexural deformation characteristics across all configurations. In contrast, force and stress distributions show greater variability across the infill types. The hexagonal infill Figure 6a displayed a mean force of 24.32 N, with a maximum value of 30.60 N, while the rectangular and triangular infill exhibited higher mean forces of 35.98 N and 35.00 N, respectively, alongside broader ranges. Stress follows a similar trend, with the hexagonal infill showing mean stress of 24.32 MPa, while the rectangular and triangular infill display higher mean stresses of 35.98 MPa and 35.00 MPa, respectively. Strain distributions, however, remain consistent across all configurations, with low variability and mean values near 0.06.
Compared to the tensile results in Figure 5, the flexural properties exhibited lower strain values but slightly higher forces and stresses in the rectangular and triangular infill types. This suggests that the infill configurations, particularly rectangular and triangular, demonstrate improved performance under flexural loading compared to tensile loading, potentially due to the material’s ability to resist bending stresses more effectively than direct tensile stresses. These differences highlight the influence of loading conditions on material behaviour and the critical role of infill type in optimising mechanical performance.

3.3.3. Evaluation of Regressor Algorithms

The heatmap in Figure 7 shows the mean R-squared scores for the top-performing regressors across multiple datasets over 10 iterations, covering both flexural (F_) and tensile (T_) material properties. This evaluation, conducted as part of the Lazy Predict algorithm, utilised the default hyperparameters for all regressors to ensure a fair comparison. Each column in the heatmap corresponds to a specific dataset (e.g., F_Hex, T_Rect), while each row represents a regressor. The colour gradient reflects performance, with darker shades indicating higher R-squared values.
Although the datasets were initially screened by a broad set of 35 regressors, which included simpler models (like linear and polynomial regression), these simpler models consistently underperformed, yielding test R-squared < 0.90. In contrast, the results showed that certain regressors, including ANN, GBR, Hist GBR, Light GBM, and XGBoost, consistently achieved mean R-squared scores above 0.95 across all datasets. These models demonstrated robust and reliable generalisation capabilities. In contrast, regressors such as Random Forest (RF), Support Vector Regressor (SVR), Bagging, Decision Trees (DTR), and Extra Trees (ETR) exhibited variable performance, with mean R-squared scores dropping below 0.92 on some datasets, such as F_Rect and F_Tri. This inconsistency in performance highlighted their limited reliability when applied across different datasets. Based on these observations, AdaBoost, ANN, GBR, Hist GBR, KNN, Light GBM, and XGBoost were selected for further analysis, while RF, SVR, Bagging, DTR, and ETR were excluded due to their inability to maintain consistently high R-squared scores. The Lazy Predict evaluation provided a systematic approach for narrowing down the regressors, ensuring that only the most promising algorithms were retained for subsequent modelling and larger error metrics (MAE > 0.05).

3.3.4. Hyper-Parameter Tuning Analysis

The hyperparameters, their investigated ranges, the selected values, and the mean test scores for the Triangular Infill type in predicting the tensile material properties are summarised in Table 3. Any hyperparameters not explicitly listed in the table were kept at their default settings. The model was then trained using the training dataset, and predictions were made for both the training and testing sets. Following this, R-squared, MAE, and MedAE metrics were computed, along with plots illustrating the relationship between the actual and predicted values for each model.
The training process revealed robust performance across multiple models, with ensemble learners such as LightGBM and XGBoost demonstrating consistently high accuracy. For the ANN model, the training phase began with a validation loss of 0.0054 in the first epoch, which progressively decreased and stabilised at a minimum value of 0.0006. Similarly, the training loss followed a parallel trajectory, achieving convergence at approximately the same level, which indicated that the model effectively learned meaningful patterns without overfitting. The validation MAE values ranged between 0.0193 and 0.0236, while the test set MAE further verified the model’s reliability at 0.0212. These consistent metrics highlight the model’s capacity to generalise well across unseen data. The training process converged after approximately 45 epochs as both the training and validation losses stabilised. Early stopping played a pivotal role in halting the training process at the optimal point, ensuring a balance between underfitting and overfitting. The training and validation losses, as well as the training and validation MAE values of the ANN model across epochs for flexural material properties (hexagonal stacking sequence), are presented in Figure 8. This plot provides a detailed visualisation of the model’s learning dynamics. The alignment of the loss curves between training and validation underscores the absence of significant overfitting, while the MAE trends further reinforce the model’s predictive accuracy and consistency. The inclusion of early stopping, coupled with precise hyperparameter tuning, allowed the ANN model to achieve exceptional performance. The final evaluation results demonstrated a validation loss and MAE of 0.00059 and 0.0213, respectively. The stable loss and MAE values observed in Figure 8 reflect the model’s robustness and its ability to handle the complexities of the flexural material property dataset effectively.

3.3.5. ML Model Performance

Table 4 and Table 5 highlight that all models achieved R-squared values above 92% across the tensile and flexural material property predictions, indicating consistently high predictive performance. Among these, models like ANN, HGBR, LGBM, and GBR consistently delivered the best results across the Hex, Rect, and Tri stacking sequences. The bold formatting in the tables indicates the highest performance scores for each metric within each stacking sequence, helping to visually emphasise the top-performing models. Notably, ANN emerged as one of the top-performing models in most cases, achieving the highest R-squared, MedAE, and MAE scores in several predictions. When comparing tensile and flexural material property predictions, the tensile predictions exhibited slightly better performance overall. This is evident from higher R-squared values and lower MedAE and MAE scores across most models. The improved performance for tensile properties may be attributed to a clearer relationship between input features and output variables in the tensile datasets compared to the flexural datasets.
Owing to the robustness of MedAE against outliers, it provided more reliable performance results compared to MAE for all material property predictions considered. This is illustrated in the bar chart in Figure 9, which shows the MedAE, MAE, and R-squared values for the best-performing models in tensile and flexural property predictions.
The bar chart underscores the sensitivity of MAE to outliers, as it tends to be slightly higher than MedAE across all predictions. The chart also highlights the overall superiority of models like ANN and LightGBM, which consistently maintained excellent performance across metrics. The results demonstrate that the predictive accuracy for tensile properties was marginally better than for flexural properties, with MedAE emerging as a particularly useful metric for evaluating model performance due to its resilience to outliers. The bar chart further reinforces these insights, visually comparing the best models across both material property predictions. Although ANN delivered the best overall results, the highest accuracy was achieved with the LightGBM model predicting the tensile material properties of the Rect stacking sequence, which yielded a test performance with R-squared, MedAE, and MAE values of 0.9965, 0.0087, and 0.0097, respectively. For flexural material properties, the best performance was observed on the Hex stacking sequence, where the XGBoost model demonstrated its strength, achieving an R-squared of 0.9886, MedAE of 0.0205, and MAE of 0.0211. Graphical representations of the actual versus predicted values for the highest-performing models for both tensile and flexural material properties across the Hex, Rect, and Tri stacking sequences are shown in Figure 10 and Figure 11, respectively. These plots visually depict the alignment between actual and predicted values with respect to the ideal fit line, providing a clear assessment of model accuracy.
In particular, the actual and predicted values for the tensile material properties for the Rect stacking sequence, as shown in Figure 10, exhibit the closest alignment with the ideal fit line, outperforming the other models. However, the presence of scattered points away from the fit line reflects minor discrepancies in some predictions. Additional lines are included in the plots to indicate permissible deviations from the actual values. The dotted lines represent a ±0.1 deviation from the actual values, which can be considered an acceptable approximation. Meanwhile, the dashed lines represent a broader ±0.2 deviation range, indicating moderate yet tolerable prediction errors. Points outside this ±0.2 range denote significant errors in prediction. Unlike flexural property predictions, where all values were contained within the ±0.2 range, tensile property predictions included some values falling outside this acceptable deviation. However, these values, while deviating from the acceptable range, generally exhibit less consistent alignment with the ideal fit line. This accounts for the slightly lower R-squared values of 0.95 to 0.98 observed across the Hex, Rect, and Tri stacking sequences, as depicted in Figure 11a–c. Therefore, while the predictions for flexural material properties demonstrated fewer outliers and more consistent alignment with the ideal fit line, tensile predictions revealed a small number of significant deviations. Nevertheless, the high R-squared values across all stacking sequences reaffirm the reliability and accuracy of the models used in this study. The visualisation of actual versus predicted values further underscores the superior performance of models like LightGBM and XGBoost in delivering accurate predictions. The developed ML framework demonstrates a high degree of accuracy in predicting both the tensile and flexural behaviour of Onyx composites across different infill parameters. The results confirm that models such as LightGBM, XGBoost, and ANNs effectively capture complex material-property relationships, achieving R-squared values consistently above 0.95. For tensile properties, XGBoost performed best for the hexagonal stacking sequence, while ANN demonstrated strong predictive accuracy for the rectangular and triangular configurations. In the case of flexural properties, ANN excelled in the hexagonal sequence, while LightGBM achieved the highest accuracy for the Rectangular and Triangular stacking sequences. However, LightGBM’s predictions for the Rectangular sequence showed greater variability, with train and test values deviating more significantly from the perfect fit line, particularly in higher-value predictions. This suggests that while the model effectively captures general trends, further refinement is needed to enhance stability across all material configurations.
The study acknowledges that its ML framework was trained on just three infill patterns—triangular, hexagonal, and rectangular—each evaluated at a single 28 % density. While broader input variation is generally recommended to minimise overfitting and improve generalisability, the experiments nonetheless produced a substantial dataset: roughly 184,037 paired displacement–stress measurements for tensile tests and 131,670 for flexural tests. By capturing the full stress–strain response from initial loading through failure, the models are exposed to a rich spectrum of material behaviour, enabling them to learn genuine structure–property relationships rather than memorise noise.
This study underscores the practical utility of ML-driven predictive modelling in material optimisation, particularly for biomedical applications where precision and reliability are paramount. Although the model performance is valid for the 28% infill case, the robustness of the models suggests that ensemble learning techniques and deep learning approaches can serve as valuable tools in guiding material design. The dataset and framework could be extended to capture broader structural variations (e.g., additional densities, novel infill geometries, or multi-parameter interactions) as an important avenue for future work to improve model robustness, broaden applicability, and adaptability while also ensuring its effectiveness in real-world applications.

4. Conclusions

AM structures manufactured were fabricated with hexagonal, triangular, and rectangular infill and tested to determine their tensile and flexural properties, which were then used to develop the ML predictive models. The major findings of the investigation are as follows:
  • The Triangular patterned samples exhibited superior tensile strength (37.01 ± 1.44 MPa) and stiffness (0.728 ± 0.018 GPa), surpassing Rectangular (33.40 ± 2.40 MPa; 0.661 ± 0.020 GPa) and Hexagonal (31.35 ± 1.30 MPa; 0.541 ± 0.037 GPa) configurations. Conversely, the hexagonal pattern displayed the weakest tensile strength and lowest stiffness, coupled with the highest variability in both properties (tensile SD = 1.30 MPa; stiffness SD = 0.037 GPa). Its superiority stems from its interconnected geometry, which facilitates uniform stress distribution and improves resistance to deformation, ensuring structural stability under load. Conversely, its weaknesses likely originate from its nodal junctions, which are susceptible to failure under stress, and its lightweight honeycomb structure, which reduces load-bearing efficiency.
  • Regarding flexural properties, the triangular infill exhibited the highest bending strength (44.63 MPa) and flexural modulus (1.37 GPa), attributed to its efficient load distribution and structural integrity. In contrast, the hexagonal infill demonstrated the lowest bending strength (32.07 MPa) and flexural modulus (0.97 GPa), suggesting potential limitations in structural applications. The rectangular infill displayed intermediate values (43.1 MPa for strength and 1.31 GPa for modulus) but exhibited greater variability in performance.
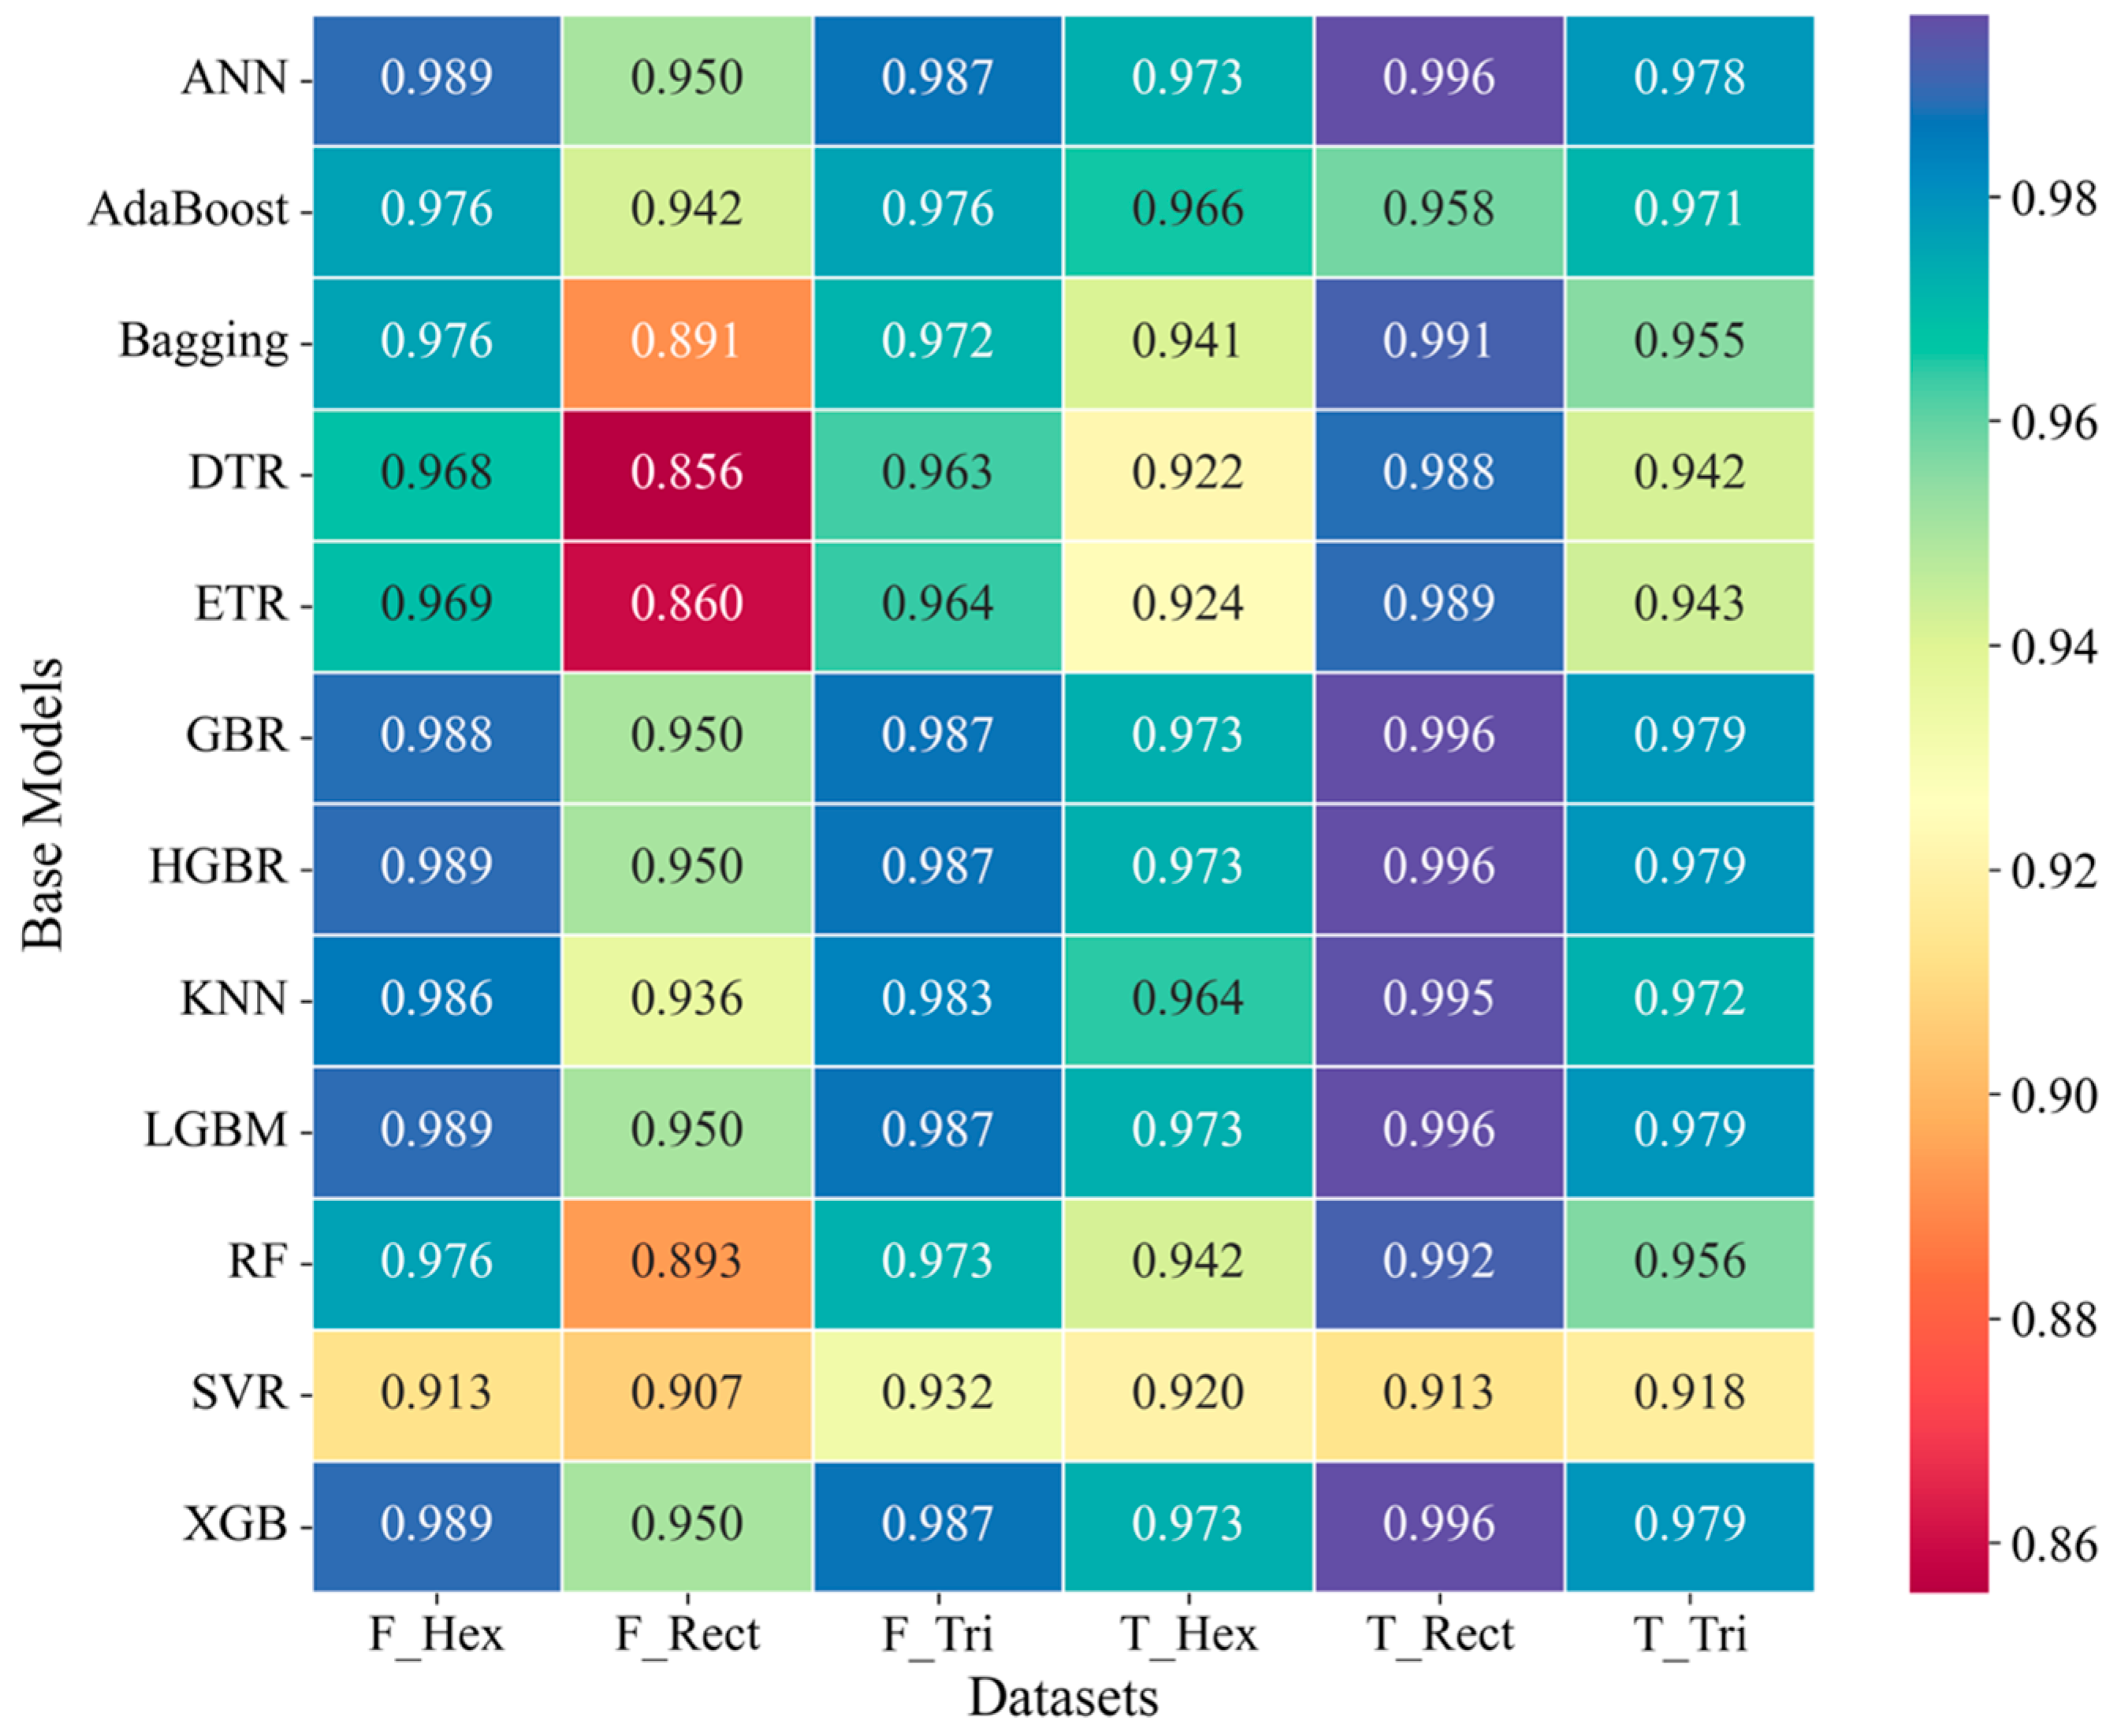
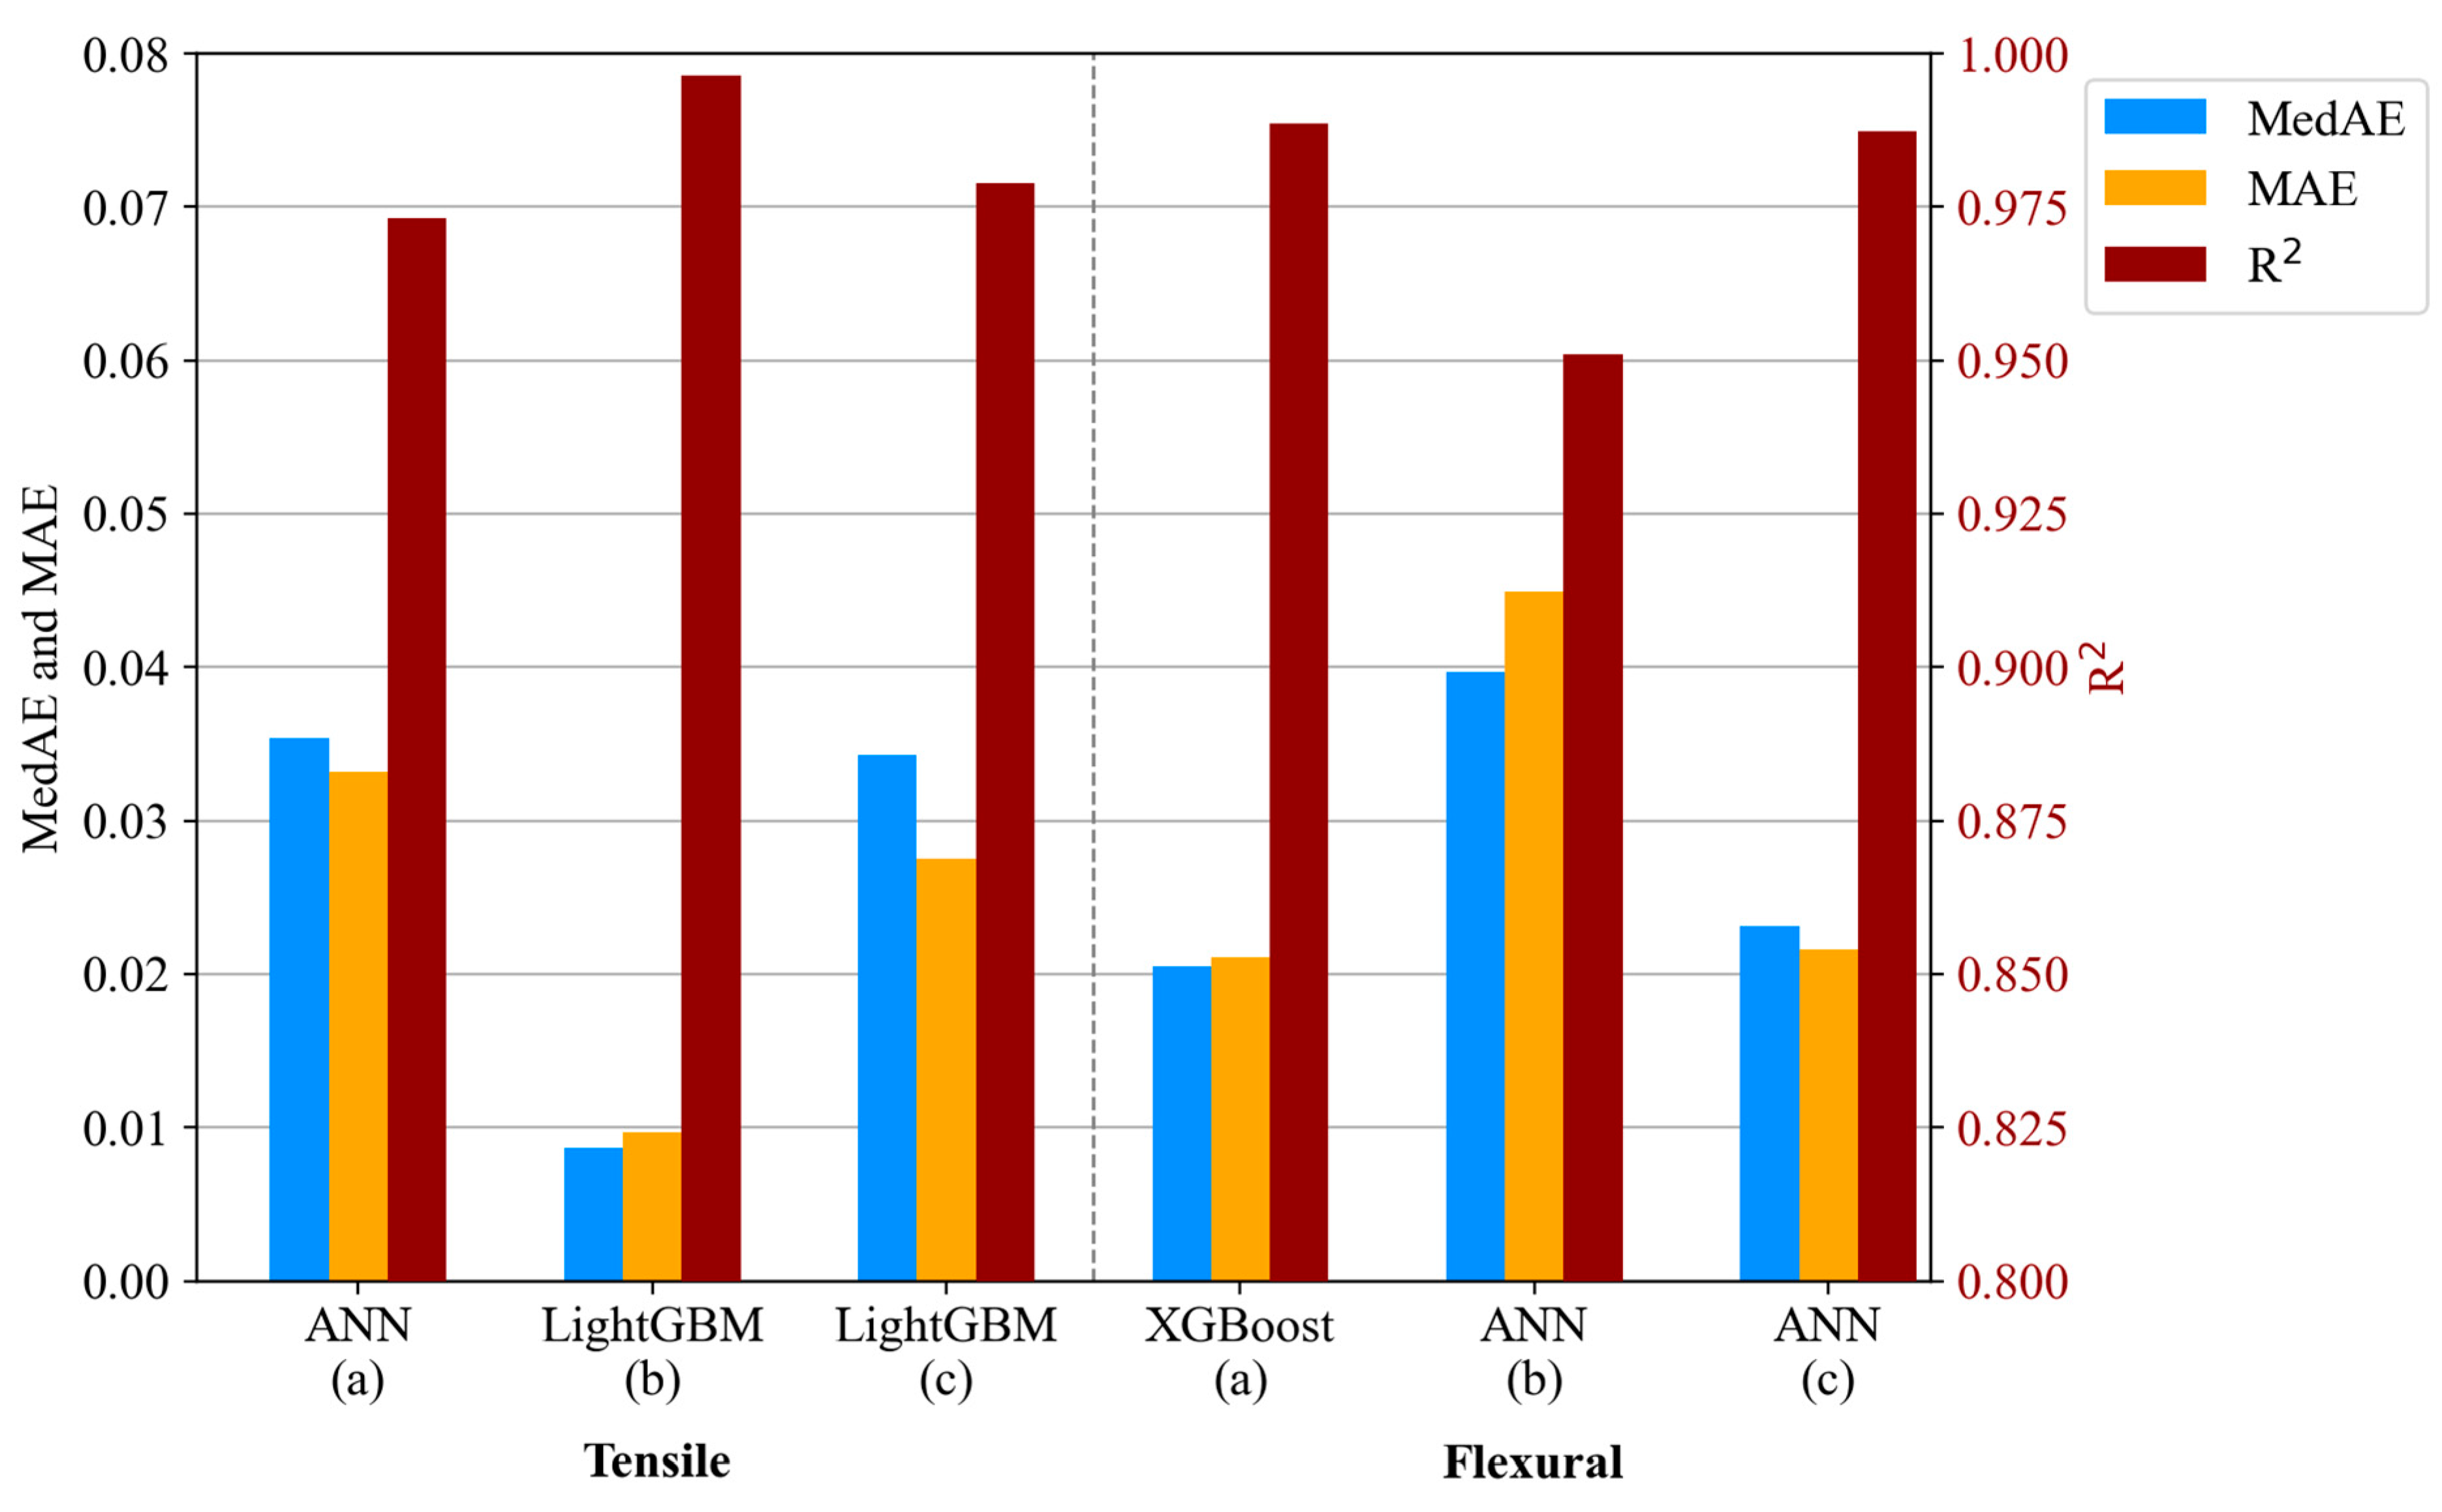
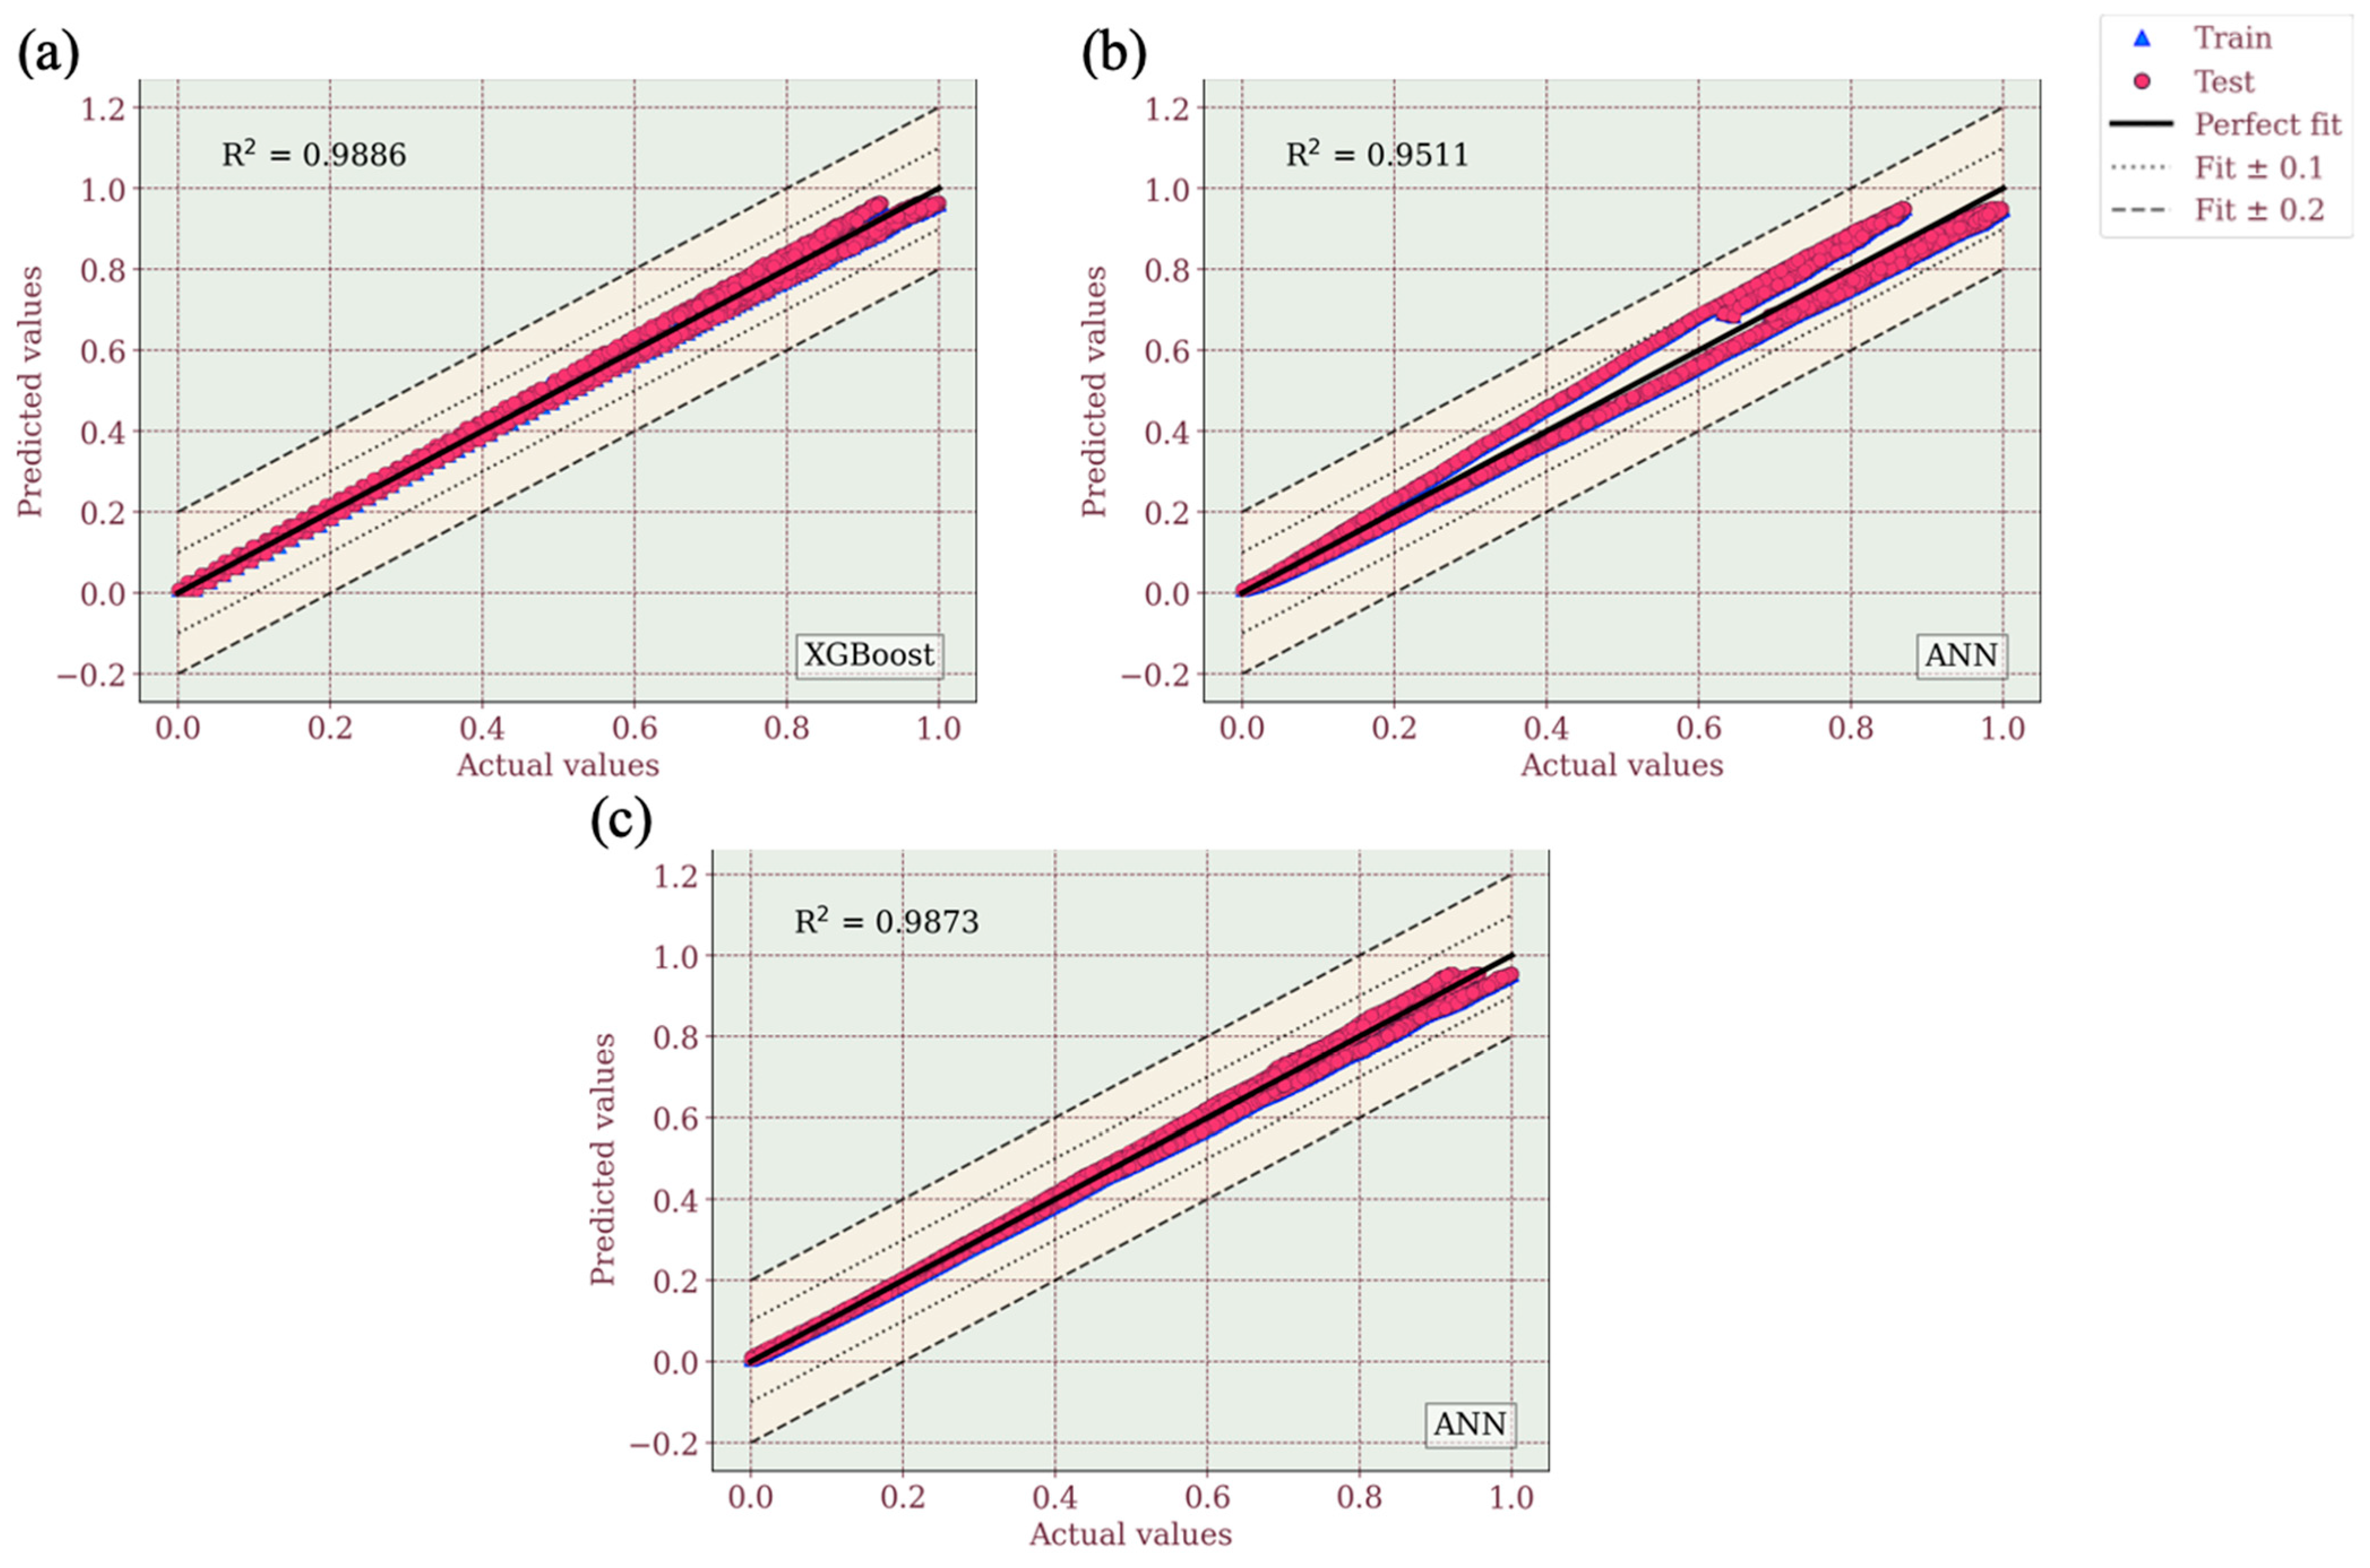
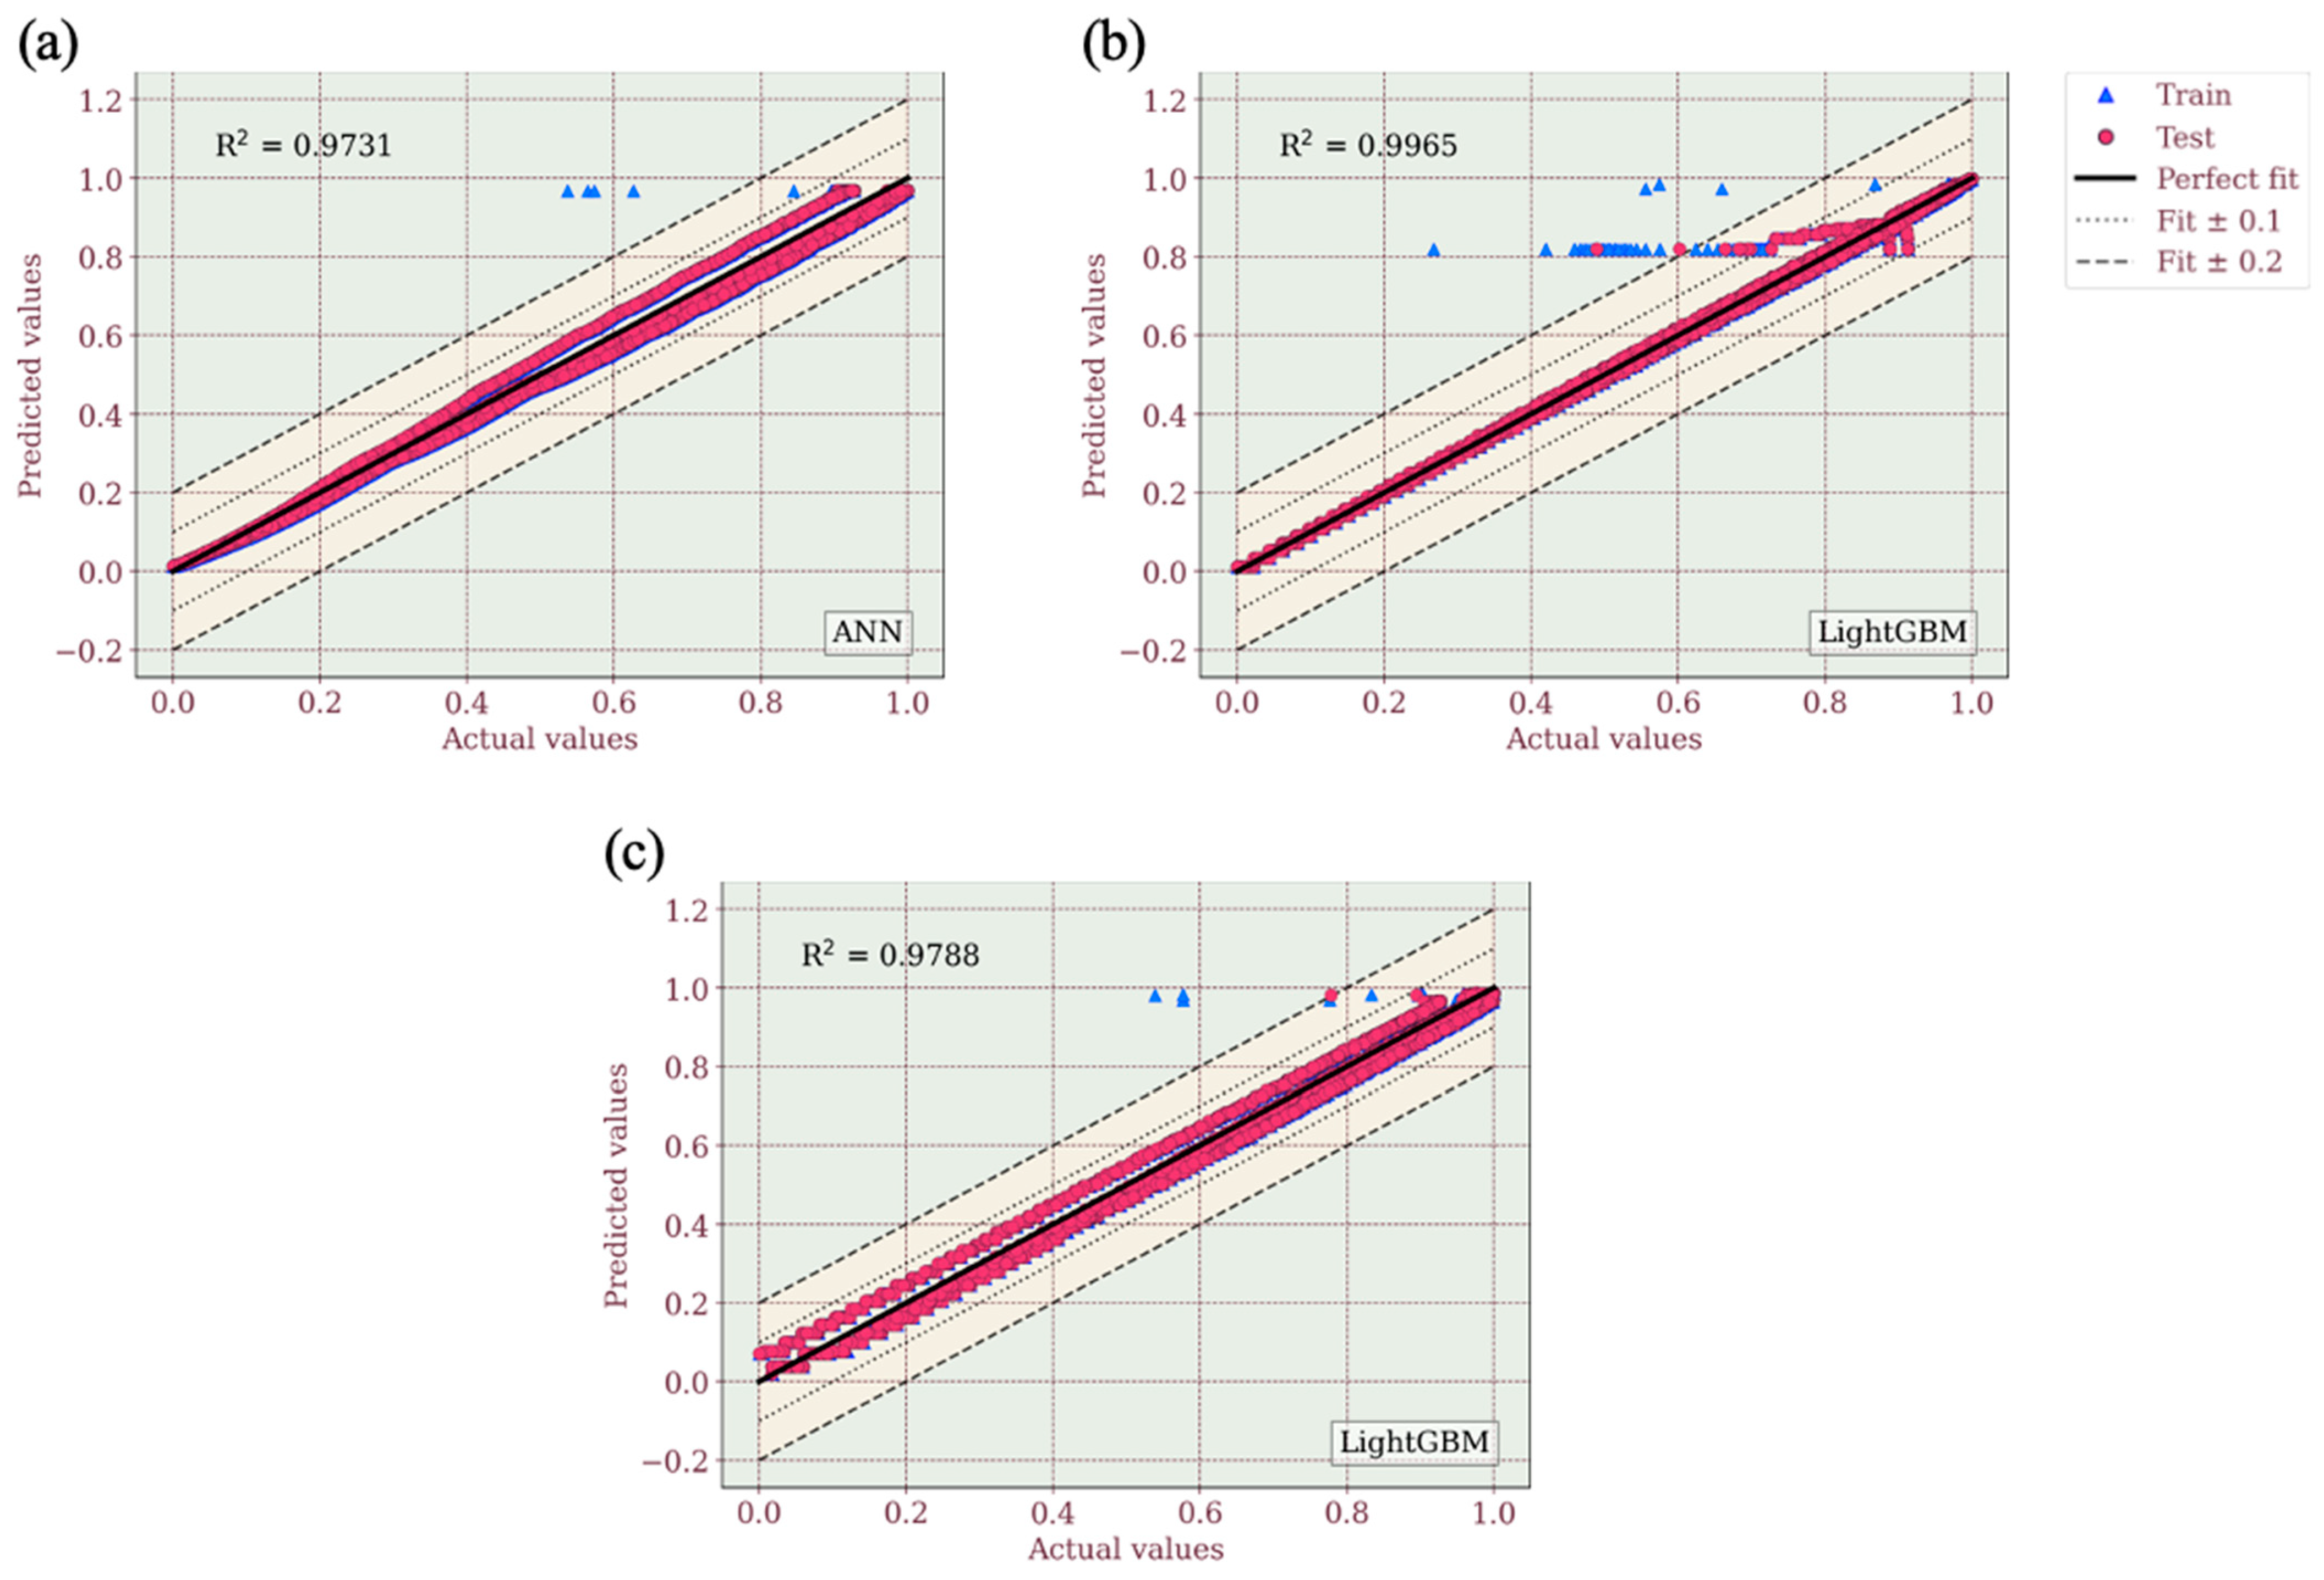
  • The developed ML framework accurately predicts the tensile and flexural behaviour of Onyx composites across various infill parameters, with models like LightGBM, XGBoost, and ANN achieving R-squared values above 0.95. For tensile properties, XGBoost performed best for hexagonal stacking, while ANN excelled in rectangular and triangular configurations. In flexural properties, ANN outperformed in hexagonal sequences, whereas LightGBM achieved the highest accuracy for rectangular and triangular sequences, though its predictions for the rectangular sequence showed higher variability. This study highlights the potential of ML-driven modelling for material optimisation, particularly in biomedical applications. While ensemble learning and deep learning approaches show promise, further refinement and dataset expansion is needed to enhance model generalisability for real-world applications.

Author Contributions

Conceptualisation, A.Q., A.G.U. and N.O.-u.; methodology, A.Q., A.G.U. and N.O.-u.; software, A.G.U.; formal analysis, A.Q., A.G.U. and N.O.-u.; resources, A.Q. and N.O.-u.; data curation, A.Q., A.G.U. and N.O.-u.; writing—original draft preparation, A.Q., A.G.U. and N.O.-u.; visualisation, A.Q., A.G.U. and N.O.-u.; All authors have read and agreed to the published version of the manuscript.

Funding

This research received no external funding.

Data Availability Statement

The data presented in this study are available on request from the corresponding author.

Conflicts of Interest

The authors declare no conflicts of interest.

References

  1. Ning, F.; Cong, W.; Qiu, J.; Wei, J.; Wang, S. Additive Manufacturing of Carbon Fiber Reinforced Thermoplastic Composites Using Fused Deposition Modeling. Compos. B Eng. 2015, 80, 369–378. [Google Scholar] [CrossRef]
  2. Petersen, R. Carbon Fiber Biocompatibility for Implants. Fibers 2016, 4, 1. [Google Scholar] [CrossRef] [PubMed]
  3. Jiang, D.; Hoglund, R.; Smith, D.E. Continuous Fiber Angle Topology Optimization for Polymer Composite Deposition Additive Manufacturing Applications. Fibers 2019, 7, 14. [Google Scholar] [CrossRef]
  4. Tekinalp, H.L.; Kunc, V.; Velez-Garcia, G.M.; Duty, C.E.; Love, L.J.; Naskar, A.K.; Blue, C.A.; Ozcan, S. Highly Oriented Carbon Fiber-Polymer Composites via Additive Manufacturing. Compos. Sci. Technol. 2014, 105, 144–150. [Google Scholar] [CrossRef]
  5. Arif, M.F.; Kumar, S.; Varadarajan, K.M.; Cantwell, W.J. Performance of Biocompatible PEEK Processed by Fused Deposition Additive Manufacturing. Mater. Des. 2018, 146, 249–259. [Google Scholar] [CrossRef]
  6. Durga Prasada Rao, V.; Rajiv, P.; Navya Geethika, V. Effect of Fused Deposition Modelling (FDM) Process Parameters on Tensile Strength of Carbon Fibre PLA. Mater. Today Proc. 2019, 18, 2012–2018. [Google Scholar] [CrossRef]
  7. Papon, E.A.; Haque, A. Fracture Toughness of Additively Manufactured Carbon Fiber Reinforced Composites. Addit. Manuf. 2019, 26, 41–52. [Google Scholar] [CrossRef]
  8. Ning, F.; Cong, W.; Hu, Y.; Wang, H. Additive Manufacturing of Carbon Fiber-Reinforced Plastic Composites Using Fused Deposition Modeling: Effects of Process Parameters on Tensile Properties. J. Compos. Mater. 2017, 51, 451–462. [Google Scholar] [CrossRef]
  9. Wang, K.; Xie, X.; Wang, J.; Zhao, A.; Peng, Y.; Rao, Y. Effects of Infill Characteristics and Strain Rate on the Deformation and Failure Properties of Additively Manufactured Polyamide-Based Composite Structures. Results Phys. 2020, 18, 103346. [Google Scholar] [CrossRef]
  10. Belarbi, Y.E.; Benmahiddine, F.; Hamami, A.E.A.; Guessasma, S.; Belhabib, S. Hygrothermal and Microstructural Investigation of PLA and PLA-Flax Printed Structures. Fibers 2022, 10, 24. [Google Scholar] [CrossRef]
  11. Al Rashid, A.; Ikram, H.; Koç, M. Additive Manufacturing and Mechanical Performance of Carbon Fiber Reinforced Polyamide-6 Composites. Mater. Today Proc. 2022, 62, 6359–6363. [Google Scholar] [CrossRef]
  12. Martulli, L.M.; Barriga Ruiz, P.; Rajan, A.; Bárnik, F.; Sága, M.; Bernasconi, A. Infill Shape Effects on Bending Stiffness of Additively Manufactured Short Fibre Reinforced Polymer Sandwich Specimens. J. Reinf. Plast. Compos. 2021, 40, 927–938. [Google Scholar] [CrossRef]
  13. Yasa, E.; Ersoy, K. Dimensional Accuracy and Mechanical Properties of Chopped Carbon Reinforced Polymers Produced by Material Extrusion Additive Manufacturing. Materials 2019, 12, 3885. [Google Scholar] [CrossRef] [PubMed]
  14. Breuer, K.; Stommel, M. Prediction of Short Fiber Composite Properties by an Artificial Neural Network Trained on an Rve Database. Fibers 2021, 9, 8. [Google Scholar] [CrossRef]
  15. Omigbodun, F.T.; Osa-Uwagboe, N.; Udu, A.G.; Oladapo, B.I. Leveraging Machine Learning for Optimized Mechanical Properties and 3D Printing of PLA/CHAP for Bone Implant. Biomimetics 2024, 9, 587. [Google Scholar] [CrossRef]
  16. Osa-uwagboe, N.; Udu, A.G.; Ghalati, M.K.; Silberschmidt, V.V.; Aremu, A.; Dong, H.; Demirci, E. A Machine Learning-Enabled Prediction of Damage Properties for Fiber-Reinforced Polymer Composites under out-of-Plane Loading. Eng. Struct. 2024, 308, 117970. [Google Scholar] [CrossRef]
  17. Gayatri, V.M.; Dave, A.; Chaganti, K. Artificial Neural Network Based Prediction of Tensile Strength of Hybrid Composites. Mater. Today Proc. 2018, 5, 19908–19915. [Google Scholar] [CrossRef]
  18. Huang, H.; Hadigheh, S.A.; Aghabalaei Baghaei, K. Influences of Fibre Shape on the Transverse Modulus of Unidirectional Fibre Reinforced Composites Using Finite Element and Machine Learning Methods. Compos. Struct. 2023, 312, 116872. [Google Scholar] [CrossRef]
  19. Cai, R.; Wen, W.; Wang, K.; Peng, Y.; Ahzi, S.; Chinesta, F. Tailoring Interfacial Properties of 3D-Printed Continuous Natural Fiber Reinforced Polypropylene Composites through Parameter Optimization Using Machine Learning Methods. Mater. Today Commun. 2022, 32, 103985. [Google Scholar] [CrossRef]
  20. Alhaddad, W.; He, M.; Halabi, Y.; Yahya Mohammed Almajhali, K. Optimizing the Material and Printing Parameters of the Additively Manufactured Fiber-Reinforced Polymer Composites Using an Artificial Neural Network Model and Artificial Bee Colony Algorithm. Structures 2022, 46, 1781–1795. [Google Scholar] [CrossRef]
  21. Meiabadi, M.S.; Moradi, M.; Karamimoghadam, M.; Ardabili, S.; Bodaghi, M.; Shokri, M.; Mosavi, A.H. Modeling the Producibility of 3d Printing in Polylactic Acid Using Artificial Neural Networks and Fused Filament Fabrication. Polymers 2021, 13, 3219. [Google Scholar] [CrossRef] [PubMed]
  22. Agarwal, R.; Singh, J.; Gupta, V. Predicting the Compressive Strength of Additively Manufactured PLA-Based Orthopedic Bone Screws: A Machine Learning Framework. Polym. Compos. 2022, 43, 5663–5674. [Google Scholar] [CrossRef]
  23. Nikiema, D.; Balland, P.; Sergent, A. Study of the Mechanical Properties of 3D-Printed Onyx Parts: Investigation on Printing Parameters and Effect of Humidity. Chin. J. Mech. Eng. Addit. Manuf. Front. 2023, 2, 100075. [Google Scholar] [CrossRef]
  24. Booker, L.B.; Goldberg, D.E.; Holland, J.H. Classifier Systems and Genetic Algorithms. Artif. Intell. 1989, 40, 235–282. [Google Scholar] [CrossRef]
  25. Alexandropoulos, S.-A.N.; Kotsiantis, S.B.; Vrahatis, M.N. Data Preprocessing in Predictive Data Mining. Knowl. Eng. Rev. 2019, 34, e1. [Google Scholar] [CrossRef]
  26. Luo, G. A Review of Automatic Selection Methods for Machine Learning Algorithms and Hyper-Parameter Values. Netw. Model. Anal. Health Inform. Bioinform. 2016, 5, 18. [Google Scholar] [CrossRef]
  27. Salman, M.T.; Siddle, D.R.; Udu, A.G. Machine Learning Approach to Predict the DC Bias for Adaptive OFDM Transmission in Indoor Li-Fi Applications. IEEE Access 2025, 13, 9627–9641. [Google Scholar] [CrossRef]
  28. Dudescu, M.C.; Racz, L.; Popa, F. Effect of Infill Pattern on Fatigue Characteristics of 3D Printed Polymers. Mater. Today Proc. 2023, 78, 263–269. [Google Scholar] [CrossRef]
  29. Lubombo, C.; Huneault, M.A. Effect of Infill Patterns on the Mechanical Performance of Lightweight 3D-Printed Cellular PLA Parts. Mater. Today Commun. 2018, 17, 214–228. [Google Scholar] [CrossRef]
  30. Rybarczyk, J.; Górski, F.; Kuczko, W.; Wichniarek, R.; Siwiec, S.; Vitkovic, N.; Păcurar, R. Mechanical Properties of Carbon Fiber Reinforced Materials for 3D Printing of Ankle Foot Orthoses. Adv. Sci. Technol. Res. J. 2024, 18, 191–215. [Google Scholar] [CrossRef]
  31. Tyagi, B.; Dixit, K.; Sahai, A.; Sharma, R.S. Characterization of Flexural and Compressive Behavior in Polylactic Acid Composites for Low-Cost Transtibial Prosthetic Applications: Influence of Reinforcements. J. Appl. Polym. Sci. 2024, 141, e55319. [Google Scholar] [CrossRef]
Figure 1. (a) Infill pattern for tensile and flexural samples: (i and iv) triangular, (ii and v) hexagonal, and (iii and vi) rectangular fill, respectively; (b) tensile set up; and (c) flexural set up.
Fibers 13 00079 g001
Figure 2. Schematics of gradient boosting algorithm. Blue circles represent the full pool of available observations, while the green circles are the subset chosen to fit the next base learner.
Fibers 13 00079 g002
Figure 3. Tensile performance of Onyx specimen with different infill; (a) stress–strain curve, (b) tensile strength/modulus, and (c) tensile fracture (with zigzag (c1), continuous and filament pullout (c2,c3).
Fibers 13 00079 g003
Figure 4. Flexural performance of Onyx specimen with different infill; (a) stress–strain curve and (b) flexural strength/modulus.
Fibers 13 00079 g004
Figure 5. Histograms of the final dataset for tensile properties of Onyx specimen (a) hexagonal, (b) rectangular, and (c) triangular. Note: statistical information like mean, minimum, maximum, and standard deviation is also shown on the histograms.
Fibers 13 00079 g005
Figure 6. Histograms of the final dataset for flexural properties of Onyx specimen (a) hexagonal, (b) rectangular, and (c) triangular. Note: statistical information like mean, minimum, maximum, and std. is also shown on the histograms.
Fibers 13 00079 g006
Figure 7. Mean R-squared for top-performing regressors across datasets after 10 iterations.
Fibers 13 00079 g007
Figure 8. Training and validation loss of the ANN model across epochs for Tensile (Hex).
Fibers 13 00079 g008
Figure 9. Best performing models for tensile and flexural strength: (a) hexagonal, (b) rectangular, (c) triangular.
Fibers 13 00079 g009
Figure 10. Actual versus predicted values of optimal performing models for Tensile: (a) hexagonal (XGBoost), (b) rectangular (ANN), and (c) triangular (ANN).
Fibers 13 00079 g010
Figure 11. Actual versus predicted values of optimal performing models for flexural: (a) hexagonal (ANN), (b) rectangular (LightGBM), and (c) triangular (LightGBM).
Fibers 13 00079 g011
Table 1. Mechanical properties of Onyx specimen [24].
ParameterValue
Tensile Modulus2.4 GPa
Tensile stress at yield40 MPa
Tensile stress at break37 MPa
Flexural Strength71 MPa
Flexural Modulus3.6 GPa
Density1.4 g/cm3
Table 2. Print parameters used for specimens in this study.
ParameterValue
Layer height0.125 mm
Nozzle diameter0.4 mm
Nozzle temperature270 °C
No. of layers24
Wall loops4
Infill typeTriangular/Hexagonal/Rectangular
Infill28%
Top/bottom layers4/4
Table 3. Hyper-parameters of algorithms and their respective investigated ranges for triangular infill type in predicting tensile material properties.
ModelAttributeRangeSelected ValueMean Test Score
AdaBoostlearning rate[0.01, 0.1, 0.5, 1]0.010.9745
loss[‘linear’, ‘square’, ‘exponential’]exponential
n_estimators[50, 100, 200, 500]500
ANNactivation[‘relu’, ‘tanh’]relu0.9787
alpha[0.0001, 0.001, 0.01]0.01
batch_size[32, 64, 128, 200, ‘auto’]32
hidden_layer_sizes[(50,), (100,), (50, 50), (100,50)](100,50)
learning rate[‘constant’, ‘adaptive’, ‘invscaling’]constant
max_iter[200, 300, 400]200
solver[‘lbfgs’, ‘sgd’, ‘adam’]lbfgs
GBRlearning rate[0.1, 0.01, 0.001]0.10.9787
n_estimators[100, 200, 300]100
max_depth[3, 5, 7]3
min_samples_split[2, 5, 10]10
min_samples_leaf[1, 2, 4]2
max_features[‘auto’, ‘sqrt’, ‘log2’]auto
Hist GBRlearning rate[0.01, 0.05, 0.1]0.050.9787
max_depth[None, 5, 10, 20]5
max_iter[100, 200, 300]300
min_leaf_nodes[15, 31, 63]15
min_samples_leaf[10, 20, 50]20
k-NNalgorithm[‘brute’, ‘kd_tree’, ‘ball_tree’, ‘auto’]auto0.9744
leaf_size[5, 10, 20, 30]30
n_neighbors[3, 5, 7, 8]8
weights[‘uniform’, ‘distance’]uniform
LightGBMlearning rate[1, 0.1, 0.01, 0.001]0.10.9787
max_depth[None, 1, 3, 5, 7, 10]3
min_child_samples[5, 10, 20, 30]5
n_estimators[100, 200, 300]100
num_leaves[31, 50, 100, 200]31
XGBoostcolsample_bytree[0.8, 0.9, 1.0]0.80.9787
gamma[0, 0.1, 0.2]0
learning rate[0.1, 0.01, 0.001]0.1
max_depth[3, 5, 7]3
min_child_weight[1, 3, 5]1
n_estimators[100, 200, 300]100
subsample[0.8, 0.9, 1.0]0.8
Table 4. Performance results for tensile material properties prediction.
HexRectTri
R-SquaredMedAEMAER-SquaredMedAEMAER-SquaredMedAEMAE
ModelTrainTestTrainTestTrainTestTrainTestTrainTestTrainTestTrainTestTrainTestTrainTest
AdaBoost0.96060.96100.03750.03760.03810.03810.97250.97370.02250.02270.02910.02900.97480.97490.02940.02950.03020.0303
ANN0.97280.97310.03390.03400.03290.03290.99470.99630.00710.00700.00980.00950.97870.97870.03450.03460.02720.0274
GBR0.97310.97270.03450.03490.03250.03290.99570.99630.00840.00850.00960.00970.97920.97850.03410.03490.02700.0276
HistGBR0.97280.97300.03500.03500.03270.03290.99540.99650.00870.00860.00980.00960.97890.97880.03440.03490.02720.0275
KNN0.97330.96570.03280.03700.03200.03650.99580.99550.00820.00920.00940.01050.97930.97320.03260.03690.02690.0308
LightGBM0.97280.97300.03440.03440.03270.03280.99550.99650.00860.00870.00990.00970.97880.97880.03400.03430.02720.0275
XGBoost0.97280.97300.03450.03440.03270.03280.99530.99640.00880.00870.00990.00970.97890.97880.03430.03450.02720.0275
Table 5. Performance results for flexural material properties prediction.
HexRectTri
R-SquaredMedAEMAER-SquaredMedAEMAER-SquaredMedAEMAE
ModelTrainTestTrainTestTrainTestTrainTestTrainTestTrainTestTrainTestTrainTestTrainTest
AdaBoost0.95420.95440.03560.03560.03920.03930.92480.92590.04770.04770.05230.05230.95070.95130.03620.03620.04010.0402
ANN0.98840.98840.01920.01950.02090.02120.95030.95110.03960.03970.04490.04490.98680.98730.02400.02310.02190.0216
GBR0.98870.98840.01940.02040.02070.02140.95080.95010.04090.04160.04510.04590.98700.98690.02330.02320.02170.0218
HistGBR0.98860.98860.02000.02040.02080.02110.95050.95070.04100.04140.04530.04560.98690.98710.02380.02330.02180.0216
KNN0.98890.98570.01930.02190.02040.02340.95120.93780.04120.04560.04430.05040.98710.98390.02200.02450.02150.0241
LightGBM0.98860.98860.02000.02060.02080.02110.95050.95070.04120.04140.04530.04560.98680.98710.02360.02310.02180.0216
XGBoost0.98870.98860.02000.02050.02080.02110.95050.95060.04110.04170.04520.04560.98690.98710.02390.02370.02180.0217
Disclaimer/Publisher’s Note: The statements, opinions and data contained in all publications are solely those of the individual author(s) and contributor(s) and not of MDPI and/or the editor(s). MDPI and/or the editor(s) disclaim responsibility for any injury to people or property resulting from any ideas, methods, instructions or products referred to in the content.

