Abstract
This paper investigates the effect of mean shear stress on short-beam shear fatigue in a GLARE 1-3/2 commercial fiber–metal laminate (FML). This study explores three shear stress ratios ( 0.1, 0.3, and 0.5) and two material orientations (longitudinal and transversal) under constant amplitude fatigue. Different stress levels for each value were explored to obtain failures between 103 and 106 load cycles. The experimental results reveal anisotropy, with transversal specimens exhibiting lower performance and increased scatter. The mean shear stress effect is discussed herein, with insights into the critical role of mean shear of fatigue performance. 0.1 was the most severe condition and 0.5 was the least severe. The 0.3 condition produced steeper S-N curves, indicating that the combined effect of mean shear stress and shear stress amplitude led to a higher rate of damage accumulation. The fractographic analysis investigated the failure modes and confirmed the damage dominated by Mode II, supporting the test methodology employed.
1. Introduction
Fiber–metal laminates (FMLs), which were designed primarily for aeronautical applications, are more complex than typical fiber-reinforced composites. They offer advantages over monolithic materials, including higher specific strength and a slower crack growth rate in fatigue, resulting from their unique design and manufacturing process [1].
However, when it comes to interlaminar cracks, FMLs tend to exhibit relatively lower values of fracture toughness and fatigue crack growth resistance [2,3] compared to other crack orientations in the material [4,5]. This phenomenon is observed in both mode I and mode II loading conditions.
Notably, mode II loading has gained more research attention due to the potential occurrence of interlaminar shear stresses in various scenarios. These include bending, internal or external ply drop, straight free edges, corners, and crack bridging, all of which can contribute to mode II-driven delaminations [6,7,8,9,10,11,12].
The fatigue interlaminar crack growth in mode II has received significant attention in recent research. Researchers like Amaral et al. [13], Giallanza et al. [3], and Bieniaś and Dadej [14] have conducted experiments and developed models to assess mode II crack growth in various FML types. These investigations employed the end-notched flexure (ENF) test fixture, a reliable method for quantifying mode II fatigue-related interlaminar crack growth. However, it is important to note that this test does not provide insights into the stage of fatigue initiation. These previous studies highlighted the complexities associated with assessing interlaminar shear fatigue. Consequently, the literature contains several alternative tests that offer the means to approximate interlaminar shear fatigue, encompassing both the initiation and propagation stages, albeit with certain limitations. Lessard et al. [15] presented a list of 31 shear test methods and summarized the advantages and disadvantages of each test. The most commonly used methods were discussed: the rail shear test [16] presents a questionable region of pure shear due to the specimens being prone to twisting, low interlaboratory repeatability, and problems due to free edges [15]. The [±45]ns test [17] is inexpensive; however, it requires superior specimen quality and does not produce reliable results [15]. The Iosipescu test [18] is considered the main choice to obtain static shear properties; however, there is a need to adapt the test rig for fatigue and its application in fatigue scenarios is not well established [15,19].
The short-beam shear (SBS) test [20] is widely employed in laminate composites to obtain the apparent interlaminar shear strength. Although this test method produces only an apparent measure of this shear property [15,20], the SBS test presents some advantages over the abovementioned methodologies, like the small specimens needed, simple test apparatus, and absence of problems related to grip between the test sample and the device [21].
This quasi-static test has been employed to investigate its applicability in FMLs [22,23] or to examine other factors related to SBS strength [24,25,26,27,28,29,30,31,32,33]. Regarding the application of cyclic loads, Kotik and Perez Ipiña [34] used this test in fatigue to study the behavior of commercial GLARE 1-3/2 laminate in two orientations for a shear stress ratio () of 0.1. Additionally, they evaluated the failure mode, along with some aspects associated with the test limitations. Surowska et al. [35] evaluated the effect of thermal cycles on various carbon–aluminum laminates with protective glass interlayers in a 3/2 configuration, employing SBS fatigue tests. They observed the dependence of the fatigue response on thermal cycles, although they did not provide the shear stress ratio used. Both studies used only one , not enabling conclusions about the possible effect of the mean shear stress.
The effect of mean stress on the fatigue life of laminate composites has been investigated under various cyclic loading conditions, including tension–tension, tension–compression, or compression–compression [36,37,38,39]. Vassilopoulos and Keller [40] explained that the influence of mean stress in normal stress fatigue can be accurately represented by the constant life diagram (CLD), which is constructed from classical S-N curves (also known as Wöhler curves).
The effect of mean shear stress on fatigue life has been explored in studies involving glass fiber- [19,41] and carbon fiber-reinforced [42,43] polymers, utilizing SBS fatigue results. However, this effect remains an open question in FML research regarding interlaminar shear stresses.
This paper explores the effect of mean shear stress fatigue on a commercial FML known as GLARE 1-3/2. The experimental program involved testing SBS fatigue specimens at three values in both the longitudinal and transversal orientations of the material, enabling an evaluation of the anisotropic effect. Basquin’s and Sendeckyj’s fitting models were adapted for shear stresses and then applied to the experimental results to build a partial piecewise CLD to illustrate the mean stress effect. A fractographic analysis of the failure mechanisms involved and a fractographic validation of the methodology applied were also included.
2. Materials and Methods
The material chosen in this investigation was a commercial GLARE ® 1-3/2 laminate [1] produced by the Structural Laminates Company, Pittsburgh, PA, US. The lay-up of this fiber–metal laminate comprises three Al 7475-76 alloy layers interleaved with two S-glass-reinforced FM-94 epoxy prepreg layers. Some characteristics and mechanical properties obtained from the manufacturer data sheet [44] are shown in Table 1. The short-beam strength in both orientations was determined in a previous study [34] and were = 81.6 MPa and = 72.5 MPa.

Table 1.
Characteristics and mechanical properties of GLARE 1-3/2 [44].
The specimens were sliced in longitudinal and transversal directions with a circular blade saw, as schematically shown in Figure 1. Nominal specimen dimensions were thickness (t) 1.42 mm, width (b) 2.84 mm, and length (l) 9 mm. A total of 60 longitudinal specimens and 70 transversal specimens were tested. Sandpaper grit grades of 80, 240, 600, and 1200 were used to produce a smooth surface in planes 1–3 and 2–3. The top and bottom surfaces (planes 1–2) were left as manufactured.
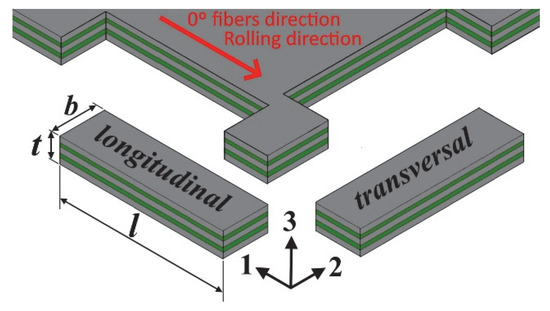
Figure 1.
Layout of the machined specimens in the material.
The specimens were tested in an electrodynamic testing machine, Instron ElectroPuls® E3000 (Instron, High Wycombe, UK), with a load cell of ±5 kN. The tests were monitored with a digital camera, Imperx IPX-2M30 (Imperx, Boca Raton, FL, USA), equipped with a 1:1.4/25 mm Fujifilm lens. The testing device, shown in Figure 2, used a span-to-thickness ratio of 4.0, supports of 1 mm in diameter, and a loading nose of 2 mm in diameter.
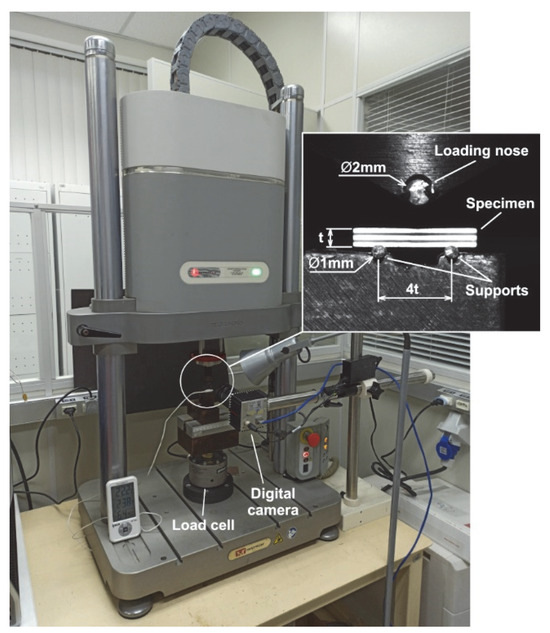
Figure 2.
Test machine and device fixture used in the SBS fatigue tests.
The SBS stress () was calculated by employing the classical equation of beams in ASTM D2344-16 [20] for quasi-static SBS tests, as follows:
where is the force at the i-th data point observed during the fatigue test.
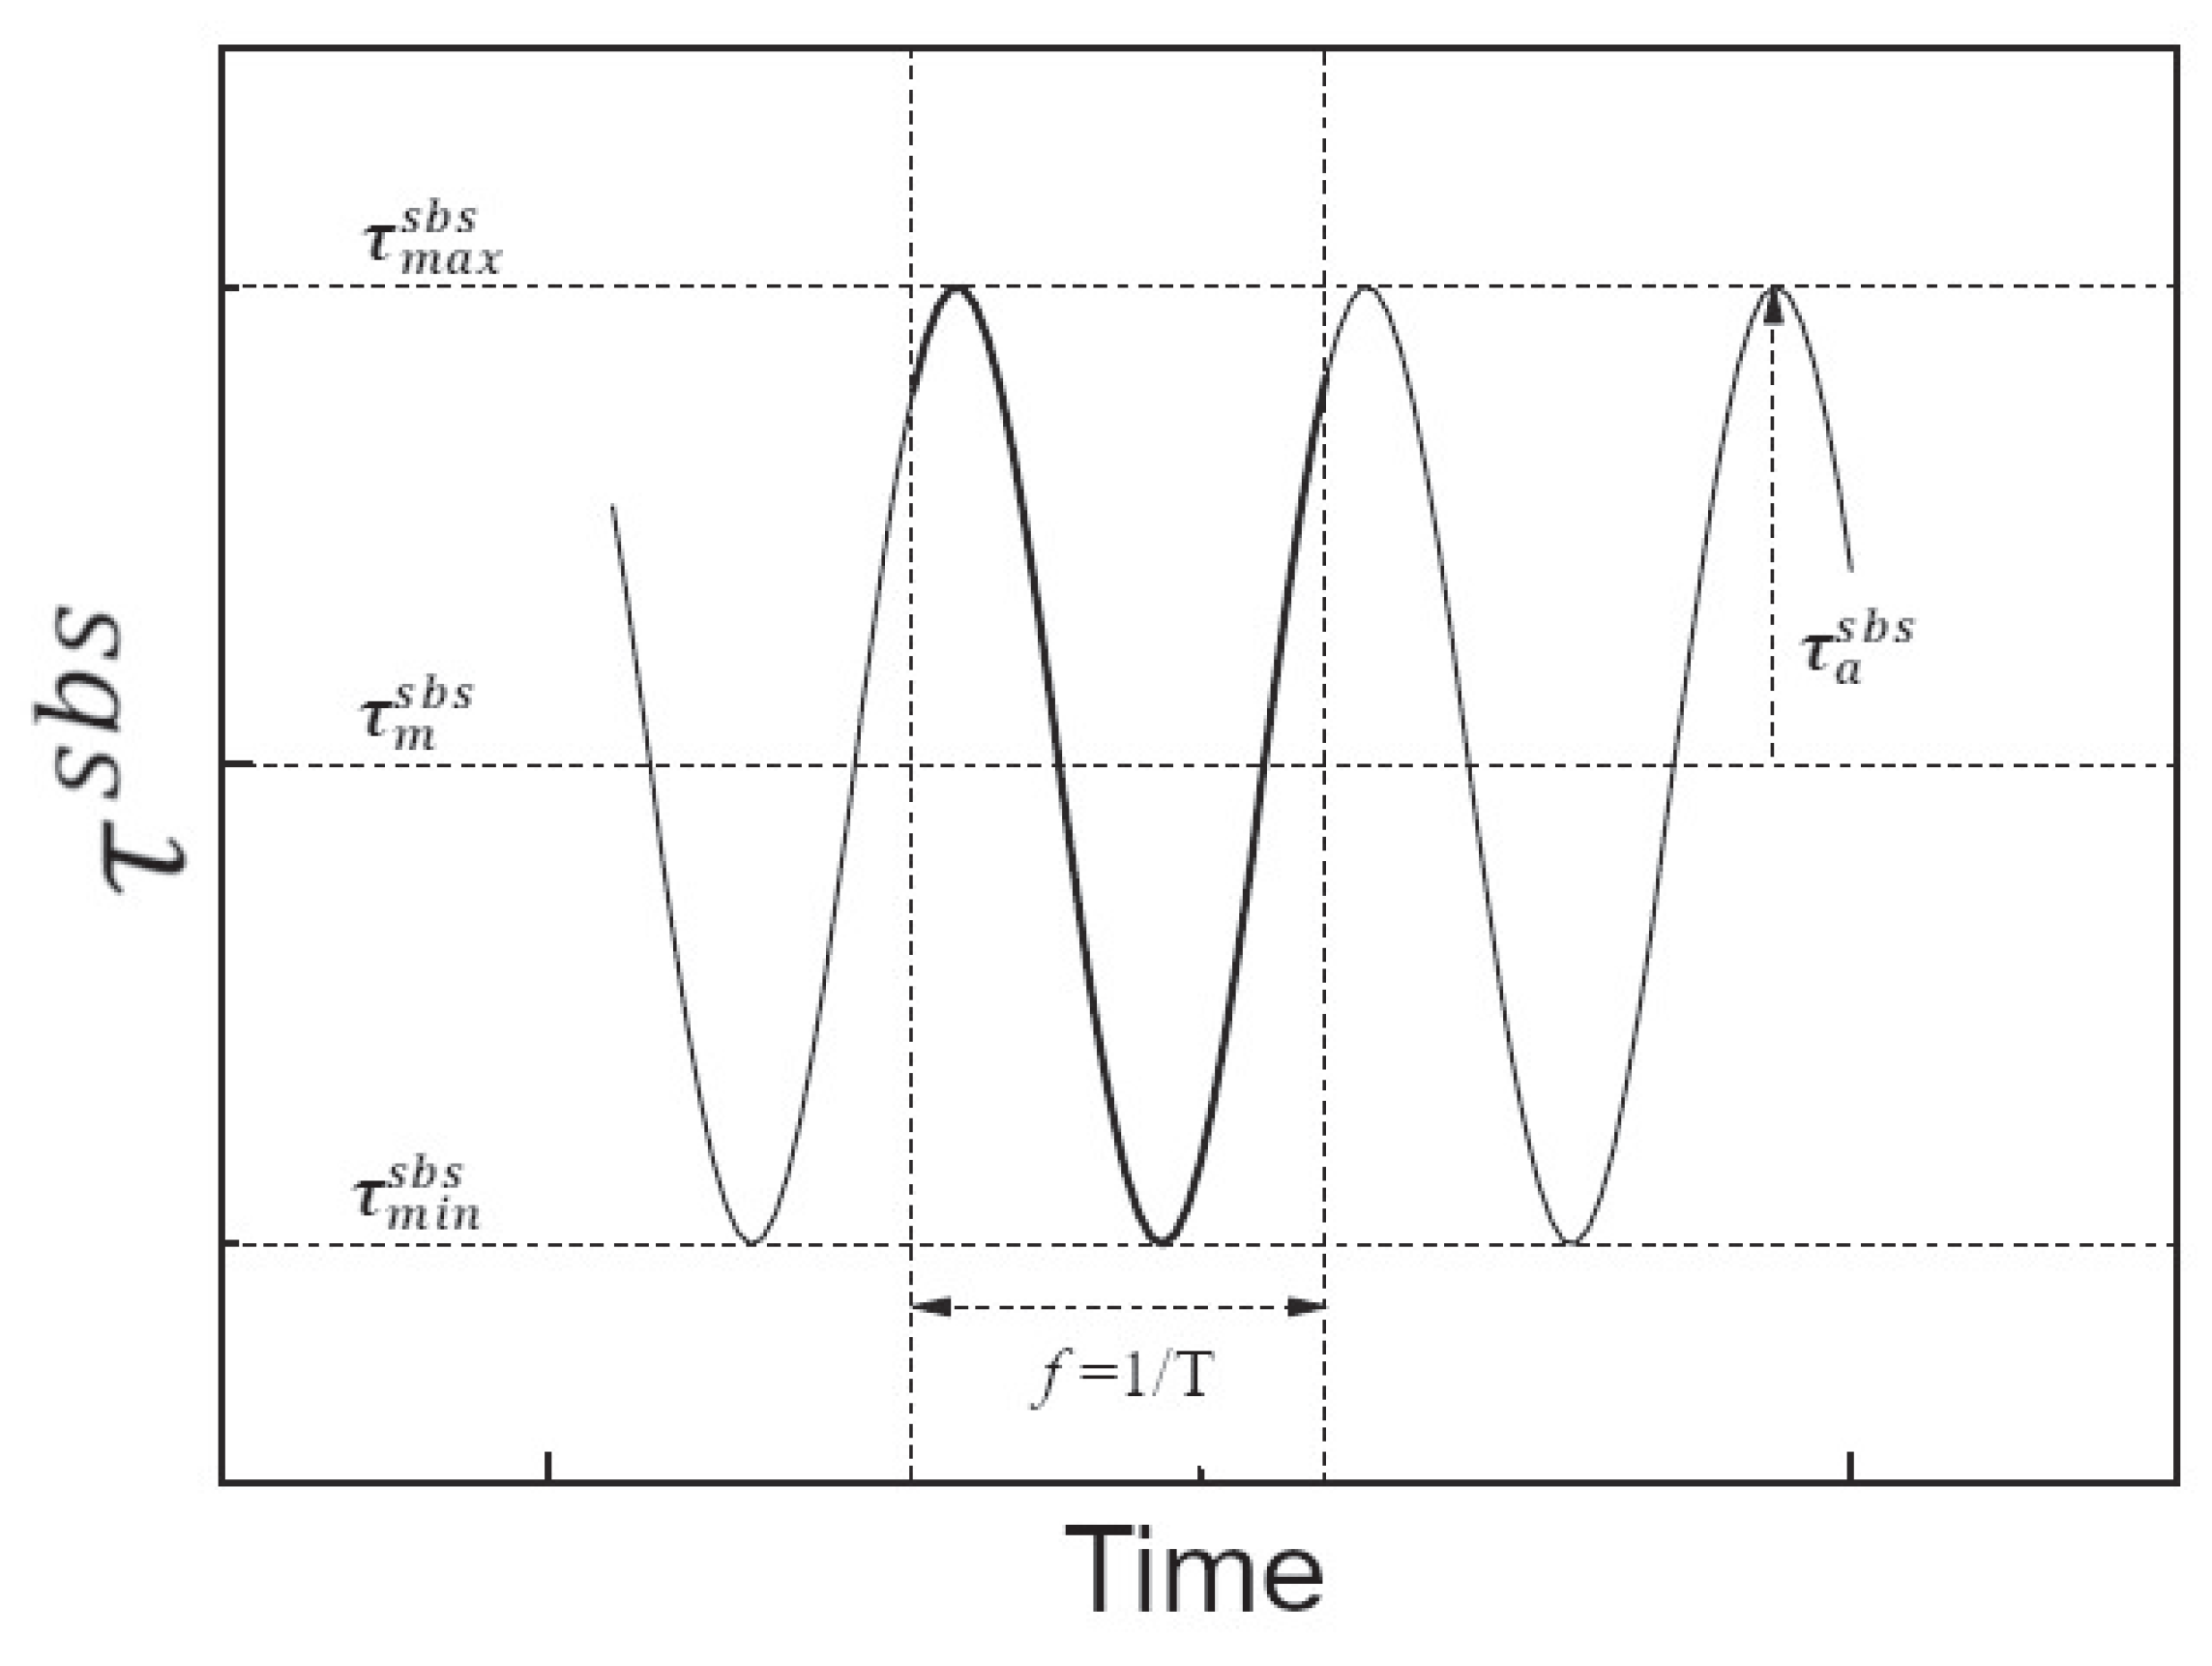
Specimens were tested using values for = 0.1, 0.3, and 0.5, with the shear stress ratio () defined as:
where and are the maximum and minimum SBS stress values, respectively, observed in one cycle (Figure 3).
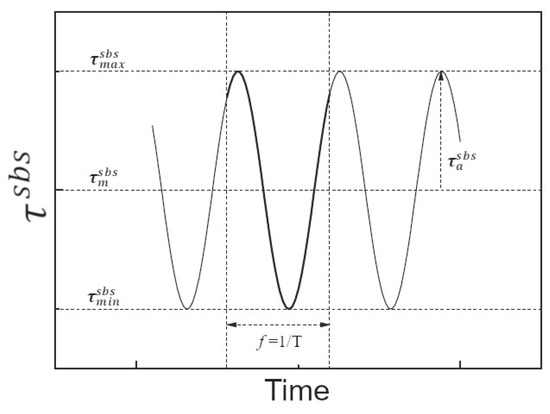
Figure 3.
Constante amplitude load cycle parameters for SBS stresses ().
The tests were performed at a loading frequency (f) of 5 Hz, constant amplitude (), sinusoidal waveform, load control (see Figure 3), and room conditions (25 °C; HR 50 ± 10%). The tests ended when the specimens collapsed or a limit of 106 cycles was reached. The load cycles were defined by the and values. The values were chosen as a function of the short-beam strength, to obtain failures between 103; and 106 cycles. The were calculated using Equation (2). The specimen orientation and the values of , , and the number of test replicates for each condition employed are detailed in Table 2.
Table 2.
Test program.
Fatigue results are used to construct S-N curves and can be fitted using either deterministic or statistical models. Vassilopoulos and Keller [40] highlighted that the choice of model significantly affects the outcomes of the CLD [40], a factor that is not always taken into account in many publications. The deterministic model by Basquin [45] and the statistical model by Sendeckyj [46] were chosen, due to their good fit to the experimental data and reliable performance in both low- and high-cycle fatigue regimes in a previous analysis. In that analysis, presented in the Supplementary Materials, these models were compared with other models recommended by Vassilopoulos and Keller [40], such as NLD [40], ASTM [47], and Whitney [48], as well as the models proposed by Mandell-Meier [49], Appel-Olthoff [50], Bach [50], and Gao et al. [51]. A partial piecewise linear CLD formulation was chosen due to model simplicity.
Although all the models were originally proposed for normal stresses, they were adapted for application to the current situation of short-beam shear (SBS) stresses. In this way, values such as normal stress amplitude () are superseded by shear stress amplitude (), mean stress ( by mean shear stress (, and so on.
The deterministic Basquin’s relation adapted for shear stresses is presented in Equation (3):
where is the SBS cyclic stress amplitude, is the number of cycles at failure, and are model parameters that were estimated by linear regression.
The statistical Sendeckyj’s wear-out model was implemented using Equation (4):
where is the maximum SBS stress level, is the probability of survival after N cycles, C is a constant that defines the shape of the low-cycle fatigue region in the S-N curve, and G is the slope of the S-N curve. and are the scale and shape parameters of the 2P Weibull distribution, respectively. For a better comparison with the Basquin model fit, the S-N curves for the Sendeckyj model were plotted for a 50% reliability level.
The piecewise linear CLD [40] arises from the linear interpolation between known values in the () plane and the material’s ultimate strength. This CLD was built by connecting adjacent points with the same time-to-failure value from different S-N curves using straight lines (constant life lines). The first known R-ratio (counted counterclockwise from the x-axis) was connected to the ultimate strength.
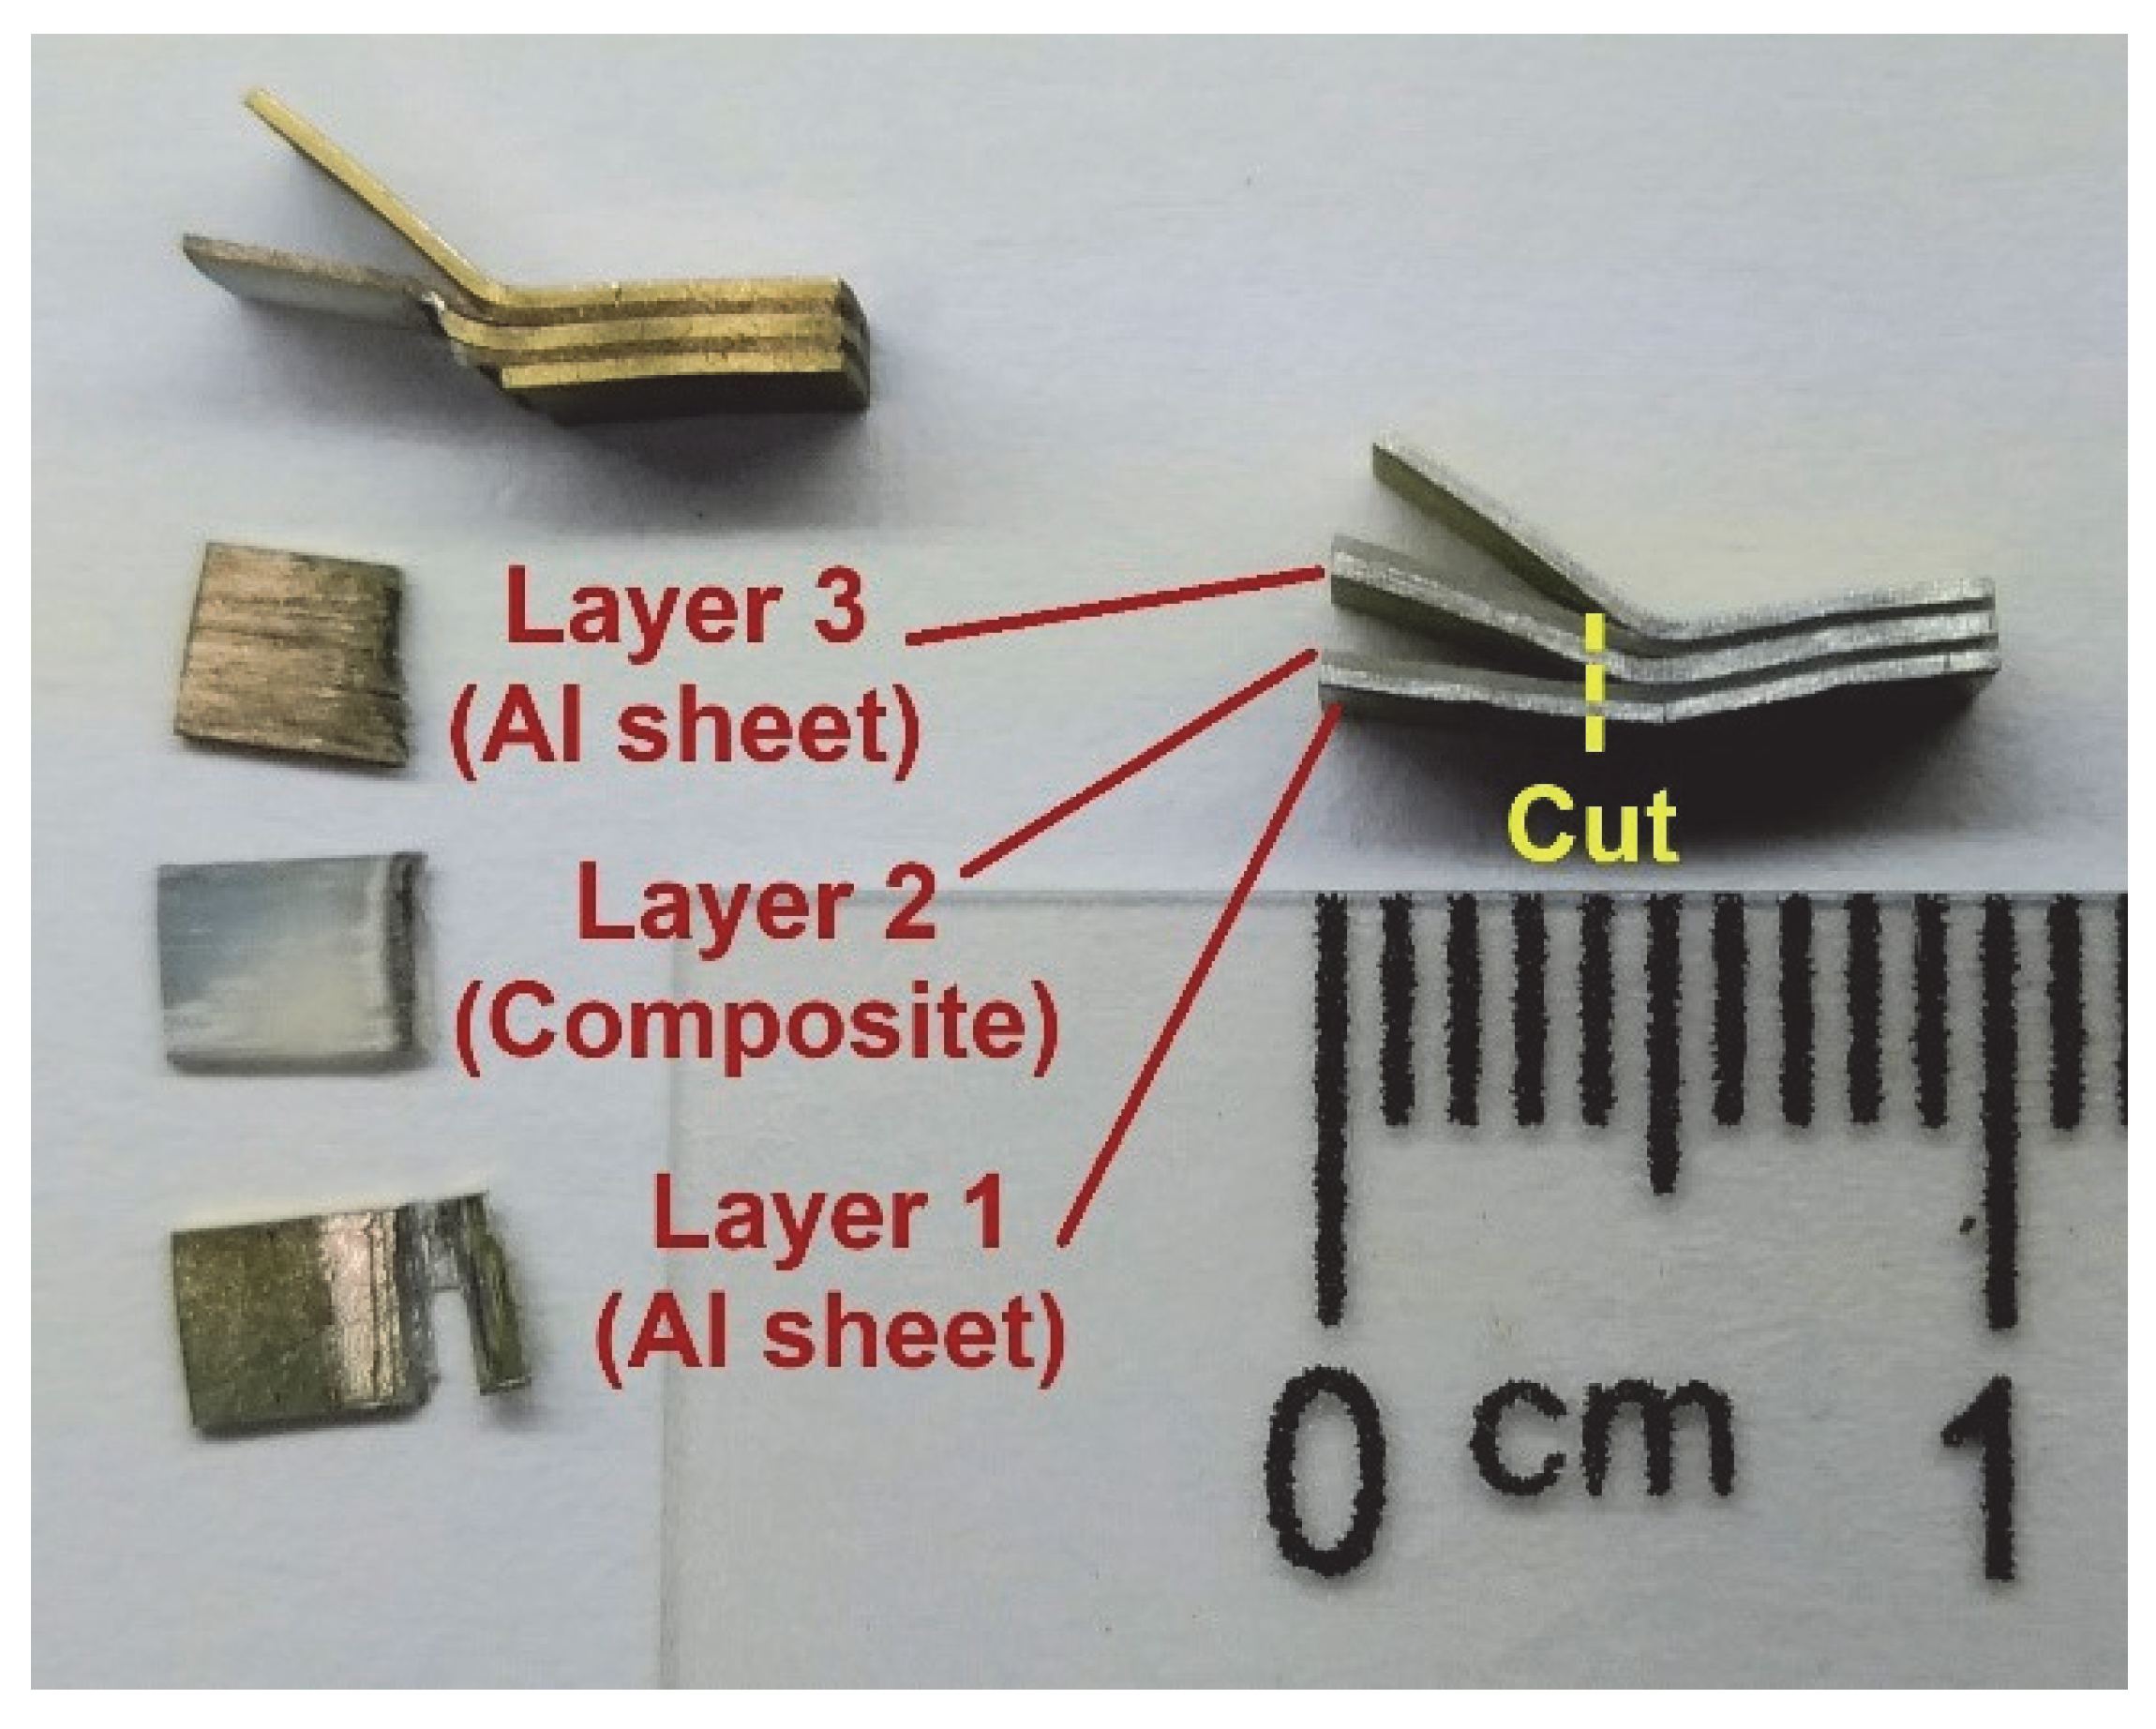
Samples with similar and different values were selected to evaluate the failure mechanisms by observing the exposed failure surfaces. The samples were then coated with gold using a sputter coater, the Denton Vacuum model Desk V, and were observed using the scanning electronic microscopes (SEM) Tescan VEGA 3. An example of a cut specimen with the identification of the layers observed in SEM is shown in Figure 4. The failure analysis was carried out on the interfaces between layers 2 and 3 or 3 and 4 (where the shear stresses are higher) and between layers 1 and 2 or 4 and 5 to compare the failure mechanisms of the different layers.

Figure 4.
Specimen prepared for fracture surface observation using SEM.
3. Results and Discussion
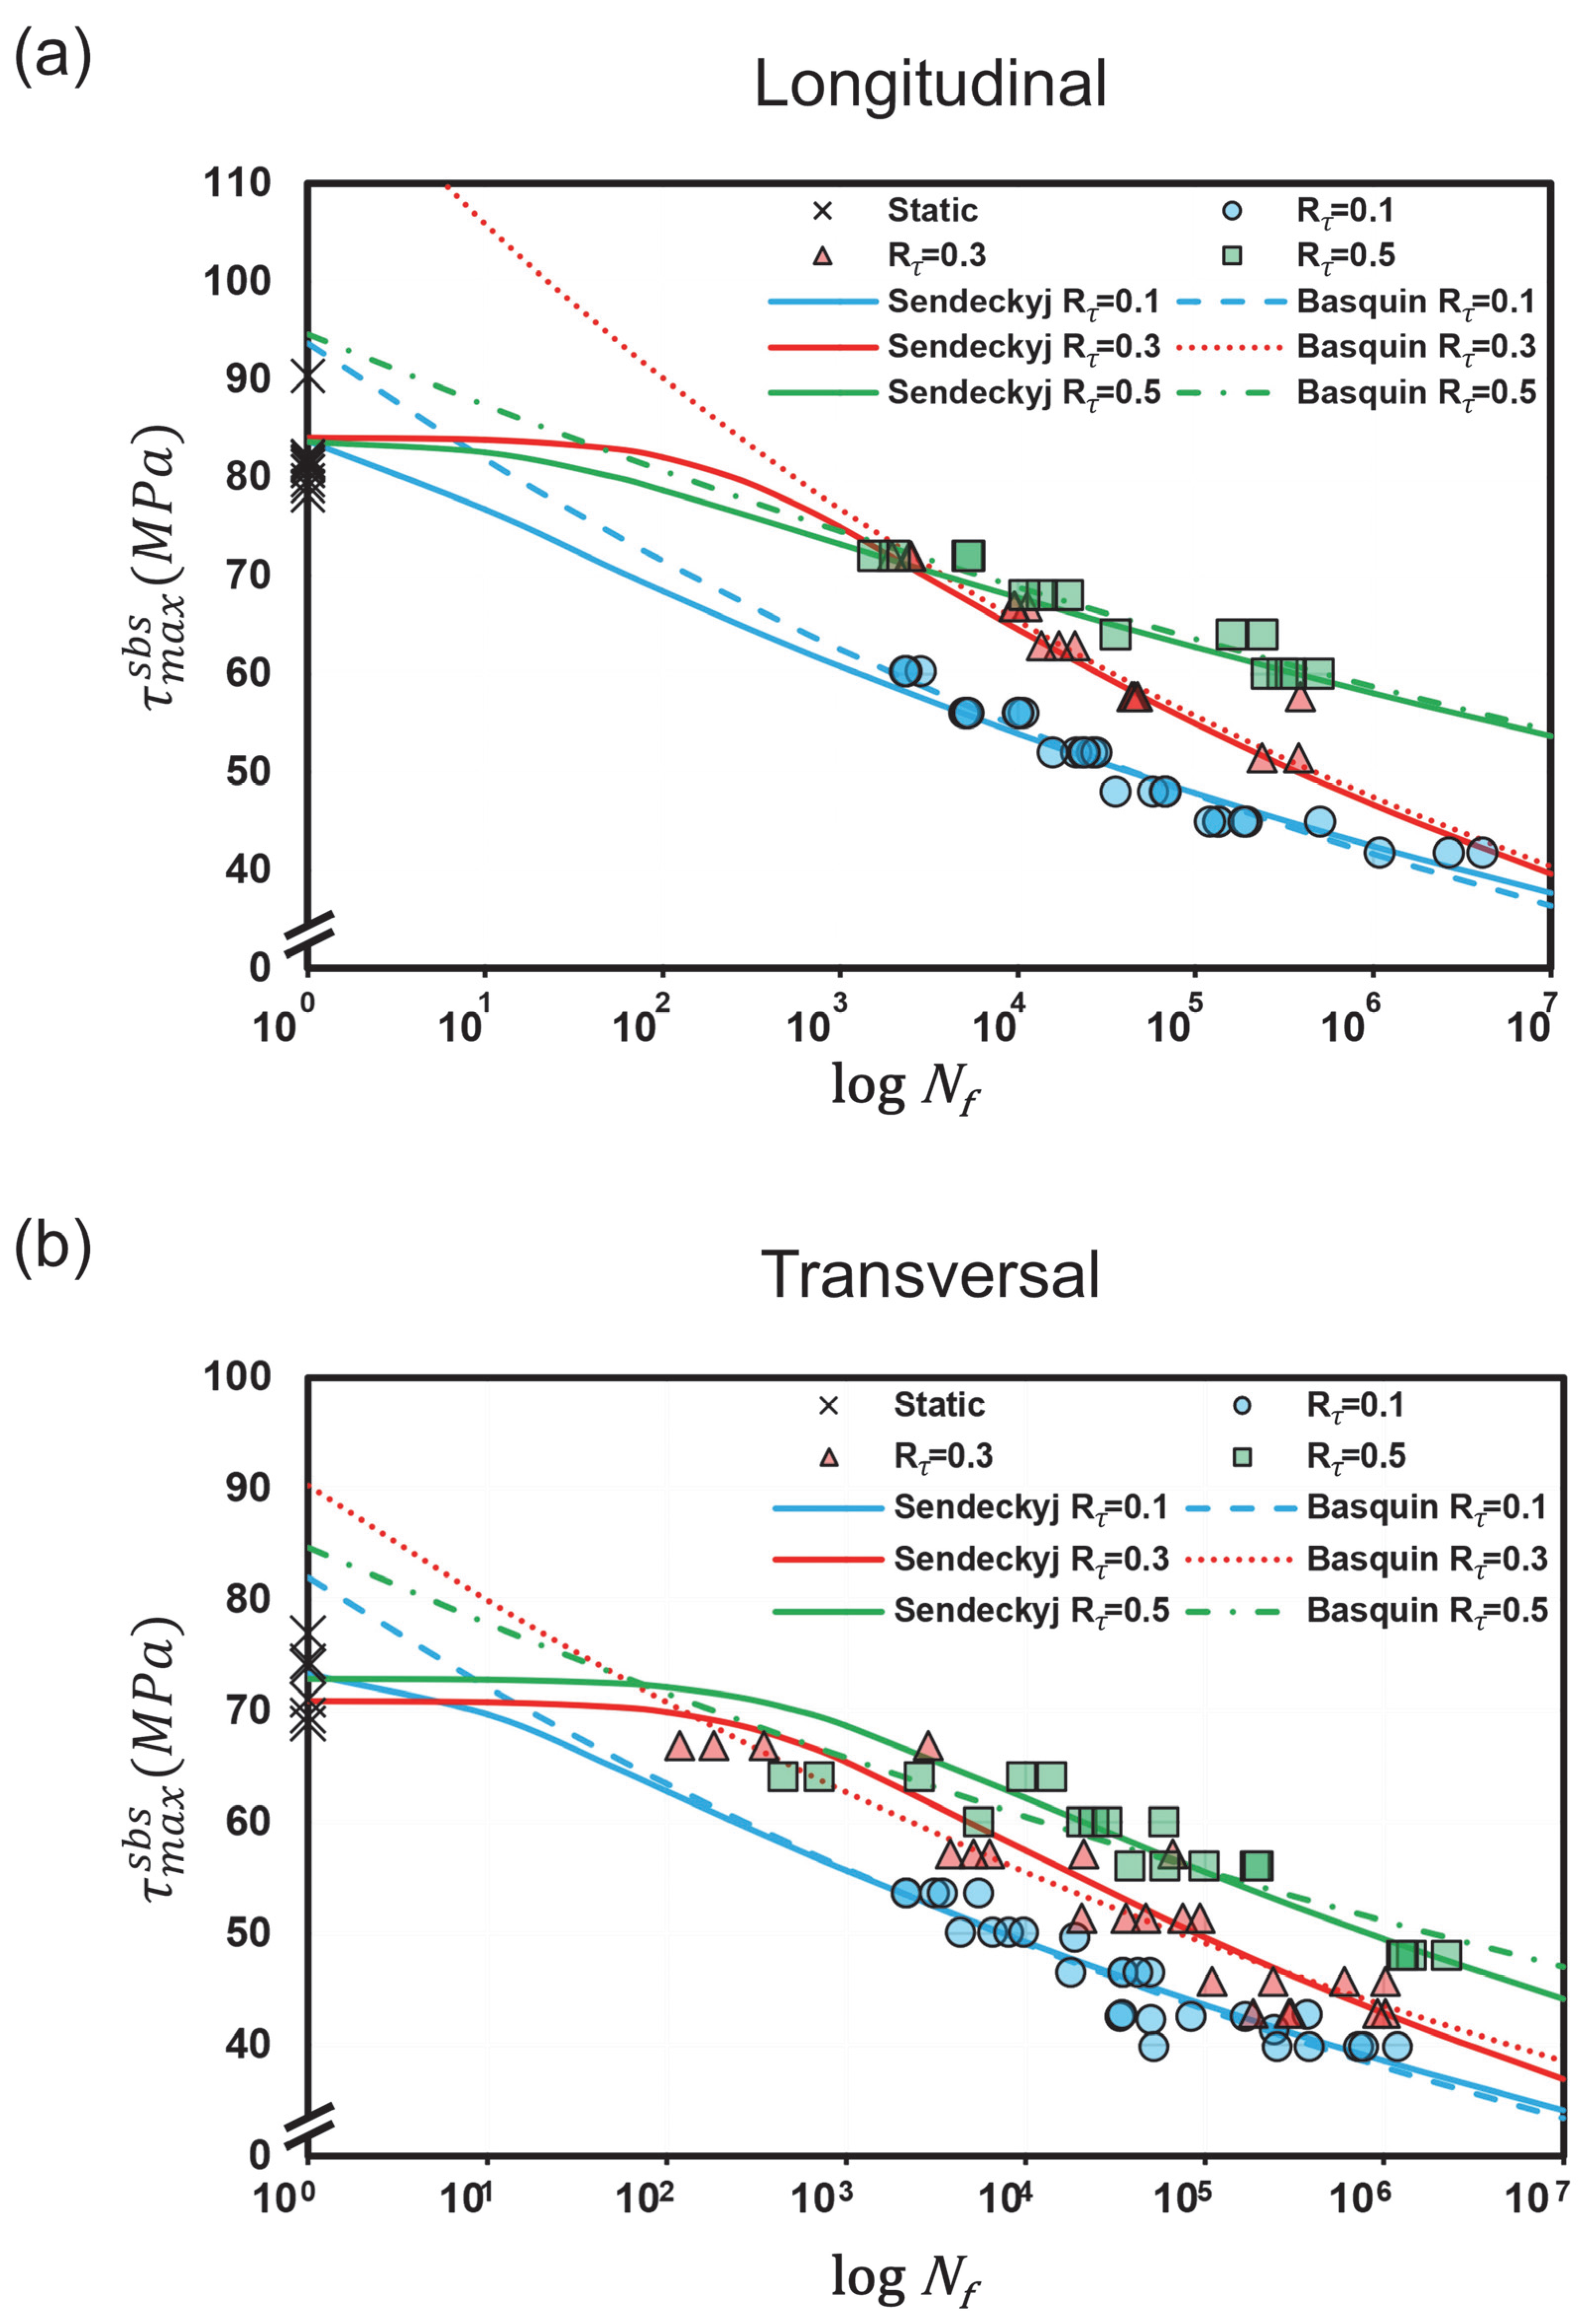
Plots of the SBS stress amplitude () and maximum SBS stress () versus the log of cycles to failure are presented in Figure 5 and Figure 6, respectively. a and Figure 6a show the results for longitudinal specimens and Figure 5b and Figure 6b for transversal specimens. Table 3 presents the parameters of the Basquin model and Table 4 presents the parameters of the Sendeckyj model when fitted to the data. Figure 6 presents the plots of these adjustments.
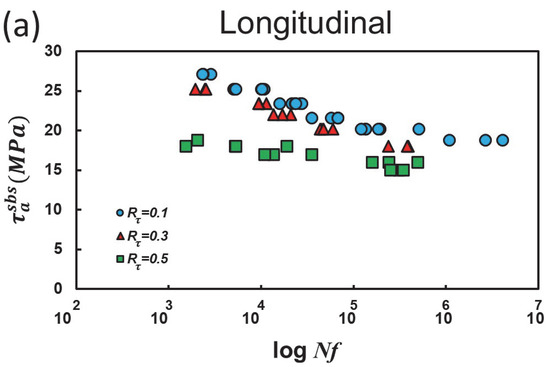
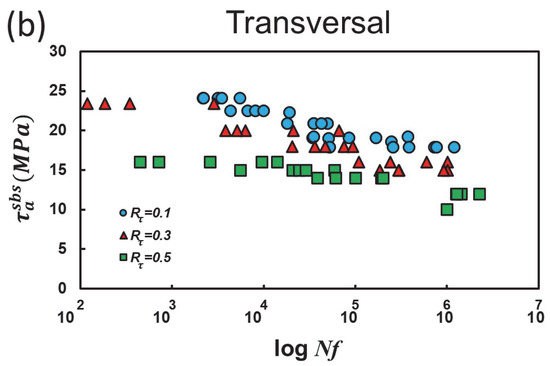
Figure 5.
SBS stress amplitude vs. the log of cycles to failure for (a) longitudinal and (b) transversal specimens.
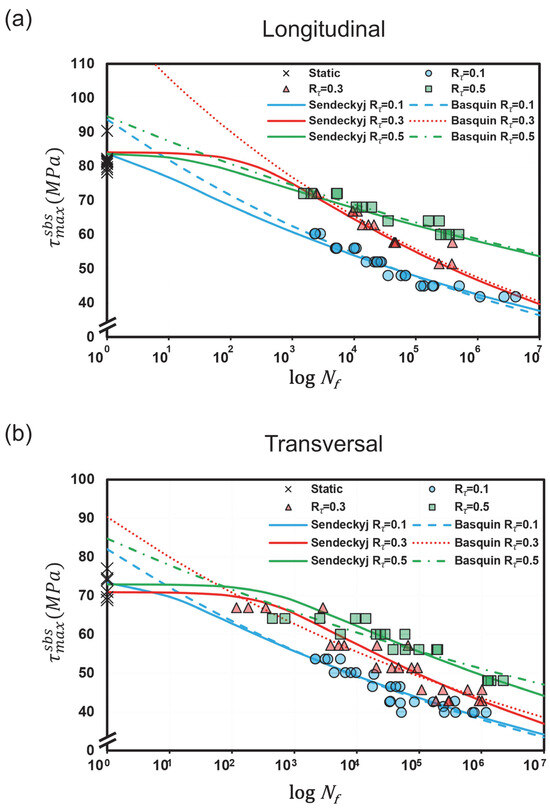
Figure 6.
Maximum SBS stress vs. the log of cycles to failure. The fits represent Basquin’s relation (dashed line) and Sendeckyj’s model (solid line) for (a) longitudinal and (b) transversal specimens.
Table 3.
Fitting parameters for the Basquin model.
Table 4.
Fitting parameters for the Sendeckyj model.
3.1. Scatter and Anisotropy
The experimental results exhibited a larger scatter for transversal specimens than longitudinal ones. Specimens tested under an value of 0.1 exhibited significant scatter in the high-cycle regime for both orientations. In opposition to the typical behavior of metals [52], this FML displayed an increased scatter in the low cycle region (<104 cycles) for values of 0.3 and 0.5 in transversal specimens. May and Hallett [19], who observed similar behavior in GFRP specimens, associated this phenomenon with variations in both material properties and specimen quality. It is worth clarifying that May and Hallett analyzed the initiation results, while this work evaluated both damage initiation and growth.
The material exhibited anisotropy for the studied situations, as was previously reported for an value of 0.1 [34]. This effect can also be observed in the CLD diagram (see Section 3.2). The transversal specimens presented lower performance than the longitudinal ones for all three values tested.
3.2. Mean Shear Stress Effect
A pronounced effect of mean shear stress on the SBS fatigue performance of GLARE 1-3/2 was observed. For instance, when = 60 MPa in Figure 6a, specimens tested at an of 0.1 failed at around 2500 cycles, whereas failure occurred at around 50,000 cycles for 0.3 and 350,000 cycles for 0.5. This underscores the critical role of shear stress amplitude in determining fatigue life.
0.3 and 0.5 exhibited similar cycles to failure under the highest condition (around 70 MPa. For low conditions (around 40 MPa , 0.3 appears to have a similar time-to-failure as 0.1, as seen in the transversal specimen data (Figure 6b). However, the 0.3 condition presented the highest exponential coefficients (curve slope) for both the Basquin and Sendeckyj models (refer to Table 3 and Table 4), except for the transversal dataset adjusted with Basquin’s relation. This effect is more prominent in longitudinal orientation but can also be observed in the transversal specimens (see Figure 6a,b). The high exponential coefficients of an value of 0.3 indicate a higher damage rate for this condition.
In contrast, the value of 0.5 exhibited the lowest exponential coefficients for both models, indicating that this condition is milder. 0.1 showed intermediate coefficient values, except for the Sendeckyj model applied for transversal specimen data. Despite that, this condition presented the lowest Nf.
The lowest S-N curve slope for the 0.5 condition was also reported for axial fatigue tests on E-glass/polyester composites, independent of specimen configurations (on- or off-axis angles) [40], and for ±45° angle-ply E-glass/epoxy composites [53]. May and Hallett [19] evaluated the failure initiation of IM7/8552 carbon/epoxy composite under shear stress fatigue, considering only the initiation stage. The S-N curves were fitted using the Basquin relation and presented a marked decrease in slope with increasing (0.5 < 0.3 < 0.1 for the double-notched shear test and 0.5 < 0.1 for the SBS test). They also observed that damage onset occurred later with high values of , indicating that the shear stress amplitude has a more significant impact on initiation than the mean shear stress.
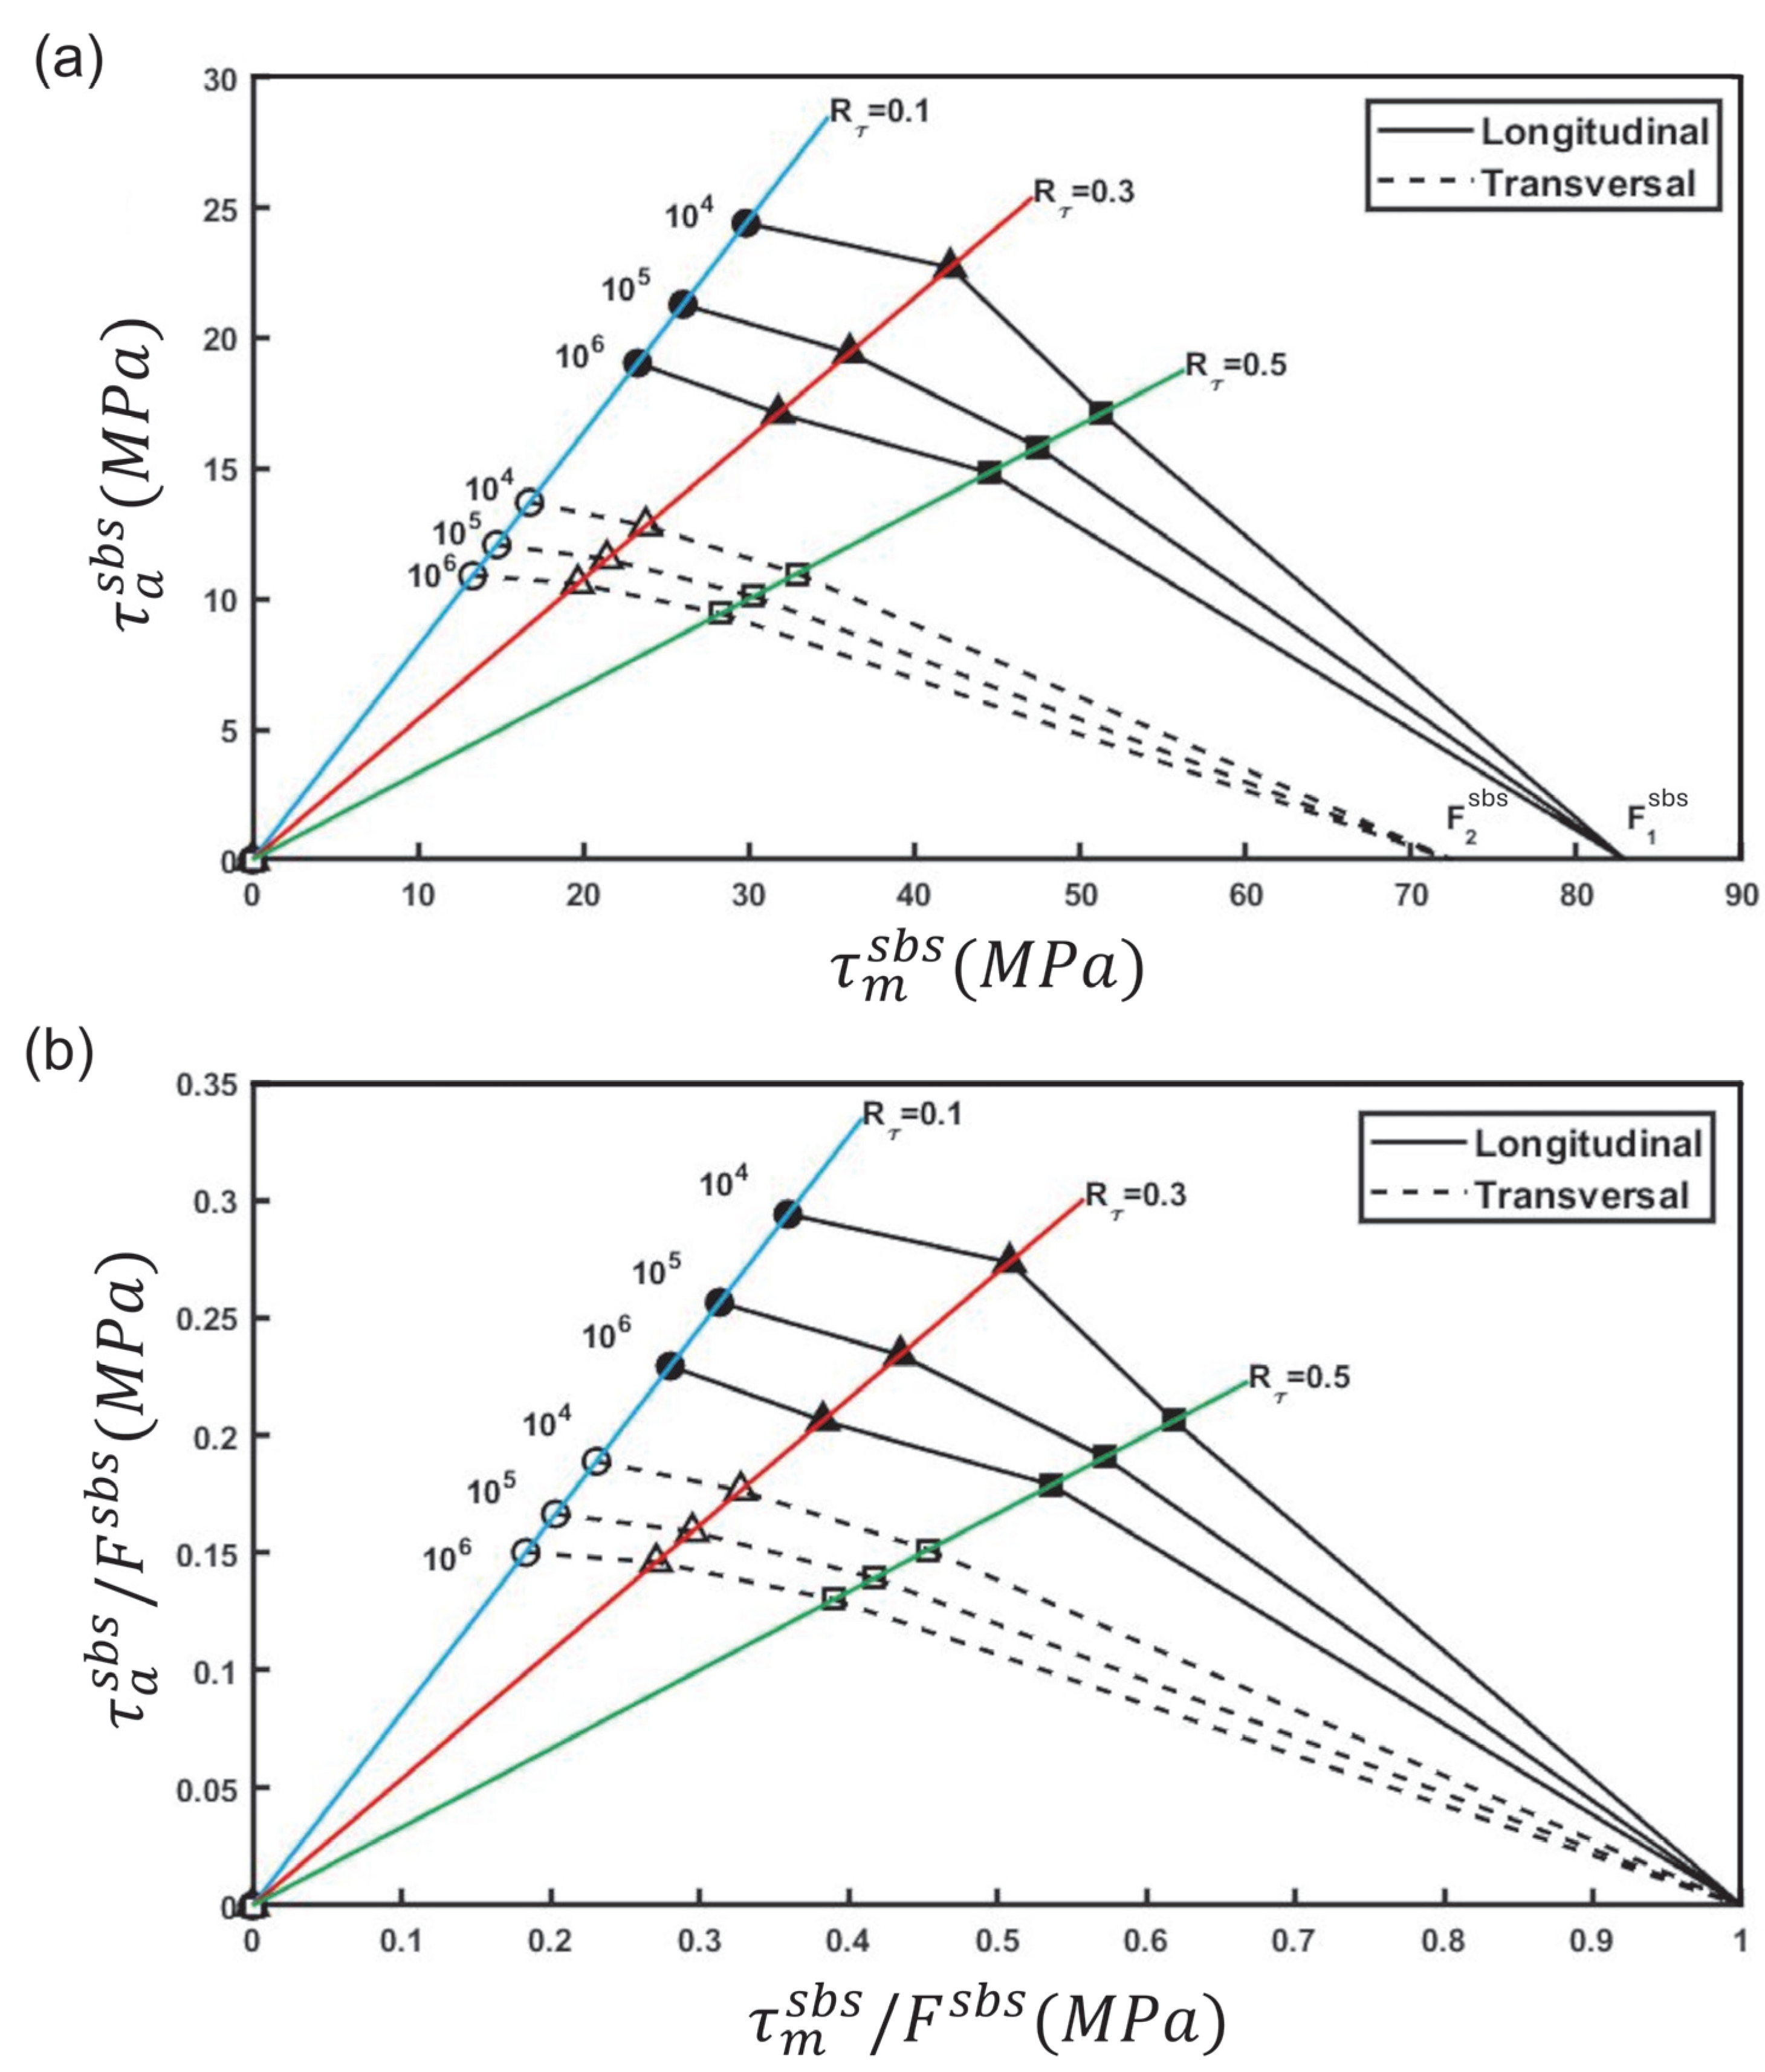
Figure 7a shows the partial piecewise linear CLD [40] built using the S-N curves fitted to Basquin’s relation for longitudinal and transversal data. In Figure 7b, the values of mean stress () and stress amplitude () were normalized by the short-beam strength () of the respective orientation to enable a better comparison between both datasets. The transversal data set seems to have a “smooth” constant life curve, while the longitudinal dataset presented a deviation for a value of 0.3. In this condition, the 104 and 106 points seem to be farther away when compared to 0.1 and 0.5 conditions. The CLDs in Figure 7b evidence the greater degradation with fatigue in the transverse direction. This combined effect of anisotropy and mean shear stress must be considered in models that aim to approximate fatigue properties from quasi-static strength values.
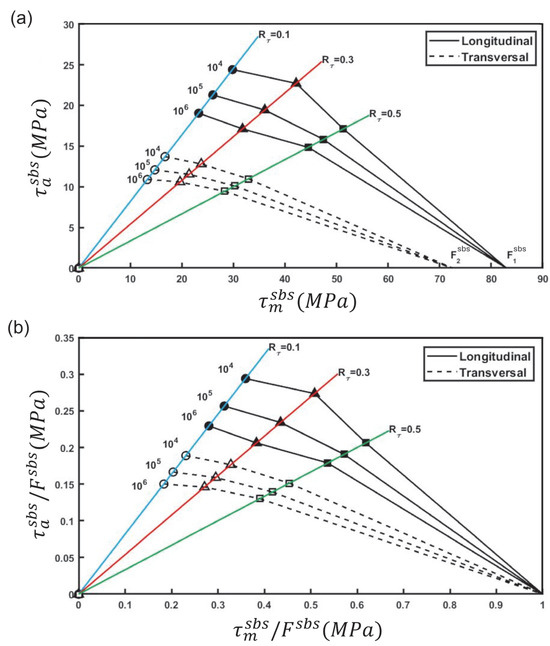
Figure 7.
Partial piecewise linear CLD for: (a) longitudinal and transversal SBS fatigue data; (b) normalized longitudinal and transversal SBS fatigue data.
3.3. Fractographic Analysis
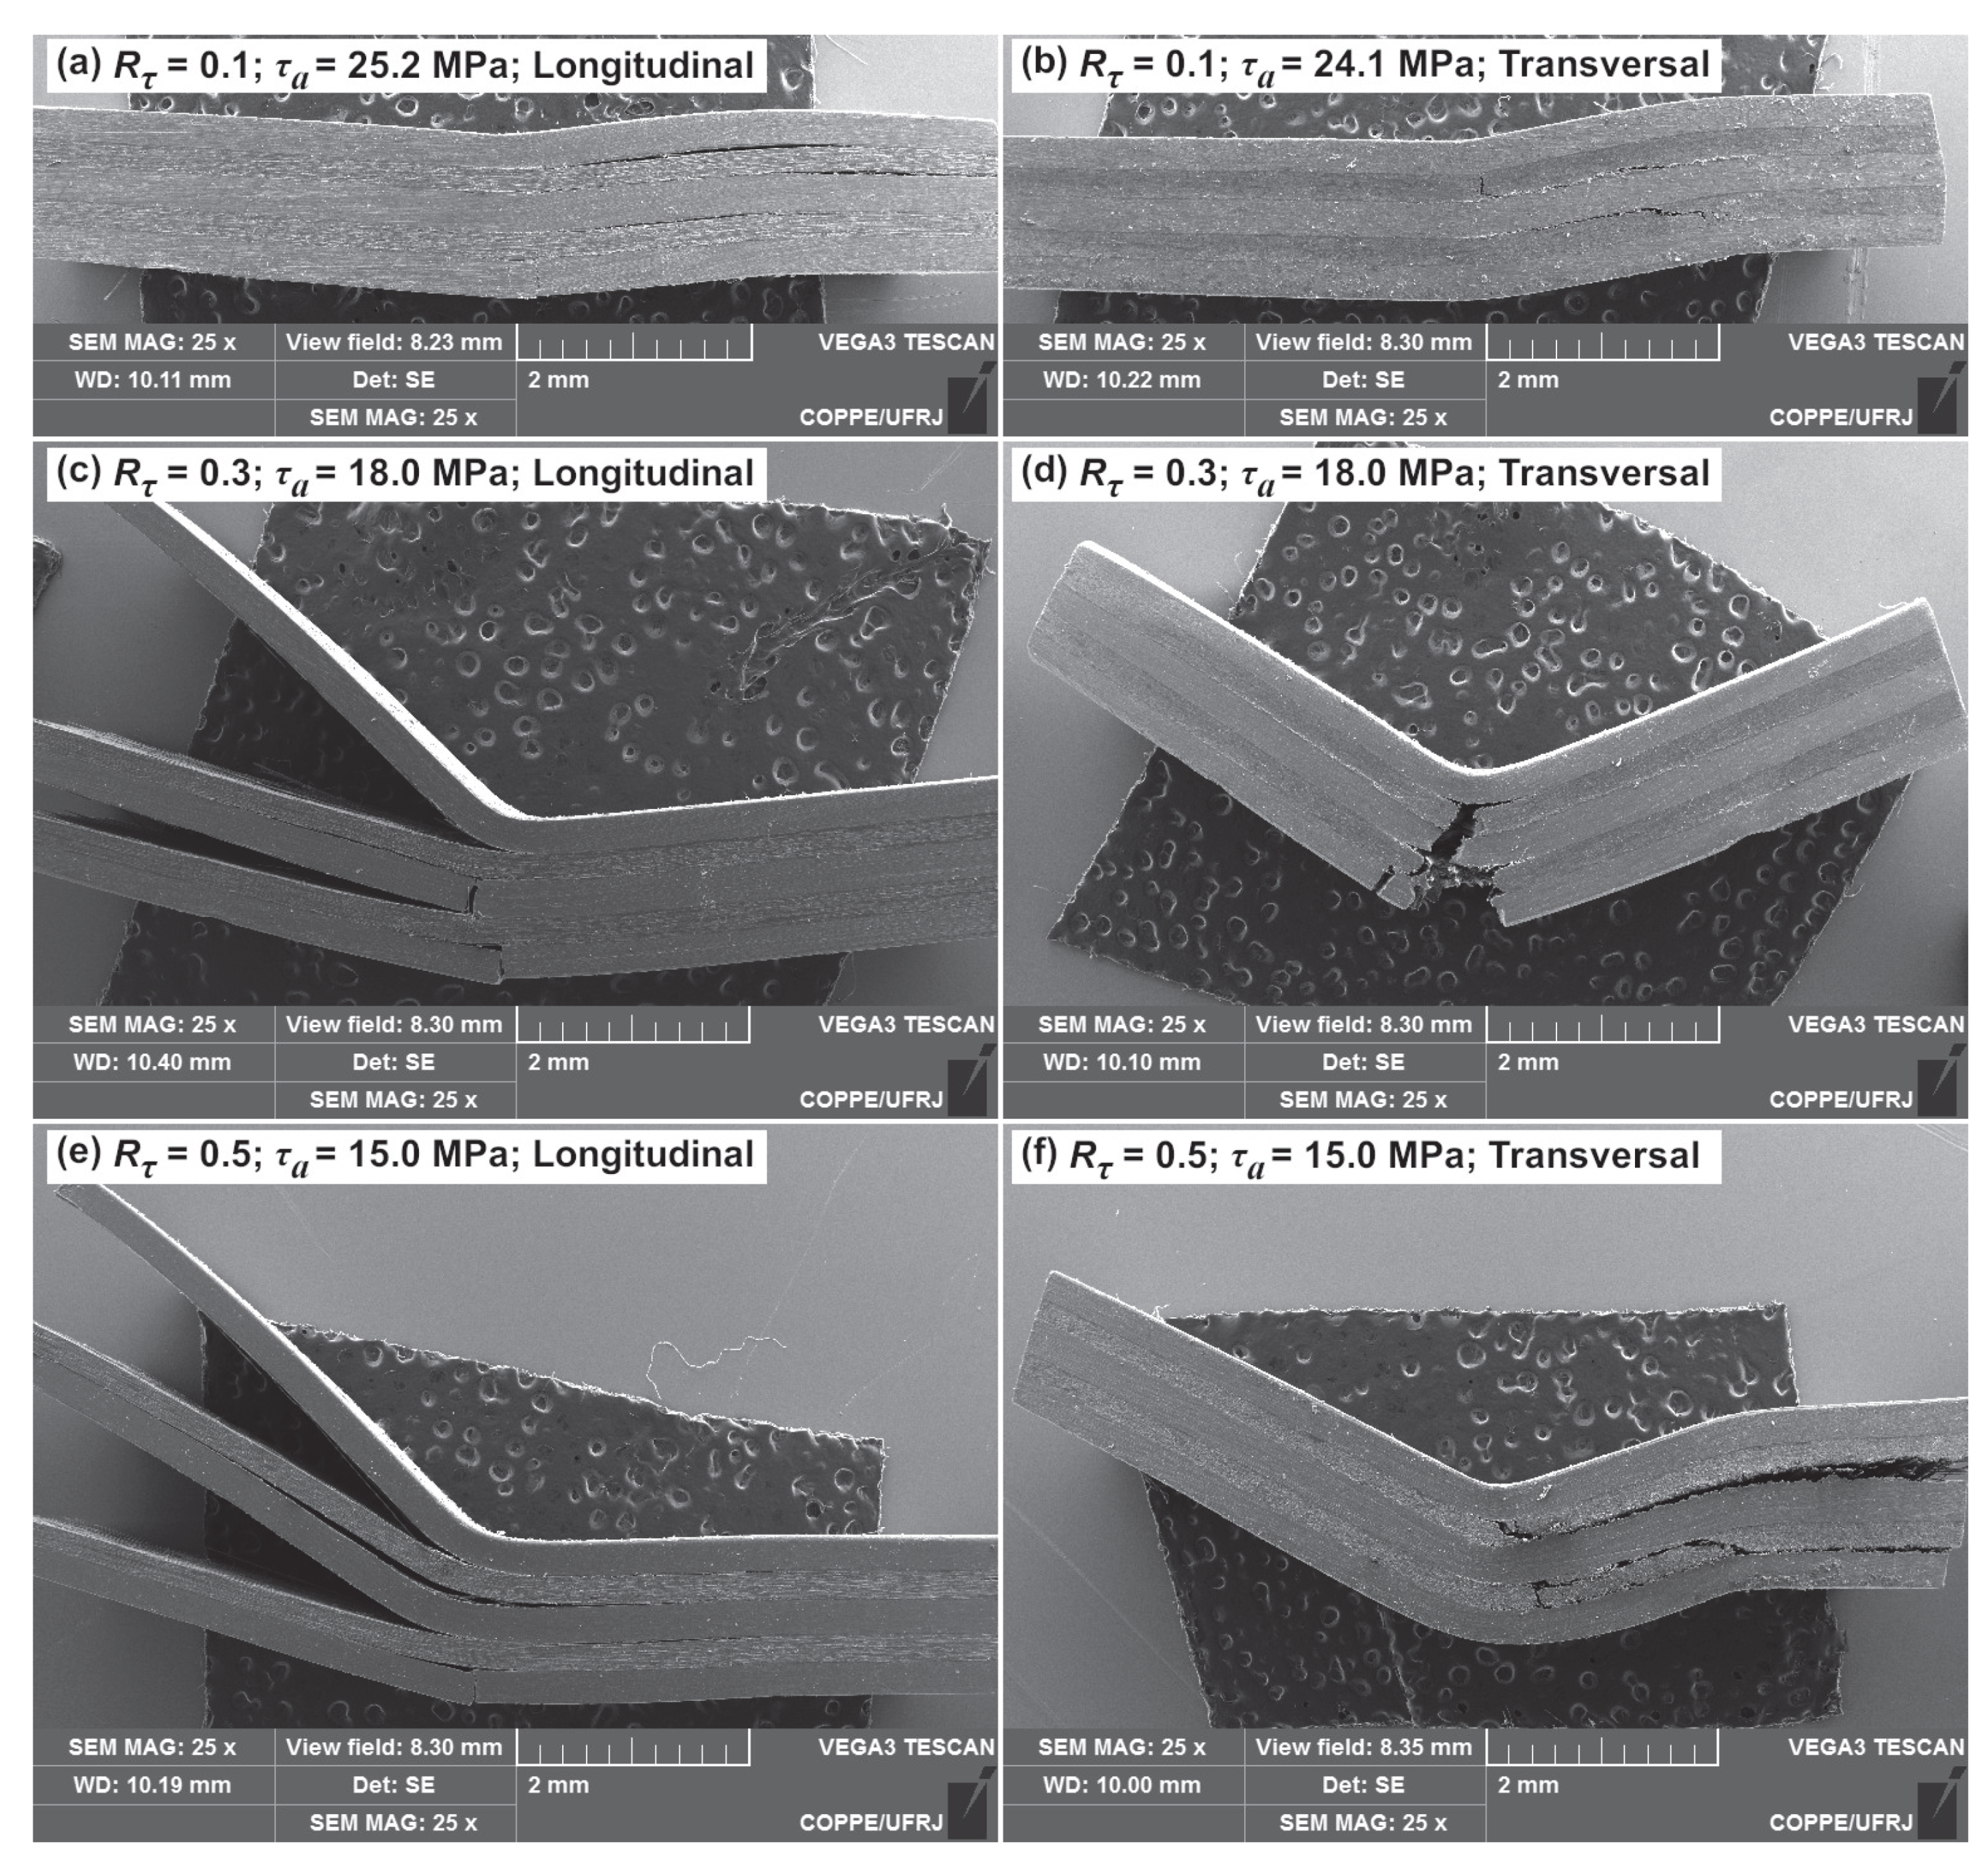
SEM images of specimens with typical failure modes are shown in Figure 8. Interlaminar failure was the preferential mode in the longitudinal samples, as can be seen in Figure 8a,c,e. Delamination was the first macroscopic damage observed during the failure process, as reported in Ref. [34], with later growth of a crack in the middle span of the external aluminum layer under tensile stresses. This can be observed in Figure 8a–e. Some specimens even exhibited a crack in the middle aluminum layer, as shown in Figure 8c. All these cracks corresponded to the final stage of life.
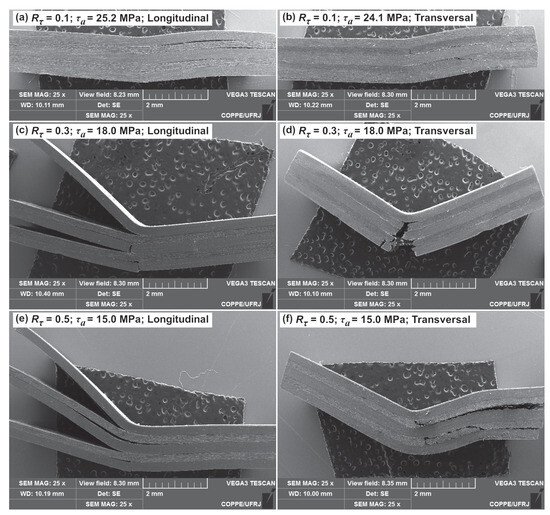
Figure 8.
Failure modes for longitudinal (left column: (a,c,e)) and transversal (right column: (b,d,f)) specimens under 0.1 (a,b), 0.3 (c,d), and 0.5 (e,f) conditions. The corresponding values are (a) 25.2 MPa, (b) 24.1 MPa, (c,d) 18.0 MPa, and (e,f) 15.0 MPa. Specimens shown in the same row share the same and have similar values.
The transversal specimens showed interlaminar and intralaminar damage, as can be seen in Figure 8b,d,e. The first damage observed in these specimens was seen in the aluminum/GFRP interface of the central layers. The interlaminar crack exhibited ply splitting during its propagation. The crack generated visible intralaminar damage in the GFRP layer near the roller (Figure 8b). Another failure mode can be observed in Figure 8d. As observed and reported in Ref. [34], an interlaminar crack first originates due to shear stresses and grows at the mid aluminum/GFRP interface in the mid-span. The interlaminar crack was the first damage that was observed on the specimen. Then, the crack propagated in intralaminar mode approximately parallel to the thickness direction. This delamination promoted through-thickness crack growth in the aluminum layers and led to specimen collapse. The last failure mode (Figure 8f) included inter and translaminar cracks in the GFRP, without macroscopic cracks in the aluminum layer being observed.
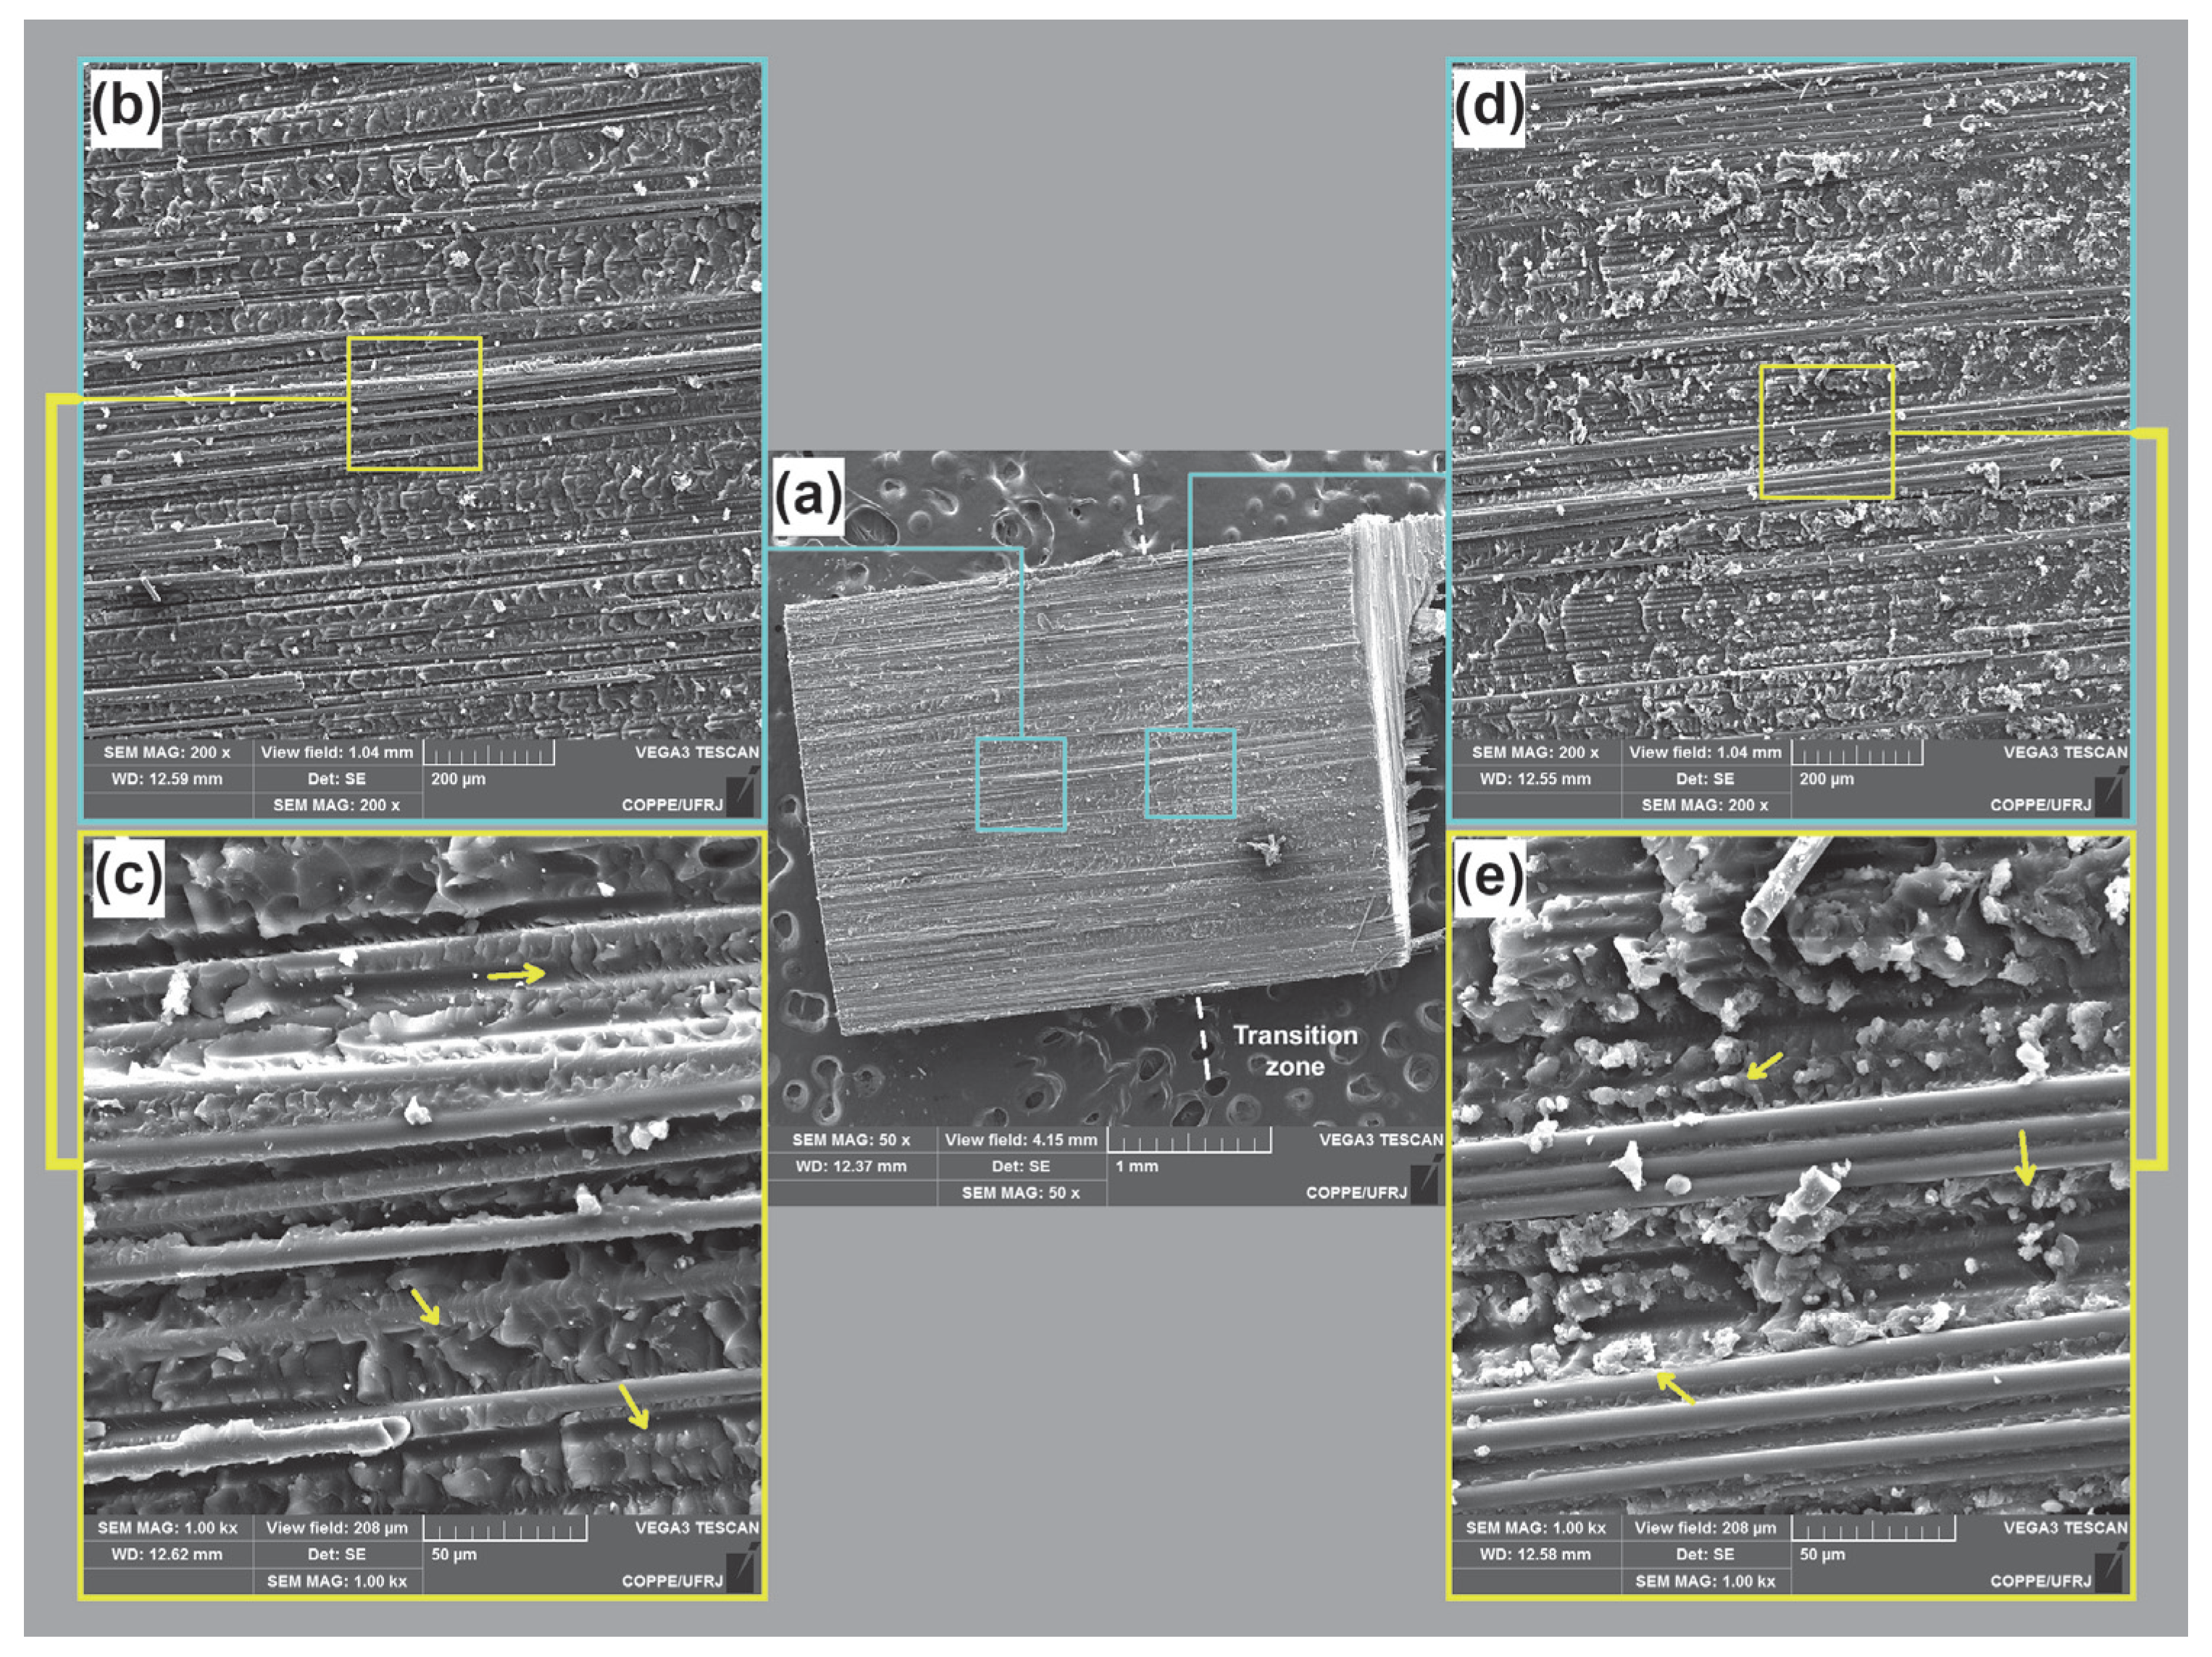
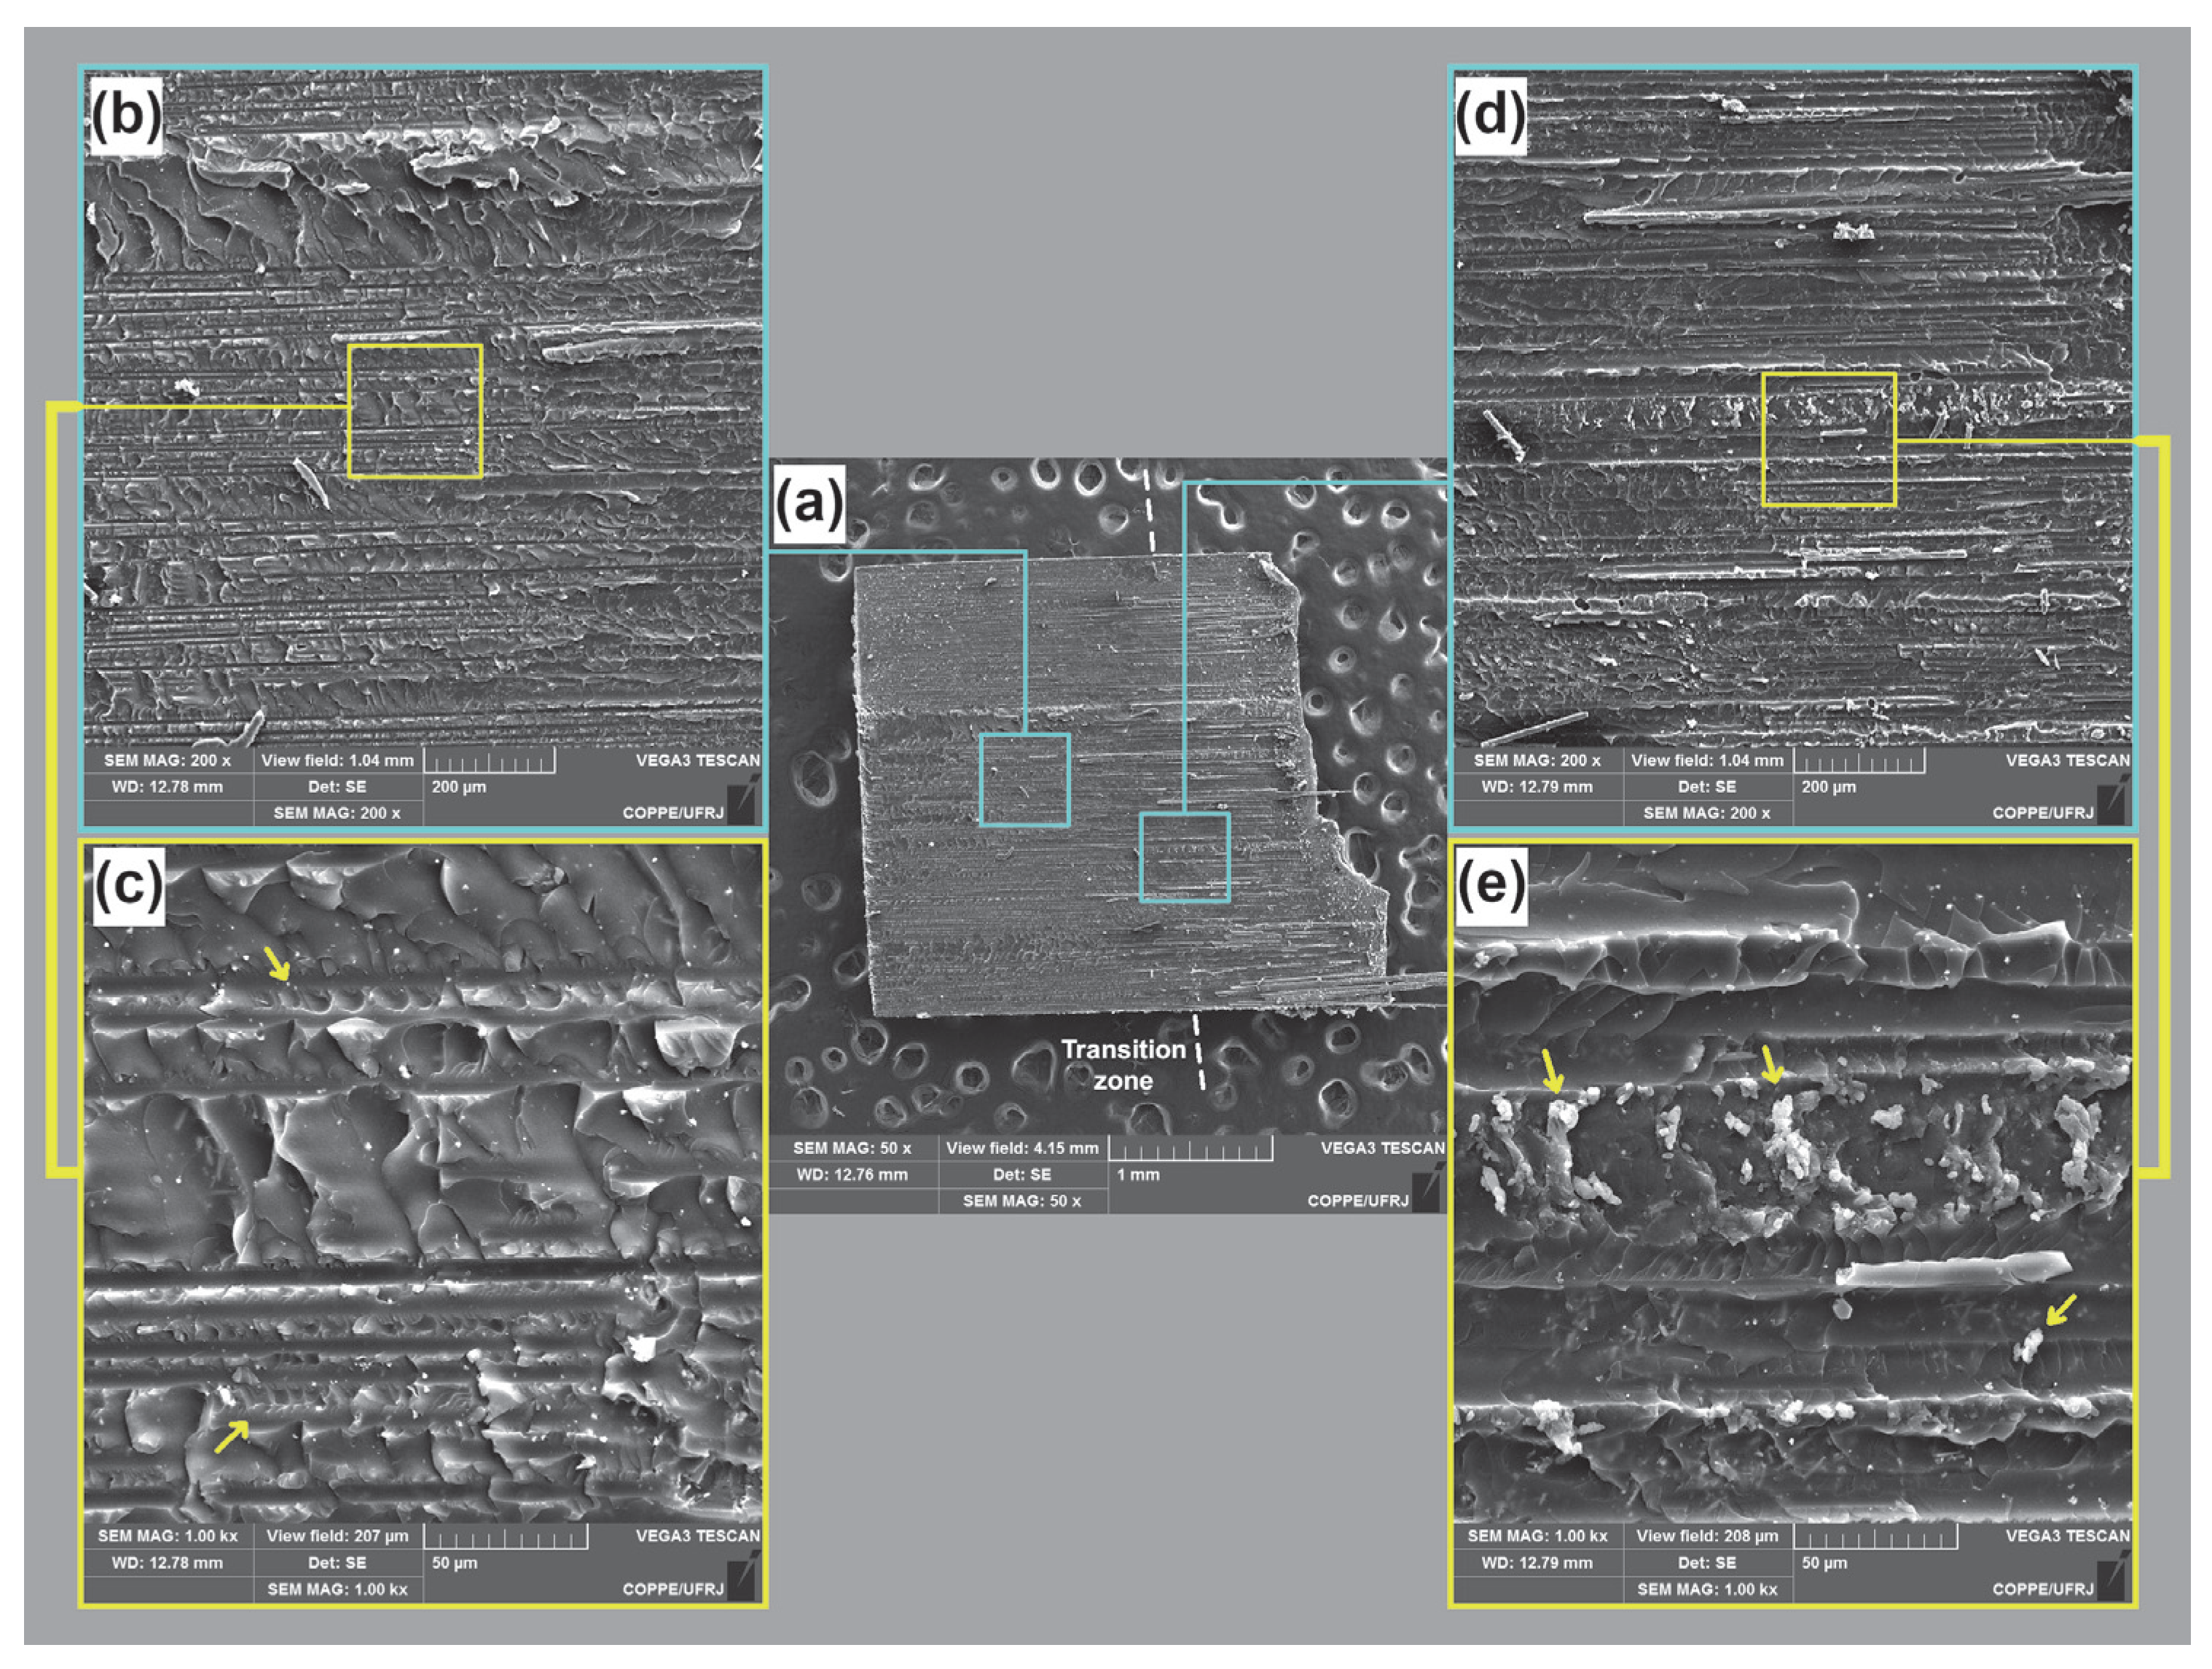
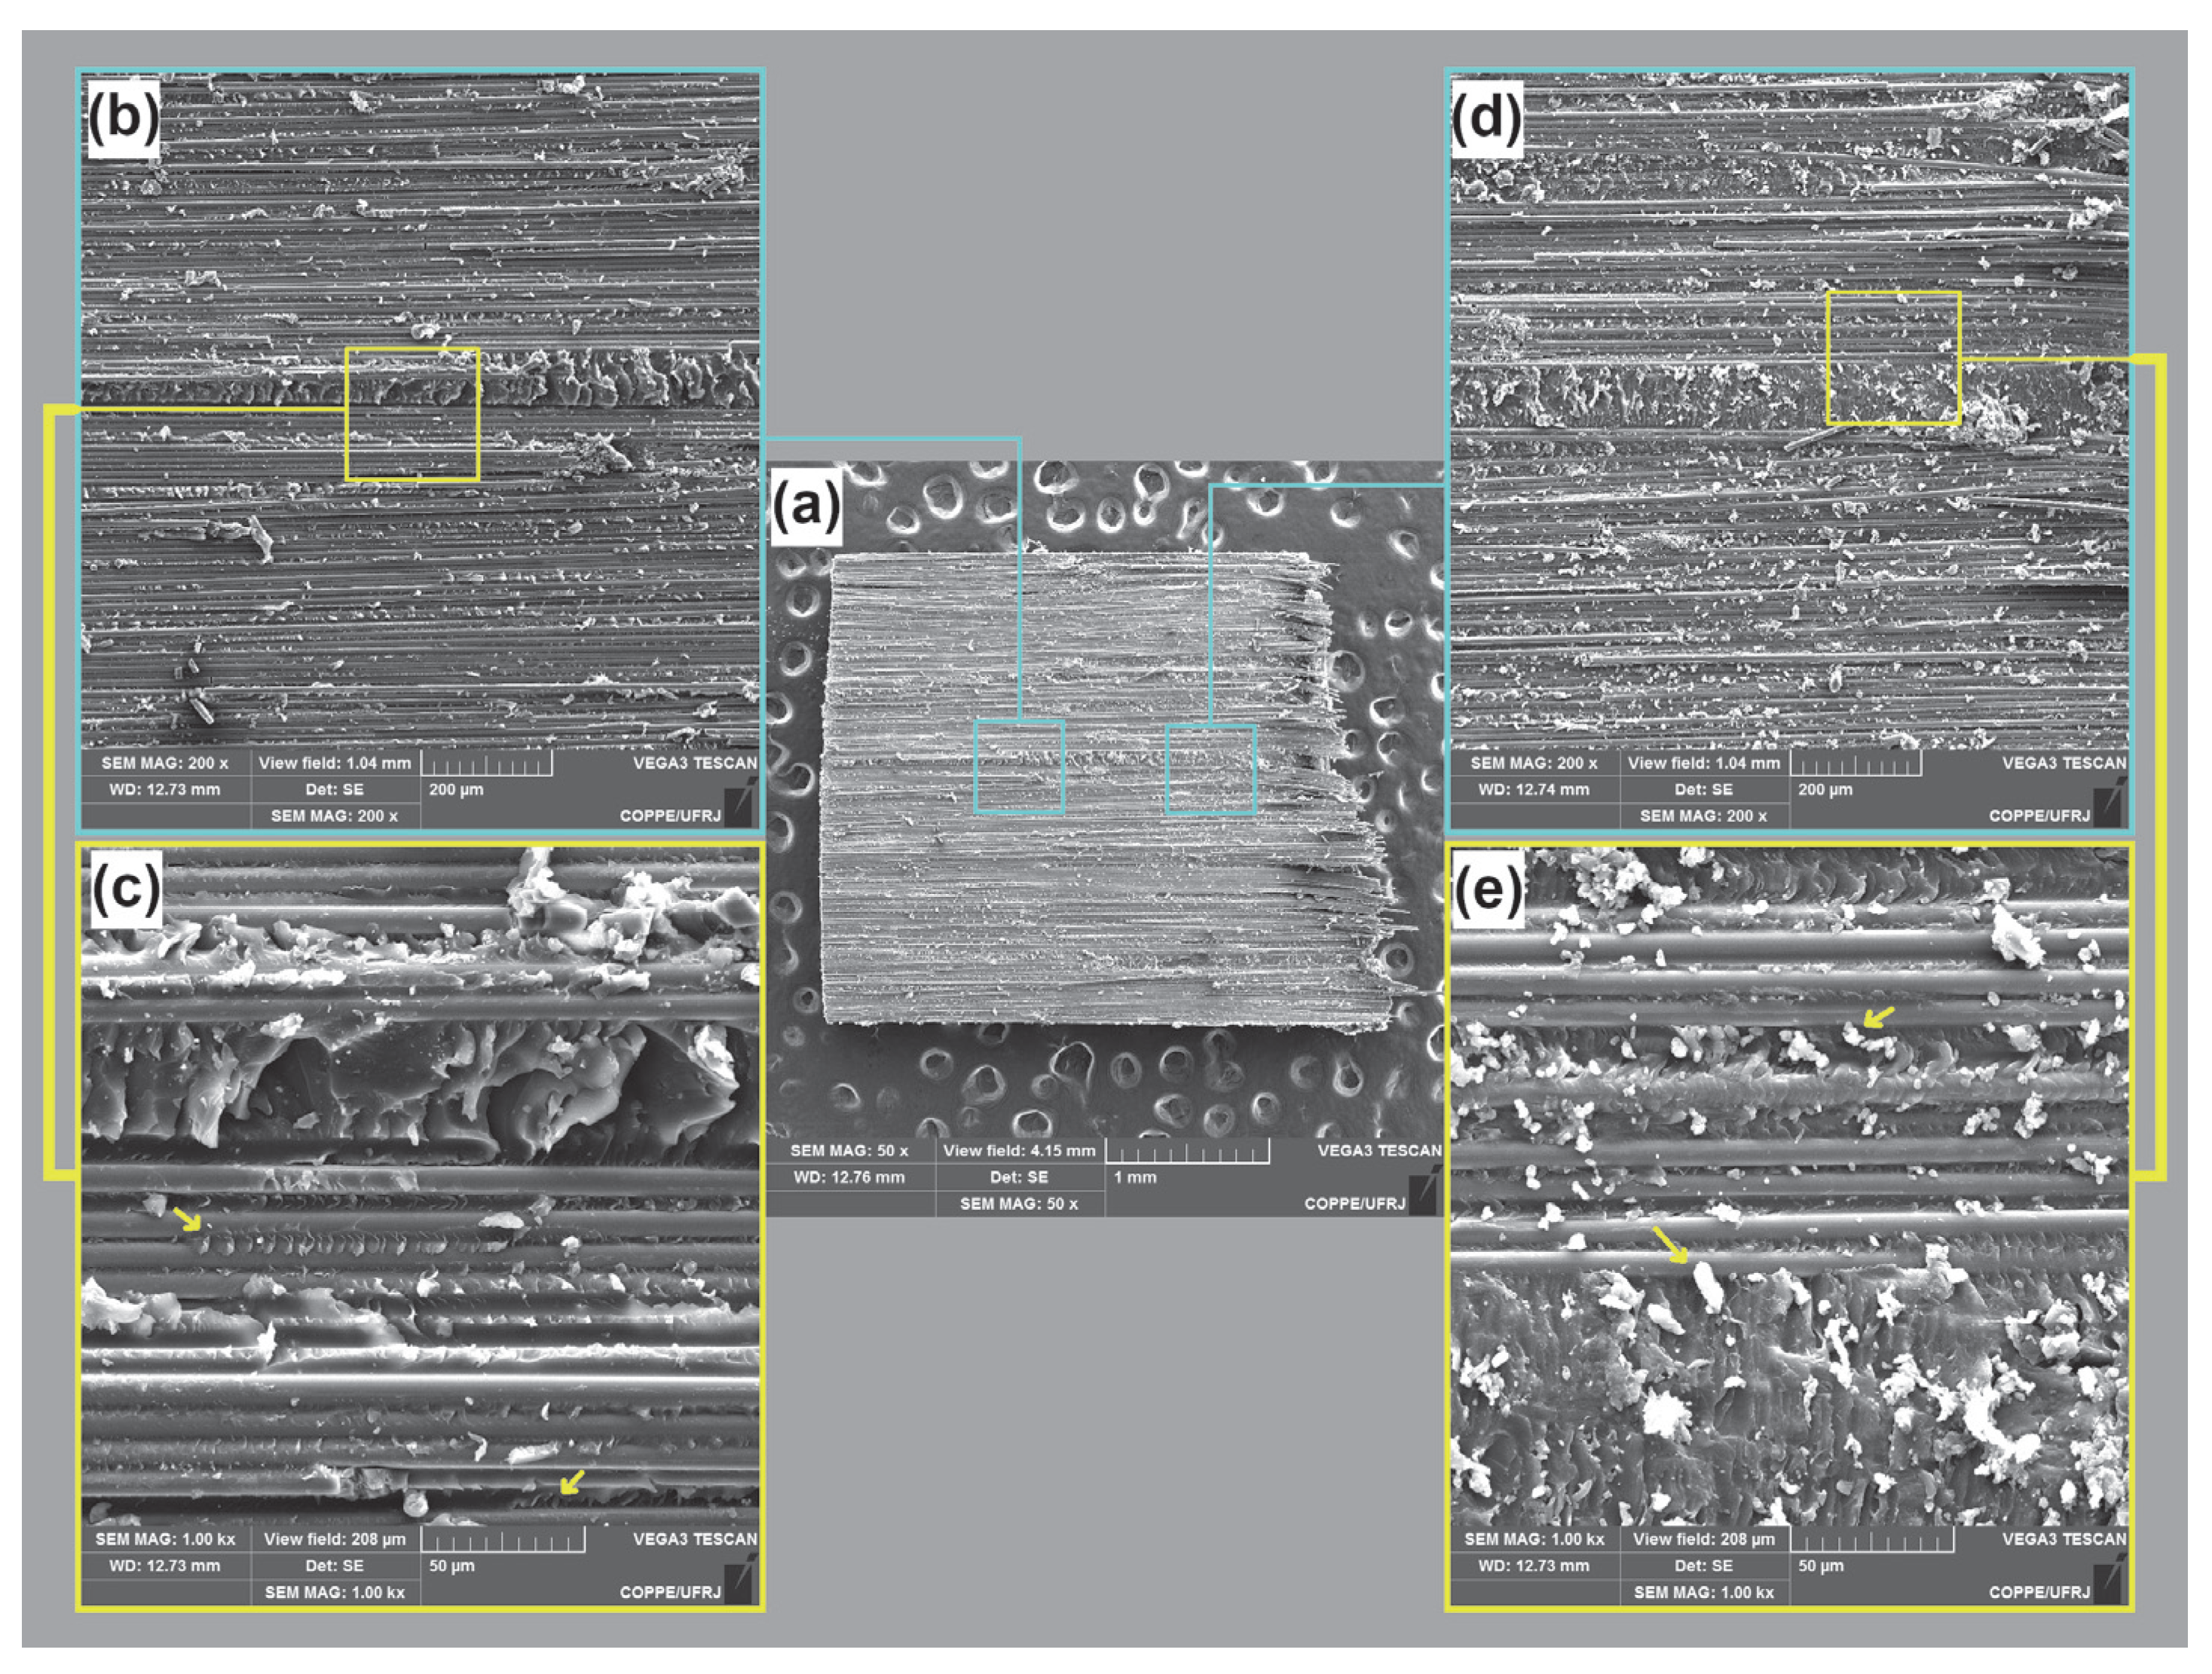
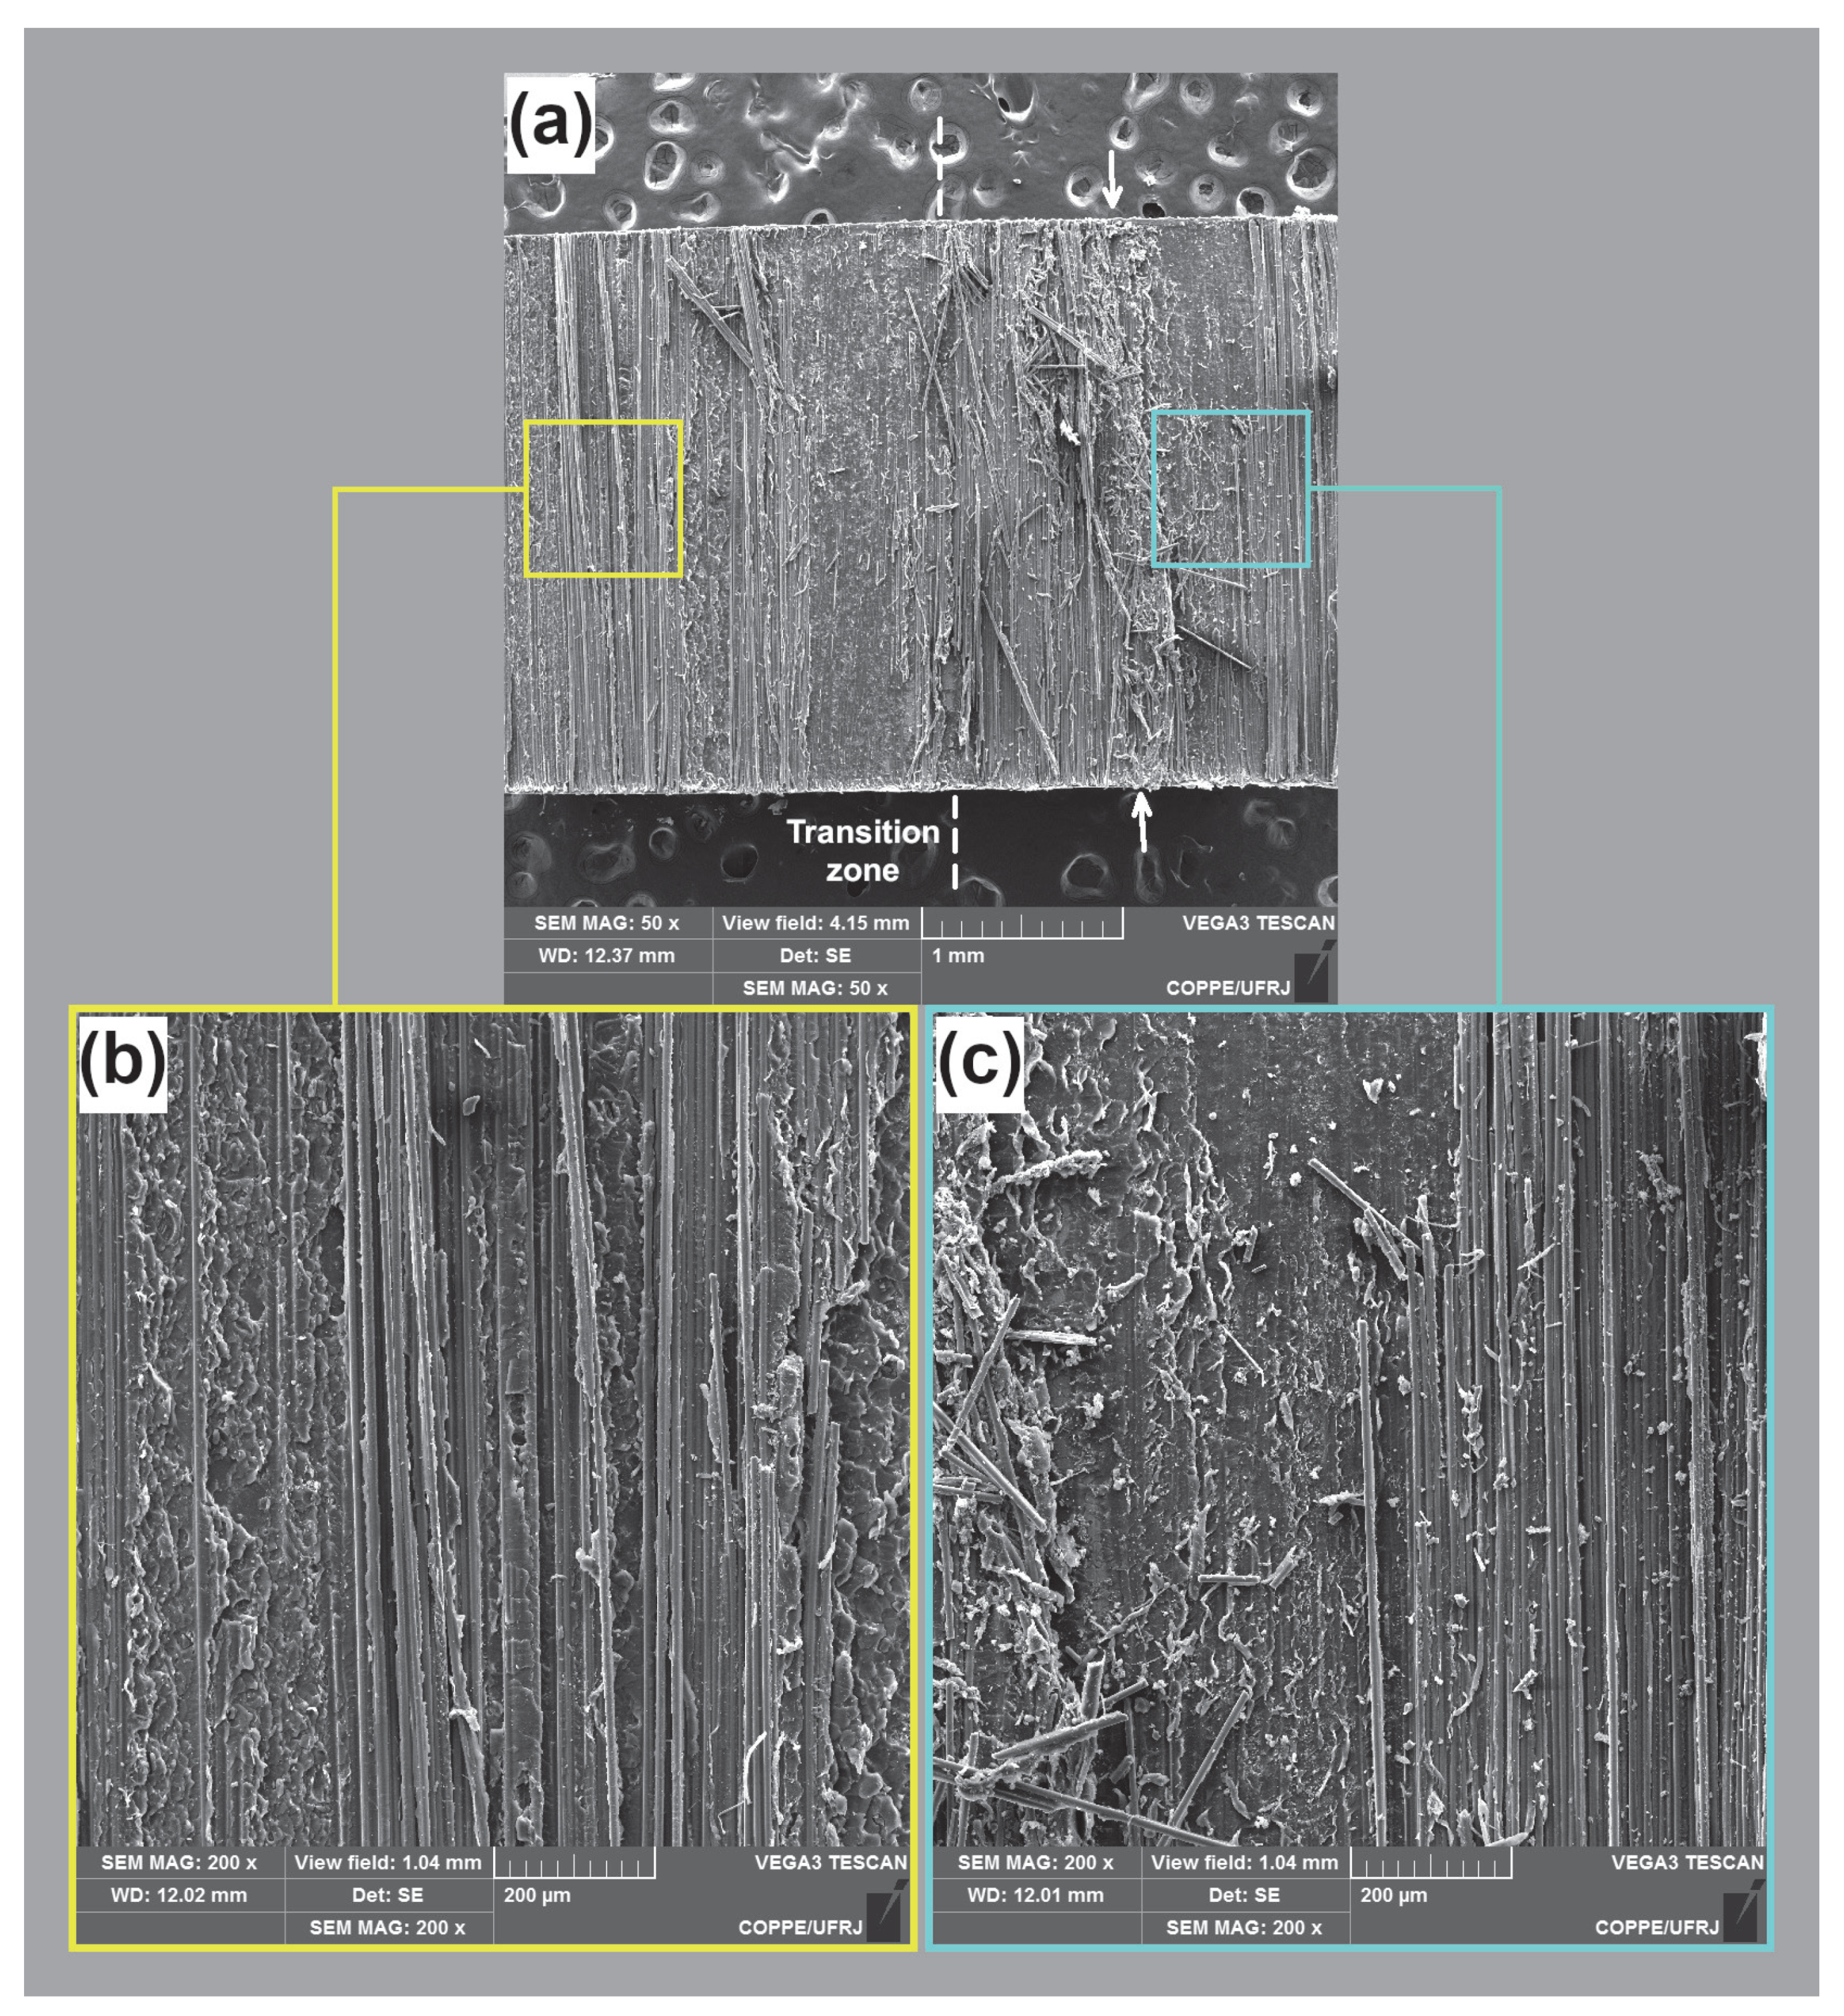
The fracture surfaces of three longitudinal specimens tested at 0.1, 0.3, and 0.5 are shown in Figure 9, Figure 10 and Figure 11, respectively. Two different regions can be observed in the three figures at lower magnification (image a), with a more noticeable transition visible in Figure 9 and Figure 10 (highlighted with a dashed line). The final quasi-static fracture can be observed on the left of image a, while the fatigue-related surface is on the right side of the images. The quasi-static surface (images b and c) presented a relatively clean surface with shear cusps, indicated by the arrows in images c. Shear cusps are morphologies that are characteristic of a predominantly mode II quasi-static fracture [54]. The fracture surfaces in Figure 9 and Figure 10 were observed on the surface dominated by the matrix, while Figure 11 presents the fiber-dominated failure surface. The direction of crack propagation can be assessed by the shear cusps’ tilt direction. On the matrix-dominated face, the crack growth direction is the same as the cusp tilts, while on the fiber-dominated face, the crack growth direction is opposite to the cusp tilt direction. The analysis of these fractures indicated that the cracks propagated from the right side to the left, which is consistent with the digital microscope observations during the test. The images in (d) and (e) correspond to that part of the specimen under cyclic shear stresses. The surface is worn and has matrix debris and broken fibers. The arrows in (e) indicate some rudimentary rollers (rounded, deformed shafts of resin) that were observed in the mode II fatigue failure surfaces of fiber-reinforced polymer composites [55].
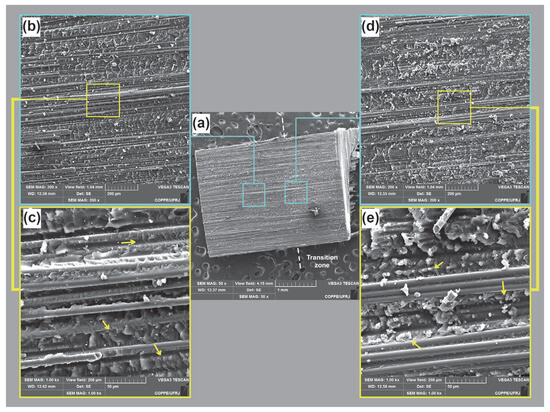
Figure 9.
(a) Fracture surface from layer 3 of a longitudinal specimen (.1, = 23.4 MPa); (b,c) show a region with the final failure and (d,e) show the interlaminar shear fatigue failure. The arrows indicate cusps in (c) and rollers in (e).
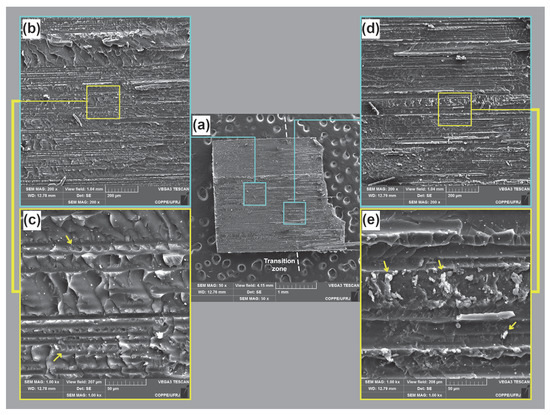
Figure 10.
(a) Fracture surface from layer 3 of a longitudinal specimen (.3, = 18.0 MPa); (b,c) show a region with the final failure and (d,e) show the interlaminar shear fatigue failure. The arrows indicate cusps in (c) and rollers in (e).
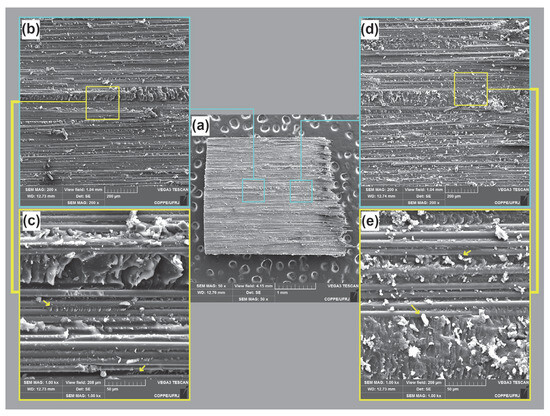
Figure 11.
(a) Fracture surface from layer 3 of a longitudinal specimen (.5, = 15.0 MPa), showing in (b,c) a region with the final failure and (d,e) the interlaminar shear fatigue failure. The arrows indicate cusps in (c) and rollers in (e).
The fracture surface of a transversal specimen tested at 0.3 and = 18.0 MPa is shown in Figure 12. The fracture exhibited two zones with different damage morphologies. The final quasi-static fracture is shown at the left of Figure 12a and is enlarged in Figure 12b. The damage associated with the fatigue processes can be observed on the right of Figure 12a and in detail in Figure 12c. The fracture surface presented ply-splitting behavior coinciding with the intralaminar crack in Figure 8b,f. The final fracture (left area) showed some debris that was distributed randomly and fibers that were partially detached. None of the analyzed particles in this region presented a roller morphology. The fatigue zone (right area) showed a worn surface that included particles and broken fibers dispersed along the surface. Most of the matrix particles were longer than those observed in the longitudinal specimens. Various particles showed the morphology of rollers. The surface characteristics coincided with a predominantly mode II fracture [55].
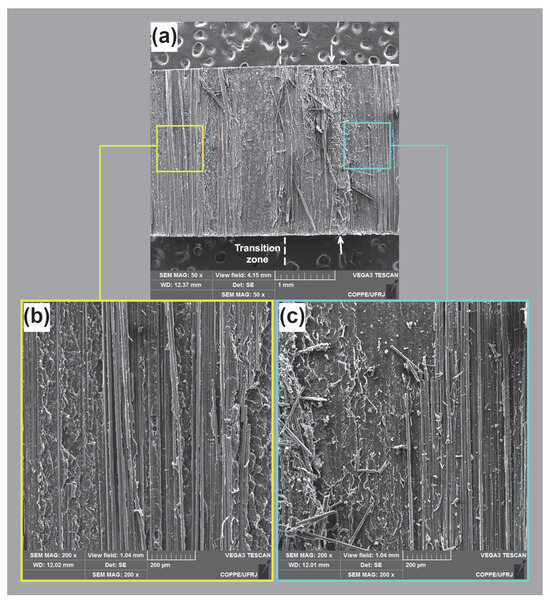
Figure 12.
(a) Fracture surface from layer 3 of a transversal specimen (.3 = 18.0 MPa), showing in (b) a region with the final failure and (c) the interlaminar shear fatigue failure.
There are differences in the appearance of the fibers on both sides of the analyzed area. Those at the side dominated by the fatigue process were cleaner than the fibers corresponding to the final fracture. Other researchers observed this behavior with compressive and tensile fatigue [56,57]. They explained that cyclic loading leads to preferential damage at the fiber/matrix interfaces, producing a cleaner surface on the fibers.
The initiation region of the dominant delamination behavior could not be found during our analysis of the fatigue surfaces. It is important to highlight that the SBS specimens showed damage morphologies that present the characteristics of mode II fatigue and fracture in composites. Although the SBS test presents several limitations [22,34], it does produce, at least predominantly, interlaminar shear fatigue damage.
4. Conclusions
The noticeable effects of anisotropy and mean shear stress in short-beam shear (SBS) fatigue were evidenced, as well as the dependence of scatter on loading conditions and specimen orientation. In comparison, transversal specimens exhibited a lower performance than longitudinal ones, accompanied by more significant scatter. These tendencies were confirmed in the constant life diagrams (CLDs) constructed for SBS stresses.
Regarding the mean stress effect, = 0.1 was the most severe condition, leading to the shortest time-to-failure. In contrast, = 0.5 was the least severe condition. = 0.3 presented intermediate values of fatigue life. Nonetheless, this condition produced steeper S-N curves, indicating that the combined effect of mean shear stress and shear stress amplitude led to a higher rate of damage accumulation.
The fractographic analysis confirmed the Mode II damage dominance hypothesis, validating the test methodology employed. Although it was not possible to identify the nucleation region, the delamination growth direction analysis matched the macroscopic observations on the specimen’s surface during the test.
Supplementary Materials
The following supporting information can be downloaded at: https://www.mdpi.com/article/10.3390/fib13060077/s1: Equations of alternative models considered for building S-N curves. Table S1: Mean and standard deviation (Std. dev.) of fatigue life values for each orientation, , and level. Table S2: D values from Mandell-Meier, Appel-Olthoff and Bach models. Table S3: Fitting parameters for the NLD and ASTM models. Table S4: Fitting parameters for the Whitney model. Table S5: Root mean square error for for deterministic models. Table S6: Root mean square error for for statistical models.
Author Contributions
D.G.C.: Software, validation, formal analysis, investigation, data curation, writing—original draft, writing—review and editing, and visualization. H.G.K.: Conceptualization, methodology, validation, formal analysis, investigation, resources, data curation, writing—original draft, writing—review and editing, visualization, supervision, project administration, and funding acquisition. J.E.P.I.: Conceptualization, methodology, validation, formal analysis, investigation, resources, writing—original draft, writing—review and editing, visualization, supervision, project administration, and funding acquisition. E.M.C.: Conceptualization, resources, writing—original draft, and funding acquisition. All authors have read and agreed to the published version of the manuscript.
Funding
This study was financed in part by the Coordenação de Aperfeiçoamento de Pessoal de Nível Superior-Brasil (CAPES)-Finance Code 001 and CNPq.
Data Availability Statement
Dataset available on request from the authors.
Acknowledgments
The authors wish to thank CONICET for their permanent support, and to Eduardo G. Benotti (GMF-LPM) for his aid in the test device’s construction.
Conflicts of Interest
The authors declare no conflicts of interest.
Abbreviations
The following abbreviations are used in this manuscript:
| exponent in Basquin’s relation | |
| b | specimen width |
| CLD | constant life diagram |
| E | tensile modulus of elasticity |
| FML | fiber metal laminate |
| quasi-static short-beam strength | |
| ultimate tensile strength | |
| tensile yield stress | |
| G | exponent in the Sendeckyj model |
| GFRP | glass fiber-reinforced polymer |
| t | specimen thickness |
| l | specimen length |
| N | number of cycles |
| Nf | number of cycles at failure or SBS fatigue life of a specimen |
| P | force |
| P(i) | force at ith data point observed during the fatigue test |
| shear stress ratio | |
| SBS | short-beam shear. |
| probability of survival after N cycles | |
| shape factor in Weibull distribution | |
| scale factor in Weibull distribution | |
| normal stress | |
| shear stress amplitude or SBS amplitude | |
| SBS stress value observed at ith data point in one cycle | |
| maximum SBS stress value observed in one cycle | |
| minimum SBS stress value observed in one cycle | |
| parameter of Basquin relation for shear stresses |
References
- Vlot, A.; Gunnink, J.W. (Eds.) Fibre Metal Laminates, An Introduction, 1st ed.; Springer Science + Business Media: Dordrecht, The Netherlands, 2001; ISBN 978-1-4020-0391-2. [Google Scholar] [CrossRef]
- Bieniaś, J.; Dadej, K.; Surowska, B. Interlaminar Fracture Toughness of Glass and Carbon Reinforced Multidirectional Fiber Metal Laminates. Eng. Fract. Mech. 2017, 175, 127–145. [Google Scholar] [CrossRef]
- Giallanza, A.; Parrinello, F.; Ruggiero, V.; Marannano, G. Fatigue Crack Growth of New FML Composites for Light Ship Buildings under Predominant Mode II Loading Condition. Int. J. Interact. Des. Manuf. 2020, 14, 77–87. [Google Scholar] [CrossRef]
- Asghar, W.; Nasir, M.A.; Qayyum, F.; Shah, M.; Azeem, M.; Nauman, S.; Khushnood, S. Investigation of Fatigue Crack Growth Rate in CARALL, ARALL and GLARE. Fatigue Fract. Eng. Mater. Struct. 2017, 40, 1086–1100. [Google Scholar] [CrossRef]
- Castrodeza, E.M.; Bastian, F.L.; Perez Ipiña, J.E. Fracture Toughness of Unidirectional Fiber–Metal Laminates: Crack Orientation Effect. Eng. Fract. Mech. 2005, 72, 2268–2279. [Google Scholar] [CrossRef]
- Jones, R.M. Macromechanical Behavior of a Laminate. In Mechanics of Composite Materials; Taylor & Francis: Philadelphia, PA, USA, 1999; pp. 260–276. [Google Scholar]
- O’Brien, K. Fracture Mechanics of Composite Delamination. In ASM Handbook Volume 21: Composites; ASM International: Materials Park, OH, USA, 2001; p. 241. ISBN 978-0-87170-703-1. [Google Scholar]
- Al-Azzawi, A.S.; Kawashita, L.F.; Featherston, C.A. Predicting Interlaminar Damage Behaviour of Fibre-Metal Laminates Containing Adhesive Joints under Bending Loads. J. Reinf. Plast. Compos. 2021, 41, 073168442110517. [Google Scholar] [CrossRef]
- Alderliesten, R.C. Fatigue. In Fiber Metal Laminates, An Introduction; Vlot, A., Gunnink, J.W., Eds.; Springer Science + Business Media: Berlin/Heidelberg, Germany, 2001; pp. 155–171. [Google Scholar]
- Chen, Y.; Wang, Y.; Wang, H. Research Progress on Interlaminar Failure Behavior of Fiber Metal Laminates. Adv. Polym. Technol. 2020, 2020, 3097839. [Google Scholar] [CrossRef]
- Alderliesten, R. Fatigue and Fracture of Fibre Metal Laminates; Springer: Berlin/Heidelberg, Germany, 2017; ISBN 978-3-319-56226-1. [Google Scholar]
- Süsler, S.; Bora, M.Ö.; Uçan, C.; Türkmen, H.S. The Effect of Surface Treatments on the Interlaminar Shear Failure of GLARE Laminate Included AA6061-T6 Layers by Comparing Failure Characteristics. Compos. Interfaces 2023, 30, 627–643. [Google Scholar] [CrossRef]
- Amaral, L.; Zarouchas, D.; Alderliesten, R.; Benedictus, R. Energy Dissipation in Mode II Fatigue Crack Growth. Eng. Fract. Mech. 2017, 173, 41–54. [Google Scholar] [CrossRef]
- Bieniaś, J.; Dadej, K. Fatigue Delamination Growth of Carbon and Glass Reinforced Fiber Metal Laminates in Fracture Mode II. Int. J. Fatigue 2020, 130, 105267. [Google Scholar] [CrossRef]
- Lessard, L.B.; Eilers, O.P.; Shokrieh, M.M. Modification of the Three-Rail Shear Test for Composite Materials under Static and Fatigue Loading. ASTM Int. 1997, 1242, 217–233. [Google Scholar] [CrossRef]
- ASTM D4255-20; Test Method for In-Plane Shear Properties of Polymer Matrix Composite Materials by the Rail Shear Method. ASTM International: Conshohocken, PA, USA, 2020.
- ASTM D3518-18; Test Method for In-Plane Shear Response of Polymer Matrix Composite Materials by Tensile Test of a ±45 Laminate. ASTM International: Conshohocken, PA, USA, 2018.
- ASTM D5379-19; Test Method for Shear Properties of Composite Materials by the V-Notched Beam Method. ASTM International: Conshohocken, PA, USA, 2019.
- May, M.; Hallett, S.R. An Assessment of Through-Thickness Shear Tests for Initiation of Fatigue Failure. Compos. Part A Appl. Sci. Manuf. 2010, 41, 1570–1578. [Google Scholar] [CrossRef]
- ASTM D2344-22; Test Method for Short-Beam Strength of Polymer Matrix Composite Materials and Their Laminates. ASTM International: Conshohocken, PA, USA, 2022; pp. 1–8.
- Kotik, H.; Ipiña, J.P. Frequency Effect in Short-Beam Shear Fatigue of a Glass Fiber Reinforced Polyester Composite. Int. J. Fatigue 2016, 90, 116–124. [Google Scholar] [CrossRef]
- Kotik, H.G.; Ipiña, J.E.P. Suggested Modifications of the ASTM D2344-16 Short-Beam Shear Test Method to Be Applied to Fiber Metal Laminates. J. Test. Eval. 2019, 49, 1213–1221. [Google Scholar] [CrossRef]
- Liu, C.; Du, D.; Li, H.; Hu, Y.; Xu, Y.; Tian, J.; Tao, G.; Tao, J. Interlaminar Failure Behavior of GLARE Laminates under Short-Beam Three-Point-Bending Load. Compos. Part B Eng. 2016, 97, 361–367. [Google Scholar] [CrossRef]
- Kulkarni, R.R.; Chawla, K.K.; Vaidya, U.K.; Koopman, M.C.; Eberhardt, A.W. Characterization of Long Fiber Thermoplastic/Metal Laminates. J. Mater. Sci. 2008, 43, 4391–4398. [Google Scholar] [CrossRef]
- Majerski, K.; Surowska, B.; Bienias, J. The Comparison of Effects of Hygrothermal Conditioning on Mechanical Properties of Fibre Metal Laminates and Fibre Reinforced Polymers. Compos. Part B Eng. 2018, 142, 108–116. [Google Scholar] [CrossRef]
- Bellini, C.; Di Cocco, V.; Iacoviello, F.; Sorrentino, L. Comparison between Long and Short Beam Flexure of a Carbon Fibre Based FML. Procedia Struct. Integr. 2020, 26, 120–128. [Google Scholar] [CrossRef]
- Kubit, A.; Trzepiecinski, T.; Kłonica, M.; Hebda, M.; Pytel, M. The Influence of Temperature Gradient Thermal Shock Cycles on the Interlaminar Shear Strength of Fibre Metal Laminate Composite Determined by the Short Beam Test. Compos. Part B Eng. 2019, 176, 107217. [Google Scholar] [CrossRef]
- Gupta, R.K.; Mahato, A.; Bhattacharya, A. Damage Analysis of Carbon Fiber Reinforced Aluminum Laminate under Short Beam and Single Edge Notch Beam Bend Test. Int. J. Mech. Sci. 2021, 198, 106393. [Google Scholar] [CrossRef]
- Bellini, C.; Di Cocco, V.; Iacoviello, F.; Sorrentino, L. Influence of Structural Characteristics on the Interlaminar Shear Strength of CFRP/Al Fibre Metal Laminates. Procedia Struct. Integr. 2019, 18, 373–378. [Google Scholar] [CrossRef]
- Khalid, M.Y.; Arif, Z.U.; Al Rashid, A.; Shahid, M.I.; Ahmed, W.; Tariq, A.F.; Abbas, Z. Interlaminar Shear Strength (ILSS) Characterization of Fiber Metal Laminates (FMLs) Manufactured through VARTM Process. Forces Mech. 2021, 4, 100038. [Google Scholar] [CrossRef]
- Bieniaś, J.; Jakubczak, P.; Droździel, M.; Surowska, B. Interlaminar Shear Strength and Failure Analysis of Aluminium-Carbon Laminates with a Glass Fiber Interlayer after Moisture Absorption. Materials 2020, 13, 2999. [Google Scholar] [CrossRef] [PubMed]
- Hamill, L.; Hofmann, D.C.; Nutt, S. Galvanic Corrosion and Mechanical Behavior of Fiber Metal Laminates of Metallic Glass and Carbon Fiber Composites. Adv. Eng. Mater. 2018, 20, 1700711. [Google Scholar] [CrossRef]
- Zheng, X.; Li, Y.; Luo, P. Preparation and Mechanical Properties of Light-Weight Fiber Metal Laminates Based on Magnesium-Rare Earth Alloy. Mater. Today Commun. 2022, 33, 104822. [Google Scholar] [CrossRef]
- Kotik, H.G.; Ipiña, J.P. Short-Beam Shear Fatigue Behavior of Fiber Metal Laminate (Glare). Int. J. Fatigue 2017, 95, 236–242. [Google Scholar] [CrossRef]
- Surowska, B.; Dadej, K.; Jakubczak, P.; Bieniaś, J. Short-Beam Shear Fatigue Life Assessment of Thermally Cycled Carbon–Aluminium Laminates with Protective Glass Interlayers. Arch. Civ. Mech. Eng. 2021, 21, 50. [Google Scholar] [CrossRef]
- Harris, B. A Parametric Constant-Life Model for Prediction of the Fatigue Lives of Fibre-Reinforced Plastics. In Fatigue in Composites; Harris, B., Ed.; CRC Press LLC.: Boca Raton, FL, USA; Woodhead Publishing Limited: Cambridge, UK, 2003; pp. 546–568. [Google Scholar]
- Sutherland, H.J.; Mandell, J.F. Optimized Constant-Life Diagram for the Analysis of Fiberglass Composites Used in Wind Turbine Blades. J. Sol. Energy Eng. 2005, 127, 563–569. [Google Scholar] [CrossRef]
- Kawai, M.; Koizumi, M. Nonlinear Constant Fatigue Life Diagrams for Carbon/Epoxy Laminates at Room Temperature. Compos. Part A Appl. Sci. Manuf. 2007, 38, 2342–2353. [Google Scholar] [CrossRef]
- Vassilopoulos, A.P. Introduction to the Fatigue Life Prediction of Composite Materials and Structures: Past, Present and Future Prospects. In Fatigue Life Prediction of Composites and Composite Structures; Vassilopoulos, A.P., Ed.; CRC Press LLC.: Boca Raton, FL, USA; Woodhead Publishing Limited: Great Abington, Cambridge, 2010; pp. 1–38. [Google Scholar]
- Vassilopoulos, A.P.; Keller, T. Fatigue of Fiber-Reinforced Composites; Engineering Materials and Processes; Springer: London, UK, 2011; ISBN 978-1-84996-180-6. [Google Scholar]
- Kotik, H.; Ipiña, J.P. Influence of Unifilo® Ply in the Interlaminar Shear Fatigue Resistance of GFRP. Procedia Mater. Sci. 2015, 8, 139–147. [Google Scholar] [CrossRef]
- Bevan, L.G. Axial and Short Beam Shear Fatigue Properties of Cfrp Laminates. Composites 1977, 8, 227–232. [Google Scholar] [CrossRef]
- Tonatto, M.L.P.; Tarpani, J.R.; Amico, S.C. Short-Beam Shear Fatigue Behavior of Round Curved Pultruded Composite. Mech. Adv. Mater. Struct. 2021, 29, 5579–5587. [Google Scholar] [CrossRef]
- QA Reports No. B0319B-2, B1008B-1, B0904A-3; Structural Laminates Company: New Kensington, PA, USA, 1994.
- Basquin, O. The Exponential Law of Endurance Tests. Am. Soc. Test Mater. 1910, 10, 625–630. [Google Scholar]
- Sendeckyj, G. Fitting Models to Composite Materials Fatigue Data. In Test Methods and Design Allowables for Fibrous Composites; ASTM International: West Conshohocken, PA, USA, 1981; pp. 245–260. [Google Scholar]
- ASTM E739-10; Standard Practice for Statistical Analysis of Linear or Linearized Stress-Life (S-N) and Strain-Life (ε-) Fatigue Data. ASTM International: Conshohocken, PA, USA, 2015; pp. 1–7.
- Whitney, J. Fatigue Characterization of Composite Materials. In ASTM STP 723 Fatigue of Fibrous Composite Materials; ASTM International: West Conshohocken, PA, USA, 1981; pp. 133–152. [Google Scholar]
- Mandell, J.; Meier, U. Effects of Stress Ratio, Frequency, and Loading Time on the Tensile Fatigue of Glass-Reinforced Epoxy. In Long-Term Behavior of Composites STP 813; ASTM International: West Conshohocken, PA, USA, 1983; pp. 55–77. [Google Scholar]
- Kensche, C.W. Fatigue of Materials and Components for Wind Turbine Rotor Blades; European Commission, Directorate-General XII, Science, Research and Development: Brussels, Belgium, 1996; ISBN 92-827-4361-6. [Google Scholar]
- Gao, Q.; Xin, H.; Correia, J.A.; Mosallam, A.S.; Berto, F. Probabilistic Fatigue Life Analysis Considering Mean Stress Effects of Fiber Reinforced Polymer (FRP) Composites. Int. J. Fatigue 2022, 162, 106951. [Google Scholar] [CrossRef]
- Schijve, J. Fatigue and Scatter. In Fatigue of Structures and Materials; Springer: Dordrecht, The Netherlands, 2009; pp. 373–394. [Google Scholar]
- Movahedi-Rad, A.V.; Keller, T.; Vassilopoulos, A.P. Stress Ratio Effect on Tension-Tension Fatigue Behavior of Angle-Ply GFRP Laminates. Int. J. Fatigue 2019, 126, 103–111. [Google Scholar] [CrossRef]
- Greenhalgh, E.S.; Rogers, C.; Robinson, P. Fractographic Observations on Delamination Growth and the Subsequent Migration through the Laminate. Compos. Sci. Technol. 2009, 69, 2345–2351. [Google Scholar] [CrossRef]
- Greenhalgh, E.S. Failure Analysis and Fractography of Polymer Composites, 1st ed.; Woodhead Publishing Limited: Cambridge, UK, 2009; ISBN 978-1-84569-217-9. [Google Scholar]
- Lang, R.W.; Manson, J.A.; Hertzberg, R.W. Mechanisms of Fatigue Fracture in Short Glass Fibre-Reinforced Polymers. J. Mater. Sci. 1987, 22, 4015–4030. [Google Scholar] [CrossRef]
- Gamstedt, E.; Sjögren, B. Micromechanisms in Tension-Compression Fatigue of Composite Laminates Containing Transverse Plies. Compos. Sci. Technol. 1999, 59, 167–178. [Google Scholar] [CrossRef]


Disclaimer/Publisher’s Note: The statements, opinions and data contained in all publications are solely those of the individual author(s) and contributor(s) and not of MDPI and/or the editor(s). MDPI and/or the editor(s) disclaim responsibility for any injury to people or property resulting from any ideas, methods, instructions or products referred to in the content. |
© 2025 by the authors. Licensee MDPI, Basel, Switzerland. This article is an open access article distributed under the terms and conditions of the Creative Commons Attribution (CC BY) license (https://creativecommons.org/licenses/by/4.0/).