Article

Eco-Friendly Extraction of Curcumin from Turmeric and Dyeability of Textile Fibers

by
Vasilica Popescu
1,
Ana-Diana Alexandrescu
1,2,
Gabriel Popescu
3,* and
Viorica Vasilache
4,*
1
Department of Chemical Engineering in Textiles and Leather, “Gheorghe Asachi” Technical University of Iasi, 700050 Iasi, Romania
2
Vasile Pavelcu Special Technological High School, I.C. Bratianu Street, no. 26 A, 700037 Iasi, Romania
3
Department of Mechanical Engineering, Mechatronics and Robotics, “Gheorghe Asachi” Technical University of Iași, 700050 Iasi, Romania
4
Arheoinvest Center, Department of Exact Sciences and Natural Sciences, Interdisciplinary Research Institute, “Alexandru Ioan Cuza” University, 11 Carol I Blvd., 700506 Iasi, Romania
*
Authors to whom correspondence should be addressed.
Fibers 2025, 13(6), 73; https://doi.org/10.3390/fib13060073
Submission received: 17 January 2025 / Revised: 10 May 2025 / Accepted: 28 May 2025 / Published: 4 June 2025

Abstract

:

Highlights

What are the main findings?
  • Degradation of the turmeric matrix by chemical (acids, oxidants, enzymes) or physical (ultrasound, microwaves) agents breaks carbohydrate cross-links, releasing starch, amylose, amylopectin, and consequently curcumin.
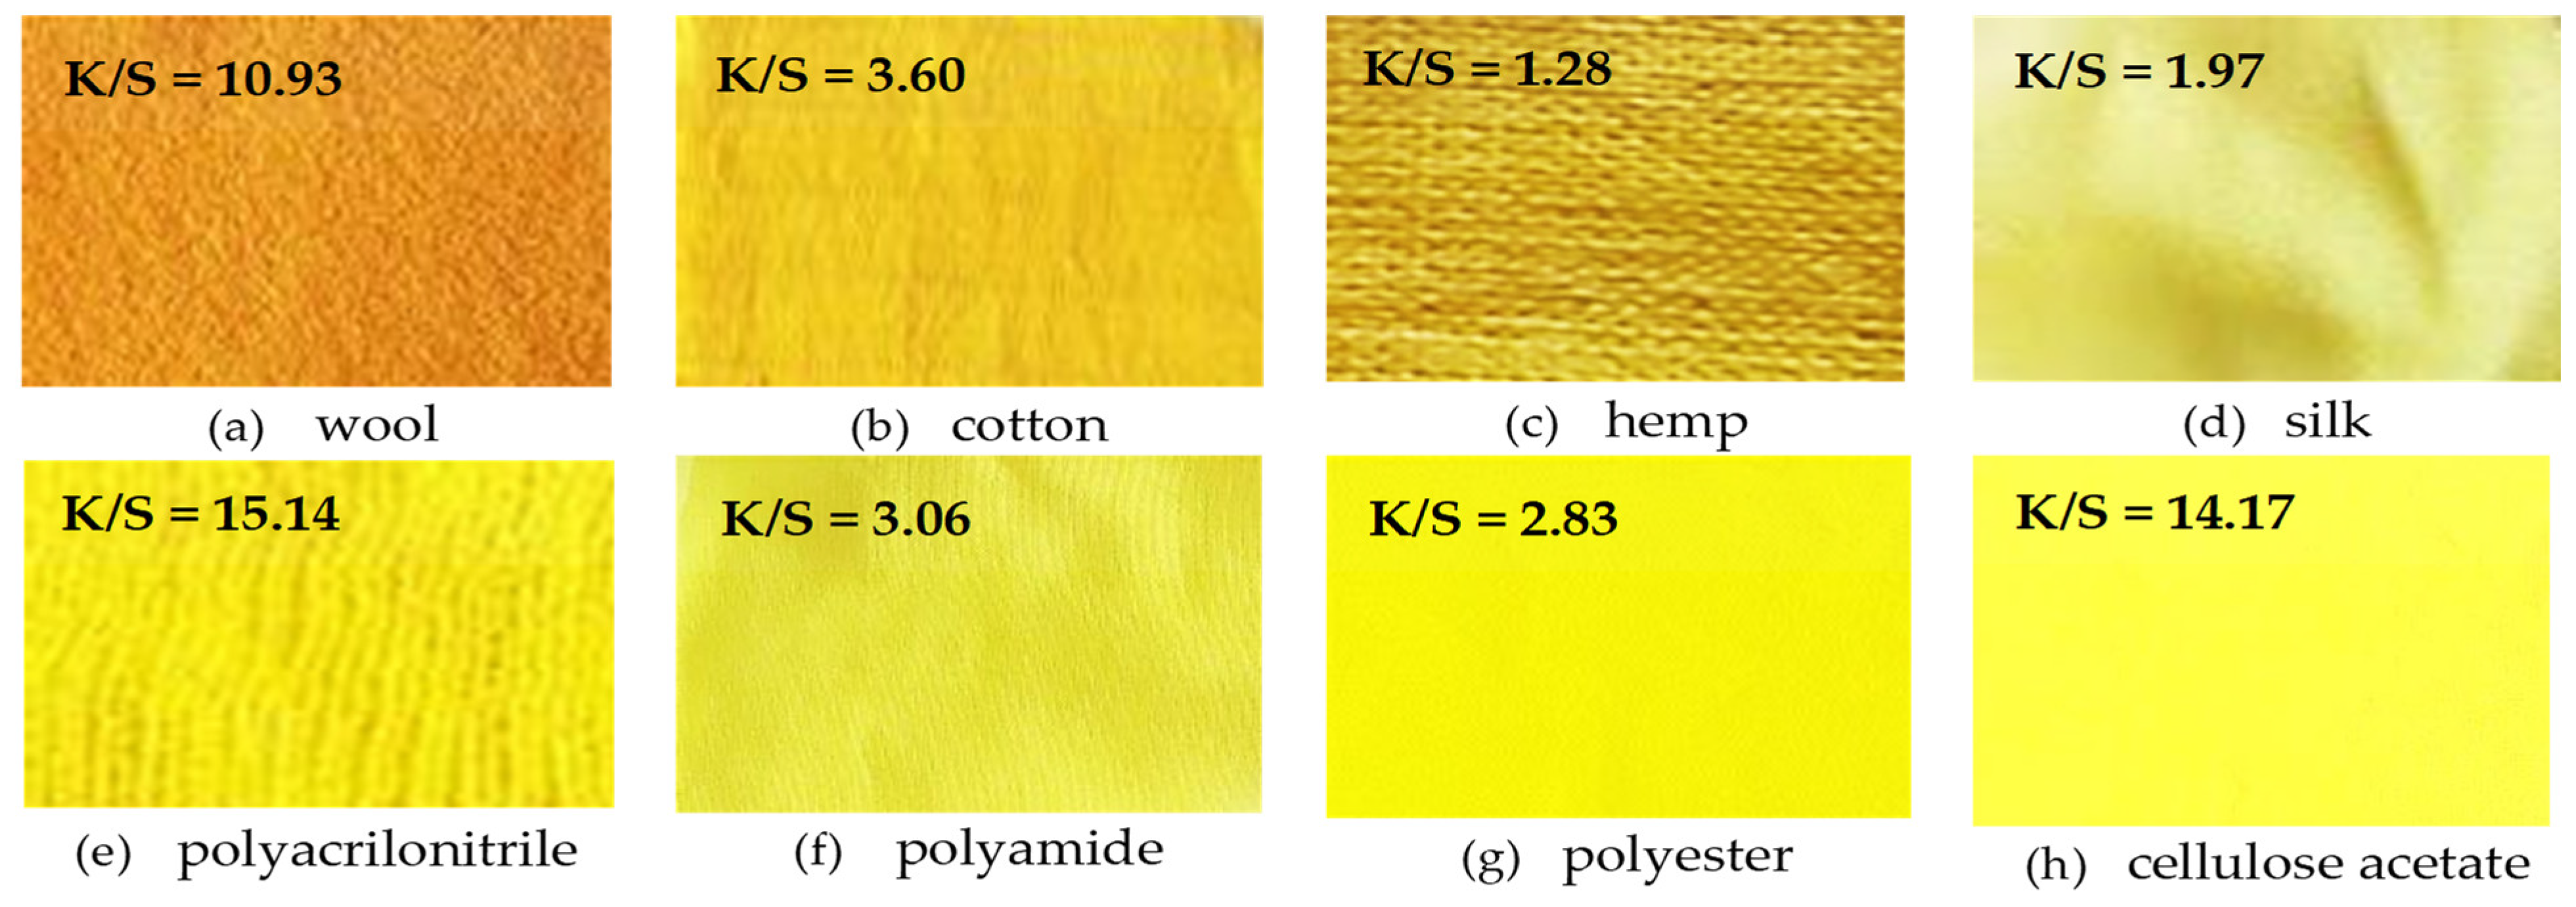
  • Microwave-assisted extraction and dyeing with eco-friendly additives (ethanol, kojic acid) achieve high curcumin uptake, especially on polyacrylonitrile and cellulose acetate fibers, which exhibit excellent color fastness (grade 5).
What is the implication of the main finding?
  • Microwave-assisted extraction is an efficient, eco-friendly method achieving 78.35 ± 2.62% curcumin recovery, suitable for sustainable natural dyeing.
  • The strong affinity and durability of curcumin on synthetic fibers (fastness grade 5) suggest hydrophobic interactions and microwave effects enhance dyeing performance and color retention.

Abstract

Classical and modern methods are used to release curcumin by degrading the polysaccharides found in the turmeric powder matrix. Classical methods use chemicals as acids (HCl, H2SO4, CH3COOH), oxidants (H2O2, kojic acid), and enzymes (amylase type) that can degrade amylose and amylopectin from starch. The modern applied methods consist of the degradation of the polysaccharides in the turmeric powder during eco-friendly processes assisted by ultrasound or microwaves. The extraction medium can consist of only water, water with a solvent, and/or an oxidizing agent. The presence of curcumin in turmeric powder is confirmed by FTIR analysis. The UV–VIS analysis of the extracts allows the determination of the efficiency of modern extraction processes. The release of curcumin from turmeric is highlighted quantitatively by colorimetric measurements for the obtained extracts, using a portable DataColor spectrophotometer. The comparison of the results leads to the conclusion that microwave-assisted extractions are the most effective. These extracts are able to dye many types of textile fibers: wool, cotton, hemp, silk, polyacrylonitrile, polyamide, polyester, and cellulose acetate. CIELab and color strength (K/S) measurements indicate that the most intense yellow colors are obtained on polyacrylonitrile (b* = 86.32, K/S = 15.14) and on cellulose acetate (b* = 90.40, K/S = 14.17).

1. Introduction

The source of curcumin is the rhizomes of the plant, which is included in the class Liliopsida, subclass Commelinids, order Zingiberales, Family Zingiberacese, Genus Curcuma, and Species Curcuma longa [1].
Turmeric rhizomes and turmeric powder obtained by processing the rhizomes are used in the food, pharmaceutical, and medicine industries, due to their bioactive properties [2]. The intense yellow color of turmeric widens its scope of application in the textile industry to ensure dyeing with curcumin, which is considered a natural dye named according to the Color Index as C.I. Natural Yellow 3 [3,4].
Turmeric contains a mixture of carbohydrates (69.4%), proteins (6.3%), fats (5.1%), minerals (3.5%), 3.5% essential oil, 2.5 to 6% curcuminoids, and 5.7% oleoresin [5,6]. The curcuminoids present in turmeric are demethoxycurcumin (curcumin II), bisdemetho-xicurcumin (curcumin III), and cyclocurcumin. The main characteristics of curcumin are the following: it is an orange-yellow crystalline powder, insoluble in water but soluble in ethanol, ketones, acetic acid, and chloroform. Solubility depends on the nature and concentration of the solvent used. Solvents also influence the maximum absorption wavelength of curcumin, as follows: between 420–425 nm in ethanol, at 430 nm in methanol, or between 415–420 nm in acetone [7,8].
The yellow-orange color of curcumin is influenced by the pH of the liquid medium, being bright yellow at pHs between 2.5–7 and reddish at pH > 7, due to degradation to ferulic acid, a reddish compound [8].
The fluorescence of curcumin depends on the wavelength at which the emission was made and on the nature of the solvent used for solubilization; fluorescence transmission is recorded at different wavelengths, λmax [8,9,10]: (a) 549 nm in the presence of ethanol; (b) 524 nm with acetonitrile; (c) 557 nm for Triton X-100 micellar solution; (d) 460 or 488 nm for toluene. Upon irradiation at λmax > 400 nm, curcumin produces simplex oxygen (in toluene or acetonitrile) and photogenerates superoxide (in toluene and ethanol).
Curcumin, this valuable component of turmeric, must be extracted from the base matrix in order to be used in dyeing processes in the textile industry. The release of curcumin can be achieved by the degradation of carbohydrates or by the dissolution of fats.
The carbohydrates in turmeric are actually polysaccharides of the amylose and amylopectin type present in starch. Amylose is a linear polysaccharide in which α-1,4 glycosidic bonds link the glucose molecules to each other. In contrast, amylopectin is a branched polysaccharide based on α-1,6 glycosidic bonds in the branching points and α-1,4 bonds in the linear portions [10,11,12,13]. The degradation of the two polymers consists of breaking these glycosidic bonds during acid, alkaline, or enzymatic hydrolysis [10,11,12,13,14]. Instead, the processes assisted by microwaves, ultrasound, or supercritical fluid release curcumin by dissolving fats, curcumin and/or by destroying the architectural structure of turmeric caused by physical stimuli such as ultrasonic waves or electromagnetic waves [15,16,17,18,19].
Considering the presentation of the dye source, the literature exhibits the following techniques for the extraction of natural dyes from vegetable sources [3,4,14,15,16,17,18,19]: fermentation; squeeze; cold aqueous extraction; hot aqueous extraction; extraction in alkali; acid extraction; extraction assisted by enzymes; solvent extraction; extraction in the presence of microwaves; extraction in the presence of ultrasound; super critical fluid extraction. Taking into account the frequency of their use and the simplicity/complexity of the extraction mechanism, these methods could be grouped into two categories: (a) conventional methods, easy to perform using simple extraction agents; (b) non-conventional/modern methods, more complex and with a very high extraction efficiency [20,21,22,23].
Curcumin extraction methods can be characterized as follows:
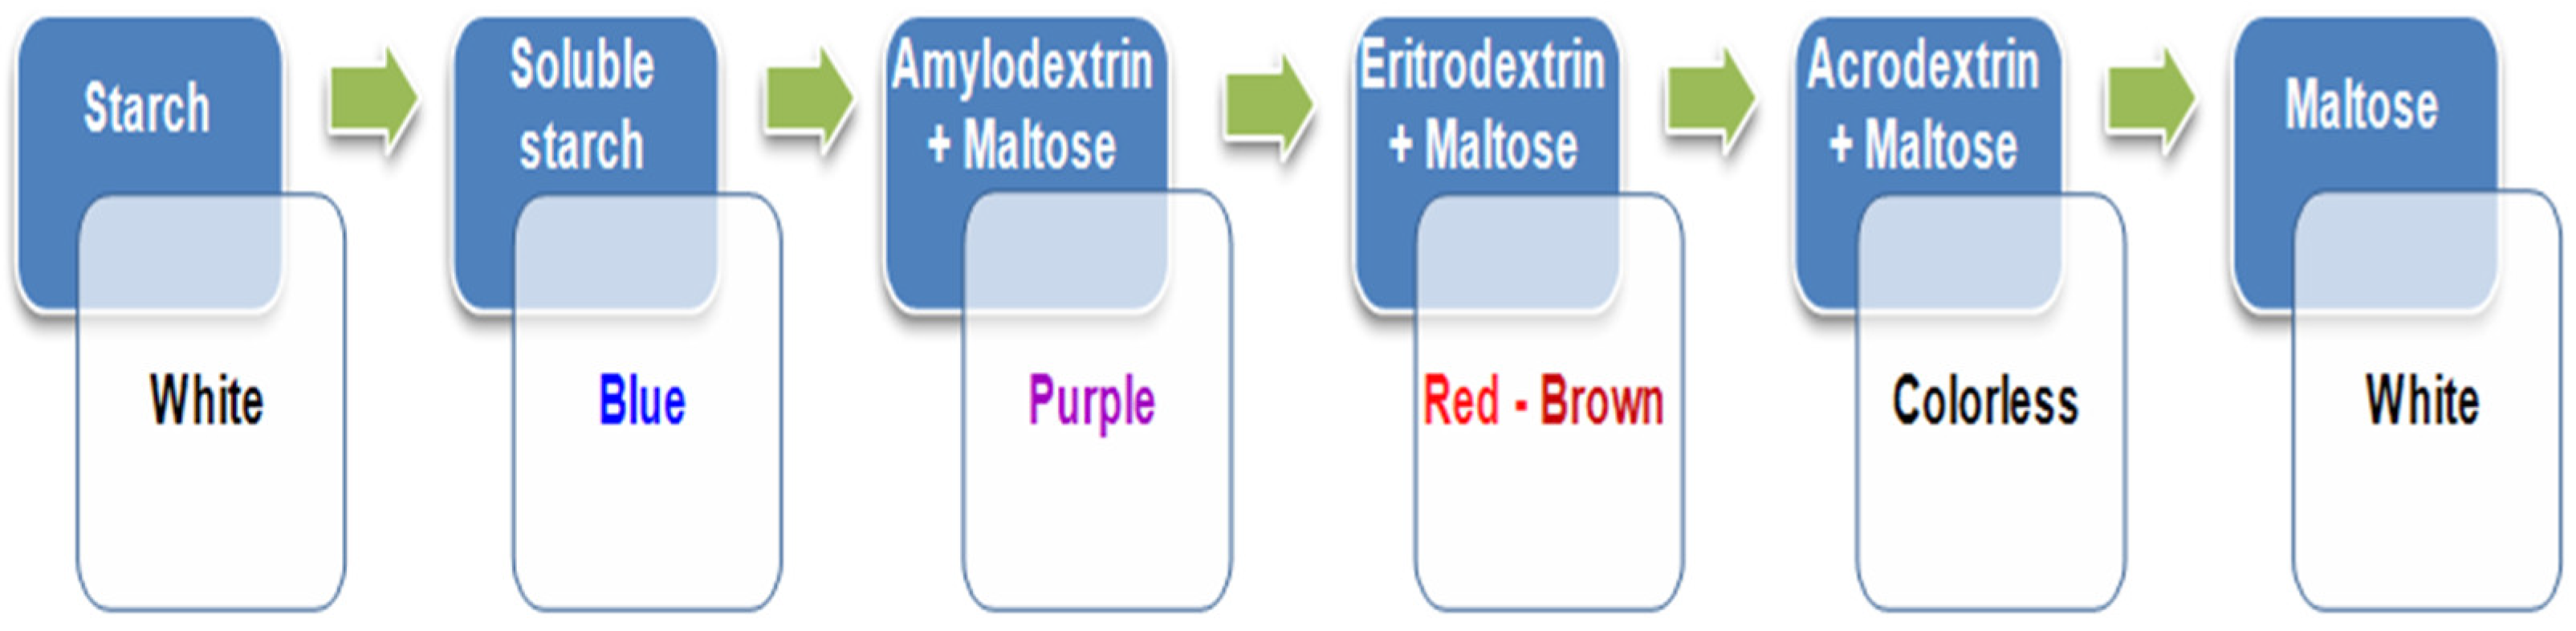
  • The conventional methods of extracting curcumin from turmeric powder are based on the action of simple chemical substances (acids, oxidants, enzymes), which degrade the points of connection between curcumin and the other components included in the turmeric matrix. At certain temperatures and durations, these substances swell the starch until the macromolecular chain splits at several points, releasing amylose, amylopectin, maltose, or glucose.
  • Unconventional/modern methods for curcumin extraction involve the use of microwaves or ultrasound; these methods are faster and more effective than classical methods [16,17,18,19,20,21,22]. Typically, the extraction of curcumin can be performed in the presence or absence of a solvent. Ethanol, ethyl acetate, acetone, benzene, dichloromethane, or dimethyl sulfoxide can be used as solvents. Curcumin is strongly non-polar, which is why it can also dissolve in non-polar solvents. In this sense, the following hydrophobic products can be used: sunflower oil, soybean oil, and linseed oil [18].
Being readily available and relatively easy to extract, curcumin can be used in textile dyeing, as a possible natural alternative to synthetic dyes. Studies in the literature indicate the use of curcumin (in powder or extract form) in dyeing cotton [24,25,26,27], silk [28,29,30], wool [31], and synthetic fibers [32]. However, the efficiency of the extraction process, the stability of the pigments obtained and their behavior in contact with different textile materials (natural and synthetic) remain aspects that require in-depth research.
In this context, the main objective of the present study is to investigate effective methods for the extraction of curcumin from turmeric powder, as well as to evaluate its potential as a coloring agent for various textile materials.
The novelty of the article lies in highlighting the degradation mode of the turmeric matrix from different extractive systems containing classical (acids, oxidants) or ecological substances (enzyme, ethanol, and kojic acid). The release of curcumin (Natural Yellow 3) is achieved by classical methods and by modern methods (assisted by microwaves or ultrasound).
A novel approach is introduced for evaluating curcumin release from the turmeric matrix through polysaccharide degradation, using both qualitative (iodometric method) and quantitative (FTIR, UV–VIS, and CIELab) analyses. Notably, the CIELab method, typically applied to solid supports, was adapted to be applicable to liquid extracts, highlighting the innovative nature of this approach.
The qualitative method used (iodometric method) highlight the degraded forms of the starch in the turmeric powder, by changing the color depending on the type of complex formed between the starch residues and the iodine species found in the I2/KI solution.
Quantitative methods such as FTIR, UV–VIS, colorimetry show that the processes assisted by microwaves are the most effective, regardless of whether the extraction medium contains water, water + ethanol, water + kojic acid, or water + kojic acid + ethanol.
For a complete analysis of the extracts, two methods are used: UV–VIS and CIELab, because they complement each other:
  • The UV–VIS method provides information about the chemical composition and concentration of active substances in the extract, indicating the absorption peaks specific to the compounds present;
  • The CIELab method provides information about the color of the extract, being useful for monitoring the visual appearance and correlating the color with the quality of the product. Although this method is specific only to solid supports, it has been adapted and applied to liquid extracts under controlled conditions.
The dyeing capacity of fibers depends on the dyeing method used, the nature of the dye, the nature and composition of the fibers, the affinity of the dye for the fibers, and the dyeing parameters. Curcumin shows affinity for a large number of fibers, of different origins: natural (cotton, hemp, wool, silk), synthetic (polyacrylonitrile, polyamide, polyester), and artificial (cellulose acetate). This property could be particularly useful in the case of fiber dyeing but especially in the case of dyeing mixed textile materials, which contain a fibrous mixture, in different proportions.

2. Materials and Methods

2.1. Materials and Chemicals

Turmeric powder is used as a source of curcumin. The substances H2SO4, HCl, CH3COOH, H2O2 (Merck KGaA, Darmstadt, Germany), kojic acid (Ellemental, Oradea, Romania), and Beisol HTS (CHT Group, Tübingen, Germany) enzyme are used as such with their concentrations as supplied.
Natural and synthetic fiber fabrics are used as textile supports for dyeing: wool, cotton, silk, hemp, polyamide, polyester, cellulose acetate, and polyacrylonitrile (Melana (RIFIL, Săvinești, Romania)).
The fabrics utilized in the tests exhibit the following specific weights: 258.24 g/m2 for wool, 160.84 g/m2 for cotton, 34.85 g/m2 for silk, 260.0 g/m2 for hemp, 64.5 g/m2 for polyamide, 62.7 g/m2 for polyester, 82.36 g/m2 for cellulose acetate, and 190.36 g/m2 for polyacrylonitrile.

2.2. Extraction Processes

The extraction processes of curcumin from turmeric powder are carried out under the following conditions:
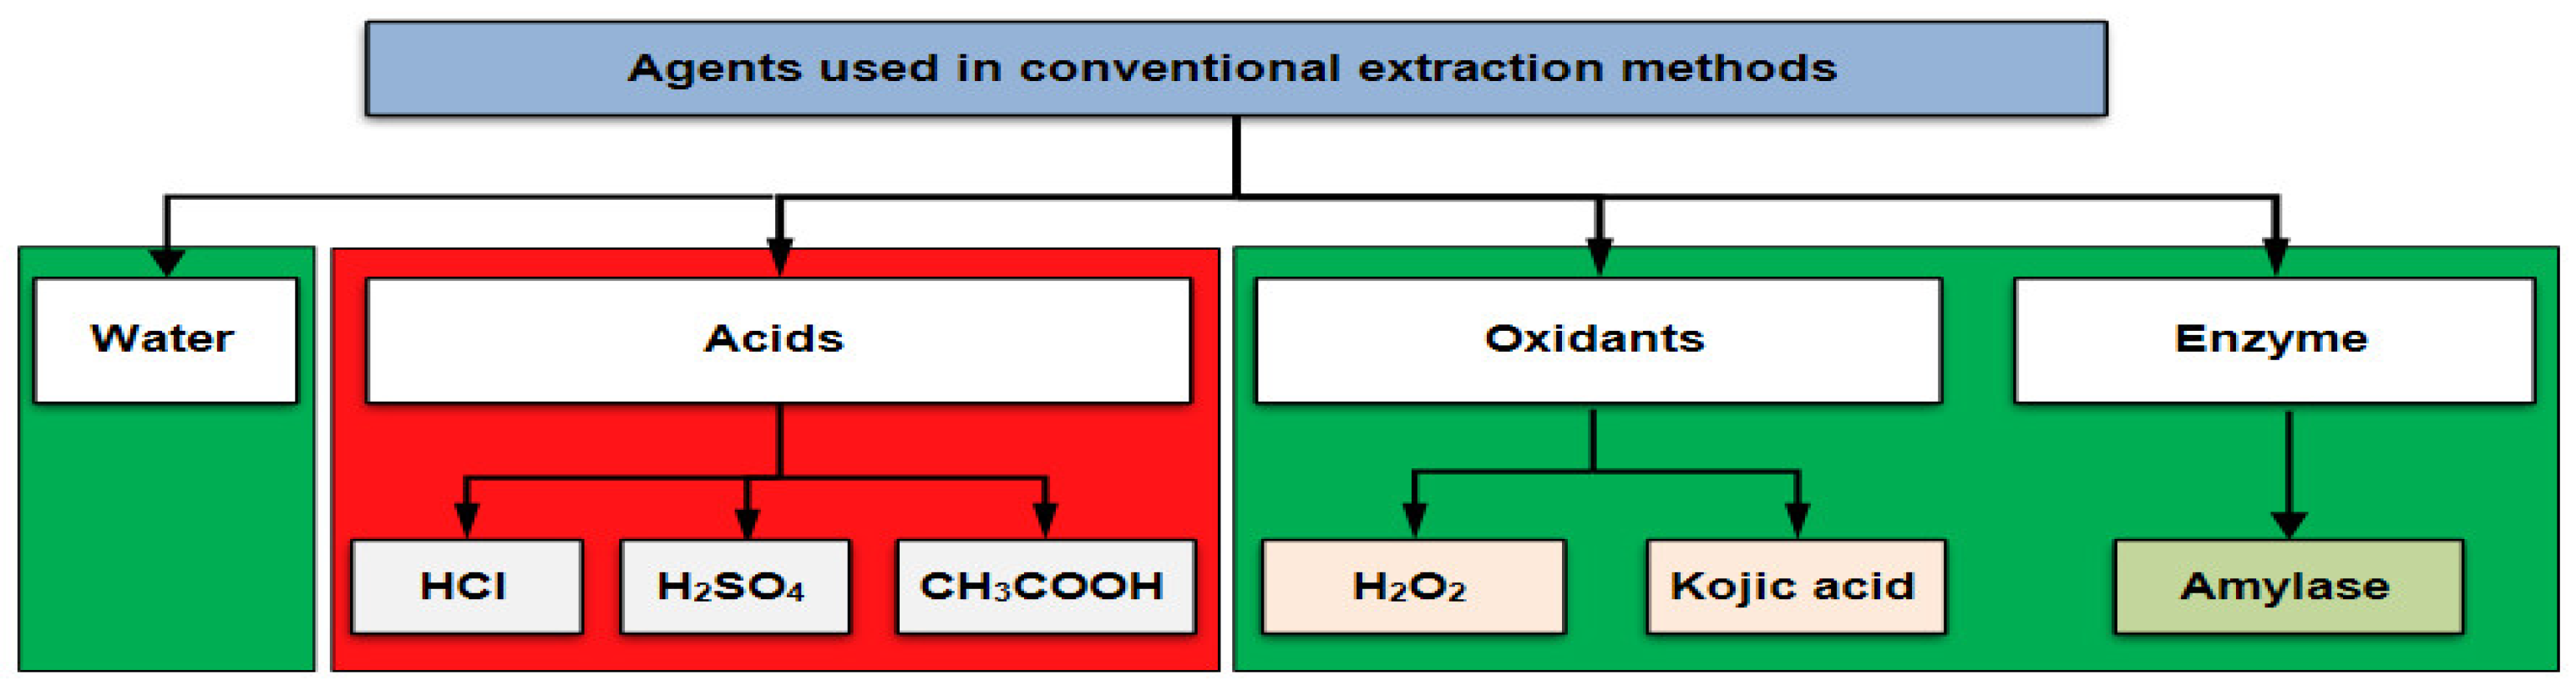
  • Classical extraction methods are based on extraction in water, in an acidic medium, in an oxidizing medium, or in the presence of enzymes. It is the first time that oxidizing agents (such as H2O2 and kojic acid) are used in the extraction process of a natural dye. In these methods, the amount of 0.1 g of turmeric powder is used, to which 100 mL of water + 0.1 mL of starch degradation agent (acids/oxidants/enzyme) is added, at different temperatures and contact times, imposed by the extraction method adopted (Figure 1). HCl, H2SO4, and CH3COOH are used as acids. The green areas in Figure 1 indicate the eco-friendly agents used in the extraction processes, such as: water, oxidants (H2O2 and Kojic acid), and the amylase type enzyme (Beisol HTS, a bacterial amylase that resists temperatures close to boiling).
2.
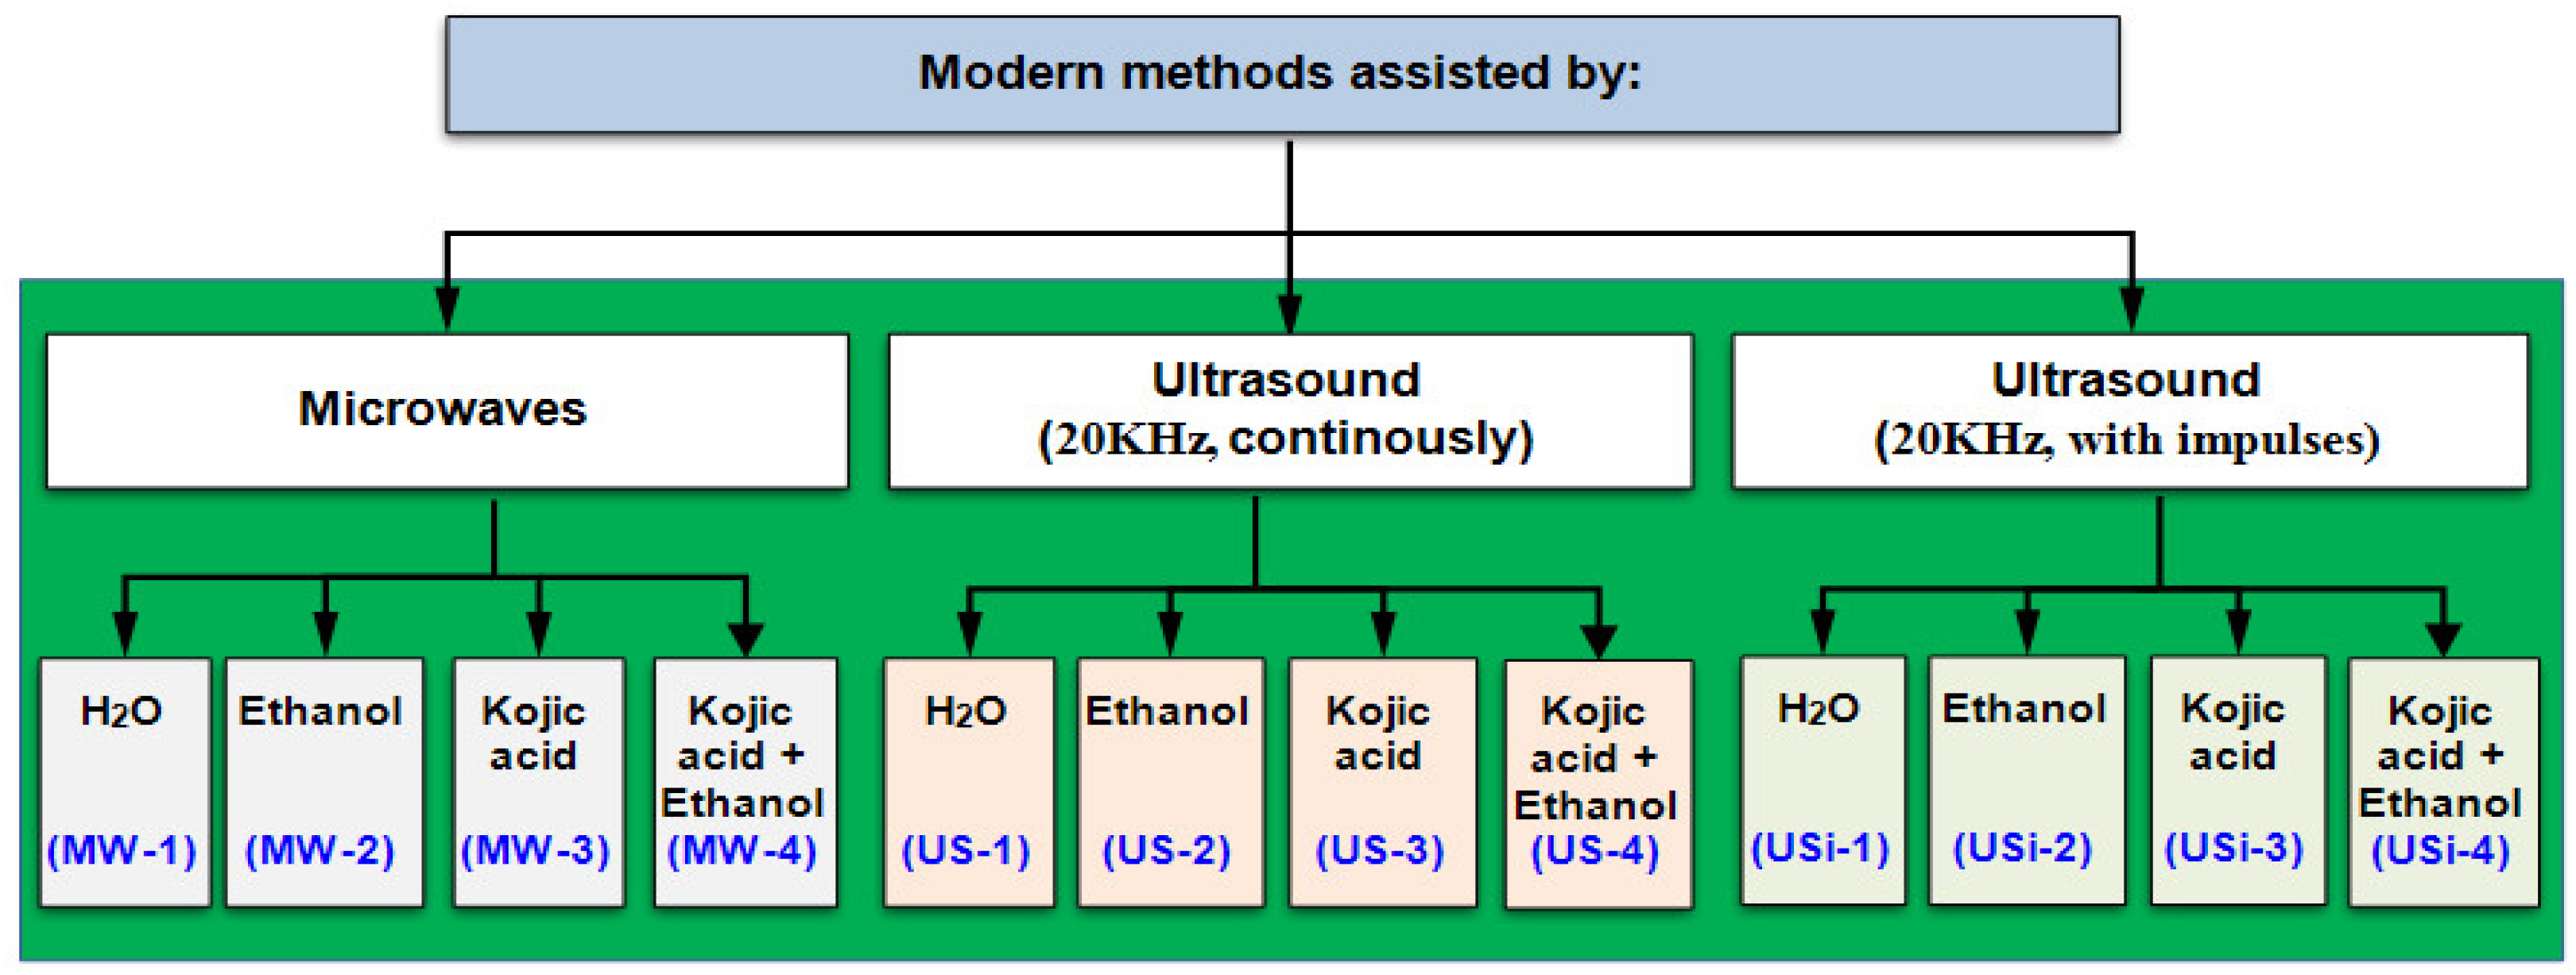
Modern extraction methods are based on the use of physical stimuli (MW and US), in the presence of eco-friendly agents (water, ethanol, and kojic acid).
In each extraction process, the amount of 0.1 g of turmeric powder is used, to which 100 mL of water and 0.1 mL of agent for starch degradation (kojic acid) or for dissolving curcumin (0.1 mL of ethanol) are added, in the presence of MW or US (Figure 2).
The conditions for the realization of these eco-friendly methods of extracting curcumin from turmeric are the following:
  • Microwave-assisted extraction method: frequency of 2450 MHz, power 650–750 W, for 10 min (coding MW-1 to MW-4);
  • Ultrasound-assisted extraction method: 20 KHz, US emitted continuously for 10 min (coding US-1 to US-4):
  • Ultrasound-assisted extraction method: 20 KHz, US emitted intermittently (impulses every 2 s), for 10 min (coding USi-1 to USi-4).

2.3. Methods of Analysis

The analysis methods used were the following:
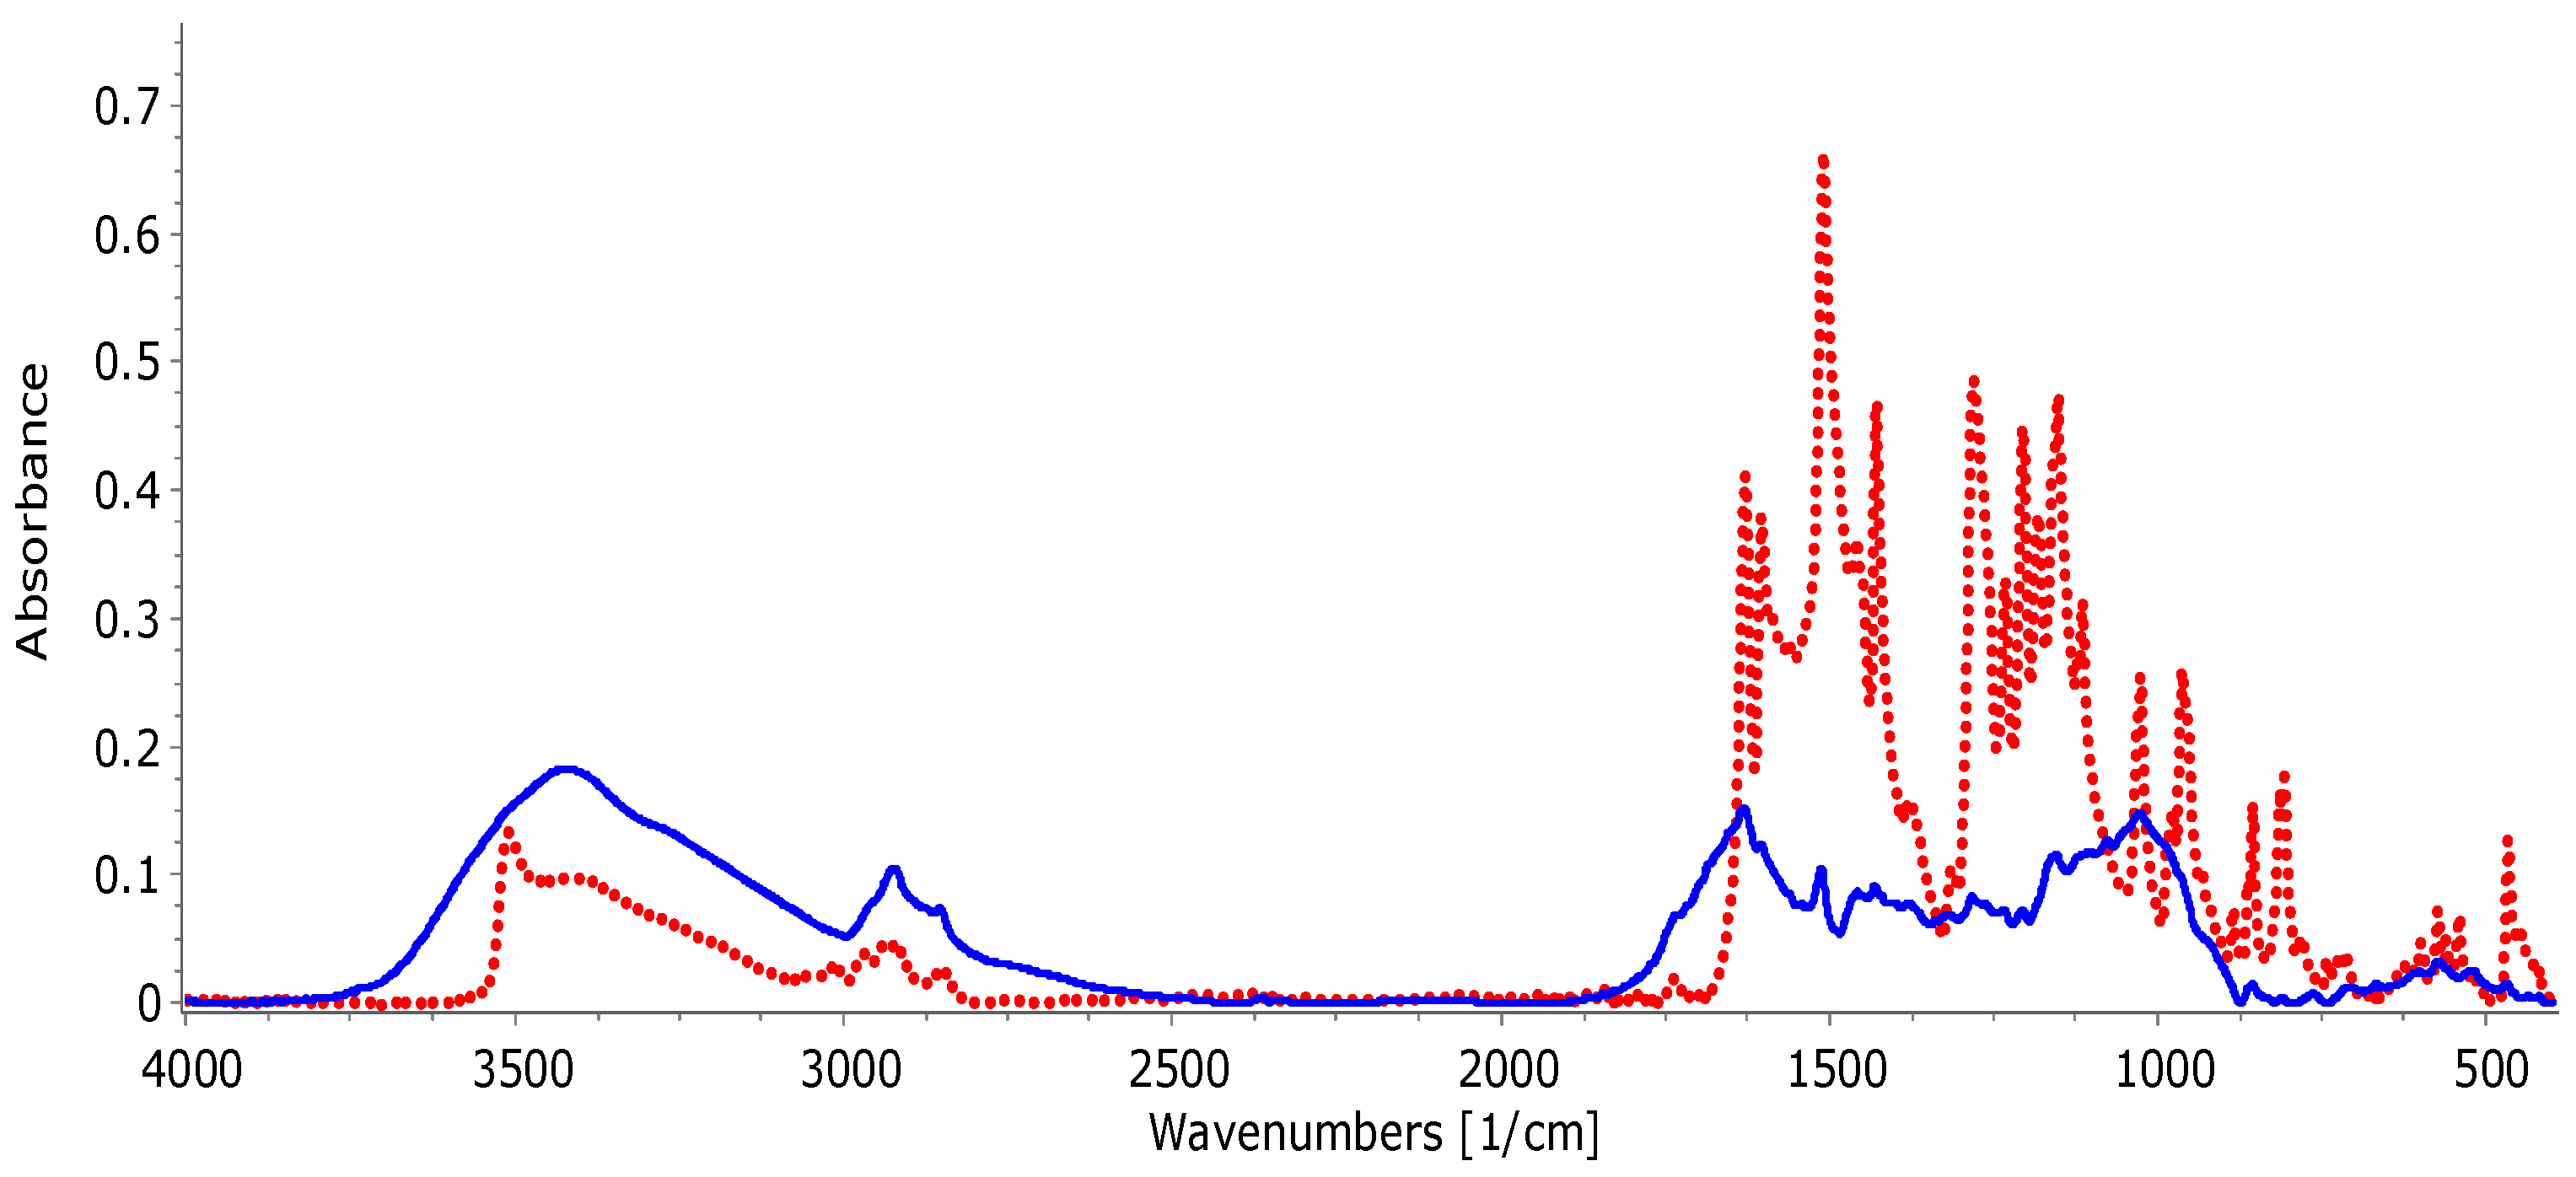
  • FTIR analysis to highlight the presence of curcumin in turmeric powder; FTIR analysis is performed on a FTIR IR Affinity-1 Schimadzu spectrophotometer (Japan); the spectra are recorded in the range 4000–400 cm−1 (with 250 scans). After recording, IR absorption spectra are overlaid using Spectragryph software, version 1.2.
  • Iodometric method: the qualitative analysis of the extract involves highlighting starch, amylose, amylopectin, and maltose using the iodine test, because their presence equates to the degradation of the turmeric matrix and the release of curcumin.
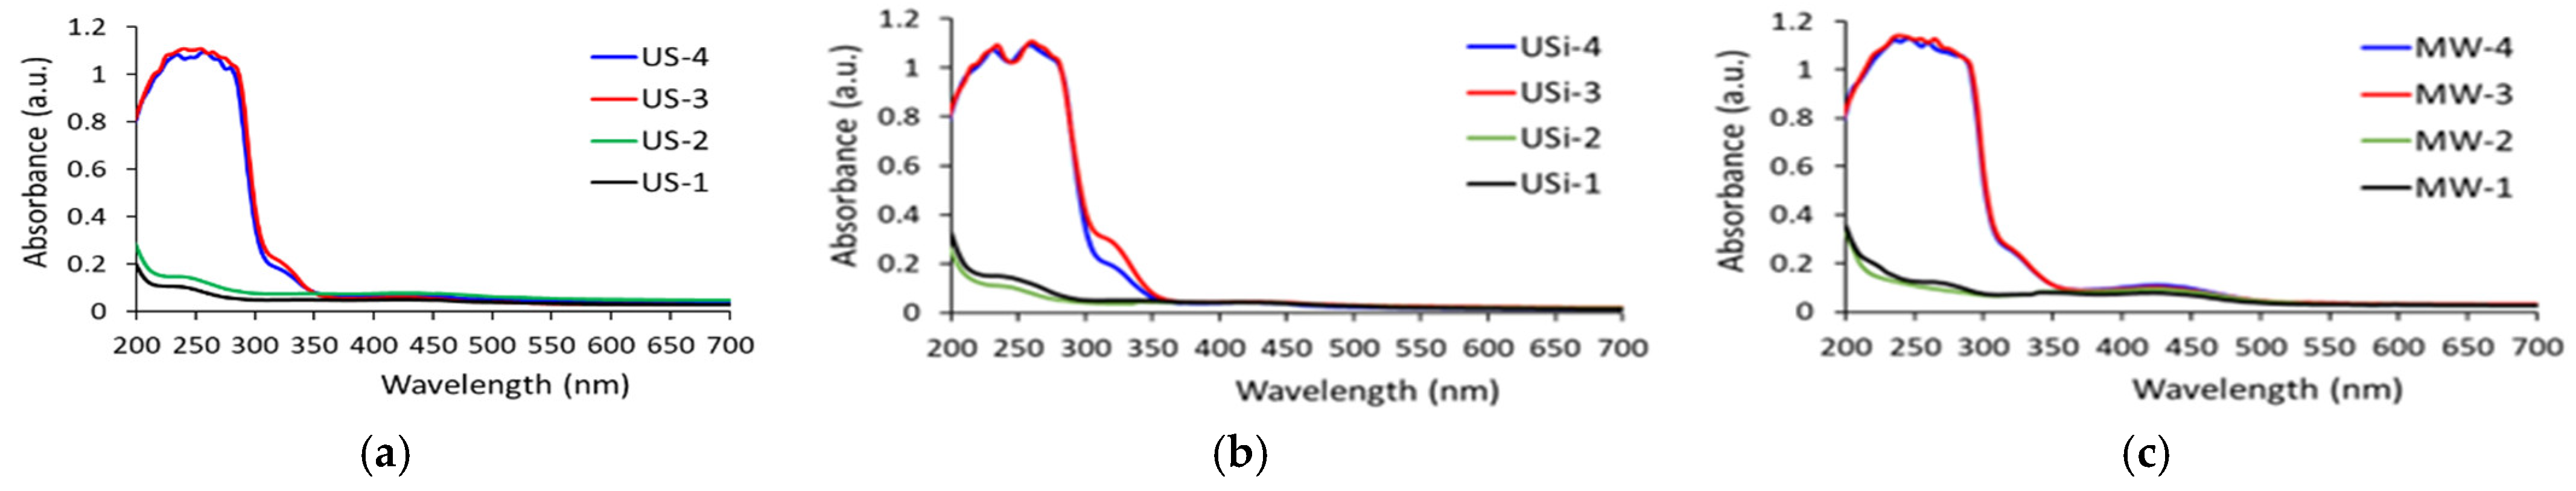
  • UV–VIS analysis to characterize the extracts. For this analysis, a Shimadzu UVmini-1240 UV–VIS spectrophotometer (Shimadzu Corporation, Kyoto, Japan) is used, which allows the measurement of absorbance in the 0–5 a.u. range using a cell of 3 mL volume. The cuvettes used in the experiments are made of quartz, with a length of 1 cm. The efficiency of ultrasound and microwaves in extraction processes can be calculated using the maximum values of UV–VIS absorbances, related to wavelengths from 420 nm, according to Equation (1):
E = [(Aextractive system − Awater extraction)/Aextractive system] × 100
where: E = the efficiency of the extractive system [%]; Aextractive system = absorbance of the extractive system [a.u.]; Awater extraction = absorbance of the obtained extract, only in water.
4.
Dyeing of textile fibers: 1 g of textile material and the mixture of 100 mL water + 0.1 g turmeric powder + 0.1 mL ethanol and 0.1 g kojic acid are subjected to microwave action (750 W, 10 min) when the extraction steps are carried out simultaneously with the dyeing. The textile materials used are wool, cotton, hemp, natural silk, polyacrylonitrile, polyamide, polyester, and cellulose acetate fibers.
In microwave-assisted dyeing processes, the temperature of the dye bath is measured using a non-contact infrared thermometer (through the transparent door of the microwave equipment) to approximate the thermal conditions influencing the processes. Temperatures are recorded at specific intervals, particularly after the first minute of irradiation (approximately 54 °C) and at the end of the 10 min treatment (approximately 98 °C). Due to equipment limitations, direct measurement of the surface temperature of the textiles is not feasible. These values provide an estimate of the thermal environment inside the reaction vessel.
Although the surface temperatures of the fabrics remain unmeasured, the recorded solution temperatures serve as valuable reference points for understanding the thermal contribution to each process. It is acknowledged that thermal and non-thermal effects act synergistically, and their exact separation is not possible under the current experimental conditions.
The dyeing performance of textiles with curcumin extracts is evaluated based on several parameters, including washing and rubbing stability. The tests used are as follows:
-
ISO 105-C06 test [33] for the evaluation of color fastness to washing of dyed textiles (at 40 °C, for 30 min, hydromodulus 50:1). The tests are carried out on a textile washing tester manufactured by Thwing-Albert in the United States of America.
-
ISO 105-X12 test: Textiles—Color fastness test—Rubbing resistance is used for the evaluation of resistance to rubbing (dry and wet) [34]. This test evaluates the color fastness and integrity of dyed or colored fabrics. The rubbing action is carried out on a Pattering Tester (Computext, Budapest, Hungary).
These tests are essential to ensure the durability and quality of the dyeing.
For both tests, a gray scale is used to evaluate the coloration of undyed fabrics, which plays a well-defined role in each test. In the case of the washing test, a gray scale is also used to evaluate the discoloration of the dyed sample, due to washing.
5.
Colorimetric measurements of extracts and dyed textile supports. For this purpose, a DataColor Check II Plus spectrophotometer (DataColor AG, Luzern, Switzerland) is used to determine the color strength (K/S) and the CIELab colors quantities: lightness (L*), position on the red–green axis (a*), position on the yellow–blue axis (b*), and chroma/saturation (C*).
The portable DataColor Check II Plus spectrophotometer operates in diffuse reflection mode, equipped with d/8° optical geometry (diffuse illumination, 8° observation angle), standard illuminant D65, standard observer 10°, 4 mm aperture, and SCI (specular component included) measurement option. The device was calibrated before each work session with the standards provided by the manufacturer.
The colors of the extracts and of the dyed textile samples, respectively, are assessed as follows:
  • Measurement of the color of liquid extracts: For the determination of the color of liquid extracts, 30 mL volumes are used, introduced into a transparent glass beaker, with smooth walls, used consistently for all samples. The container is placed on a white fundal, to ensure a uniform optical background. The measuring head of the spectrophotometer is applied perpendicularly to the side wall of the beaker, at the same point for all measurements. The outer surface of the container is cleaned before each determination, to prevent unwanted reflections.
This method, although adapted to an apparatus designed for measurements on solid surfaces, allows the comparative evaluation of chromatic changes between liquid extracts, under controlled conditions.
  • Measurement of the color of dyed textile materials: The textile samples were conditioned for 24 h in a standardized atmosphere (20 ± 2 °C and 65 ± 5% relative humidity), then placed on a flat white surface (same for all samples), with the fabric completely smoothed, to eliminate the influences of wrinkles or texture on the measurement. The measuring head of the apparatus is applied perpendicularly to the textile surface, in at least five different points, representative of the color uniformity. For each sample, the arithmetic mean of the values obtained is calculated.
In both cases (extracts and textiles), five replicates are recorded to ensure statistical reliability. The colorimetric values are recorded in the CIELab space, being expressed by the three components: L* (lightness, from 0 = black to 100 = white), a* (red–green axis), and b* (yellow–blue axis). These data are used for the comparative evaluation of the color changes between the samples subjected to different treatments.
6.
Statistical analysis: All experimental determinations are carried out in five independent replicates (n = 5). Results are expressed as arithmetic mean ± percentage error, in order to evaluate the precision of the applied methods.
The percentage error for each measurement is calculated using the following Formula (2):
Percentage error (%) = [(individual value − mean)/mean] × 100
For each data group, the average percentage error is calculated and used as an indicator of measurement reproducibility and accuracy. The graphical representations include error bars whose length reflects the magnitude of the percentage error, allowing for a visual assessment of data variability. All calculations and graphical representations are performed using Microsoft Excel.

3. Results

3.1. Mechanism

The turmeric matrix contains curcumin, curcuminoids, carbohydrates, resin, fats, and other components, as binding elements; all of these keep the curcumin and curcuminoids immobilized, as in a network. The degradation methods of the network inside turmeric coincide with the cleavage methods of starch because carbohydrates predominate in the turmeric matrix [11,12,13,14,15,16].
Regardless of the extraction method used in this work, the principle of curcumin extraction is based on the splitting of the matrix/starch, which causes the initial architectural structure in turmeric to be disturbed, to break the bonds in the polysaccharides, to form voids that facilitate the penetration of the solvent, the dissolution oleoresins, and release/extraction of curcuminoids/curcumin. The curcuminoids in turmeric are made up of 90% curcumin, i.e., a mixture of yellow dyes: diferuloylmethane/Curcumin I (C.I. Natural Yellow 3, C.I. 75300), monodexmethoxycurcumin, and bisdesmethoxy-curcumin [16,19].

3.2. FTIR Analysis

The presence of curcumin in turmeric powder is confirmed by the FTIR spectroscopic method; the spectrum of turmeric powder closely resembled that of pure curcumin (Figure 3) [16].
In Figure 3, the FTIR spectra of pure curcumin and powder turmeric are included to compare their spectral profiles and highlight the structural and compositional differences between an isolated bioactive substance and the complex plant matrix from which it comes. These two spectra are analyzed in the 400–4000 cm−1 range, an interval that covers both the molecular fingerprint region and the vibrations characteristic of polar functional groups.
In the region 400–1750 cm−1, the spectrum of pure curcumin is dominated by intense and well-defined bands, attributed to stretching vibrations of carbonyl groups (C=O, around 1630 cm−1), of the C=C double bonds in the conjugated aromatic system (1514 cm−1 and 1600 cm−1), as well as of the C–O and C–C bonds (1000–1370 cm−1) [16,35,36,37,38,39]. The presence of these high-intensity bands reflects the purity of the sample and the high concentration of curcumin, without significant interference from another compound.
In contrast, the spectrum of turmeric powder shows the same bands characteristic of curcumin, but with significantly lower intensities. This indicates a limited presence of curcuminoids within the plant matrix. The decrease in absorption is attributed to a spectral dilution effect caused by non-specific major compounds (such as starch, maltose, dextrin, and other polysaccharides). These compounds, although they do not contribute significantly in the relevant spectral regions, interfere with the signal by masking or blurring the characteristic absorption bands of curcumin.
In the range of 1750–4000 cm−1, the spectrum of turmeric shows significantly more intense absorption bands compared to that of pure curcumin. The most pronounced and broad band appears around 3427 cm−1 and is attributed to O–H stretching vibrations (specific to hydroxyl compounds such as starch, maltose, and dextrin, as well as water bound within the polysaccharide network) and N–H stretching vibrations (from amino acids and proteins). The bands observed in the region of 2854–2923 cm−1, associated with aliphatic C–H vibrations, are more prominent in turmeric than in pure curcumin, indicating the presence of carbohydrate chains and other plant-derived constituents that are absent in purified curcumin [37].
In the region 1750–4000 cm−1, the spectrum of pure curcumin is relatively weak due to the limited number of hydroxyl groups and the absence of auxiliary compounds such as polysaccharides or structural water. Thus, the differences in intensity in this range support a simpler and more specific molecular composition in the case of pure curcumin, compared to the compositional complexity of raw turmeric.
Overall, the FTIR spectra reveal significant compositional differences between the two samples. Pure curcumin is distinguished by intense and clear absorptions in the fingerprint region (400–1750 cm−1), while powdered turmeric shows stronger absorptions in the region 1750–4000 cm−1, due to polar compounds and polysaccharides present in the plant matrix.
These results demonstrate the efficiency of the FTIR method in revealing the relative chemical composition, allowing clear differentiation between a purified bioactive substance and a complex plant raw material, as well as semi-quantitative estimation of the presence of curcumin in turmeric.

3.3. Qualitative Analysis of the Extract

The qualitative analysis of the extract is based on the iodometric method; the reagent used in the iodometric method (iodine test) is the triiodide I3, which exists in the solution obtained from the dissolution of solid elemental iodine, in a concentrated solution of alkaline iodide (potassium iodide). This test consists of identifying starch degradation compounds using a few drops of I2/KI solution. The blue color indicates the presence of amylose that forms helices where more iodine molecules gather, generating this specific color. In this sense, the following steps are taken: 1 mL of extract is mixed with 10 mL of distilled water and two drops of I2/KI solution. The coloration obtained indicates the degradation stage of the turmeric matrix (which includes carbohydrates/starch, as in Figure 4) so indirectly indicates the efficiency of curcumin release.
It is known that starch is a polymer, more specifically an insoluble polysaccharide, composed of amylose and amylopectin. The action of degradation of this polymer leads to compounds that give different colors, in the presence of I2/KI solution [40], (Figure 4).
These stages of degradation of starch in turmeric powder occur during enzymatic hydrolysis. When an acid is used to release curcumin, then the degradation of polysaccharides results in glucose, as the final product [40].

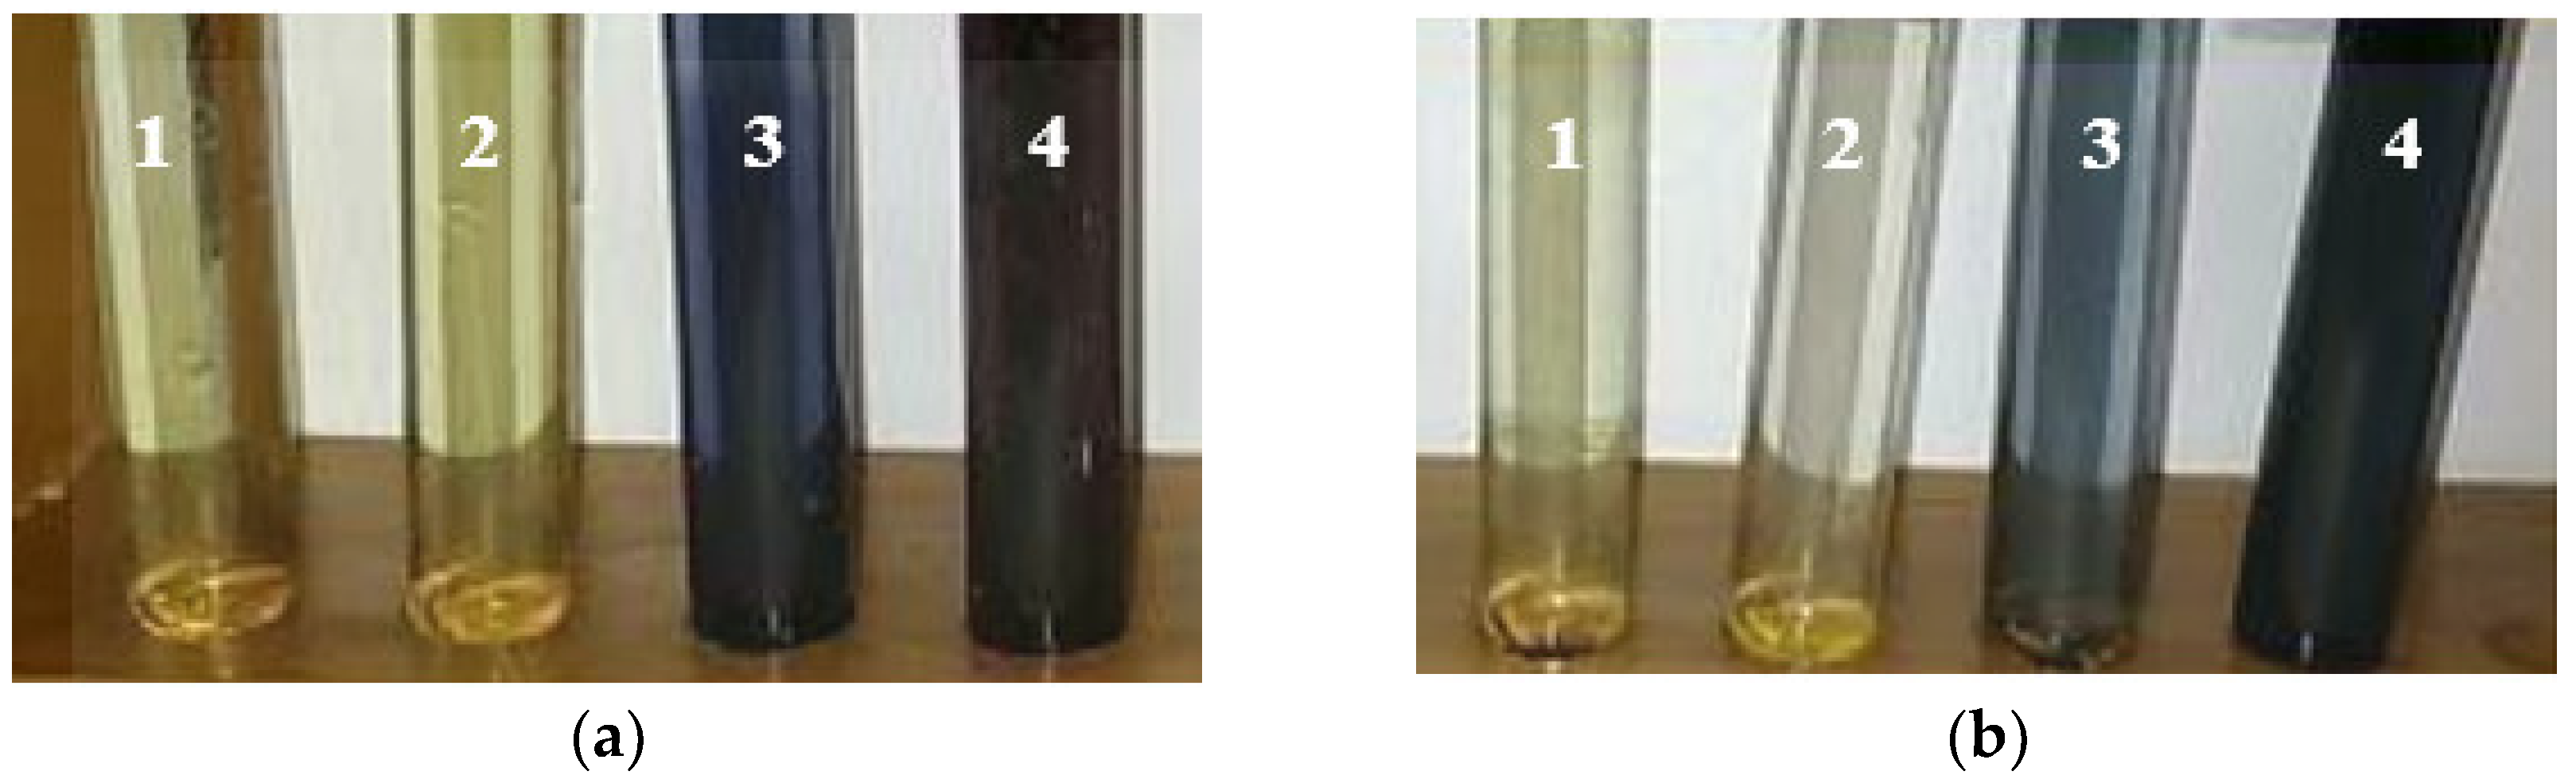
3.3.1. Extraction of Curcumin from Turmeric Using H2SO4 and H2O2

The blue color indicates the presence of amylose and the purple color indicates amylopectin/amylodextrin, knowing that starch is composed of 20% amylose and 80% amylopectin. The presence of amylose can also be determined by UV–VIS analysis when an absorption peak is obtained on the UV–VIS spectrum, at ~570 nm. These colors are not observed in extracts obtained by simply mixing turmeric powder with water because the two components of starch are immobilized in the network with the help of oleoresin, fats, and other components.
The results of the iodometric method indicating the degradation of starch in the curcumin matrix (Figure 5) are illustrated by the colors in test tubes 1–4, in which there are 1 mL extract + 10 mL water + 2 drops of I2/KI. Figure 5 indicates that the extraction of curcumin and implicitly the presence of degraded starch is higher when the extraction process is carried out by boiling for 10 min (in test tubes 4).

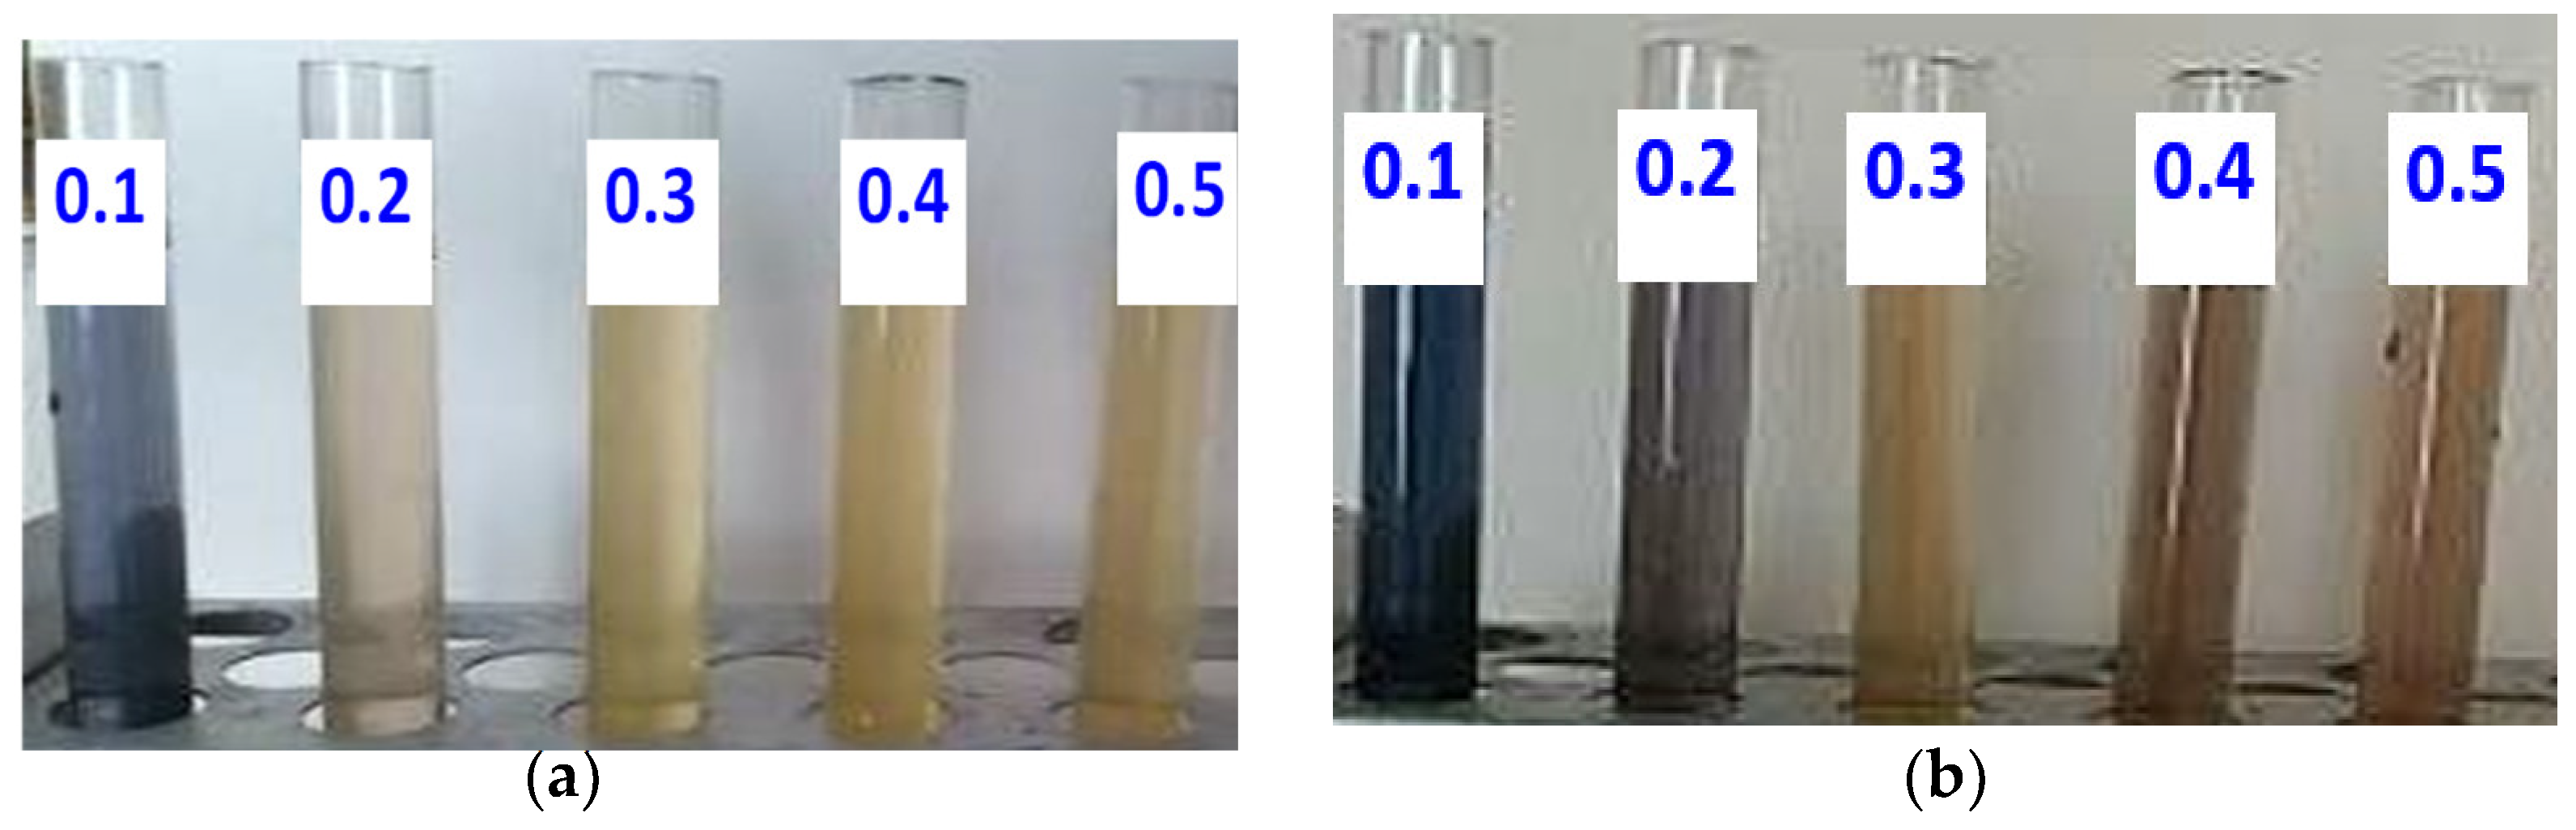
3.3.2. Extraction of Curcumin from Turmeric Using Kojic Acid

Kojic acid is a chelating agent obtained from several species of fungi, particularly Aspergillus oryzae, which has the common Japanese name koji. It is known as 5-Hydroxy-2-(hydroxymethyl)-4H-pyran-4-one or 2-Hydroxymethyl-5-hydroxy-γ-pyrone, it has molecular mass, 142.11 g/mol, boiling point of 152–155 °C, acidity (pKa = 9.40), and considerable solubility in water.
Kojic acid is also an eco-friendly oxidizing agent. By replacing H2O2 with kojic acid, results are obtained that confirm its ability to degrade starch, but in a longer time than H2O2. This fact is explained on the basis of the reduced ability to oxidize and destroy the macromolecular chain of starch compared to H2O2. The colors of the solutions in the last test tubes (Figure 6) indicate that kojic acid has determined the degradation of the turmeric matrix, a fact observable by the presence of the starch that gives the blue coloration with the I2/KI solution, up to maltose (in the last test tube).

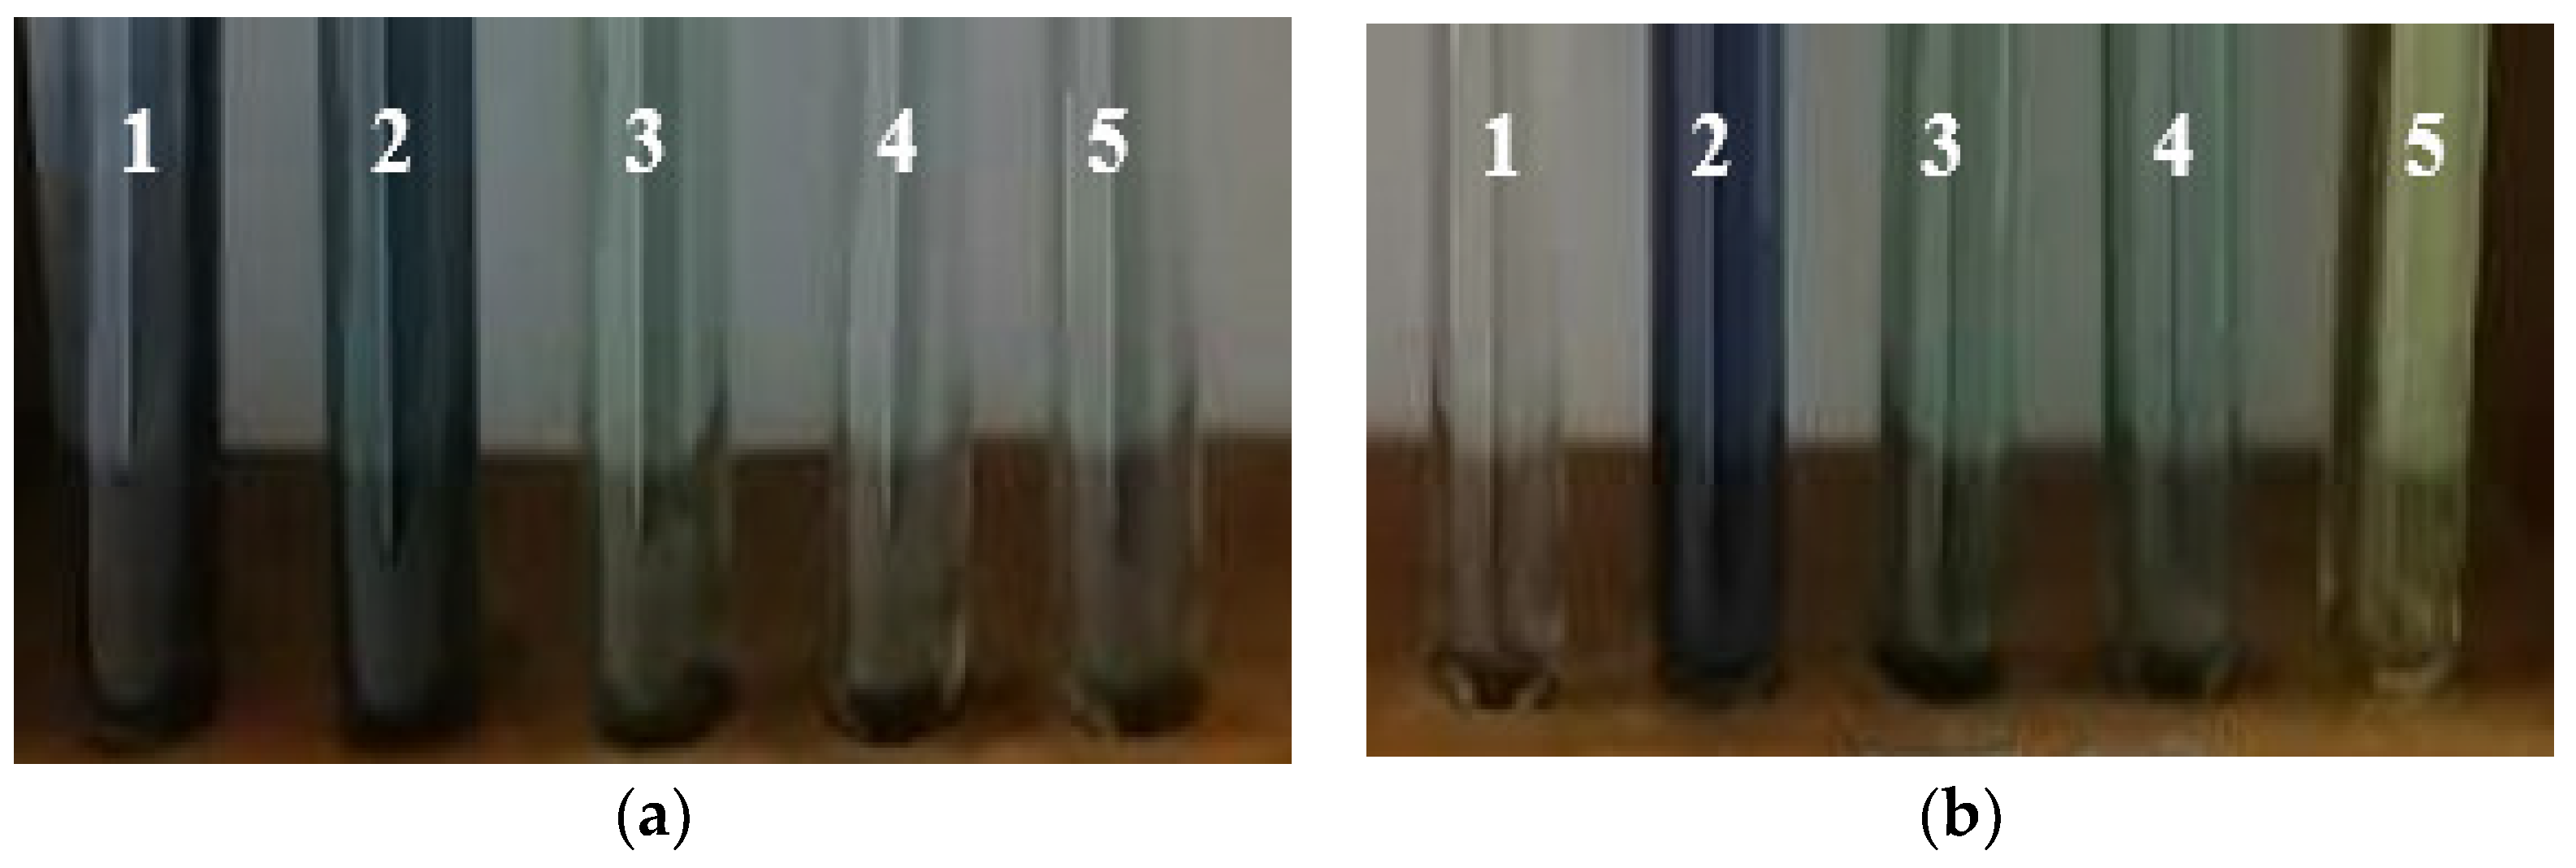
3.3.3. Enzyme Assisted Extraction

An eco-friendly alternative to any classic extraction method is extraction assisted by one or more enzymes. The most commonly used enzymes in different extractive systems [41,42,43], to destroy or hydrolyze part of the constituents of plant cell walls, are the following:
  • cellulases—to hydrolyze cellulose and release cellobiose and glucose molecules when the hydrolysis is complete;
  • hemicelluloses—to hydrolyze hemicelluloses that produce simple sugars or oligosaccharides;
  • α—amylases—to degrade starch; it acts on the 1–4 glycosidic bonds producing hydrolysis into dextrin fragments and finally into maltose molecules;
  • glucoamylases—to hydrolyze the glycosidic bond in starch and dextrin;
  • mixture of xylanases + cellulases—to degrade the linear polysaccharide xylan into xylose and cellulose into cellobiose and glucose, respectively;
  • pectinases—to hydrolyze the different types of pectins, releasing uronic acids;
  • proteases—to hydrolyze proteins that release peptides, amino acids.
The mechanism of enzyme-assisted extraction is based on the selectivity and ability of the enzymes to hydrolyze certain components of the cell wall and to damage or even destroy the architectural structure of the cell wall of the plant used as a natural dye source. In the enzyme-assisted extraction process, working conditions such as enzyme concentration, temperature, pH, substrate particle size and extraction time are very important, they significantly influence the extraction power.
In this work, the effect of an amylase (Beisol HTS) in the extraction process of curcumin from turmeric powder is studied (Figure 7). The colors of the extracts in Figure 7 illustrate the degradation of starch from the turmeric powder, in the case of using 0.1–0.5 mL Beisol HTS enzyme.
Compared to the extraction variants, shown in Figure 6, the extraction of curcumin in the presence of the Beisol HTS enzyme (Figure 7) leads to much superior results; for 0.1 mL enzyme, a weak blue-brown coloration is obtained, and for 0.2 mL Beisol HTS, the blue coloration disappears as a result of the transformation of starch into compounds with lower molecular mass, which are colorless or white (as indicated in Figure 4).
Figure 7 indicates that the extraction process performed with the enzyme is very highly effective because the curcumin-blocking starch in turmeric powder is highly degraded, even in the presence of a small amount of enzyme (0.1 mL); as the amount of enzyme increases, starch degradation is more pronounced, leading to the formation of erythrodextrin + maltose (reddish-brown colors in the last two tubes indicate starch degradation to erythrodextrin + maltose) [40].

3.3.4. Unconventional Extractions Assisted by Microwaves or Ultrasound

Microwave Assisted Extraction; Comparisons with Classical Methods

In order to more easily observe the efficiency of microwave-assisted extraction, the results of the qualitative analysis of starch degradation are exhibited in Figure 8 together with other classic extractions carried out in this work (with water, HCl, CH3COOH, Beisol HTS).
The obtained results (Figure 8) indicate that the most effective extraction method is the one assisted by microwaves.
The efficiency of microwave curcumin extraction is superior to any classical process involving the use of water as a solvent: 1 min of microwave irradiation at 750 W leads to the same percentage of extracted curcuminoids (approximately 60%) as 1 h by the conventional extraction method. Microwave-assisted extraction of curcuminoids is fast and effective because the dielectric heating generated by microwaves causes a degradation of the matrix that kept curcuminoids immobilized; the prerequisites are created for their extraction with the help of solvents that can easily penetrate through the cracks resulting from matrix degradation [19].
In order to analyze the efficiency of extractions assisted by ultrasound or microwaves, from 0.1 g of turmeric powder, a series of experiments are carried out, which are coded as in Table 1.
Qualitative analysis indicates that the best extractions result in the presence of microwaves (Figure 9); in the last four tubes, the coloration of the extracts in the presence of I2/KI indicates the significant degradation of carbohydrates/starch in the turmeric powder and thus indirectly indicates the release of curcumin.
The information from the literature indicates that the presence of a cosolvent (especially ethanol) leads to an enhanced extraction both in ultrasound-assisted processes [17,44,45,46] and in microwave-assisted processes [16,19,47,48], regardless of the source of the natural dye.
The influence of the solvent in the curcumin extraction process is explained in the literature [49,50,51] as follows: the role of a solvent is either to dissolve reactants (non-participative role) or to be a source of acid (proton), base (remove protons), or as a nucleophile that can donate a single pair of electrons (participative role). The studies that made comparisons between the extraction efficiencies in the presence of ultrasound/microwaves, indicates significant influences of the working conditions (frequency and intensity/power of irradiation, duration, temperature, presence/absence of a solvent, and especially its nature) [52,53,54]. Similar conclusions are obtained when all the UV–VIS spectra of the extracts resulting from the processes assisted by US or MW are analyzed. The presence of ethanol determines the increase of maximum wavelength (λmax), in all extractive systems, regardless of the nature of the physical stimuli (US or MW). Kojic acid determines the release of curcumin at 420 nm or 425 nm probably depending on how the extraction is performed: US, USi, or MW. In the extractive systems USi-3 and MW-3, amylose appears at λmax = 590 nm and 585 nm, respectively (Table 2). The presence of amylose indicates the degradation of starch from turmeric, thus the release of curcumin.
When both ethanol and kojic acid exist in extractive systems, curcumin is released at a wavelength equal to the arithmetic mean of the maximum wavelengths given by ethanol and kojic acid, respectively, i.e., at 425 nm in US-4 and MW-4 and at 420 in USi-4 (Table 2), respectively. This fact proves an equal influence of the two additions from these extractive systems. Amylose appears in these three extractive systems at λmax = 590 nm in US-4 and MW-4 and at 575 and 590 nm in USi-4, respectively.
Table 2 indicates that amylose is present in the solution only in US-4, USi-3, USi-4, and MW-1 up to MW-4. Microwaves, even in the absence of an oxidant or a solvent, manage to quickly destroy the turmeric matrix, which favors the release of curcumin. It follows that the extraction processes assisted by microwaves are the most effective.

Extraction Mechanism—Assisted by Ultrasound

The effects of ultrasound-assisted extraction can be explained based on the classic mechanism by which ultrasound acts in a heterogeneous medium [55,56,57,58,59,60], liquid–solid (turmeric); the action of ultrasound is mainly due to the effect of acoustic cavitation, the implosion of air/gas bubbles inside the turmeric, when the so-called “hot spots” are obtained, micro-jets of liquid that bombard the solid part encountered in the path, producing erosion, turbulence, and certain destructive effects to it. In this way, cracks can be created in the architectural structure of turmeric and internal reorganizations; the penetration of the solvent through these cracks causes the solubilization of the curcumin and its release into the solution/extract. In addition, the micro-jets resulting from the implosion of the turmeric gases cause significant turbulence associated with significant mass transfer.
During ultrasonication and acoustic cavitation, friction/shearing forces appear at the separation surface between turmeric and the liquid mass, which can break certain bonds in the starch (a natural polymer with a high molecular mass) making a depolymerization reducing the adhesion between the turmeric components; In this way, the curcumin can be released and solubilized by the solvent in the extraction bath.

Extraction Mechanism—Assisted by Microwaves

Microwave-assisted curcumin extraction is based on the classical principle of the action of microwaves: under the influence of a fluctuating electromagnetic field, water becomes electrically charged (with positive charges on H atoms and with a negative charge on oxygen) and continuously tries to reorient itself according to that electromagnetic field generated by the microwave oven; from these reorientations, water molecules continuously collide with neighboring molecules, developing friction energies and therefore heat [16,61]. The temperature of the extractive system (water + turmeric) increases extremely rapidly, causing the pressure inside the turmeric to increase and finally cracking/destruction of the architectural structure of the turmeric. In fact, the effect of microwaves is due to heat transfer, even the “thermal shock” that occurs in the first minute of irradiation.

3.4. Characterization of the Extracts by Colorimetric Measurements

For the chromatic evaluation of the liquid extracts, the portable spectrophotometer DataColor Check II Plus, equipped for measurements in diffuse reflection mode and optimized for color control applications, is used. Given that this device is not designed for transmission measurements (which are specific to solutions in UV–VIS cuvettes), an alternative approach was adopted that involves analyzing the color by reflectance from the liquid surface.
The choice of this method allows the comparative monitoring of color variations between samples, in a practical and reproducible way. However, it should be noted that the method has certain limitations: measurement through the walls of a glass container can introduce minor errors caused by internal reflections, the thickness of the glass, or possible optical imperfections. Also, in the case of very light or very dark solutions, the contrast with the background can influence the perception of the instrument.
However, under conditions of a well-controlled methodology, the results obtained are relevant for the chromatic comparison between samples treated differently, even if they are not directly equivalent to those obtained by transmission spectrophotometry.
The use of DataColor Check II Plus offers the advantage of a fast, stable reading and standardized measurement parameters, which makes this method suitable for comparative applications in the color analysis of natural extracts.

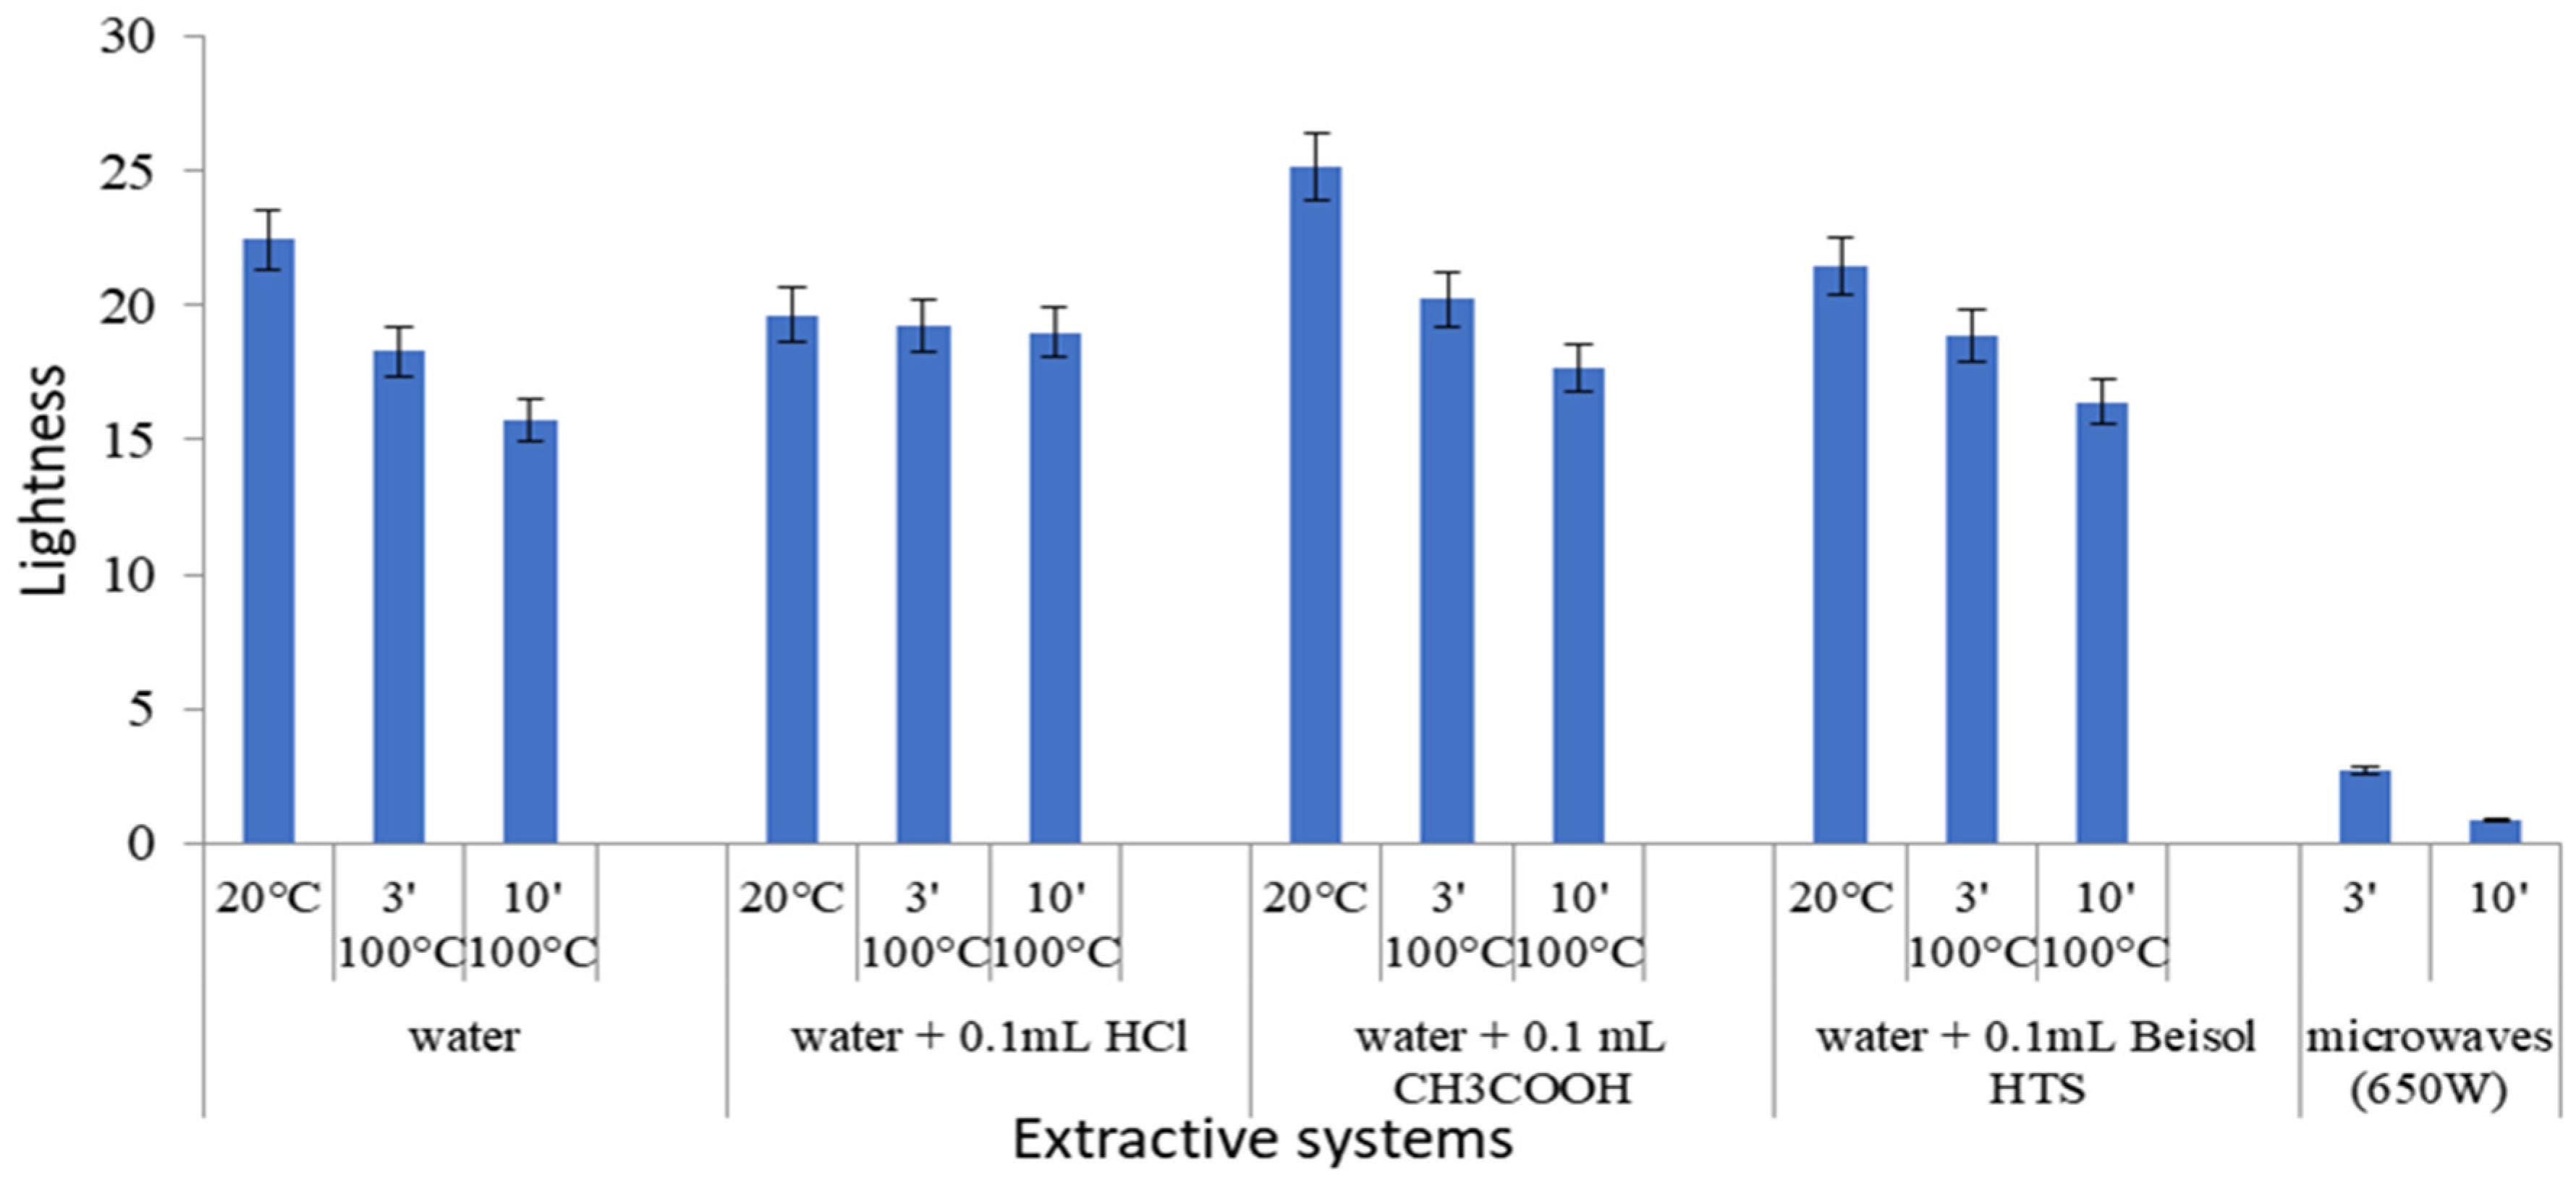
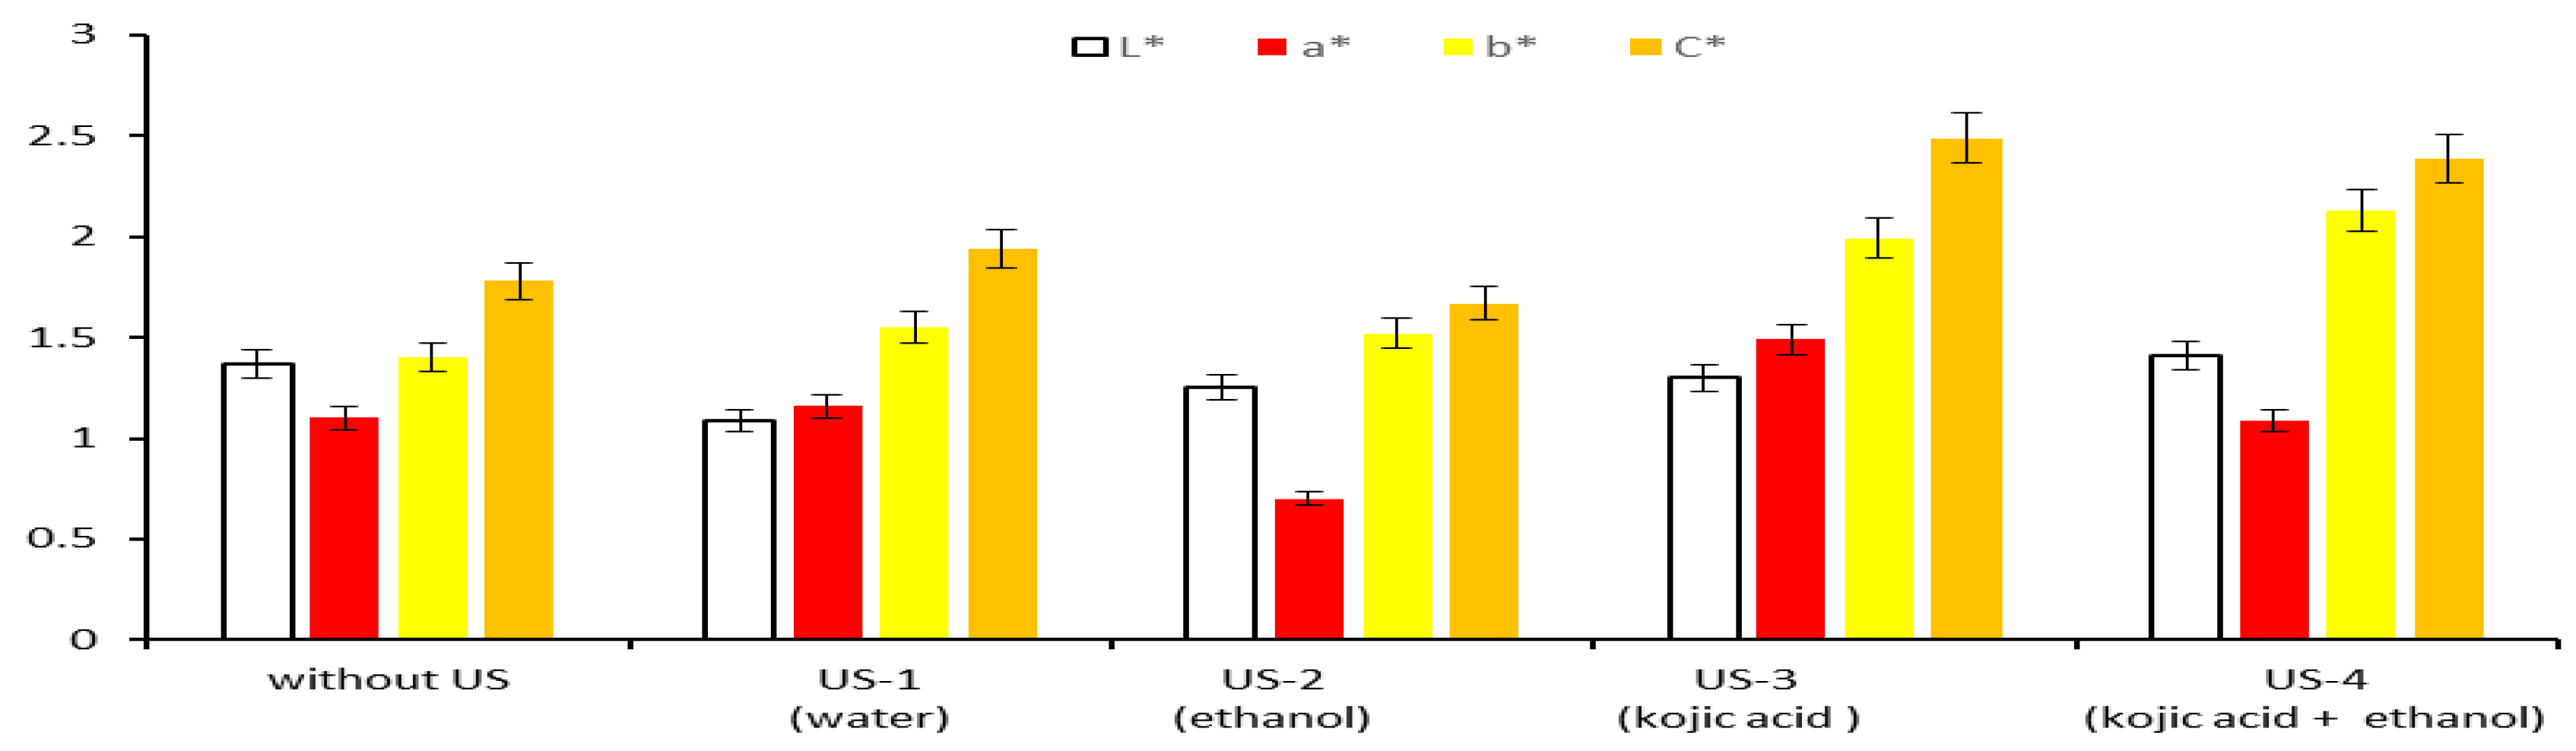
3.4.1. CIELab Values of Extracts Obtained by Applying Conventional Methods

The extracts obtained from the listed extractive systems, of 1 g/L (0.1 g turmeric in each extractive system: 100 mL water, 100 mL water + 0.1 mL HCl, 100 mL water + 0.1 mL CH3COOH, 100 mL water + 0, 1 mL Beisol HTS) are evaluated using colorimetric measurements (Figure 10 and Figure 11): L*, a*, and b*. The meaning of these quantities is as follows: L* = lightness, a* = color position on the red–green axis, and b* = color position on the blue–yellow axis.
The results are exhibited in Figure 10 and Figure 11 where, for comparison, the results from microwave irradiation (650 W) are also exhibited. It is observed that the highest values of L* are obtained at 20 °C, which means that at this temperature, curcumin extraction is poor. As two extraction parameters (time and temperature) increase, the lightness values decrease as curcumin is released from the turmeric powder. The most effective extraction method is the one assisted by microwaves (at 650 W, 0.1 g turmeric in 100 mL water): the lightness decreases extremely much, both at 3 min and especially at 10 min of irradiation. The decrease in lightness is accompanied by an increasingly pronounced yellow hue, or by a yellow coloration with bluish hues, depending on the direction of chromatic variation along the blue–yellow axis. The yellow coloration of the extracts is accompanied by either reddish or greenish undertones, depending on the chromatic displacement along the red–green axis (Figure 11).

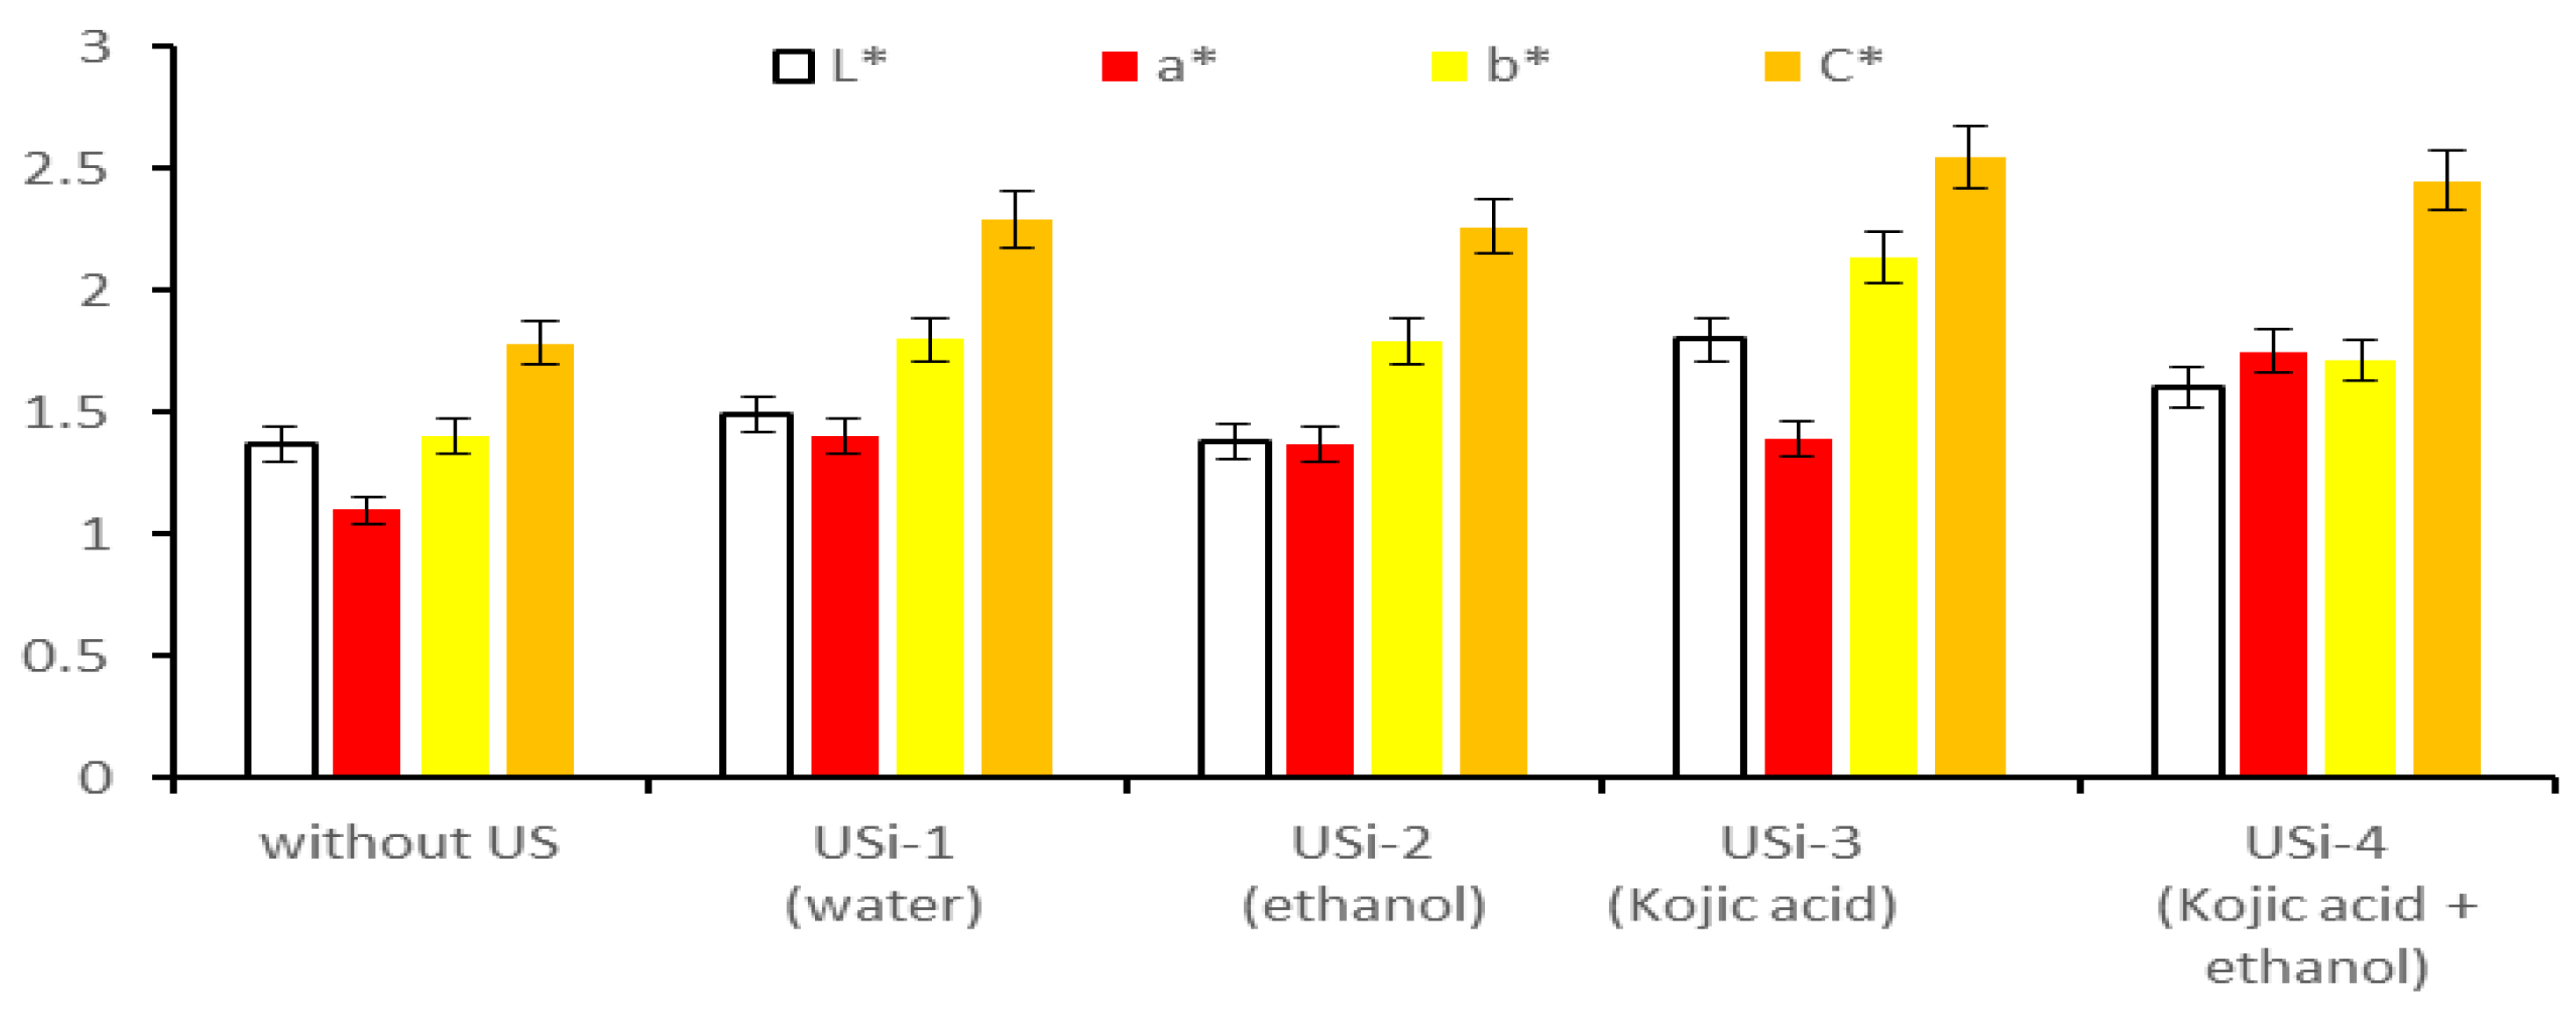
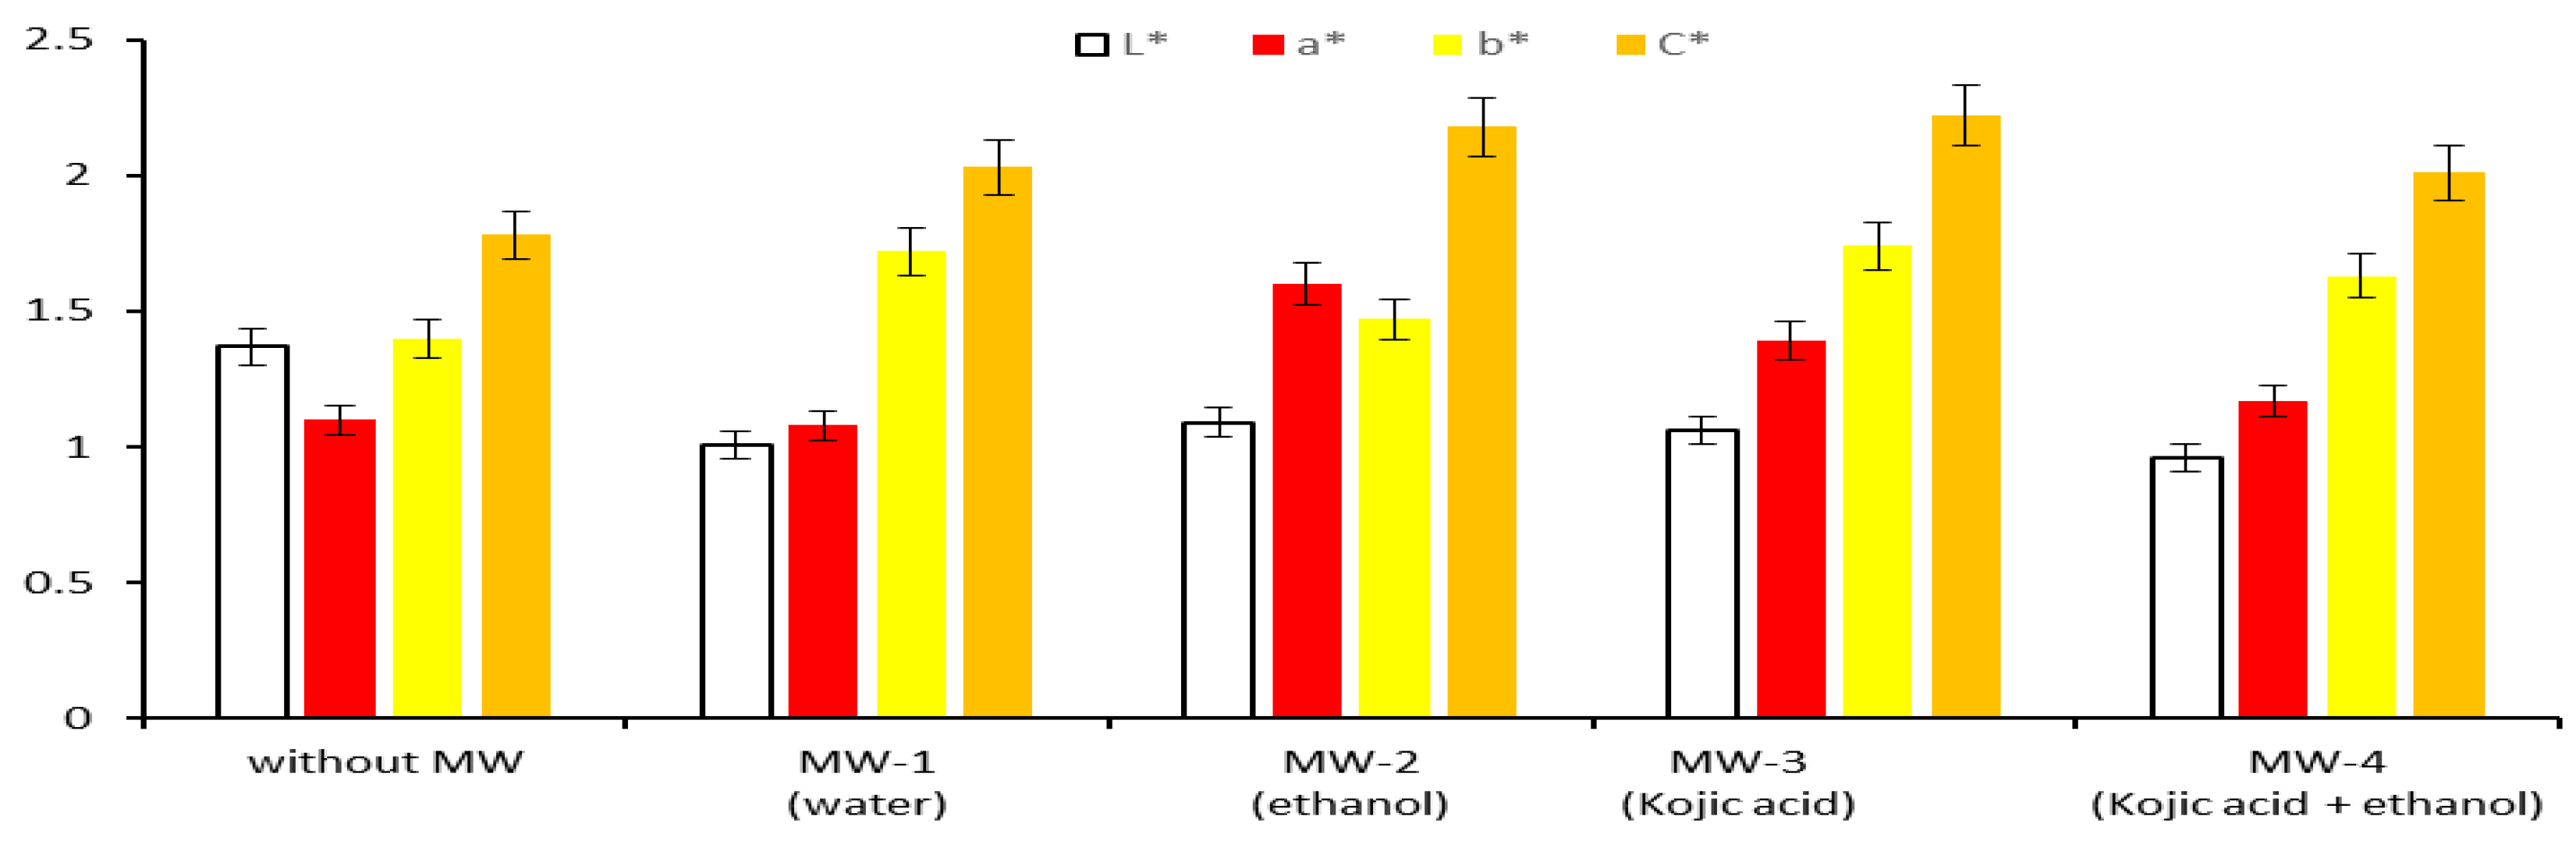
3.4.2. CIELab Values of Extracts Obtained by Applying Modern Methods

The extraction processes assisted by ultrasound, and especially those assisted by microwaves, cause the evaporation of a certain volume of water from the extractive system, which is why, for a fair comparison, only volumes of 30 mL of each extract obtained are used in this article, to measure and appreciate its color.
Figure 12 shows the CIELab values of the extracts obtained in the presence of continuously emitted ultrasound and some additives (solvent/ethanol, oxidant/kojic acid) in extractive systems US-1 to US-4, compared to the reference extractive systems (without ultrasound).
All ultrasound-assisted extractive systems generate more strongly colored extracts, with lower lightness values (L* ranging 1.37 to 1.09) and with higher b* and C* values (b* ranging 1.52 to 2.13 and C* varying 1.7 to 2.49)) than those obtained in the reference extractive system (without ultrasound) (L* = 1.37, b* = 1.4 and C* = 1.78). This fact confirms the effectiveness of ultrasound in extraction processes. The continuous action of ultrasound on the extractive systems in Figure 12 causes the degradation of the turmeric matrix and the release of curcumin, which gives the yellow coloration to the extracts.
The highest saturation/chroma is obtained when using kojic acid, in the presence of ultrasound, probably due to the synergistic effect of the partnership between an oxidant (kojic acid) and ultrasound.
In the case of intermittent ultrasound action (with pulses every 2 s), the results of colorimetric measurements are indicated in Figure 13.
As in the case of continuously emitted ultrasound, the results are also more favorable than in the case of the reference extractive system, with the extracts having higher values for C*, a*, and b*. After comparing the results of ultrasound-assisted extractions (Figure 12 and Figure 13), it is observed that intermittent ultrasound leads to brighter/saturated extracts (C* ranging 2.29 to 2.55), more yellow, with reddish hues (b* ranging 1.8 to 2.13 and a* varying 1.37 to 1.75). The explanation of this more effective behavior has to do with the cavitation phenomenon that is forced to repeat more times than in the case of continuous irradiation; in this case, the ultrasound pulses at 2 s intervals and thus several implosions of the cavities take place, i.e., hits with the liquid microjets (formed after the implosion) in the turmeric matrix, causing cracks.
The microwave-assisted extraction processes (at 750 W, for 10 min) leads to the following values for the CIELab color quantities (Figure 14):
  • The extracts are more colored, having lower lightness values (L* ranging 1.09 to 0.96) than the reference extract (without MW, L* = 1.37);
  • The yellow color with reddish hues is more pronounced (b* ranging 1.47 to 1.74 and a* varying 1.08 to 1.60) than that of the reference extract (b* = 1.4 and a* = 1.1);
  • Higher chroma/saturation for each extract obtained in the presence of microwaves (C* ranging 2.01 to 2.22), compared to the saturation of the reference extract (C* = 1.78).

4. Discussion

4.1. Efficiency of Ultrasound and Microwave in Extraction Processes of Curcumin from Turmeric

To evaluate the efficiency of curcumin extraction under the action of physical stimuli (US and MW), extractions are performed in control baths (“blind baths”), in the absence of the textile material. These baths contain the same proportions of water, turmeric, ethanol, or kojic acid (depending on the extractive system used) as in the usual dyeing conditions and are subjected to the same irradiation regime.
After dilution, the extracts obtained using two modern extraction techniques (US-assisted extraction and MW-assisted extraction) are subjected to spectrophotometric analysis. Both the extraction method and the composition of the extraction medium influence the spectroscopic behavior of curcumin, particularly the position and intensity of its maximum absorbance, typically observed in the 420–425 nm range in the presence of ethanol. Notably, higher absorbance values are recorded for the extracts obtained via MW-assisted extraction, suggesting a more effective disruption of the turmeric matrix and an increased release of curcumin under these specific experimental conditions (Figure 15).
Figure 15 shows that microwave irradiation is effective in rapidly breaking down the turmeric matrix, even in the absence of an oxidizing agent (kojic acid) or a solvent (ethanol). This effective disruption of the turmeric structure significantly enhances curcumin release, indicating that microwaves alone serve as a powerful tool for promoting compound extraction through non-conventional means.
Table 3 exhibits the absorbance values of the initial extracts, determined at the maximum wavelengths specific to curcumin, which, according to the data in Table 2, are situated in the 415–430 nm range. As discussed in Section 3.3.4, these values are influenced by the type of physical stimulus applied (ultrasound or microwave) as well as by the presence of additives—namely, an oxidizing agent and a solvent—in the extraction system.
The data in Table 3 and Figure 15 indicate that the highest absorption value is recorded for the extractive system consisting of 100 mL water + 0.1 mL ethanol + 0.1 g kojic acid, which is irradiated with MW. In this case, according to the efficiency calculation, a value of 78.35% is obtained.
Regardless of the extraction system used, microwave-assisted extraction processes yield higher values for efficiency, from 68.37% to 78.35% (Table 4). The lowest values (53.11–69.38%) are obtained when the extraction processes are assisted by continuously emitted US.
For the extraction of a natural dye, these values are very high (usually the extraction efficiency does not exceed the value of 55%) and are due to the action of microwaves, which, due to the thermal shock related to dielectric heating, causes swelling and then degradation/cracking of the turmeric matrix and release of curcumin.
Thermal shock is also responsible for the appearance of fluorescence, both in the case of extracts and textile supports dyed in the presence of microwaves [16].

4.2. Color Characteristics of the Dyed Textile Materials

Extractive systems composed of turmeric, water, ethanol, and kojic acid are applied as dyeing media in the treatment of various textile substrates. The dyeing efficiency of textile substrates can be evaluated by the magnitude of the color strength (K/S) value.
In the case of the simultaneous MW-assisted extraction and dyeing process, the K/S values obtained from the dyed textiles are used to evaluate color strength and, by extension, reflect the amount of curcumin absorbed by the textile fibers. According to the Kubelka–Munk theory, the K/S value is directly related to the amount of dye absorbed, as it is derived from the reflectance (R), which decreases with increasing dye concentration. Therefore, higher K/S values indicate a higher absorption of curcumin into the fiber during the MW-assisted process. The color strength can be influenced not only by the availability of curcumin in the dye bath, but also by its molecular interaction with the textile substrate and the stability of the compound upon microwave irradiation. In MW-assisted dyeing, thermal and non-thermal effects can influence fiber–dye interactions, as reflected in the K/S value.
Knowing that turmeric/curcumin has affinities that depend on the nature of the textile support, in this work both materials made of natural fibers and those made with synthetic fibers are tested/dyed. The dyeing processes are carried out in the presence of microwaves, and the results are indicated in Table 5 and Figure 16.
The dyeing and extraction of curcumin were carried out simultaneously in a neutral pH environment (approximately 7), without the use of acidic or alkaline solutions. The choice of a neutral environment was determined by the need to ensure the stability of curcumin during both stages, since in acidic or alkaline environments curcumin can undergo degradation or color changes. It is also important to note that although the pH of the solution was kept constant at 7, interactions between curcumin and the textile substrate can locally influence the pH of the solution, which can have an impact on the adsorption of the dye on the fibers. These interactions can vary depending on the nature of the fiber, and local changes in pH can influence the efficiency of the curcumin extraction and fixation process. Therefore, the absence of direct pH monitoring represents a potential source of variation in the results obtained.
The values exhibited in Table 5 represent the arithmetic means obtained under the conditions described in Section 2.3—Methods of Analysis, along with the corresponding standard deviations resulting from the colorimetric measurements.
Dyeing various textile substrates (wool, cotton, hemp, silk, polyacrylonitrile, polyamide, polyester, and cellulose acetate) with curcumin, materials that differ in terms of origin, chemical structure, and affinity for the dye, leads to the obtaining of various shades of yellow, from lighter to darker tones.
The complete color evaluation is based on both the analysis of the perceived color and the coloring power of each textile support following dyeing with curcumin from the extract. While the color perception—in terms of lightness, tones, and saturation—is highlighted by the values of the CIELab colorimetric quantities (L*, a*, b*, C*), the absorption efficiency of curcumin is expressed by the color strength (K/S).
The color assessment of each textile support is carried out taking into account the following rules: low lightness means dark color; high b* values indicate strong yellow colors; a high chroma value (C*) indicates increased color saturation, which means that the shade is more intense, more vivid and more defined; high K/S values mean that the coloring power is high, due to the high affinity of the dye for the fibers in the textile support.
Analyzing the data in Table 5, it is shown that curcumin generates pronounced yellow colors on polyacrylonitrile (K/S = 15.14, L* = 81.58, b* = 86.32, and C* = 86.53), cellulose acetate (K/S = 14.17, L* = 90.39, b* = 90.40, and C* = 91.87) and wool (K/S = 10.93, L* = 69.76, b* = 67.55, and C* = 68.42).
The K/S evaluates the degree of absorption of curcumin on different textile substrates. The highest color strengths are obtained on polyacrylonitrile (K/S = 15.14) and cellulose acetate (K/S = 14.17), which suggests that their dyeing mechanisms involve hydrophobic interactions between curcumin and the synthetic or semi-synthetic fibers. Comparing with the K/S values obtained for polyamide (3.06) and polyester (2.83), synthetic fibers considered to be more hydrophobic and non-polar than polyacrylonitrile and cellulose acetate, it is shown that the dyeing could also be due to the dissolution of curcumin in the synthetic polymer as in a solvent, if the physical structure of the polymer allows this. The ordered structures and high degrees of crystallinity of polyester and polyamide negatively influence the absorption of curcumin, which is evidenced by the lower K/S values than in the case of polyacrylonitrile.
In fact, in the MW-assisted dyeing process, the coloration performance of textile materials is influenced by a combination of thermal and non-thermal effects, whose proportions and manifestations vary depending on the chemical structure of the textile substrate. The thermal effect, resulting from the rapid heating of the system under electromagnetic radiation, contributes to the acceleration of both the extraction and fixation reactions of the dye. The non-thermal effects, caused by the direct interaction of microwaves with molecules in the solution and within the substrate, include increased mobility of polar molecules from turmeric, accelerated extraction of curcumin from turmeric powder, the formation of excited states that may enhance the reactivity of the dye, and, in certain cases, a temporary reorganization of the fiber’s polymeric structure, which facilitates dye penetration and fixation. The intensity and relevance of these effects differ according to the chemical composition, polarity, and the ability of each fiber to interact with the electromagnetic field, which explains the variations in K/S values observed after dyeing.
Following microwave irradiation (750 W, 10 min), textile substrates made of polyacrylonitrile and cellulose acetate exhibited significantly higher color strength compared to natural fibers and other synthetic substrates tested. This behavior can be attributed to the ability of these polymers, under specific thermal conditions, to facilitate the dissolution of the nonpolar dye (curcumin) present in turmeric. At temperatures near their glass transition point (Tg), the amorphous regions of polyacrylonitrile and cellulose acetate become sufficiently flexible to allow partial diffusion and solubilization of the pigment within the polymer matrix. In contrast, natural fibers (such as cotton, hemp, or wool) retain the colorant mainly through surface adsorption and hydrogen bonding, leading to weaker dye–fiber interactions. This distinct fixation mechanism explains the experimental color intensity hierarchy observed and highlights the potential of semi-synthetic and synthetic fibers for natural dyeing processes under microwave irradiation.

4.3. Fastness Properties

The results of the washing and rubbing tests (dry and wet) reflect the quality of the dyed samples. Curcumin extracts used in microwave-assisted dyeing lead to superior fastness properties evidenced by high grades (between 4 and 5) awarded according to the two gray scale assessments, both for washing fastness and color fastness to rubbing (Table 6).

5. Limitations

-
A significant limitation of this study is the lack of direct monitoring of the surface temperature of the textile material during the simultaneous extraction and dyeing process assisted by microwaves. While the temperature of the extraction solution was measured (reaching approximately 54 °C after the first minute and 98 °C at the end of the 10 min process), the surface temperature of the textile materials could not be monitored due to the constraints of the microwave equipment used. This limitation restricts the ability to fully isolate thermal from non-thermal effects in the process.
-
Although UV–VIS analysis confirmed the presence of curcumin in turmeric extracts, using the characteristic absorption signal at 420 nm and 425 nm, the main limitation of this study is the absence of a selective analytical technique, such as HPLC, that would have allowed for a more specific identification of curcumin.
-
One limitation of the present study lies in the absence of a true control dyeing experiment using separately pre-extracted curcumin. Although blind baths without textile support were included to observe the extractive capacity of the system, this does not fully isolate the dyeing efficiency from the extraction process. Future studies should include dyeing trials with standardized curcumin extracts, applied independently, in order to better distinguish between the extraction and fixation mechanisms involved under microwave-assisted conditions.
-
Although the dyeing process was conducted in a neutral pH environment to minimize pH-related effects on curcumin, the lack of direct pH monitoring during both the extraction and dyeing processes may limit the comprehensive understanding of how pH influences curcumin stability and dyeing behavior. Future studies could incorporate real-time pH monitoring to better assess the impact of pH variations on both extraction efficiency and dyeing outcomes

6. Conclusions

This study was not limited to curcumin extraction but extended the research to its application in textile dyeing, demonstrating the potential of using curcumin as a natural dyeing agent on both natural and synthetic fiber materials.
Curcumin is a natural yellow dye (C.I. Natural Yellow 3) found both in turmeric rhizomes and in turmeric powder. The extraction of curcumin from turmeric powder depends on the classical or unconventional extraction method and the presence or absence of an agent/solvent in the extraction system.
Classical extraction methods involve the use of water as a solvent in the absence or presence of a chemical agent that can destroy the starch in the turmeric matrix, thus making possible the release/extraction of curcumin. Such agents tested were HCl, concentrated CH3COOH, H2O2, Beisol HTS enzyme, and kojic acid.
Unconventional extraction methods based on the action of physical stimuli can crack or even destroy the matrix in turmeric, releasing more curcumin. In this work, the extraction efficiencies are tested in the presence of ultrasound and microwaves.
The qualitative assessment (observation of the intensity of the blue color in the presence of the I2/KI mixture) but also the quantitative one (UV–VIS analyses and CIELab) indicate that the microwave-assisted method is preferable.
Microwave-assisted extraction processes lead to higher results as evidenced by the CIELab values obtained for the extracts (colorimetric parameters ranging as follows: L* from 1.09 to 0.96, a* from 1.08 to 1.6, and b* from 1.47 to 1.74) compared to the extracts obtained under the same conditions but without microwaves. The extracts obtained under the action of microwaves (10 min) show high values for saturation/chrome (C* ranging from 2.01 to 2.022), which indicates more vivid yellow colors.
The efficiencies of ultrasound-assisted extractions depend on the way they are emitted and on the additions in the extraction system (solvent/ethanol, oxidant/kojic acid): between 53.11 and 68.38% in the case of continuous ultrasound and from 67.73 to 69.02% in the case of intermittent ultrasound (every 2 s). In the case of using microwaves for the extraction of curcumin from turmeric powder, the best option is the one in which the extraction system contains small amounts of ethanol and kojic acid (the efficiency being 78.35%).
The curcumin exhibits a strong affinity for both synthetic fiber and natural fiber textiles. However, the most intense yellow hues are obtained on polyacrylonitrile (K/S = 15.14, L* = 81.58, b* = 86.32, C* = 86.53) and cellulose acetate (K/S = 14.17, L* = 90.39, b* = 90.40, C* = 91.87), which also show the best fastness properties.
This study demonstrates the potential of using microwave-assisted extraction and dyeing processes for curcumin extraction and textile dyeing. Both thermal and non-thermal effects of microwaves contribute synergistically to the overall process and although the exact separation of these effects could not be achieved due to technical limitations, the results indicate an efficient dyeing performance with curcumin. Future studies should explore ways to monitor temperature during microwave treatments and evaluate the individual contributions of thermal and non-thermal effects.

Author Contributions

Conceptualization, V.P. and A.-D.A.; methodology, V.V.; software, G.P.; investigation, A.-D.A., G.P. and V.V.; writing—original draft preparation, A.-D.A. and V.P.; writing—review and editing, V.P.; visualization, V.P., A.-D.A., G.P. and V.V. All authors have read and agreed to the published version of the manuscript.

Funding

This research received no external funding.

Institutional Review Board Statement

Not applicable.

Informed Consent Statement

Not applicable.

Data Availability Statement

The original contributions presented in the study are included in the article; further inquiries can be directed to the corresponding author.

Acknowledgments

The study presented in this article was conducted within the frame of the Centre for Research and Innovation in Textiles and Fashion Industry SMART-Tex-IS from Gheorghe Asachi Technical University of Iasi, Romania.

Conflicts of Interest

The authors declare no conflicts of interest.

References

  1. Chattopadhyay, I.; Biswas, K.; Bandyopadhyay, U.; Banerjee, R.K. Turmeric and curcumin: Biological actions and medicinal applications. Curr. Sci. 2004, 87, 44–50. [Google Scholar]
  2. Jia, S.; Sun, Y.; Li, L.; Wang, R.; Xiang, Y.; Li, S.; Zhang, Y.; Jiang, H.; Du, Z. Discrimination of turmeric from different origins in China by MRM-based curcuminoid profiling and multivariate analysis. Food Chem. 2021, 338, 127794. [Google Scholar] [CrossRef] [PubMed]
  3. Chungkrang, L. Environmental friendly synthesis of natural dyes and pigments. Int. J. Chem. Stud. 2020, 8, 2398–2402. [Google Scholar] [CrossRef]
  4. Yusuf, M.; Shabbir, M.; Mohammad, F. Natural Colorants: Historical, Processing and Sustainable Prospects. Nat. Prod. Bioprospect. 2017, 7, 123–145. [Google Scholar] [CrossRef] [PubMed]
  5. Kamble, K.J.; Ingale, V.M.; Kaledhonkar, D.P. Comparative study of curcumin extraction from turmeric varieties grown in Maharashtra. Afr. J. Food Sci. 2011, 5, 780–789. [Google Scholar] [CrossRef]
  6. Thangavel, K.; Dhivya, K. Determination of curcumin, starch and moisture content in turmeric by Fourier transform near infrared spectroscopy (FT-NIR). Eng. Agric. Environ. Food 2019, 12, 264–269. [Google Scholar] [CrossRef]
  7. Sharma, A.; Dikshit, M.; Tiwari, R.C.; Sharma, V.B. Haridra-Curcumin the active principle. World J. Pharm. Res. 2021, 10, 357–362. [Google Scholar] [CrossRef]
  8. Bagchi, A. Extraction of Curcumin. IOSR J. Environ. Sci. Toxicol. Food Technol. (IOSR-JESTFT) 2012, 1, 01–16. [Google Scholar] [CrossRef]
  9. Chignell, C.; Bilski, P.; Reszka, Z.; Motten, A.; Sik, R.; Dahl, T. Spectral and photochemical properties of curcumin. Photochem. Photobiol A Chem. 1994, 59, 295–302. [Google Scholar] [CrossRef]
  10. BeMiller, J.N. (Ed.) Starches: Molecular and Granular Structures and Properties. In Carbohydrate Chemistry for Food Scientists, 3rd ed.; AACC International Press: St. Paul, MN, USA, 2019; pp. 159–189. [Google Scholar]
  11. Maniglia, B.C.; Silveira, T.M.G.; Tapia-Blacido, D.R. Starch isolation from turmeric dye extraction residue and its application in active film production. Int. J. Biol. Macromol. 2022, 202, 508–519. [Google Scholar] [CrossRef]
  12. Seung, D. Amylose in starch: Towards an understanding of biosynthesis, structure and function. New Phytol. 2020, 228, 1490–1504. [Google Scholar] [CrossRef] [PubMed]
  13. Cole, M.; Eggleston, G.; Triplett, A. New Starch Methodology to Measure Both Soluble and Insoluble Starch. Adv. Sugar Crop Proc. Conv. 2016, 1, 150–177. [Google Scholar]
  14. Sahne, F.; Mohammadi, M.; Najafpour, G.D.; Moghadamnia, A.A. Enzyme-assisted ionic liquid extraction of bioactive compound from turmeric (Curcuma longa L.): Isolation, purification and analysis of curcumin. Ind. Crops Prod. 2017, 95, 686–694. [Google Scholar] [CrossRef]
  15. Braga, M.E.M.; Moreschi, S.R.M.; Meireles, M.A.A. Effects of supercritical fluid extraction on Curcuma longa L. and Zingiber officinale R. starches. Carbohydr. Polym. 2006, 63, 340–346. [Google Scholar] [CrossRef]
  16. Popescu, V.; Astanei, D.-G.; Burlica, R.; Popescu, A.; Munteanu, C.; Ciolacu, F.; Ursache, M.; Ciobanu, L.; Cocean, A. Sustainable and cleaner microwave-assisted dyeing process for obtaining eco-friendly and fluorescent acrylic knitted fabrics. J. Clean. Prod. 2019, 232, 451–461. [Google Scholar] [CrossRef]
  17. Quoc, L.P.T. Ultrasound-assisted extraction of phenolic compounds from red turmeric (Curcuma zanthorrhiza). Bull. Transilv. Univ. 2019, 12, 107–116. [Google Scholar] [CrossRef]
  18. Creţu, R.; Dima, C.; Bahrim, G.; Dima, Ş. Improved solubilization of curcumin with a microemulsification formulation. Ann. Univ. Dunarea Galati Fascicle VI-Food Technol. 2011, 35, 46–55. [Google Scholar]
  19. Dandekar, D.V.; Gaikar, V.G. Microwave assisted extraction of curcuminoids from curcuma longa. Sep. Sci. Technol. 2002, 37, 2669–2690. [Google Scholar] [CrossRef]
  20. Manasa, P.S.L.; Kamble, A.D.; Chilakamarthi, U. Various Extraction Techniques of Curcumin—A Comprehensive Review. ACS Omega 2023, 8, 34868–34878. [Google Scholar] [CrossRef]
  21. Bhardwaj, N.; Dadsena, U. Extraction and evaluation of dyeing quality of natural curcumin. J. Innov. Appl. Pharma. Sci. (JIAPS) 2017, 2, 01–03. [Google Scholar]
  22. Ciuca, M.D.; Racovita, R.C. Curcumin: Overview of Extraction Methods, Health Benefits, and Encapsulation and Delivery Using Microemulsions and Nanoemulsions. Int. J. Mol. Sci. 2023, 24, 8874. [Google Scholar] [CrossRef] [PubMed]
  23. Habib, N.; Batool, F.; Adeel, S.; Naveed, M.; Ali, A.; Mia, R.; Assiri, M.A. Green extraction and application of yellow natural curcumin colorant from Curcuma aromatica rhizomes for silk dyeing. Sci. Rep. 2024, 14, 13032. [Google Scholar] [CrossRef] [PubMed]
  24. Dass, P.M.; Joshua, Y.; Atoshi, M.A.; Emmanuel, E. Extraction, optimization and evaluation of turmeric root (Curcuma longan) dyeing conditions on cotton fabric. Int. J. Multidiscip. Res. Growth Eval. 2023, 4, 930–935. [Google Scholar] [CrossRef]
  25. Rahman, M.M.; Kim, M.; Youm, K.; Kumar, S.; Koh, J.; Hong, K.H. Sustainable one-bath natural dyeing of cotton fabric using turmeric root extract and chitosan biomordant. J. Clean. Prod. 2023, 382, 135303. [Google Scholar] [CrossRef]
  26. Awode, A.U.; Dalyop, G.M.; Olatidoye, S.D.; Tijani, S.; Kalu, I.H.; Adeyanju, O. Extraction, Chemical Modification and Characterization of Turmeric Dye (Curcuma longa) and its Application on Cotton Fabric. Int. J. Res. Innov. Appl. Sci. 2023, 8, 124–128. [Google Scholar] [CrossRef]
  27. Raduly, F.M.; Raditoiu, V.; Raditoiu, A.; Frone, A.N.; Nicolae, C.A.; Raut, I.; Constantin, M.; Grapin, M. Multifunctional Finishing of Cotton Fabric with Curcumin Derivatives Coatings Obtained by Sol–Gel Method. Gels 2023, 9, 369. [Google Scholar] [CrossRef]
  28. Sadaf, S.A.; Hassan, S.K.; Ahmad, Z.; Butt, M.N. Extraction and application of turmeric dye on silk fabric. J. Innov. Sci. 2024, 10, 1–6. [Google Scholar] [CrossRef]
  29. Do, K.L.; Ahsan, T.; Wahab, A.; Tayyab, M.; Yin, X.; Pan, N.; Huang, T.; Mushtaq, A.; Su, M. Bioactive Silk Revolution: Harnessing Curcuminoid Dye and Chitosan for Superior Antimicrobial Defence and UV Shielding. Pharmaceutics 2024, 16, 1510. [Google Scholar] [CrossRef]
  30. Palaskar, S.S.; Kale, R.D.; Deshmukh, R.R. Application of natural yellow (curcumin) dye on silk to impart multifunctional finishing and validation of dyeing process using BBD model. Color Res. Appl. 2021, 46, 1301–1312. [Google Scholar] [CrossRef]
  31. Onal, A.; Tombul, K.C.; Nached, S. Investigation of Dyeing Properties of Different Fabric Species with Curcuma Longa Extracts. Rev. Roum. Chim. 2020, 65, 983–988. [Google Scholar] [CrossRef]
  32. Lykidou, S.; Pashou, M.; Vouvoudi, E.; Nikolaidis, N. Study on the Dyeing Properties of Curcumin on Natural and Synthetic Fibers and Antioxidant and Antibacterial Activities. Fibers Polym. 2021, 22, 3336–3342. [Google Scholar] [CrossRef]
  33. ISO 105-C06-2010; Textiles—Tests for Colour Fastness—Part C06: Colour Fastness to Washing of Dyed Textiles. International Organization for Standardization (ISO): Geneva, Switzerland, 2010.
  34. ISO 105-X12-2016; Textiles—Color Fastness—Test for Rubbing Resistance (Dry and Wet). International Organization for Standardization (ISO): Geneva, Switzerland, 2016.
  35. Yallapua, M.M.; Jaggi, M.; Chauhana, S.C. Beta-Cyclodextrin-curcumin selfassembly enhances curcumin delivery in prostate cancer cells. Colloids Surf. B 2010, 79, 113–125. [Google Scholar] [CrossRef] [PubMed]
  36. Wang, P.; Hu, W.; Su, W. Molecularly imprinted poly (methacrylamide-comethacrylic acid) composite membranes for recognition of curcumin. Anal. Chim. Acta 2008, 615, 54–62. [Google Scholar] [CrossRef]
  37. Karimi, N.; Ghanbarzadeh, B.; Hamishehkar, H.; Mehramuz, B.; Kafil, H.S. Antioxidant, antimicrobial and physicochemical properties of turmeric extract-loaded nanostructured lipid carrier (NLC). Colloid Interfac. Sci. 2018, 22, 18–24. [Google Scholar] [CrossRef]
  38. Hossain, M.K.; Firoz Pervez, M.; Mia, M.N.H.; Mortuza, A.A.; Rahaman, M.S.; Karim, M.R.; Islam, J.M.M.; Ahmed, F.; Khan, M.A. Effect of dye extracting solvents and sensitization time on photovoltaic performance of natural dye sensitized solar cells. Results Phys. 2017, 7, 1516–1523. [Google Scholar] [CrossRef]
  39. Krishna Mohan, P.R.; Sreelakshmi, G.; Muraleedharan, C.V.; Joseph, R. Water soluble complexes of curcumin with cyclodextrins: Characterization by FT-Raman spectroscopy. Vib. Spectrosc. 2012, 62, 77–84. [Google Scholar] [CrossRef]
  40. Gunasekaran, S.; Kanchana Devi, M. UV-Vis Spectroscopic Investigation on Hydrolysis of Starch and Starch-Drug Interaction. Asian J. Chem. 2007, 19, 3363–3374. [Google Scholar]
  41. Muniglia, L.; Claisse, N.; Baudelet, P.-H.; Ricochon, G. Enzymatic Aqueous Extraction (EAE). In Alternative Solvents for Natural Products Extraction; Chemat, F., Vian, M.A., Eds.; Springer: Berlin/Heidelberg, Germany, 2014; pp. 167–205. [Google Scholar]
  42. Kurmudle, N.; Kagliwal, L.D.; Bankar, S.B.; Singhal, R.S. Enzyme-assisted extraction for enhanced yields of turmeric oleoresin and its constituents. Food Biosci. 2013, 3, 36–41. [Google Scholar] [CrossRef]
  43. Marathe, S.J.; Jadhav, S.B.; Bankar, S.B.; Singhal, R.S. Enzyme-Assisted Extraction of Bioactives. In Food Bioactives: Extraction and Biotechnology Applications; Puri, M., Ed.; Springer: Cham, Switzerland, 2017; pp. 171–201. [Google Scholar] [CrossRef]
  44. Sivakumar, V.; Lakshmi Anna, J.; Vijayeeswarri, J.; Swaminathan, G. Ultrasound assisted enhancement in natural dye extraction from beetroot for industrial applications and natural dyeing of leather. Ultrason. Sonochem. 2009, 16, 782–789. [Google Scholar] [CrossRef]
  45. Oancea, S.; Perju, M.; Olosutean, H. Influence of enzyme-aided extraction and ultrasonication on the phenolics content and antioxidant activity of Paeonia officinalis L. petals. J. Serb. Chem. Soc. 2020, 85, 845–856. [Google Scholar] [CrossRef]
  46. Ghafoor, K.; Yong-hee, C.; Yeong Jeon, J.; Jo, I.H. Optimization of ultrasound-assisted extraction of phenolic compounds, antioxidants, and anthocyanins from grape (Vitis Vinifera) seeds. J. Agric. Food Chem. 2009, 57, 4988–4994. [Google Scholar] [CrossRef] [PubMed]
  47. Ekezie, F.-G.C.; Sun, D.-W.; Cheng, J.-H. Acceleration of microwave-assisted extraction processes of food components by integrating technologies and applying emerging solvents: A review of latest developments. Trends Food Sci. Technol. 2007, 67, 160–172. [Google Scholar] [CrossRef]
  48. Liang, H.; Wang, W.; Xu, J.; Zhang, Q.; Shen, Z.; Zeng, Z.; Li, Q. Optimization of ionic liquid based microwave-assisted extraction technique for curcuminoids from Curcuma longa L. Food Bioprod. Process. 2017, 104, 57–65. [Google Scholar] [CrossRef]
  49. Kumar, S. Organic Chemistry. Spectroscopy of Organic Compounds; University Amritsar: Amritsar, India, 2006; pp. 10–64. [Google Scholar]
  50. Hansen, C.M. Hansen Solubility Parameters: A User’s Handbook, 2nd ed.; CRC Press: Boca Raton, FL, USA, 2007. [Google Scholar]
  51. Ruhanea, T.A.; Tauhidul Islam, M.; Saifur Rahaman, M.; Bhuiyan, M.M.H.; Islam, J.M.M.; Newaz, M.K.; Khan, K.A.; Khan, M.A. Photo current enhancement of natural dye sensitized solar cell by optimizing dye extraction and its loading period. Optik 2017, 149, 174–183. [Google Scholar] [CrossRef]
  52. Sahne, F.; Mohammadi, M.; Najafpour, G.D.; Moghadamnia, A.A. Extraction of bioactive compound curcumin from turmeric (Curcuma Longa L.) Via Different Routes: A comparative study. Pak. J. Biotechnol. 2016, 13, 173–180. [Google Scholar]
  53. Li, M.; Ngadi, M.O.; Ma, Y. Optimisation of pulsed ultrasonic and microwave-assisted extraction for curcuminoids by response surface methodology and kinetic study. Food. Chem. 2014, 165, 29–34. [Google Scholar] [CrossRef]
  54. Wakte, P.S.; Sachin, B.S.; Patil, A.A.; Mohato, D.M.; Band, T.H.; Shinde, D.B. Optimization of microwave, ultra-sonic and supercritical carbon dioxide assisted extraction techniques for curcumin from Curcuma longa. Sep. Purif. Technol. 2011, 79, 50–55. [Google Scholar] [CrossRef]
  55. Mason, T.J.; Peters, D. Practical Sonochemistry: Power Ultrasound Uses and Applications, 2nd ed.; Woodhead Publishing: London, UK, 2002. [Google Scholar] [CrossRef]
  56. Savun-Hekimoglu, B.A. Review on Sonochemistry and Its Environmental Applications. Acoustics 2020, 2, 766–775. [Google Scholar] [CrossRef]
  57. Kerboua, K.; Merouani, S.; Hamdaoui, O.; Alghyamah, A.; Islam, M.H.; Hansen, H.E.; Pollet, B.G. How do dissolved gases affect the sonochemical process of hydrogen production? An overview of thermodynamic and mechanistic effects—On the “hot spot theory”. Ultrason. Sonochem. 2021, 72, 105422. [Google Scholar] [CrossRef]
  58. Brenner, T.; Kiessler, B.; Radosta, S.; Arndt, T. Processing surface sizing starch using oxidation, enzymatic hydrolysis and ultrasonic treatment methods—Preparation and application. Carbohydr. Polym. 2016, 138, 273–279. [Google Scholar] [CrossRef]
  59. Suslick, K.; Flannigan, S.D.J. Inside a collapsing bubble—Sonoluminescence and the conditions during cavitation. Annu. Rev. Phys. Chem. 2008, 59, 659–683. [Google Scholar] [CrossRef] [PubMed]
  60. Suslick, K.S.; Eddingsaas, N.C.; Flannigan, D.J.; Hopkins, S.D.; Xu, H. The Chemical History of a Bubble. Acc. Chem. Res. 2018, 51, 2169–2178. [Google Scholar] [CrossRef] [PubMed]
  61. Kubrakova, I.V.; Toropchenova, E.S. Microwave heating for enhancing efficiency of analytical operations. Inorg. Mater. 2008, 44, 1509–1519. [Google Scholar] [CrossRef]
Figure 1. Agents used in the classic methods of curcumin extraction from turmeric powder.
Fibers 13 00073 g001
Figure 2. Modern extraction methods assisted by microwaves or ultrasound.
Fibers 13 00073 g002
Figure 3. FTIR spectra for turmeric powder (blue spectrum) and pure curcumin (red spectrum).
Fibers 13 00073 g003
Figure 4. The colors of starch degradation forms, highlighted with an I2/KI solution.
Fibers 13 00073 g004
Figure 5. The results of the I2/KI test in the case of extraction from 0.1 g turmeric + 100 mL water + 0.1 mL H2SO4 (a) or with 0.1 mL H2O2 (b); test tube codes: test tube 1 = initial extract (after magnetic stirring at 300 RPM); test tube 2 = the extract after 48 h cold storage; test tube 3 = the extract after boiling for 2 min; test tube 4 = the extract after boiling for 10 min.
Fibers 13 00073 g005
Figure 6. Iodometric method results in the case of extraction from 0.1 g turmeric + 100 mL water + 0.1 g kojic acid after boiling for 0; 2′, 5′, 13′, 20′, 30′, and 32 min at 100 °C.
Fibers 13 00073 g006
Figure 7. Results of the qualitative analysis of starch degradation from turmeric powder, in the case of using 0.1–0.5 mL of Beisol HTS enzyme (the volume of Beisol HTS being indicated directly on the test tubes): (a) after 10 min of boiling 0.1 g turmeric powder + 100 mL water + 0.1–0.5 mL Beisol HTS; (b) after 24 h of cold storage of the extract obtained by boiling for 10 min in the presence of the enzyme.
Fibers 13 00073 g007
Figure 8. Results of the iodometric method in the case of curcumin extraction at 100 °C for 3 min (a) and 10 min (b) in: water (1); water + 0.1 mL HCl (2); water + 0.1 mL CH3COOH (3); water + 0.1 mL Beisol HTS (enzyme) (4); water in the presence of microwaves (5).
Fibers 13 00073 g008
Figure 9. The result of the qualitative analysis for each extractive process assisted by ultrasound or microwaves.
Fibers 13 00073 g009
Figure 10. Lightness (L*) values of extracts from each extractive system (initial water volume: 100 mL, volume of analyzed extract: 30 mL), with error bars representing percentage error.
Fibers 13 00073 g010
Figure 11. The a* and b* values of the extracts obtained in different extractive systems (initial water volume: 100 mL, volume of analyzed extract: 30 mL), with error bars representing percentage error.
Fibers 13 00073 g011
Figure 12. Color characterization of extracts obtained from the continuous action of ultrasound (20 kHz, 10 min) on extractive systems consisting of 100 mL water + 0.1 g turmeric powder + 0.1 mL ethanol or 0.1 g kojic acid (volume of analyzed extract: 30 mL), with error bars representing percentage error.
Fibers 13 00073 g012
Figure 13. Characterization of the colors of the extracts obtained from the alternative action of ultrasound (20 kHz, with pulses every 2 s, duration 10 min), on the extractive systems consisting of 100 mL water + 0.1 g powdered turmeric + 0.1 mL ethanol or 0.1 g kojic acid (volume of analyzed extract: 30 mL), with error bars representing percentage error.
Fibers 13 00073 g013
Figure 14. Characterization of the colors of the extracts obtained from the action of microwaves (750 W, 10 min), on extractive systems consisting of 100 mL water + 0.1 g turmeric powder + 0.1 mL ethanol or 0.1 g kojic acid (volume of analyzed extract: 30 mL), with error bars representing percentage error.
Fibers 13 00073 g014
Figure 15. Absorption curves of extracts resulting from modern extraction processes: (a) US-assisted processes (continuously emitted US); (b) US-assisted processes (intermittently emitted US); (c) MW-assisted processes; (same codes as in Table 1; dilution factor 3).
Fibers 13 00073 g015
Figure 16. The aspects and color strengths of dyed samples during processes assisted by microwaves; (each sample rests on a white background, and the photograph is taken under natural light).
Fibers 13 00073 g016
Table 1. Coding of extraction systems assisted by ultrasound or microwaves.
Extractive SystemsCodes for Extractions Assisted by:
USUSiMW
100 mL waterUS-1USi-1MW-1
100 mL water + 0.1 mL ethanolUS-2USi-2MW-2
100 mL water + 0.1 g kojic acidUS-3USi-3MW-3
100 mL water + 0.1 g kojic acid + 0.1 mL ethanolUS-4USi-4MW-4
Table 2. Maximum wavelengths (in nm) specific to curcumin and amylose, in UV–VIS analysis.
Extractive Systemsλmaxim for curcuminmaxim for amylose
USUSiMW
100 mL water425/-415/-420/560
100 mL water + 0.1 mL ethanol430/-420/-425/590
100 mL water + 0.1 g kojic acid420/-420/590425/585
100 mL water + 0.1 g kojic acid + 0.1 mL ethanol425/590420/575, 590425/590
Table 3. Absorbance of initial extracts obtained by ultrasound- and microwave-assisted extraction, at the maximum wavelength of curcumin.
Extractive SystemExtract Absorbance ± Standard Deviation
USUSiMW
100 mL water (without additives)0.1540 ± 0.00510.2238 ± 0.00750.2283 ± 0.0076
100 mL water + 0.1 mL ethanol0.2284 ± 0.00760.2331 ± 0.00780.2801 ± 0.0093
100 mL water + 0.1 g kojic acid 0.1819 ± 0.00610.2318 ± 0.00770.3043 ± 0.0100
100 mL water + 0.1 mL ethanol + 0.1 g kojic acid0.1987 ± 0.00660.2302 ± 0.00770.3336 ± 0.0100
Table 4. Efficiency of extraction systems assisted by ultrasound or microwaves.
Extractive SystemUSUSiMW
100 mL water (without additives)53.11 ± 1.7868.73 ± 2.2768.37 ± 2.29
100 mL water + 0.1 mL ethanol68.38 ± 2.2969.02 ± 2.3174.22 ± 2.48
100 mL water + 0.1 g kojic acid 60.30 ± 2.0268.84 ± 2.3076.27 ± 2.55
100 mL water + 0.1 mL ethanol + 0.1 g kojic acid63.66 ± 2.1368.63 ± 2.3078.35 ± 2.62
Table 5. Evaluation of the color dimensions of the dyed samples.
SampleCIELab Colorimetric Values 1Color Strength
K/S
Color Codes
L*a*b*C*RGB 2HEX 3
Wool69.76 ± 0.3810.87 ± 0.0667.55 ± 0.3868.42 ± 0.3810.93 ± 0.06224, 138, 29#e08a1d
Cotton81.05 ± 0.455.40 ± 0.0366.93 ± 0.3767.15 ± 0.373.60 ± 0.02241, 204, 28#f1cc1c
Silk88.26 ± 0.49−8.48 ± 0.0551.70 ± 0.2952.39 ± 0.291.97 ± 0.01225, 221, 98#e1dd62
Hemp81.10 ± 0.45−1.89 ± 0.0138.11 ± 0.2138.15 ± 0.211.28 ± 0.01190, 164, 94#bea45e
Polyacrylonitrile81.58 ± 0.45−6.13 ± 0.0386.32 ± 0.4886.53 ± 0.4815.15 ± 0.08255, 248, 39#fff827
Polyamide85.94 ± 0.48−11.44 ± 0.0657.87 ± 0.3258.97 ± 0.323.06 ± 0.01217, 212, 48#d9d430
Polyester89.70 ± 0.50−15.02 ± 0.0859.91 ± 0.3361.75 ± 0.342.83 ± 0.01248, 247, 7#f8f707
Cellulose acetate90.39 ± 0.50−16.35 ± 0.0990.40 ± 0.5091.87 ± 0.5114.17 ± 0.07255, 255, 69#ffff45
1 The values L*, a*, b*, C*, and K/S are dimensionless. 2 RGB—Color codes in the digital system (Red, Green, Blue). 3 HEX—Color codes in the hexadecimal system.
Table 6. Results of fastness properties.
SampleColor Fastness to WashingColor Fastness to Rubbing
Change in
Color
Staining
CottonWoolDryWet
Wool4-54-54-54-54-5
Cotton4444-54
Silk4-54-54-54-54
Hemp44444
Polyacrylonitrile55555
Polyamide4-54-54-54-54
Polyester4-54-54-54-54
Cellulose acetate55554-5
Disclaimer/Publisher’s Note: The statements, opinions and data contained in all publications are solely those of the individual author(s) and contributor(s) and not of MDPI and/or the editor(s). MDPI and/or the editor(s) disclaim responsibility for any injury to people or property resulting from any ideas, methods, instructions or products referred to in the content.

