


Verification of Crack Width Evaluation in Fiber-Reinforced Cementitious Composite Reinforced with Various Types of Fiber-Reinforced Polymer Bars


Abstract
Highlights
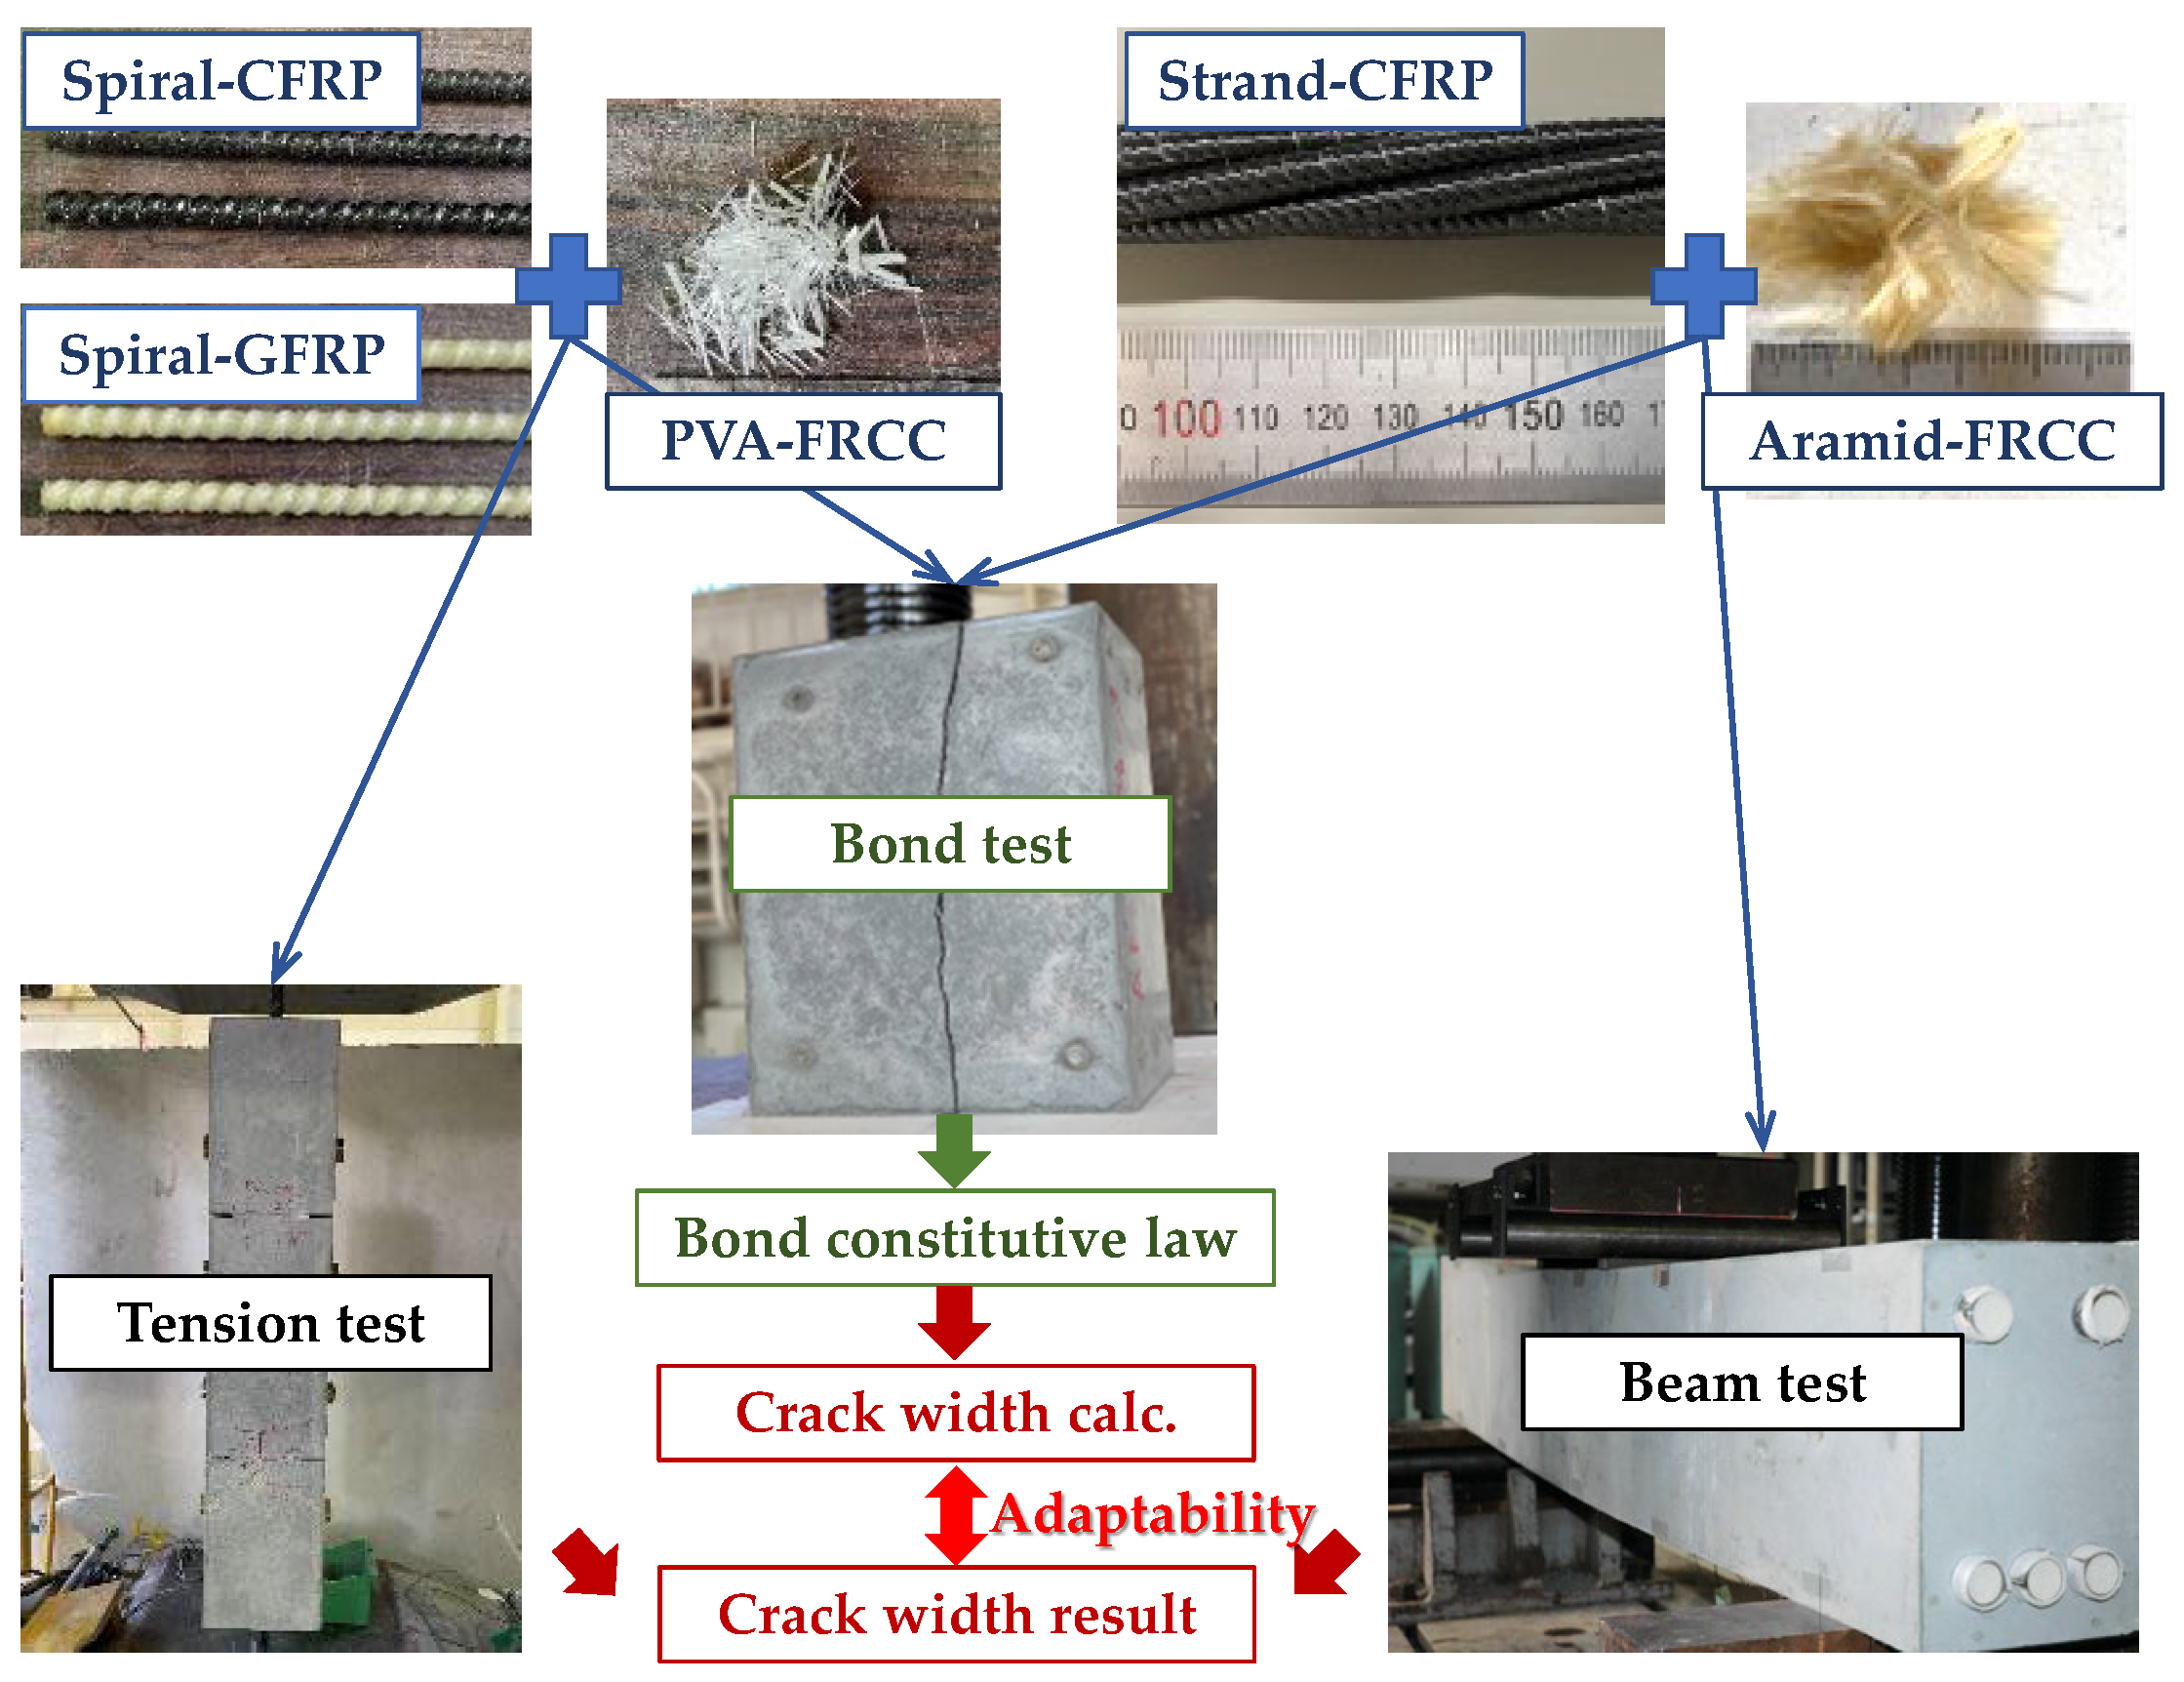
- The proposed crack width evaluation method is valid for various FRP–FRCC com-binations, as predictions matched test results.
- Greater rib height of FRP bars and higher fiber-volume fraction in FRCC improve bond strength and reduce crack width.
- The crack width evaluation method incorporating both bridging and bond behav-iors can be extended to various FRP–FRCC combinations, enabling broader struc-tural applications.
- It suggests that accurate bond modeling is essential for reliable crack width pre-diction, which in turn supports the development of design guidelines for FRP–FRCC composite members.
Abstract
1. Introduction
2. Bond Properties of FRP/FRCC
2.1. Bond Properties of Spiral-FRP/PVA-FRCC
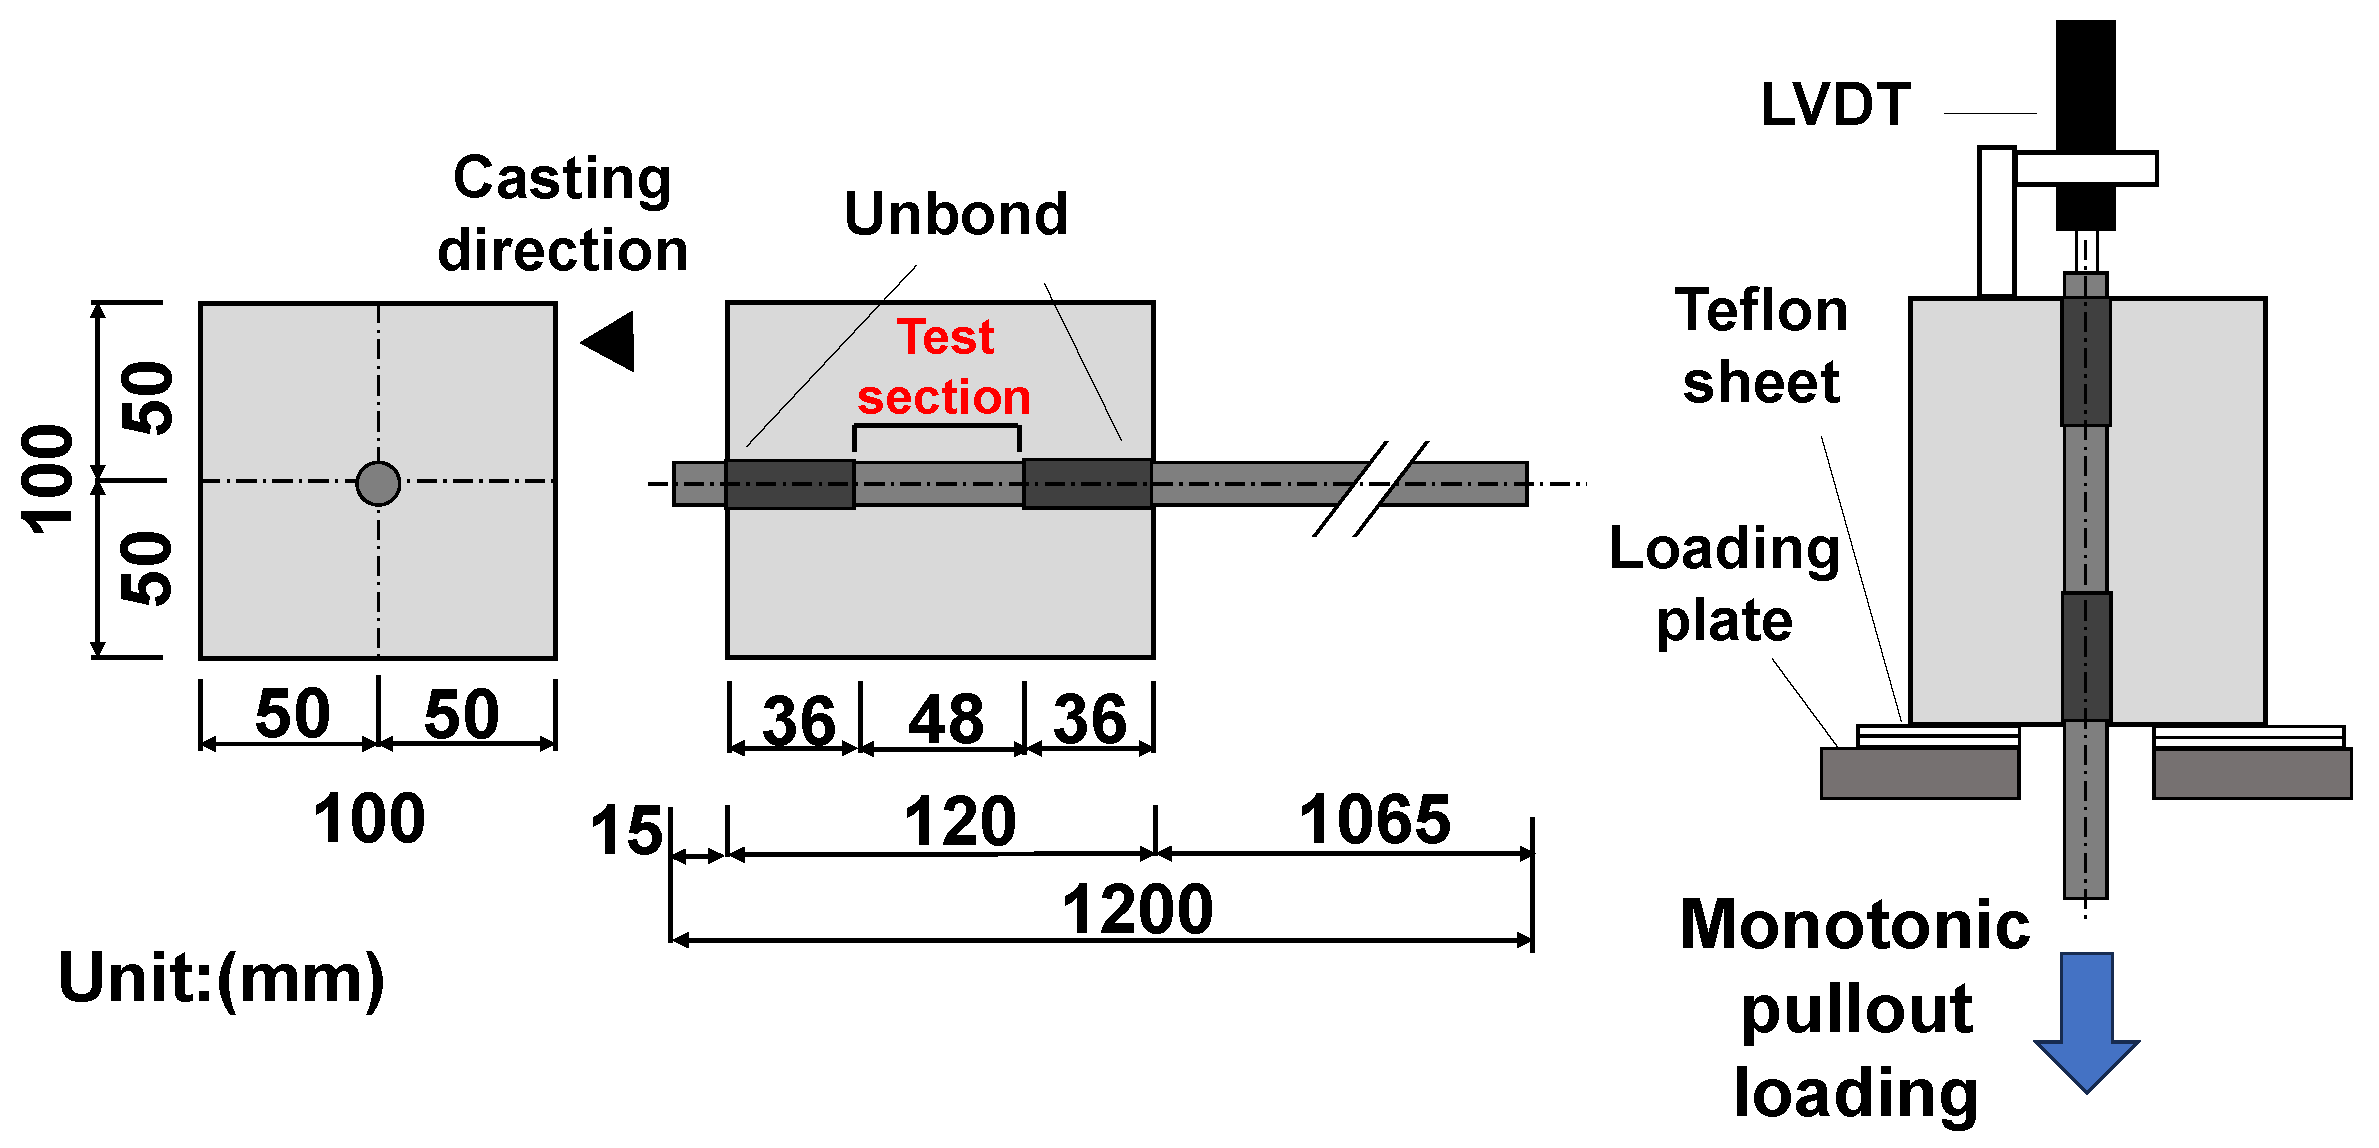
2.1.1. Outline of Bond Test for Spiral-FRP/PVA-FRCC
- (1)
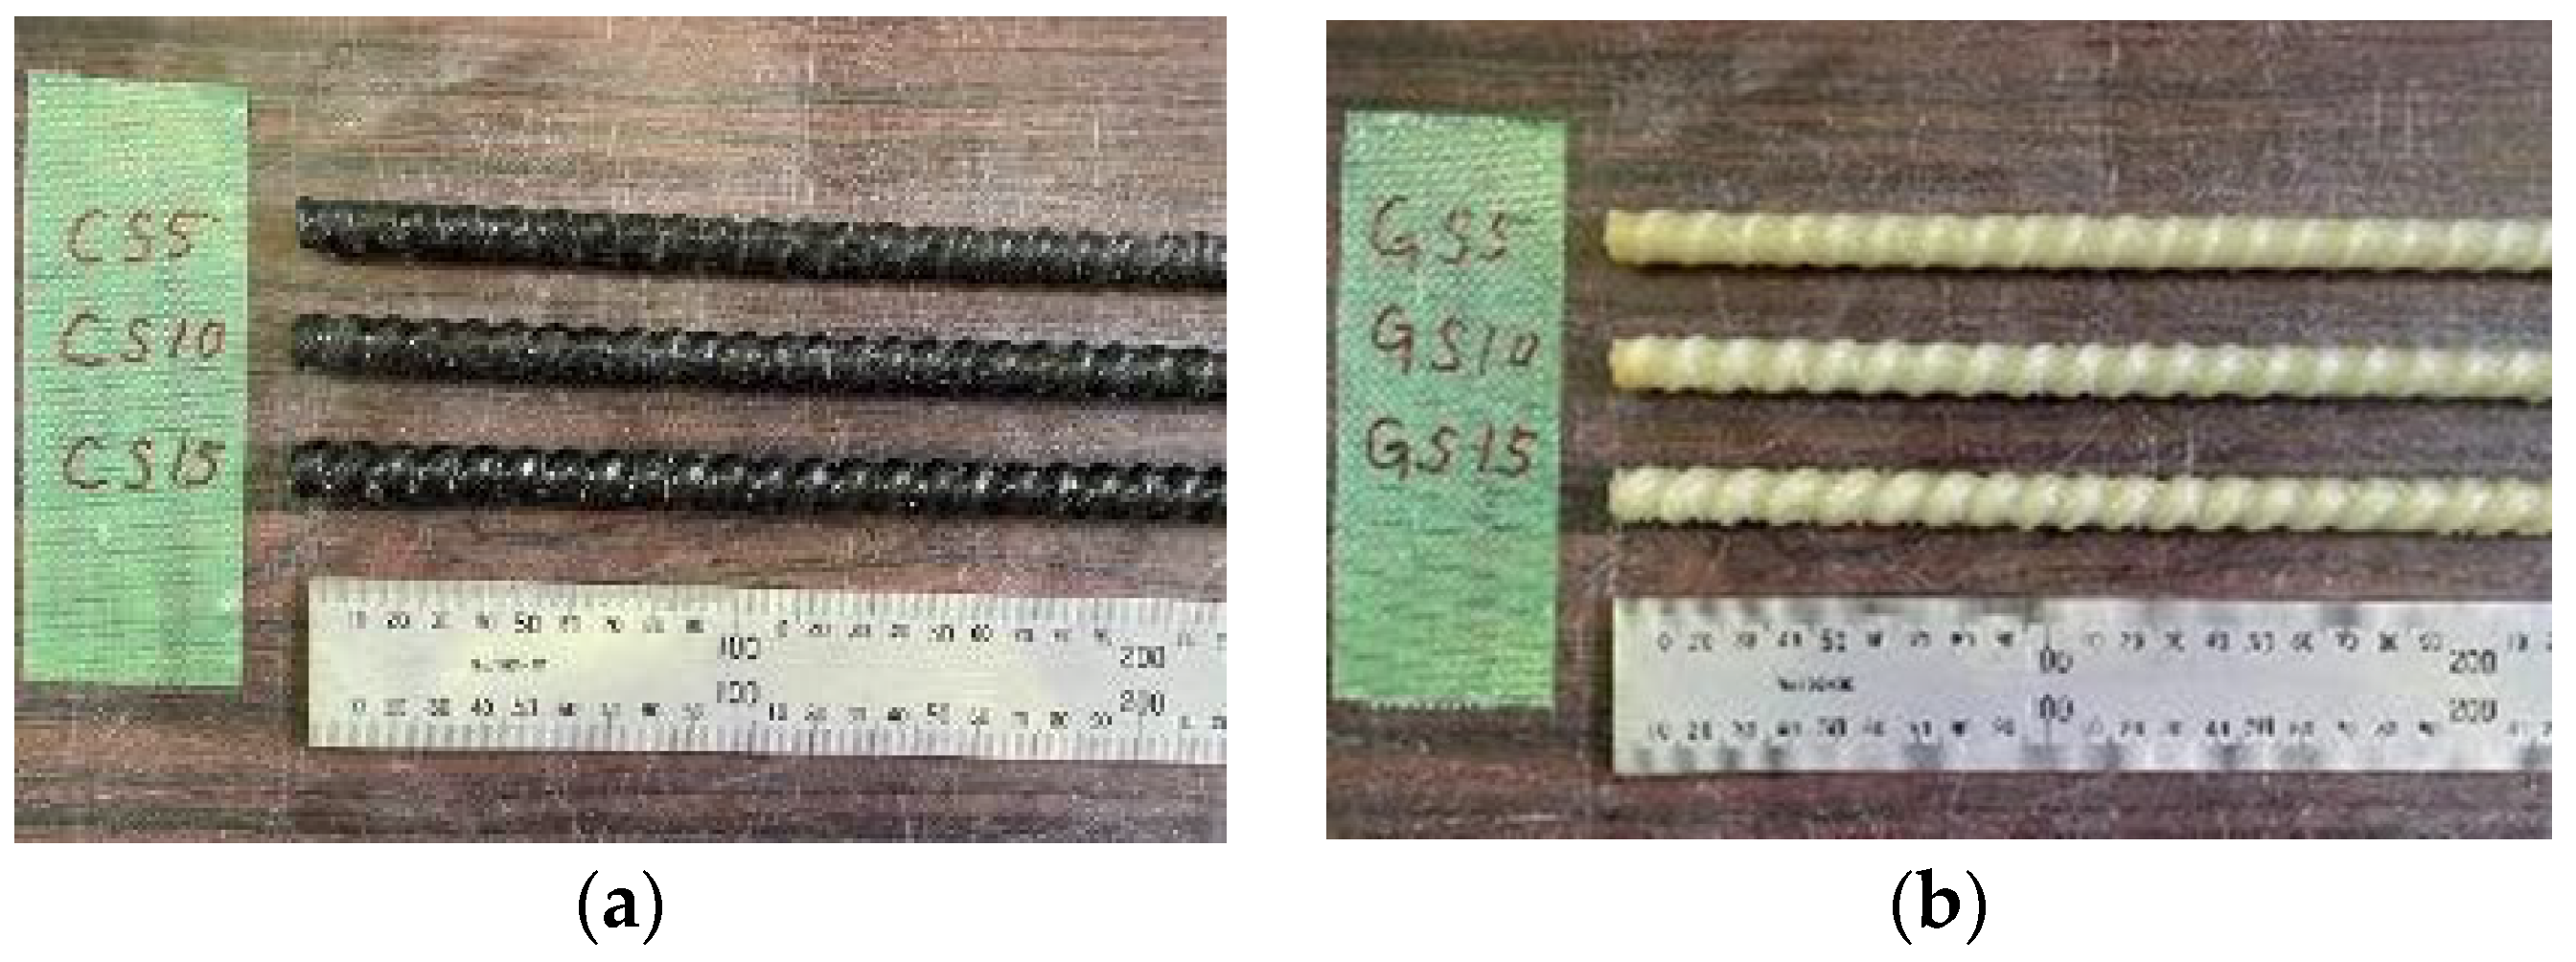
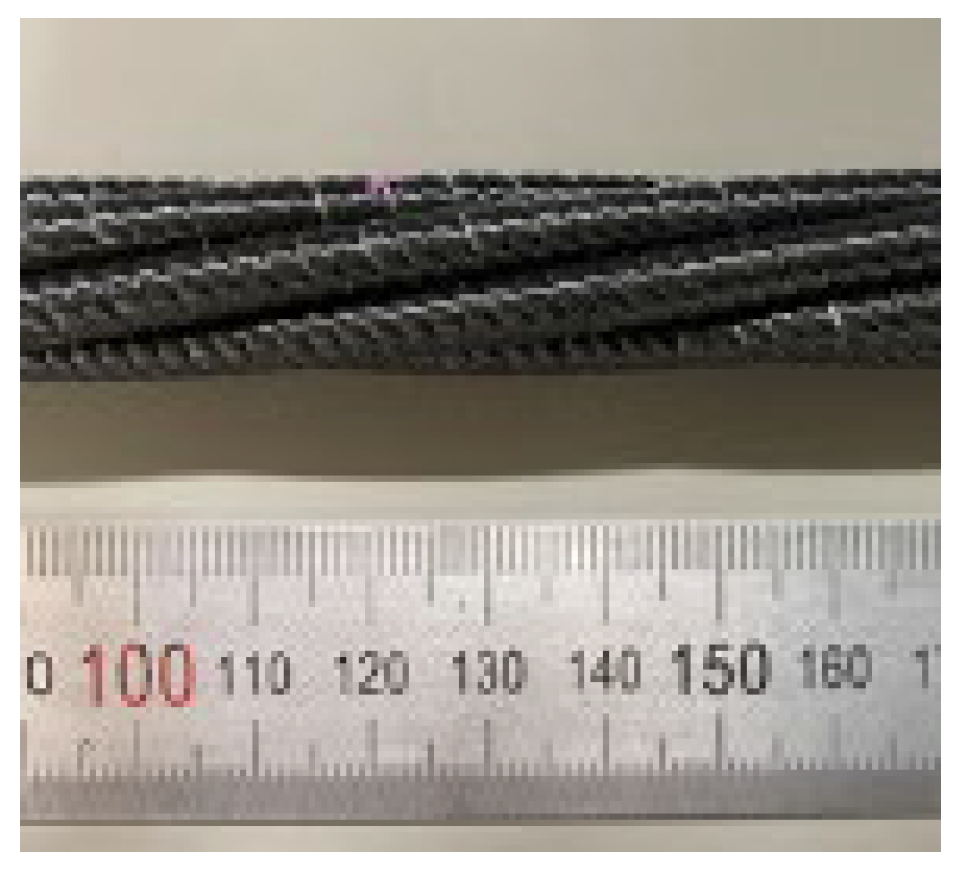
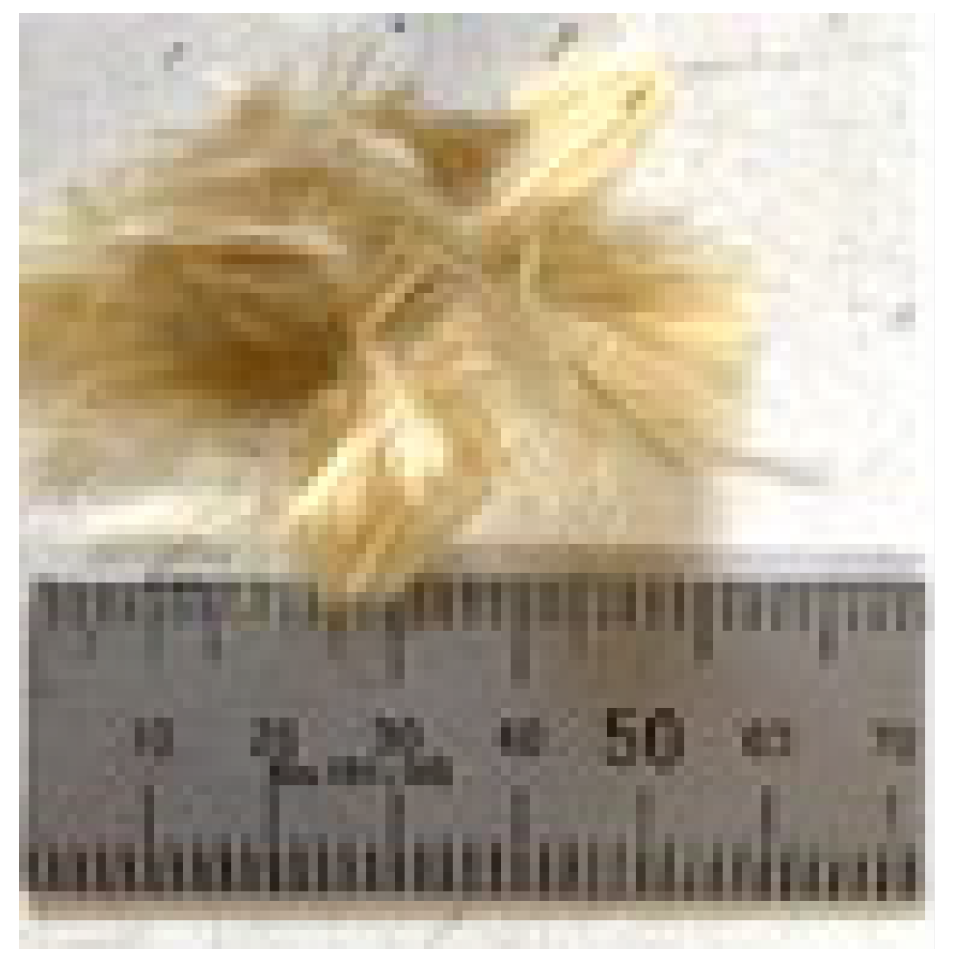
- Materials

| ID | FRP Bar | Cross-Section (mm2) | Average Diameter (mm) | Perimeter (mm) | Rib–Height Ratio (%) | Elastic Modulus [SD] (GPa) |
|---|---|---|---|---|---|---|
| CS5 | Spiral CFRP | 102 | 11.4 | 35.9 | 5.7 | 127 [9.3] |
| CS10 | 114 | 12.1 | 37.9 | 8.8 | 111 [6.1] | |
| CS15 | 129 | 12.8 | 40.3 | 9.2 | 100 [9.8] | |
| GS5 | Spiral GFRP | 94 | 11.0 | 34.4 | 5.9 | 43.2 [0.8] |
| GS10 | 103 | 11.4 | 35.9 | 8.5 | 38.0 [3.8] | |
| GS15 | 114 | 12.1 | 37.9 | 8.8 | 31.6 [3.0] |
| Length (mm) | Diameter (µm) | Tensile Strength (MPa) | Elastic Modulus (GPa) | Density (g/cm3) |
|---|---|---|---|---|
| 12 | 100 | 1200 | 28 | 1.3 |
| Specimen | Unit Weight (kg/m3) | Compressive Strength [SD] (MPa) | Elastic Modulus [SD] (GPa) | ||||
|---|---|---|---|---|---|---|---|
| W | C | S | FA | PVA | |||
| CSxx or GSxx/PVA200 | 380 | 678 | 484 | 291 | 26 | 51.7 [1.7] | 17.3 [0.7] |
- (2)
- Specimens
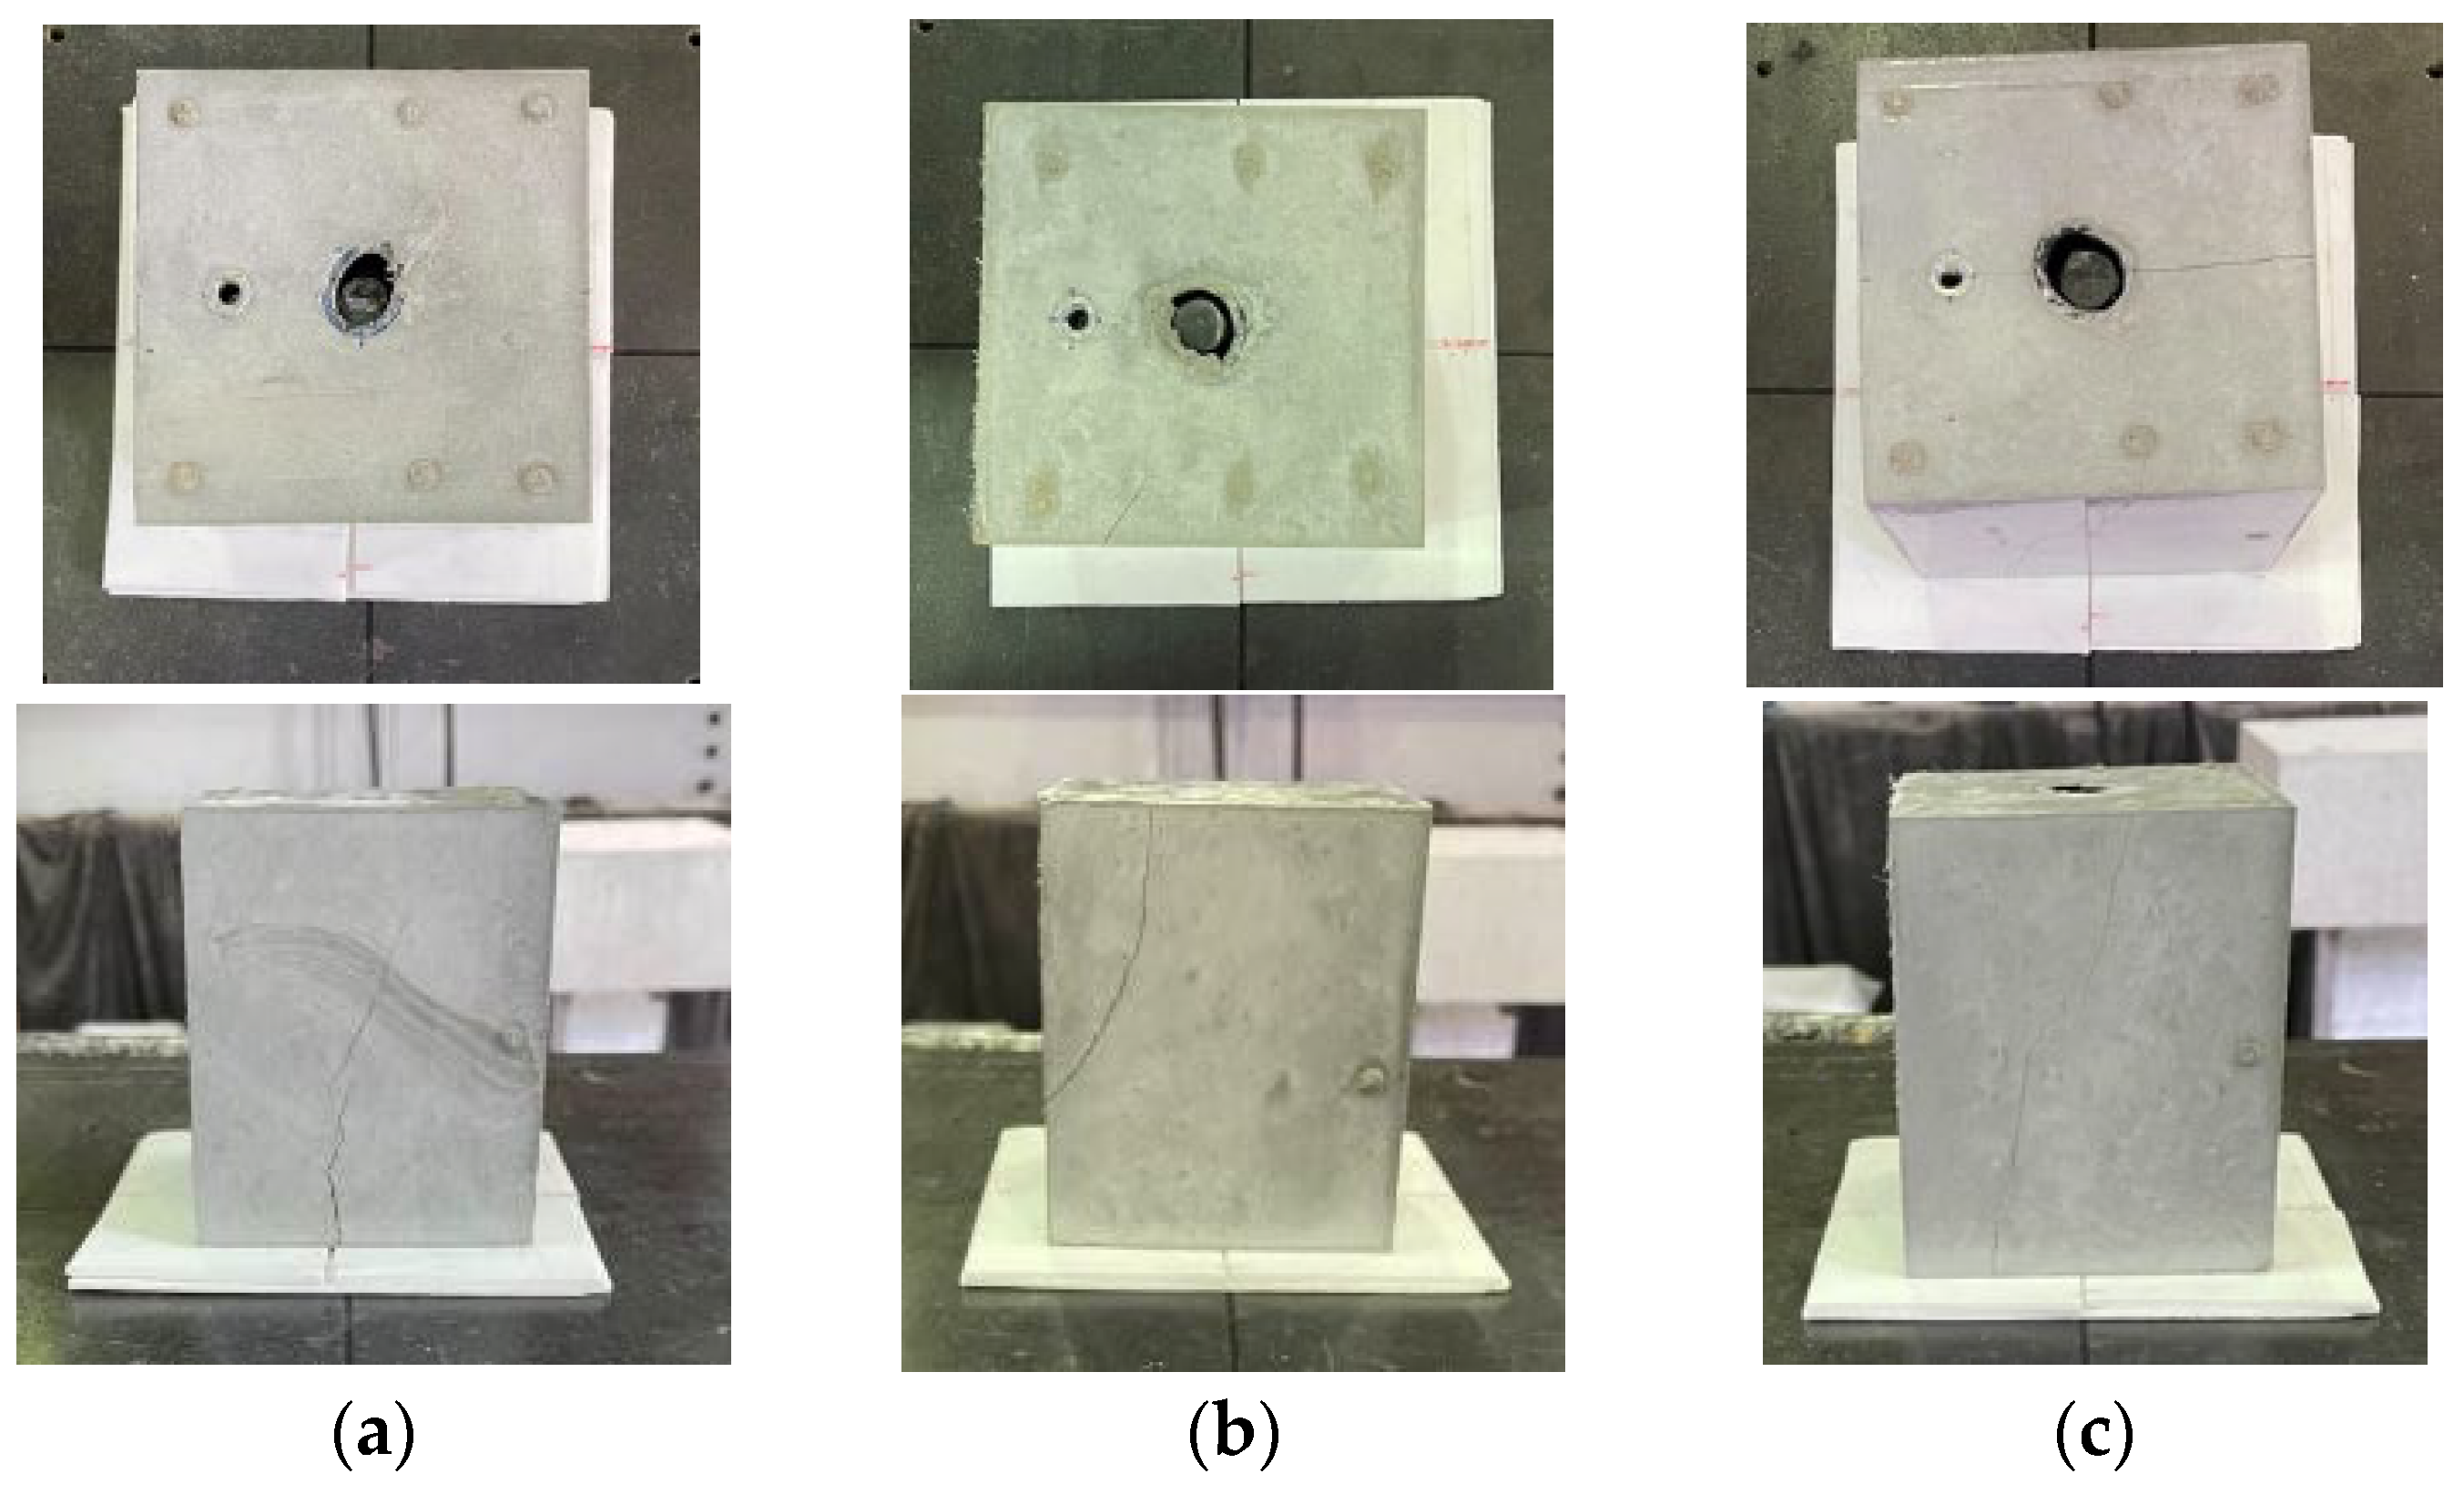
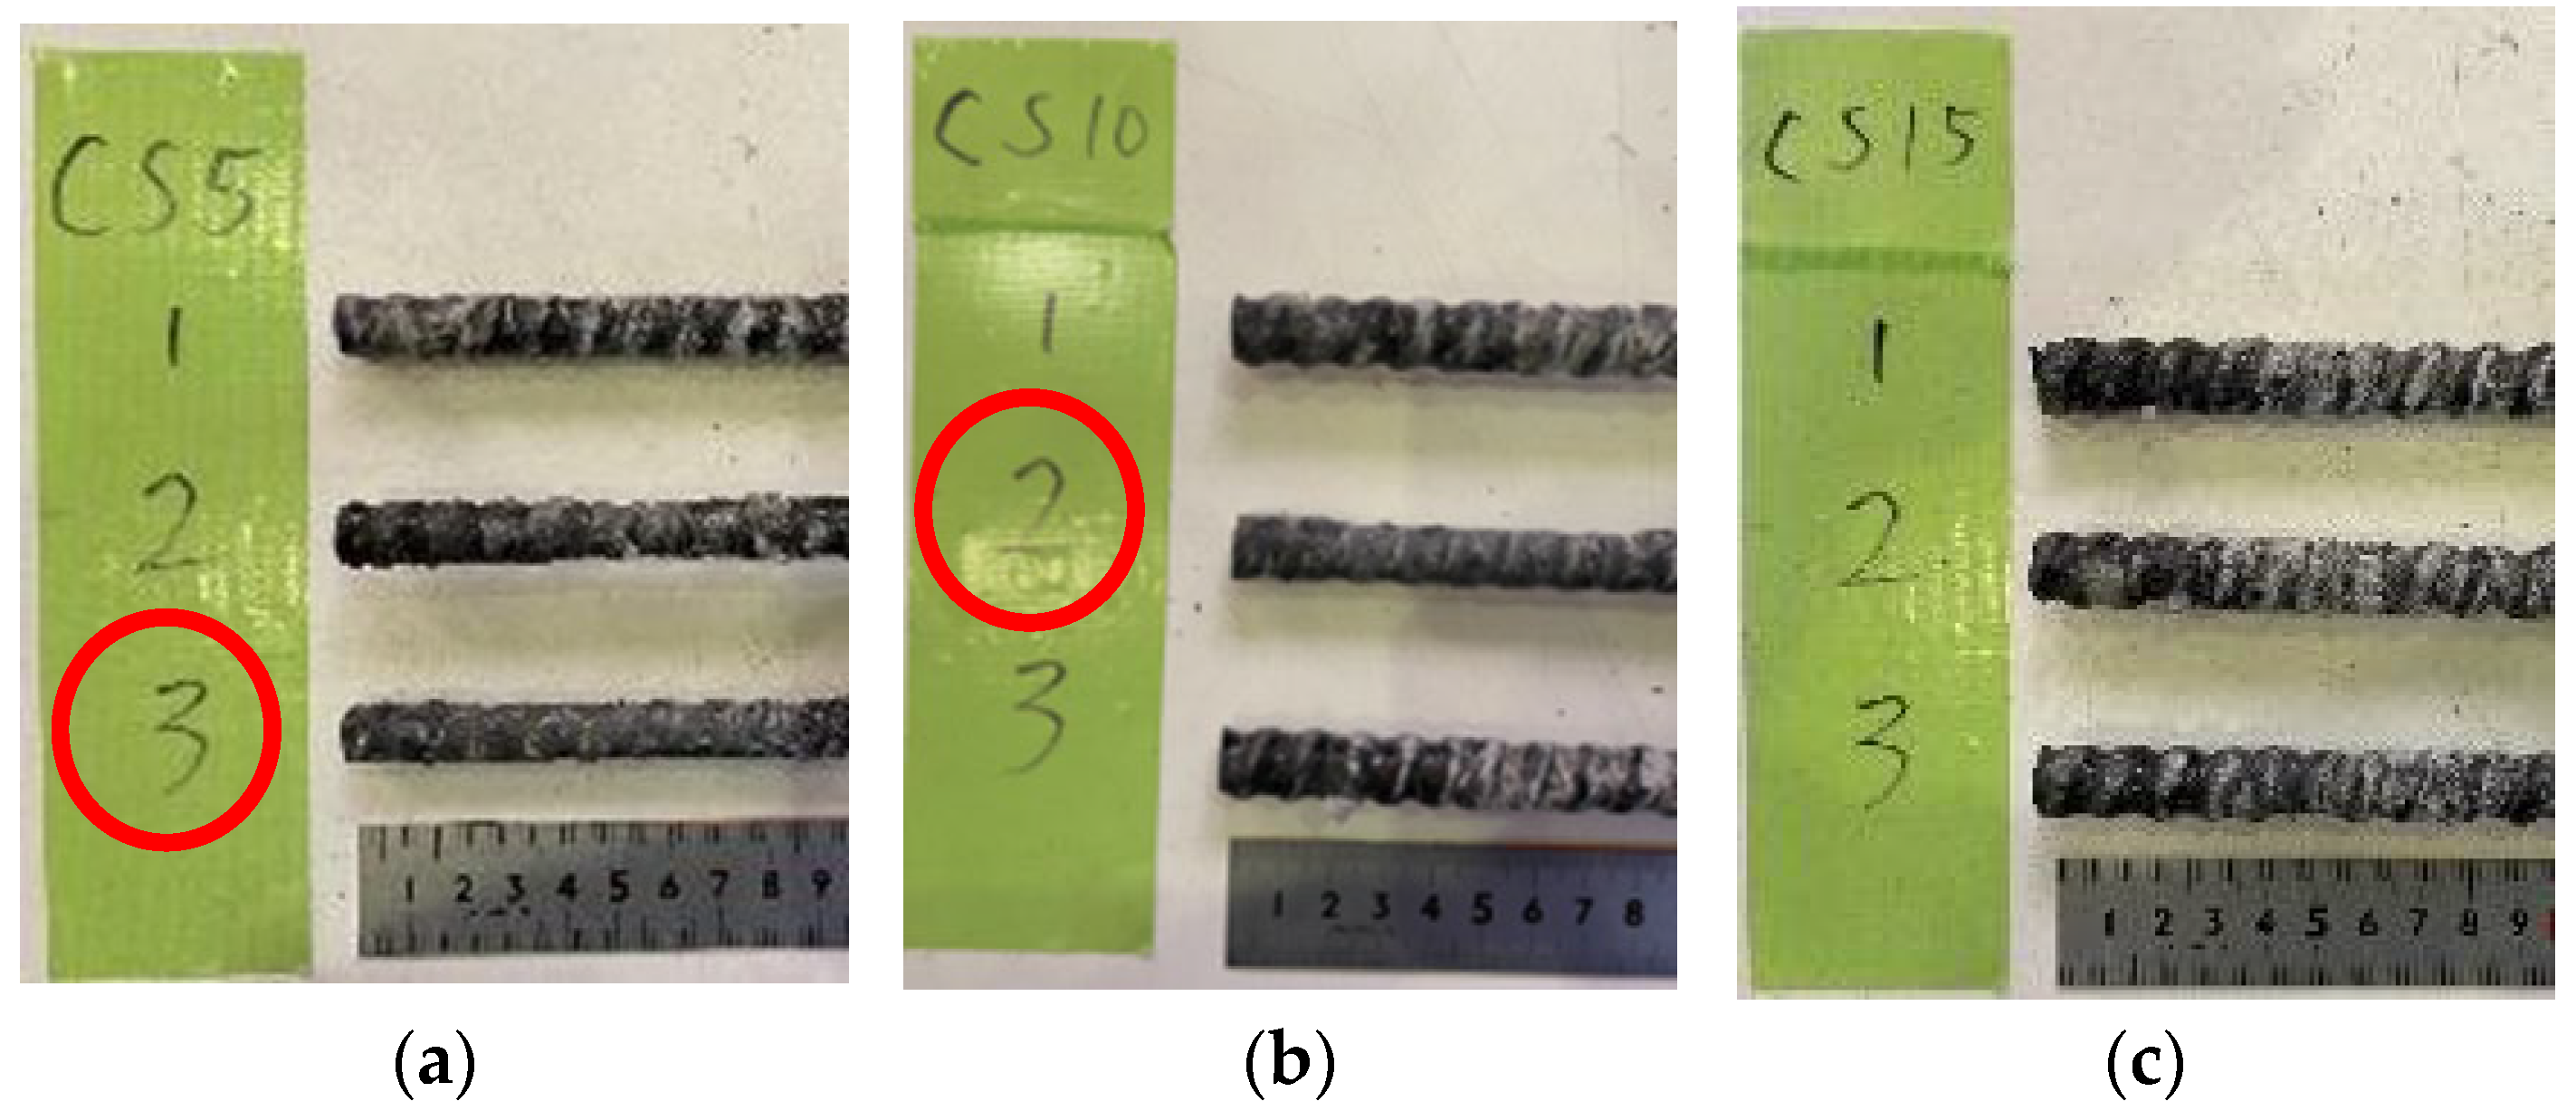
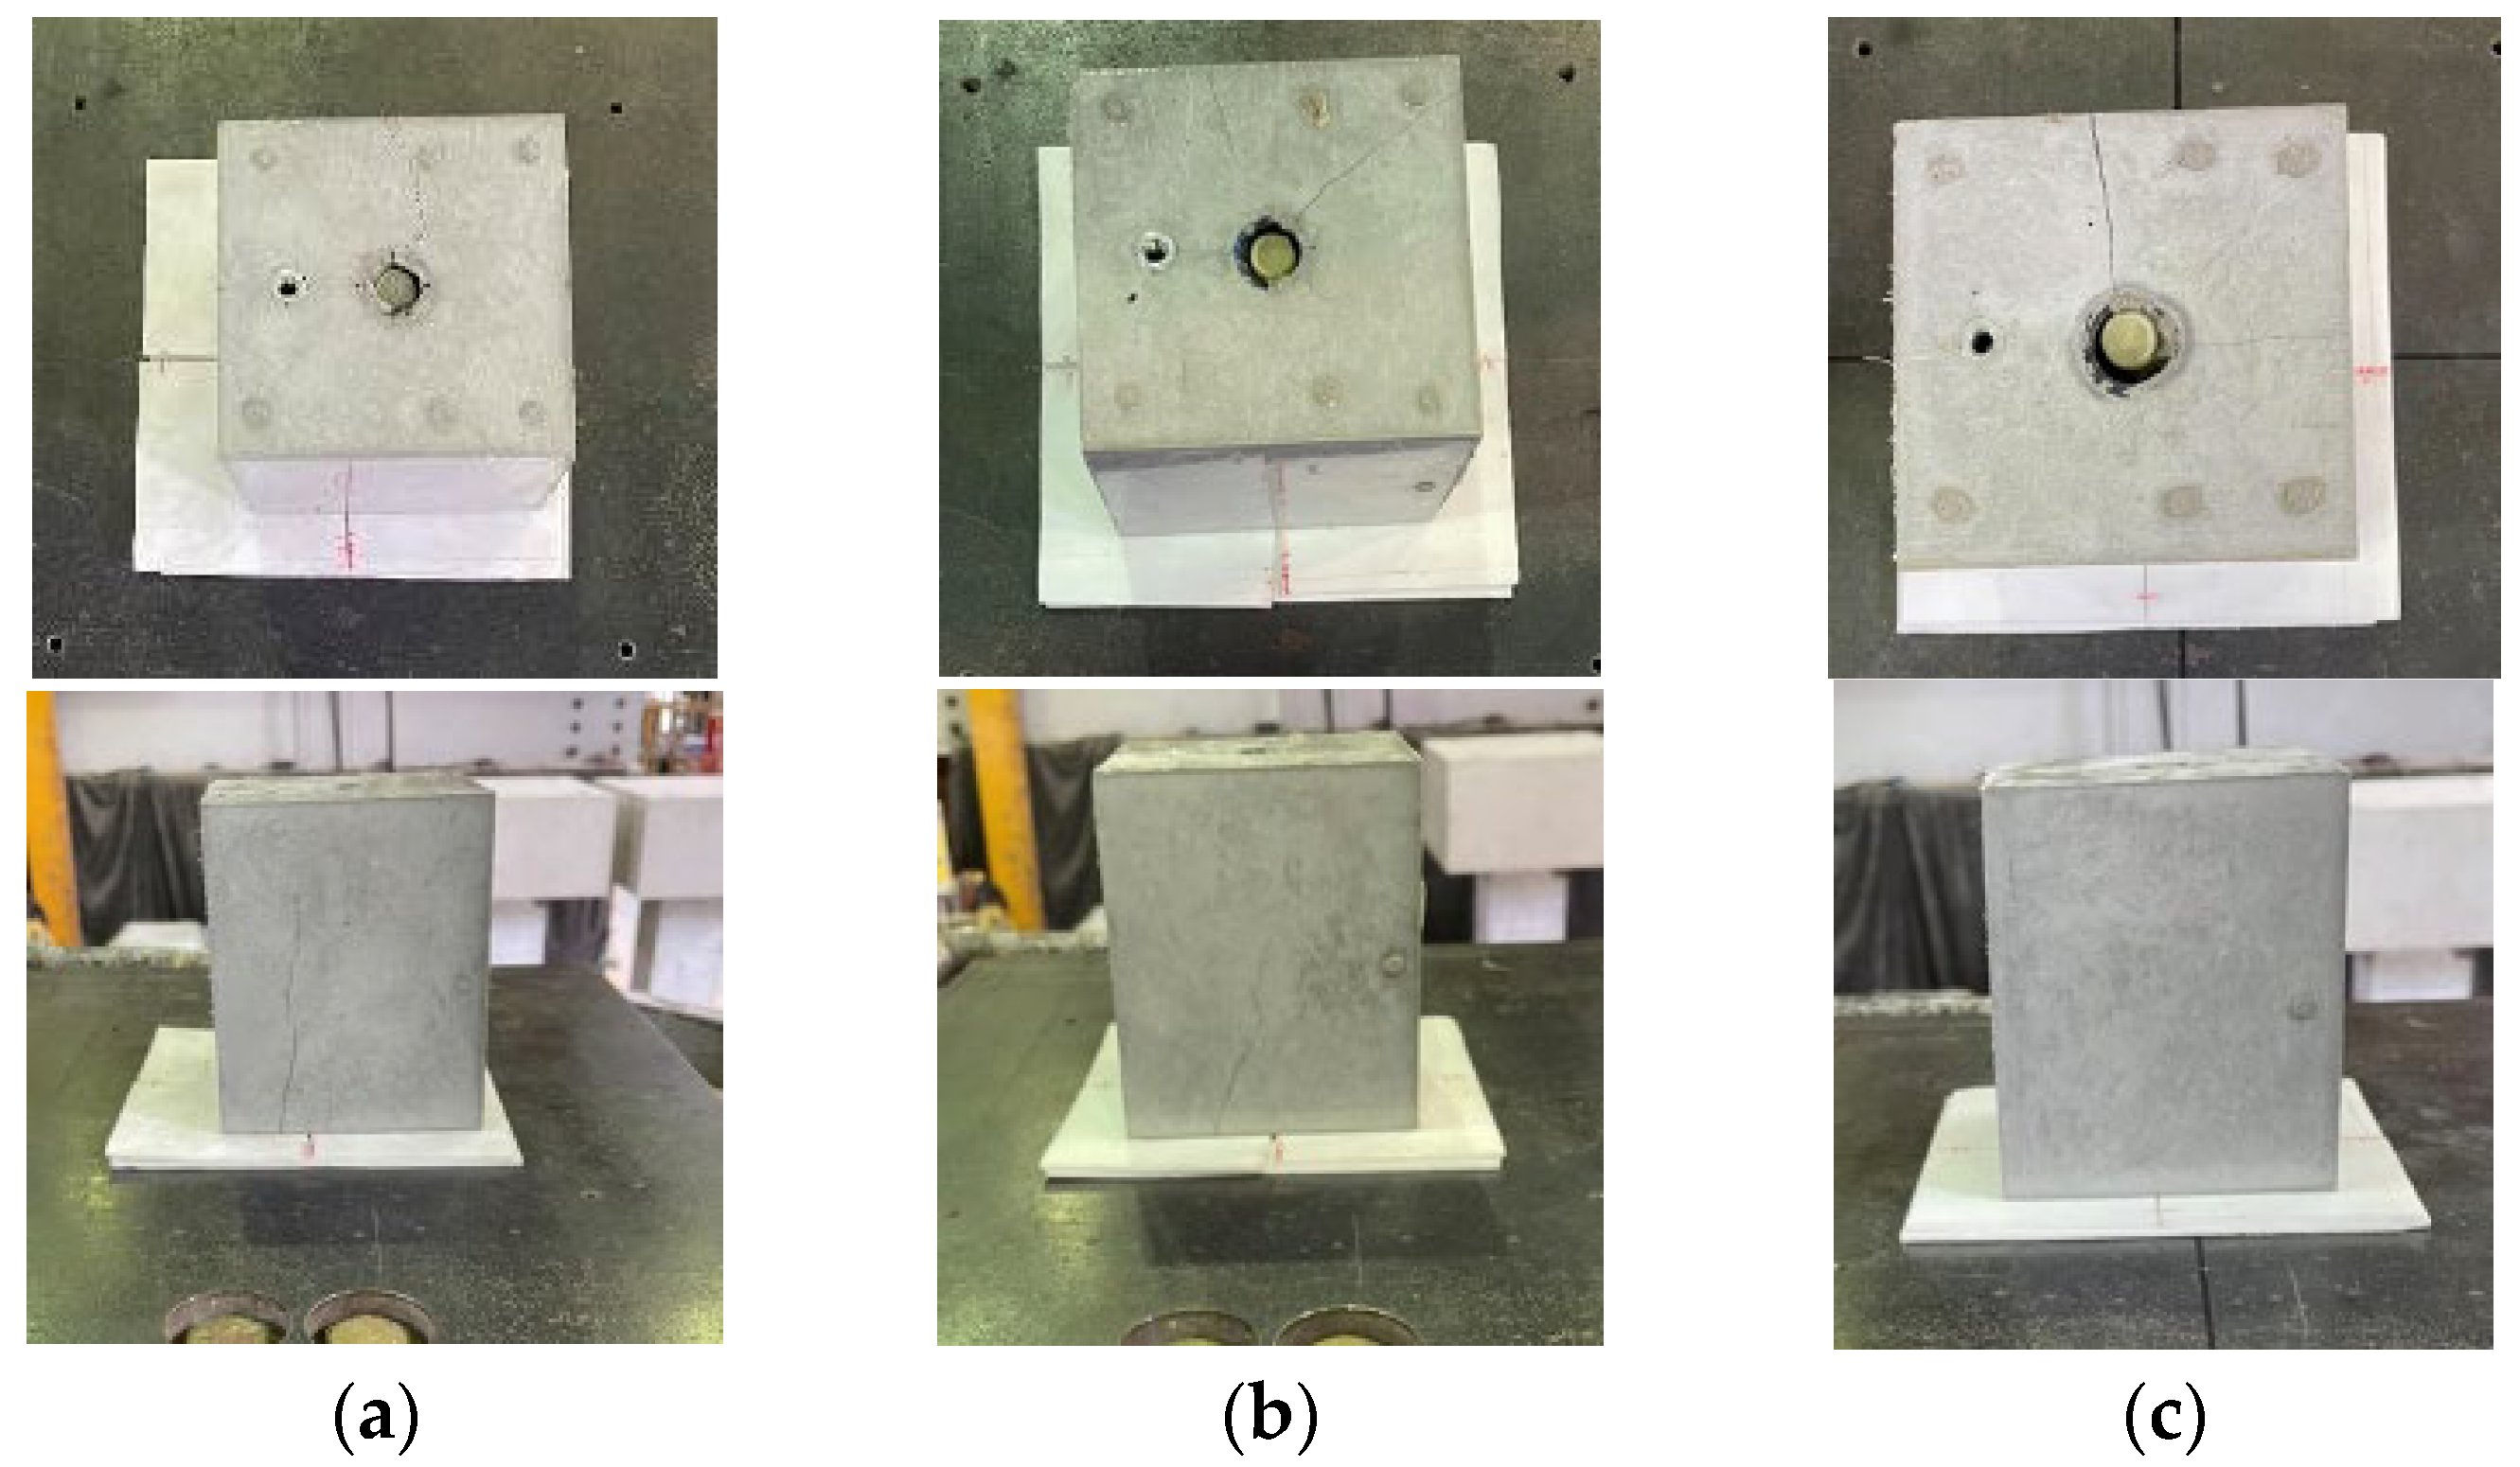
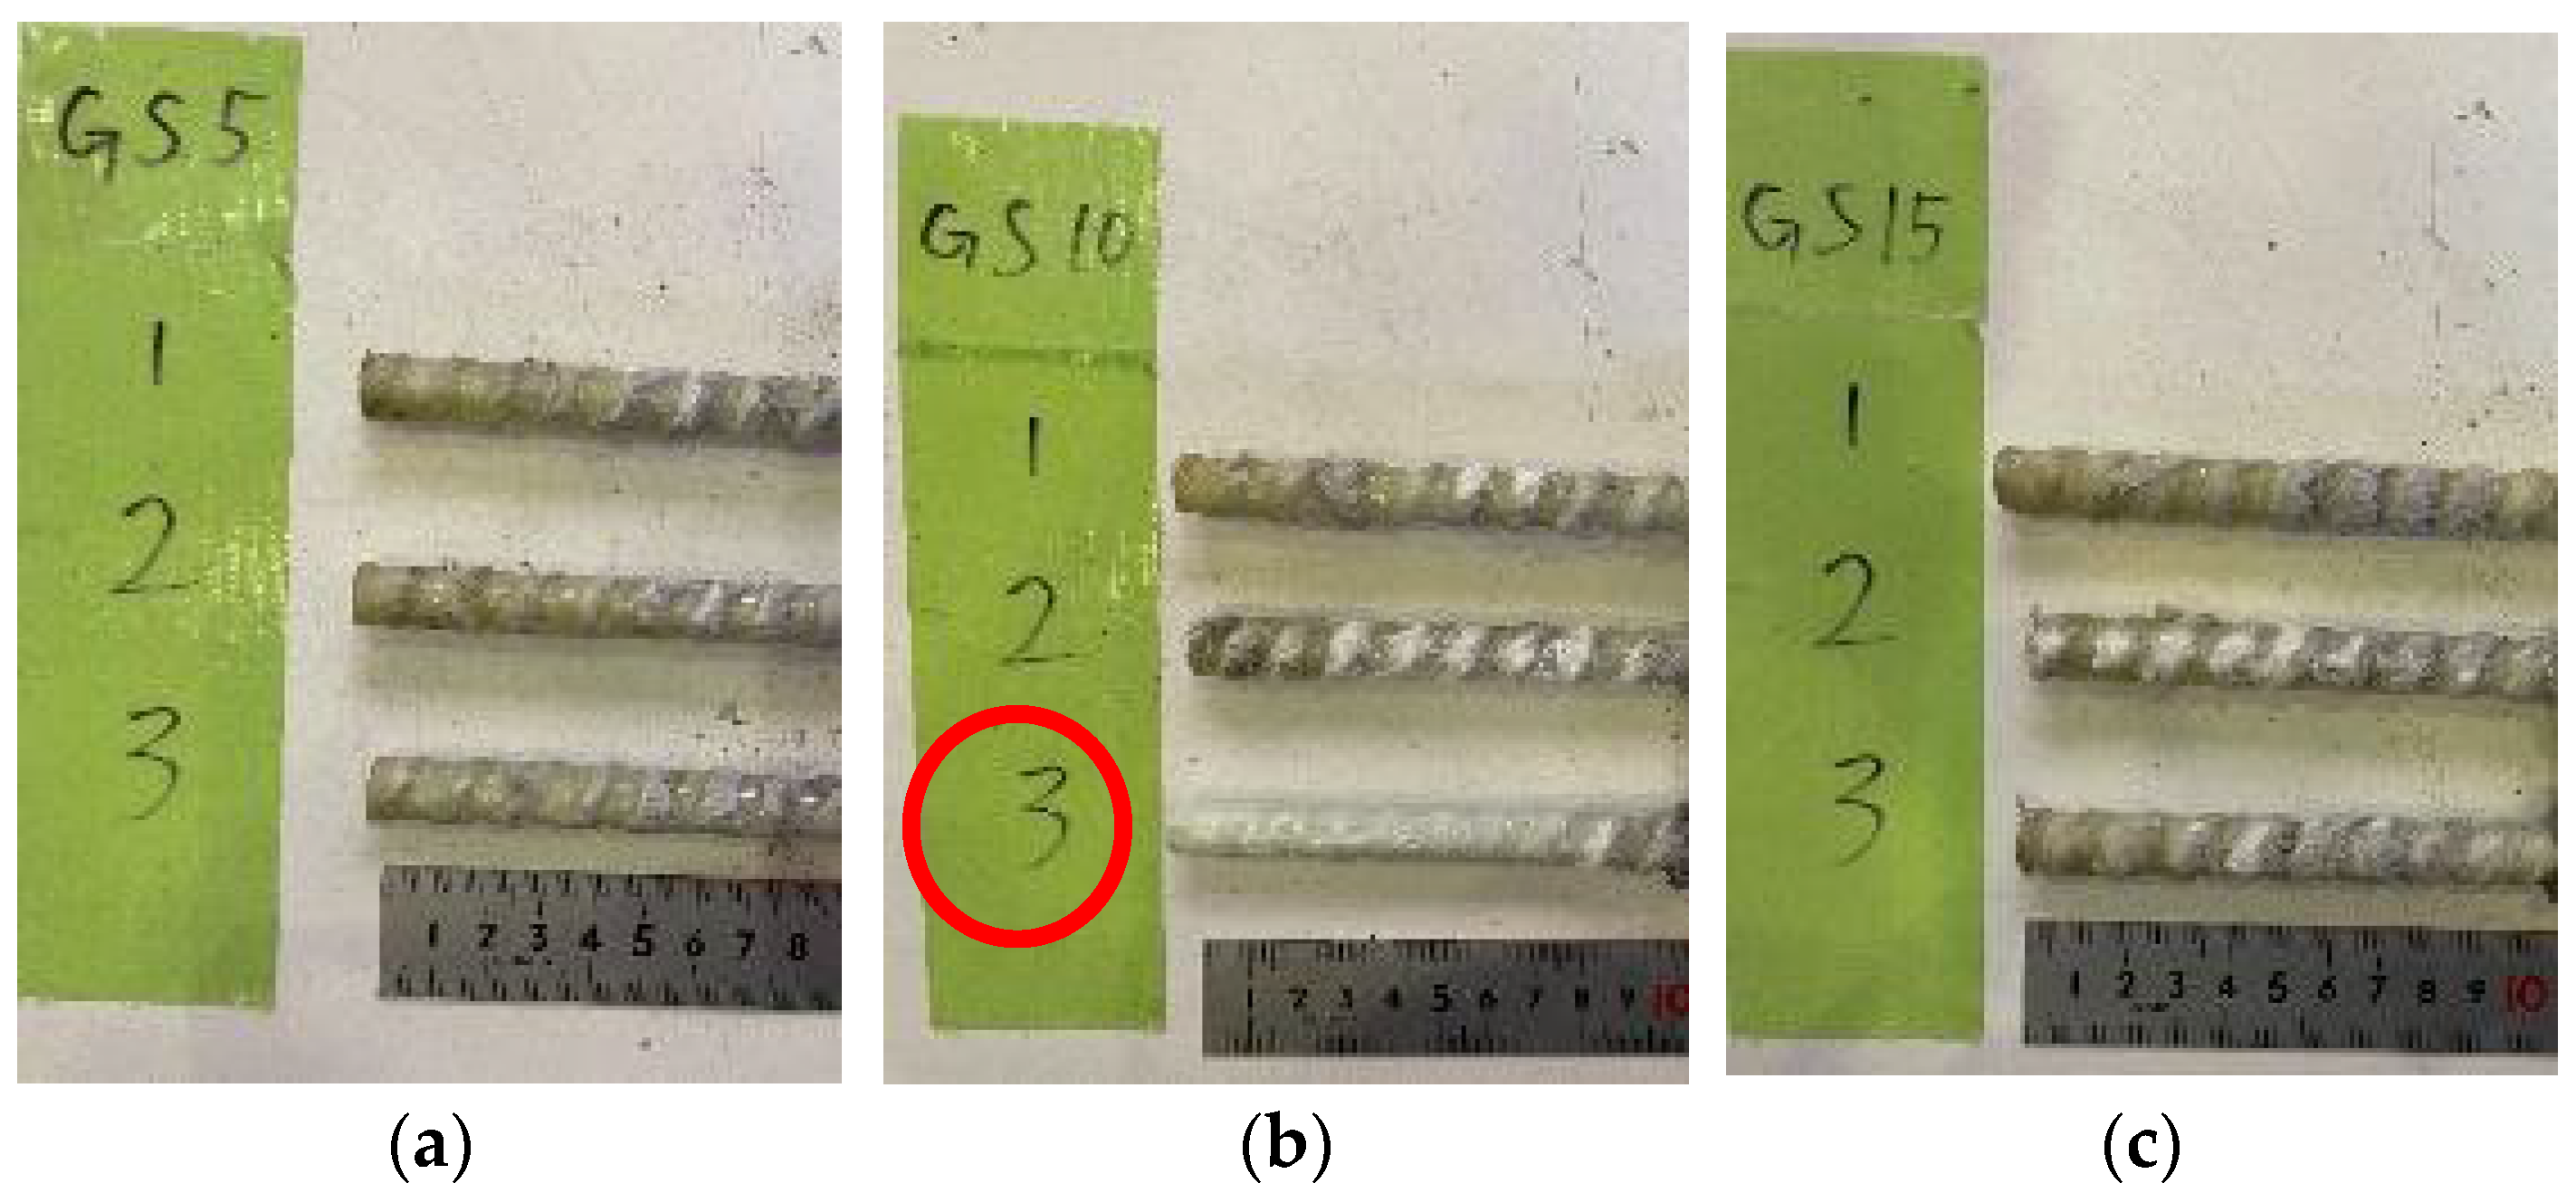
2.1.2. Results of Bond Test for Spiral-FRP/PVA-FRCC
- (1)
- Failure modes
- (2)
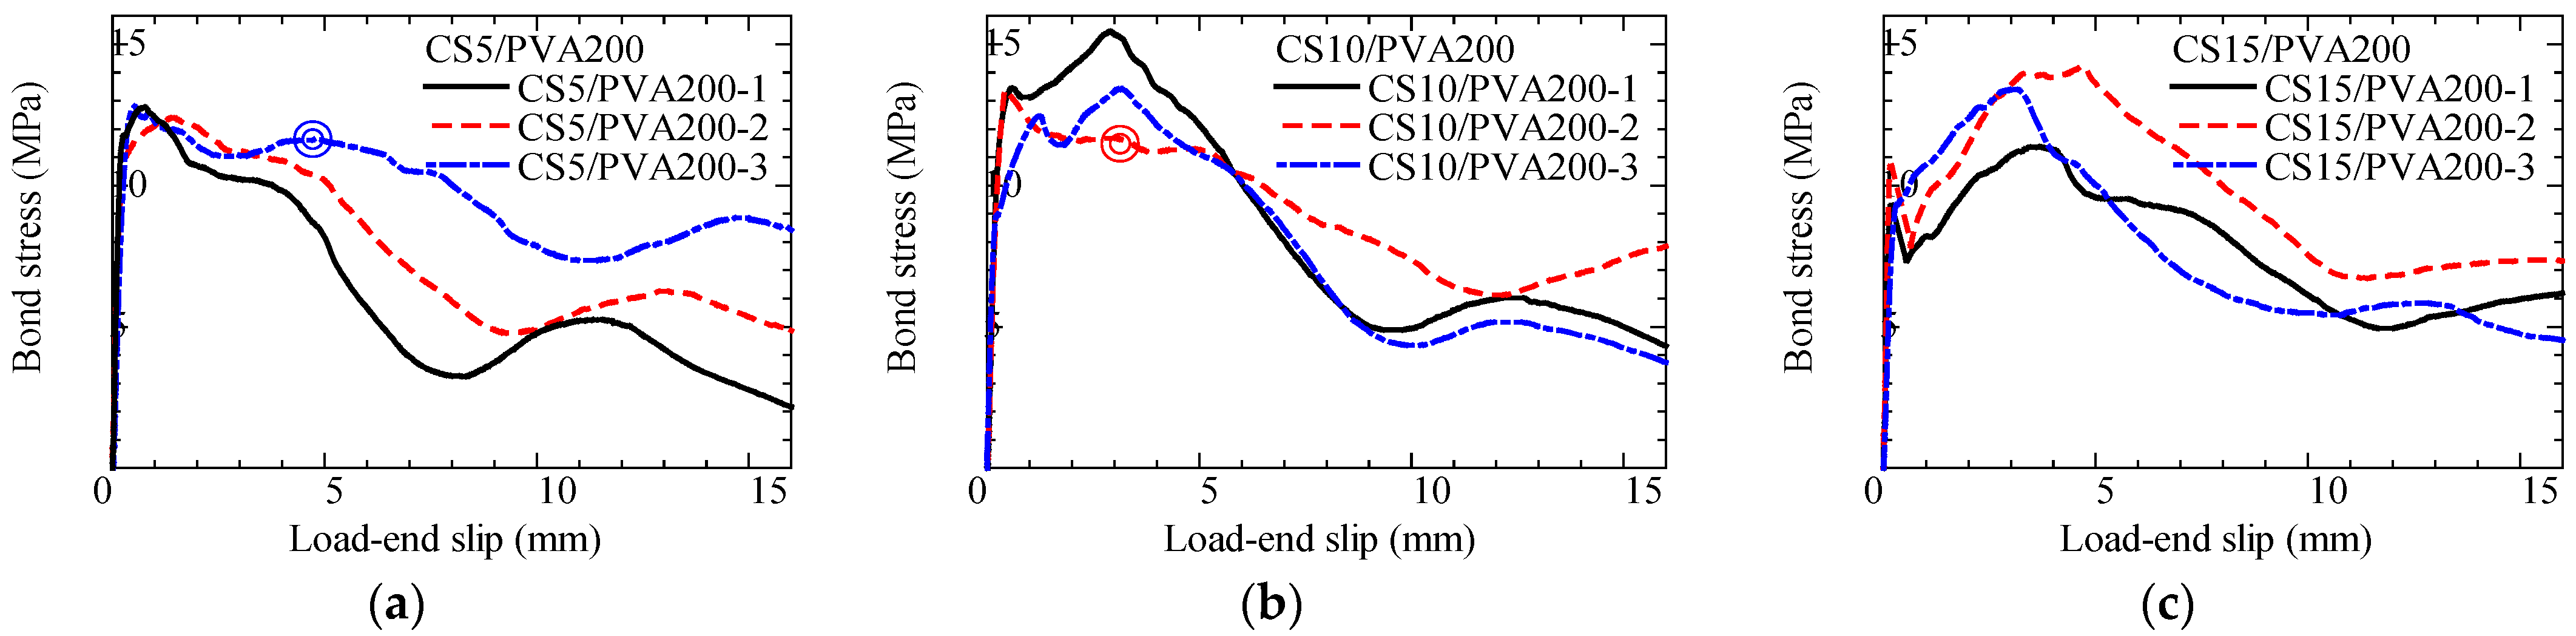
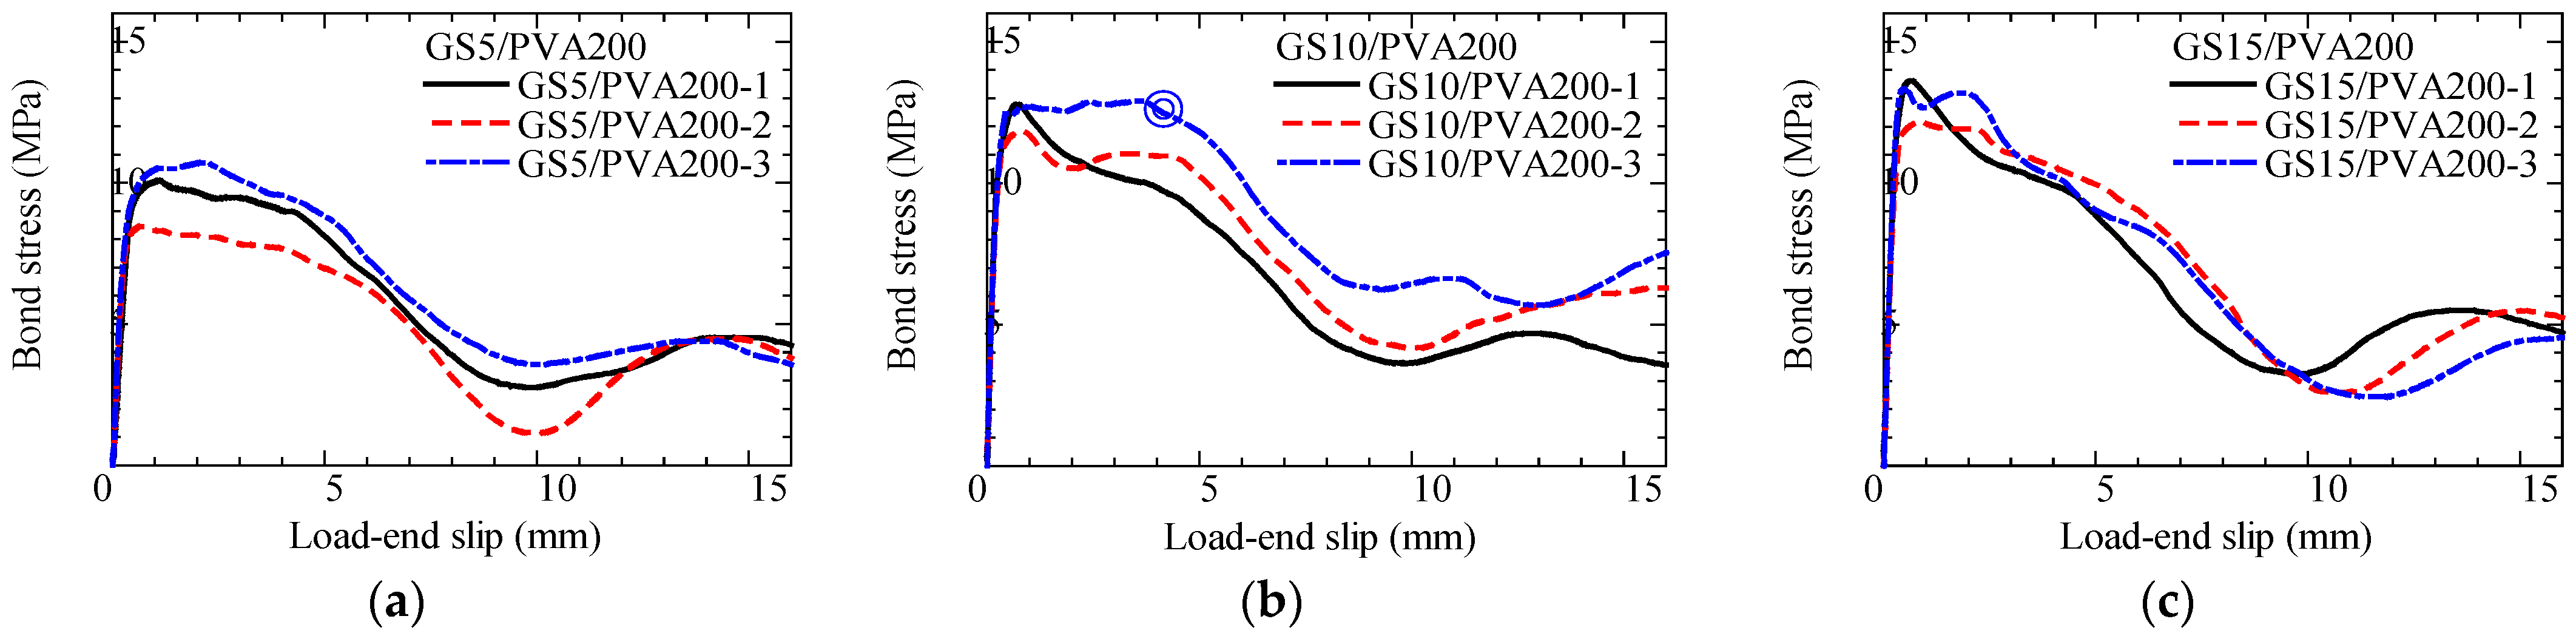
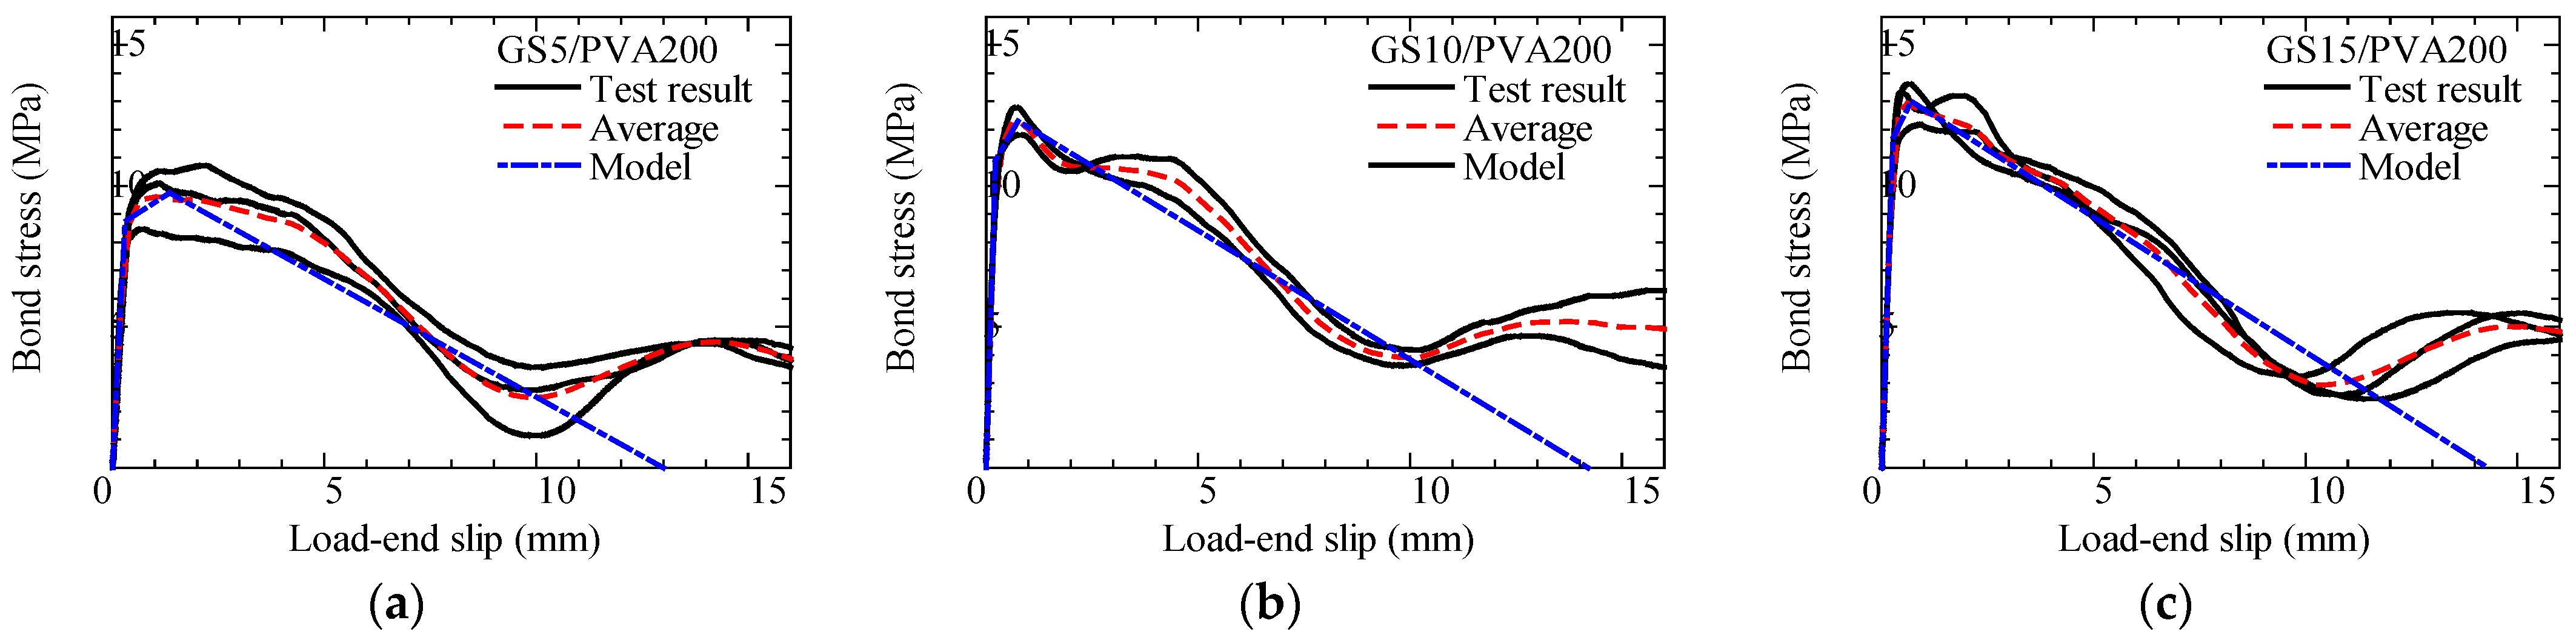
- Bond stress–slip curve
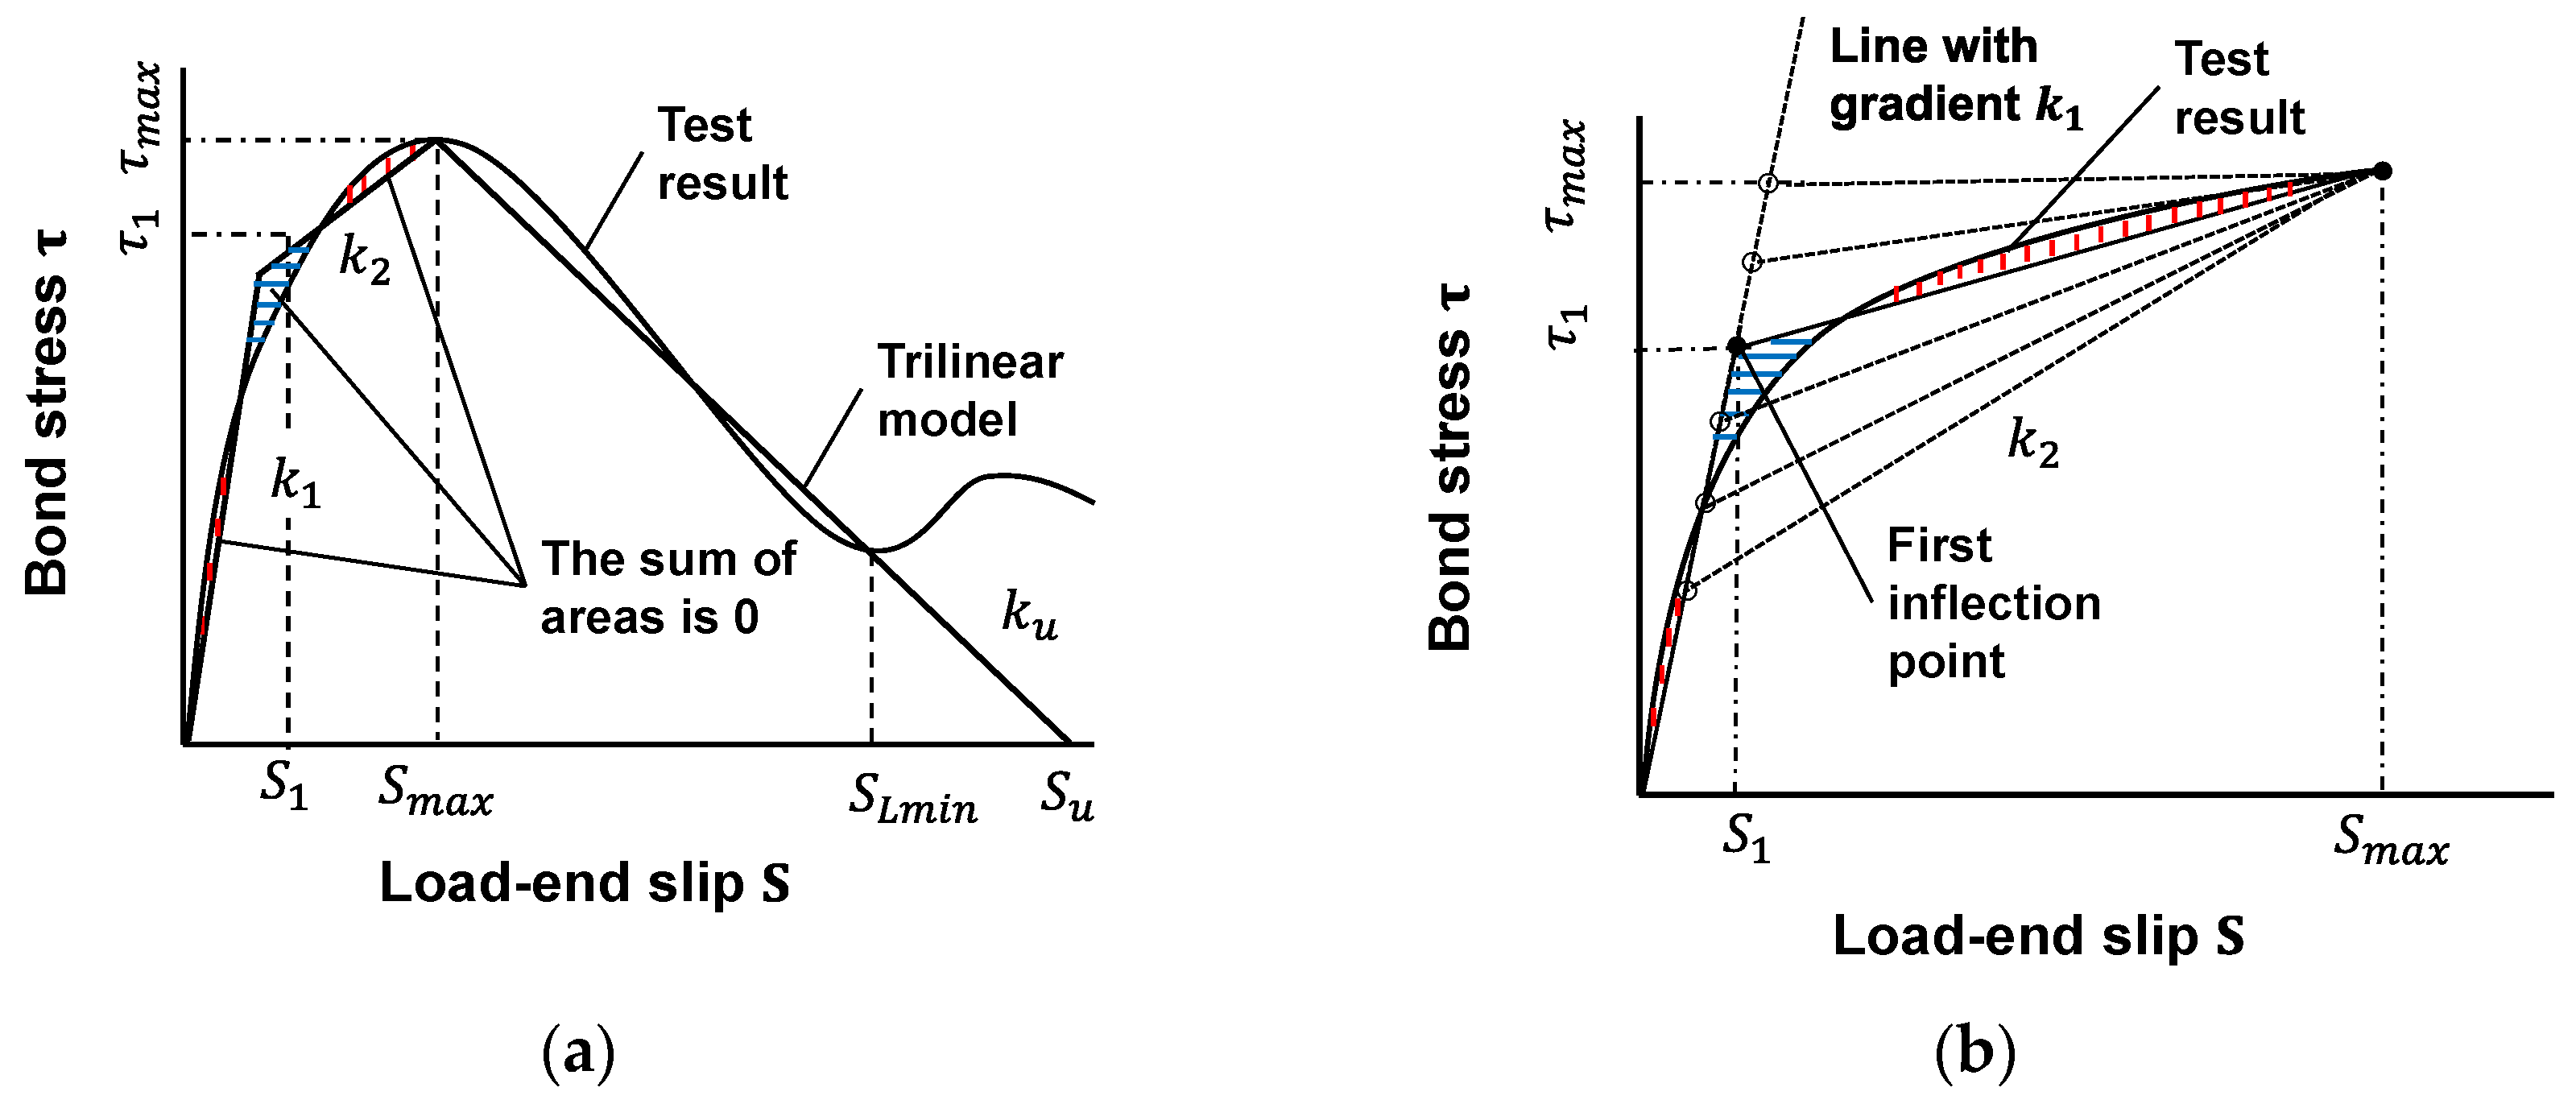
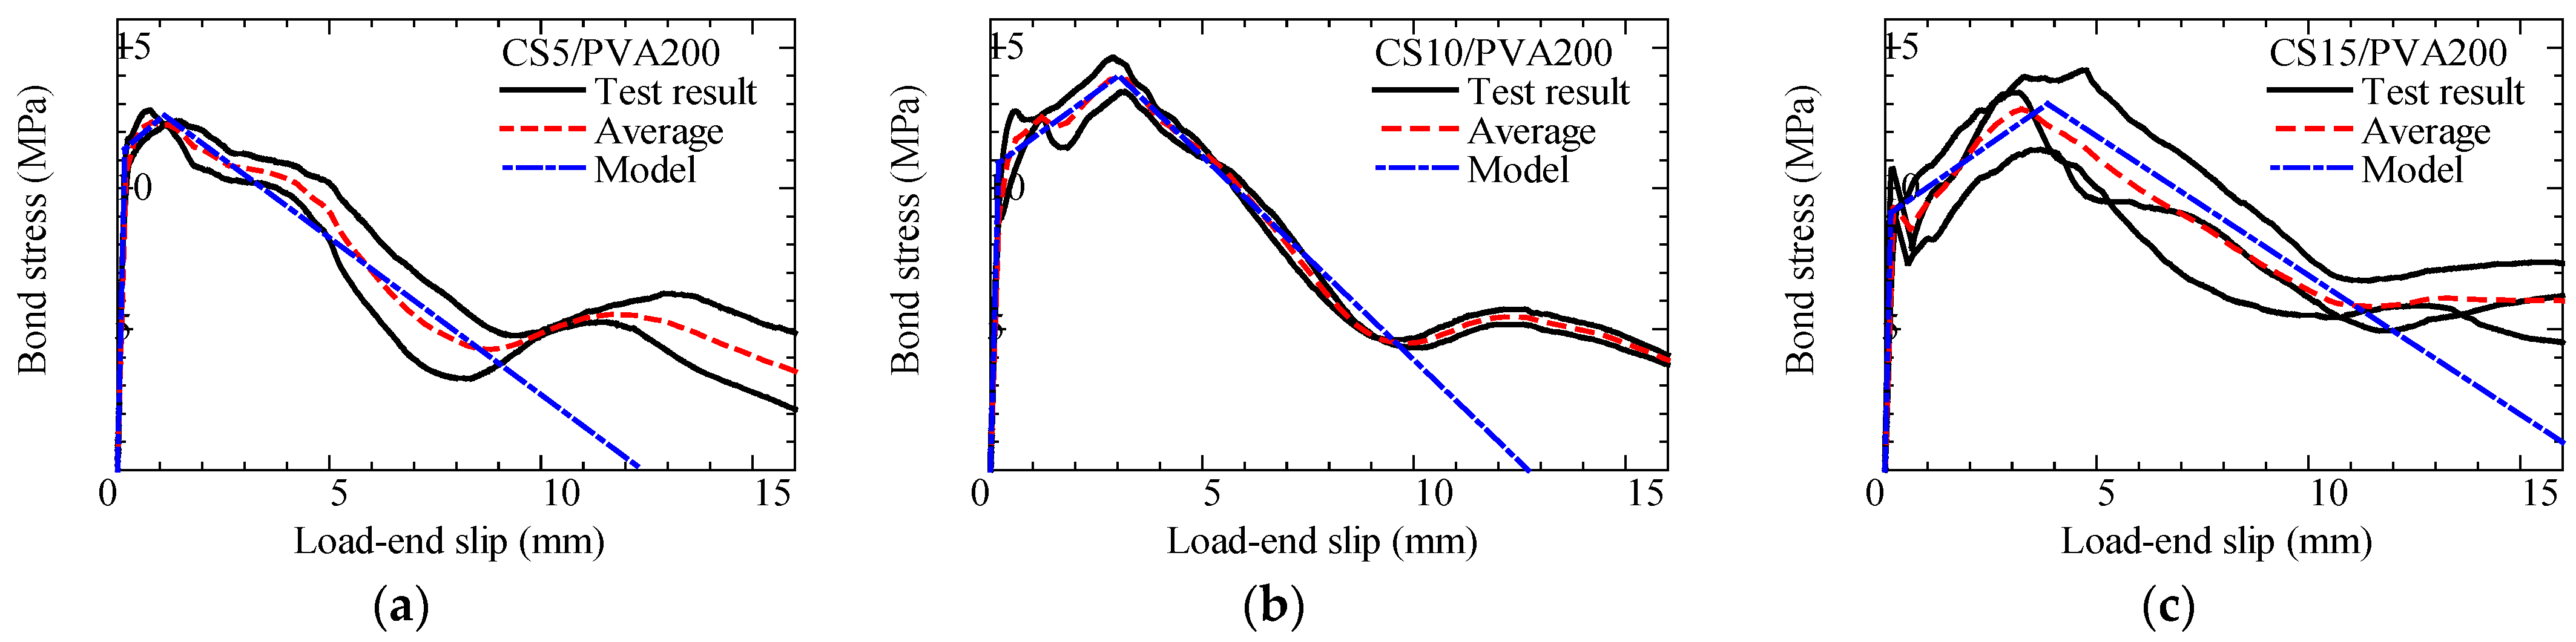
2.1.3. Modeling of Bond Constitutive Law for Spiral-FRP/PVA-FRCC
2.2. Bond Properties of Strand-CFRP/Aramid–FRCC
2.2.1. Outline of Bond Test for Strand-CFRP/Aramid–FRCC
- (1)
- Materials
- (2)
- Specimens
2.2.2. Results of Bond Test for Strand-CFRP/Aramid–FRCC
- (1)
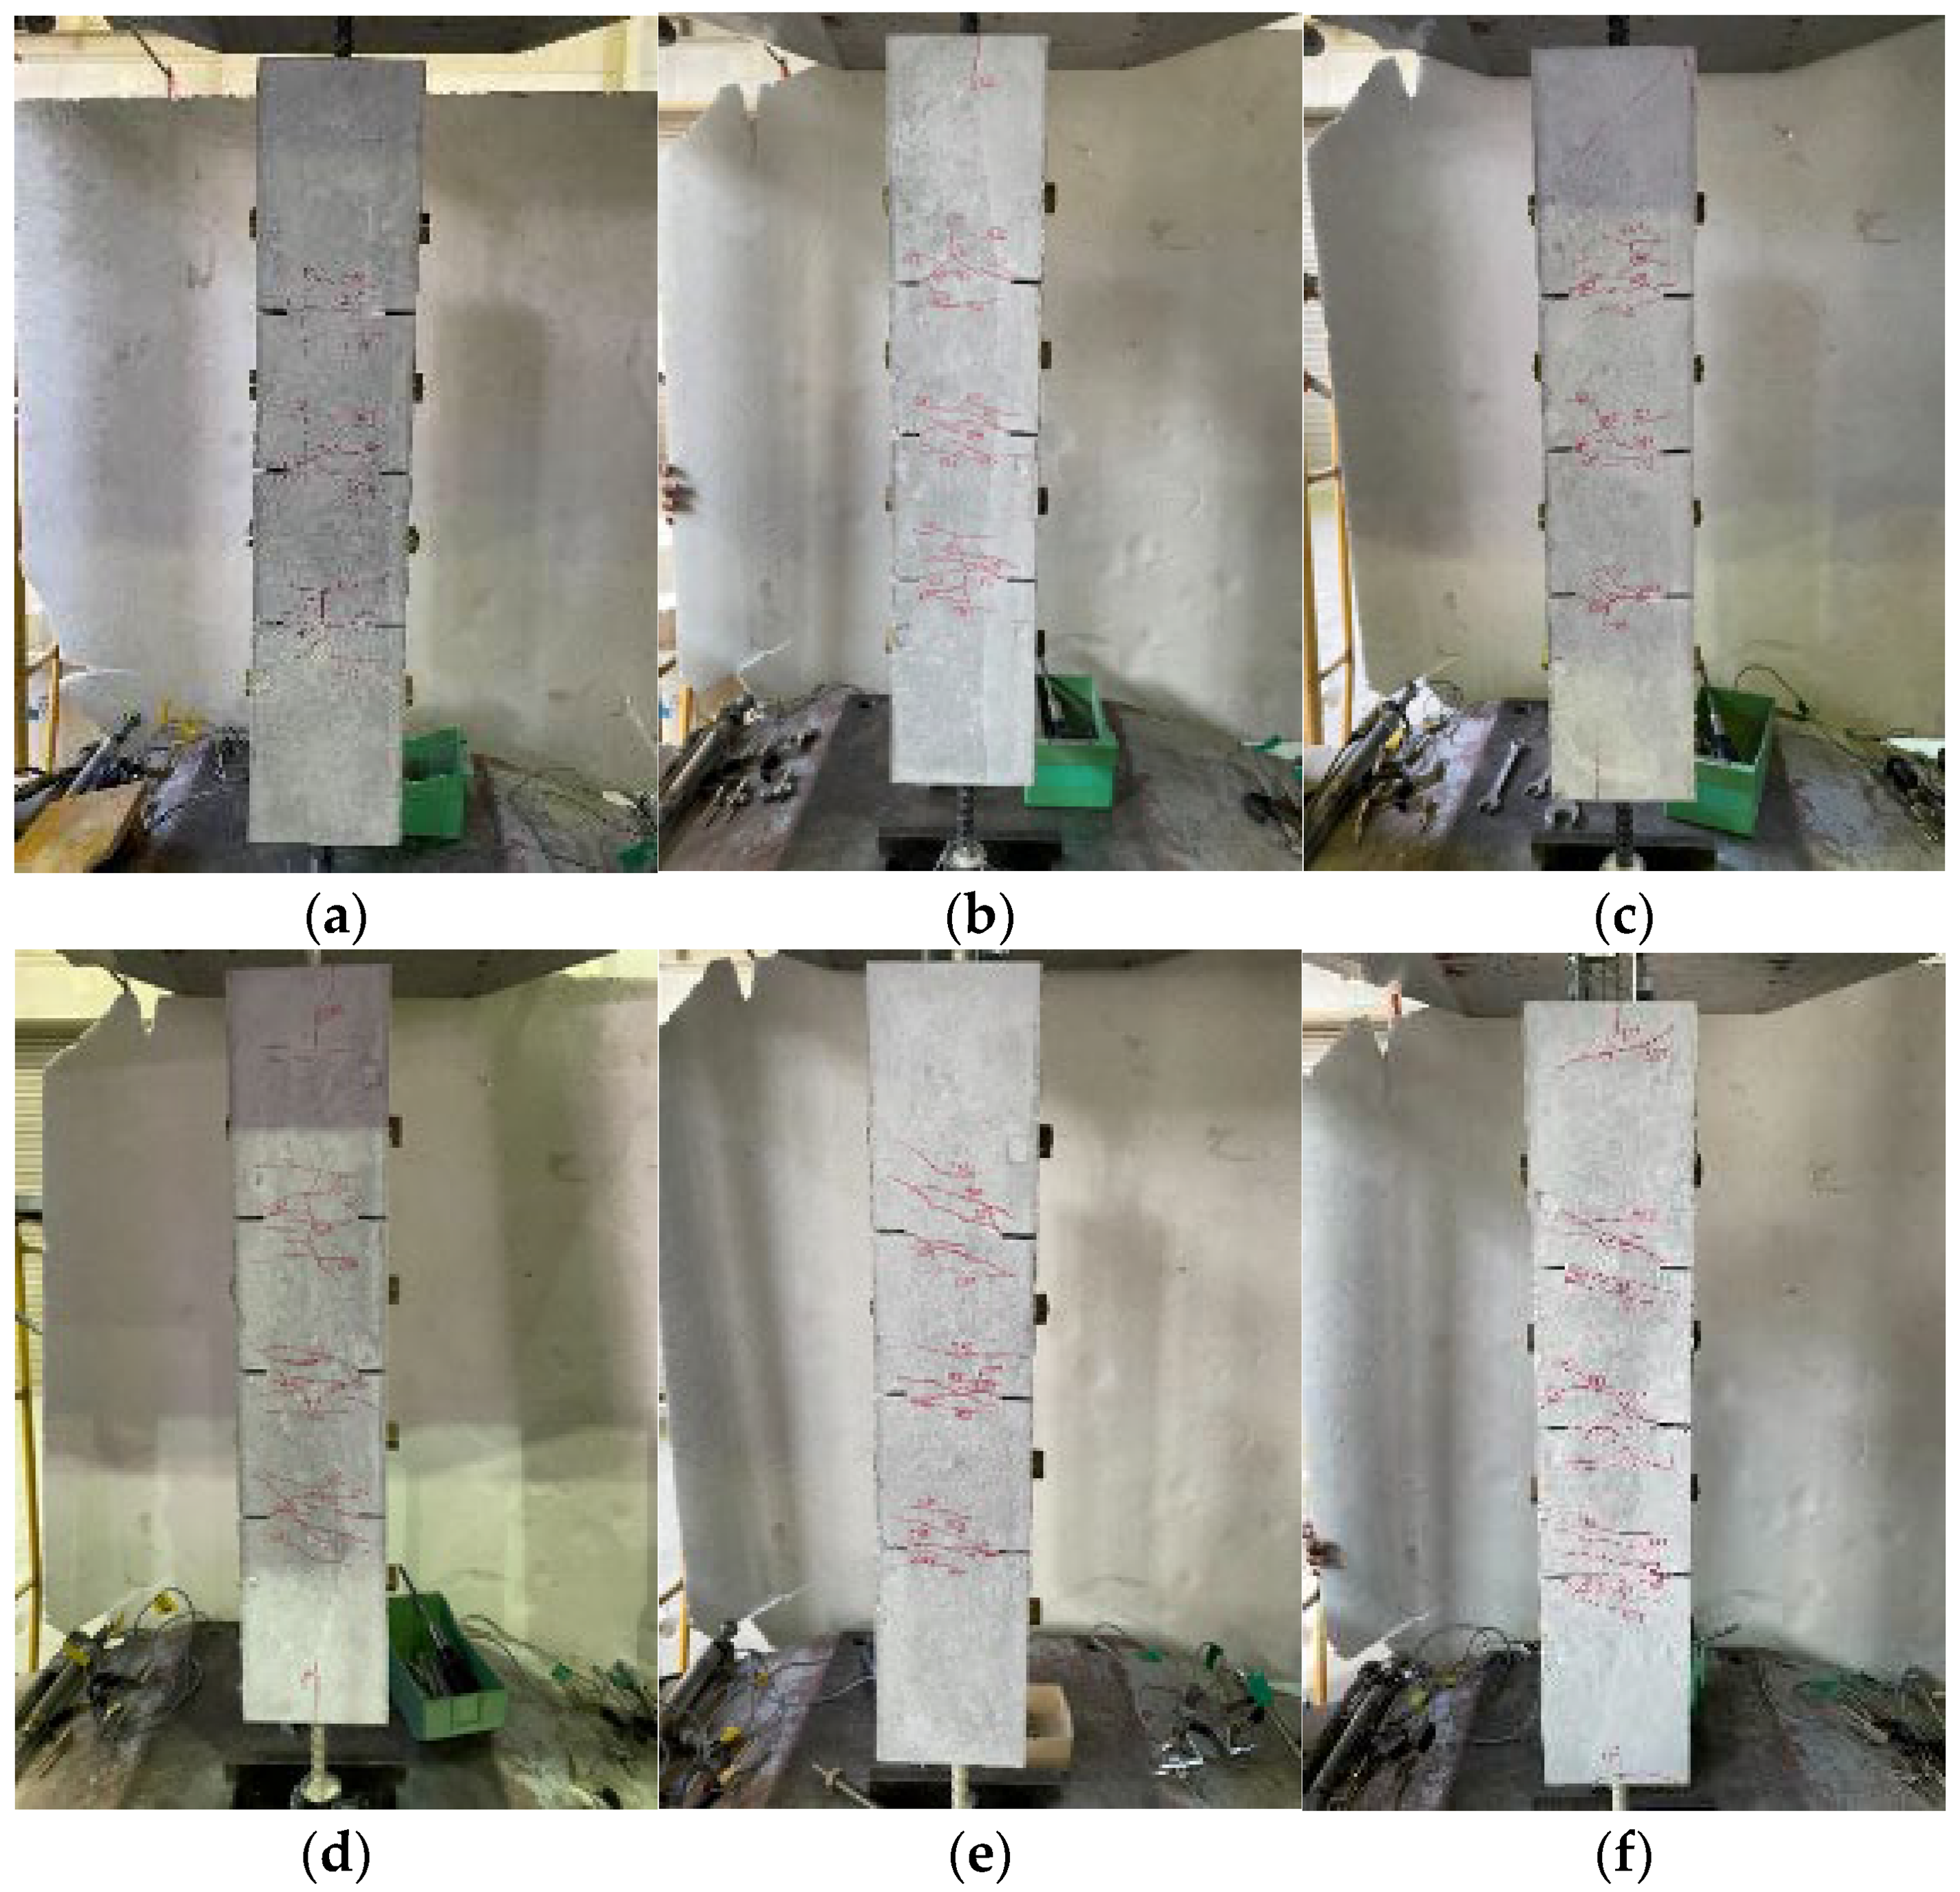
- Failure modes
- (2)
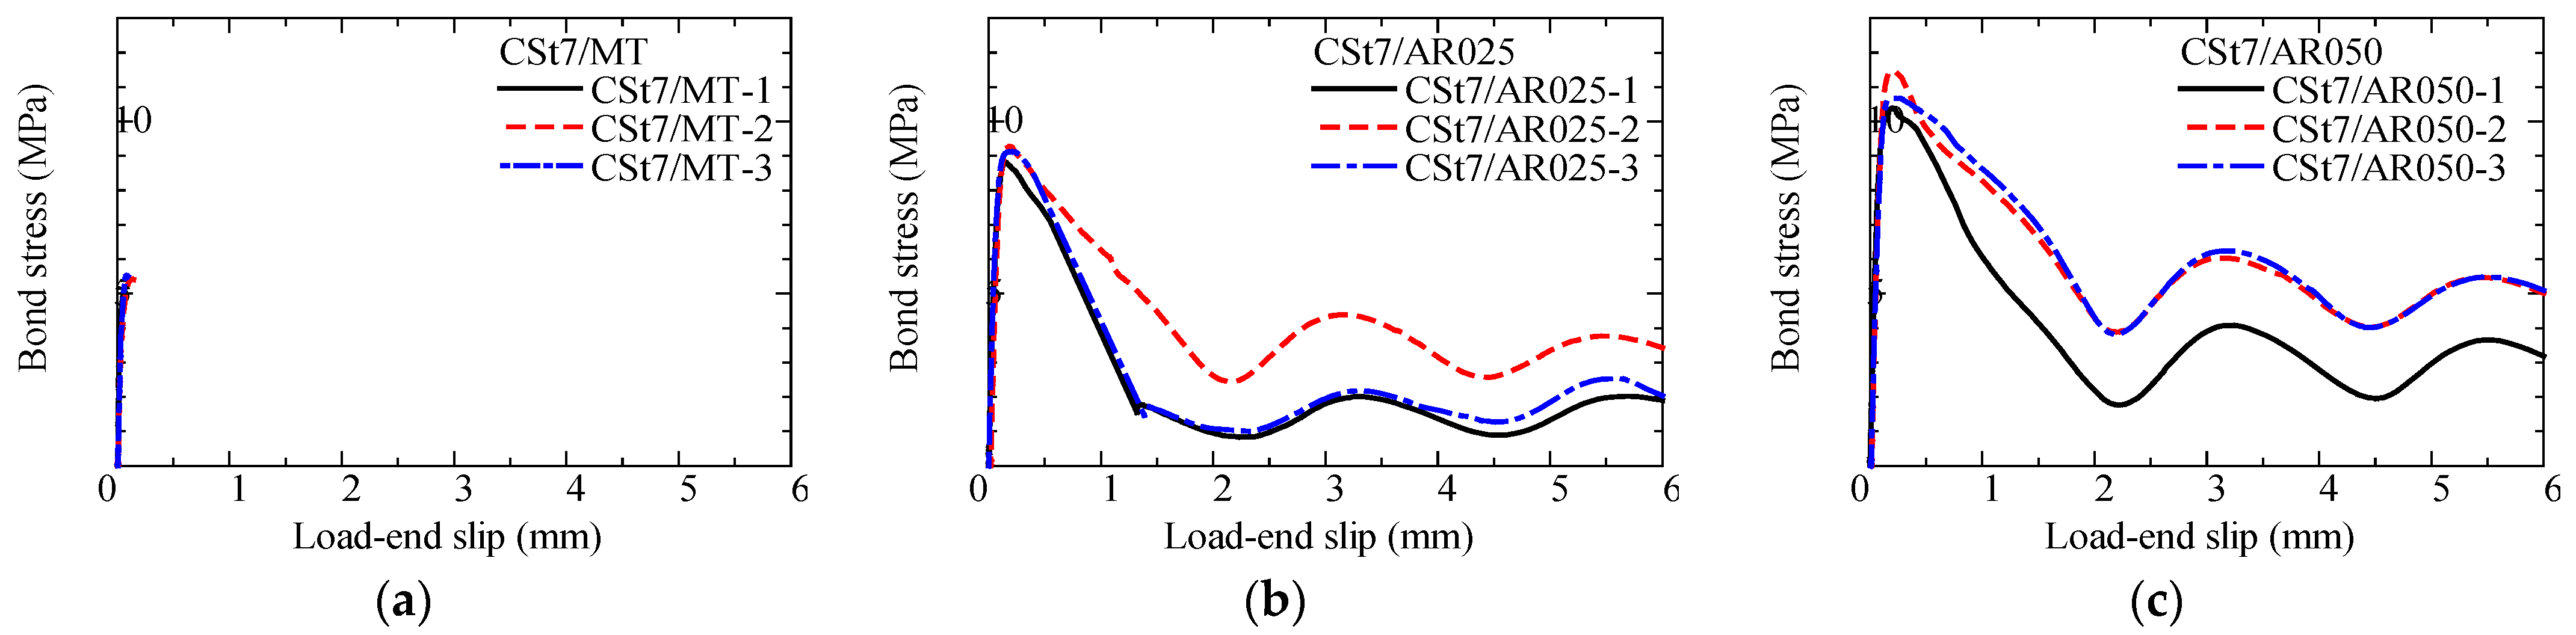
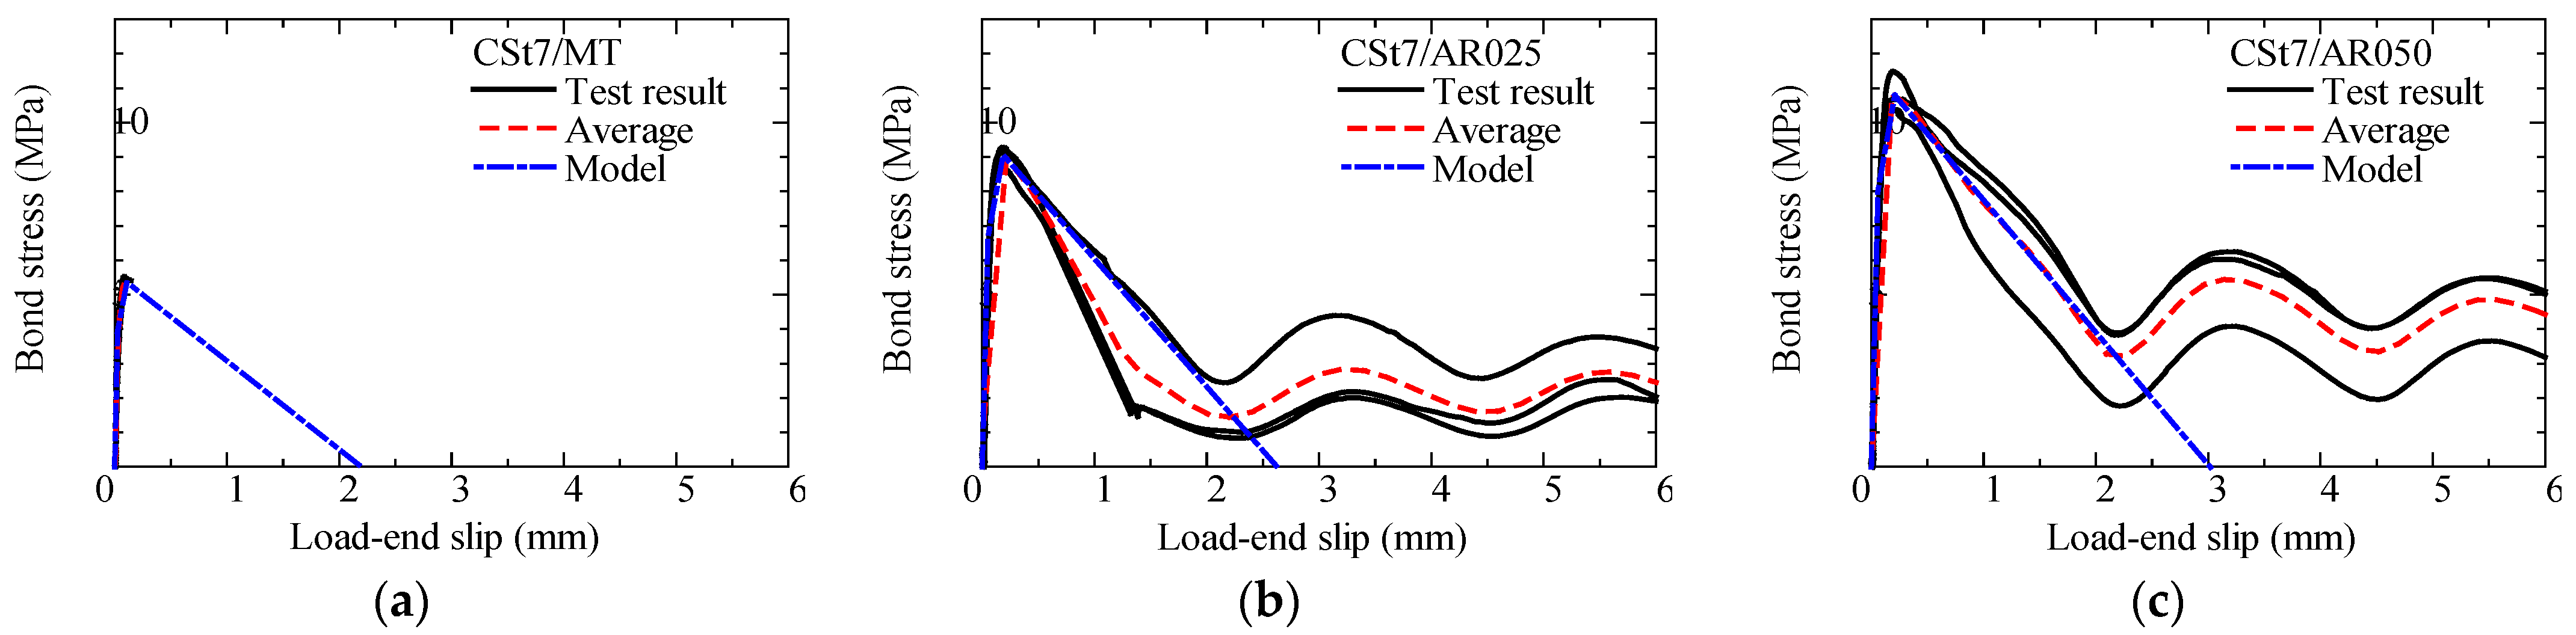
- Bond stress–slip curve
2.2.3. Modeling of Bond Constitutive Law for Strand-CFRP/Aramid–FRCC
3. Crack Width Evaluation of Spiral-FRP/PVA-FRCC Prism
3.1. Outline of Tension Test of Spiral-FRP/PVA-FRCC Prism
3.1.1. Materials
3.1.2. Specimens
3.2. Results of Tension Test for Spiral-FRP/PVA-FRCC
3.2.1. Crack Observation
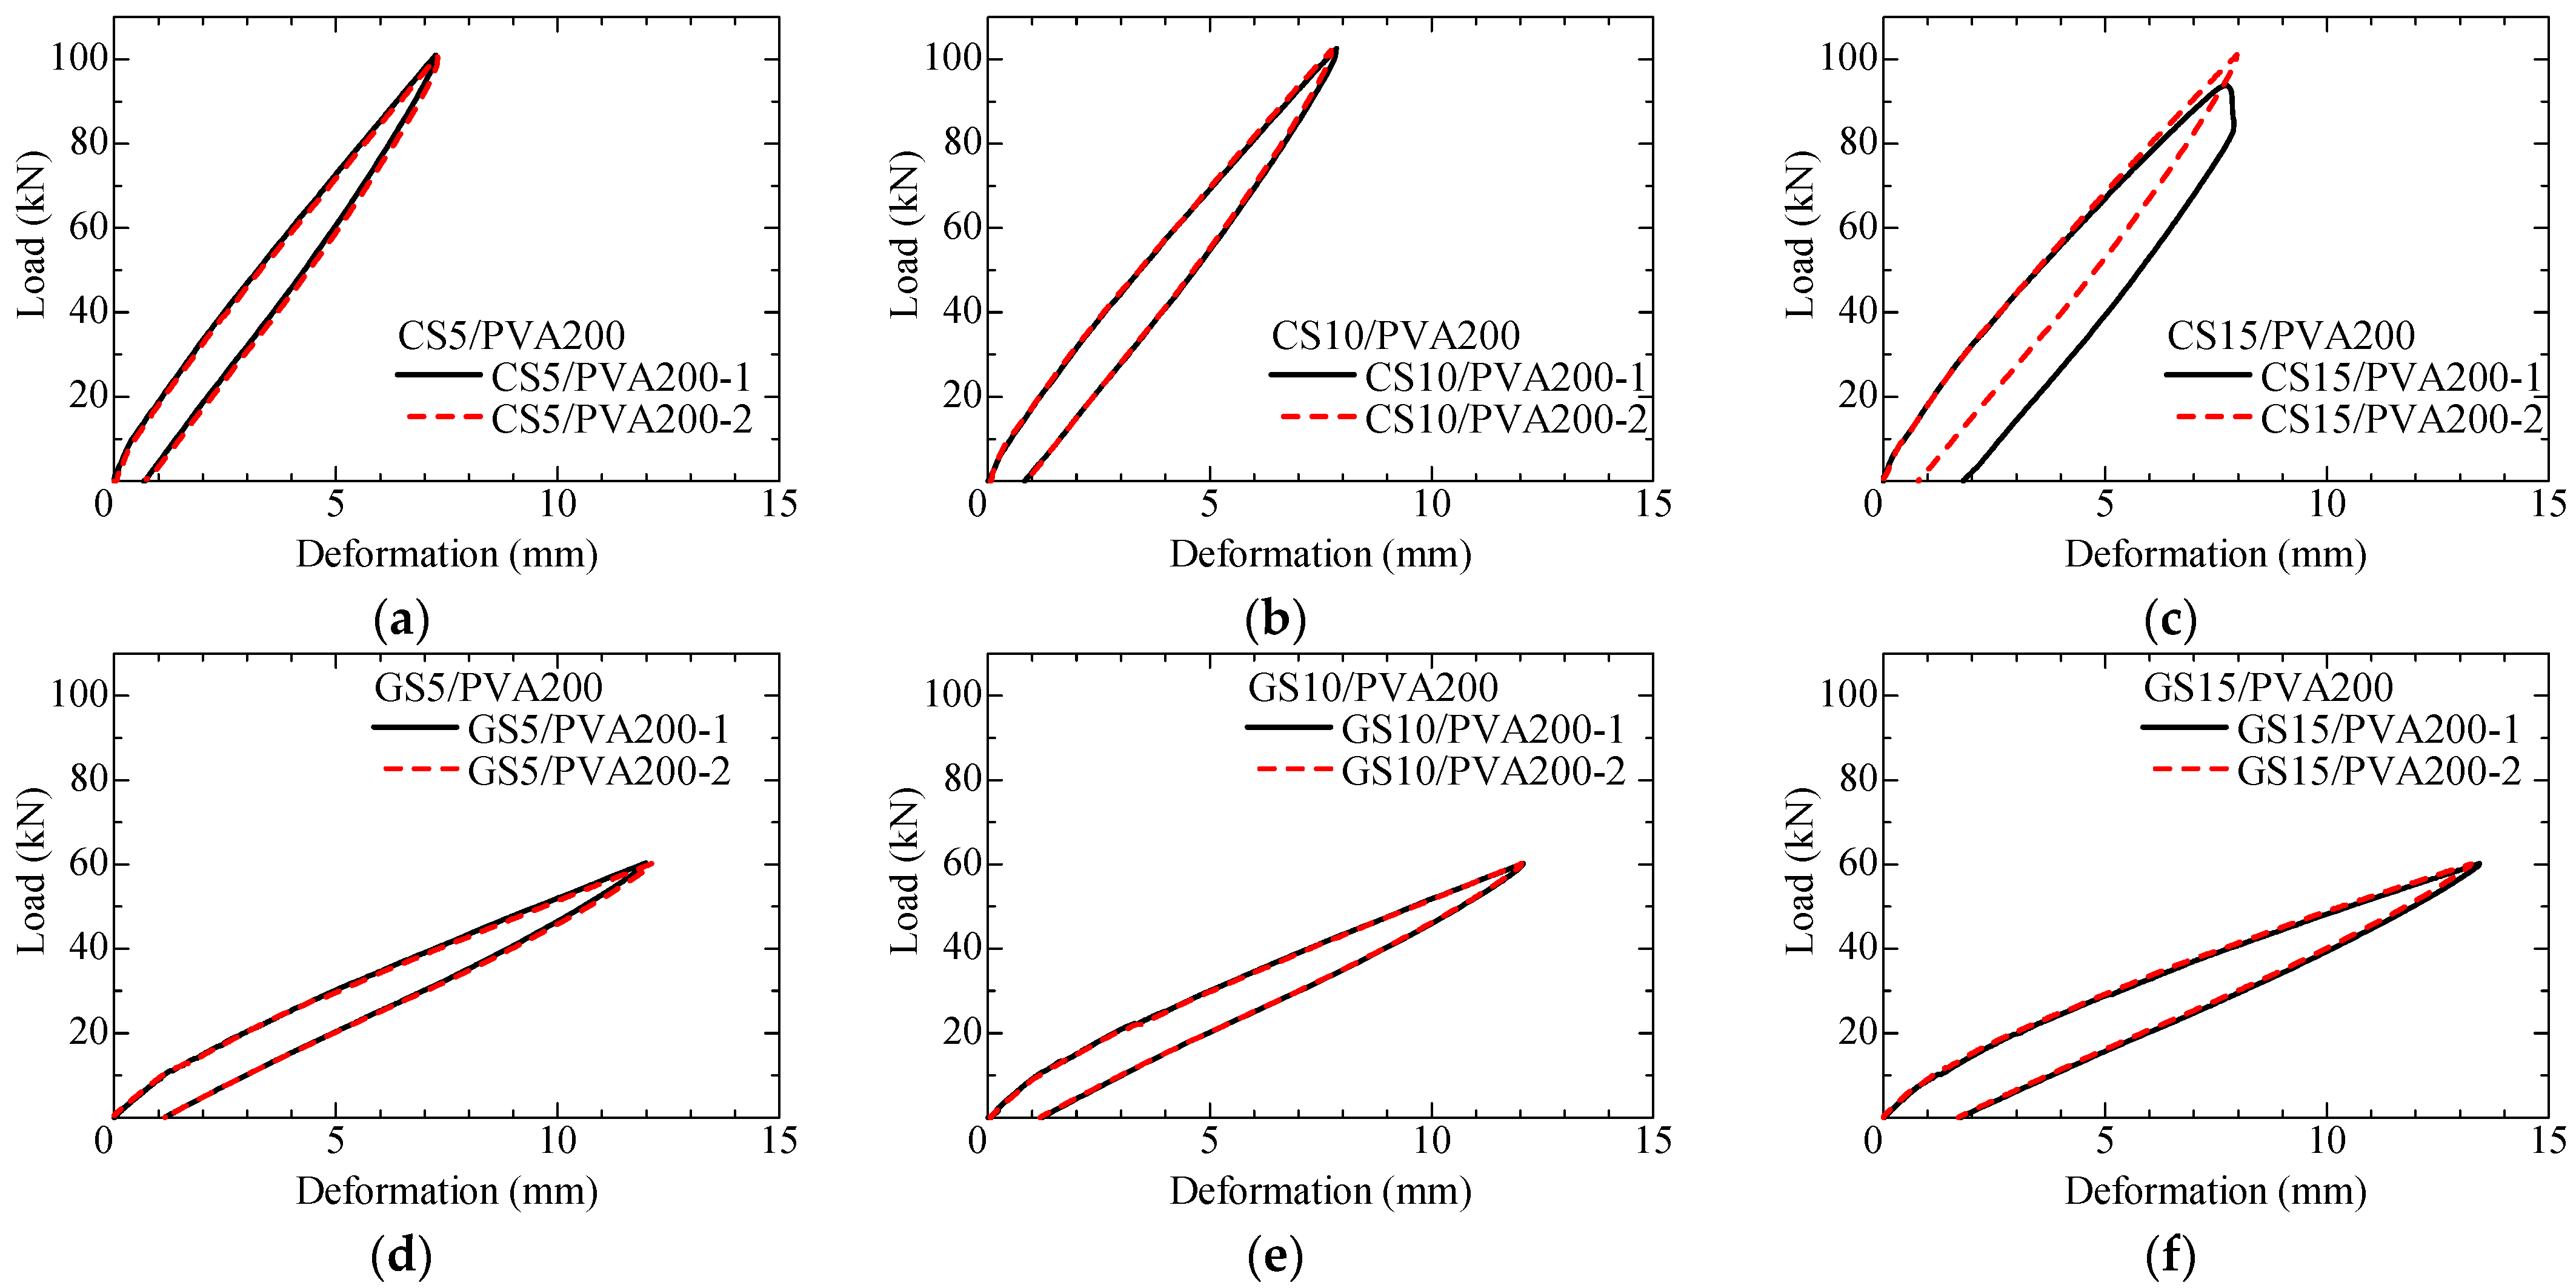
3.2.2. Load–Overall Deformation Curve
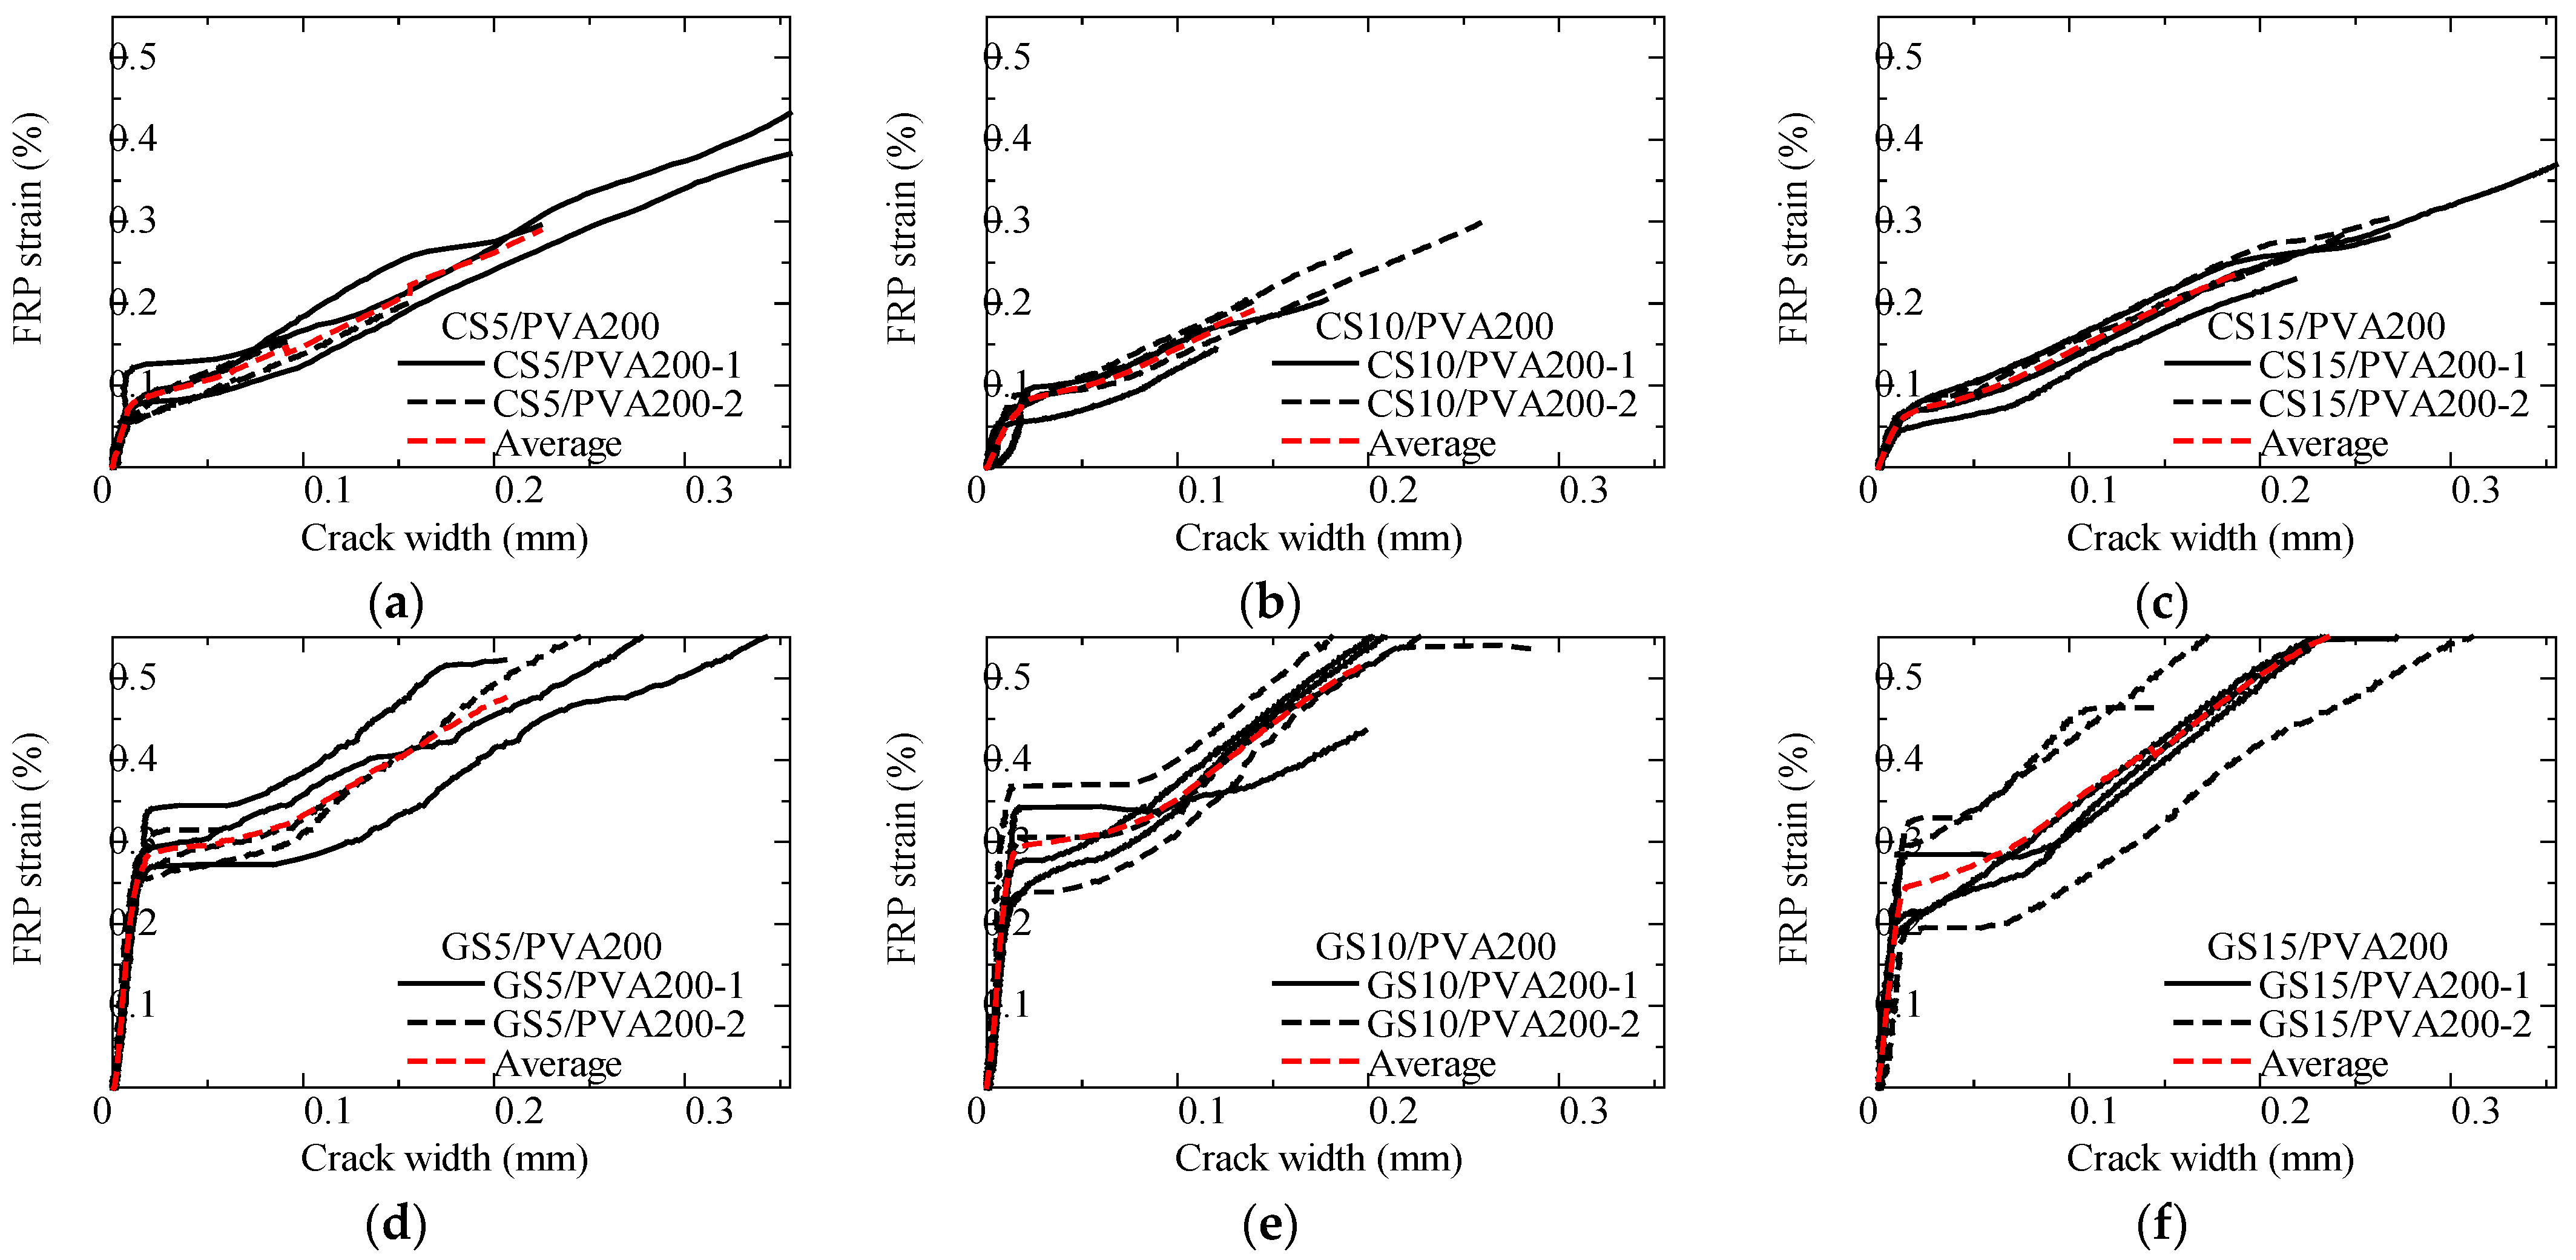
3.2.3. FRP Strain–Crack Width Relationship
3.3. Crack Width Evaluation of Spiral-FRP/PVA-FRCC Prism
3.3.1. Crack Width Prediction Formula
3.3.2. Comparison Between Test Results and Calculation
4. Crack Width Evaluation of Strand-CFRP/Aramid–FRCC Beam
4.1. Outline of Bending Test for Strand-CFRP/Aramid–FRCC Beam
4.1.1. Materials
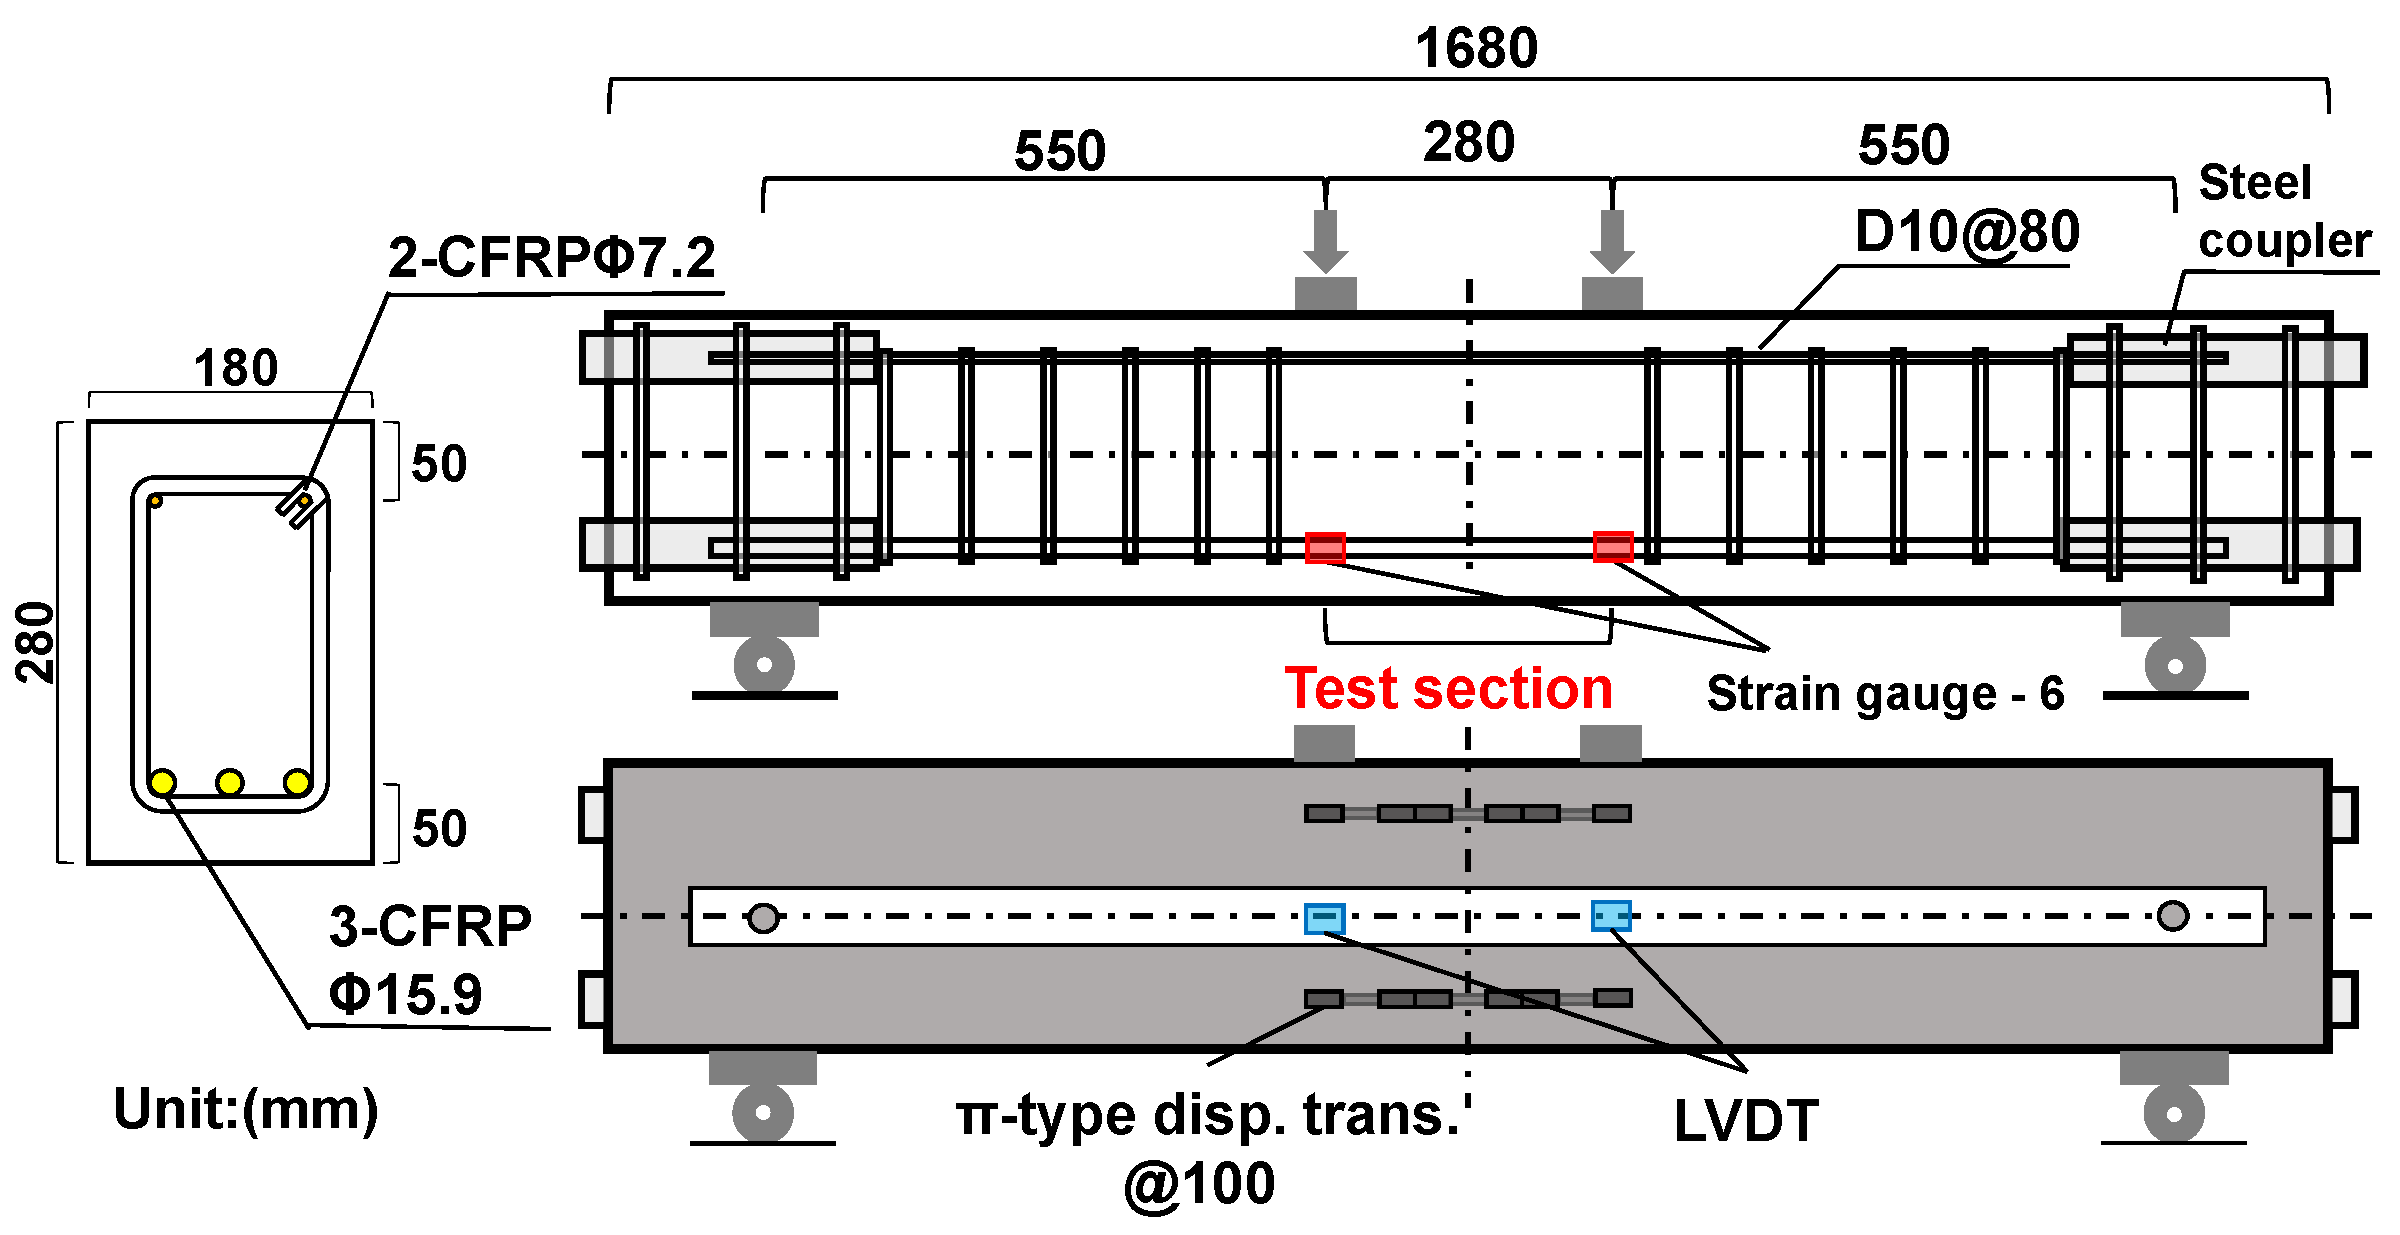
4.1.2. Specimens
4.2. Result of Bending Test of Strand-CFRP/Aramid–FRCC Beam
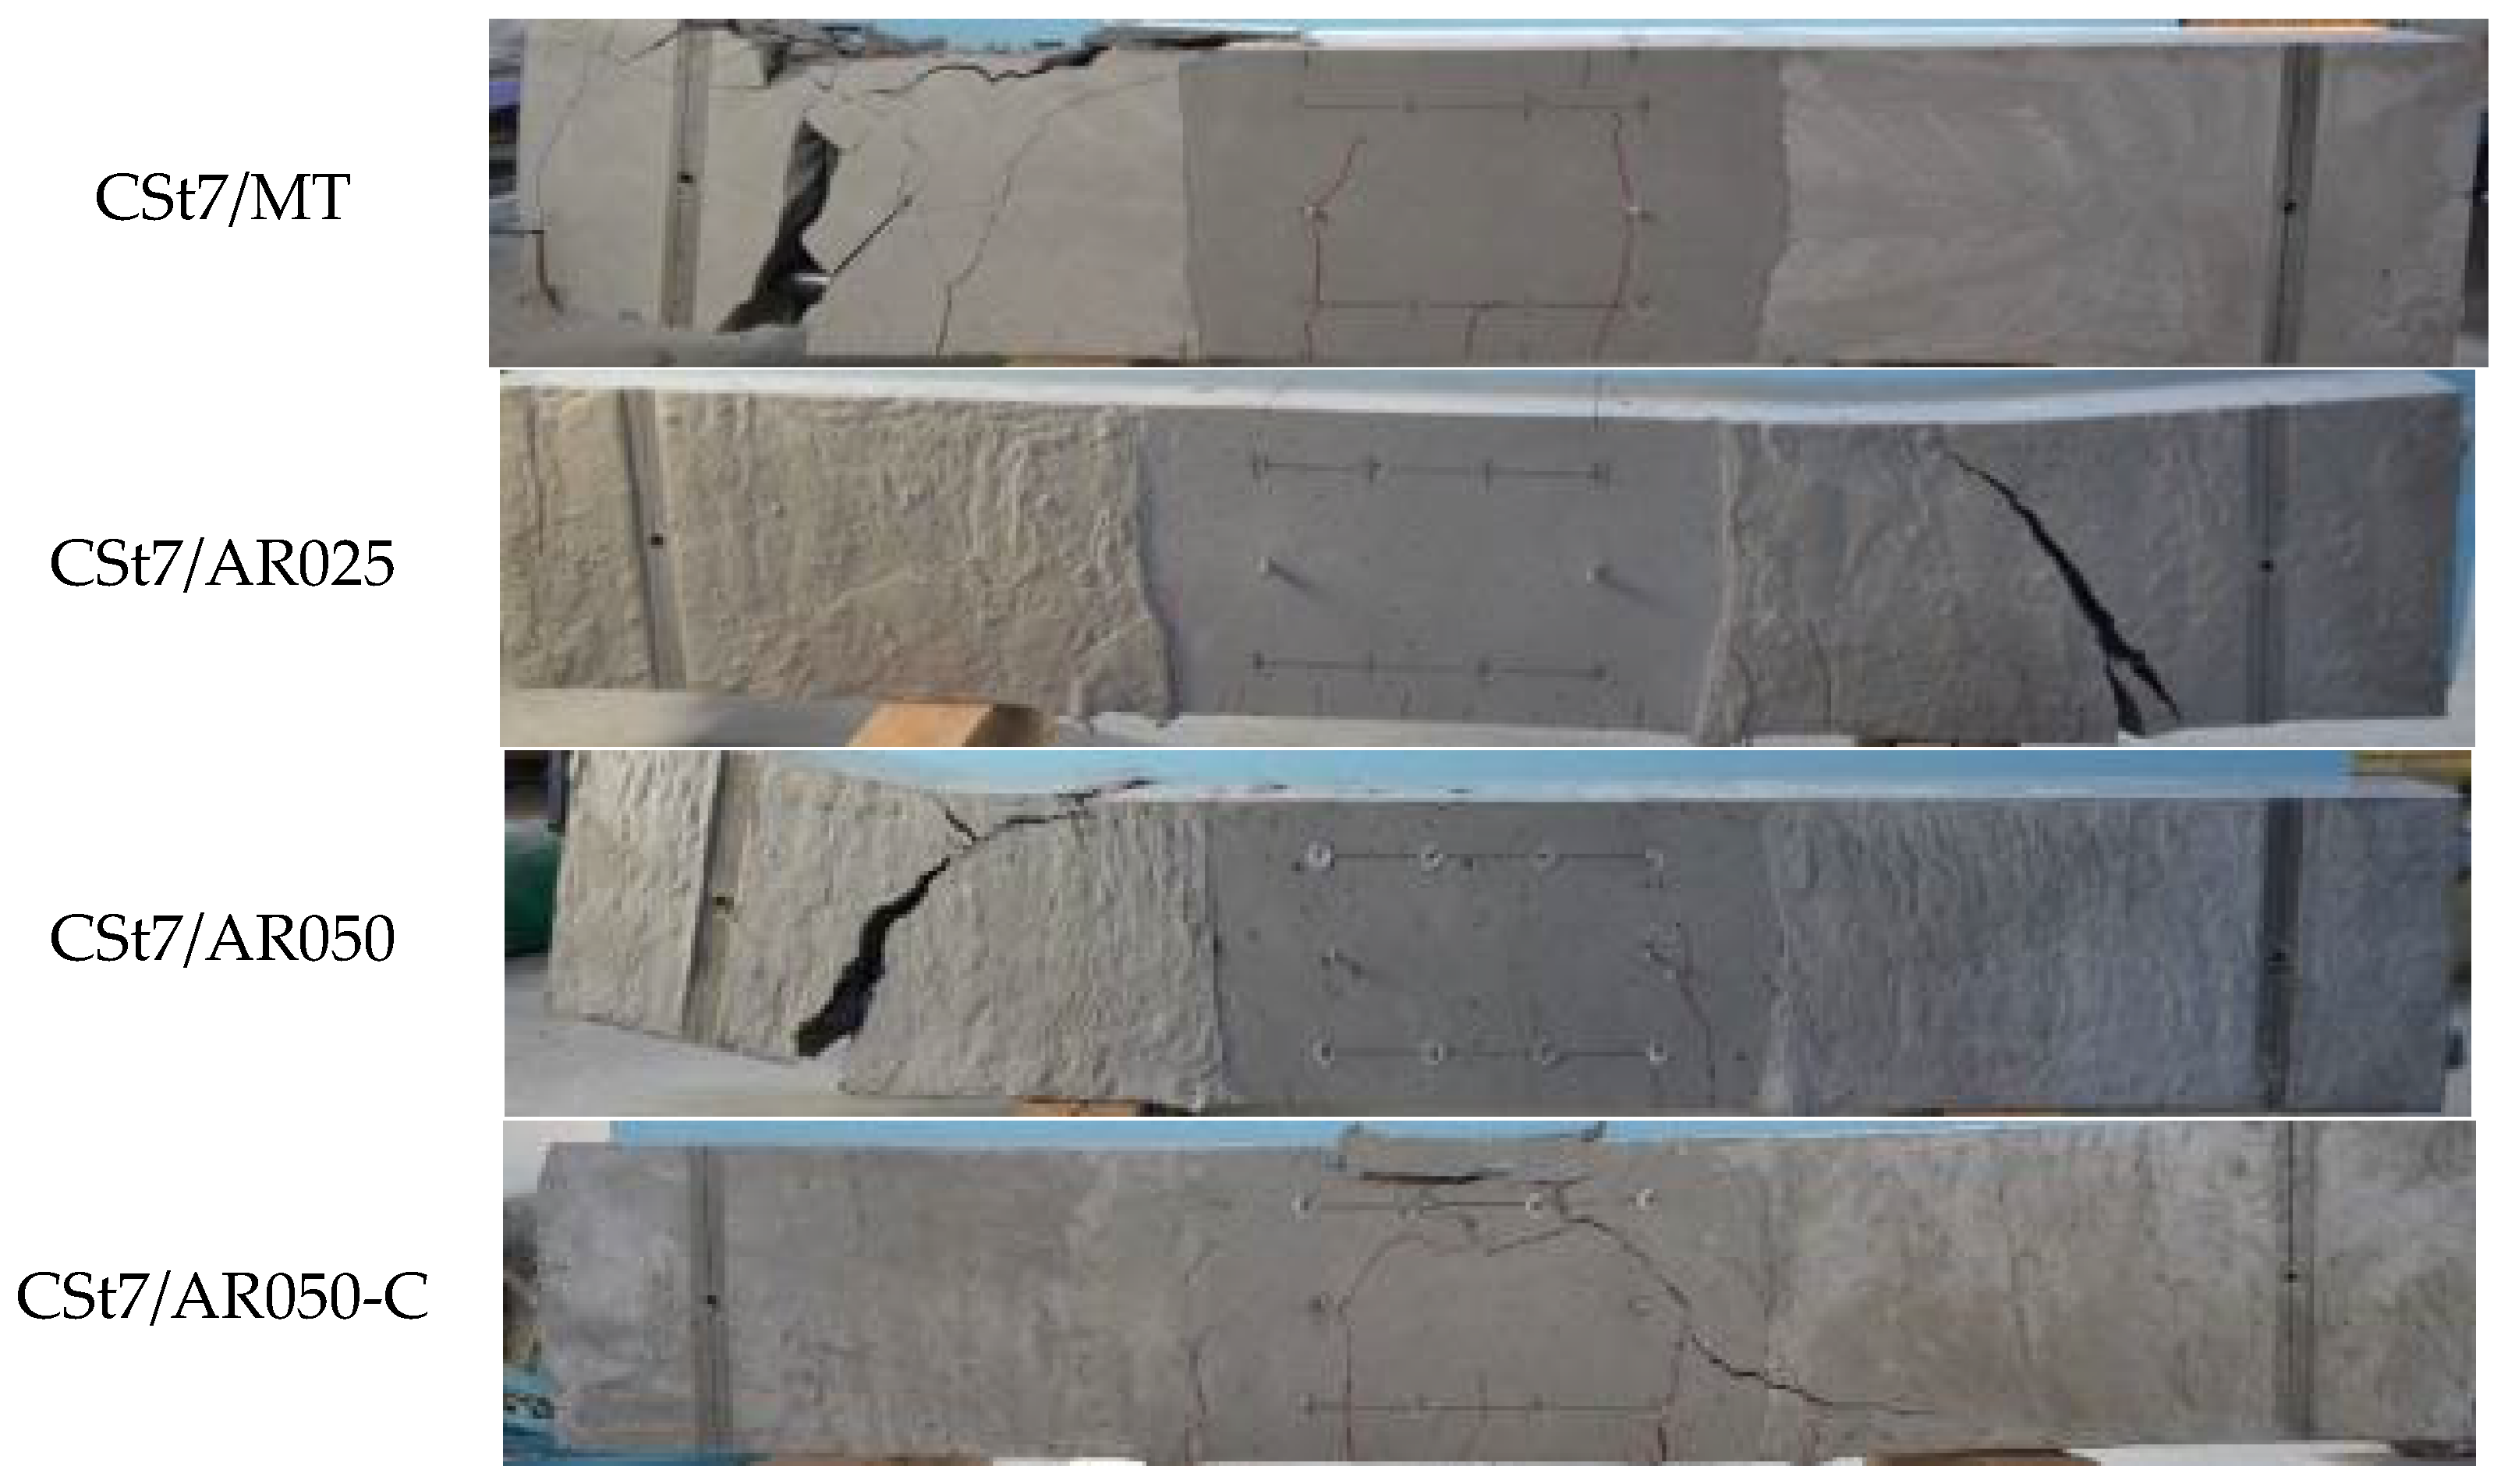
4.2.1. Failure Progress
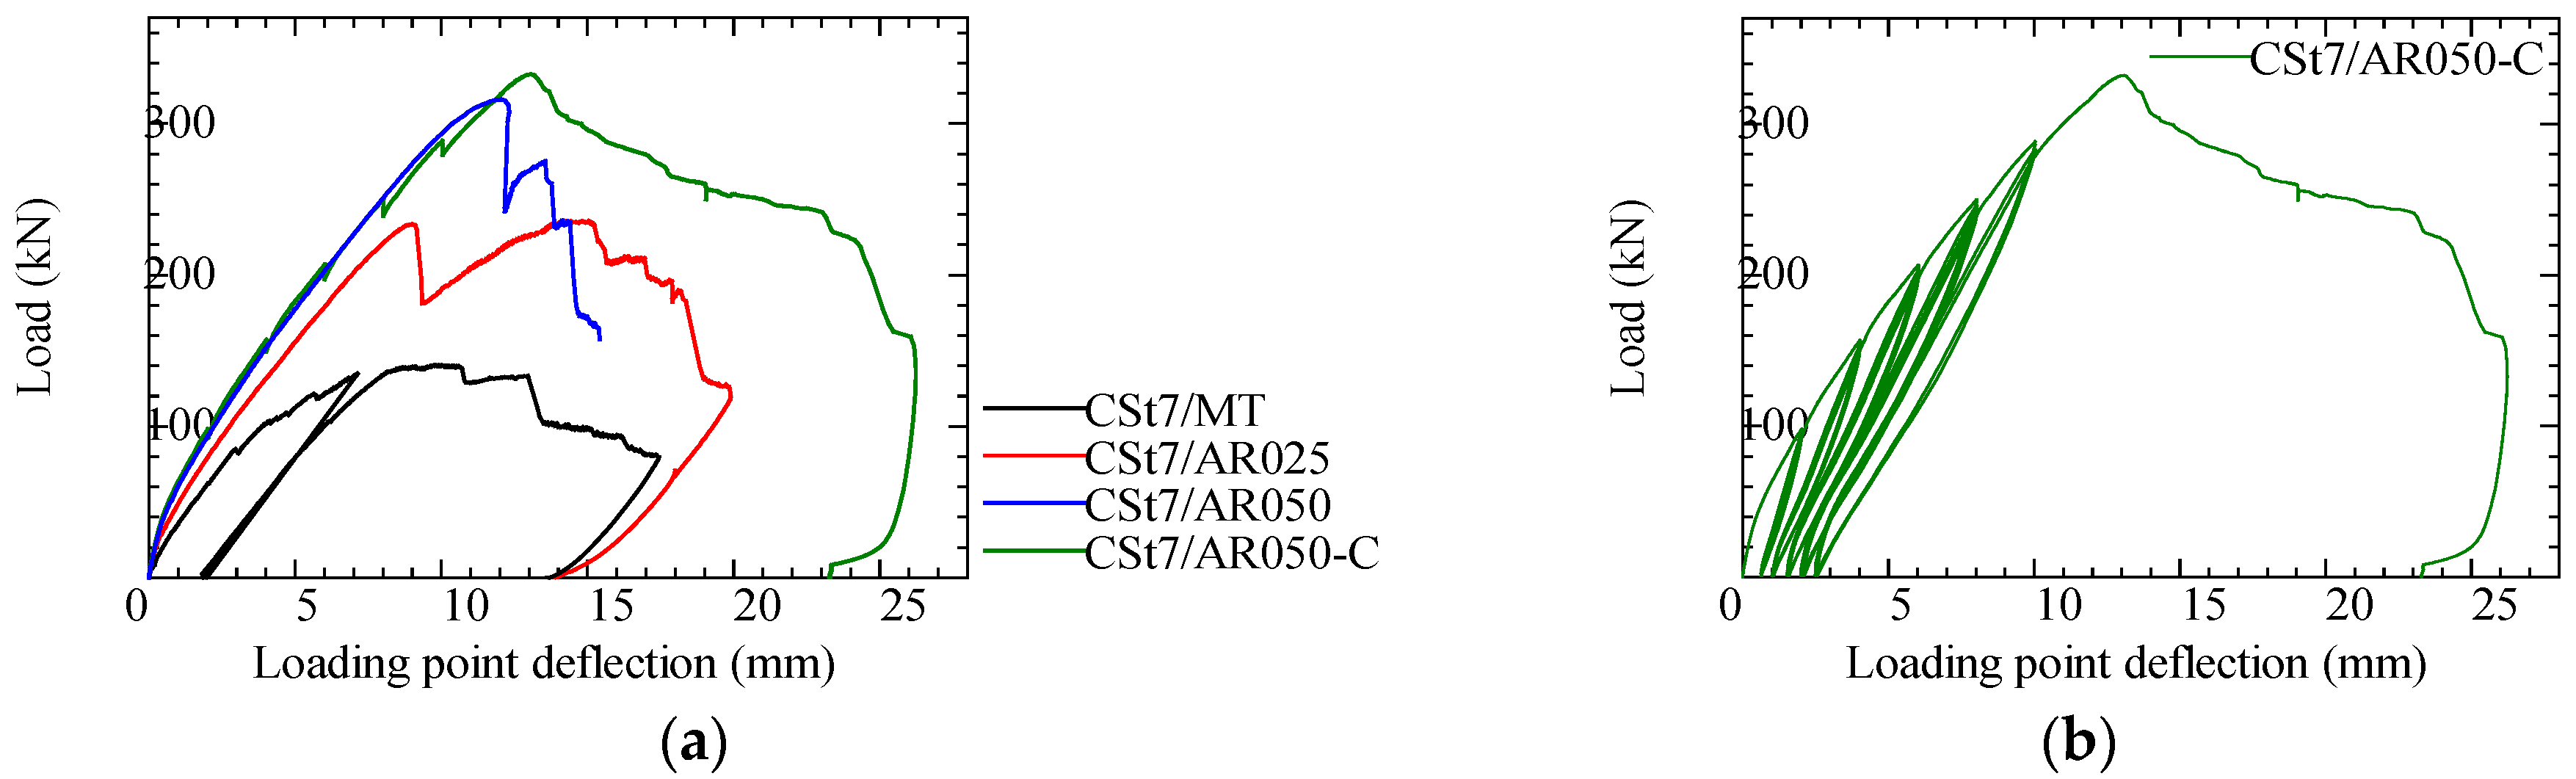
4.2.2. Load–Deflection Curve
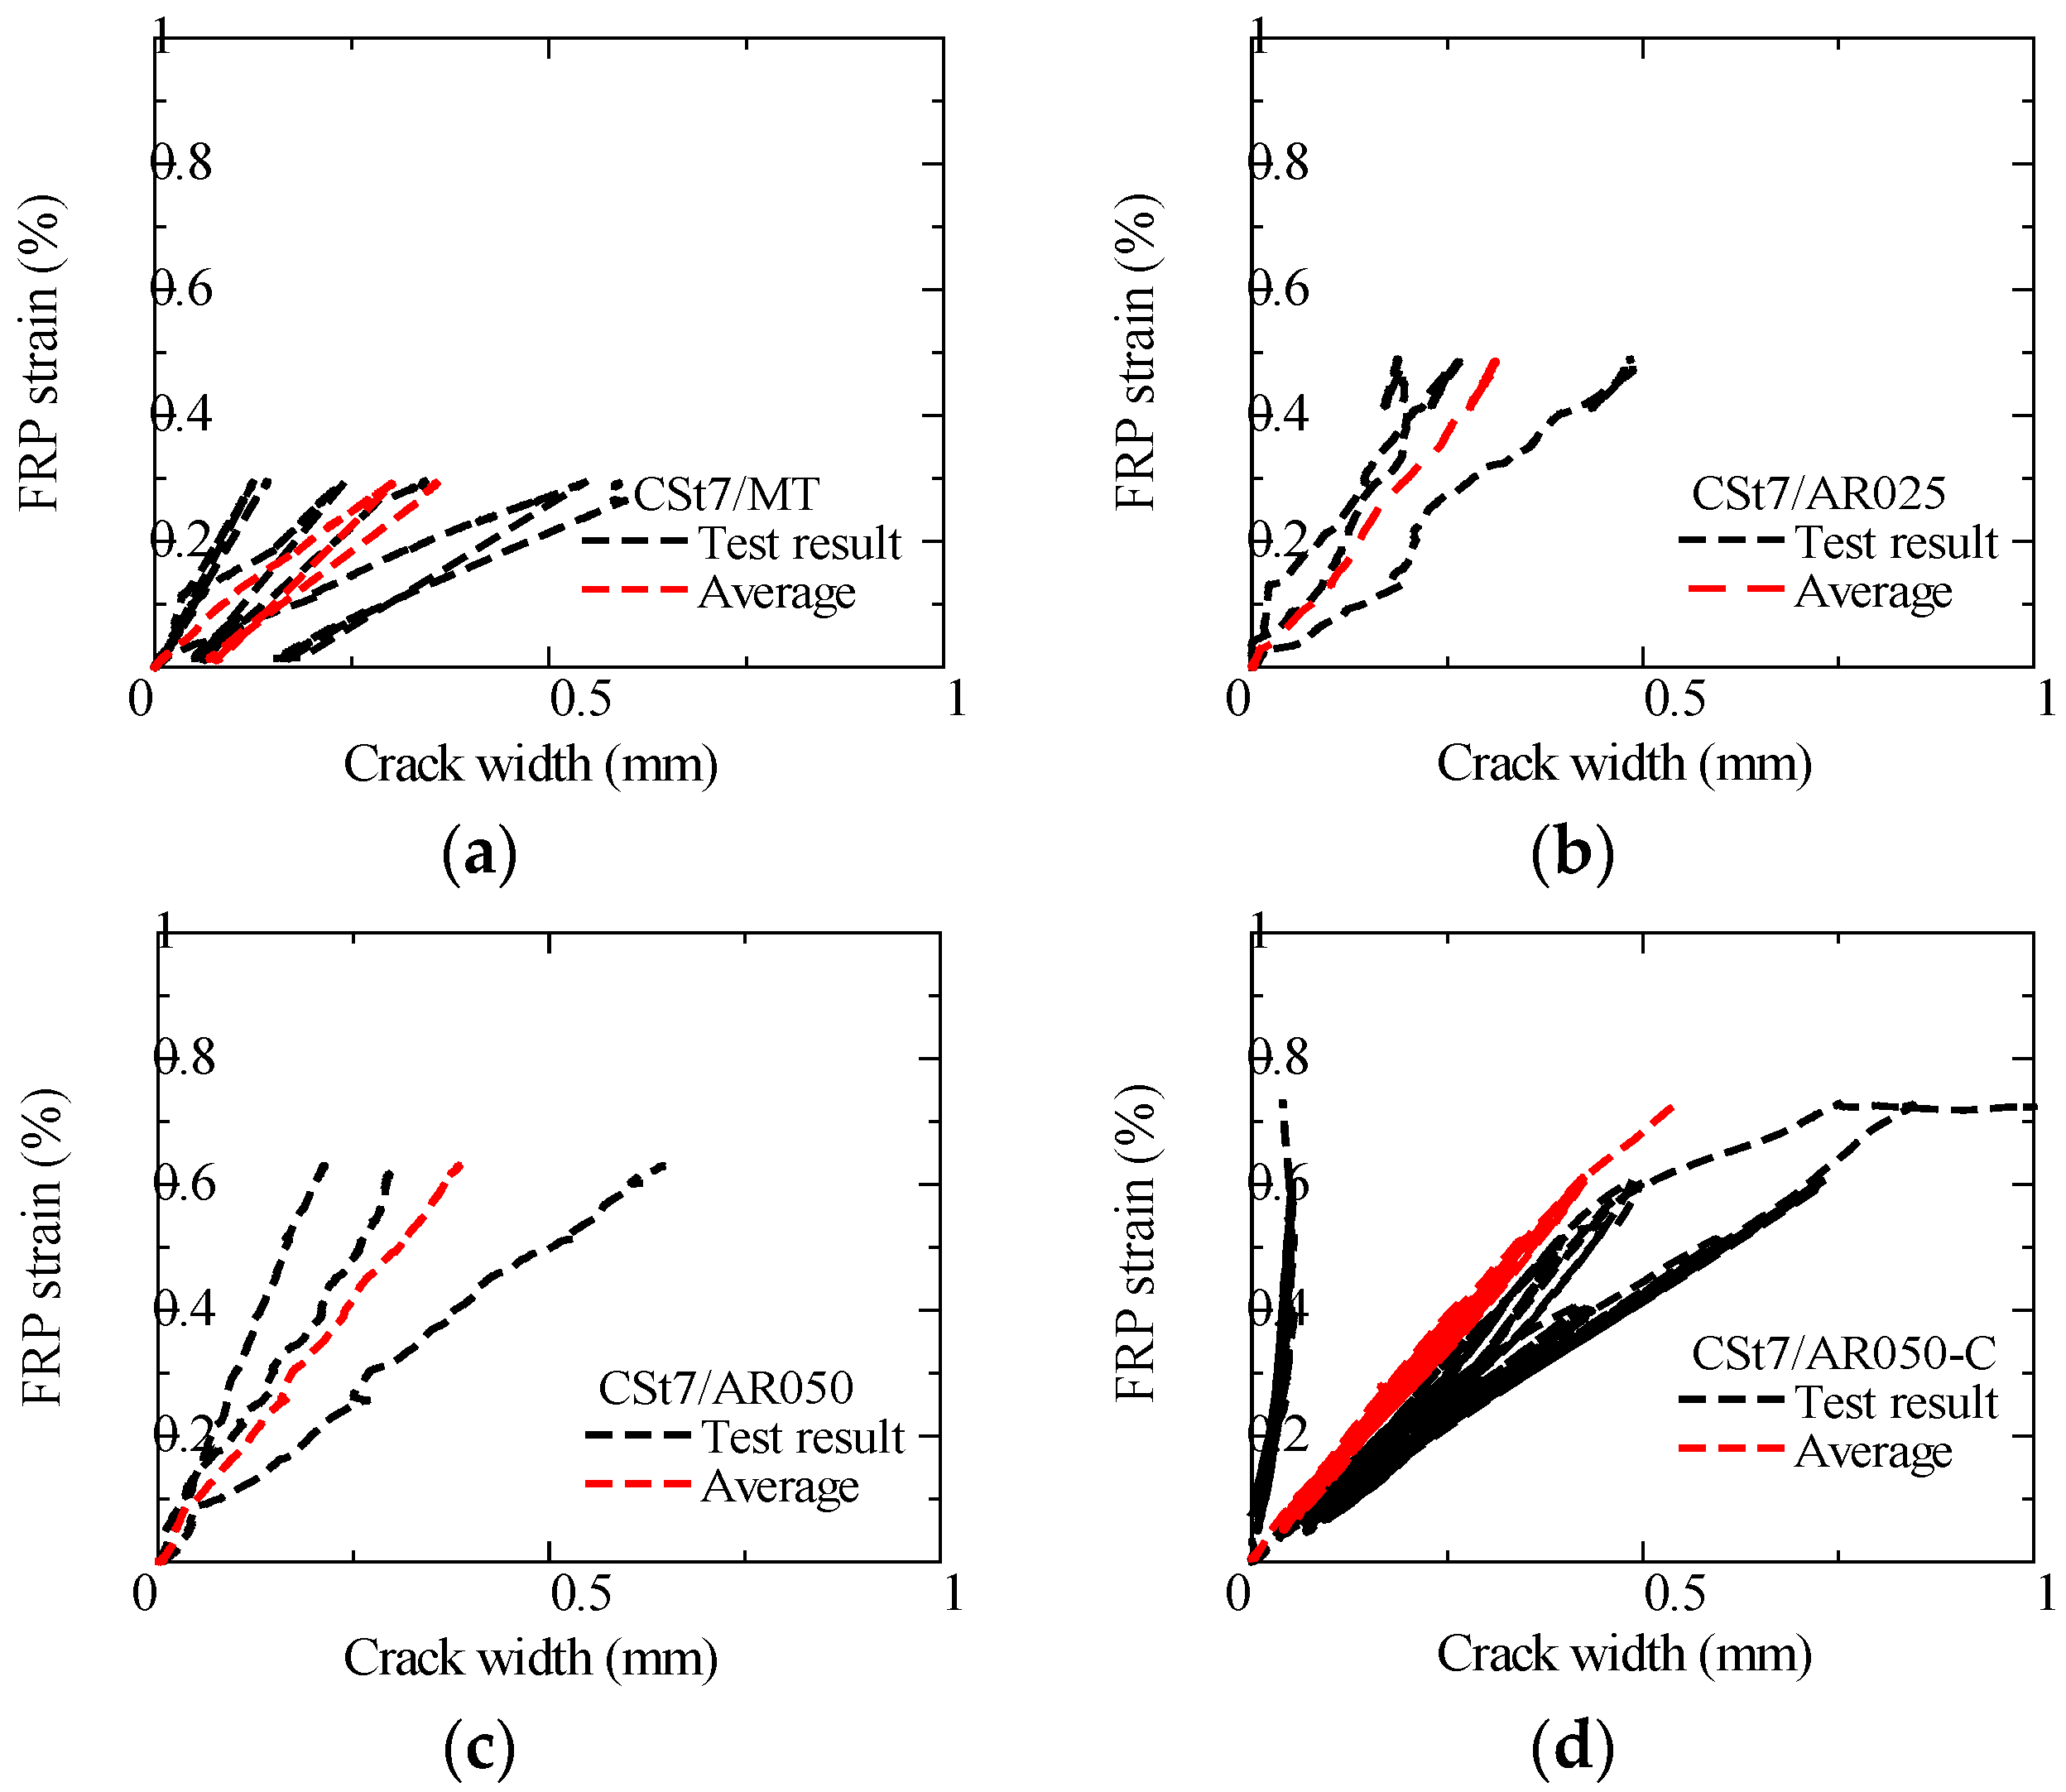
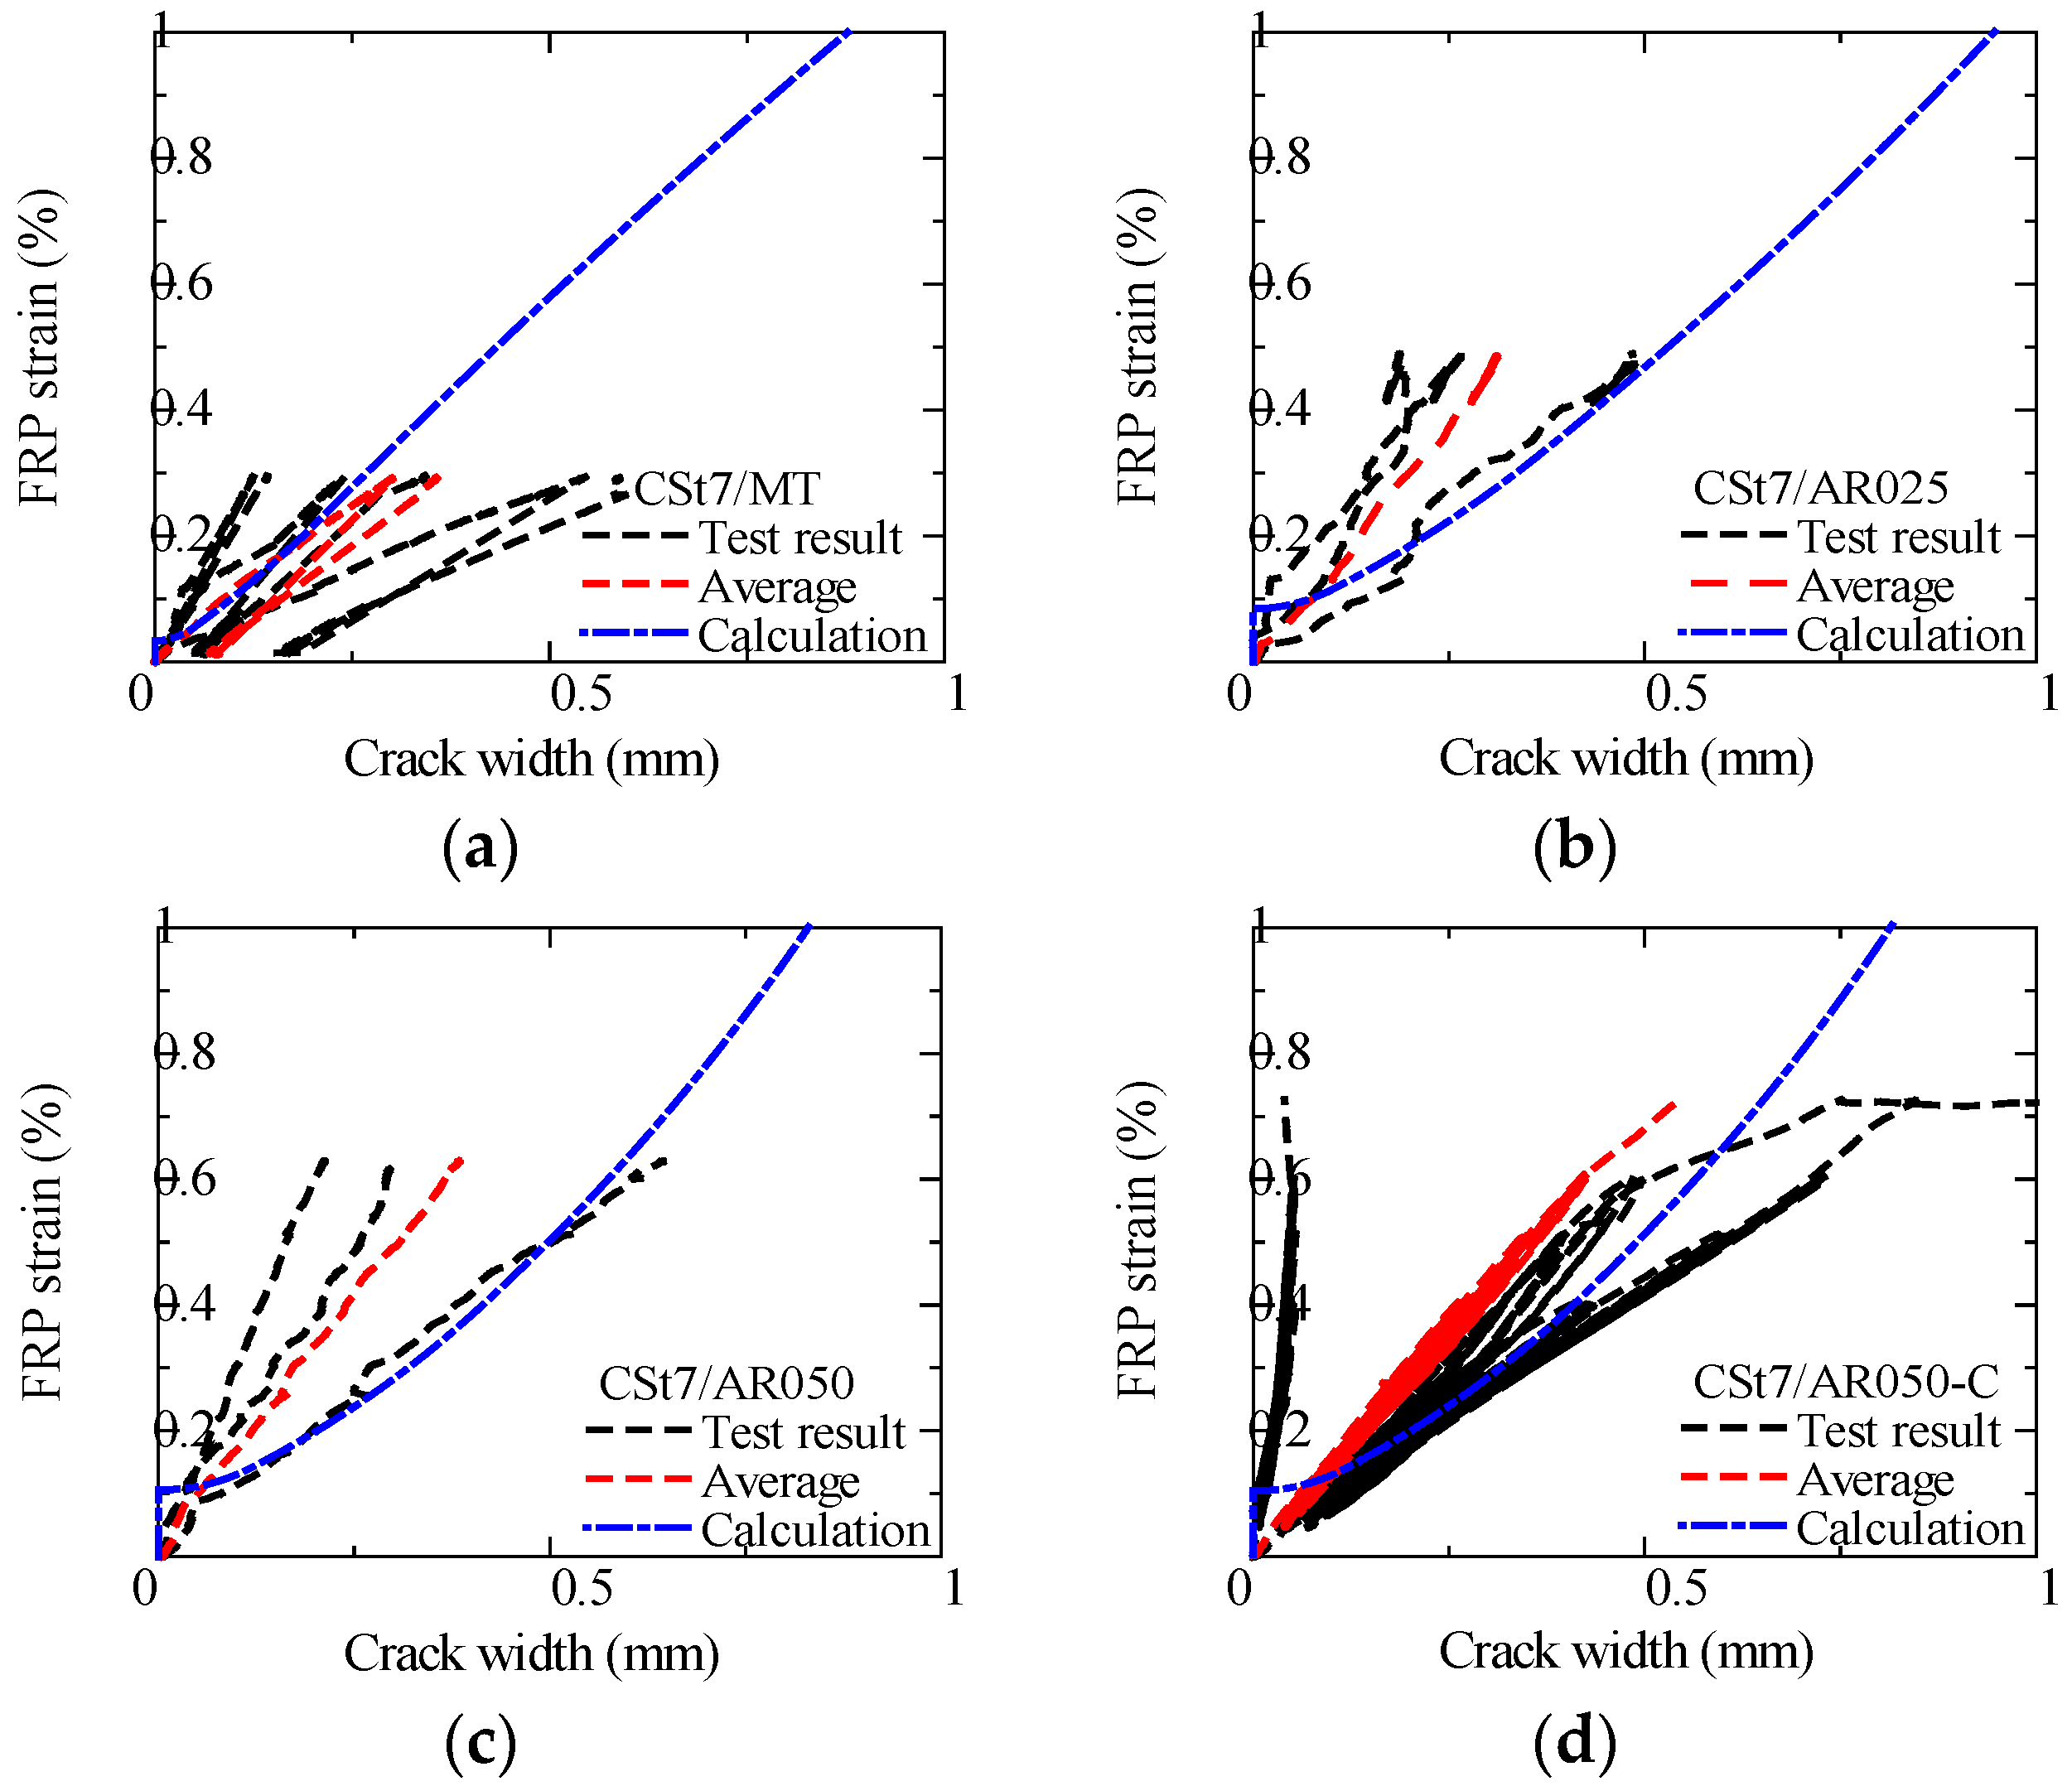
4.2.3. FRP Strain–Crack Width Relationship
4.3. Crack Width Evaluation of Strand-CFRP/Aramid–FRCC Beam
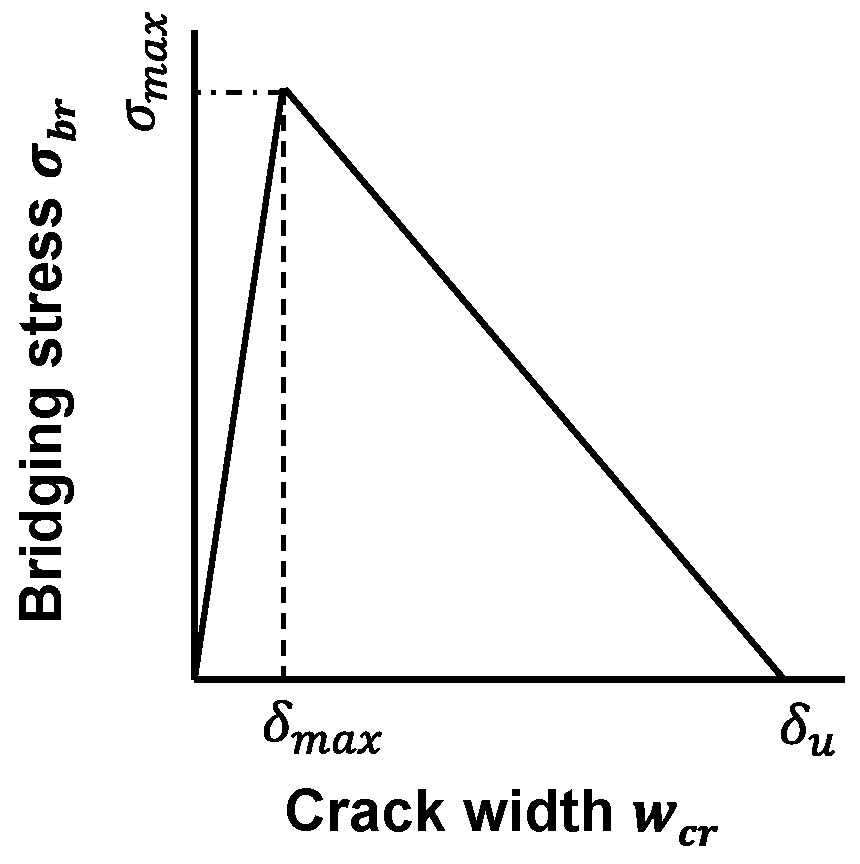
4.3.1. Crack Width Prediction Formula
4.3.2. Comparison Between Test Results and Calculations
5. Conclusions
- In bond tests of spiral-type CFRP and GFRP bars with PVA-FRCC, the maximum bond stress tends to increase as the rib–height ratio increases. For CFRP specimens, when the rib–height ratio increased from 5.7% to 8.8%, the maximum bond stress increased by 11%. For GFRP specimens, when the ratio increased from 5.9% to 8.8%, the maximum bond stress increased by 33%.
- In bond tests of strand-type CFRP with aramid–FRCC, the maximum bond stress tends to increase as the FRCC fiber volume fraction increases. The average maximum bond stress in FRCC with a 0.25% volume fraction is 1.67 times that of mortar, and that in 0.50% is 2.01 times that in mortar.
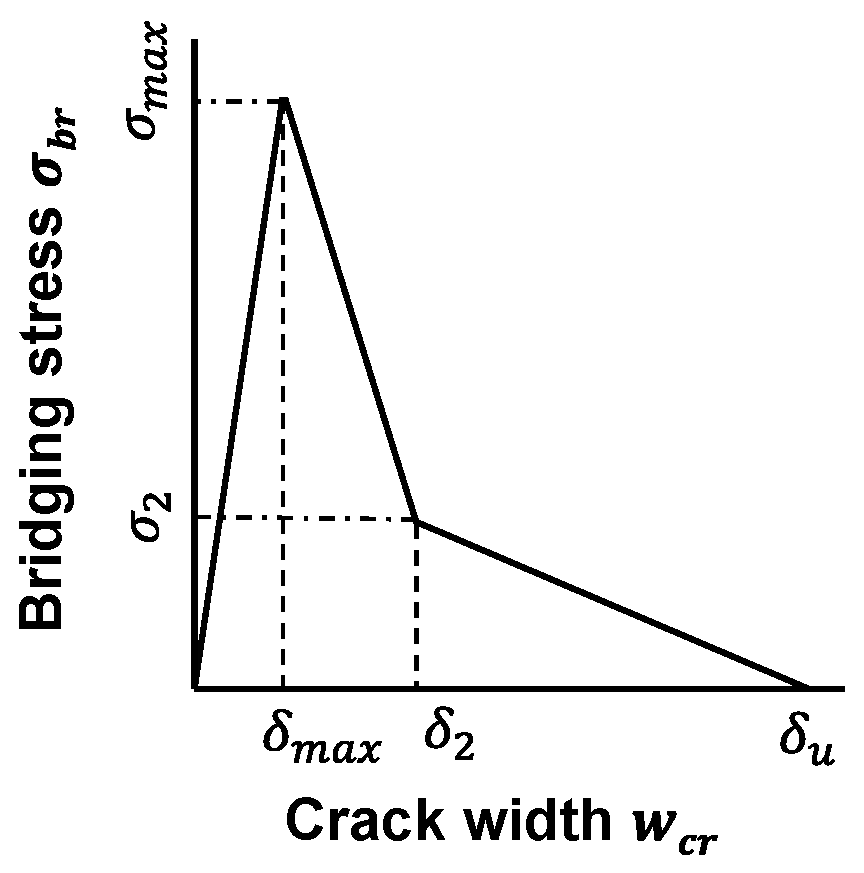
- The bond constitutive laws for spiral-type CFRP and GFRP bars with PVA-FRCC and strand-type CFRP with aramid–FRCC were modeled using the trilinear model.
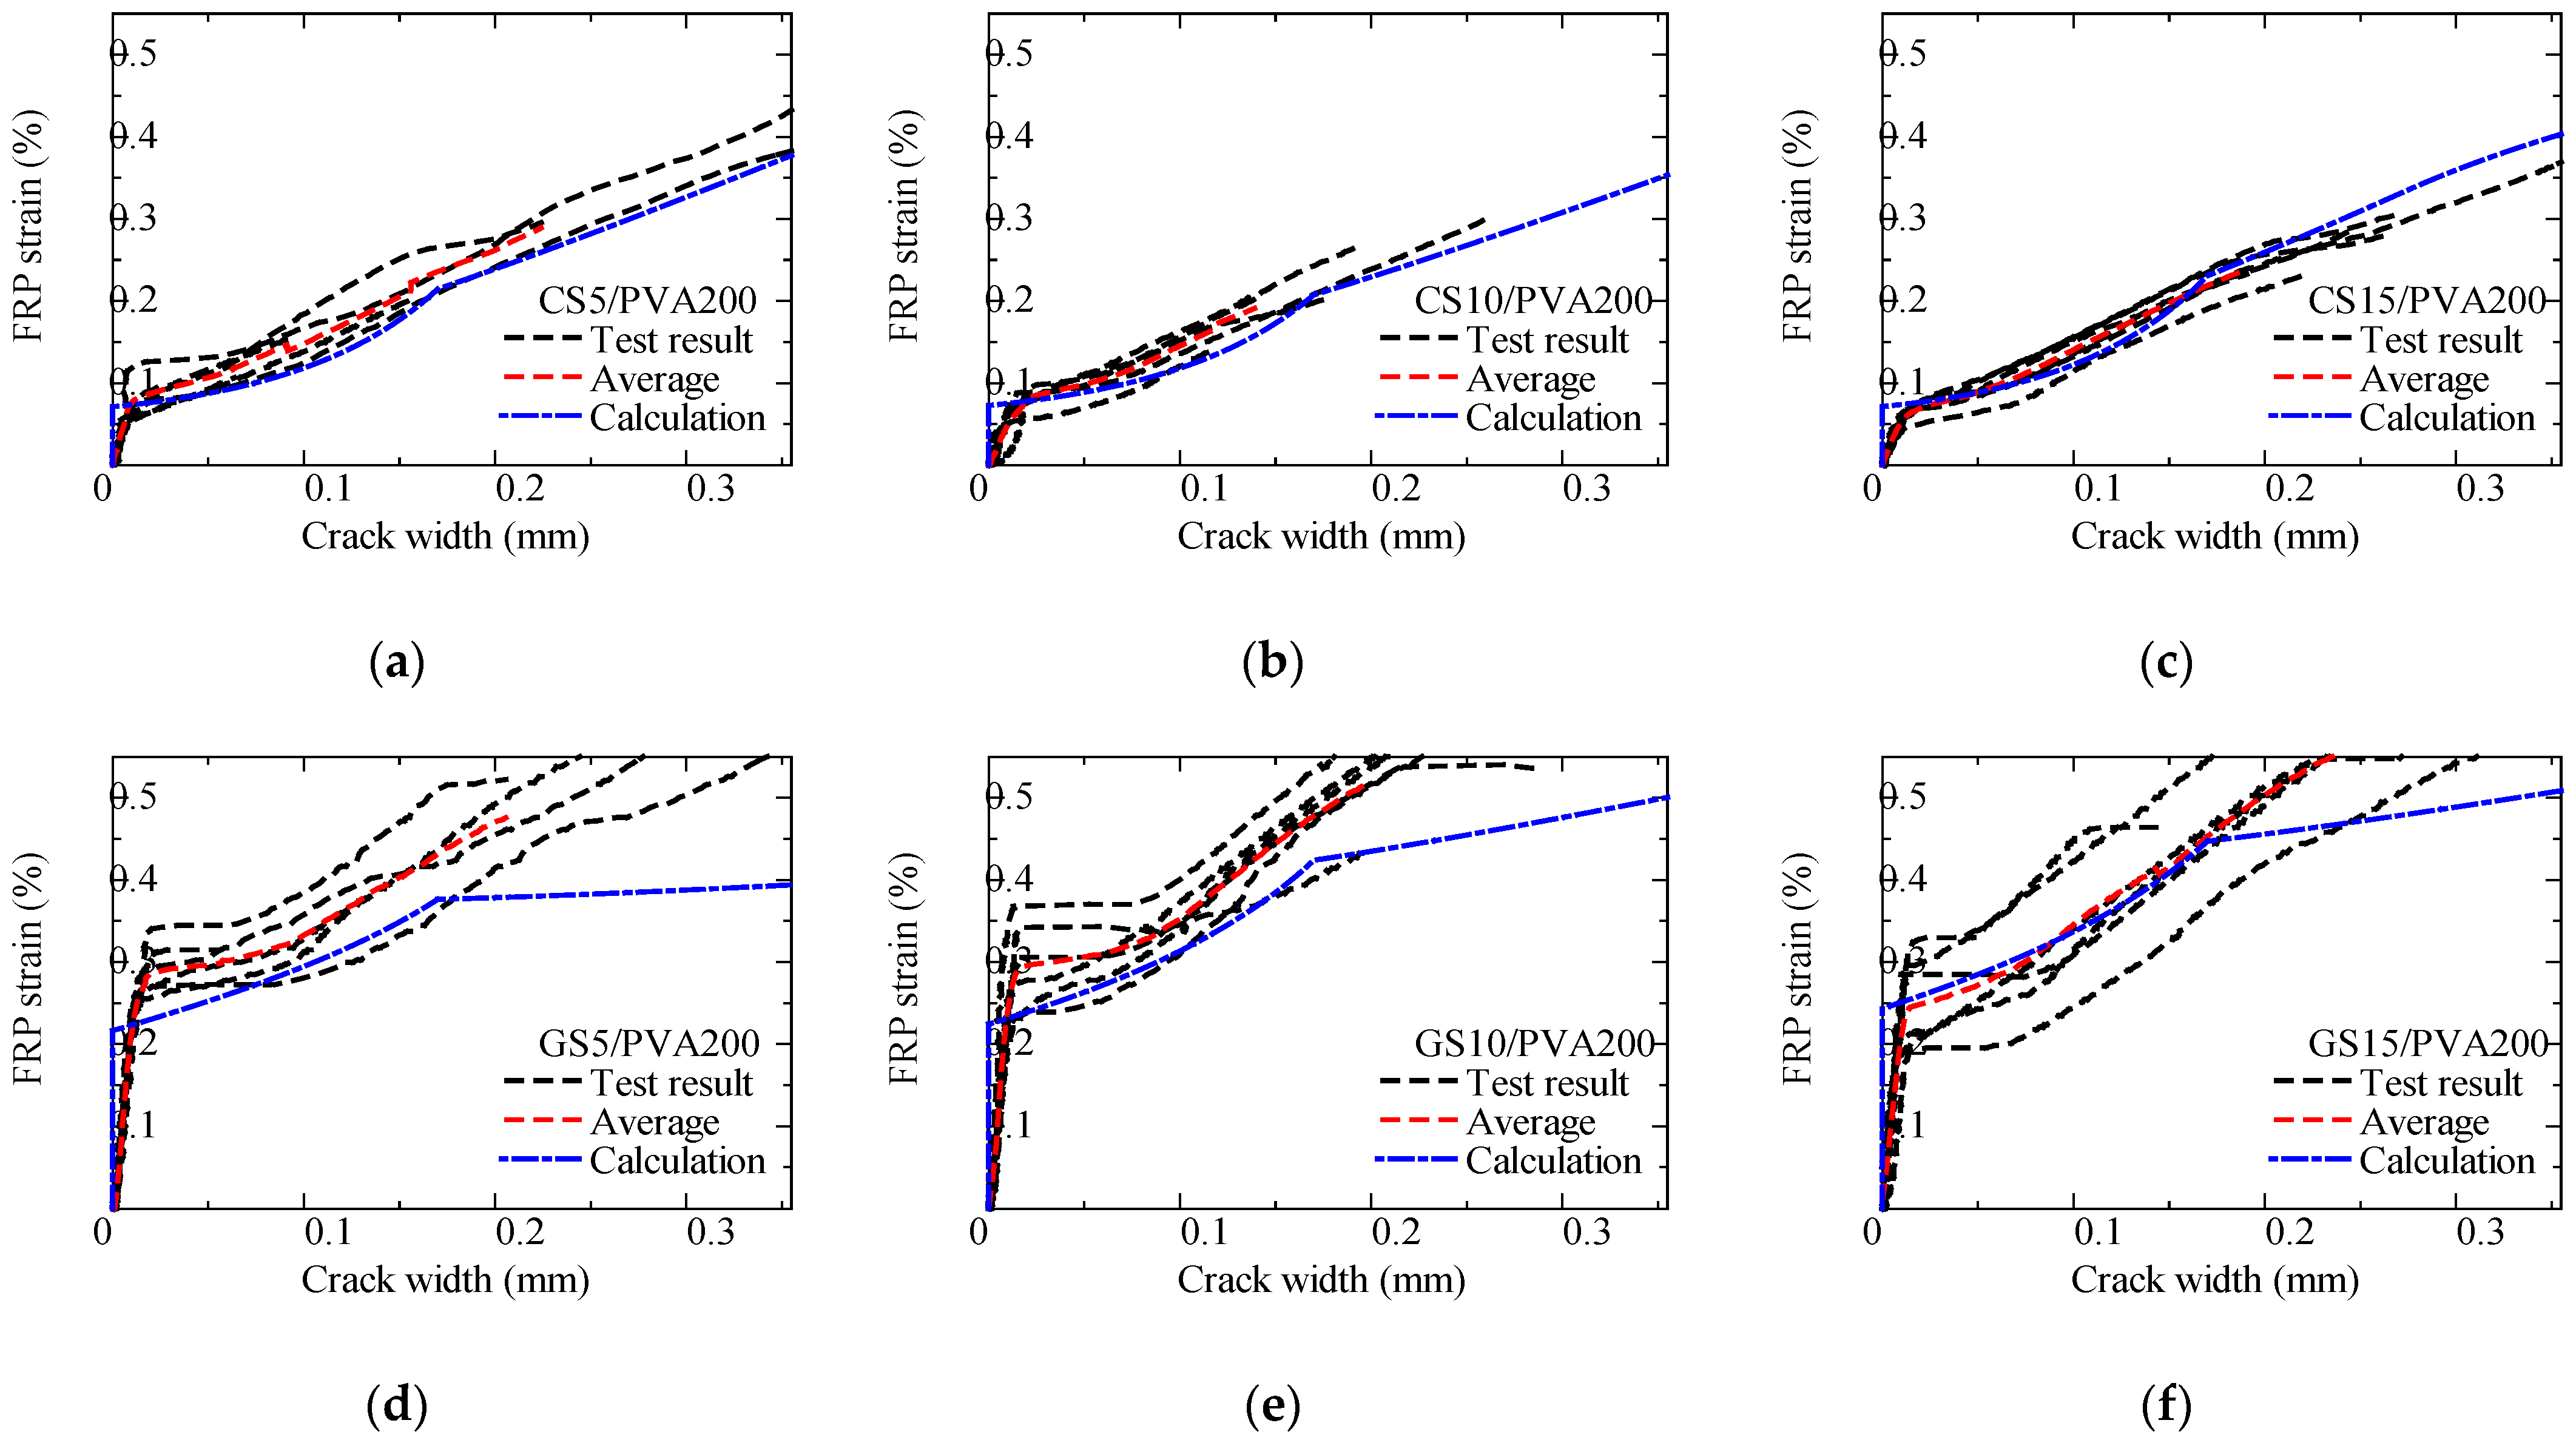
- In tension tests of spiral-type CFRP and GFRP bars with PVA-FRCC, the crack width at the same FRP strain is smaller in the GFRP specimens than in the CFRP specimens. When the FRP strain reached approximately 0.3%, the crack width was about 0.2 mm for CFRP specimens and about 0.1 mm for GFRP specimens.
- The tension test results of the FRP strain–crack width relationship were compared with results calculated using the crack width prediction formula. The test results and the calculated crack width show good compatibility.
- In four-point bending tests of a strand-type CFRP beam with aramid–FRCC, the crack width at the same FRP strain tends to become smaller as the fiber volume fraction of the FRCC increases. When the FRP strain reached approximately 0.2%, the average crack width of the mortar specimen was around 0.25 mm, whereas it was about 0.15 mm in FRCC with a 0.25% volume fraction and about 0.10 mm in 0.5%.
- The bending test results for the FRP strain–crack width relationship were compared with results calculated using the crack width prediction formula. The test results and calculated crack width also show good compatibility.
6. Further Research
Supplementary Materials
Author Contributions
Funding
Data Availability Statement
Acknowledgments
Conflicts of Interest
References
- Rokugo, K.; Kanda, T. (Eds.) Strain Hardening Cement Composites: Structural Design and Performance, RILEM State-of-the-Art Reports; Springer: Berlin/Heidelberg, Germany, 2013. [Google Scholar]
- Li, V.C. Engineered Cementitious Composites (ECC)—Bendable Concrete for Sustainable and Resilient Infrastructure; Springer: Berlin/Heidelberg, Germany, 2019. [Google Scholar]
- Balaguru, P.N.; Shah, S.P. Basic Concepts and Mechanical Properties: Tension, Fiber-Reinforced Cement Composites; McGraw Hill: New York, NY, USA, 1992; pp. 37–84. [Google Scholar]
- Bentur, A.; Mindess, S. Fiber Reinforced Cementitious Composites, 2nd ed.; Taylor & Francis: London, UK, 2007; 601p. [Google Scholar]
- Amin, A.; Foster, S.J.; Muttoni, A. Derivation of the σ- w Relationship for SFRC from Prism Bending Tests. Struct. Concr. 2015, 16, 93–105. [Google Scholar] [CrossRef]
- Yang, E.H.; Wang, S.; Yang, Y.; Li, V.C. Fiber-Bridging Constitutive Law of Engineered Cementitious Composites. J. Adv. Concr. Technol. 2008, 6, 181–193. [Google Scholar] [CrossRef]
- Kanakubo, T.; Miyaguchi, M.; Asano, K. Influence of Fiber Orientation on Bridging Performance of Polyvinyl Alcohol Fiber-Reinforced Cementitious Composite. Mater. J. Am. Concr. Inst. 2016, 113, 131–141. [Google Scholar] [CrossRef]
- Echizen, S.; Kanakubo, T. Study on pullout behavior of single steel fiber in SFRCC. In Proceedings of the 2019 World Congress on Advances in Structural Engineering and Mechanics (ASEM19), Jeju Island, Republic of Korea, 17–21 September 2019. [Google Scholar]
- Hashimoto, H.; Yu, M.; Yamada, H.; Kanakubo, T. Slip-Out Characteristics of Aramid and PP Fibers and Calculation of Bridging Law. Concr. Res. Technol. 2017, 8, 103–111. (In Japanese) [Google Scholar] [CrossRef]
- Jiang, C.; Wu, Y.F.; Dai, M.J. Degradation of steel-to-concrete bond due to corrosion. Constr. Build. Mater. 2018, 158, 1073–1080. [Google Scholar] [CrossRef]
- Lundgren, K. Effect of corrosion on the bond between steel and concrete: An overview. Mag. Concr. Res. 2007, 59, 447–461. [Google Scholar] [CrossRef]
- Auyeung, Y.; Balaguru, P.; Lan, C. Bond behavior of corroded reinforcement bars. ACI Struct. J. 2000, 97, 214–220. [Google Scholar]
- American Concrete Institute. Guide for the Design and Construction of Structural Concrete Reinforced with Fiber-Reinforced Polymer (FRP) Bars, ACI 440.1R-15; American Concrete Institute: Farmington Hills, MI, USA, 2015. [Google Scholar]
- fib (International Federation for Structural Concrete). fib Model Code 2020 for Concrete Structures; Ernst & Sohn: Berlin, Germany, 2021; Volumes 1 and 2. [Google Scholar]
- Bakar, M.B.C.; Muhammad Rashid, R.S.; Amran, M.; Saleh Jaafar, M.; Vatin, N.I.; Fediuk, R. Flexural Strength of Concrete Beam Reinforced with CFRP Bars: A Review. Materials 2022, 15, 1144. [Google Scholar] [CrossRef]
- Pecce, M.; Manfredi, G.; Cosenza, E. Experimental Response and Code Models of GFRP RC Beams in Bending. J. Compos. Constr. 2000, 4, 182. [Google Scholar] [CrossRef]
- Buyukkaragoz, A.; Kalkan, I.; Lee, J.H.A. Numerical Study of the Flexural Behavior of Concrete Beams Reinforced with AFRP Bars. Strength Mater 2013, 45, 716–729. [Google Scholar] [CrossRef]
- Zhu, J.X.; Weng, K.F.; Huang, B.T.; Xu, L.Y.; Dai, J.G. Ultra-High-Strength Engineered Cementitious Composites (UHS-ECC) panel reinforced with FRP bar/grid: Development and flexural performance. Eng. Struct. 2024, 302, 117193. [Google Scholar] [CrossRef]
- Zhou, J.; Xia, G.; Wang, P.; Zhao, J.; Xu, L.; Pan, P. Investigation of flexural cracks in engineered cementitious composites beams reinforced with CFRP bars. Constr. Build. Mater. 2024, 438, 136900. [Google Scholar] [CrossRef]
- Wang, L.H.; Shi, W.H.; Qian, L.P.; Bai, Y.L.; Liu, S.Z.; Yang, Z.Q. Flexural behaviors of GFRP-reinforced Engineered Cementitious Composite (ECC)-concrete composite beams. Constr. Build. Mater. 2024, 438, 136900. [Google Scholar] [CrossRef]
- Zhao, D.; Zhou, Y.; Xing, F.; Sui, L.; Ye, Z.; Fu, H. Bond behavior and failure mechanism of fiber-reinforced polymer bar–engineered cementitious composite interface. Eng. Struct. 2021, 243, 112520. [Google Scholar] [CrossRef]
- Hossain, K.M.A. Bond Strength of GFRP Bars Embedded in Engineered Cementitious Composite using RILEM Beam Testing. Int. J. Concr. Struct. Mater. 2018, 12, 6. [Google Scholar] [CrossRef]
- Zhou, J.; Liu, S.; Zhao, J.; Xu, L.; Wu, H.; Yu, J. Bond behavior of sand-coated CFRP rebars in SHCC under bending: Experiment and prediction. J. Build. Eng. 2023, 77, 107448. [Google Scholar] [CrossRef]
- Tolou Kian, M.J.; Ghazizadeh, S.; Cruz Noguez, C.A. An Experimental Investigation of FRCC Shear Walls Reinforced with Steel and GFRP Bars. J. Compos. Sci. 2018, 2, 55. [Google Scholar] [CrossRef]
- Sunaga, D.; Koba, T.; Kanakubo, T. Modeling of Bridging Law for Bundled Aramid Fiber-Reinforced Cementitious Composite and its Adaptability in Crack Width Evaluation. Materials 2021, 14, 179. [Google Scholar] [CrossRef]
- Takasago, S.; Kanakubo, T.; Kobayashi, H.; Sasaki, H. Bond and Cracking Characteristics of PVA-Fiber-Reinforced Cementitious Composite Reinforced with Braided AFRP Bars. Fibers 2023, 11, 107. [Google Scholar] [CrossRef]
- JIS A 1108; Method of Test for Compressive Strength of Concrete. Japanese Standards Association (JSA): Tokyo, Japan, 2018.
- JIS A 1192; Test Method for Tensile Properties of Fiber Reinforced Polymer (FRP) Bars and Grids for Reinforcement of Concrete. Japanese Standards Association (JSA): Tokyo, Japan, 2021.
- JIS A 6201; Fly Ash for Use in Concrete. Japanese Standards Association (JSA): Tokyo, Japan, 2015.
- Sunaga, D.; Namiki, K.; Kanakubo, T. Crack width evaluation of fiber-reinforced cementitious composite considering interaction between deformed steel rebar. Constr. Build. Mater. 2020, 261, 119968. [Google Scholar] [CrossRef]
- Ozu, Y.; Miyaguchi, M.; Kanakubo, T. Modeling of Bridging Law for PVA Fiber-Reinforced Cementitious Composite Con-sidering Fiber Orientation. J. Civ. Eng. Archit. 2018, 12, 651–661. [Google Scholar]
- Asayama, S.; Yasojima, A. Structural Performance of Aramid-FRCC Exterior Beam-Column Joints. Proc. Jpn. Concr. Inst. 2020, 42, 1069–1074. Available online: https://data.jci-net.or.jp/data_html/42/042-01-2179.html (accessed on 18 March 2025). (In Japanese).
- Zhang, X.; Lu, Q.; Wang, Y. Experimental Study on Bond Behavior between Steel Rebar and PVA Fiber-Reinforced Concrete. Coatings 2023, 13, 740. [Google Scholar] [CrossRef]
- Hou, L.; Sun, H.; Liu, G.; Huang, T.; Chen, D. Bond strength of deformed reinforcement embedded in steel fiber reinforced concrete: Influencing factors and prediction model. Constr. Build. Mater. 2023, 407, 133436. [Google Scholar] [CrossRef]
- Chao, S.H.; Naaman, A.E.; Parra-Montesinos, G.J. Bond Behavior of Strand Embedded in Fiber Reinforced Cementitious Composites. PCI J. 2006, 51, 56–71. [Google Scholar] [CrossRef]


| Specimen | FRCC Fiber | FRP Bar | Diameter of FRP Bar (mm) | Bond Length (mm) | Dimensions of Cross-Section | Fiber Volume Fraction (%) | Number of Specimens |
|---|---|---|---|---|---|---|---|
| CS5/PVA200 | PVA Length 12 mm Diameter 100 μm | Spiral CFRP | 11.4 | 48 | 100 mm × 100 mm | 2 | 3 |
| CS10/PVA200 | 12.1 | 3 | |||||
| CS15/PVA200 | 12.8 | 3 | |||||
| GS5/PVA200 | Spiral GFRP | 11.0 | 3 | ||||
| GS10/PVA200 | 11.4 | 3 | |||||
| GS15/PVA200 | 12.1 | 3 |
| Specimen | Test Result | |||
|---|---|---|---|---|
| Failure Mode | Max. Bond Stress (MPa) | Average (MPa) | ||
| CS5/PVA200 | CS5/PVA200-1 | Pullout A | 12.8 | 12.7 (12.6) |
| CS5/PVA200-2 | Pullout A | 12.4 | ||
| CS5/PVA200-3 | Pullout B | 12.8 | ||
| CS10/PVA200 | CS10/PVA200-1 | Pullout A | 14.6 | 13.5 (14.0) |
| CS10/PVA200-2 | Pullout B | 12.6 | ||
| CS10/PVA200-3 | Pullout A | 13.4 | ||
| CS15/PVA200 | CS15/PVA200-1 | Pullout A | 11.4 | 13.0 |
| CS15/PVA200-2 | Pullout A | 14.2 | ||
| CS15/PVA200-3 | Pullout A | 13.4 | ||
| GS5/PVA200 | GS5/PVA200-1 | Pullout A | 10.1 | 9.75 |
| GS5/PVA200-2 | Pullout A | 8.45 | ||
| GS5/PVA200-3 | Pullout A | 10.7 | ||
| GS10/PVA200 | GS10/PVA200-1 | Pullout A | 12.8 | 12.5 (12.3) |
| GS10/PVA200-2 | Pullout A | 11.8 | ||
| GS10/PVA200-3 | Pullout B | 12.9 | ||
| GS15/PVA200 | GS15/PVA200-1 | Pullout A | 13.6 | 13.0 |
| GS15/PVA200-2 | Pullout A | 12.2 | ||
| GS15/PVA200-3 | Pullout A | 13.3 | ||
| Specimen | (MPa) | (mm) | (N/mm3) | (N/mm3) | (MPa) | (mm) | (mm) | (mm) | (N/mm3) |
|---|---|---|---|---|---|---|---|---|---|
| CS5/PVA200 | 11.4 | 0.174 | 65.2 | 1.34 | 12.6 | 1.10 | 8.79 | 12.4 | −1.12 |
| CS10/PVA200 | 10.9 | 0.193 | 56.2 | 1.10 | 14.0 | 3.03 | 9.56 | 12.7 | −1.45 |
| CS15/PVA200 | 9.13 | 0.136 | 67.2 | 1.04 | 13.0 | 3.84 | 11.2 | 17.0 | −0.998 |
| GS5/PVA200 | 8.74 | 0.300 | 29.3 | 0.926 | 9.75 | 1.35 | 10.0 | 13.0 | −0.893 |
| GS10/PVA200 | 10.9 | 0.218 | 50.1 | 2.64 | 12.3 | 0.751 | 9.90 | 14.2 | −0.916 |
| GS15/PVA200 | 11.7 | 0.266 | 44.0 | 3.08 | 13.0 | 0.698 | 11.4 | 14.3 | −0.960 |
| ID | FRP Bar | Diameter (mm) | Cross-Section (mm2) | Tensile Strength (MPa) | Elastic Modulus (GPa) |
|---|---|---|---|---|---|
| CSt7 | Strand CFRP | 15.9 | 125.0 | 1770 | 150 |
| Length (mm) | Diameter (µm) | Tensile Strength (MPa) | Elastic Modulus (GPa) | Density (g/cm3) |
|---|---|---|---|---|
| 12 | 12 | 3432 | 73 | 1.39 |
| Specimen | Unit Weight (kg/m3) | Compressive Strength [SD] (MPa) | Elastic Modulus [SD] (GPa) | ||||
|---|---|---|---|---|---|---|---|
| W | C | S | FA | AR | |||
| CSt7/MT | 380 | 678 | 484 | 291 | 0 | 47.6 [1.9] | 18.3 [0.7] |
| CSt7/AR025 | 3.475 | 39.6 [1.4] | 15.9 [0.6] | ||||
| CSt7/AR050 | 6.95 | 39.0 [1.2] | 16.3 [1.5] | ||||
| Specimen | FRCC Fiber | FRP Bar | Diameter of FRP Bar (mm) | Bond Length (mm) | Dimensions of Cross-Section | Fiber Volume Fraction (%) | Number of Specimens |
|---|---|---|---|---|---|---|---|
| CSt7/MT | Aramid Length 12 mm Diameter 12 μm | Strand CFRP | 15.9 | 64 | 60 mm × 100 mm | 0 | 3 |
| CSt7/AR025 | 0.25 | 3 | |||||
| CSt7/AR050 | 0.5 | 3 |
| Specimen | Test result | |||
|---|---|---|---|---|
| Failure Mode | Max. Bond Stress (MPa) | Average (MPa) | ||
| CSt7/MT | CSt7/MT-1 | Splitting | 5.20 | 5.37 |
| CSt7/MT-2 | Splitting | 5.42 | ||
| CSt7/MT-3 | Splitting | 5.49 | ||
| CSt7/AR025 | CSt7/AR025-1 | Pullout | 8.80 | 9.07 |
| CSt7/AR025-2 | Pullout | 9.27 | ||
| CSt7/AR025-3 | Pullout | 9.13 | ||
| CSt7/AR050 | CSt7/AR050-1 | Pullout | 10.4 | 10.8 |
| CSt7/AR050-2 | Pullout | 11.5 | ||
| CSt7/AR050-3 | Pullout | 10.7 | ||
| Specimen | (MPa) | (mm) | (N/mm3) | (N/mm3) | (MPa) | (mm) | (mm) | (mm) | (N/mm3) |
|---|---|---|---|---|---|---|---|---|---|
| CSt7/MT | 3.94 | 0.0264 | 149 | 17.3 | 5.37 | 0.109 | - | 2.2 | −5.42 |
| CSt7/AR025 | 6.69 | 0.0515 | 130 | 17.6 | 9.07 | 0.187 | 2.24 | 2.63 | −3.71 |
| CSt7/AR050 | 8.03 | 0.0597 | 135 | 18.8 | 10.8 | 0.209 | 2.20 | 3.02 | −3.85 |
| Specimen | FRCC Fiber | FRP Bar | Diameter of FRP Bar (mm) | Dimensions of Cross-Section | Fiber Volume Fraction (%) | Number of Specimens |
|---|---|---|---|---|---|---|
| CS5/PVA200 | PVA Length 12 mm Diameter 100 μm | Spiral CFRP | 11.4 | 100mm × 100mm | 2 | 2 |
| CS10/PVA200 | 12.1 | 2 | ||||
| CS15/PVA200 | 12.8 | 2 | ||||
| GS5/PVA200 | Spiral GFRP | 11.0 | 2 | |||
| GS10/PVA200 | 11.4 | 2 | ||||
| GS15/PVA200 | 12.1 | 2 |
| Specimen | (mm) | (GPa) | (mm2) | (MPa) | (GPa) | (mm2) | Bridging Law |
|---|---|---|---|---|---|---|---|
| CS5/PVA200 | 35.9 | 127 | 102 | 1.72 | 17.3 | 100×100 | |
| CS10/PVA200 | 37.9 | 111 | 114 | ||||
| CS15/PVA200 | 40.3 | 100 | 129 | ||||
| GS5/PVA200 | 34.4 | 43.2 | 94 | ||||
| GS10/PVA200 | 35.9 | 38.0 | 103 | ||||
| GS15/PVA200 | 37.9 | 31.6 | 114 |
| ID | FRP Bar | Diameter (mm) | Cross-Section (mm2) | Tensile Strength (MPa) | Elastic Modulus (GPa) |
|---|---|---|---|---|---|
| CStU (Compression side) | Strand CFRP | 7.2 | 32.7 | 1770 | 160 |
| CSt7 (Tension side) | 15.9 | 125.0 | 1770 | 150 |
| Specimen | Compressive Strength [SD] (MPa) | Elastic Modulus [SD] (GPa) |
|---|---|---|
| CSt7/MT | 51.6 [2.3] | 18.1 [1.8] |
| CSt7/AR025 | 45.5 [1.9] | 17.2 [1.1] |
| CSt7/AR050 | 39.2 [0.7] | 13.7 [1.8] |
| CSt7/AR050-C | 42.8 [1.1] | 15.5 [0.9] |
| Specimen | FRCC Fiber | FRP Bar | Diameter of FRP Bar (mm) | Fiber Volume Fraction (%) | Loading | Number of Specimens |
|---|---|---|---|---|---|---|
| CSt7/MT | Aramid Length 12 mm Diameter 12 μm | Strand CFRP | 15.9 (tens.) 7.2 (comp.) | 0 | Mono. | 1 |
| CSt7/AR025 | 0.25 | Mono. | 1 | |||
| CSt7/AR050 | 0.5 | Mono. | 1 | |||
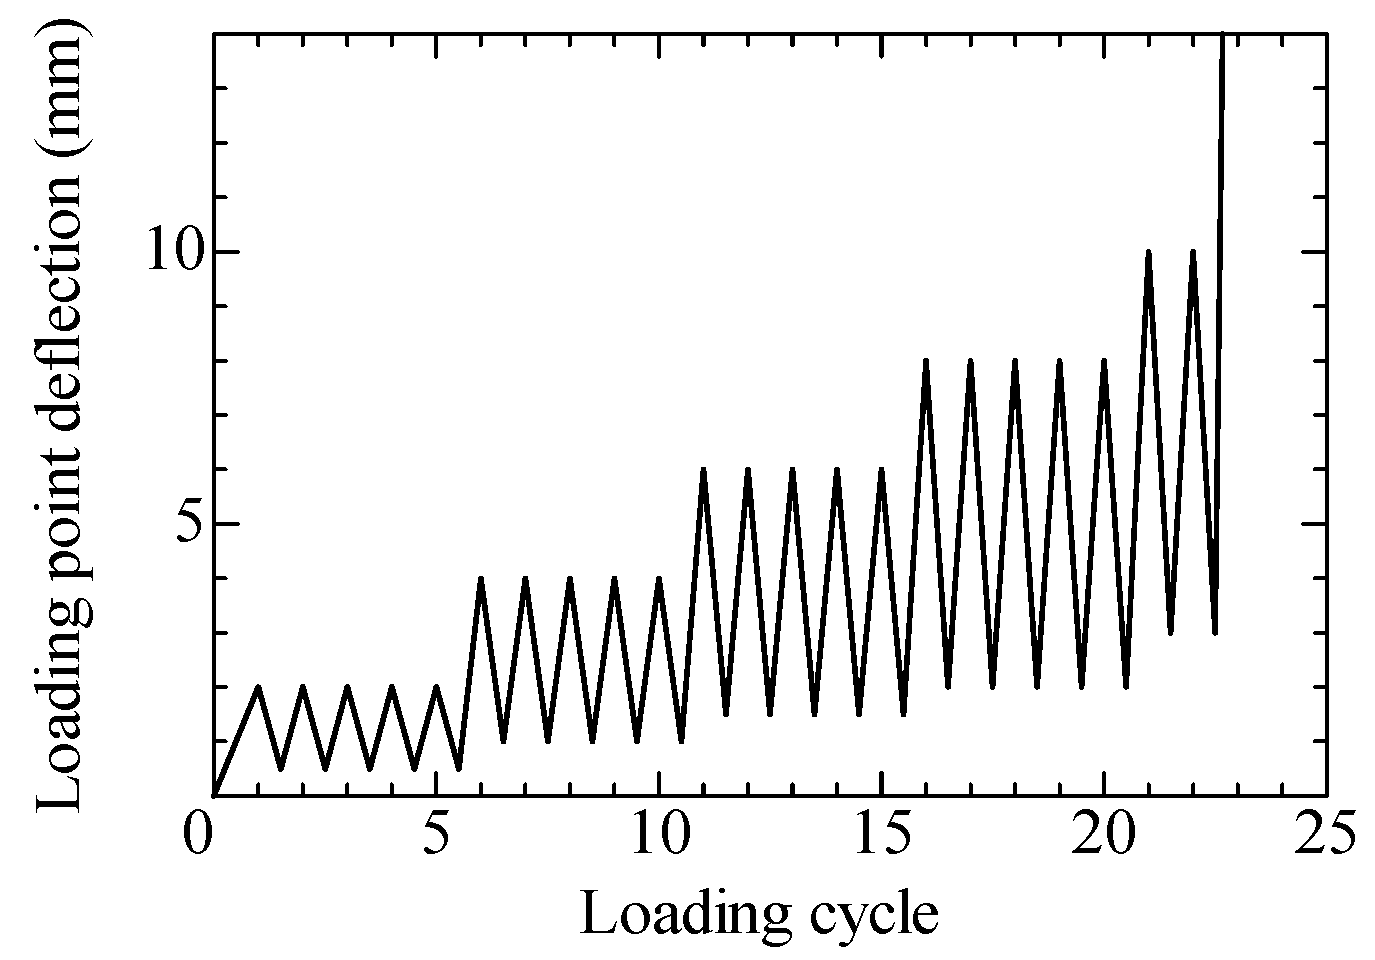
| CSt7/AR050-C | Cyclic | 1 |
| Specimen | (mm) | (GPa) | (mm2) | (MPa) | (GPa) | (mm2) | Bridging Law |
|---|---|---|---|---|---|---|---|
| CSt7/MT | 50.0 | 150 | 125.0 | 1.78 | 18.1 | 60×100 | (AR025) (AR050) |
| CSt7/AR025 | 4.44 | 17.2 | |||||
| GSt7/AR050 | 5.42 | 13.7 | |||||
| GSt7/AR050-C | 5.30 | 15.5 |
Disclaimer/Publisher’s Note: The statements, opinions and data contained in all publications are solely those of the individual author(s) and contributor(s) and not of MDPI and/or the editor(s). MDPI and/or the editor(s) disclaim responsibility for any injury to people or property resulting from any ideas, methods, instructions or products referred to in the content. |
© 2025 by the authors. Licensee MDPI, Basel, Switzerland. This article is an open access article distributed under the terms and conditions of the Creative Commons Attribution (CC BY) license (https://creativecommons.org/licenses/by/4.0/).
Share and Cite
Sasaki, H.; Shiferaw, H.N.; Kanakubo, T. Verification of Crack Width Evaluation in Fiber-Reinforced Cementitious Composite Reinforced with Various Types of Fiber-Reinforced Polymer Bars. Fibers 2025, 13, 60. https://doi.org/10.3390/fib13050060
Sasaki H, Shiferaw HN, Kanakubo T. Verification of Crack Width Evaluation in Fiber-Reinforced Cementitious Composite Reinforced with Various Types of Fiber-Reinforced Polymer Bars. Fibers. 2025; 13(5):60. https://doi.org/10.3390/fib13050060
Chicago/Turabian StyleSasaki, Hideto, Helen Negash Shiferaw, and Toshiyuki Kanakubo. 2025. "Verification of Crack Width Evaluation in Fiber-Reinforced Cementitious Composite Reinforced with Various Types of Fiber-Reinforced Polymer Bars" Fibers 13, no. 5: 60. https://doi.org/10.3390/fib13050060
APA StyleSasaki, H., Shiferaw, H. N., & Kanakubo, T. (2025). Verification of Crack Width Evaluation in Fiber-Reinforced Cementitious Composite Reinforced with Various Types of Fiber-Reinforced Polymer Bars. Fibers, 13(5), 60. https://doi.org/10.3390/fib13050060