Highlights
What are the main findings?
- Silica microfibers obtained by the Cofiblas technique were reacted with lithium to produce lithium orthosilicate membranes.
- The method involving immersion of silica microfibers in an aqueous lithium solution followed by calcination was demonstrated to be effective.
What is the implication of the main finding?
- Their unique shape leads to the formation of 3D porous membranes, enabling their direct use as filters without the need for pelletizing.
- These membranes exhibited superior performance, as they adsorbed 31 wt.% of CO2 and demonstrated complete regeneration capacity.
Abstract
Lithium orthosilicate (Li4SiO4) has demonstrated a high CO2 adsorption rate and capacity and its suitability to be implemented in industry as CO2 capture technology at high temperatures. The optimum solid adsorbent should present a porous structure to maximize surface and enable a high sorption rate. In this work, we present an original approach based on the use of a novel architecture of precursors in the form of very thin free-standing solid silica fibers. An original technique called continuous fiberizing by laser melting (Cobiflas) was used to obtain membranes of pure silica fibers with diameters in the micrometer range, forming a porous membrane which offer a high surface and porous connectivity to be used as precursors without any supporting substrate. Then, we employed a method based on the impregnation of the silica fibers within a lithium-containing aqueous solution and subsequent calcination to obtain a porous solid adsorbent with the maximum proportion of lithium orthosilicate. This method is compared with the results obtained using a sol-gel powder method by analyzing their composition using X-Ray Diffraction (XRD), and their adsorption capacity and adsorption kinetics by Thermogravimetric analyses (TGA). As a result, an outstanding type of solid adsorbent is reported with a 31% adsorption capacity and a total regeneration capacity, which is over 0.8 efficiency with regard to the theoretical maximum adsorption of this material.
1. Introduction
Global warming is one of the biggest threats for humankind in the long-term. The increment of the CO2 concentration on the atmosphere as a consequence of human activities in the last decades is today a fact: from the year 1750 to 2000, it changed from 280 to 368 ppm and to 388 ppm in 2010 [1]. A demonstration of the goodwill of the 196 countries taking part on the United Nations Framework Convention on Climate Change, who signed the Paris Climate Agreement in December 2015, is where they agreed to limit the rise in the average temperature to levels before industrial revolution: under 2 °C at 2100. According to the Net Zero Roadmap published by the International Energy Agency in November 2024, if all announced carbon capture projects are built, around 400 Mt CO2 could be captured every year globally by 2030. However, they would to provide around 40% of the annual CO2 capture of 1 Gt/year needed by 2030 in the Net Zero Emissions Scenario [2]. It is therefore obvious that further efforts are still needed to develop new technologies and implement them. The availability of CCS (Carbon Capture and Storage) is particularly important in industrial processes, primarily in the production of iron and steel, chemicals and cement. CCS technologies consist of the separation and capture of the CO2, as it is stored in geological deposits underground or used for one of its many practical purposes. These technologies should also play an important role in delivering future “negative emissions” which, according to the Intergovernmental Panel on Climate Change (IPCC), have become increasingly important under more ambitious mitigation scenarios [3]. A combination of different removal technologies should be deployed to reach this objective.
Most of the efforts of the scientific community are focused on the development of a material that separates CO2 from emission fumes and, subsequently being able to release it in a controlled environment for storage or utilization. Large scale existing CO2 capture systems mostly rely on its absorption into an aqueous solution of amine [4]. However, the heat duty for CO2 stripping from the sorbents can require around 20 to 30% of generated energy in power plants [5], resulting in the largest increase in costs for implementation in this kind of installation and is a critical barrier in other industries. Several solid materials have been proposed as alternative adsorbers such as zeolites [6,7], porous carbon [8], limestone nanoparticles [8,9], amine sorbents supported on mesoporous silica [8,10], metal-organic frameworks (MOFs) [8,11] and porous organic polymers [12]. Alkaline ceramics comprise the most promising group of solid sorbents, and specifically, the lithium zirconates [13,14], aluminates [14] and silicate ceramics [14]. The literature reviews highlight the advantages of lithium silicates for high temperature flues, allowing their direct utilization for exhaust fumes with reduced previous treatment [14,15,16]. Particularly, lithium orthosilicate (Li4SiO4) presents a high CO2 capture capacity, lower regeneration temperatures (<750 °C) when compared to CaO, and it has a lower cost of raw materials when compared to alkali zirconates [8]. It has excellent stability that allows its use throughout a significant number of cycles without losing its sorption capacity. This material is able to react with CO2 at temperatures lower than 720 °C following this reaction [13]:
At temperatures higher than 720 °C, the Gibbs free energy of reaction (1) becomes positive [17,18], and consequently, the reverse reaction occurs and the material releases the CO2 and recovers its original state, so it can be used again for CO2 capture. Its theoretical maximum adsorption capacity is 1 mol of CO2 for every mole of Li4SiO4 (over 8.2 mmol g−1 or more than 36% in weight) [18] and it demonstrated an adsorption rate of over 50 mg g−1 min−1 at 500 °C with a feed gas containing 20% CO2, which is superior to other materials [19,20]. This theoretical performance is hard to reach in practice due to limited diffusivity, but several factors can influence real performance. Indeed, enhancement of the practical adsorption capacity and widening of the temperature range of adsorption is possible by doping the lithium orthosilicate with K and Al, which facilitates electrons transferring from the Li4SiO4 surface to CO2 [21]. Indeed, the most important factor affecting the sorption rate is likely to be the particle size of the sorbent, since this directly affects the surface area exposed to the gas and to the diffusion through the whole volume of the adsorber. Several studies demonstrated that a reduction in the particle size in the range of tens of micrometers has a significant influence on the sorption rate [11,14]. Some investigations on the use of particles [22], nanowires [23] and nanorods [24] succeeded on synthesizing Li4SiO4 with an adsorption capacity of over 30 wt.%. For practical use, these kinds of materials should be embedded in pellets so they can act as filters in real adsorption reactors [25]. This process requires the use of some additives or supporting materials [13,25,26] that might decrease the adsorption capacity of the particles and create another step for the production of these filters. A porous structure, preferably microporous, is desired to increase the surface area of the adsorber to maximize the adsorption capacity and rate. With this aim, a different approach based on synthesizing porous structures using MOFs has also been reported to avoid this last step. Despite exhibiting optimum porosity and variable surface chemistry, MOFs exhibit reduced CO2 uptake in either low CO2 concentrations or the presence of moisture [11]. Another original route employed rice husk, an agricultural waste, as a pore former to improve the structures of lithium orthosilicate pellets to enhance the CO2 sorption performance. The CO2 sorption capacity of lithium orthosilicate pellets was found to be enhanced by using these templates [27]. In any case, the solid-state reaction process is one the main routes to synthesize Li4SiO4 thanks to its high yield, low cost and simplicity, which can also ensure the optimum Li/Si molar ratio between 4 and 5 [14,15,28]. With this method, the minimum particle size is obtained in the range of 30 to 40 μm, limiting the sorption rate according to the double-shell model theory [14]. Another factor in this process that significantly affects the sorption performance is the lithium source. The use of lithium hydroxide as lithium precursor allows lower temperature synthesis to be employed and yields a higher specific surface area of the lithium silicate particles, leading to better sorption performance [14].
Here, we present an original approach for the development of highly porous solid sorbents of lithium orthosilicate using a novel architecture as the precursor material. We employ a pure silica precursor in the form of a free-standing solid membrane composed of microfibers. Their fibrous structure creates a 3D open architecture with interconnected void volumes. This architecture features a network of high-surface-area elements in the form of ultra-thin fibers, proposed as an optimal morphology for the complete solid-state synthesis of lithium orthosilicate. We demonstrate a solid-state method to react the silica microfibers with a lithium hydroxide precursor to obtain the maximum proportion of lithium orthosilicate in the microfibers, while maintaining a porous structure. Subsequently, we analyze the adsorption and desorption of CO2 for the different samples comparing them with lithium orthosilicate powders. Therefore, the aim of our work is to investigate a novel route based on the use of silica microfibers for the production and use of highly porous lithium orthosilicate sorbents for CO2 capture.
2. Materials and Methods
2.1. Precursor Materials
Precursor silica microfibers were produced by continuous fiberizing laser melting and supersonic dragging [29]. Specifically, the Cofiblas technique utilizes a high-power CO2 laser (10.6 µm wavelength) to heat a cylindrical silica preform (Figure 1 and Figure S1 from the Supplementary Material). A specifically designed optical system divides the main laser beam into two equal beams, which, together with a set of spherical and cylindrical lenses, provide the optimum laser irradiance on the filament [30]. A feeding system controls the supply of the precursor material by means of a stepper motor. In the present case, the precursor material employed in the Cofiblas method was the core of optical fibers (Optran PUV, from CeramOptec, Riga, Latvia) made of pure synthetic silica with a diameter of 600 µm. Finally, a de Laval nozzle was designed to provide a uniform supersonic air jet flowing coaxially with the filament, which stretches the precursor material to form the microfibers. In the present work, the silica microfibers were produced using a laser power of 390 W with a feeding speed of 1 mm/s for the 600 µm precursor fiber. The two laser beams reached the preform irradiating a circular area with approximately 12 mm diameter, giving an average irradiance of 3.4 × 10² W cm−2 and a peak irradiance of 4.6 × 10² W cm−2. We employed lithium hydroxide monohydrate (LiOH·H2O, >98%, ACS) made of rectangular prisms with a higher and more varied distribution of sizes of (350 ± 198) µm for the lithium precursor.
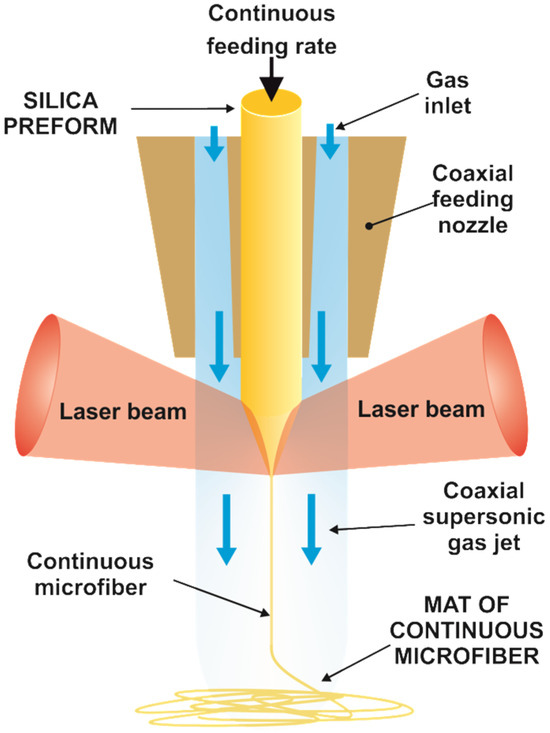
Figure 1.
Illustration of the process of continuous fiberizing by laser melting and supersonic dragging. The scheme shows the cylindrical silica preform which is fed at a constant rate into the coaxial nozzle. The two laser beams melt the preform while it is stretched by the supersonic gas jet, forming a mat of continuous microfiber.
2.2. Materials Synthesis Methods
One of the most important challenges of this research was to reach a proper mix of fibers and lithium-precursor powder, so the powder is homogeneously distributed over the fibers with a suitable proportion and, obviously, the structure of the fibers must remain unaffected. This last requirement seems trivial, but the most commonly employed methods, such as mechanical mixing [28], did not keep the integrity of the fibers and led to a heterogeneous mix since the powder is distributed unequally over their surface. Therefore, in the present study, we investigated a different method to mix the lithium compound and the fibers based on the impregnation of the silica fibers within a lithium-containing aqueous solution. Then, in order to incorporate lithium into the fibers preserving their integrity, the fibers were completely immersed in the lithium solution and gently stirred to prevent breakage and ensure complete impregnation. Two different solutions with different concentrations of LiOH·H2O were prepared: one with a concentration of 6.6 wt.% and one with a saturated solution of 11 wt.%. The concentration of the solution was varied in order to find the conditions to obtain the optimum Li/Si molar ratio between 4 and 5, according to previous works [14,15,28]. The fibers were then extracted and dried at 40 °C for several hours. After the mixing stage, samples were calcined at 900 °C for 20 min in 100% N2 flow, to promote the chemical reaction between elements which leads to the formation of lithium silicates.
As a means of comparison for the fibers CO2 sorption performance, we synthesized Li4SiO4 powder via a sol-gel method [26]. Stoichiometric quantities of Li2CO3 (≥99%, Panreac Química, Castellar del Vallès, Spain) and SiO2 (≥95%, MilliporeSigma, Burlington, MA, USA) were dissolved in 500 mL deionized water, followed by the addition of 153 mL hydrogen peroxide (H2O2, 30% wt. in H2O, Sigma Aldrich) which acted as the complexation agent. Subsequently, 5.3 mL of ammonium hydroxide (NH4OH, 25% v/v in H2O, Sigma Aldrich) was introduced to peptise the solution into a stable sol and it was heated at 90 °C overnight. The produced gel dried at 110 °C for several hours before being calcined at 900 °C for 4 h. The resulting light blue powder was subjected to all characterisation experiments after being ground and sieved to particles of <38 μm. Table 1 summarizes the characteristics of the samples.

Table 1.
Summary of the methods for the production of the samples of Li4SiO4 fibers and powder.
2.3. Materials Characterization
The preliminary evaluation of the mixing methods within the scope to obtain samples with the maximum lithium orthosilicate content was carried out through X-Ray Diffraction (XRD) analysis. The XRD profiles of the samples were collected at room temperature by a Panalytical X’Pert PRO Diffractometer operated at generation tension and generator current 40 kV and 40 mA, respectively, and using CuKα1 radiation (λ = 1.5406 Å). Qualitative and quantitative analyses of the XRD profiles were performed using the Panalytical X’pert Highscore Plus software [31]. The crystalline phases of the samples were identified through the search–match feature of the software which compares the sample’s profile against the reference patterns within the JCPDS crystallographic database. A matching score for the identified phases in the measured profile of the sample, was also obtained. These scores are based on the peak positions and peak intensities matching between the peaks of the measured profile and those of the reference patterns. The values are within the range of 0–100 and higher scores indicate a better match. Quantitative analysis of the samples was produced by using the Rietveld refinement module of the X’pert Highscore Plus software. Rietveld refinement [32] is a useful and fast method for quantitative analysis for the determination of the weight percent of components in a composite or mixture once its phases are identified and a model of the structure already exists. By this method, the full experimental pattern is fitted with a multiphase pattern which is calculated by the identified phases. The difference between the two patterns is minimized by the variation in many parameters (refinement procedure) and the weight percentage of each crystalline phase existing on the tested sample, can be estimated. This phase analysis can be considered semiquantitative since we are not using internal standards with known compositions as a reference and as such, errors relating to the minor amorphous phase or the undetected crystalline phase can arise [33]. Surface area and pore size analysis were performed by determination of the nitrogen adsorption isotherm using a surface area analyzer Anton Paar-Nova 600 BET (Graz, Austria). The Brunauer–Emmett–Teller (BET) method was employed to estimate the surface area from the adsorption isotherm.
The CO2 adsorption capacity was evaluated by Thermogravimetric analyses (TG-DSC Detsys evolution 16/18, Setaram and TA Q5000 V3.17 Build 265, TA Instruments, New Castle, DE, USA). First, we carried out an isothermal TGA at 700 °C for 30 min with a 100% CO2 flow (25 mL/min) of the three samples to analyze their adsorption capacity as well as kinetics of the reaction. The selection of this temperature to perform the isothermal TGA is based on the outcomes of previous studies which demonstrated that the maximum adsorption capacity is obtained at a temperature close to 700 °C [13,14]. A set of new samples were further analyzed by a double adsorption–desorption cycle in order to investigate their cyclic behavior. The adsorption step was performed at 700 °C with a 100% CO2 flow (25 mL/min) for 60 min, while for desorption, the samples were maintained for 30 min at 850 °C with a 100% N2 flow (25 mL/min). The heating step from 700 to 850 °C was performed in CO2 flow while the cooling step from 850 to 700 °C in was in N2 flow. All thermogravimetric experiments included two preliminary steps in N2 flow with heating from 30 to 800 °C or 900 °C (depending on the calcination temperature of each sample) and, subsequently, cooling from this temperature to the initial temperature for the CO2 capturing experiment, i.e., 700 °C. This preliminary treatment was essential to remove any remaining humidity and existing carbonates since lithium orthosilicate can absorb CO2 with prolonged exposure in ambient air even at room temperature [34].
After the cyclic exposure in CO2, the samples were evaluated again through XRD, following the same procedure described above. In addition, the morphology of the microfibers was studied before and after the adsorption–desorption cycles by an optical microscopy (Nikon, SZM-10, Shinagawa, Tokyo, Japan) and a scanning electron microscopy (FESEM JEOL JSM6700F, Tokyo, Japan). The diameters of the as-produced silica fibers were estimated by measuring around 30 fibers in the SEM, the arithmetic mean and standard deviation was calculated and given as the representative value.
3. Results and Discussion
3.1. Lithium Orthosilicate Fiber Synthesis
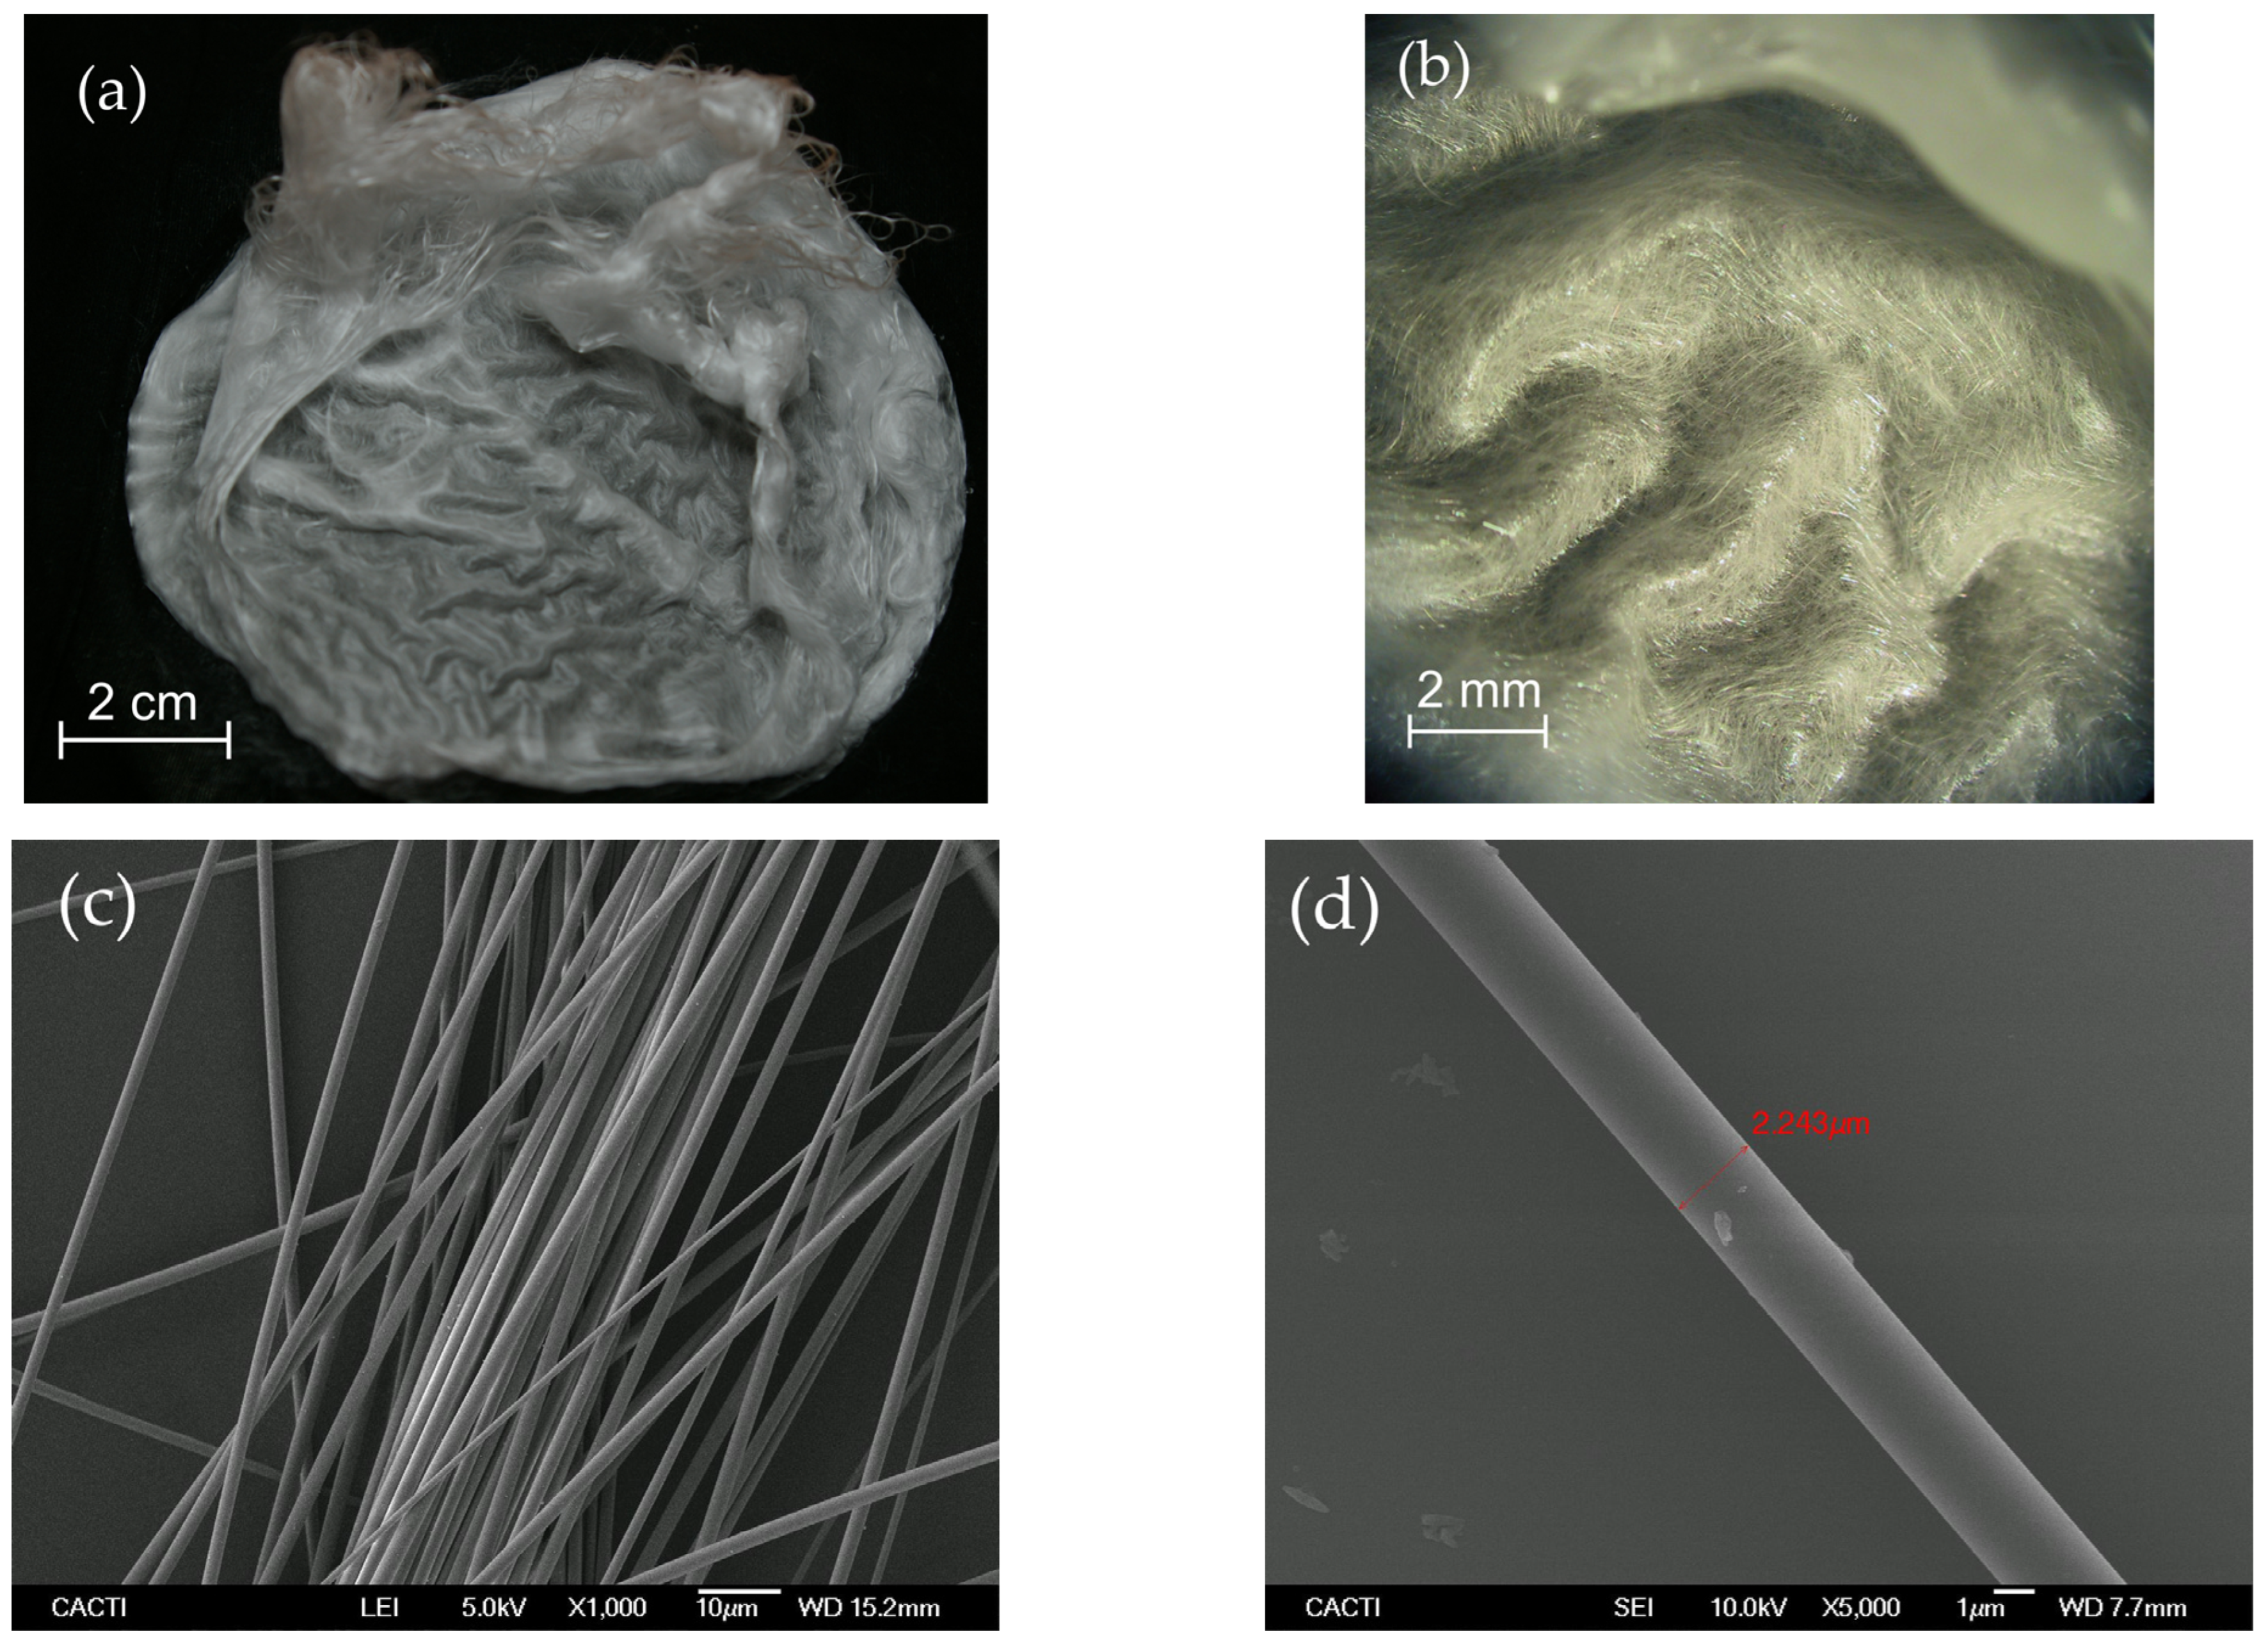
First, solid porous membranes of continuous silica microfibers were produced by Cofiblas. The morphology of the fibers forming these mats was analyzed by SEM showing a regular cylindrical shape and uniform diameters of (2.0 ± 0.6) µm. These continuous fibers form a dense and porous membrane as can be seen in Figure 2. Its fibrous structure forms a 3D open architecture with an interconnected void volume crossed and intertwined by very thin fibers, giving an optimum consistency to be used as filters without the need for any substrate. At the same time, they combine an interconnected macroporous net with a high surface morphology in the form of very thin fibers. The fibers forming these membranes are solid and non-porous, with diameters of around 2 μm, as can be observed in Figure 2d. These membranes of pure silica microfibers were used as precursor materials for the synthesis of the lithium silicate filters.
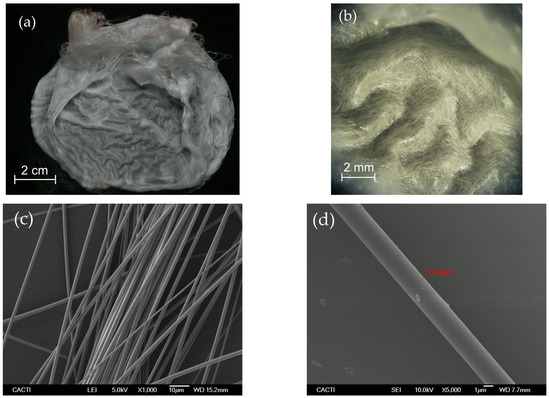
Figure 2.
(a) Image of the porous membranes of the silica microfibers produced by Cofiblas taken by a digital camera; (b) Micrograph obtained using the optical microscope showing the open 3D architecture formed by the fibrous structure; (c,d) SEM micrographs showing the uniform cylindrical shape of the microfibers with a non-porous surface.
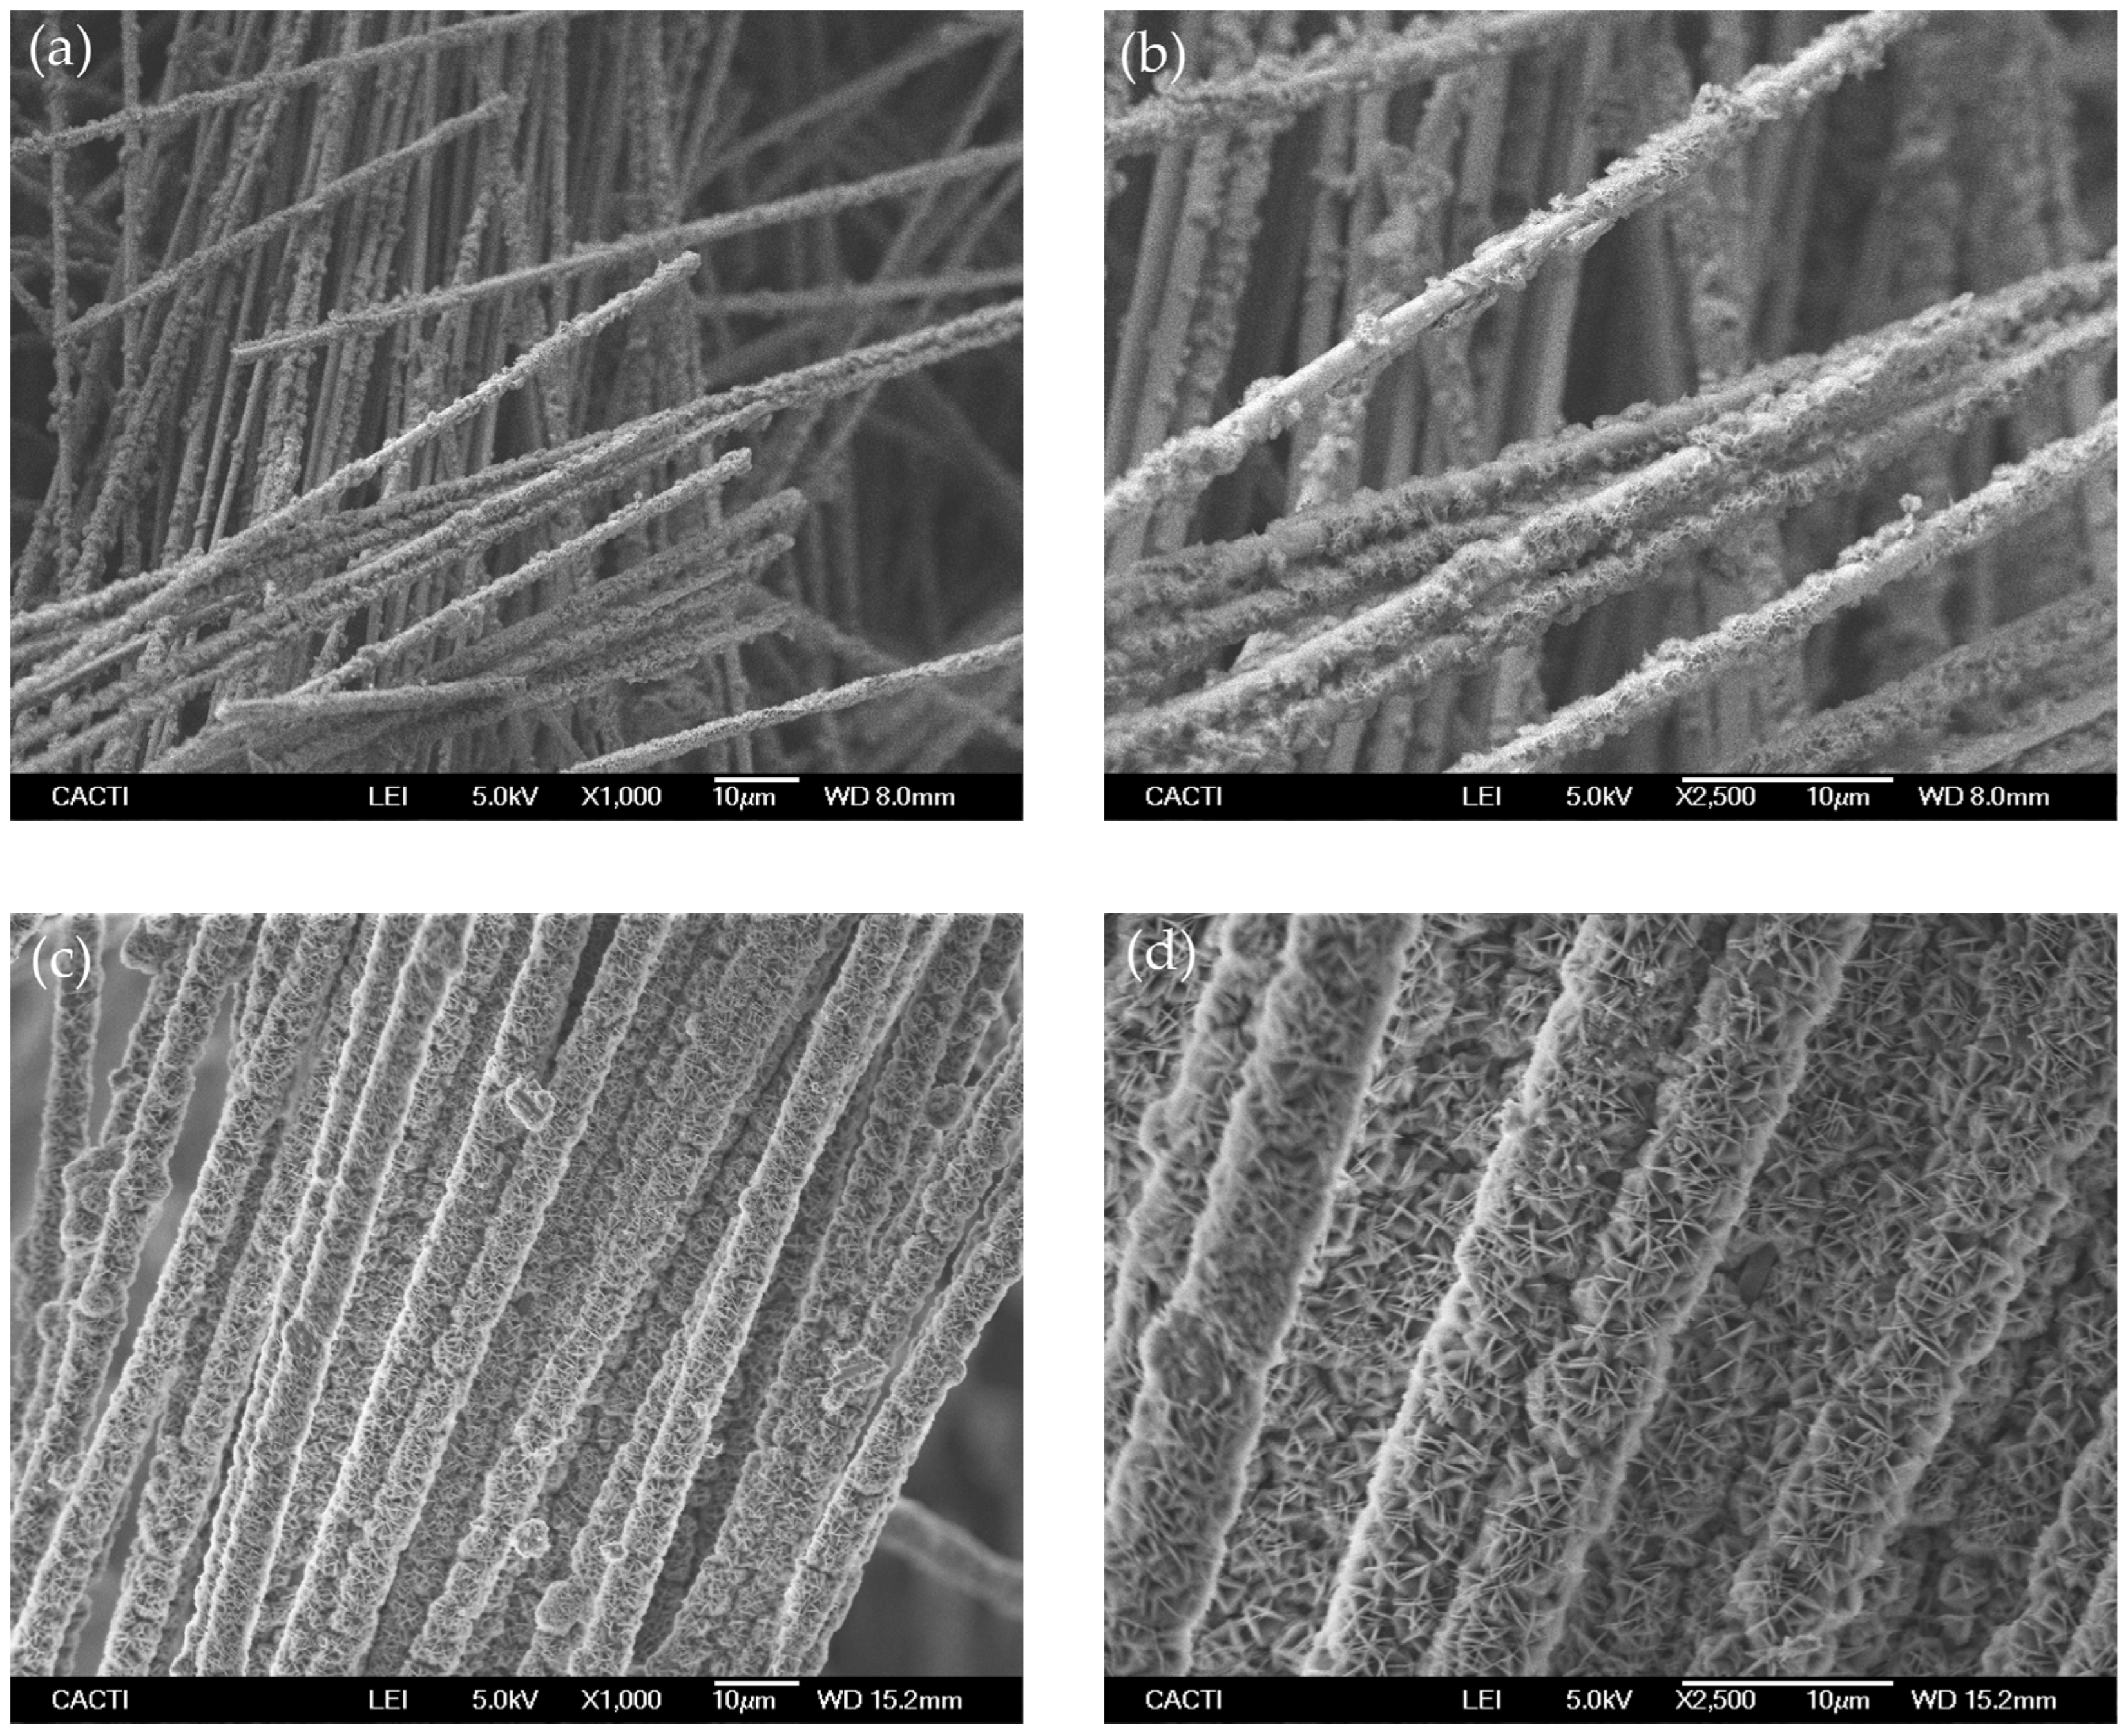
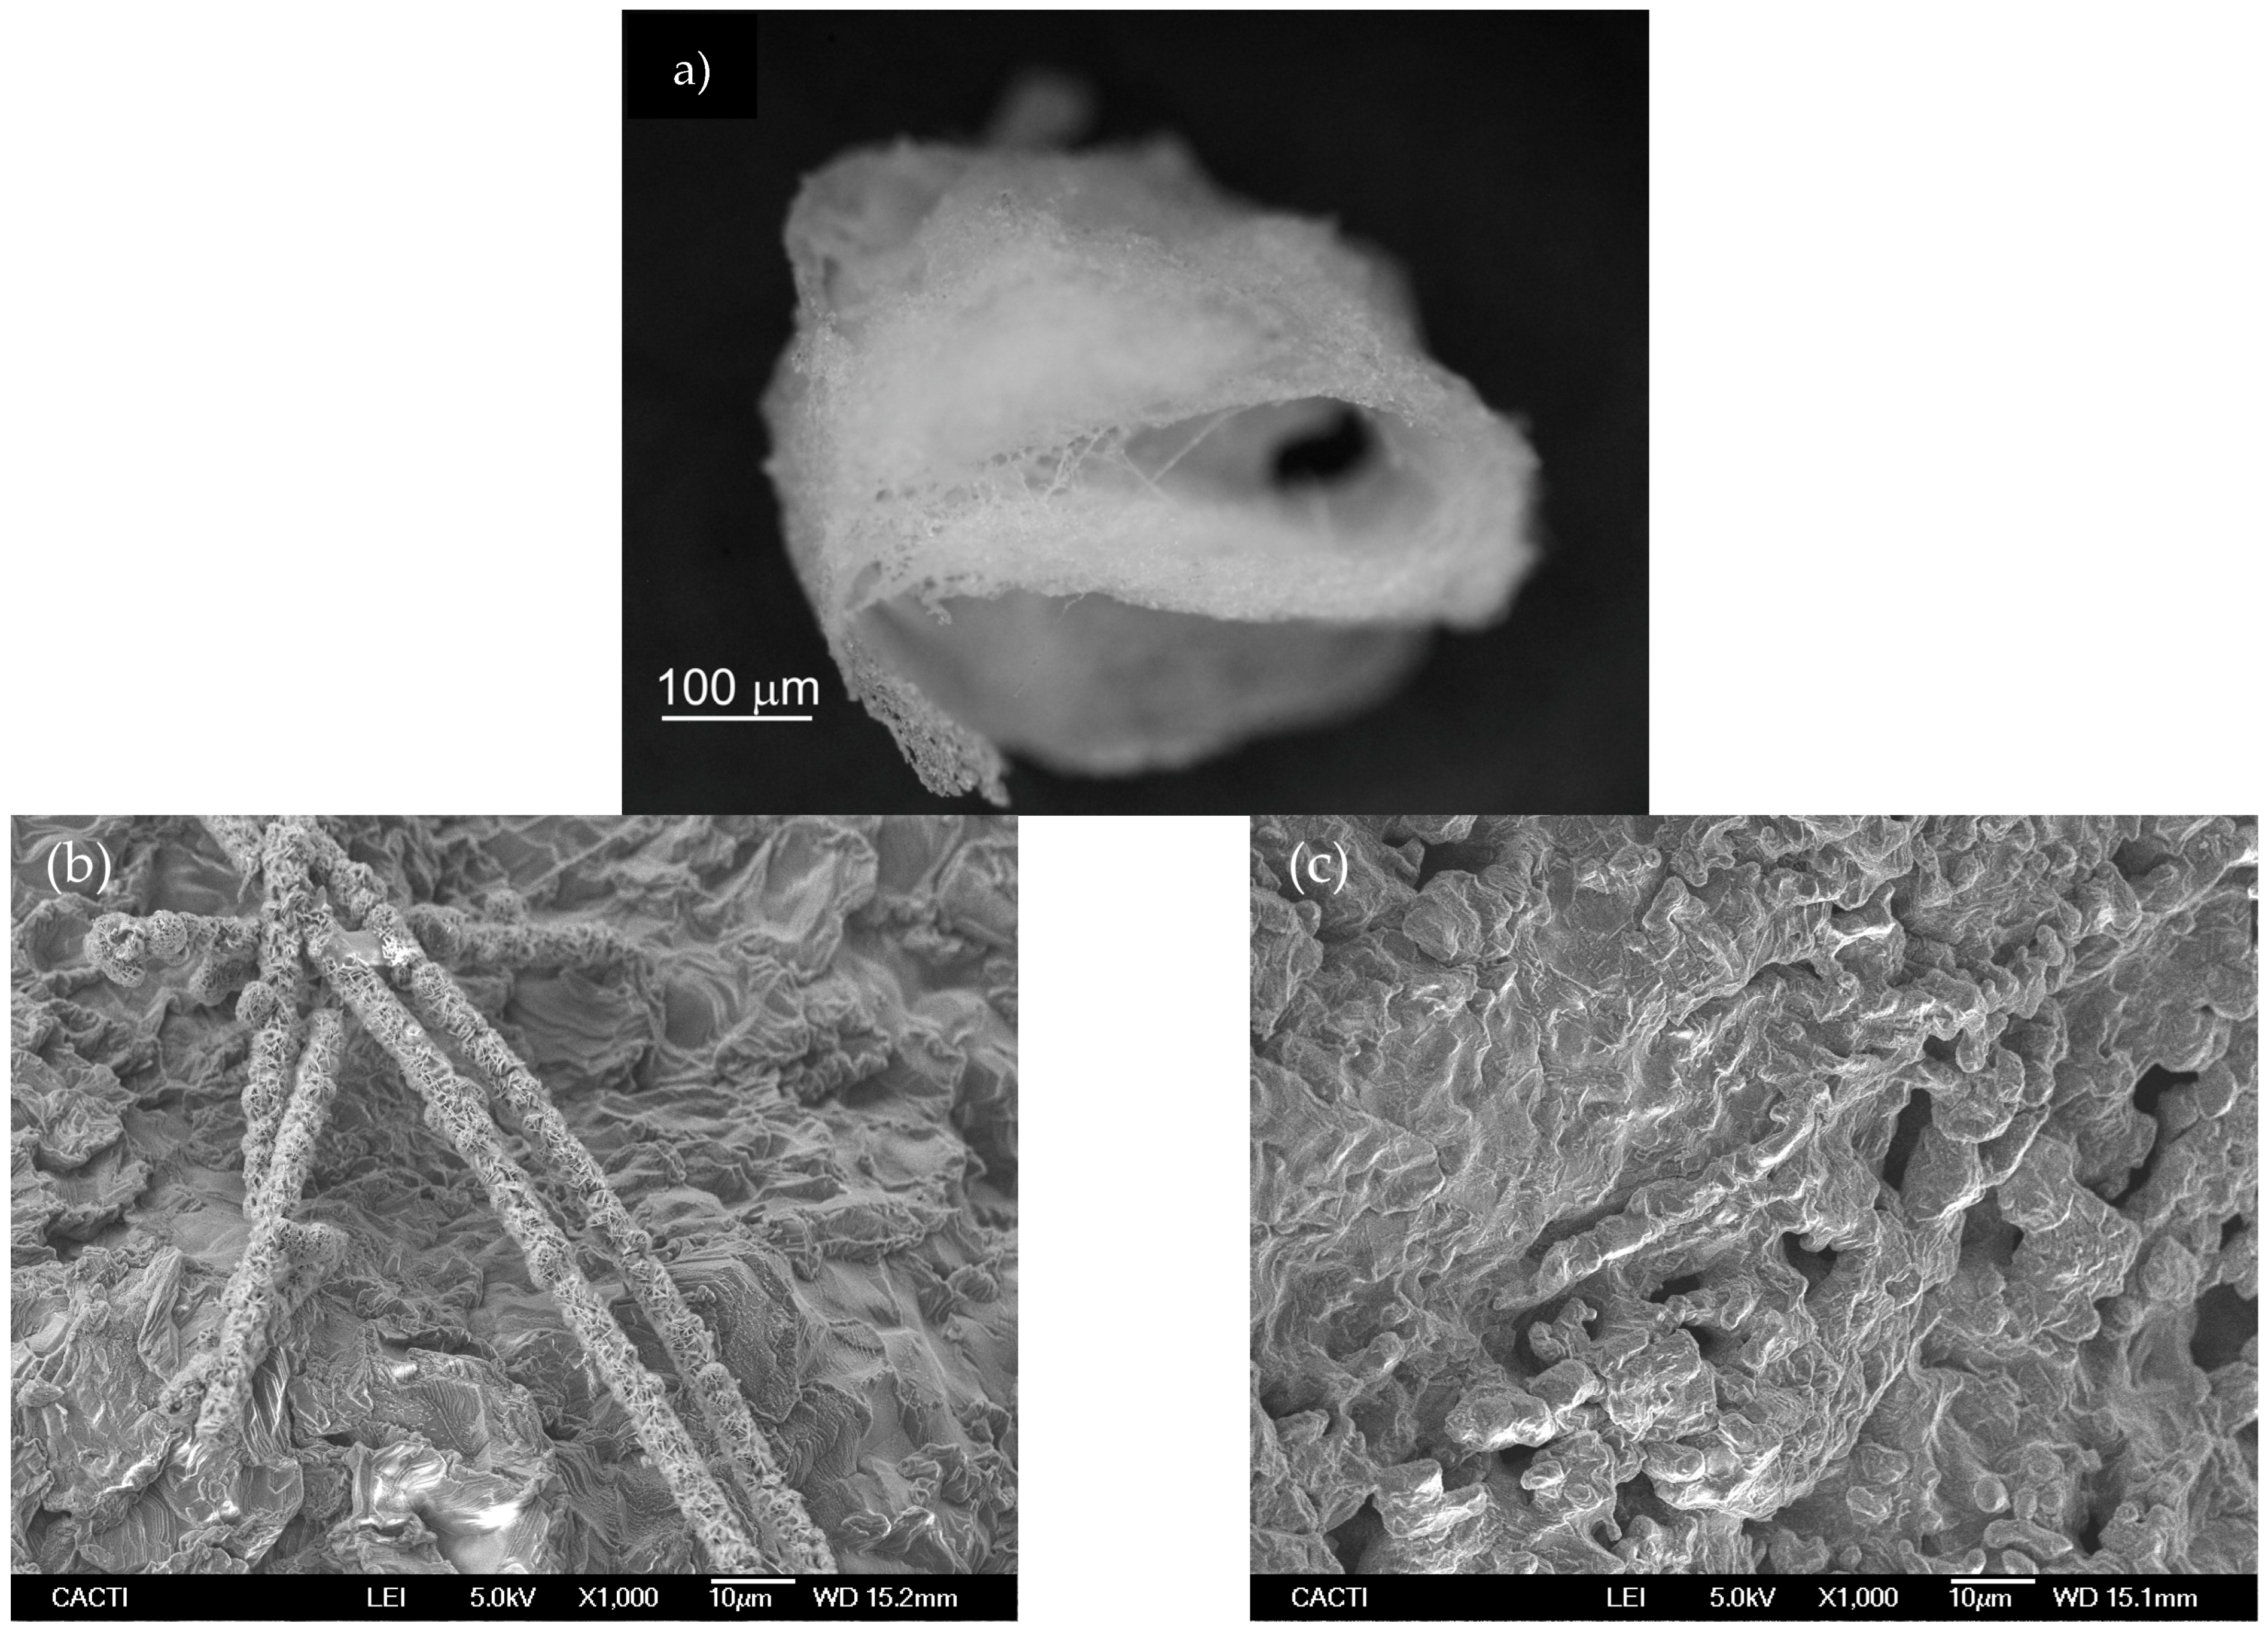
Secondly, silica microfibers membranes were made to react with the lithium compounds to produce the lithium silicates. The main objective was to produce homogeneous mixtures of fibers and lithium-precursor powder, with uniform distribution of the powder deposited on the fibers’ surface to enable the formation of lithium orthosilicate after heat treatment, but with the condition that the fibers’ structure is maintained. Sol-gel methods have been widely used in previous studies [26,35,36] as well as in the present work, for the synthesis of Li4SiO4 powder. However, in this case, since the starting material for silica has fiber morphology, the sol-gel was not useful to retain the fibers integrity. This method involves the magnetic stirring of the mixtures that caused the rupture of most of the fibers in the preliminary tests carried out, conserving only a small portion of fibers that withstood the process. On the contrary, our immersion and impregnation method produced more homogeneous mixtures and retained the fibers’ form as intact. An example can be seen in Figure 3, which shows the SEM image of the silica fibers after being mixed with the LiOH·H2O solutions by the impregnation method (samples 1-Fib-Impregnated and 2-Fib-Impregnated). Lithium hydroxide precipitated on the fibers impregnating a high proportion of their surface in the case of sample 1 but leaving some uncovered areas. However, the surface of the fibers from sample 2 is completely and densely covered by the crystals of lithium hydroxide.

Figure 3.
SEM images of silica fibers mixed with LiOH·H2O by the impregnation method and dried before calcination: (a,b) 1-Fib-Impregnated; (c,d) 2-Fib-Impregnated.
An insight regarding the effectiveness of the preparation methods was accomplished through nitrogen adsorption, to analyze the porous structure and surface area, and XRD analysis to characterize the different phases in the calcined membranes. Table 2 presents the results of the estimation of the surface area using the Brunauer–Emmett–Teller (BET) method. The surface area of the as-produced silica fibers agrees fairly well with the estimate of the surface area of solid, non-porous fibers with diameters between 1 and 2 μm. After immersion in the Lithium hydroxide and drying, the fibers increase their specific surface area due to the flaked structure of the precipitate on the surface of the fibers. The 2-Fib-Impregnated sample has a larger surface area because the precipitate completely covers the fibers; whereas, the 1-Fib-Impregnated sample has regions without precipitate, as can be observed in the SEM micrograph of Figure 3b, showing a detail of the fibers where some parts which are not covered by the precipitate are visible. This is due to the difference in concentration of lithium hydroxide between both cases. Samples 1-Fib-Calcined and 2-Fibers-Calcined show a notable reduction in surface area due to partial agglomeration.
Table 2.
Surface area estimated using the BET method from the nitrogen adsorption isotherms of the as-produced silica membrane; samples 1-Fibers and 2-Fibers impregnated before calcination and after calcination.
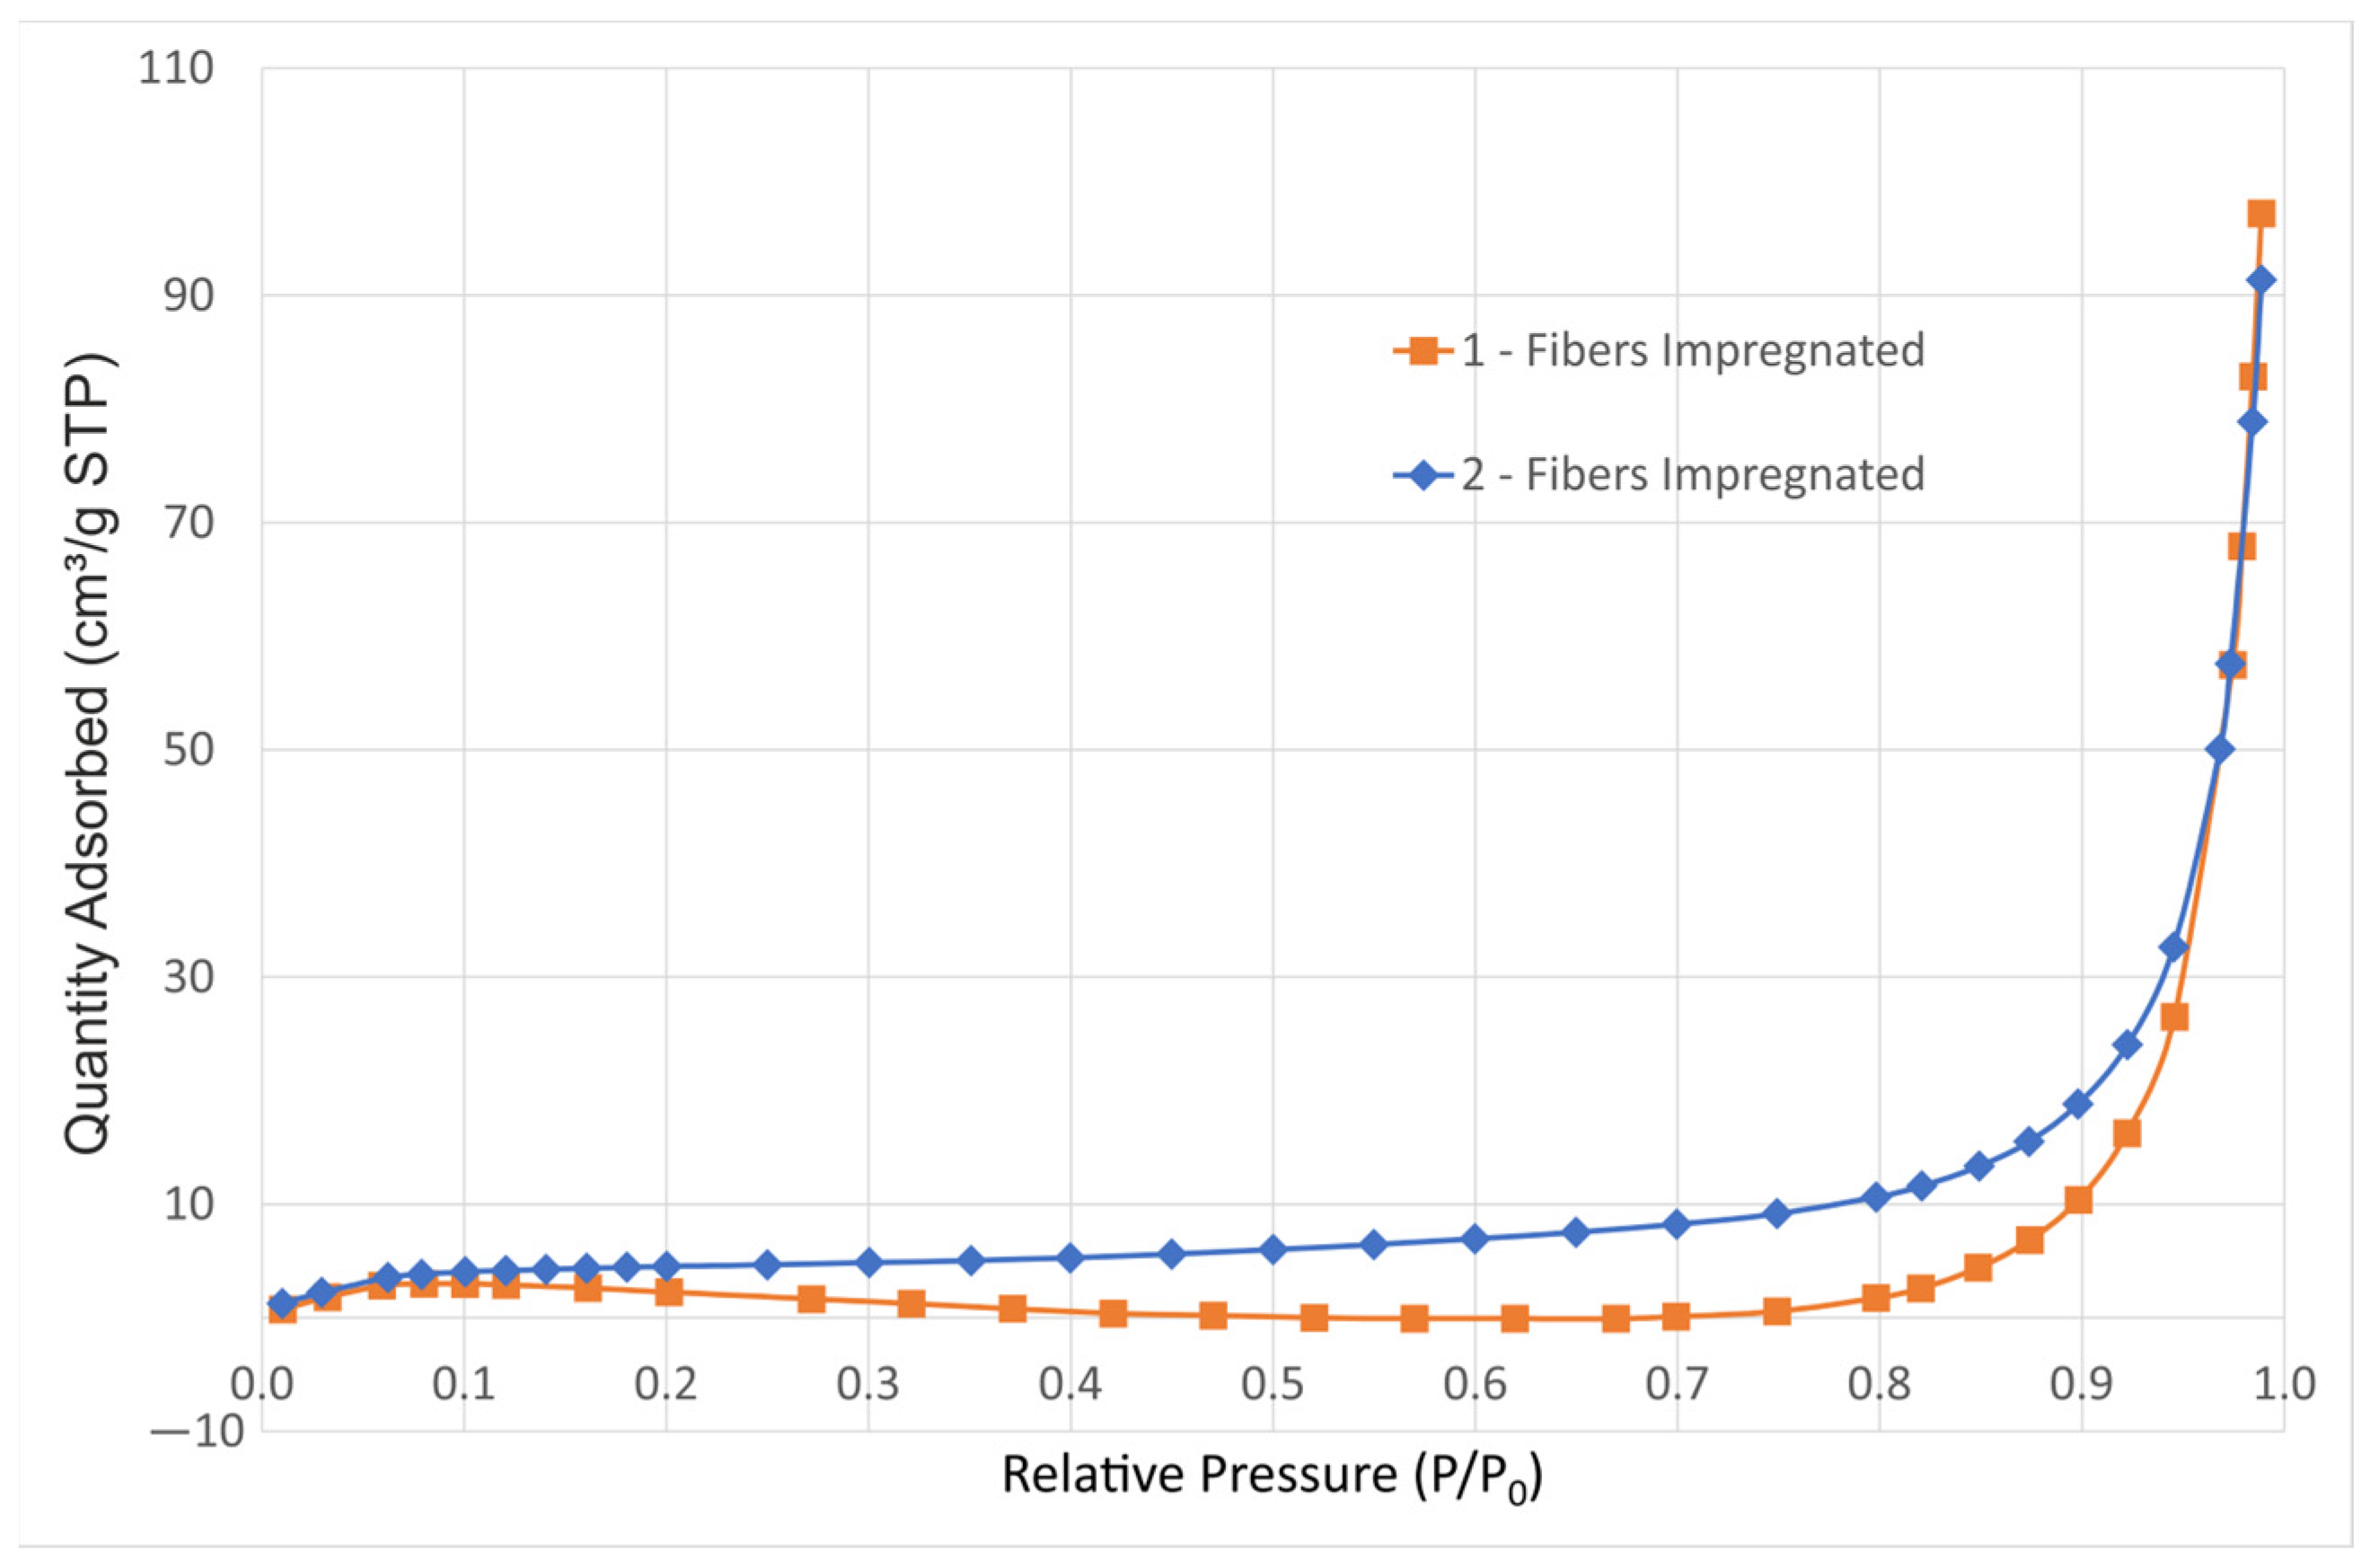
Figure 4 shows the nitrogen adsorption isotherms of both impregnated samples without calcination, showing that even in this case, with the flaked precipitate giving the highest surface area of the three states—as-produced silica fibers, impregnated and calcinated—the physisorption isotherms correspond to a macroporous adsorbent [37]. The as-produced silica fibers are solid with smooth non-porous surface, as can be observed in Figure 2d; whereas, after calcination, the reduction in surface area due to agglomeration is also indicative of a reduction in porosity.
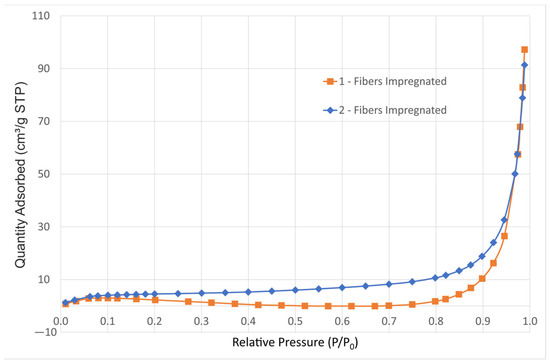
Figure 4.
Nitrogen adsorption isotherms of samples 1-Fib-Impregnated and 2-Fib-Impregnated.
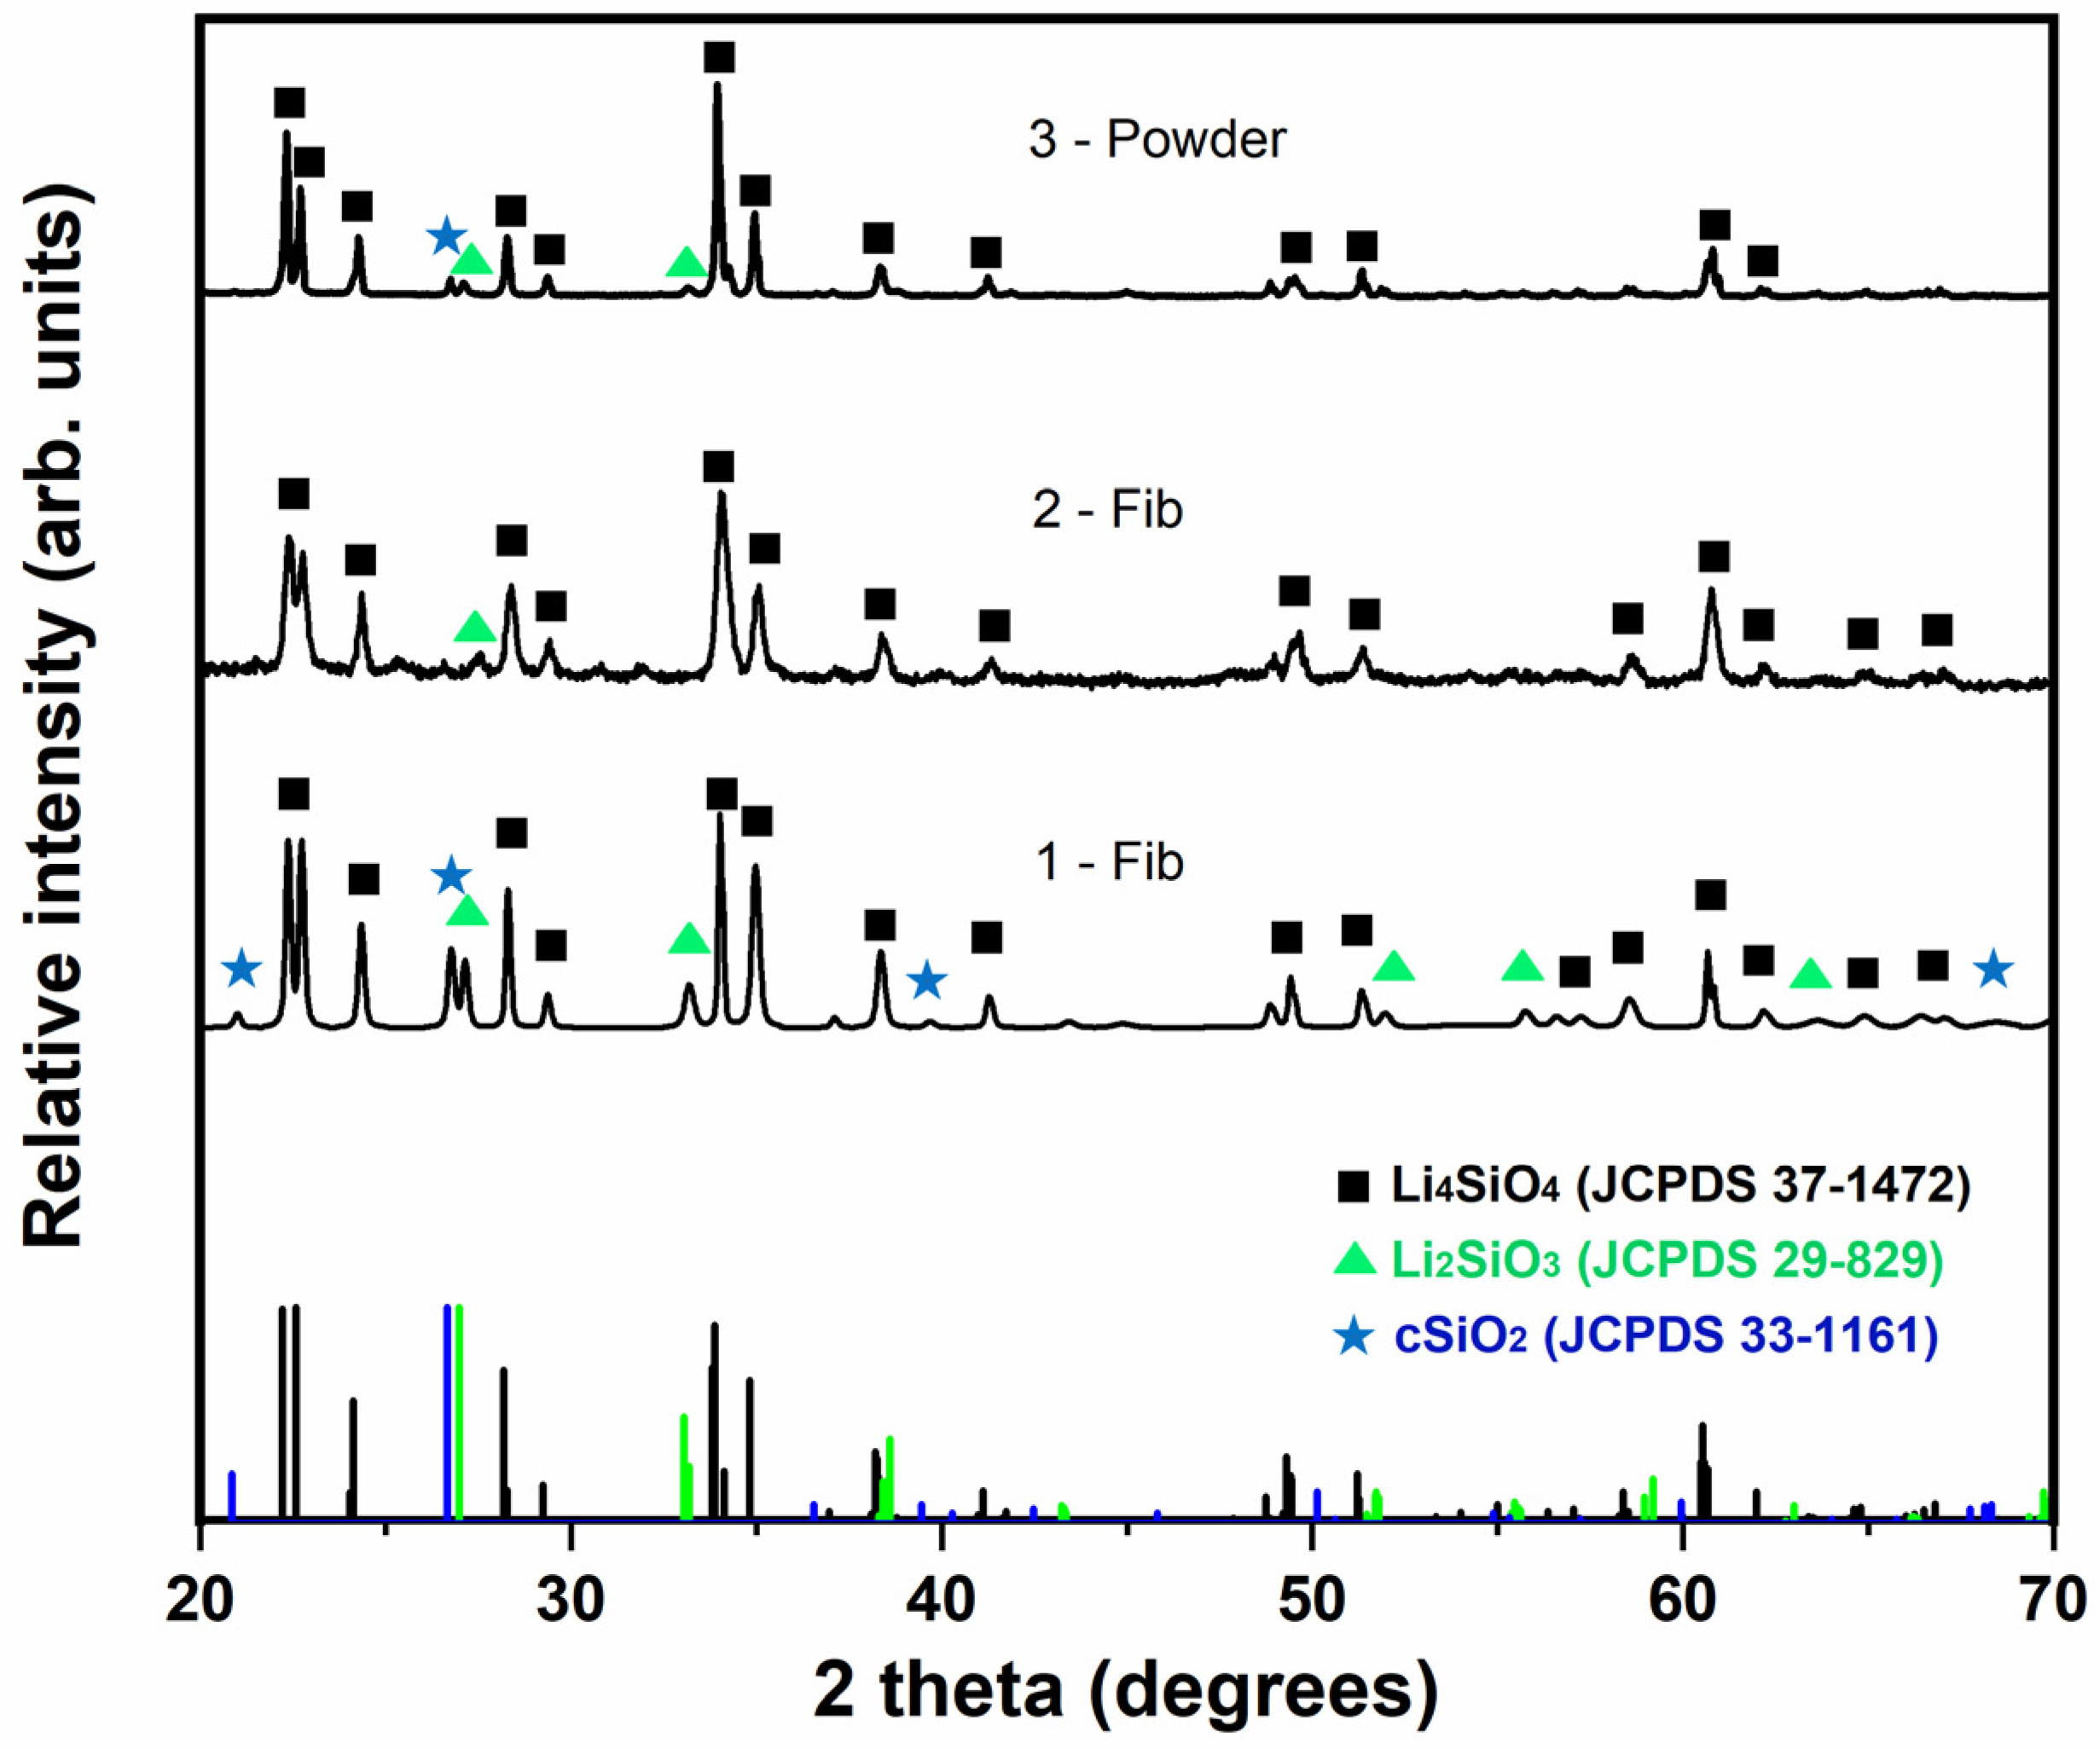
Figure 5 shows the XRD patterns of the calcined samples prepared in this work in comparison with the standard patterns for Li4SiO4 (JCPDS 37-1472), Li2SiO3 (JCPDS 29-829) and SiO2 (JCPDS 33-1161) crystalline phases. The matching scores and the semi-quantification (in terms of weight percentage) of each phase in the measured XRD patterns are presented in Table 3. The impregnation method results in an efficient and simple way of producing samples with a high proportion of Li4SiO4. Specifically, the Li4SiO4 phase was calculated as 78.5% wt. in sample 1-Fib, while, in the case of using the saturated LiOH·H2O solution (sample 2-Fib), a higher proportion of Li4SiO4, i.e., 86.3% wt., was observed. The reason for the difference between the phase proportion of samples 1-Fib and 2-Fib is due to the different concentration in the solutions employed in the impregnation method. While both samples were obtained by the same method of impregnation in the lithium hydroxide solution, the concentration of the solution employed to prepare sample 2-Fib was higher, leading to a thicker and more extended covering of Lithium precipitate on the silica fibers before calcination. Then, the stoichiometric ratio of Li to Si atoms required for the formation of lithium orthosilicate is more likely to occur covering the surface of the fibers in sample 2-Fib than in 1-Fib. On the other hand, the powder samples obtained by the sol-gel method (sample 3-Powder) gave a higher proportion of lithium orthosilicate and almost no traces of the rest of components. Overall, the sorbents produced through the impregnation method with the use of LiOH·H2O saturated solution give an homogeneous distribution of lithium on the silica fibers and have a high Li4SiO4 content.
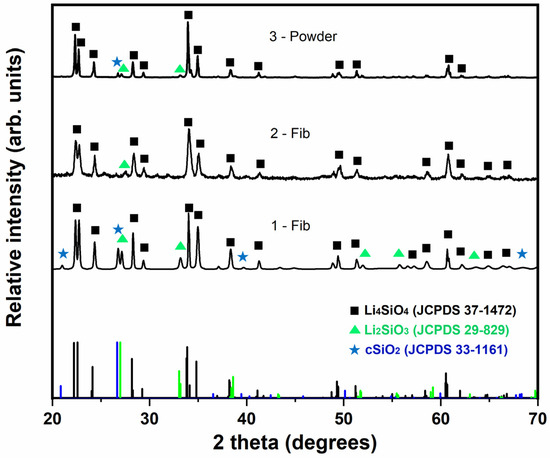
Figure 5.
XRD patterns of calcined samples 1-Fib, 2-Fib and 3-Powder, compared with the characteristic peaks of the reference phases: lithium orthosilicate (black square), lithium metasilicate (green triangle) and crystalline silica (blue star).
Table 3.
Phase identification and semi-quantification by XRD analysis for samples after being calcined at 900 °C for 20 min.
3.2. CO2 Adsorption Analysis
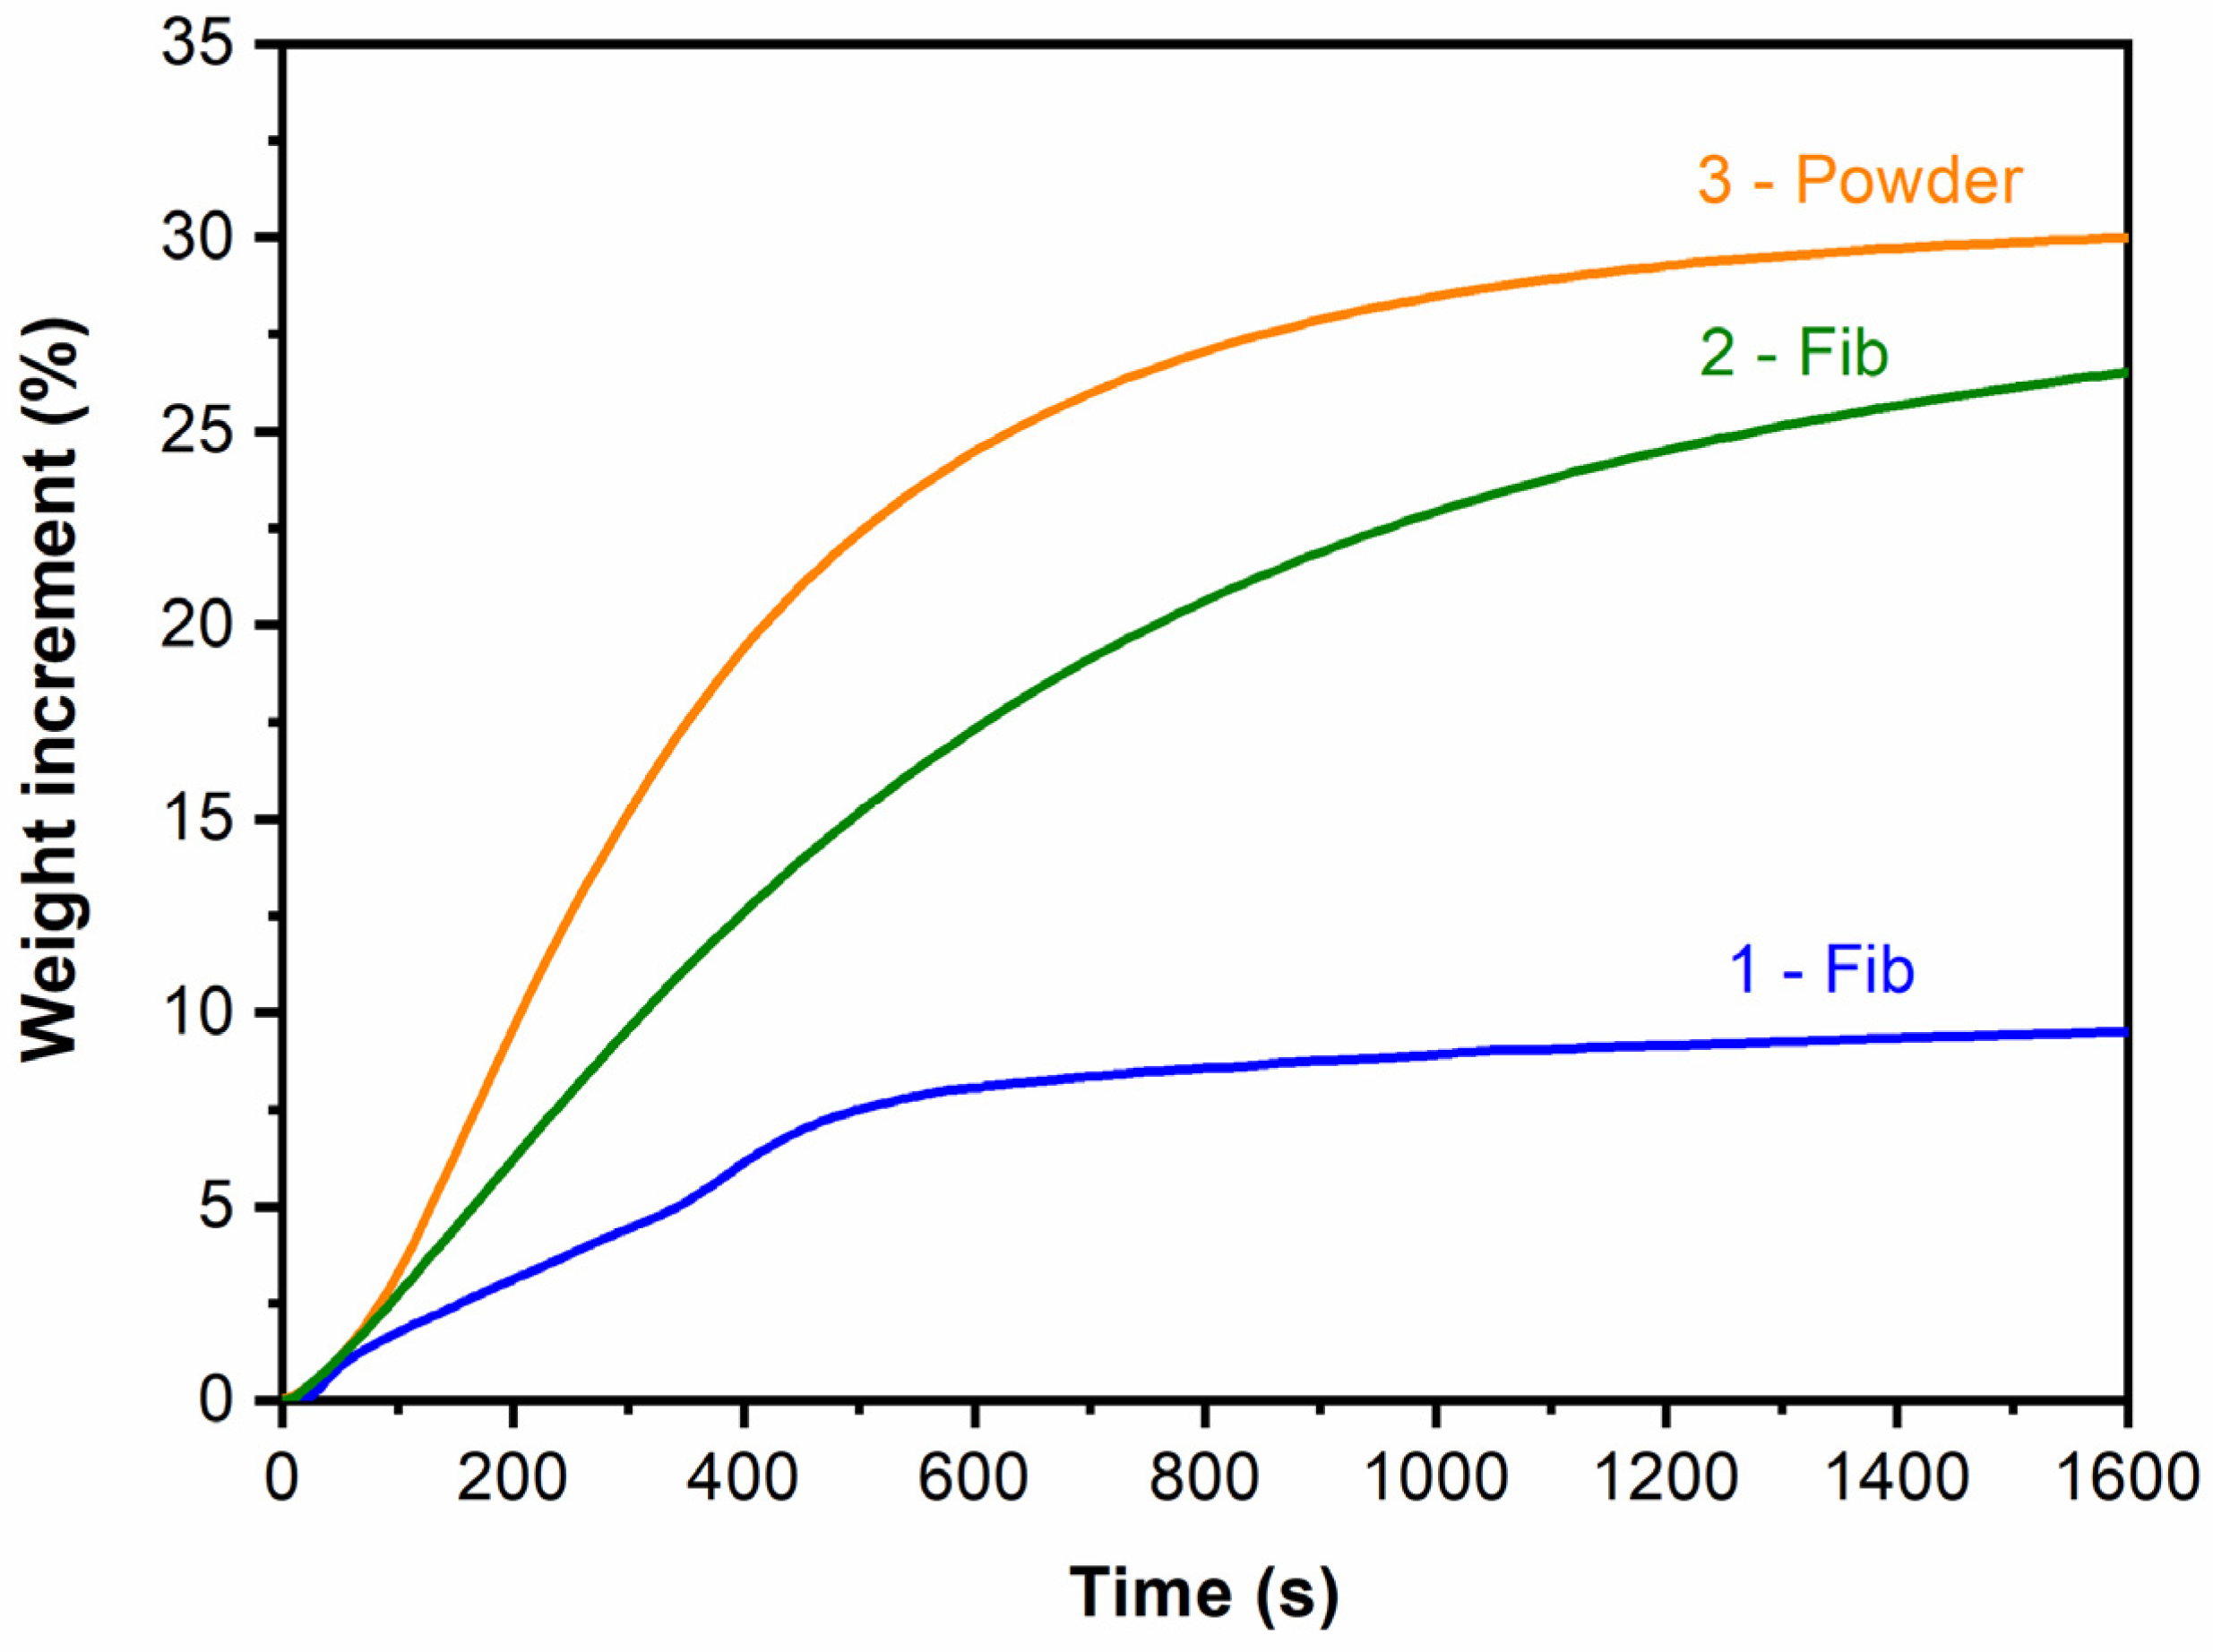
The adsorption capacity of the three samples was assessed by performing the isothermal thermogravimetric analysis at 700 °C with a 100% CO2 flow. The results are presented in Figure 6 for the first 1600 s. As can be seen, the samples prepared by the impregnation of the silica fibers with the lithium hydroxide solution and calcination (samples 1-Fib and 2-Fib) showed a lower CO2 adsorption capacity than the sample prepared using the sol-gel powder method. Nevertheless, the one made by a saturated solution of LiOH·H2O (sample 2-Fib) captured 27% wt. of CO2, which is close to the values recorded for the sol-gel method, which was ca. 30% wt. after 1600 s of exposure in CO2.
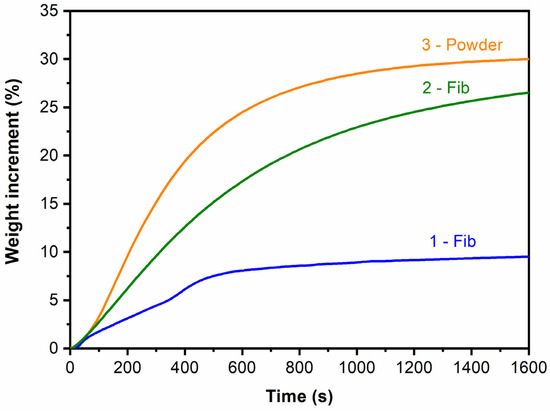
Figure 6.
Isothermal TGA curves at 700 °C of the three samples with a 100% CO2 flow.
Samples 1-Fib and 2-Fib presented adsorption curves similar to the Li4SiO4 powder (sample 3-Powder) and other Li4SiO4 materials reported in the literature [19,22,26,36] whose chemical reaction with CO2 is shown in reaction (1). Samples produced in this work showed a higher adsorption rate at the beginning, which corresponds to the surface chemisorption of the surrounding CO2. The second part of the process shows a steady decrease in the adsorption rate due to the gradual formation of the Li2CO3 and Li2SiO3 external layer. This shell leads to a reduction in the adsorption rate because the diffusion takes control of the kinetics of the adsorption process.
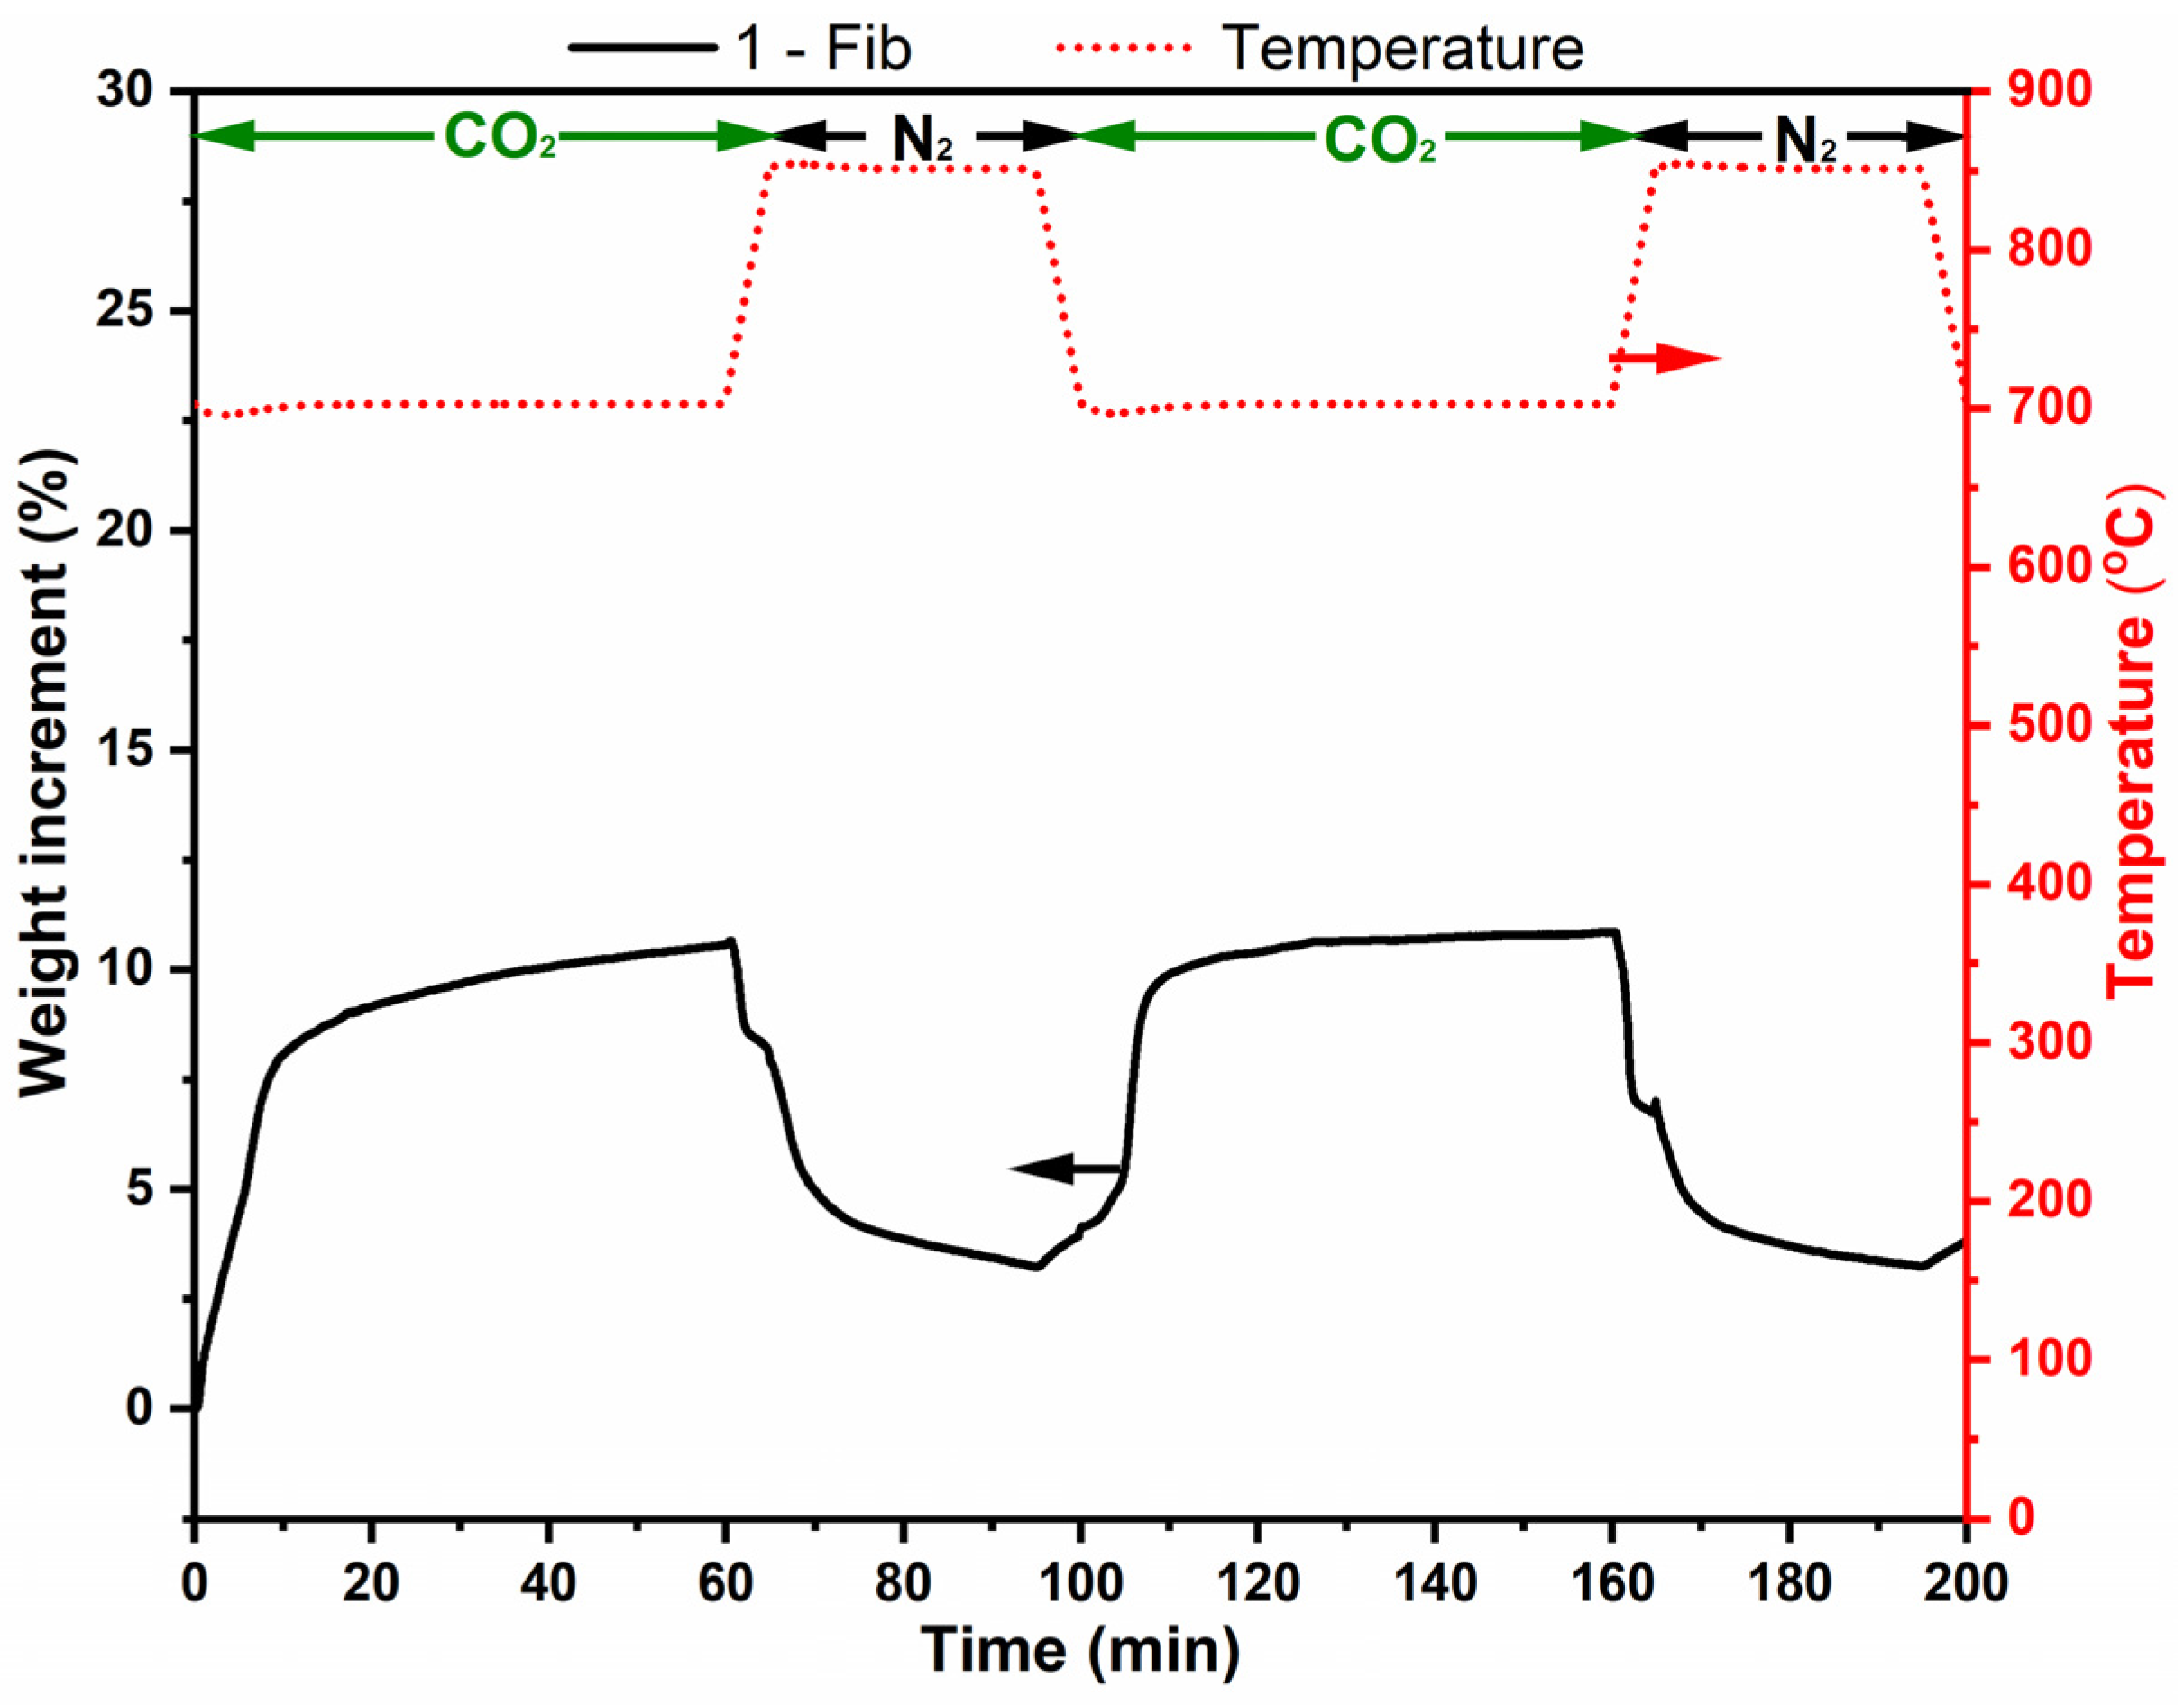
Figure 7 shows the results of two adsorption–desorption cycles for sample 1-Fib. The adsorption capacity in this case is approximately 10% in weight. The graph shows clearly the first chemisorption step, with a higher adsorption rate, and its steady decrease when the layer of Li2CO3 and Li2SiO3 was thick enough to slow down the rate of the process, limited by diffusion. The adsorption process goes beyond the isotherm but stops when the temperature is higher than 720 °C, temperature at which point, the Gibbs free energy changes the sign for Equation (1) [17]. On the other hand, the relative regeneration capacity is ca. 70% in both cycles and 100% in the second. However, the desorption rate was low and the sample did not release all the adsorbed CO2 within the 30 min desorption step.
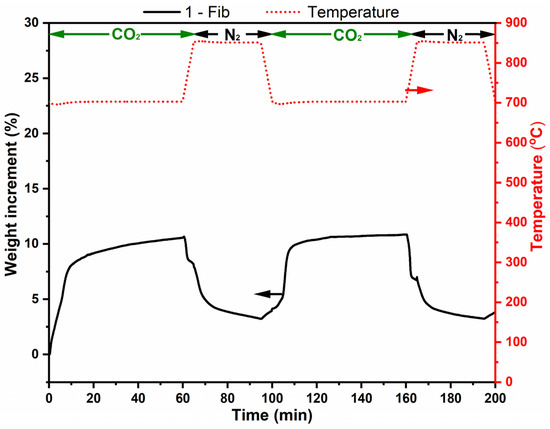
Figure 7.
Thermogravimetric analysis of lithium silicate fibers (sample 1-Fib) in two adsorption-release cycles (at 700 °C and 850 °C, respectively). The analysis was performed with a 100% CO2 flow except when then temperature is 850 °C, where there was a 100% N2 flow. The red dotted line corresponds to temperature (right vertical axis) and the black line corresponds to weight change % of sample 1-Fib (left vertical axis).
Figure 8 shows optical and SEM images of sample 1-Fib after the two adsorption-regeneration cycles. The optical image shows that the 3D structure of these fibers is still unaltered; they retained their morphology during this process which helps to avoid major agglomeration. However, the SEM images evidence the occurrence of agglomeration after calcination, and that might be the reason for the slow desorption and the incomplete regeneration.

Figure 8.
(a) Optical microscopy image showing the fibrous macroscopic structure of sample 1-Fib; (b,c) SEM images of the sample 1-Fib after calcination reveal some agglomeration at the microscale.
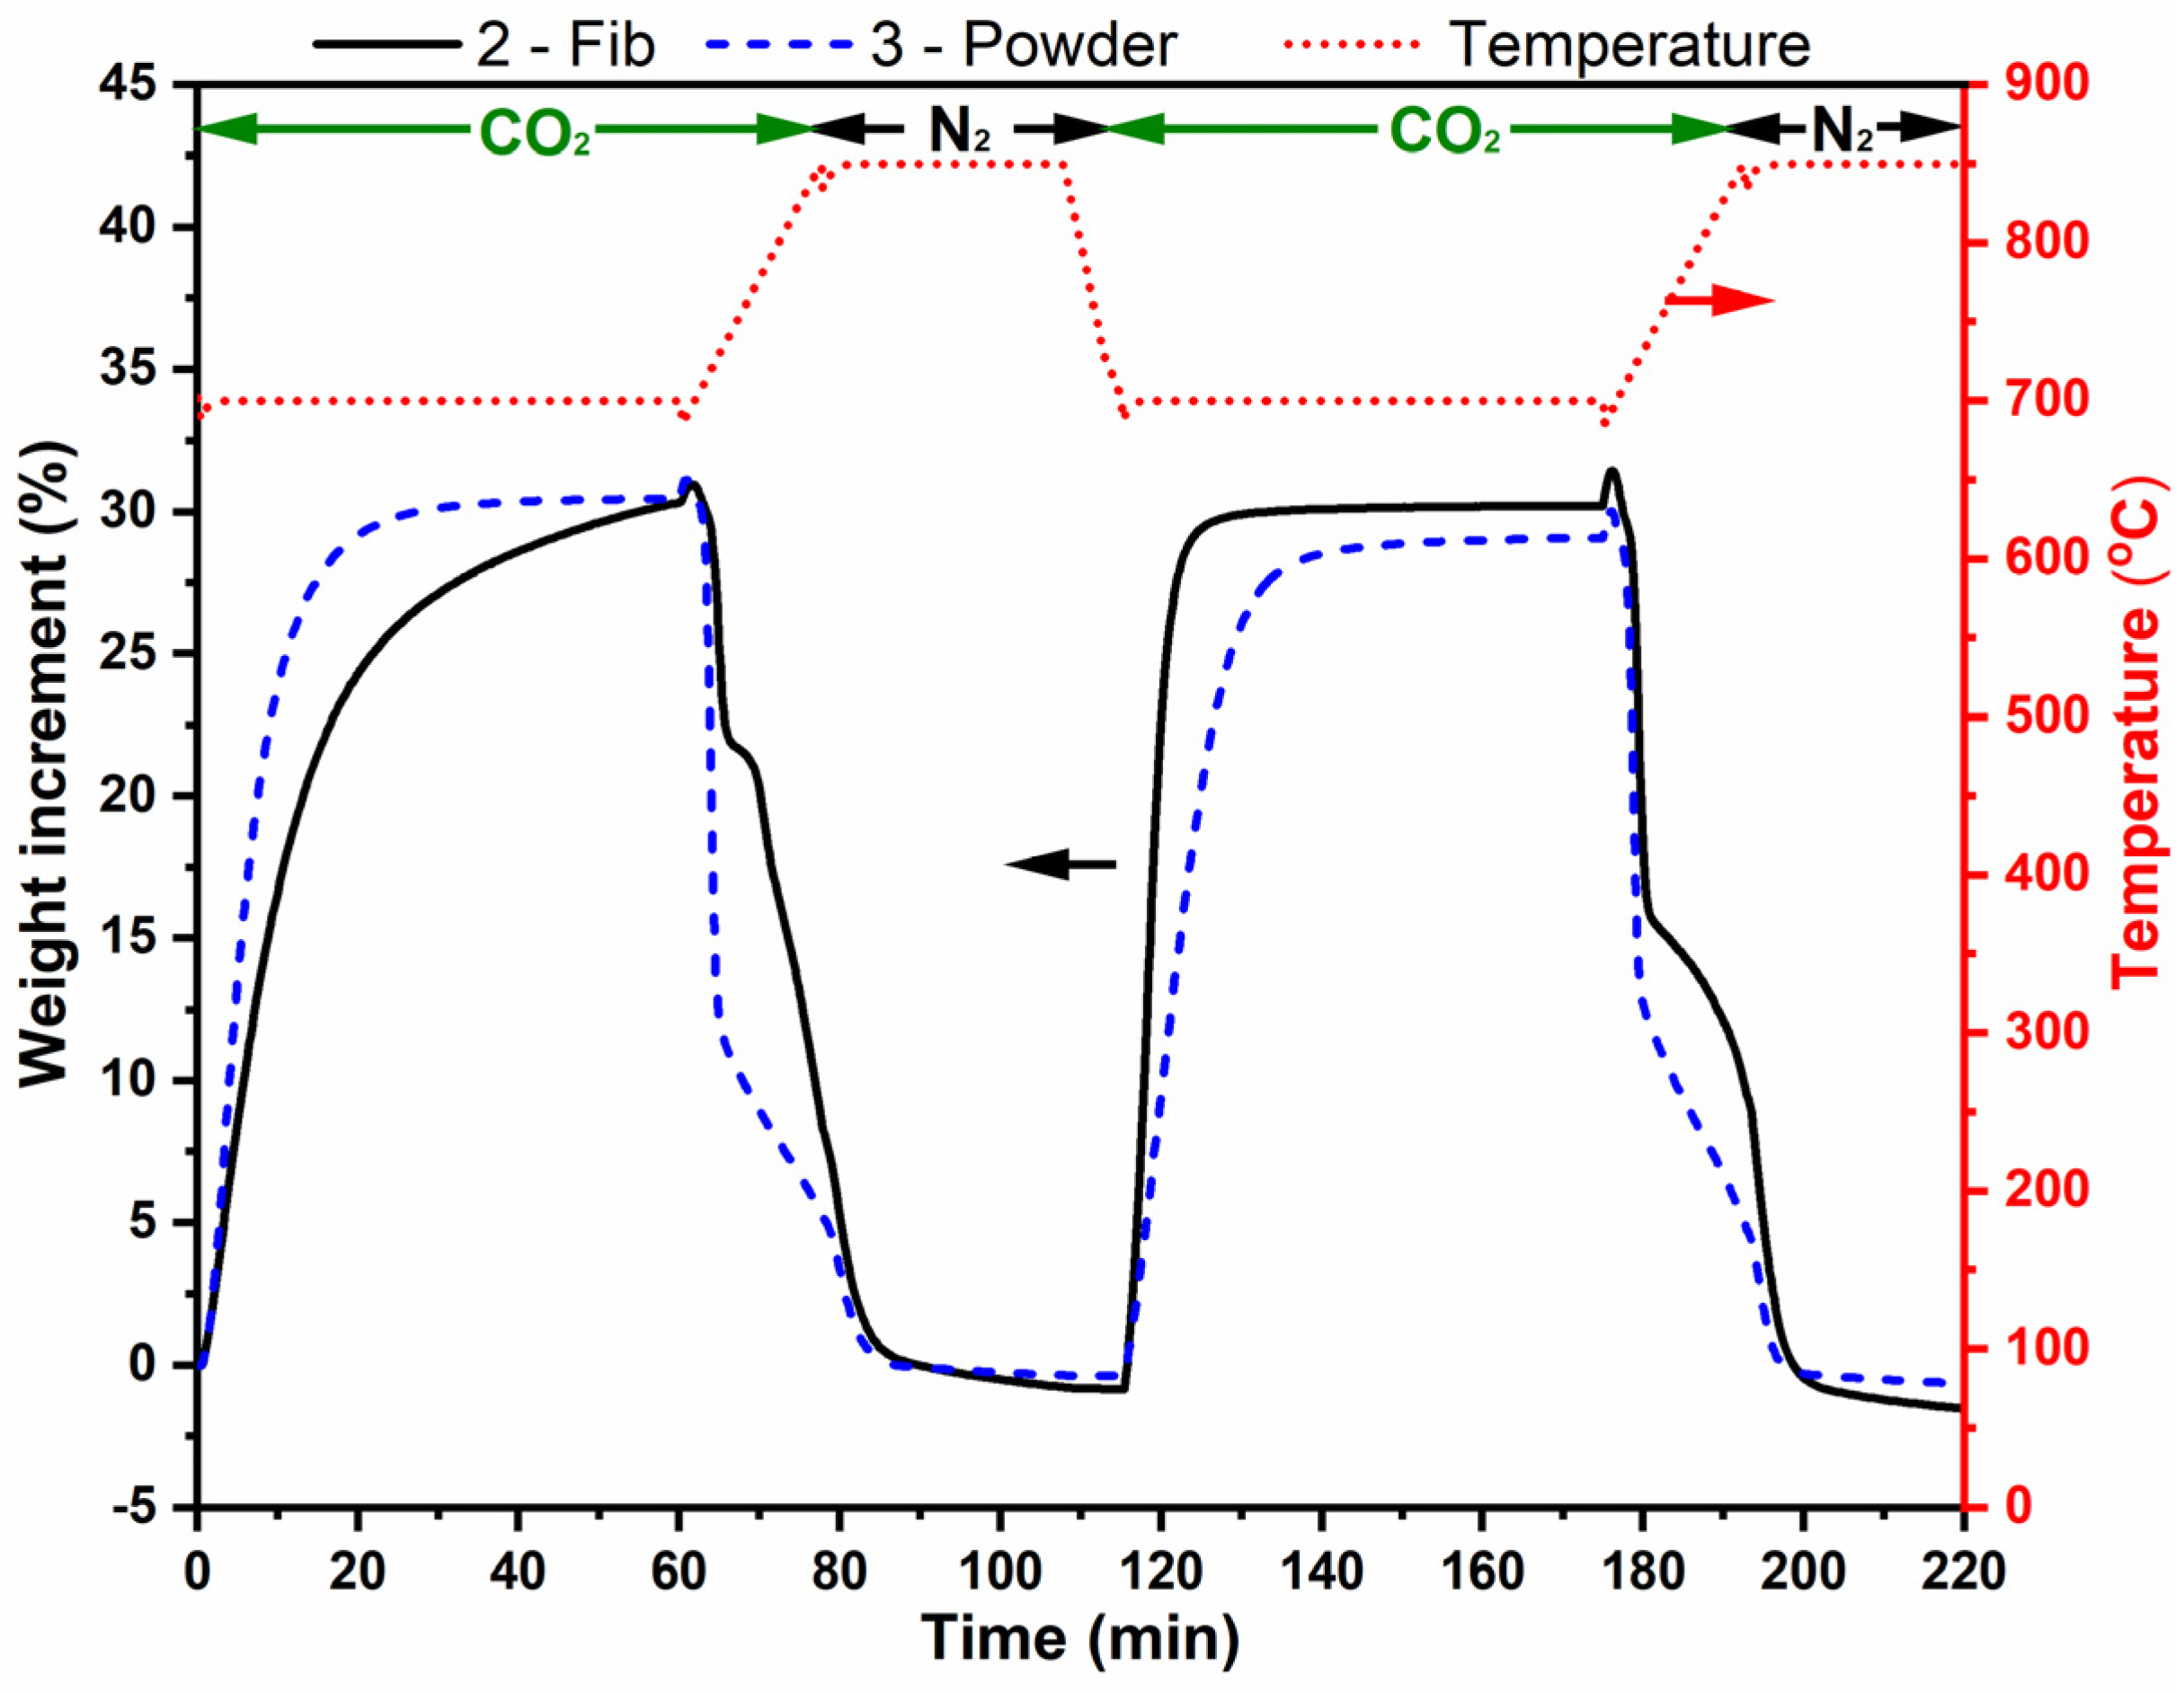
Figure 9 shows the same two adsorption–desorption cycles for sample 2-Fib and 3-Powder. Sample 2-Fib clearly shows a higher adsorption capacity (ca. 31% wt.) with regard to sample 1-Fib (Figure 7) and a total regeneration capacity in both cycles. The carbonation of this sample was completed after 12.5 min. In the first cycle, the adsorption rate of the powder used as reference is higher than that of sample 2-Fib; however, in the second cycle, the reverse phenomenon was observed. This behavior is probably due to the fact that the fibers are able to keep their 3D structure and avoid major agglomeration, while the powder sample might have suffered from particles agglomeration and lost free surface. The latter makes the diffusion more important for the powdered sample in detriment of the chemisorption process, which is faster in 2-Fib.
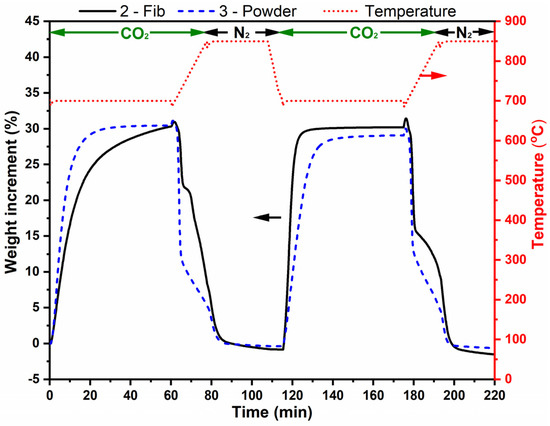
Figure 9.
Thermogravimetric analysis of samples 2-Fib and 3-Powder in two adsorption-release cycles. The analysis was performed with a 100% CO2 flow except when the temperature was 850 °C, where there was a 100% N2 flow. The red dotted line corresponds to temperature (right vertical axis), and the black and blue lines correspond to weight change % of samples 2-Fib and 3-Powder, respectively (left vertical axis).
Samples 2-Fib and 3-Powder were characterized through XRD after their cyclic exposure in CO2. Figure 10 shows the collected XRD patterns and the patterns compared to the reference patterns, while Table 4 presents the matching score and semi-quantification analysis of these samples compared to the corresponding values before the cyclic exposure. As expected from the TGA results, all the samples mostly retained their Li4SiO4 phase. However, a similarly low percentage in the Li2CO3 phase was identified in both samples. Unfortunately, it is not possible to clarify whether this carbonate phase remained from the cyclic exposure in CO2 or if it was formed after the experiment while storing the samples. The XRD measurement took place a few days after the completion of the TGA experiment and Li4SiO4 is known to adsorb CO2 even in an ambient environment at room temperature [34]. The adsorption–desorption curve in Figure 9 shows that the mass after the first and second desorption processes is slightly lower than the initial mass. This could be evidence of slight CO2 adsorption during storage of the samples at room temperature before performing the adsorption–desorption cycles in the TGA. Additionally, the formation and subsequent release of an stable layer of lithium carbonate formed during storage on the surface of sample 2-Fib, might be also an explanation for the increase in the adsorption rate of this sample in the second cycle: after completed CO2 desorption at 850 °C in N2 atmosphere during the first cycle, the sample might expose a cleaner surface for the next cycle, increasing the adsorption rate.
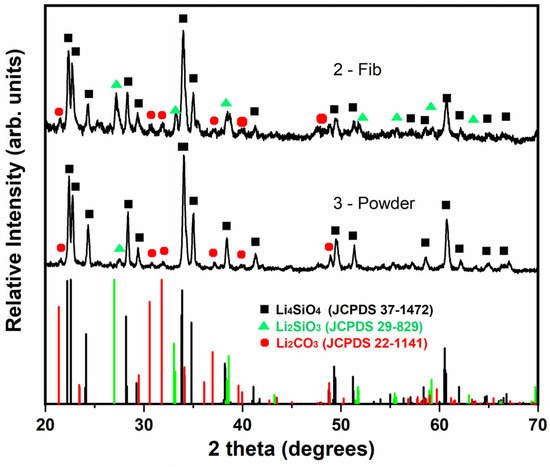
Figure 10.
XRD patterns of samples 2-Fib and 3-Powder after exposure in the CO2 adsorption–desorption cyclic test and a comparison with the characteristic peaks of the reference phases: lithium orthosilicate (black square), lithium metasilicate (green triangle) and lithium carbonate (red cycle).
Table 4.
Phase identification and semi-quantification by XRD analysis for samples 2-Fib and 3-Powder after exposure in the high temperature cyclic test and a comparison with pre-testing values.
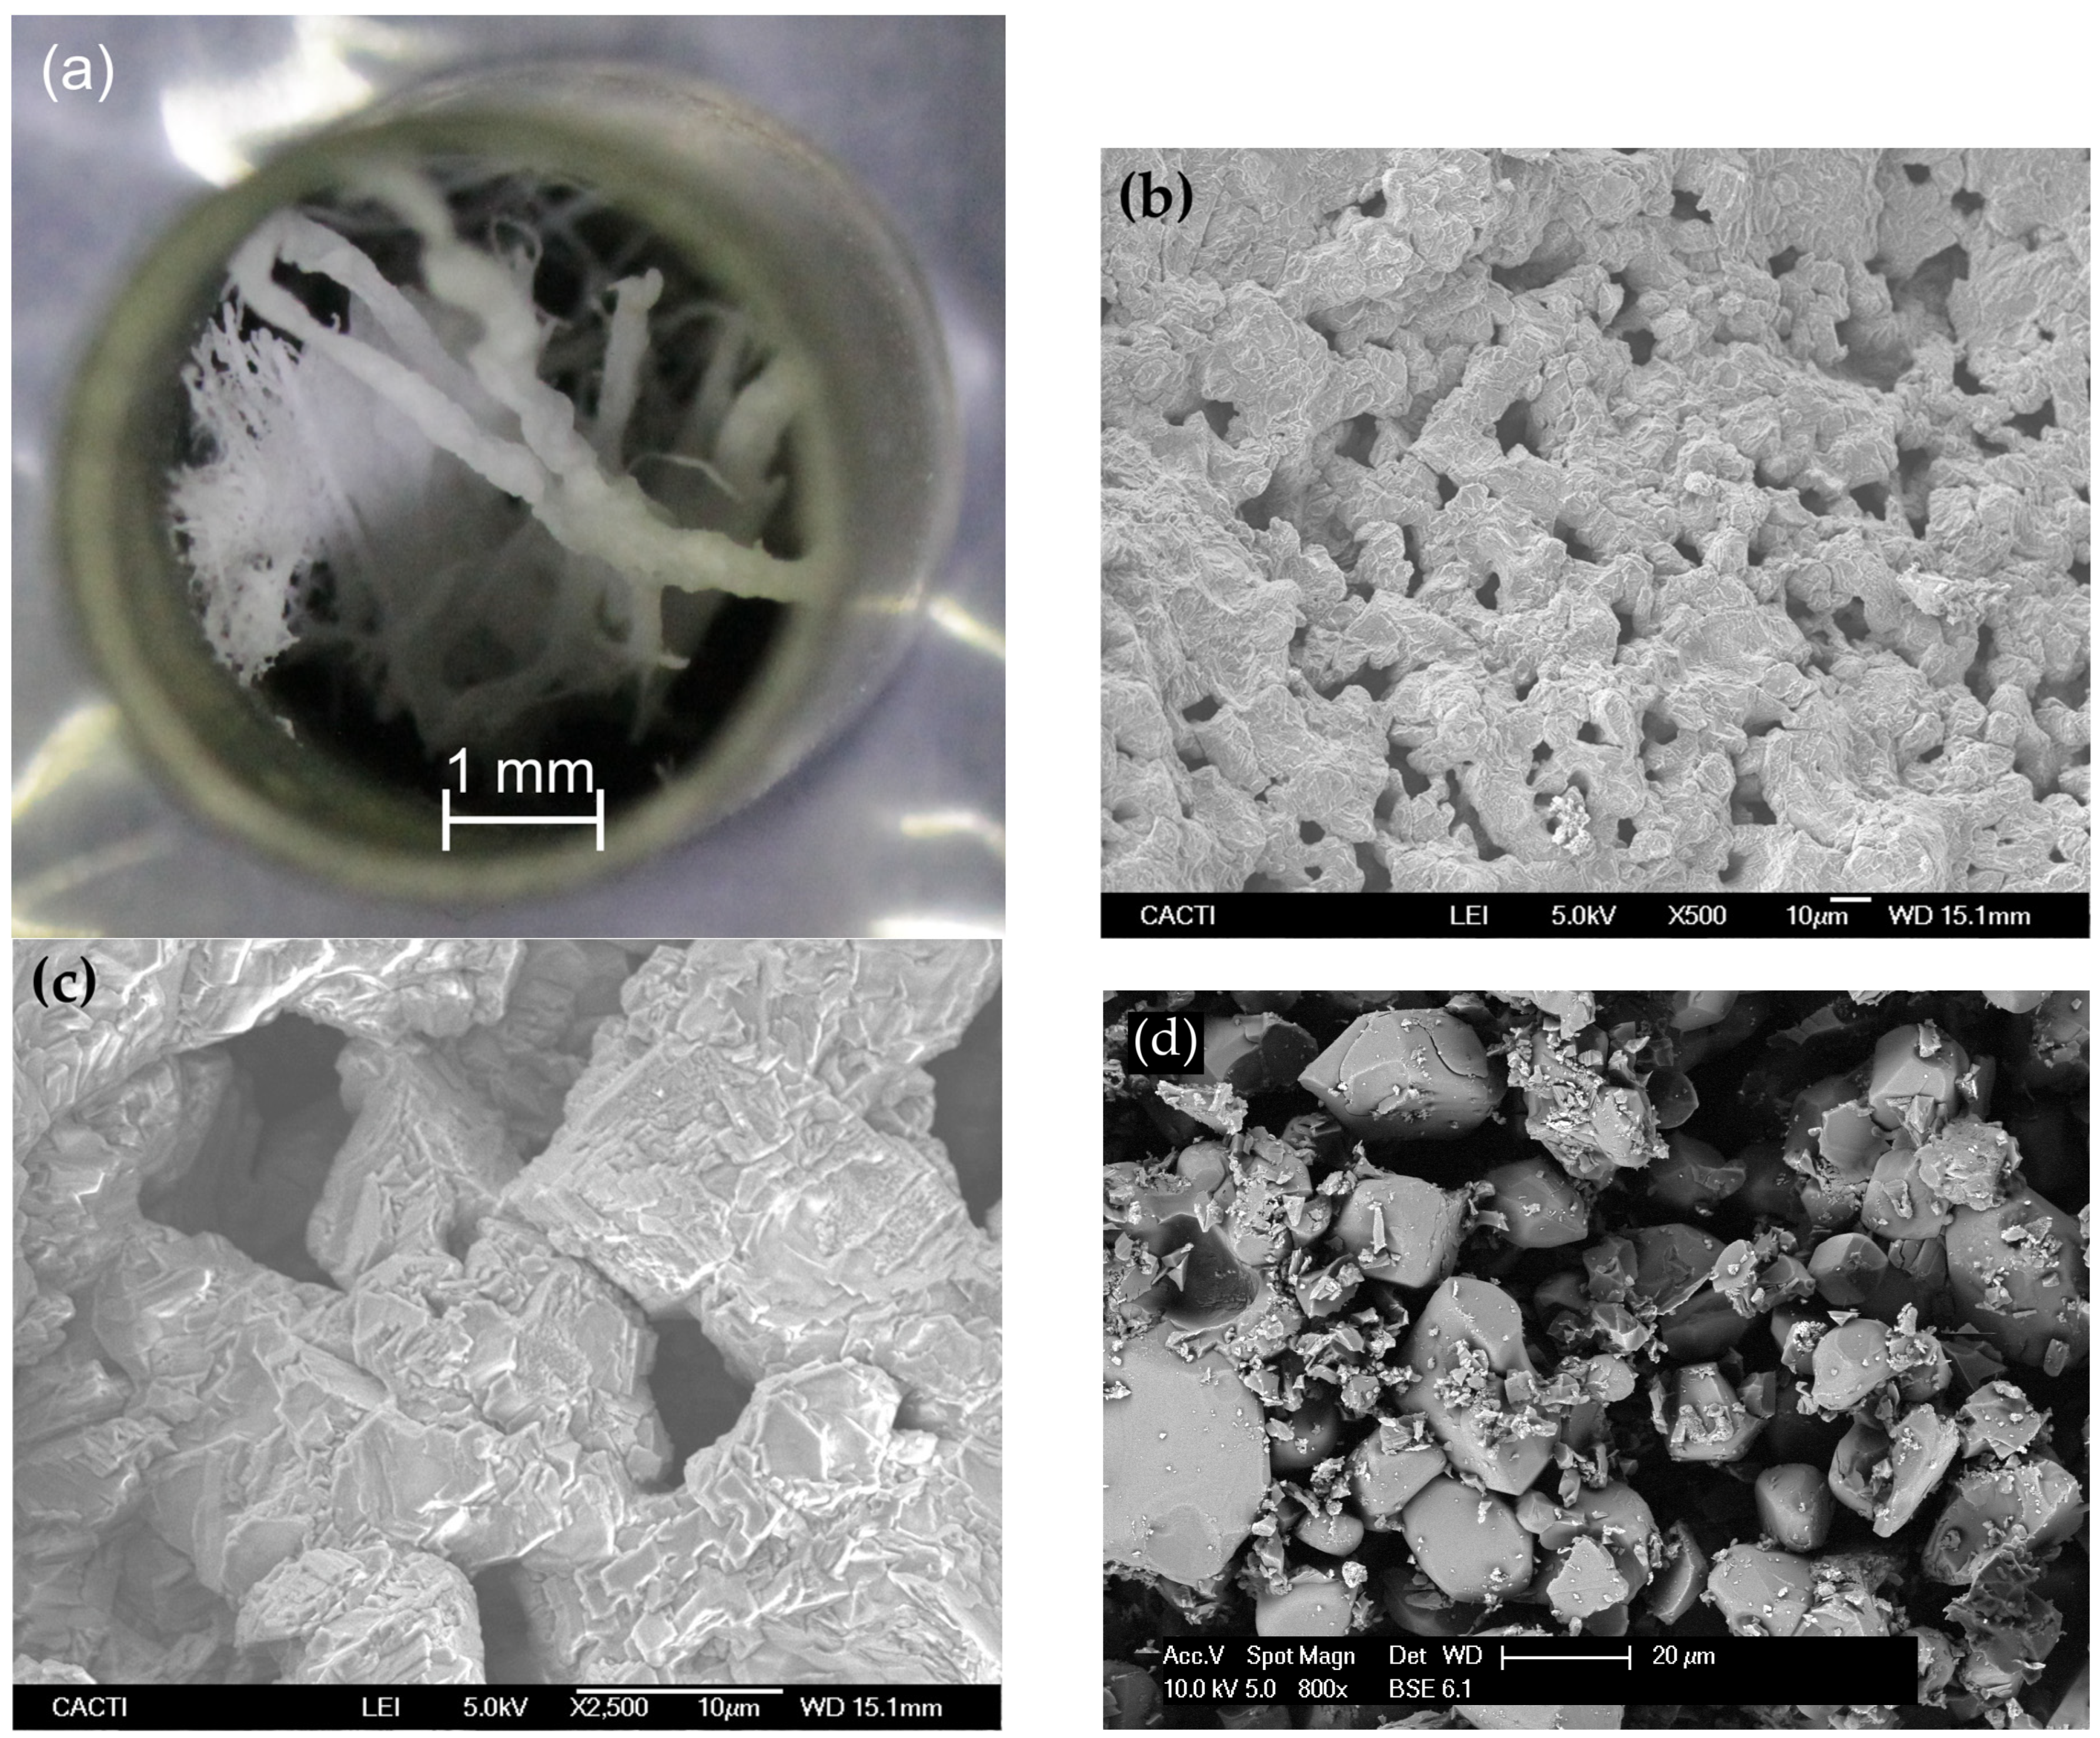
These samples were further characterized after the adsorption–desorption cycles through optical microscopy and SEM. Figure 11a shows that the fibrous structure remains unchanged at the macroscopic scale, forming a short of solid porous membrane. Major agglomeration was avoided, thereby conferring the sample with a 3D structure which is crucial to be able to form a filter by themselves. On the other hand, SEM images of some details of sample 2-Fib show again that there was some agglomeration at microscale and a mix of particles and fibers coexist on the sample, although it has not lost its 3D structure. This agglomeration is likely due to the Li2CO3 formation when the sample is adsorbing the CO2, compound that presents a relatively low melting temperature (723 °C), and hence, it promotes agglomeration. In any case, the adsorption capacity of sample 2-Fib is nearly 85% of the theoretical maximum adsorption capacity of Li4SiO4 and double the minimum required to be eligible as a feasible technology for industry implementation [38]. On the other hand, the comparison of the surface structure of sample 2-Fib with the image of sample 3-Powder (Figure 11d), reveals that the surface of the former is much more fragmented and porous than that of the 3-Powder. This fragmentation of the 2-Fib sample could be caused by thermal stresses generated during the first adsorption and desorption cycle, and could explain the higher adsorption rate of this sample in the second cycle, exceeding that of the 3-Powder.
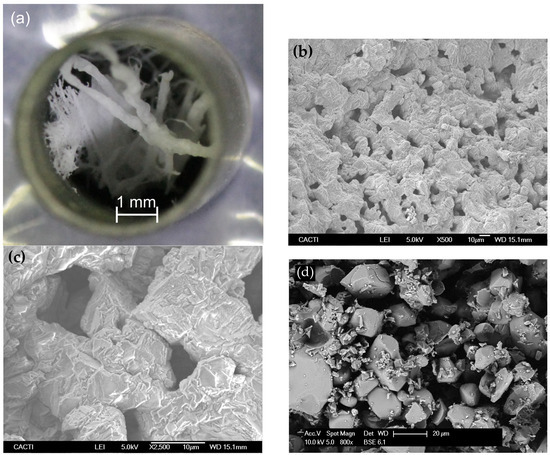
Figure 11.
(a–c) Images of sample 2-Fib after the two CO2 adsorption-release cycles shown in Figure 9: (a) Overall view of the sample in the crucible taken by optical microscopy showing that it keeps part of the fibrous macroscopic structure, forming a solid macroporous membrane; (b,c) SEM micrographs, of some parts that underwent partial agglomeration at the microscale. (d) SEM micrograph of sample 3-Powder.
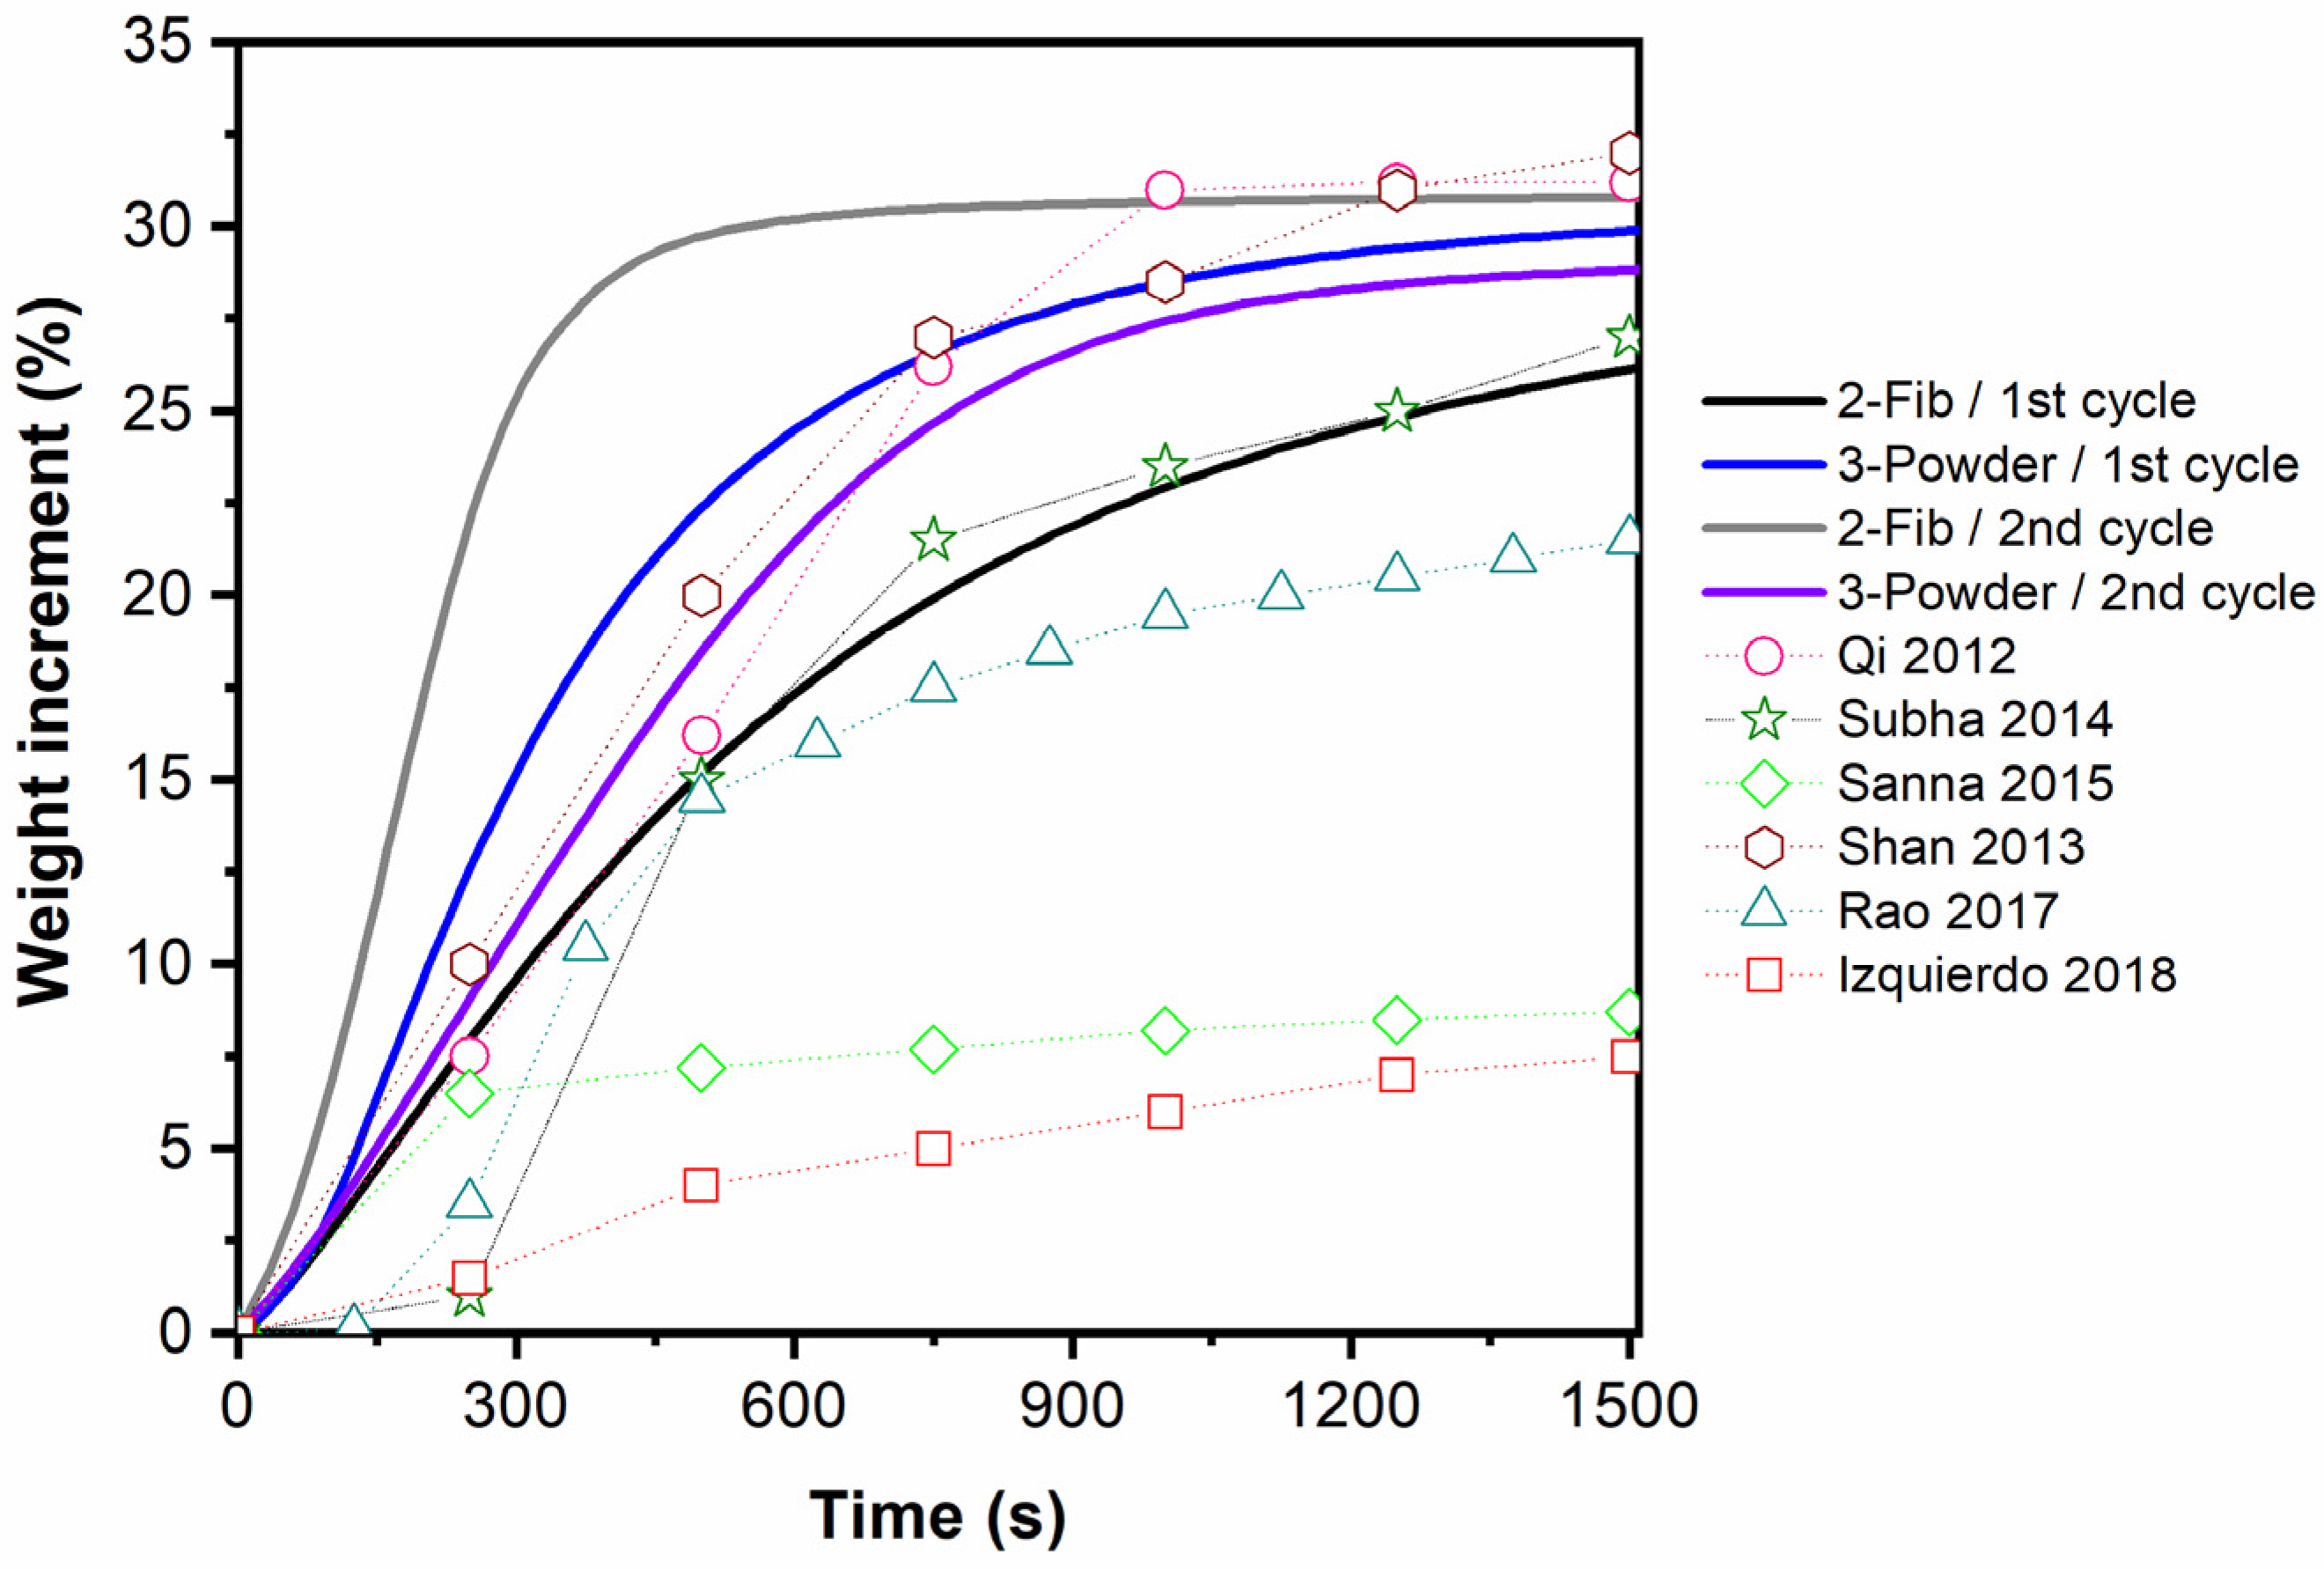
As a comparative analysis of the adsorption behavior of samples 2-Fib and 3-Powder, their CO2 capability at 700 °C for the first 25 min is compared in Figure 12 with data from other studies which regard to Li4SiO4 materials [10,26,39,40,41,42]. It should be noted that the datapoints presented in Figure 12 are approximate values extracted from the experimental curves of these papers. Overall, the adsorption rate and the adsorption capacity of the fibers (as well as the powder) presented in this work, can be characterized as high compared to some of the corresponding values reported in the literature.
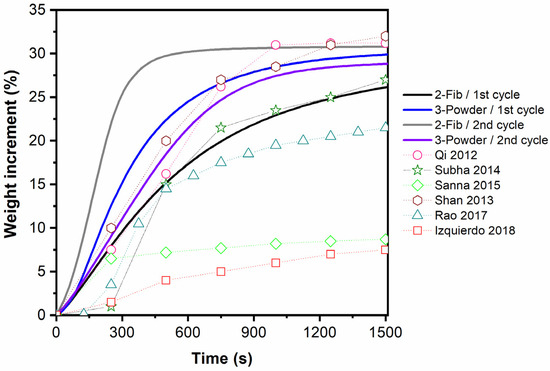
Figure 12.
Comparison of CO2 adsorption isotherms of samples 2-Fib and 3-Powder with experimental data of other studies obtained at 700 °C in 100% CO2. Qi, 2012 [10], Subha, 2014 [26], Sanna 2015 [39], Shan 2013 [40], Rao 2017 [41], Izquierdo 2018 [42].
In summary, the use of different mixing methods leads to clearly different results although the starting precursor materials are the same. Once the inhomogeneity of the samples problem was solved, the most important difference between mixing methods was the lithium to silicon ratio in the final sample (Table 1). The impregnation method of silica fibers developed in this work led to materials with Li/Si proportions being slightly lower than stoichiometric. This promotes the formation of lithium metasilicate and lithium orthosilicate after calcination and their proportion depends on the starting Li/Si ratio. Consequently, these samples showed a lower adsorption capacity than the sol-gel powder sample, but there is a small increase in the relative regeneration capacity. Thus, the material retains its efficacy for repeated CO2 capture cycles. The sample by impregnation in the solution with a lower concentration is richer in Li2SiO3, so its adsorption capacity was relatively low (10% weight), but sample 2-Fib, obtained from the saturated solution showed an enhanced adsorption capacity (ca. 31% wt.) with a 100% regeneration capacity in the first two cycles. Therefore, when working with fibers as a precursor material, the mixing method is crucial, and the key factor to achieve the optimal results. The impregnation method solves the problem of homogeneity of lithium on the fibers before calcination, conferring the proper proportion of lithium orthosilicate after calcination and hence, is the best performance when adsorbing and regenerating the sample.
4. Conclusions
Lithium silicate solid porous membranes obtained from thin silica fibers produced by continuous laser supersonic fiberizing and, subsequently, reacted with lithium hydroxide powder demonstrated a high CO2 adsorption and regeneration capacity. The lithium-to-silicon ratio was critically determined to be the key factor in synthesizing a sample exhibiting both high adsorption and regeneration capacities. The homogeneous mixture of the compounds giving this optimal Li/Si ratio can be obtained using the impregnation method with a saturated solution of lithium hydroxide. Particularly, the fibers that were impregnated by a lithium hydroxide saturated solution and calcined at 900 °C, demonstrated the best results. This method led to a sample which, after calcination, is composed mainly of a lithium orthosilicate phase. The performance of these fibers was superior since they adsorbed CO2 at 31% wt. and presented a total regeneration capacity.
Lithium orthosilicate fibers are a promising technology for CO2 capture since they demonstrate high adsorption and regeneration capacity. Moreover, they form 3D porous membranes due to their singular shape, which allows them to be directly used as filters without pelletizing and prevents major agglomeration since the material will not collapse. Further investigation into the cyclic behavior of this material is required, as well as testing under realistic conditions, to examine the feasibility of the fibers for potential applications such as in a reactor at a thermal power station.
Supplementary Materials
The following supporting information can be downloaded at: https://www.mdpi.com/article/10.3390/fib13050059/s1, Figure S1: Picture of the experimental system developed for the Cofiblas process.
Author Contributions
Conceptualization, F.Q., J.P. (Joaquín Penide) and J.P. (Juan Pou); methodology, J.P. (Joaquín Penide) and E.S.; formal analysis, F.Q., D.P. and J.P (Juan Pou); investigation, J.P. (Joaquín Penide), E.S., J.d.V., R.C. and F.L.; writing—original draft preparation, J.P. (Joaquín Penide), E.S. and F.Q.; writing—review and editing, D.P. and J. Pou; supervision, F.Q., D.P. and J P. (Juan Pou); project administration, J.P. (Juan Pou); funding acquisition, A.R. and J.P. (Juan Pou). All authors have read and agreed to the published version of the manuscript.
Funding
This work was partially supported by the Government of Spain [PID2020-117900RB-I00 (MCI/AEI/FEDER, UE)] and by Xunta de Galicia (ED431C 2023/25). E.S. acknowledges the financial support of DEL NI for a PhD studentship.
Data Availability Statement
The raw data supporting the conclusions of this article will be made available by the authors on request.
Acknowledgments
The technical staff from CACTI (University of Vigo) is gratefully acknowledged.
Conflicts of Interest
The authors declare no conflicts of interest.
Abbreviations
The following abbreviations are used in this manuscript:
| Cofiblas | Continuous fiberizing by laser melting |
| CCS | Carbon Capture and Storage |
| XRD | X-Ray Diffraction analysis |
| SEM | Scanning Electron Microscope |
| TGA | Thermogravimetric analyses |
References
- Rackley, S.A. Carbon Capture and Storage, 1st ed.; Butterworth-Heinemann: Burlington, MA, USA, 2010; ISBN 9781856176361. [Google Scholar]
- IEA. Net Zero Roadmap: A Global Pathway to Keep the 1.5 °C Goal in Reach; IEA: Paris, France, 2023.
- IPCC 2022 Climate Change 2022-Mitigation of Climate Change: Working Group III Contribution to the Sixth Assessment Report of the Intergovernmental Panel on Climate Change; Cambridge University Press (CUP): Cambridge, UK, 2023; ISBN 9789291691609.
- Rochelle, G.T. Amine Scrubbing for CO2 Capture. Science 2009, 325, 1652–1654. [Google Scholar] [CrossRef] [PubMed]
- Chen, E.; Zhang, Y.; Lin, Y.; Nielsenb, P.; Rochelle, G. Review of Recent Pilot Plant Activities with Concentrated Piperazine. Energy Procedia 2017, 114, 1110–1127. [Google Scholar] [CrossRef]
- Song, Z.; Dong, Q.; Xu, W.L.; Zhou, F.; Liang, X.; Yu, M. Molecular Layer Deposition-Modified 5A Zeolite for Highly Efficient CO2 Capture. ACS Appl. Mater. Interfaces 2018, 10, 769–775. [Google Scholar] [CrossRef] [PubMed]
- Mahinpey, N.; Karami, D.; Labbaf, B. 11-Zeolites and Their Composites for CO2 Adsorption. In CO2-philic Polymers, Nanocomposites and Chemical Solvents; Kumar Nadda, A., Sharma, S., Kalia, S., Eds.; Elsevier: Amsterdam, Netherlands, 2023; pp. 271–288. ISBN 978-0-323-85777-2. [Google Scholar]
- Wang, J.; Huang, L.; Yang, R.; Zhang, Z.; Wu, J.; Gao, Y.; Wang, Q.; O’Hare, D.; Zhong, Z. Recent Advances in Solid Sorbents for CO2 Capture and New Development Trends. Energy Environ. Sci. 2014, 7, 3478–3518. [Google Scholar] [CrossRef]
- Armutlulu, A.; Naeem, M.A.; Liu, H.J.; Kim, S.M.; Kierzkowska, A.; Fedorov, A.; Müller, C.R. Multishelled CaO Microspheres Stabilized by Atomic Layer Deposition of Al2O3 for Enhanced CO2 Capture Performance. Adv. Mater. 2017, 29, 1–9. [Google Scholar] [CrossRef] [PubMed]
- Qi, G.; Fu, L.; Choi, B.H.; Giannelis, E.P. Efficient CO2 Sorbents Based on Silica Foam with Ultra-Large Mesopores. Energy Environ. Sci. 2012, 5, 7368–7375. [Google Scholar] [CrossRef]
- Shi, Y.; Ni, R.; Zhao, Y. Review on Multidimensional Adsorbents for CO2 Capture from Ambient Air: Recent Advances and Future Perspectives. Energy Fuels 2023, 37, 6365–6381. [Google Scholar] [CrossRef]
- Zou, L.; Sun, Y.; Che, S.; Yang, X.; Wang, X.; Bosch, M.; Wang, Q.; Li, H.; Smith, M.; Yuan, S.; et al. Porous Organic Polymers for Post-Combustion Carbon Capture. Adv. Mater. 2017, 29, 1700229. [Google Scholar] [CrossRef]
- Nair, B.N.; Burwood, R.P.; Goh, V.J.; Nakagawa, K.; Yamaguchi, T. Lithium Based Ceramic Materials and Membranes for High Temperature CO2 Separation. Prog. Mater. Sci. 2009, 54, 511–541. [Google Scholar] [CrossRef]
- Zhang, Y.; Gao, Y.; Pfeiffer, H.; Louis, B.; Sun, L.; O’Hare, D.; Wang, Q. Recent Advances in Lithium Containing Ceramic Based Sorbents for High-Temperature CO2 Capture. J. Mater. Chem. A 2019, 7, 7962–8005. [Google Scholar] [CrossRef]
- Hu, Y.; Liu, W.; Yang, Y.; Qu, M.; Li, H. CO2 Capture by Li4SiO4 Sorbents and Their Applications: Current Developments and New Trends. Chem. Eng. J. 2019, 359, 604–625. [Google Scholar] [CrossRef]
- Yan, X.; Li, Y.; Ma, X.; Zhao, J.; Wang, Z. Performance of Li4SiO4 Material for CO2 Capture: A Review. Int. J. Mol. Sci. 2019, 20, 928. [Google Scholar] [CrossRef]
- Kato, M.; Nakagawa, K.; Essaki, K.; Maezawa, Y.; Takeda, S.; Kogo, R.; Hagiwara, Y. Novel CO2 Absorbents Using Lithium-Containing Oxide. Int. J. Appl. Ceram. Technol. 2005, 2, 467–475. [Google Scholar] [CrossRef]
- Duan, Y.; Pfeiffer, H.; Li, B.; Romero-Ibarra, I.C.; Sorescu, D.C.; Luebke, D.R.; Halley, J.W. CO2 Capture Properties of Lithium Silicates with Different Ratios of Li2O/SiO2: An Ab Initio Thermodynamic and Experimental Approach. Phys. Chem. Chem. Phys. 2013, 15, 13538–13558. [Google Scholar] [CrossRef] [PubMed]
- Kato, M.; Yoshikawa, S.; Nakagawa, K. Carbon Dioxide Absorption by Lithium Orthosilicate in a Wide Range of Temperature and Carbon Dioxide Concentrations. J. Mater. Sci. Lett. 2002, 21, 485–487. [Google Scholar] [CrossRef]
- Bhatta, L.K.G.; Subramanyam, S.; Chengala, M.D.; Olivera, S.; Venkatesh, K. Progress in Hydrotalcite like Compounds and Metal-Based Oxides for CO2 Capture: A Review. J. Clean. Prod. 2015, 103, 171–196. [Google Scholar] [CrossRef]
- Luo, G.; Chen, J.; Wang, J.; Zhu, B.; Xu, M.; Yang, Y.; Sun, Y. Enhancement of CO2 Adsorption Performance and Widening of Adsorption Temperature Window by Co-Doping Different Valence State Metals on the Li4SiO4 (010) Surface. Ceram. Int. 2024, 50, 9293–9306. [Google Scholar] [CrossRef]
- Amorim, S.M.; Domenico, M.D.; Dantas, T.L.P.; José, H.J.; Moreira, R.F.P.M. Lithium Orthosilicate for CO2 Capture with High Regeneration Capacity: Kinetic Study and Modeling of Carbonation and Decarbonation Reactions. Chem. Eng. J. 2016, 283, 388–396. [Google Scholar] [CrossRef]
- Nambo, A.; He, J.; Nguyen, T.Q.; Atla, V.; Druffel, T.; Sunkara, M. Ultrafast Carbon Dioxide Sorption Kinetics Using Lithium Silicate Nanowires. Nano Lett. 2017, 17, 3327–3333. [Google Scholar] [CrossRef]
- Subha, P.V.; Nair, B.N.; Mohamed, A.P.; Anilkumar, G.M.; Warrier, K.G.K.; Yamaguchi, T.; Hareesh, U.S. Morphologically and Compositionally Tuned Lithium Silicate Nanorods as High-Performance Carbon Dioxide Sorbents. J. Mater. Chem. A 2016, 4, 16928–16935. [Google Scholar] [CrossRef]
- Puccini, M.; Stefanelli, E.; Seggiani, M.; Vitolo, S. Removal of CO2 from Flue Gas at High Temperature Using Novel Porous Solids. Chem. Eng. Trans. 2016, 47, 139–144. [Google Scholar] [CrossRef]
- Subha, P.V.; Nair, B.N.; Hareesh, P.; Mohamed, A.P.; Yamaguchi, T.; Warrier, K.G.K.; Hareesh, U.S. Enhanced CO2 Absorption Kinetics in Lithium Silicate Platelets Synthesized by a Sol–Gel Approach. J. Mater. Chem. A 2014, 2, 12792–12798. [Google Scholar] [CrossRef]
- Hu, Y.; Lu, H.; Li, H. Li4SiO4 Pellets Templated by Rice Husk for Cyclic CO2 Capture: Insight into the Modification Mechanism. Ceram. Int. 2021, 47, 32060–32067. [Google Scholar] [CrossRef]
- Kim, H.; Jang, H.D.; Choi, M. Facile Synthesis of Macroporous Li4SiO4 with Remarkably Enhanced CO2 Adsorption Kinetics. Chem. Eng. J. 2015, 280, 132–137. [Google Scholar] [CrossRef]
- Quintero, F.; Penide, J.; Riveiro, A.; del Val, J.; Comesaña, R.; Lusquiños, F.; Pou, J. Continuous Fiberizing by Laser Melting (Cofiblas): Production of Highly Flexible Glass Nanofibers with Effectively Unlimited Length. Sci. Adv. 2020, 6, eaax7210. [Google Scholar] [CrossRef] [PubMed]
- Penide, J.; Quintero, F.; Fernández, J.L.; Fernández-Arias, M.; Barciela, R.; del Val, J.; Lusquiños, F.; Pou, J. Anamorphic Beam Shaping System Designed to Optimize Irradiance Distribution in the Cofiblas Process for Glass Nanofibers Production. Opt. Lasers Eng. 2022, 152, 106972. [Google Scholar] [CrossRef]
- Degen, T.; Sadki, M.; Bron, E.; König, U.; Nénert, G. The HighScore Suite. Powder Diffr. 2014, 29, S13–S18. [Google Scholar] [CrossRef]
- Rietveld, H.M. A Profile Refinement Method for Nuclear and Magnetic Structures. J. Appl. Crystallogr. 1969, 2, 65–71. [Google Scholar] [CrossRef]
- Zhao, P.; Lu, L.; Liu, X.; De La Torre, A.G.; Cheng, X. Error Analysis and Correction for Quantitative Phase Analysis Based on Rietveld-Internal Standard Method: Whether the Minor Phases Can Be Ignored? Crystals 2018, 8, 110. [Google Scholar] [CrossRef]
- Essaki, K.; Nakagawa, K.; Kato, M.; Uemoto, H. CO 2 Absorption by Lithium Silicate at Room Temperature. J. Chem. Eng. JAPAN 2004, 37, 772–777. [Google Scholar] [CrossRef]
- Wu, X.; Wen, Z.; Xu, X.; Wang, X.; Lin, J. Synthesis and Characterization of Li4SiO4 Nano-Powders by a Water-Based Sol-Gel Process. J. Nucl. Mater. 2009, 392, 471–475. [Google Scholar] [CrossRef]
- Venegas, M.J.; Fregoso-Israel, E.; Escamilla, R.; Pfeiffer, H. Kinetic and Reaction Mechanism of CO2 Sorption on Li 4SiO4: Study of the Particle Size Effect. Ind. Eng. Chem. Res. 2007, 46, 2407–2412. [Google Scholar] [CrossRef]
- Thommes, M.; Kaneko, K.; Neimark, A.V.; Olivier, J.P.; Rodriguez-Reinoso, F.; Rouquerol, J.; Sing, K.S.W. Physisorption of Gases, with Special Reference to the Evaluation of Surface Area and Pore Size Distribution (IUPAC Technical Report). Pure Appl. Chem. 2015, 87, 1051–1069. [Google Scholar] [CrossRef]
- Gray, M.L.; Champagne, K.J.; Fauth, D.; Baltrus, J.P.; Pennline, H. Performance of Immobilized Tertiary Amine Solid Sorbents for the Capture of Carbon Dioxide. Int. J. Greenh. Gas Control 2008, 2, 3–8. [Google Scholar] [CrossRef]
- Sanna, A.; Ramli, I.; Mercedes Maroto-Valer, M. Development of Sodium/Lithium/Fly Ash Sorbents for High Temperature Post-Combustion CO2 Capture. Appl. Energy 2015, 156, 197–206. [Google Scholar] [CrossRef]
- Shan, S.; Jia, Q.; Jiang, L.; Li, Q.; Wang, Y.; Peng, J. Novel Li4SiO4-Based Sorbents from Diatomite for High Temperature CO2 Capture. Ceram. Int. 2013, 39, 5437–5441. [Google Scholar] [CrossRef]
- Rao, G.J.; Mazumder, R.; Bhattacharyya, S.; Chaudhuri, P. Synthesis, CO2 Absorption Property and Densification of Li4SiO4 Powder by Glycine-Nitrate Solution Combustion Method and Its Comparison with Solid State Method. J. Alloys Compd. 2017, 725, 461–471. [Google Scholar] [CrossRef]
- Izquierdo, M.T.; Turan, A.; García, S.; Maroto-Valer, M.M. Optimization of Li4SiO4 Synthesis Conditions by a Solid State Method for Maximum CO2 Capture at High Temperature. J. Mater. Chem. A 2018, 6, 3249–3257. [Google Scholar] [CrossRef]


Disclaimer/Publisher’s Note: The statements, opinions and data contained in all publications are solely those of the individual author(s) and contributor(s) and not of MDPI and/or the editor(s). MDPI and/or the editor(s) disclaim responsibility for any injury to people or property resulting from any ideas, methods, instructions or products referred to in the content. |
© 2025 by the authors. Licensee MDPI, Basel, Switzerland. This article is an open access article distributed under the terms and conditions of the Creative Commons Attribution (CC BY) license (https://creativecommons.org/licenses/by/4.0/).