Abstract
The combined use of macro-synthetic fibers and traditional steel reinforcement in structural concrete shows promise for enhancing shear behavior, particularly with respect to crack control, ductility, and potentially strength. However, experimental data on such systems remain scarce, especially for elements subjected to pure in-plane shear, where the interaction between fibers and conventional reinforcement is not well understood. This study contributes essential experimental evidence toward addressing this gap. Nine reinforced concrete panels were tested under monotonic in-plane shear, with transverse reinforcement ratios ranging from ρv = 0% to 0.91%, and macro-synthetic fiber contents from Vf = 0% to 0.52% by volume. Results showed that fibers were highly effective in reducing crack widths at low reinforcement levels. For specimens with ρv = 0.34%, increasing Vf from 0% to 0.52% halved the maximum crack width (from 0.6 mm to 0.3 mm) and reduced the average crack width by 22% (from 0.32 mm to 0.25 mm). Potential ductility improvements were also detected at low reinforcement ratios, with increased shear strain capacities observed as fiber content increased. In contrast, the influence of fibers on shear strength was minimal across all reinforcement levels. These findings highlight the potential of macro-synthetic fibers to enhance the performance of shear-critical elements, particularly in lightly reinforced systems, while also illustrating the need for further experimental and numerical work. The results presented here provide a fundamental dataset that can support future efforts to develop reliable assessment and design approaches accounting for the simultaneous presence of steel reinforcement and synthetic fibers in concrete elements subjected to shear.
1. Introduction
The use of fibers in structural concrete has attracted sustained research attention for over half a century, primarily due to their benefits in enhancing tensile strength, ductility, crack resistance, and durability. Since the early 1960s, considerable experimental efforts have focused on fiber-reinforced concrete (FRC), particularly steel fiber-reinforced concrete (SFRC), investigating parameters such as fiber type, volume fraction, aspect ratio, and the presence of longitudinal reinforcement in influencing flexural and shear behavior (e.g., [1]). A critical milestone was the revision of ACI 318-08, which, based on an extensive database compiled by Parra-Montesinos [2], permitted the elimination of minimum shear reinforcement in SFRC beams containing ≥0.75% fiber volume. This was a pivotal development, underpinned by data from 147 beam tests demonstrating that such configurations consistently exceeded a shear strength threshold of 3.5 (psi).
Despite the significant advances made in SFRC design provisions, growing interest in non-metallic alternatives, particularly macro-synthetic fibers, has expanded the scope of fiber-reinforced concrete research. These fibers, while offering advantages such as corrosion resistance and improved durability, are typically used at lower volume fractions and often serve as secondary reinforcement. Their role in improving post-cracking behavior, tensile strength, and crack control is increasingly recognized, and recent studies have begun to explore their structural contributions beyond serviceability limits.
However, the existing body of research reveals a notable imbalance: while substantial work has examined FRC members without stirrups, significantly less is known about how fibers, especially macro-synthetic ones, interact with conventional transverse reinforcement (see Figure 1, data from [3]).
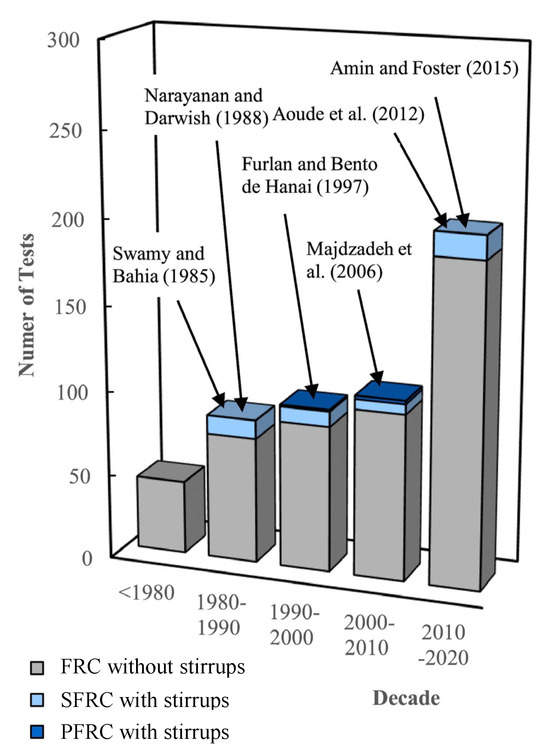
Figure 1.
Tests of fiber-reinforced concrete beams (data from [3]).
Notable research efforts dedicated to investigating the shear response of macro-synthetic fiber-reinforced concrete beams without stirrups include those by [4,5,6,7,8,9,10,11]. These studies primarily examined the influence of fiber type, dosage, aspect ratio, and distribution on shear capacity and crack behavior in the absence of traditional shear reinforcement. Key findings highlight the benefits listed earlier, such as the ability of macro-synthetic fibers to bridge shear cracks and delay failure, with effectiveness strongly dependent on fiber content and matrix properties. Several authors also noted enhanced post-cracking ductility and energy absorption compared to plain concrete beams.
In contrast, the shear behavior of elements containing both steel shear reinforcement and macro-synthetic fibers has been studied by authors such as [12,13,14,15,16,17,18,19,20]. These works explored hybrid action mechanisms, assessing parameters such as stirrup spacing, fiber dosage, and longitudinal reinforcement. The results generally indicate a synergistic interaction between fibers and stirrups, leading to improved crack control, increased shear capacity, and in some cases, a reduction in required stirrup content. However, the degree of interaction varies depending on fiber efficiency and the failure mode (diagonal tension vs. shear compression). For instance, Majdzadeh et al. [15] reported that combining 0.5% macro-synthetic fibers with a transverse reinforcement ratio of 0.28% increased shear capacity beyond the sum of their individual contributions. Nonetheless, these findings remain scattered and inconsistent, limiting fundamental understanding and, in turn, the development of predictive models or reliable design guidance.
From a careful analysis of the available literature, three main research gaps emerge:
- Insufficient experimental data on the combined action of fibers and stirrups, particularly using macro-synthetic fibers at realistic volume fractions (<0.75%).
- Lack of studies employing pure shear loading, which is essential to decouple shear effects from flexure and more clearly isolate the fiber contribution.
- Absence of comparative assessments between experimental outcomes and existing shear strength prediction models or code provisions for hybrid fiber-stirrup systems.
This study seeks to contribute towards addressing these deficiencies, by generating fundamental experimental data on the shear behavior of concrete elements reinforced with both macro-synthetic fibers and conventional stirrups. An experimental program comprising nine panel specimens tested under pure shear was carried out using the University of Washington’s Panel Element Tester, a specialized apparatus capable of applying controlled in-plane stress states. This setup enables isolation of shear mechanisms and offers insights unattainable from conventional beam testing.
The study explores the effects of varying fiber volume fractions (0%, 0.26%, and 0.52%) and transverse reinforcement ratios (0% to 0.91%) on shear strength and failure mechanisms, thereby contributing essential data for future design guidance. In addition, the results are critically compared against predictions from selected design codes to assess their applicability to fiber-stirrup hybrid systems.
2. Experimental Program
The objective of the experimental program described in this paper was to elucidate the contributions and benefits, with respect to shear response, of macro-synthetic fiber reinforcement when used in combination with steel deformed bars. Table 1 shows the test matrix of the experimental program alongside the variables of interest that include the transverse reinforcement ratio, ρv (area of deformed bar/panel cross section area) and the macro-synthetic fiber volume fraction, Vf (fiber volume/total volume). A 3 × 3 experimental design was selected to enable the quantification of interactions between the primary variables and ample coverage of the region of interest.

Table 1.
Test matrix, test variables, and specimen designations.
The selected fiber volume fractions were consistent with what is currently used in practice. The minimum effective fiber dosage recommended by the Steel Deck Institute for composite slabs is 2.4 kg/m3 [21], which corresponds to 0.26% fibers by volume for the specific fibers used in this study. In addition to the panel specimens, companion cylinders and beams were also cast at the same time as each of the panels to measure the concrete material properties, including compressive strength, the modulus of elasticity, and flexural strength and toughness properties for each batch of concrete used.
2.1. Specimen and Material Properties
A total of nine panels were fabricated. The specimens were all nominally identical in dimensions, measuring 890 mm × 890 mm × 70 mm. Figure 2 shows the selected reinforcement layouts for the panel specimens. For all configurations, the longitudinal reinforcement ratio was held constant at ρℓ = 2.28%. This specific ratio was carefully selected to ensure that the structural response would be dominated by transverse behavior, thereby intentionally promoting failure in the transverse direction, and precluding early onset of biaxial yielding. The chosen reinforcement ratio reflects a deliberate design decision grounded in both prior experimental experience with comparably detailed specimens and established recommendations in the literature (e.g., [22,23]). Maintaining ρℓ at 2.28% thus aligns with best practices for isolating shear failure mechanisms involving exclusively combinations of strut crushing, transverse reinforcement yielding and aggregate interlock failure.
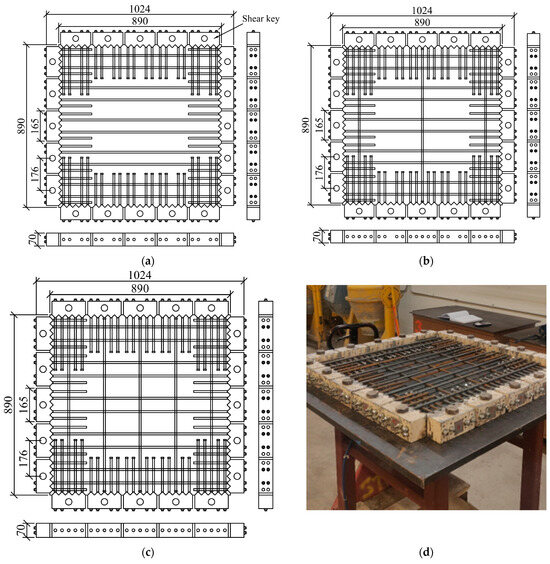
Figure 2.
Reinforcement layout (dimensions in mm): (a) ρℓ = 2.28% and ρv = 0%, (b) ρℓ = 2.28% and ρv = 0.34%, (c) ρℓ = 2.28% and ρv = 0.91%, (d) Photo of representative reinforcement layout.
In the transverse direction, the spacing of the continuous reinforcement varied between panels, from ρv = 0.34% to ρv = 0.91%, with three unreinforced specimens (ρv = 0%) acting as benchmarks. The selected reinforcement levels were chosen to span a representative and practical range, encompassing both moderate and relatively high reinforcement scenarios while remaining within the reinforcement detailing capabilities of the panel tester. Importantly, the selected values align with the minimum and maximum transverse reinforcement limits prescribed by ACI 318-19 for non-prestressed concrete beams [24]. For instance, assuming a concrete compressive strength of f’c = 41.4 MPa and a transverse reinforcement yield strength of fyt = 414 MPa, ACI 318-19 permits transverse reinforcement ratios between approximately ρv = 0.1% and ρv = 1.0%. The selected range of ρv = 0.34% to 0.91% thus falls well within these design bounds, ensuring regulatory relevance while capturing meaningful differences in structural performance due to variations in transverse reinforcement. This range also reflects a balance between code-compliant detailing and the geometric and mechanical limitations inherent to the panel test setup. All reinforcement for the project was A706 Gr 60 [25] No. 3 (nominal diameter of 9.5 mm) deformed steel bars from the same heat. The mechanical properties were obtained from laboratory testing. Strains were measured using an extensometer with a 51 mm gauge length. The response of the five samples tested were similar. The average yield stress for all the samples was 512 MPa with a standard deviation of 12 MPa, and the average ultimate stress for the samples was 698 MPa with a standard deviation of 3 MPa. The extensometer was removed just prior to bar fracture; therefore, the fracture strain was not directly measured. However, the lowest last reliable strain reading for the five samples prior to fracture was 0.18 mm/mm.
Table 2 summarizes the concrete mixture proportions for the panel specimens. To accommodate wetting the surface area of the macro-synthetic fibers, the mixture design without fibers (M1) for panels PFRC-000-000, PFRC-000-034, and PFRC-000-091 was modified by replacing three fiber volumes of fine aggregate with one fiber volume of fibers and two fiber volumes of coarse aggregate (M2 for panels PFRC-026-000, PFRC-026-034, and PFRC-026-091 and M3 for panels PFRC-052-000, PFRC-052-034, and PFRC-052-091). This practice has been found to help maintain workability when macro-synthetic fibers are added to a conventional concrete mixture design. The original mixture design was selected in coordination with CalPortland, a regional ready mixed concrete supplier, who donated the aggregate from their aggregate plant in Dupont, WA. The fine aggregate was washed building sand, conforming to ASTM C33 [26], and the coarse aggregate was washed 10 mm pea gravel, conforming to ASTM C33 No. 8 [26]. Selecting a commercially available concrete mixture and procuring aggregate from their plant was advantageous to ensure that the research results were consistent, scalable, and reflected current practice.
Table 2.
Concrete mixture design for panel specimens.
To accompany the panel elements, cylinders (100 mm × 200 mm) and beams (100 mm × 100 mm × 355 mm and 150 mm × 150 mm × 530 mm) were cast at the same time as the panel elements and tested to determine the key mechanical properties of the concrete (see [27]). The companion specimens’ experimental setup is outlined in Figure 3.
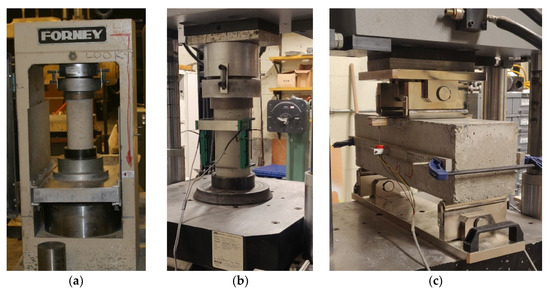
Figure 3.
Material testing: (a) compressive strength; (b) compressive modulus; (c) flexural strength and toughness.
Concrete compressive strength was determined following the procedures in ASTM C39 [28], elastic modulus was determined following the procedures in ASTM C469 [29], and flexural strength and residual strength values were determined following the procedures in ASTM C1609 [30]. Each value was recorded as the average of at least two measurements. For non-fiber-reinforced specimens, the modulus of rupture was determined following the procedures in ASTM C78 [31].
The target compressive strength for all three mixture designs was 41.4 MPa and the average measured test day compressive strength was 37.2 MPa with a standard deviation of 5.6 MPa (15% COV). Some of this variability was expected due to the different ages of the specimens on test day, which varied between 28 and 134 days due to the project schedule. There was no observed difference in the test day strength between the three fiber levels. The measured values of the modulus of elasticity were consistent with the measured compressive strengths, generally within 10% of the values estimated using ACI 318 19.2.2.1(b) ( = 4700 MPa). The measured modulus of rupture values for the 100 mm beam specimens were consistently higher (by roughly 20%) than the values predicted using ACI 318 19.2.3.1 ( = 0.62 MPa). The consistently higher measured strengths in comparison with the code estimates were largely attributed to size effects since the tested beams were smaller in depth and width than the standard (150 mm) beams and smaller beams have been demonstrated to have higher modulus of rupture values for the same maximum aggregate size (e.g., [32]). The modulus of rupture values for the 150 mm beams, where available, were more consistent with the code estimates. For details on construction sequence, mixing procedures and concrete curing, interested readers can refer to [27]. The companion specimen strength values collected on test day of each panel element are summarized in Table 3, where fc is the concrete compressive strength, is the modulus of elasticity and ff is the flexural strength.
Table 3.
Companion specimen properties on panel test day.
Finally, Table 4 gives the properties of the macro-synthetic fibers that were used in this project (STRUX 90/40). The virgin polypropylene and polyethylene blend fibers were from the same lot, straight, and rectangular in cross-section. These fibers were selected due to their high modulus and successful use in several previous tests of structural members. GCP Applied Technologies donated the fibers and concrete admixtures that were used for the project. The fibers complied with ASTM D7508 [33] and have been evaluated by the ICC (ESR-2942).
Table 4.
Fiber properties for panel specimens.
2.2. Test Setup, Instrumentation and Loading
All experiments were conducted at the UW SETL in Seattle, WA. Figure 4a shows a schematic of the UW SETL Panel Element Tester, an advanced apparatus that can apply any combination of in-plane stresses to planar reinforced concrete elements. The panel specimens, measuring 890 mm × 890 mm × 70 mm, were connected to the Panel Element Tester through “toothed” anchor blocks affixed to the concrete panel. Each deformed bar embedded in the panel concrete was threaded at its ends, passed through the steel anchor blocks, and anchored to the blocks using nuts. The anchor blocks connected to the Panel Element Tester through 20 vertical and 20 horizontal links. Of these 40 links, 37 were connected to 267 kN hydraulic actuators (blue and green arrows in Figure 4a) and 3 were fixed (yellow rectangles in Figure 4a) to act as supports. Forces from the actuators were resisted by a stiff reaction frame and a restraint system on the back side of the panel, between the anchor blocks and the rigid frame, prevented out-of-plane movement. Pressure transducers were used to measure forces produced by the actuators. The deformations in the panels were monitored using non-contact instrumentation and affixed displacement transducers.
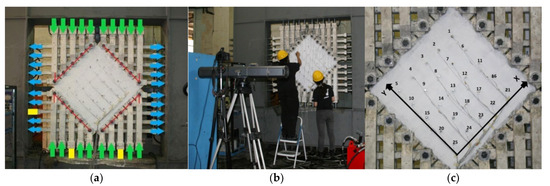
Figure 4.
Experimental setup: (a) Panel Element Tester (b) LED camera setup (c) LED target layout with target numbers and coordinate system annotated.
Figure 4b,c show the non-contact instrumentation that was used on the front (bottom casting surface) of the panel specimens. The location of infrared LED targets adhered to the surface of the panel were resolved in three-dimensional space using an OptoTrak camera (NDI, Waterloo, Canada) and corresponding software. The LED targets were placed in a 5 × 5 grid spaced evenly across the 540 mm × 540 mm) test region, resulting in a 135 mm × 135 mm grid. The OptoTrak camera was set up directly in front of the panel with good line of sight on all the targets. The output from the system was the x-, y-, and z-coordinates of the targets in the camera’s coordinate system, which was collected at a rate of 10 Hz.
The LED readings were processed to obtain both global and local strains. In general, the strains of any quadrilateral element defined by a group of four LED targets were computed employing the following equations [34]:
where is the x-displacement of node i between two consecutive measurements and is the analogous displacement in the y-direction. Parameters and are the dimensions of the quadrilateral element considered, in the x- and y-directions, respectively. The element nodes are defined counterclockwise starting from the bottom-left node as shown in Figure 5. The global strains were calculated using the position of LED targets 1, 5, 21 and 25, identified in Figure 4c.
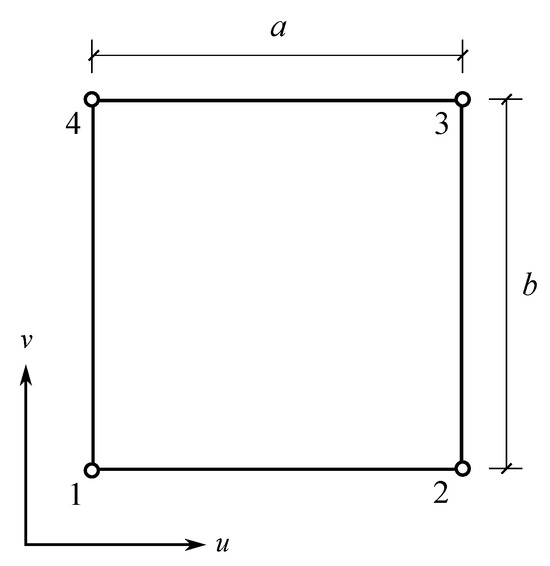
Figure 5.
Geometry of quadrilateral element used to perform strain calculations.
The specimens were loaded in increments, increasing the hydraulic pressure until panel failure. Loading was paused at regular intervals during testing, at first cracking and then at specified load levels, to document crack propagation, spacing, and crack widths. At each load level, visible cracks were identified with marker, measured using a crack comparator, and photographed.
3. Experimental Results
The results of the experiments conducted are examined in this section. Figure 6 shows the normalized shear stress-global shear strain behavior for all nine panel specimens. Backbone curves were developed for each panel from the computed shear stress and global shear strain data by extracting the point at first cracking, the maximum stress reached at the end of each load increment, and the failure point. Additional points were selected at the midpoint of each load increment. To allow comparisons between the tests, the applied shear stress for each panel was normalized by the square root of the compressive strength of the panel concrete (values in Table 3). In general, the panels all had cracking stresses around 0.3 (average of 0.28 with a COV of 14%) and panels with higher transverse reinforcement ratios exhibited greater shear strengths, as anticipated.
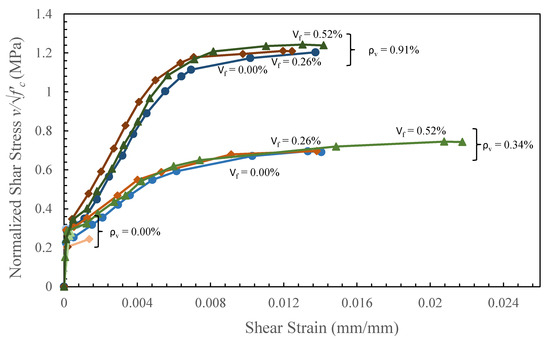
Figure 6.
Normalized shear stress-global shear strain behavior for all panels (stress in MPa).
It is evident that the shear reinforcement played a predominant role, significantly increasing the strength and deformation capacity of the specimens. Regardless of fiber content, the panels with no shear reinforcement exhibited normalized shear strength in the order of 0.28, with average shear strain at peak stress of 0.8 × 10⁻³ mm/mm. In contrast, panels with transverse steel bars displayed average normalized strengths of 0.72 and 1.22, for reinforcement ratios of 0.34% and 0.91%, respectively, with corresponding shear strain at failure in the order of 0.014 mm/mm.
It is also observed that the inclusion of fibers resulted in only minor to negligible increases in peak strength across all specimens. For example, increasing the fiber volume fraction from 0% to 0.52% led to a normalized strength increase of just 7% (from 0.70 to 0.75) in the panel with a transverse reinforcement ratio of 0.34%, and an even smaller increase of 3% (from 1.20 to 1.24) in the panel with a ρv of 0.91%. Table 5 summarizes key results from the test series including the cracking shear stress (νcr) and strain (γcr) and values of the shear stress (νu), shear strain (γxy), normal strains (εx and εy), concrete principal stresses (fc1 and fc2), concrete principal strains (ε1 and ε2), reinforcement stresses (fsx and fsy), crack width (wm), and crack spacing (sm) at the final load stage before failure for all nine panels. The strain and stress values reported were estimated from the measured responses of the panel specimens, based on equilibrium, compatibility and assumed stress–strain relationships, as discussed in detail by [35], amongst others.
Table 5.
Summary of key experimental results from panel element tests.
Figure 7 shows photographs of all nine panels after failure. The panels without transverse reinforcement failed due to deterioration of aggregate interlock, while the biaxially reinforced panels specimens failed through yielding of the transverse reinforcement, followed by crack sliding or concrete crushing. Across all specimens, the dominant post-peak mechanism was fiber pull-out rather than fiber rupture, indicating that the bond behavior and matrix-reinforcement interaction governed the energy dissipation mechanisms, rather than the tensile capacity of the fibers themselves.
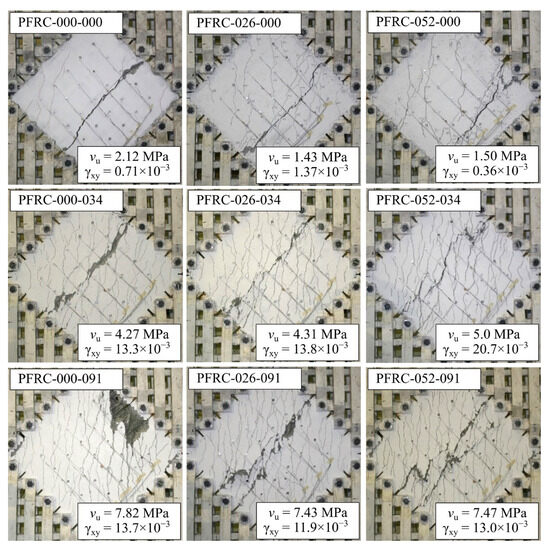
Figure 7.
Photographs of specimens after failure.
The ultimate shear strength of the specimens was analyzed in the context of the two variables considered in this study, namely the transverse reinforcement ratio and the fiber volume ratio.
The normalized shear strength of all nine panels is plotted against the test variables in Figure 8. Also shown is the shear strength of the panels estimated using the ACI 318 one-way shear strength equations [24] assuming a transverse yield stress of fy = 512 MPa, and a concrete compressive strength of f’c = 37 MPa (average of the measured panel material properties). As anticipated, the normalized shear strength at each reinforcement level increased with increasing transverse reinforcement ratio. The increase in strength was consistent with ACI 318 estimates for reinforced concrete elements with transverse reinforcement ratios in the range considered in this study. In contrast, for a given reinforcement ratio, there was no noticeable change in strength with increasing fiber volume fraction, in the range of fiber volume fractions considered in this study (Vf < 0.52%). This is consistent with the observed failure mechanisms, where fibers predominantly pulled out rather than fractured, indicating that their tensile strength was not fully mobilized during loading. Moreover, it is important to note that the strain corresponding to peak fiber engagement is significantly lower than the strain at which peak rebar contribution occurs. This mismatch in strain capacities further explains the limited influence of fibers on the peak strength of the specimens, as their contribution had largely diminished by the time the reinforcement reached its yield capacity.
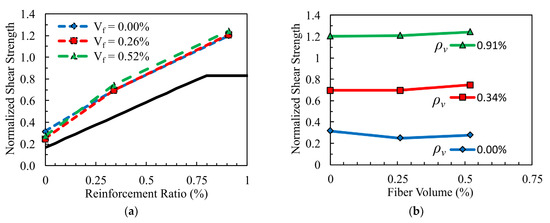
Figure 8.
Normalized shear strength: (a) versus reinforcement ratio; (b) versus fiber volume (stress in MPa).
Figure 9 shows the shear strain at failure for all nine panels plotted against transverse reinforcement ratio and fiber volume ratio. The shear strain at failure increased significantly transitioning from specimens with no shear reinforcement to specimens containing transverse steel bars. In contrast, the addition of fibers to the concrete appeared to have little influence on the shear strain at failure. Both unreinforced panels and heavily reinforced panels (0.91% transverse reinforcement) displayed essentially constant shear strains at failure, despite the addition of fibers. An increase in shear strain at failure was observed for the panel with shear reinforcement ratio of 0.34%, with the addition of macro-synthetic fibers, but overall, no consistent trend was identified.
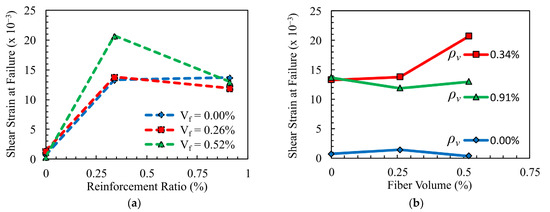
Figure 9.
Shear strain at failure: (a) versus reinforcement ratio; (b) versus fiber volume.
Panel cracking was also affected by the test variables considered. Figure 10 shows the average crack width in each panel containing shear reinforcement (no meaningful data was collected for the unreinforced specimens as they failed abruptly right after first cracking) versus the normalized shear stress. The average crack width was determined considering all cracks, with widths greater than 0.1 mm, that crossed a horizontal line through the diagonal of the 540 mm × 540 mm test region. Since the compressive strength of the panels varied between specimens and cracks were measured at predetermined load levels, linear interpolation was necessary to compare specimens at a particular normalized shear stress.
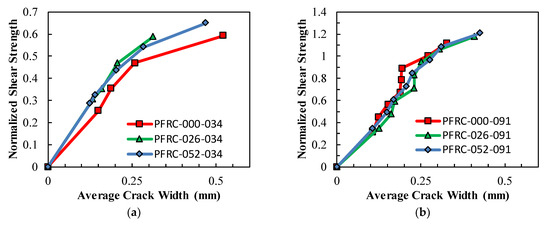
Figure 10.
Average crack width vs. normalized shear stress (stress in MPa): (a) for specimens with a transverse reinforcement ratio of 0.34% (b) for specimens with a transverse reinforcement ratio of 0.91%.
The average crack width decreased as the transverse reinforcement ratio or fiber volume fraction increased, with the transverse reinforcement ratio playing a more marked role. The decrease in average crack width with fiber volume fraction was significant for panels with low reinforcement (i.e., ρv = 0.34%) and negligible for heavily reinforced panels (i.e., ρv = 0.91%).
The maximum crack width, determined as the largest crack occurring within the 540 mm × 540 mm test region, was also examined. Figure 11 shows the maximum crack width in each panel containing shear reinforcement versus the normalized shear stress. The graphs show that the maximum crack width tended to decrease as either the transverse reinforcement ratio or fiber volume increased, following a similar trend to that observed for the average crack width. Significant decrease in maximum crack width was observed with the addition of fibers for lightly reinforced panels, while essentially no difference was detected in the cracking response of panels heavily reinforced in shear, regardless of the volume of fibers.
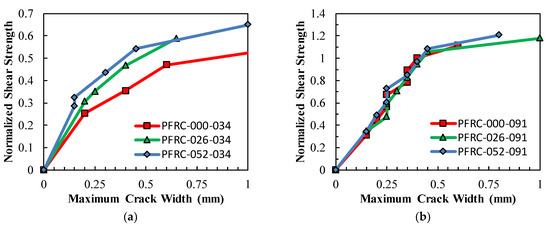
Figure 11.
Maximum crack width vs. normalized shear stress (stress in MPa): (a) for specimens with a transverse reinforcement ratio of 0.34%; (b) for specimens with a transverse reinforcement ratio of 0.91%.
4. Comparison of Observed Strengths to Available Code Equations
Table 6 summarizes the concrete shear strength equations specified in several model codes. These codes were selected because they each handle the presence of fibers differently. Although ACI 318 [24] permits the use of SFRC beams without stirrups if certain criteria are met, it does not quantify the contribution of fiber reinforcement to the strength of structural elements; the shear strength of FRC is conservatively assumed equal to that of conventional concrete. The fib Model Code 2010 [36] shear strength expression does not include a specific term for fiber reinforcement; however, it does include the post cracking strength of the concrete as a design parameter, , which would be influenced by the presence of fibers. AASHTO [37] and CSA [38] are based on a simplified version of the Modified Compression Field Theory (MCFT) [35], proposed by Bentz et al. [39]. These codes do not consider the contribution of fibers to a member’s shear strength, rather the nominal shear resistance is determined as the sum of contributions from the concrete, transverse steel, and prestressing. The EC2 [40] provides two approaches to compute the shear resistance of members with and without transverse reinforcement, respectively. Both do not explicitly consider the fiber contribution to strength. Lastly, the RILEM TC162-TDF Design Method for Steel Fiber Reinforced Concrete [41] explicitly includes the contributions from both concrete and fibers; however, the design recommendations were specifically developed for SFRC and may not be applicable to PFRC due to potentially different post-cracking behaviors of the two types of fiber-reinforced concretes (deflection hardening, if Vf is sufficiently large, versus softening).
Table 6.
Model code equations for the shear strength of SFRC.
Table 7 shows the ratio between the observed strength in the panel tests and the predicted strength from the code equations (summarized in Table 6) as well as the average, standard deviation, and coefficient of variation of the predicted strength ratios. It should be noted that no resistance factors or material factors have been applied to the estimated values (i.e., = 1.0 and = 1.0). Figure 12a shows the predicted shear strength from the code equations versus the observed shear strength. The dashed line indicates a 1:1 relationship, and the shaded area indicates 20% bounds. Figure 12b shows the predicted-to-measured strength ratio from the design code equations versus the fiber volume.
Table 7.
Predicted/observed ratio for considered code equations.
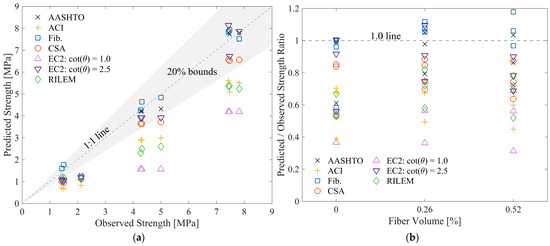
Figure 12.
Observed versus predicted concrete strength for design code equations: (a) predicted versus measured shear strength of panels; (b) predicted-to-measured strength ratio.
As expected, the results show that most codes adopt a conservative stance when estimating the capacity of PFRC panels, though the degree of conservatism and variability varies considerably across methods. Among the codes evaluated, fib Model Code 2010 [36] delivered the most accurate predictions on average, with a mean ratio of 1.00 and a relatively low coefficient of variation (COV) of 17.3%, reflecting good consistency across all specimens. EC2 [40] with cot(θ) = 2.5 followed closely, yielding a slightly conservative average of 0.85 and a COV of 19.6%. This variant of EC2 appears more reliable than its counterpart using cot(θ) = 1.0, which was the most conservative of all codes, underestimating strength with a mean ratio of 0.52 and the highest variability (COV = 28.7%). These findings highlight the sensitivity of EC2 predictions to the assumed shear angle and the potential inadequacy of cot(θ) = 1.0 for PFRC panels. AASHTO LRFD [37] and CSA A23.3 [38] showed moderately conservative estimates, with average ratios of 0.89 and 0.77, respectively, and relatively low dispersion (COVs of 17.4% and 16.0%). ACI 318 [24], in contrast, produced the most conservative predictions overall (mean = 0.60), along with a higher COV (21.1%), indicating both a tendency to underestimate strength and greater variability in predictive quality. The RILEM TC 162-TDF [41] method offered balanced performance, with a mean ratio of 0.65 and one of the lowest COVs (17.5%), suggesting it may be a viable choice for consistent, albeit conservative, estimation.
It is important to note, however, that these conclusions are based on a limited dataset of nine specimens. While the results provide valuable insight into current code performance, they should be regarded as preliminary. The statistical significance of the observed trends is inherently constrained by the sample size, and caution should be exercised when generalizing these findings. Further experimental and numerical investigations are required before a design methodology is definitively identified or calibrated.
5. Summary and Conclusions
This study examined the combined influence of deformed bar reinforcement and macro-synthetic fibers on the in-plane shear behavior of concrete panel elements. The purpose of the experimental campaign was to investigate the use of fiber volume fractions, transverse reinforcement ratios, and concrete mixture designs consistent with current practice, where macro-synthetic fibers are often added to concrete mixtures as secondary reinforcement, designed to control shrinkage, temperature cracks, and improve the durability of structural elements. Nine panels were tested under varying transverse reinforcement ratios (ρv = 0–0.91%) and fiber volume fractions (Vf = 0–0.52%), with companion material tests conducted to determine concrete properties. The following key findings and contributions emerged from the experimental program:
- The addition of macro-synthetic fibers proved effective in reducing both maximum and average shear-induced crack widths in panels with a low transverse reinforcement ratio (ρv = 0.34%). At a shear stress corresponding to approximately 50% of specimen capacity, increasing the fiber volume fraction from 0% to 0.52% reduced the maximum crack width by 50% (from 0.6 mm to 0.3 mm) and the average crack width by 22% (from 0.32 mm to 0.25 mm). This benefit diminished in specimens with higher reinforcement, indicating that the effectiveness of fibers is influenced by the amount of transverse reinforcement present.
- The inclusion of macro-synthetic fibers, at the dosage rates tested, did not result in appreciable increases in shear strength for the PFRC panels tested as part of this study. However, prior beam-based studies (e.g., [6]), have reported shear strength improvements of approximately 20% with similar fiber volumes. These findings suggest that there is a potential strength benefit, or at least no strength penalty, for adding macro-synthetic fibers to control cracking and improve durability, especially for structural elements with low levels of transverse reinforcement.
- The discrepancy between the measured shear strength improvements for PFRC beams and panels likely stems from differences in specimen type and loading conditions (panels under in-plane shear under force control in this study versus beams experiencing combined shear and flexure under displacement control in previous work). It is anticipated that fibers may show greater benefit for improving the flexure-shear strength of beams, versus the web-shear strength. This would be consistent with the existing literature available and may explain the different behaviors observed in this and other testing series.
- The results suggest that the most promising benefits of macro-synthetic fibers occur in concrete panels with fiber volumes ≥ 0.5% and low transverse reinforcement ratios (ρv ≤ 0.5%). Future research should explore a broader range of fiber types (e.g., varying in shape, material, and coating) and concrete mixtures to evaluate the generalizability of these findings and further advance the structural application of PFRC (polymer fiber-reinforced concrete).
- With respect to determining shear strength, the fib MC2010 [36] demonstrated the best overall performance, while ACI 318 [24] and EC2 [40] with cot(θ) = 1.0 tended to significantly underestimate PFRC panel strength. These preliminary findings suggest that for design applications involving PFRC, fib MC2010 offer the most reliable predictions among the codes assessed. Additional work is recommended before definitive conclusions are drawn in this regard.
Author Contributions
Conceptualization, T.T. and P.M.C.; methodology, T.T. and P.M.C.; software, J.P.G. and B.F.F.; validation, B.F.F., T.T. and P.M.C.; formal analysis, J.P.G. and B.F.F.; investigation, J.P.G.; data curation, J.P.G. and B.F.F.; writing—original draft preparation, J.P.G.; writing—review and editing, B.F.F., T.T. and P.M.C.; visualization, J.P.G.; supervision, T.T. and P.M.C.; project administration, T.T. and P.M.C.; funding acquisition, T.T. and P.M.C. All authors have read and agreed to the published version of the manuscript.
Funding
This research was funded by the American Concrete Institute Foundation under its Concrete Research Council (CRC) Program, award CRC 2021 P0047. The opinions, findings and conclusions expressed here are those of the authors alone.
Data Availability Statement
The raw data supporting the conclusions of this article will be made available by the authors upon reasonable request.
Acknowledgments
The authors would like to express their gratitude and appreciation for the in-kind contributions of macro-synthetic fibers and chemical admixtures by GCP Applied Technologies, coarse and fine aggregates by CalPortland, and cement by Lafarge North America.
Conflicts of Interest
The authors declare no conflicts of interest.
References
- Shah, S.P.; Rangan, B.V. Fiber reinforced concrete properties. ACI J. Proc. 1971, 68, 126–137. [Google Scholar] [CrossRef] [PubMed]
- Parra-Montesinos, G.J. Shear strength of beams with deformed steel fibers. Concord Int. 2006, 28, 57–66. [Google Scholar]
- Lantsoght, E.O.L. Database of shear experiments on steel fiber reinforced concrete beams without stirrups. Materials 2019, 12, 917. [Google Scholar] [CrossRef] [PubMed]
- Li, V.C.; Ward, R.; Hamza, A.M. Steel and Synthetic Fibers as Shear Reinforcement. ACI Mater. J. 1992, 89, 499–508. [Google Scholar]
- Greenough, T.; Nehdi, M. Shear behavior of fiber-reinforced self-consolidating concrete slender beams. ACI Mater. J. 2008, 105, 468. [Google Scholar]
- Altoubat, S.; Yazdanbakhsh, A.; Rieder, K.-A. Shear behavior of macro-synthetic fiber-reinforced concrete beams without stirrups. ACI Mater. J. 2009, 106, 381–389. [Google Scholar] [CrossRef]
- Parmentier, B.; Cauberg, N.; Vandewalle, L. Shear resistance of macro-synthetic and steel fibre reinforced concrete beams without stirrups. In Proceedings of the 8th RILEM International Symposium on Fibre Reinforced Concrete: Challenges and Opportunities, Guimaraes, Portugal, 19–21 September 2012. [Google Scholar]
- Sahoo, D.R.; Maran, K.; Kumar, A. Effect of steel and synthetic fibers on shear strength of RC beams without shear stirrups. Constr. Build. Mater. 2015, 83, 150–158. [Google Scholar] [CrossRef]
- Arslan, G.; Keskin, R.S.O.; Ozturk, M. Shear behaviour of polypropylene fibre-reinforced-concrete beams without stirrups. Proc. Inst. Civ. Eng. Struct. Build. 2017, 170, 190–198. [Google Scholar] [CrossRef]
- Murad, Y.; Abdel-Jabbar, H. Shear behavior of RC beams prepared with basalt and polypropylene fibers. Case Stud. Constr. Mater. 2022, 16, e00835. [Google Scholar] [CrossRef]
- Koura, M.M.; Tahwia, A.M.; Matthana, M.H. Influence of macro-synthetic fibers on the flexural behavior of high strength concrete beams reinforced with GFRP bars. Mansoura Eng. J. 2024, 49, 4. [Google Scholar] [CrossRef]
- Narayanan, R.; Darwish, I.Y.S. Use of steel fibers as shear reinforcement. ACI Struct. J. 1987, 84, 216–227. [Google Scholar] [CrossRef] [PubMed]
- Li, V.C.; Mishra, D.K.; Naaman, A.E.; Wight, J.K.; LaFave, J.M.; Wu, H.; Inada, Y. On the Shear Behavior of Engineered Cementitious Composites. Advn Cem. Bas Mater. 1994, 1994, 142–149. [Google Scholar] [CrossRef]
- Furlan, S.; Bento-de-Hanai, J.B. Shear behavior of fiber reinforced concrete beams. Cem. Concr. Comp. 1997, 19, 359–366. [Google Scholar] [CrossRef]
- Majdzadeh, F.; Soeimani, S.M.; Banthia, N. Shear strength of reinforced concrete beams with a fiber concrete matrix. Can. J. Civ. Eng. 2006, 33, 726–734. [Google Scholar] [CrossRef]
- Carnovale, D.; Vecchio, F. Effect of Fiber Material and Loading History on Shear Behavior of Fiber-Reinforced Concrete. ACI Struct. J. 2014, 111, 1235–1244. [Google Scholar] [CrossRef]
- Conforti, A.; Minelli, F.; Tinini, A.; Plizzari, G.A. Influence of polypropylene fibre reinforcement and width-to-effective depth ratio in wide-shallow beams. Eng. Struct. 2015, 88, 12–21. [Google Scholar] [CrossRef]
- Alhassan, M.; Al-Rousan, R.; Ababneh, A. Flexural behavior of lightweight concrete beams encompassing various dosages of macro synthetic fibers and steel ratios. Case Stud. Constr. Mater. 2017, 7, 280–293. [Google Scholar] [CrossRef]
- Navas, F.O.; Navarro-Gregori, J.; Herdocia, G.L.; Serna, P.; Cuenca, E. An experimental study on the shear behaviour of reinforced concrete beams with macro-synthetic fibres. Constr. Build. Mater. 2018, 169, 888–899. [Google Scholar] [CrossRef]
- Farag, B.F.; Thonstad, T.; Calvi, P.M. Numerical modeling of distributed macro-synthetic fiber and deformed bar reinforcement to resist shear. Buildings 2024, 14, 3247. [Google Scholar] [CrossRef]
- SDI. ANSI/SDI C; Standard for Composite Steel Floor Deck—Slabs. Steel Deck Institute: Glenshaw, PA, USA, 2017.
- Calvi, P.M.; Bentz, E.C.; Collins, M.P. Reversed Cyclic Experiments on Shear Stress Transfer across Cracks in Reinforced Concrete Elements. ACI Struct. J. 2016, 113, 851–859. [Google Scholar] [CrossRef]
- Zhang, H.; Calvi, P.M.; Lehman, D.; Kuder, K.; Roeder, C. Response of recycled coarse aggregate concrete subjected to pure shear. J. Struct. Eng. 2020, 146, 04020075. [Google Scholar] [CrossRef]
- ACI; Building Code Requirements for Structural Concrete (ACI 318-19) and Commentary, Committee 318. American Concrete Institute: Farmington Hills, MI, USA, 2019.
- ASTM. A706/A706M; Standard Specification for Deformed and Plain Low-Alloy Steel Bars for Concrete Reinforcement. ASTM International: West Conshohocken, PA, USA, 2022.
- ASTM. C33/C33M; Standard Specification for Concrete Aggregates. ASTM International: West Conshohocken, PA, USA, 2023.
- ASTM. C39/C39M; Standard Test Method for Compressive Strength of Cylindrical Concrete Specimens. ASTM International: West Conshohocken, PA, USA, 2023.
- ASTM. C469/C469M; Standard Test Method for Static Modulus of Elasticity and Poisson’s Ratio of Concrete in Compression. ASTM International: West Conshohocken, PA, USA, 2022.
- ASTM. C1609/C1609M; Standard Test Method for Flexural Performance of Fiber-Reinforced Concrete (Using Beam With Third-Point Loading. ASTM International: West Conshohocken, PA, USA, 2019.
- ASTM. C78/C78M; Standard Test Method for Flexural Strength of Concrete (Using Simple Beam with Third-Point Loading). ASTM International: West Conshohocken, PA, USA, 2022.
- Bažant, Z.P.; Novák, D. Proposal for standard test of modulus of rupture of concrete with its size dependence. ACI Mater. J. 2001, 98, 79–87. [Google Scholar]
- Gaston, J.P. Shear Behavior of Macro-Synthetic Fiber-Reinforced Concrete Panels. Master’s Thesis, University of Washington, Seattle, WA, USA, 2023. [Google Scholar]
- ASTM. D7508/D7508M; Standard Specification for Polyolefin Chopped Strands for Use in Concrete. ASTM International: West Conshohocken, PA, USA, 2020.
- Vecchio, F.J. Reinforced Concrete Membrane Element Formulations. J. Struct. Eng. 1990, 116, 730–750. [Google Scholar] [CrossRef]
- Vecchio, F.J.; Collins, M.P. The modified compression-field theory for reinforced concrete elements subjected to shear. ACI J. Proc. 1986, 83, 219–231. [Google Scholar] [CrossRef]
- FIB. Model Code 2010 for Concrete Structures; International Federation for Structural Concrete (fib): Lausanne, Switzerland, 2010. [Google Scholar]
- AASHTO. LRFD Bridge Design Specifications, 10th ed.; American Association of State Highway and Transportation Officials: Washington, DC, USA, 2024. [Google Scholar]
- CSA; Design of Concrete Structures (CSA A23.3). Canadian Standards Association: Mississauga, Canada, 2014.
- Bentz, E.C.; Vecchio, F.J.; Collins, M.P. Simplified modified compression field theory for calculating shear strength of reinforced concrete elements. ACI Struct. J. 2006, 103, 614. [Google Scholar] [CrossRef]
- CEN. EN 1992-1-1; Eurocode 2: Design of Concrete Structures—Part 1-1: General Rules and Rules for Buildings. European Committee for Standardization: Brussels, Belgium, 2015.
- RILEM. RILEM TC 162-TDF: Test and design methods for steel fibre reinforced concrete sigma-epsilon-design method. Mater. Struct. 2003, 36, 560–567. [Google Scholar] [CrossRef]


Disclaimer/Publisher’s Note: The statements, opinions and data contained in all publications are solely those of the individual author(s) and contributor(s) and not of MDPI and/or the editor(s). MDPI and/or the editor(s) disclaim responsibility for any injury to people or property resulting from any ideas, methods, instructions or products referred to in the content. |
© 2025 by the authors. Licensee MDPI, Basel, Switzerland. This article is an open access article distributed under the terms and conditions of the Creative Commons Attribution (CC BY) license (https://creativecommons.org/licenses/by/4.0/).