Abstract
The earthquake of 6 February 2023, in Turkey and Syria, was catastrophic for many existing buildings. Various reasons have been given to try to understand what happened, since after 2000, changes in construction methods were introduced in this area, with the aim of improving buildings. In this research, the behavior of frame buildings with a concrete structure is analyzed. To do this, graphene oxide (GO) is introduced into traditional mixtures to improve the most deficient mechanical characteristics of traditional concrete. Laboratory tests performed with GO in traditional concrete mixtures produce improvements in the mechanical analyses performed, essential characteristics for improving the structural behavior of the frame models analyzed in this research. The mechanical results show increases of 13% in the modulus of elasticity, 22% in compression strength tests, 72% in flexural-tensile strength tests, and 14% in ductility, in addition to a 4% reduction in the density of the mixture. These characteristics are essential to understand the structural improvement of the models, helping to reduce the seismic vulnerability of the structures. To reach these conclusions, static and dynamic analyses (using records of the most intense seismic activity that occurred in Turkey in 2023) are performed on three frames of 5, 10, and 20 stories in height, considering the mechanical properties of the new mixtures (traditional and GO) obtained in the laboratory. The results obtained in the analyses of the frame models using GO in the new mixtures show improvements in the structural performance of the frames, improvements that increase with increasing height of the structures. To conclude this investigation, the analyses performed on the frame models are extended with the introduction of brick walls in the exterior bays of the bare frames, a solution commonly used to improve the resistant behavior of these structures, determining a structural improvement of the models, due to the high strength and stiffness that these infill walls impart to the bare frames.
1. Introduction
Earthquakes around the world are, along with hurricanes, floods, and volcanism, the main natural events causing structural damage to buildings, significantly limiting their useful life, in addition to the catastrophic economic consequences they produce in a country. These effects translate into irreparable damage to buildings, causing the destruction of many homes, the loss of infrastructure necessary for the functioning of a country, and the loss of businesses. These factors directly affect a country’s productivity and functionality, increasing unemployment, and paralyzing or partially slowing economic and development activity in the affected areas. These effects have been observed in medium- and high-intensity earthquakes such as those that occurred in Chile (2010) [1], Turkey and Syria (2023) [2], and Italy (2009) [3].
All of the effects generated in a country because of these natural events result in a series of direct and indirect economic impacts that affect a country, as shown in research carried out such as the environmental, medical, and public health impacts in [4]; the economic impacts of losses in [5]; the detailed economic impact of historical earthquakes in [6,7]; and the analysis of the social and economic consequences of earthquakes in [8,9,10], which is an addition to the interest of this research.
- Direct economic impacts:
- (a)
- Destruction of infrastructure: earthquakes can cause severe damage to buildings, bridges, roads, electrical grids, and communication systems, affecting a country’s economic production and the distribution of goods and services, paralyzing or slowing its economic activity, as shown in economic studies carried out on earthquakes such as the one in Italy [3] or the economic impacts of historical earthquakes [6].
- (b)
- Damage to homes: the destruction of homes affects the well-being and well-being of society, generating unexpected and significant costs for families and the country in general, resulting from the loss of assets and the reconstruction of affected areas.
- (c)
- Impact on economic activity: the interruption of production and the loss of jobs generated by disasters caused by these events reduce the income of companies and society in general, affecting consumption and investment in a country’s development.
- (d)
- Increased prices: the shortage of goods and services after an earthquake leads to higher prices, significantly affecting a country’s economy. Generally, these increases occur in basic, essential products for people’s daily lives, such as food, beverages, and fuel.
- (e)
- Loss of capital and personnel: the destruction of buildings, machinery, and infrastructure represents an essential loss for the reconstruction of a country, hindering its economic recovery.
- Indirect economic impacts:
- (a)
- Unemployment: the destruction of small and medium-sized businesses and the disruption of a country’s economic activity cause layoffs, increasing unemployment and poverty.
- (b)
- Reduction in investment: economic uncertainty, derived from the risk of losses due to earthquakes, significantly affects foreign investment, both public and private.
- (c)
- Impact on mental health: earthquakes can generate stress, anxiety, and psychological trauma in the population, affecting labor productivity and quality of life.
- (d)
- Long-term effects: the effects caused by an earthquake can persist for years, affecting a country’s economic and social development.
On the other hand, considering the construction sector, a factor of great interest in society, the effects of earthquakes are responsible for the generation of severe damage to building structures, limiting their useful life, causing cracks and fissures and even the total collapse of a building. These consequences vary depending on the intensity of the earthquake, the quality of the construction, the type of soil, the distance to the epicenter, and the configuration of the building (fundamental periods), among others. Among the damages generated in a building due to these events are the following, all of which have been shown in research carried out on structural damages generated by earthquakes [11,12] or studies carried out on the classification of damages in different structural types [13] or the behavior of structures during earthquakes [14].
- Foundation damage: weakening or displacement of a building’s foundation, causing uneven settlement or subsidence, affecting the building’s stability.
- Failures in walls and columns: vibrations or tremors can cause cracks, fissures, and even collapse of supporting structural elements such as walls and columns, especially if they are not properly designed or constructed, causing discomfort and insecurity due to loss of functionality or the collapse of buildings.
- Collapses and failures: structures can collapse due to loss of stability, broken connections between elements, or material failure.
- Damage to non-structural elements: earthquakes can affect non-structural elements such as windows, doors, cladding, and plumbing systems. These damages significantly affect important, high-occupancy buildings such as hospitals, due to the expensive medical equipment and the lives of the many people who pass through these buildings daily, as well as the limited mobility of inpatients.
- Collapse: buildings can partially or completely collapse due to the intensity of seismic waves, compounded by the weakness of some structures, either due to low regulatory requirements or technical calculation errors, resulting in poorly designed buildings or those constructed with inadequate materials and/or designs.
- Facility failures: earthquakes can damage pipes, electrical cables, ventilation systems, and other internal building systems, significantly affecting people’s well-being and building functionality.
- Falling cladding: vibrations can cause cladding, finishes, and non-structural elements to fall, putting people’s safety at risk.
- Loss of life: building collapses and falling debris cause injuries and deaths during earthquakes, especially in high-traffic buildings such as hospitals, shopping centers, sports stadiums, and educational centers.
- Service disruptions: earthquakes can cause damage to critical infrastructure such as roads, bridges, and power and gas lines, directly affecting the provision of basic services and, therefore, the functioning of a country.
With all the above, and the technical and technological developments resulting from research and learning from natural events around the world, measures and improvements in construction have been adopted to mitigate the material, social, and economic damage caused by earthquakes. Among the measures adopted the following are shown, referenced in research works such as those carried out on innovations and changes in the earthquake-resistant analysis of buildings [15], the reduction of seismic risk in structural design [16], the earthquake-resistant characteristics in reinforced concrete buildings [17], or the structural design criteria for earthquakes [18,19].
- Earthquake-resistant construction: use of materials and construction techniques that enable buildings to withstand seismic movements. This section includes the ongoing updating of the requirements established by each country’s structural and earthquake-resistant regulations.
- Training of technicians and professionals capable of designing building projects appropriate to a location’s seismic risk.
- Use of new, improved materials and advanced devices in structural design: the introduction of new materials, combined with the chemical composition of traditional materials used in structural sections (columns, beams, or walls), would improve their most deficient structural and mechanical characteristics, reducing the structures’ seismic vulnerability.
- Reinforcement of existing structures: repair and reinforcement of old buildings to improve their resistance to earthquakes.
- Soil studies: conducting geotechnical studies to determine soil quality, adopting appropriate structural designs.
- Education and preparedness: inform the public about seismic risks and how to respond during an earthquake.
- Urban planning: consider seismic zoning and building location to minimize risks.
With all the above mentioned, this research will address the catastrophe of the earthquake in Türkiye and Syria that occurred in 2023, analyzing and justifying what happened in the buildings there.
Effects of the Turkey and Syria Earthquake (2023)
The earthquake that occurred on 6 February 2023, originated between the Anatolian, Arabian, and African plates. According to current data, this location is defined as a relatively quiet zone in terms of seismic activity, as only three earthquakes of magnitude six or greater have occurred in the last 50 years [20].
Of the various seismic movements associated with this earthquake (including aftershocks), the United States Geological Survey (USGS) measured the first movement as being the most intense, with a magnitude of 7.8 (Mw) and an epicenter west of Gaziantep, near the Syrian border. The USGS estimated the rupture to be approximately 100 km long and 70 km wide, corresponding to a surface strike-slip fault [21].
The earthquake caused an estimated 43,550 deaths and 108,000 injuries across Turkey’s 10 provinces, affecting a total of 13.5 million people and four million buildings. Around 12,000 buildings collapsed, and extensive road cracks were created, significantly impacting the country’s functionality. The USGS Rapid Assessment of Global Earthquake Response (PAGER) service estimated the economic losses as between USD 10 billion and USD 100 billion [22].
Various studies and analyses of the tragedy have concluded that most of the buildings that collapsed in Turkey were built before the year 2000, prior to the 1999 earthquake, and that the new regulations regarding improved materials had not yet been implemented. However, existing studies and research have shown that for many of the more than 80,000 buildings that collapsed, the effects of the earthquake could have been reduced by following the seismic safety standards [23].
Furthermore, the characteristics of the construction sector and the fraudulent policies that were in force at the time, related to bribery, money laundering, bid rigging, and patronage, may also have significantly influenced the quality of construction, especially of public buildings [24]. These problems led to new regulations and measures being drawn up and implemented between 2007 and 2018 to improve the construction characteristics of buildings [25]. Even so, after the 2023 disaster, the body responsible for ensuring compliance with these measures admitted that more than half of the buildings in Turkey in 2023 (approximately 13 million apartments) did not meet acceptable structural requirements. It has been proven that many of the buildings that fell in the earthquake had received the approval of the authorities, despite changes in regulations in previous years in relation to disaster prevention in this sector, thus demonstrating the existence of ineffective construction resulting from corruption in the construction sector and a lack of supervision of compliance with the existing law [25]. Furthermore, uncontrolled urban growth in the area in recent years has allowed government officials and businessmen to garner large profits. During this period, contractors (responsible for much of the construction) have been accused of participating in illicit practices, and arrest warrants have been issued against public officials for alleged safety violations and construction irregularities [26]. Among the existing irregularities found in the buildings destroyed by the earthquake, one stands out, related to disaster management and the policy carried out by the Turkish public administration regarding the disaster that occurred in the Turkey–Syria earthquake in 2023, related to the existing flaws in the structural and building design existing in the place and that have served as a basis for carrying out this research, wanting to investigate more about what happened [27], and another, referring to the work carried out by Lagormarsino and Penna [28] on the state of damage and seismic vulnerability of frame structures, helping this research to analyze the state of the “frame type” buildings used in this document [28]:
- Faulty design
Weak ground floor plans, due to the lack of load-bearing elements (such as structural walls). These are open-plan plans, composed of low-strength supporting elements (columns), due to the architectural layout of these premises, such as shopping centers.
- 2.
- Obsolete construction
In Turkey, for buildings over three stories high, a common technique used in the construction of reinforced concrete frames is the use of masonry infill blocks to increase their load-bearing capacity. However, it has been shown that these frames collapsed rapidly as soon as the shaking began. Furthermore, many of these structures predate the building codes for the 1999 earthquake.
- 3.
- Soft stories
The presence of soft stories in many existing apartments and condominiums makes these structures susceptible to significant damage from earthquakes.
- 4.
- Non-compliance with building standards
Many of the buildings have been shown to not meet the safety requirements set out in the current standards.
- 5.
- Age of some buildings
The age of some of the buildings also contributed to the severity of the earthquake’s impacts.
As previously described, concrete is one of the most widely used materials for structures and construction, due to its desirable properties and capabilities [29]. Hence, improvements in the mechanical properties of this mixture, as justified by the post-1999 earthquake regulations, could have benefits for the structural behavior of buildings, and may partly mitigate the effects of disasters such as the 2023 Turkey earthquake [30,31,32,33]. One of the current processes for improving traditional materials involves the addition of new materials to their chemical composition to positively influence their most undesirable behaviors. In relation to concrete, there are many existing studies and research on the materials that can be introduced into traditional dosages, with the aim of improving the properties, such as the flexural-tensile strength or the impermeable or thermal behavior. In this study, GO is used, due to the significant mechanical improvements produced in traditional concrete from the addition of small quantities of this material [34]. It also produces a reduction in CO2 emissions into the environment due to a reduction in the material required for construction [35], its impermeability [36], and its thermal conductivity [37], meaning that its incorporation at a large scale into new mixtures for use in buildings is potentially viable.
Numerous materials have been incorporated into traditional materials to improve their weakest properties. Among the different materials incorporated into these materials is graphene oxide (GO), a material that has attracted the interest and attention of many researchers in the last two decades due to the exceptional mechanical properties of graphene [38,39,40,41] and its derivatives. Among the characteristics of this material compared to other nanotechnologies are its simplicity of production and its lower risks to health and the environment [42].
There are numerous existing studies on graphene and its derivatives, most focusing on improving the mechanical properties of traditional materials such as cement, mortar, or concrete [43,44,45,46,47,48,49,50,51,52,53]. These studies have shown that small amounts (i.e., from 0.01 to 0.03% by weight cement) of graphene oxide (GO) significantly improve the compressive strength, flexural-tensile strength of concrete [54].
However, the benefits of GO may not be fully achieved unless it is uniformly dispersed throughout the mix. Achieving uniform dispersion of GO in concrete mixes is crucial to extend its application in the concrete industry [55], since its chemical inertness and hydrophobic nature can lead to lumps, which would reduce the mechanical strength of the new materials due to the concentration of this product in the mixes [56]. The temporal dispersion effect, as demonstrated by Divya et al. [57] is remarkable. These authors found that similar amounts of GO in the mixes improved the compressive and flexural-tensile strengths by 40% and 70%, respectively, depending on the dispersion of this product in the initial mixes [57].
In this research, we seek to demonstrate improvements in the numerical structural and seismic resistance of a new GO concrete mixture in 5-, 10-, and 20-story frame structures, based on the mechanical properties measured in a laboratory. The difference from other research in this area is related to the application of these new modified concretes in structures located in medium- and high-seismic areas, with the aim of determining their real effectiveness in low-, medium-, and high-rise constructions, as an alternative or complement to the use of other devices such as bracing or shear walls. In addition, infill walls are added to the frames to explore the real effects that these elements have on the structures, as this is a solution commonly used in real buildings.
2. Materials and Methods
2.1. Synthesis of GO
The GO solution used in this research was prepared using a variation of the modified Hummers method [58,59,60,61]. Once the mixture had been prepared, 3 g of KMnO3 was added, and to ensure complete oxidation of the graphite, the new mixture was stirred for 3 h. Subsequently, 10 mL of an aqueous H2O3 solution was incorporated into the mixture, which generated a slightly yellowish solution. The GO obtained in this way was washed with 10 mL of HCl solution, and the pH was adjusted by adding an aqueous NaOH solution. Exfoliation of the GO was carried out by sonicating the mixture in an ultrasonic bath at 40 kHz. In this process, centrifugation cycles at 4000 rpm were performed, and the surplus was collected to obtain the GO solution. The resulting GO was then diluted in distilled water, the mixture was ultrasonically sonicated for 30 min, and an aqueous solution of GO was finally obtained according to the process described by Chandra et al. [62]. However, although the inclusion of GO in the mixture produces improvements in the mechanical strength [63], dispersion of GO in the mixture can cause agglomeration in the cement matrix due to the negatively charged GO and the high concentration of alkaline ions (e.g., Ca2+, Na+, and K+) [64]. Hence, to avoid potential problems related to GO agglomeration in the mixtures, the resulting GO solutions were diluted with tap water. This process followed the procedure described in [65], where the GO was mixed with deionized water for 3 h and sonicated at 1000 rpm, with a soaking time of 18 h. The GO solution remained stable for several weeks, with no visible precipitation. Figure 1 shows the GO substance obtained via the process described above for use in the new mixtures. For a better explanation and understanding of this method, it is represented schematically in Figure 2, corresponding to Figure 2 of Alam et al. (2017) [60].

Figure 1.
Photograph of the GO solution.
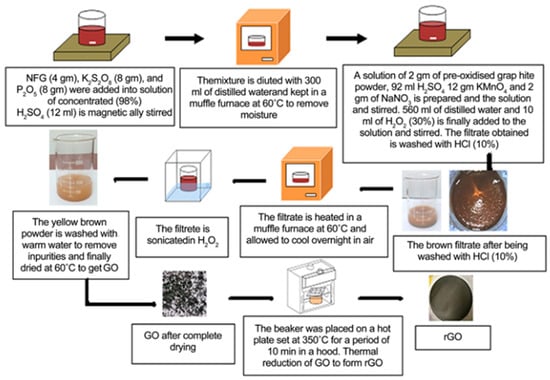
Figure 2.
Schematic of the graphene oxide synthesis method by the modified Hummers method. Alam et al. (2017) [60].
2.2. Sample Preparation
For this experiment, two mixtures were prepared, including a traditional G30 concrete (30 MPa), which was taken as a reference. For each series, 9 specimens were manufactured (5 specimens were used for compression strength tests and 4 specimens were used for flexural-tensile strength tests), for a total of 27 specimens for each of the two cases analyzed (9 specimens tested at 7 days, 9 specimens tested at 14 days, and 9 specimens at 28 days), which would make a total of 54 specimens (27 specimens using traditional concrete and 27 specimens using traditional concrete with GO). The percentage of GO was determined using the Taguchí methodology [66], taking, as a reference, the most common values in the scientific literature (0.01–0.2% by weight of cement) [67]. In this case, a value of 0.2% was used. The distribution of aggregates in the mixture followed the Faury–Joisel method [68], and the mass distribution of the aggregates was done using the ISO 20290-1:2021 standard [69]. From the collected data, the ideal granulometric curve was obtained using the Faury–Joisel method (Figure 3), and as a result, the combined percentage of sand and cement was set at around 52% by weight. The mixtures were prepared using a standard type of cement, with a water–cement ratio of 0.43. The samples were mixed with an automatic mixer, with the mixtures being prepared in the following sequence: (i) 70% of the total mixing water was introduced; (ii) the coarse aggregates, fine elements, and cement were sequentially loaded; and (iii) the remaining water (25% by weight) was added. All compounds were mixed for approximately 2 min in the concrete mixer until a homogeneous mixture was obtained.
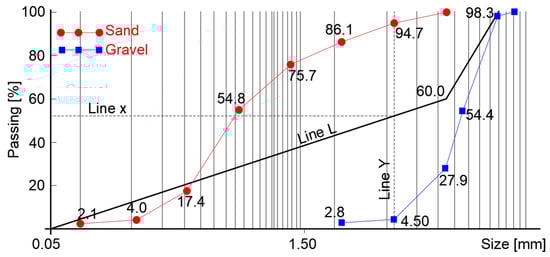
Figure 3.
Particle size distribution in accordance with a Faury–Joisel curve. Curve L represents the ideal grain size band; line Y represents the intersection of the gravel and sand curves; line X represents the intersection of curves L and Y [70].
For proper compaction of the mix, the Abrams cone slump method was followed, in accordance with the ISO 1920-2:2016 [71] standard, thus ensuring the workability of the mix. Tests were performed (Figure 4), which gave a slump of 1 cm, thus complying with the workability requirements established and required by the standard.
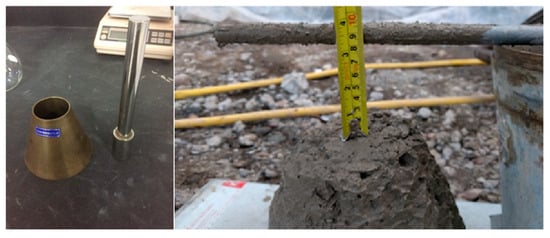
Figure 4.
Photograph showing an Abrams cone test, which was conducted to determine the workability of the concrete samples.
Finally, the concrete was poured into cylindrical (Ø300 × 150 mm) and prismatic (530 × 150 × 150 mm) molds, and the existing air in the specimens was removed by vibration with a pneumatic hammer (vibrator). The samples were demolded after 20 h and were then cured in lime-saturated water at a temperature of 23 ± 2 °C and a relative humidity of 90% for 7, 14, and 28 days. All of the tested samples were prepared considering the water absorption of the aggregates (10% losses), in order to accurately determine the dosage of materials used in the mixtures, as shown in Table 1, where TC denotes traditional concrete of 30 MPa (G30), and C_GO denotes traditional concrete (G30) with the addition of GO.

Table 1.
Mix proportions expressed in kg per cubic m of concrete [70].
The dosages used in this research correspond to those reported by Dominguez et al. [70].
2.3. Testing
Compression strength tests were performed on cylindrical specimens made at 7, 14, and 28 days using a universal hydraulic testing machine. Before the test, a 3 mm layer of sulfur plastic mortar was applied to the surface to eliminate any imperfections (Figure 5a). Contact between the specimen and the machine was made through a 10 mm-thick cylindrical metal plate, with a constant loading rate of 1 kN/s until collapse. In this context, the loading process used by hydraulic machines in laboratory tests in compliance with regulatory standards should not be confused with the criteria adopted in the analysis of the models, in which deformation control and not load control has been used, as referred to in Chapter 3.0. Unlike the strain control calculation method used in numerical analyses of models (push-over) (Section 2.5), due to its better control of plastic deformations and their ductilities, variables used in the conclusions carried out in the studies of structural behavior were utilized in this research; in laboratory experimental tests, force control is used, seeking to control the magnitude and direction of the forces applied to a body (specimen) through a controlled variable such as compression, bending, tension (compression strength tests, flexural-tensile strength tests performed in this research), or torsion through the hydraulic machines used (Figure 5) to break the material, obtaining the behavior values under different types of load. To do this, the machine applies incremental forces in the tests performed at the sampling rate indicated by the Standard until collapse. The flexural-tensile strength was measured using prismatic specimens made at 28 days, according to ISO 1920-4:2020 [72] (Figure 5b), using the corresponding hydraulic machine. The loads applied in these flexural-tensile strength tests were placed 7.5 cm from the center point, as shown in Figure 5b.
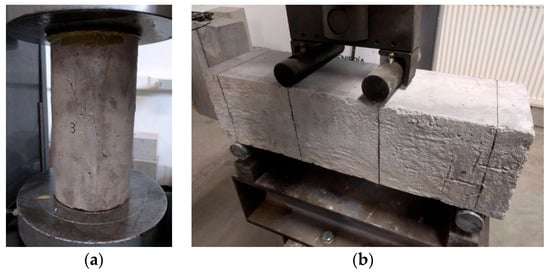
Figure 5.
Photographs of (a) a cylindrical sample used for the compression strength test; (b) a flexural-tensile strength test of a prismatic sample.
The elastic modulus (E) was measured for the cylindrical samples through a compressive strength test using a combined compressometer and extensometer, which provided numerical values and corresponding stress-strain curves. The average Young’s modulus (Ea) was obtained, as shown in Equation (1), as the slope of the straight line of the initial part of the stress–strain curve, i.e., between the end of the compaction phase (X1, Y1) and the beginning of the fracture phase (X2, Y2) [73], where Y1 and Y2 are the values corresponding to the compaction and fracture initiation stresses, respectively, and X1 and X2 are the values corresponding to the compaction and fracture initiation strains of the tests performed, respectively.
The ductility was also calculated during these tests, as a dimensionless parameter determined by the relationship between the ultimate strain (εu) and the plastic strain (εp), and was determined from the capacity curves of the samples. The final deformation of each sample was determined based on the last point of the capacity curve before the decrease in its resistance, while the plastic deformation was obtained using the procedure established by the FEMA P1050 [74] and ATC-40 [75] standards. The determination of the ultimate deformation (δu) is the point corresponding to the displacement of the maximum stress acquired in the capacity curve of the push-over analysis, while the plastic deformation (δy) is obtained through the process of area equality between a generated bilinear curve and the capacity curve, whose process is explained in detail in ATC-40.
2.4. Sample Characterization
It was observed from the laboratory results that mixtures with small doses of GO showed improved mechanical properties in relation to traditional concrete (G30). When GO was added at 0.2% by weight of cement, the compressive strength of the concrete increased by 17.92% (Table 2). These values are notably higher than previous results obtained for equal concentrations of GO, although Devasena and Karthikeyan [76] reported increases of 8% with the same amount of GO. These differences can be explained by the water-cement ratio. Existing studies such as that in [77] describe two reasons for the effect on the strength of concrete: the acceleration of the cement hydration process, and the filling effect of graphene. Reorganization of particles within the cementitious matrix and the hydration process largely depends on the water-cement ratio, as demonstrated by Preethi and Chikkanagoudar [78]. These authors showed that for the same GO concentration, increasing the water–cement ratio affected the average strength of the mixtures. For example, with 0.03% GO (by weight), the compressive strength was increased by 4.8% and 14.9% for water–cement ratios of 0.5 and 0.4, respectively [78]. Similar results have been presented by Yee and Ghayesh [79].
Table 2.
Laboratory results obtained from the samples.
The same principle can be applied to the discrepancies in flexural-tensile strength. In this study, the increase in flexural-tensile strength compared to traditional concrete was 75.62% when 0.2% GO (by weight) was added to cement (Table 2). Yeke and Yu [80] report average increases in flexural-tensile strength of 20% between 0.04% and 0.06% GO (by weight).
The introduction of GO into concrete not only increases the strength but also affects the elastic modulus (E). This leads to a greater capacity of the concrete to absorb the deformation energy in the elastic part of the initial behavior of the material, resulting in improved ductility [81]. The elastic modulus (E) increases slightly with the inclusion of GO (Table 2), a finding that agrees with those of previous studies [82]. The ductility results (µ = δu/δy), referring to Table 2, have been obtained as the quotient between the ultimate (δu) and plastic (δy) strains corresponding to the capacity curves obtained from the hydraulic machines (Figure 5) with which the tests are performed. The obtaining of each strain follows the same criteria as that used in the results of the capacity curves of the structural models, in which the ultimate strain corresponds to the maximum stress of the curve, prior to collapsing the specimen (when the curve begins to descend), and the plastic stress obtained from the process followed by the equality of areas arising from the intersection of the capacity curve obtained from the machine and a bilinear curve, corresponding to the process explained in ATC-40.
The mechanical values used for the characterization of the concretes in this research in the modeling of the beams and columns of the frame structures were compared with those reported by Dominguez et al. [70].
2.5. Modeling and Analysis of Frame Structures
The choice of frame structure for analysis in this research was made due to the abundance of this construction system in many countries with low, medium, and moderate seismicity in Latin America and Europe [83]. These structures are characterized by their fast execution times and lower economic cost for execution when compared with other construction systems (shear walls), due to the smaller sections (beams and columns) that make up this type of structure. The low lateral rigidity of these constructions is compensated for with the use of brick walls (non-structural infill walls) in the enclosures and dividing walls, corresponding to the interior distributions of the buildings [84].
For this investigation, frame structures of 5, 10, and 20 stories were considered. Each story was 3 m high, corresponding to structures of 15, 30, and 60 m in height, respectively. Each structure was composed of five spans of 5 m in length, corresponding to a total length of 25 m. The structural models had a regular elevation, following the design recommendations established by most earthquake-resistant standards. The use of this structural model in the analyses [85,86] was due to the reliability of these structural models in relation to the results and conclusions obtained considering the time of data processing in the computational analysis, as well as its reliability of the results obtained in other research [87,88].
For the design of the structural sections (columns and beams), the requirements established by European Standard EC-2 [89] for reinforced concrete were followed. In addition, the seismic design criteria established by the European Seismic Standard EC-8 [90] were considered to determine the horizontal loads applied to the frames for a design acceleration of 0.35 g, corresponding to the area where the earthquake occurred. The amount of steel used in all sections was 2%. As mentioned in several existing studies corresponding to the disaster caused by the earthquake in Turkey and Syria in 2023, the most affected buildings date from the end of the last century and the beginning of the current one. The calculation regulations used for the design of concrete structures (EC-2) date from 1992, corresponding to the construction years of the most affected structures. Furthermore, the design acceleration used in seismic analyses coincides with the design acceleration (ag = 0.35 g) of the affected area in the most affected building.
The materials used for the structural elements (beams and columns) were G-30 (H30) concrete, with a characteristic strength of fck = 300 kg/cm2 (30 MPa), and high-strength steel B-500-S, with a yield strength of fyk = 5000 kg/cm2 (500 MPa). The loads considered for the structural calculations followed the G + 0.3Q action combination of EC-8 [90], where G represents the weight of the structure and Q the live loads corresponding to residential, administrative, or small commercial use, equivalent to 2 kN/m2 [91]. This load was applied to all floors of the portal frame, except for the top floor (roof), where the applied load was 1 kN/m2 (only for maintenance).
This investigation was completed with the introduction of infill walls in the external bays of the bare frames (TC and C_GO), elements commonly used to improve the behavior of structures, where TC refers to the structural model using traditional concrete and C_GO to the structural model using graphene oxide (GO) in concrete. It should be noted that these infill walls are not structural. To ensure this in the analyses, they have not been connected to the main frame elements (beams and columns) but are separated from them by some insulating element. In the analyses performed in the Seismostruct structural program, these walls have not been introduced as shear walls, but as “infill” elements. In these cases, TC_W represents frames constructed using traditional G30 concrete, and C_GO_W represents frames using traditional G30 concrete with GO.
Although several analytical models exist in the literature for determining the mechanical response of these elements (infill walls), the most widely used are based on equivalent strut models, as they allow for the bracing effect of masonry under lateral load to be represented [92,93,94], and these were chosen for this investigation. The elements were defined by four nodes [95], with their compression and shear behavior considered separately. The model was programmed in Seismostruct [96], based on the theory of nonlinear responses in frame structures.
Each frame was represented by six struts (Figure 6), with each diagonal characterized by two parallel struts that transferred loads to the corners through opposite diagonals, and a third strut called a shear strut. The purpose of the latter is to transfer shear stress from the top to bottom of the masonry, through the diagonal under compression. Struts subjected to axial loads were represented using a hysteresis model, while for the shear strut, a finite element method (MEF) was used.
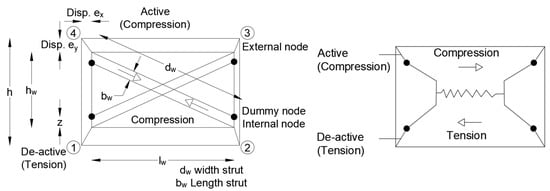
Figure 6.
Diagonal strut model showing the beam elements.
For these analyses, a wall width (t) equivalent to the width of the masonry bricks (12 cm, corresponding to a conventional perforated brick) was assumed. The characteristic strengths of the infill walls using mortar at the joints between the bricks were calculated using Equation (2) (Eurocode 6) [97]:
where
- fk = characteristic value of masonry strength (Nmm−2),
- fb = normalized compressive strength of the material (Nmm−2),
- fm = normalized compressive strength of the mortar (Nmm−2),
- K = coefficient, expressed in (Nmm−2)0.10, obtained from the initial slope of the capacity curves.
The collapse drift value was introduced as a percentage of the story height.
The area of the struts, A, was defined as the product of the frame beam width and the equivalent strut width (bW), ranging from 10% to 40% of the diagonal length (dm). These values were analyzed following Smyrou et al. (2011) [98].
The effective strut width A1 was calculated using Equation (3):
A2 was defined as a percentage of A1. The purpose of A2 is to show the fracture pattern of the sections that make up the frames. Due to fracture, the contact length between the outer frame and the inner frame decreases with lateral displacement, which affects the effective width of the struts (A2). In this work, it was assumed that the area reduction varies linearly as a function of axial strain, in accordance with Smyrou et al. (2011) [98].
The equivalent contact length (hz) is defined as a percentage of the height of the inner frame and represents the contact between the outer frame and the inner frame. In this case, a ratio of 1:3 with respect to the effective contact length (z) was assumed, calculated according to Nicola et al. (2015) [93] and López Almansa et al (2013) [99]. The horizontal (Xoi) and vertical (Yoi) displacement values were considered as percentages of the element dimensions. The Seismostruct program automatically determines the proportion of stiffness related to shear stress (γS), with a range between 0.20 and 0.60.
The specific weights (γ) (volumetric weights of the elements) were obtained from the results of laboratory tests. To obtain the stiffness of these elements, the Rayleigh damping coefficients were used [100].
To limit the possibility of displacement along the vertical axis of the horizontal elements of the frames, a rigid diaphragm (an infinitely rigid element) was considered, corresponding to a 15 cm slab.
The dimensions of the sections (beams and columns) used in the models are shown in Figure 7, while the longitudinal reinforcement steel used in the frames corresponding to a value of 2% is shown in Table 3, with the transverse reinforcement used (in mm). To understand the characteristics of the different structural sections shown in Table 3, it is necessary to first observe the sections existing in Figure 7. As can be seen on the left side of the frame in Figure, the frames of 5 (15 m), 10 (30 m), and 20 (60 m) heights are dimensioned with the corresponding sections used in each structural element. As can be seen in the column sections, they increase as the height of the frames increases. The size of the structural sections and the reinforcement (longitudinal and transverse) used in the columns coincide for the same heights, as shown in Figure 7 and Table 3. On the other hand, the sections used for the beams are always the same.
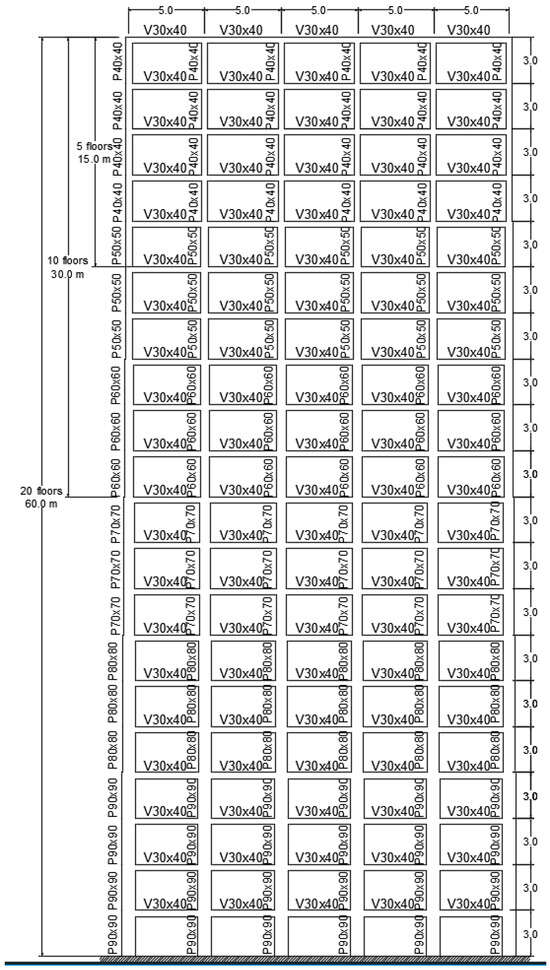
Figure 7.
Frame structure: dimensions and sections used (heights in m and section elements, i.e., beams and columns, in cm).
Table 3.
Longitudinal and transverse reinforcements of the sections used in the frames.
The calculation was based on the finite element analysis method [101,102], using the classical displacement-based formulation [103]. Each structural element (columns and beams) was modeled following the examples in the bilinear model of Mander [104,105,106] for concrete and Ferrara [107,108] for steel. The columns and beams were represented as nonlinear bar finite elements [109,110,111]. The nonlinearity of the structural elements was concentrated in the “plastic hinges” [112,113,114] in the areas close to the connections between the elements making up the frames. These structural connections were considered to be rigid, as in the work by Scott and Fenves [115]. The advantage of this formulation lies not only in the reduction in the computational analysis time, but also in the total control and calibration of the length of the plastic hinges, as described by Calabrese et al. [116], Zhao et al. [117], and Ning et Li [118]. In this case, the locations of the hinges of the structural elements were concentrated at a distance equivalent to 10% of the total length of the element [117,118,119].
The analysis was completed by defining the number of fibers used in the cross-section calculations for each frame element. To ensure an adequate representation of the stress-strain distribution of each section, considering the material properties and the shape of the section and the expected degree of inelasticity, this was estimated as 300 fibers.
The tolerances used in the displacement and rotation analyses were around 10−5 in both cases, with a maximum of 300 iterations. In addition, standard values from the Seismostruct software (2018) [96] were used to determine the unit strains corresponding to the concrete and steel failure processes, with corresponding values for concrete cracking (0.0001), concrete spalling (−0.002), concrete failure (−0.0020), steel yielding (0.0025), and steel fracture (0.0600). The material deformations were modeled following the classical laws of elasticity; the curvature and rotation criteria were verified by the rotation capacity of Mergos and Kappos [120], while the shear capacity was established according to the requirements of Eurocode 8 [90].
3. Push-Over Analysis
Push-over analysis is used to estimate the maximum horizontal capacity of structures by considering the dynamic response of the structures in relation to the deformations experienced by them. The incremental load, P, applied at each floor is proportional to the nominal load pattern (P°), where P = λ(P°). To carry out these calculations, the Seismostruct program [96] was used. This program automatically increases the load factor, λ, until a limit defined by the user is reached or numerical instability occurs. In these analyses, a triangular load pattern was used.
For this analysis, strain control was used due to the advantages it offers over force control, particularly in the range of nonlinear behavior. This type of control allows for better estimation of responses to seismic loads, since strains are better indicators of damage than forces. Furthermore, strain control facilitates the evaluation of ductility and the capacity to dissipate energy in structures, important aspects in seismic-resistant design and analysis, and important factors in the numerical analysis performed in this research.
The results in the form of curves obtained from the analyses of the three frames are shown in Figure 8a–c.
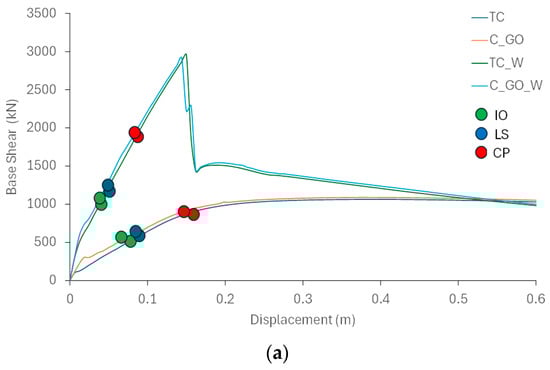
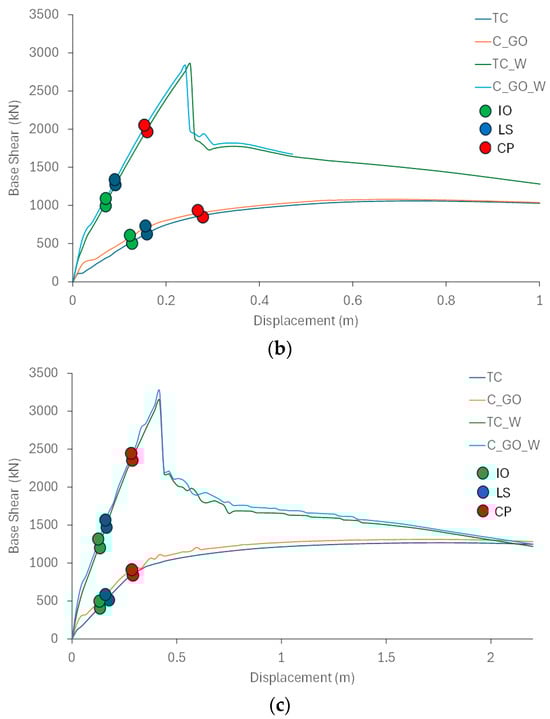
Figure 8.
Capacity curves for the analyzed frames. (a) Capacity curves for 5-height frames; (b) capacity curves for 10-height frames; (c) capacity curves for 20-height frames.
The most significant values of the curves in Figure 8a–c are shown in Table 4, Table 5 and Table 6. In addition, Figure 8 shows the performance points indicated in Table 7, Table 8 and Table 9 with the legends corresponding to these points (IO, LS, and CP), where the green point indicates the immediate occupation point, the blue point indicates the life safety point, and the red point indicates the collapse prevention point.
Table 4.
Most significant values for the five-height frame capacity curves.
Table 5.
Most significant values for the 10-height frame capacity curves.
Table 6.
Most significant values for the 20-height frame capacity curves.
Table 7.
Performance points displacement for the five-height frame.
Table 8.
Performance points displacement for the 10-height frame.
Table 9.
Performance points displacement for the 20-height frame.
The displacements corresponding to the performance points of the curves (IO: immediate occupancy, LS: life safety, CP: collapse prevention) were obtained using the methods described in ATC-40 and FEMA 356, and they are shown in Table 7, Table 8 and Table 9. In addition, the damage states corresponding to Table 10, Table 11 and Table 12 for each performance point (IO, LS, CP) have been entered into these tables, using the same colors as those shown in the tables. Uncolored values correspond to undamaged states. Furthermore, considering the damage states of the frame structures with respect to the performance points of the structures, good structural performance is observed in the analyzed models.
Table 10.
Displacements corresponding to the damage states for the five-height frames.
Table 11.
Displacements corresponding to the damage states for the 10-height frames.
Table 12.
Displacements corresponding to the damage states for the 20-height frames.
These results were complemented with an analysis of damage states based on the damage thresholds of the idealized bilinear capacity spectrum presented by Lagomarsino and Penna [28,121], using the yield displacement (dy) and the ultimate displacement (du). These four damage thresholds are as follows:
Sd,1 = 0.7dy,
Sd,2 = dy,
Sd,3 = dy + 0.25(du − dy),
Sd,4 = du,
representing ‘slight’, ‘moderate’, ‘extensive’, and ‘complete’ damage states, respectively.
Table 10, Table 11 and Table 12 show the displacements corresponding to the damage states defined in [121]. The colors indicate the damage states of the frames. In addition, the tables show some percentages in parentheses, corresponding to the reduction in displacements compared to the case of the bare frame using traditional concrete (TC).
As shown in Table 10, Table 11 and Table 12, the use of infill walls (elements much stronger and stiffer than the elements that make up the frame sections) significantly reduces the displacements of bare frame structures. As shown in this and other existing research [84,86,87], these elements significantly condition the initial behavior of bare frame structures. Furthermore, the use of GO in the mixes significantly reduces the displacements of frames with traditional concrete (TC) in the case of bare frames. However, the reductions produced in the cases with walls are not as significant, because the resistance of the frames in these cases is due to the same infill walls existing in the structures, as mentioned in this study and other existing research [84,86,87]. Finally, it is observed how the differences in displacements are more significant with the increase in height in the frame structures.
As observed in the quantification of the damage states in Table 10, Table 11 and Table 12, as the models increase in height, the differences between traditional concrete and concrete with OG become more evident. As is normal, when comparing displacements, the greater the height of the structures is, the greater the displacements are. On the other hand, when analyzing the displacements between models with the same height, the differences are significantly reduced in the models that use infill walls, due to their greater rigidity, when compared to the bare model; however, the differences are not significant between the cases with walls, because the resistance of these models is almost exclusively due to the walls [70,84,87,88]. On the other hand, since the infill walls are the same in both models (TC_W and C_GO_W), the behavior of these cases is similar, with slight reductions due to the better behavior of the cases with structural sections (beams and columns) made with GO concrete. With these, in the bare five-story model, displacement reductions occur between 3% and 9%, while in structures with walls, they are quite similar between the concretes, with reductions between 27% and 63%. In the 10-story model, these reductions are slightly higher than in the 5-story model, being between 9% and 12% in the bare structures and between 33% and 67% in structures with walls. Concluding with the 20-story model, bare structures are reduced by between 3% and 12% compared to traditional concrete, and those with walls are reduced by between 37% and 76%. Finally, analyzing the damage state values using the RISK-EU method [28], with respect to the performance points, good performance is observed in all cases, with low displacements. This may be due to the increased cross-sections of the structural elements in the bare models, as braces are not used.
4. Dynamic Analysis
4.1. Gaziantep Register (2023)
The design seismic acceleration for Gaziantep (Turkey) depends on several factors, including the seismic zone, the structural importance factor, and the soil type. For the dynamic (time-history) analyses, the NS direction record was used (corresponding to the most intense record of the 2023 earthquake with a maximum acceleration of 21.56 m/s2, an Arias intensity coefficient of 57.48 m/s, and a Housner intensity of 166 cm).
The basic seismic acceleration for Gaziantep, according to the Turkish seismic code TS 500 [122] (revised from the previous standard), is 0.35 g. The previous calculation acceleration for this zone for the years 1998–2007, according to the (TEC-1998 [123]), was 0.30 g, and it was classified as zone 2, “high seismic risk” (of four possible zones).
The records used in this investigation are shown in Figure 9a (accelerogram), Figure 9b (velocigram), and Figure 9c (displacement diagram). Figure 9d shows the spectrum corresponding to the record in the NS, EW, and vertical (V) directions. This last figure shows the design spectrum obtained from EC-8 (Type 1, for a Mw > 5.5) corresponding to the design acceleration in this area for the years 1998–2007 (0.30 g, according to TEC-1998) and the current value (0.35 g, according to TS-500). These figures show significant differences between the design spectral accelerations obtained from EC-8 and the actual spectral acceleration of the earthquake, which was seven times higher than that considered by EC-8 [90].
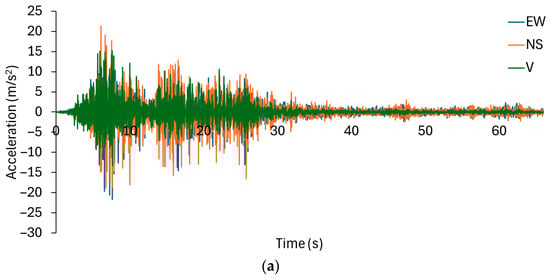
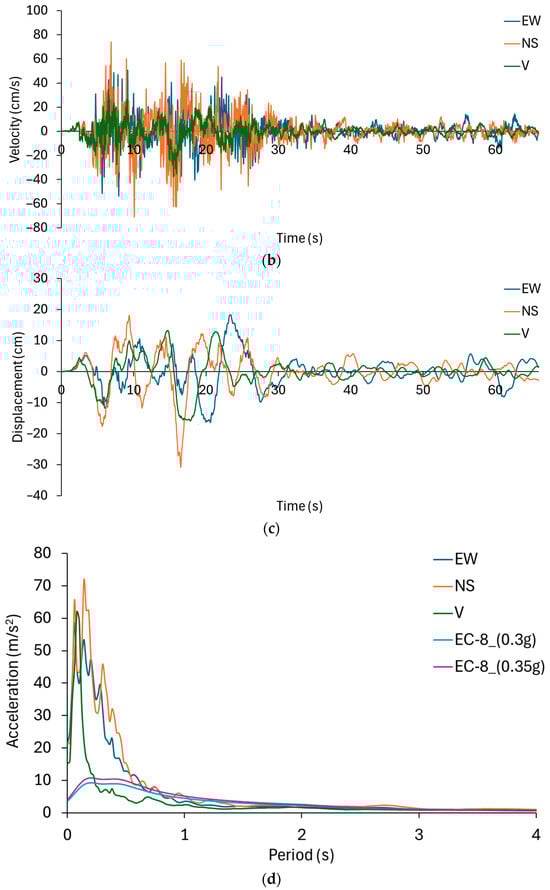
Figure 9.
(a) Accelerograms (EW, NS, and V) for the Gaziantep record considered in the dynamic analyses. (b) Velocigrams (EW, NS, and V) for the Gaziantep log considered in the dynamic analyses. (c) Displacigrams (EW, NS, and V) for the Gaziantep record considered in the dynamic analyses. (d) Calculation spectra for the record and design spectra considered in EC-8.
4.2. Dynamic Responses of the Models Using the Gaziantep Record (2023) in the N-S Direction
Nonlinear dynamic analyses (time-history) were performed in discrete time steps using Newmark’s “b” method [124]. The time discretization period (Δt) was based on the corresponding sampling of the records (0.01 s). The damping of the structures was represented using the Rayleigh model [125], equivalent to 5%.
The displacement results obtained from the analyses for the models are shown in Figure 10a–c. The absolute accelerations from these analyses are shown in Figure 11a–c.
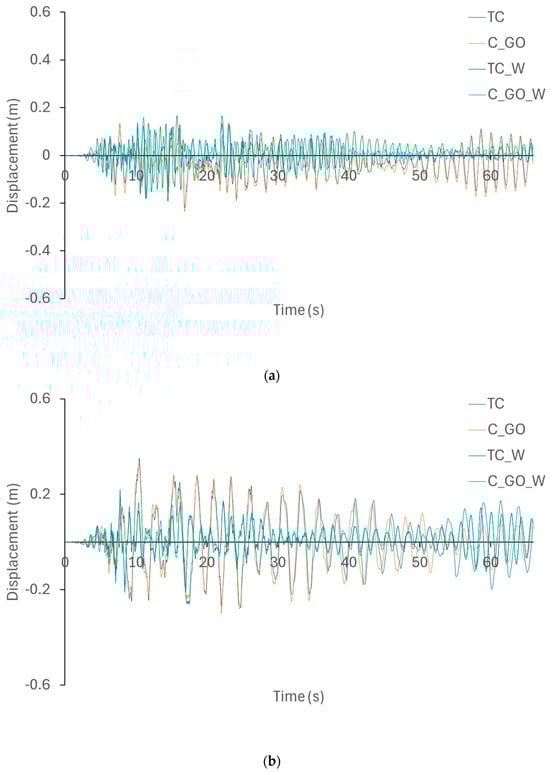
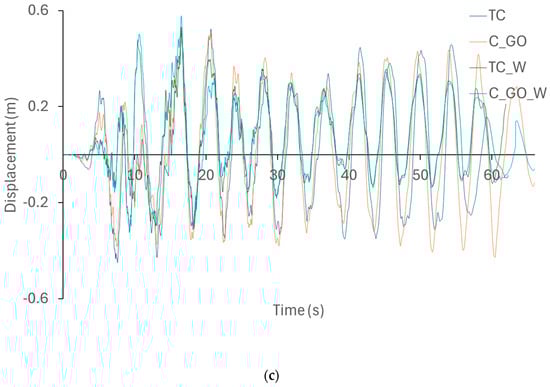
Figure 10.
(a) Displacements for the 5-height frame. (b) Displacements for the 10-height frame. (c) Displacements for the 20-height frame.
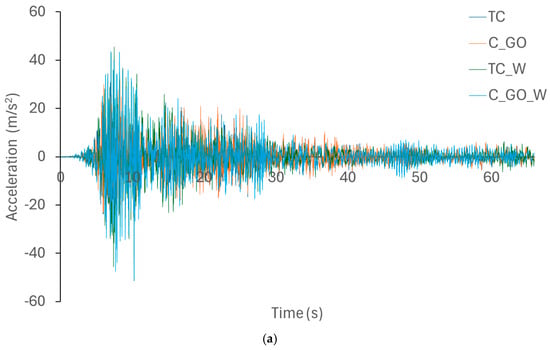
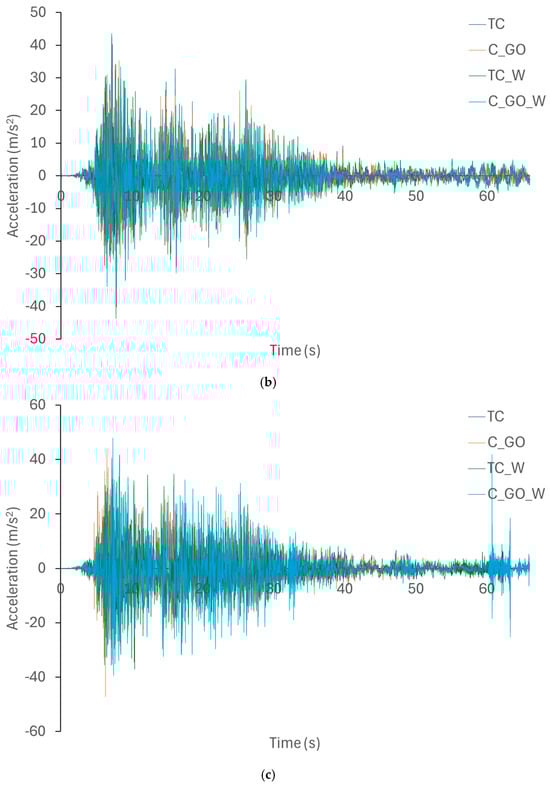
Figure 11.
(a) Absolute accelerations for the 5-height frames. (b) Absolute accelerations for the 10-height frames. (c) Absolute accelerations for the 20-height frames.
Table 13 shows the maximum displacements corresponding to the dynamic analyses in Figure 10a–c. The notation (--) means that the analyses were interrupted by the collapse of the structure. The colors used in Table 13 indicate the damage states of the buildings, as described in [121], considering the push-over analyses performed, where no color means that there is no damage in the models, green indicates a state of slight damage, yellow indicates a moderate state, orange a state of extensive damage, and red a state of collapse.
Table 13.
Maximum displacements corresponding to the dynamic analyses performed on the models.
Table 14 shows the maximum absolute accelerations obtained from the dynamic analyses corresponding to Figure 11a–c. The notation (--) indicates that the analyses were interrupted by collapse of the structure.
Table 14.
Absolute maximum accelerations corresponding to the dynamic analyses of the models.
5. Conclusions and Discussion of Results
The experimental mechanical analysis of the specimens, together with the structural numerical analysis (static and dynamic) performed in this research, show that the use of small quantities (controlled and optimized in existing research) well dosed in the mixtures of some materials with superior mechanical characteristics (strength, hardness, stiffness, ductility, deformation) in the chemical composition of traditional materials such as concrete, are beneficial to obtain better structural behaviors, reducing the vulnerability of structures to catastrophic events such as earthquakes. On the other hand, the numerical analysis carried out in this research shows quantitatively and objectively that these improvements in behavior are more significant in taller buildings, due to their greater demands on their behavior. However, the numerical results obtained show that the use of materials with high manufacturing costs such as GO, is questionable in low-rise buildings or excessively rigid buildings, due to its existing economic viability in construction, due to the low gain in structural properties produced in the models. To ensure the widespread use of these new concretes, an economic study would be necessary, optimizing the structural sections. This new study would analyze the material savings in the structural sections due to the mechanical and structural improvements achieved with the new material, compared to the cost increase that would result from the addition of GO to the mix.
This study demonstrated the technical feasibility of incorporating small amounts of GO into concrete to improve its properties. Through meticulous sample fabrication and testing, as well as comparisons with existing research, the results of this study were validated.
The purpose of this research, with the analyses carried out, is to demonstrate the positive effect of adding small amounts of GO to traditional concrete mixes, which could be a very positive additive in the manufacture of traditional concrete. Furthermore, it was intended to demonstrate, using the “recent” record of large-scale catastrophic effects in Turkey and Syria (Mw = 7.8) as an example, that this additive in traditional concrete mixes could have improved the behavior of structures, “partially” reducing many of the devastating effects produced by the earthquake, as set forth in the regulations existing in the area with the aim of preventing these devastating events. Furthermore, it could be concluded that if these new mixtures are “relatively” effective in an earthquake of this magnitude for this structural typology widely used in areas of low and medium seismicity, for more common earthquakes or seismic movements of lower intensity, it could be an important solution to avoid major catastrophes, safeguarding human lives, as stated, and set forth in the vast majority of earthquake-resistant regulations.
The mechanical variations obtained from laboratory tests compared to other studies are due to the dispersion of GO particles in the mixtures. To solve this problem in this study, the sonication process was used in the mixtures. To obtain the mechanical results of the mixtures in the laboratory under compression and flexural-tensile strength, specific hydraulic machines were used for these tests. The results obtained with these machines determined the forces and plastic and ultimate displacements of the different mixtures. These data were used in this study and are essential in the structural simulations of the materials carried out in the sections (beams and columns) that determine the frames. The simulations carried out in this study are based on nonlinear static (push-over) and dynamic (time-history) analyses. However, unlike the mechanical tests obtained in the laboratory on the mixtures, the structural results obtained in this study cannot be compared with other studies due to the limited information available in the scientific literature. Finally, dynamic analyses used the Turkish record to demonstrate the catastrophe that occurred in 2023 in frame structures, which are widely used in areas of medium and low seismic activity, seeking to offer a possible solution that could have reduced the catastrophic effects.
Regarding the numerical analysis carried out in this study, the main objectives were to analyze the behavior of a complex model, resulting from the large number of variables involved in the structural behavior of a building, in order to determine some objective conclusions with numerical values that affect the models in general. To this end, various variables that affect the structural models were analyzed numerically, in order to demonstrate the theories or hypotheses that could be expected from the proposed solution. These numerical analyses seek to numerically demonstrate that the use of materials with characteristics that favor seismic behavior, such as greater flexural strength and ductility, improves the seismic vulnerability of structures. Among the numerical conclusions obtained in this research are the following:
The use of walls significantly reduces the displacements of the structures’ performance points in all cases by between 30% and 75%. There are no significant numerical differences between the ultimate and plastic strengths and deformations of the GO and traditional models, with their performance improving from 1% to 3%.
The stiffness imposed by the walls on the bare frames practically triples. Furthermore, regarding ductility, this practically doubles in the 5- and 10-story cases and almost triples in the 20-story cases.
The use of GO in the mixes significantly increases the most deficient characteristics of concrete, especially the flexural-tensile strength (72%), ductility (13%), and decrease in density (4%), characteristics that significantly benefit the earthquake-resistant performance of buildings.
The 13% increase in the material’s ductility increases the ductility of the bare frames by between 5% and 9%. However, in the case of models with walls, there is hardly any variation because the resistance has already been justified as depending on these elements.
On the other hand, the earthquake, with spectral accelerations seven times higher than estimated by the regulations, was one of the main causes of the catastrophe that occurred in the 2023 earthquake in Turkey and Syria.
The deformations from the dynamic analyses with and without walls are reduced by 9% in the 5-story buildings, 40% in the 10-story buildings, and 20% in the 20-story building. Comparisons are not possible because the models without the GO cannot withstand the earthquake.
The differences in the accelerations from the dynamic analyses with and without walls decrease with the height of the structures, with increases of 60% in the 5-story buildings and between 10% and 20% in the 10-story building. In the 20-height models, it is not possible to make comparisons because they do not withstand the earthquake of the models without the GO.
Moreover, the results and conclusions obtained in this work are divided into four distinct sections:
- (1)
- Laboratory results
Regarding the mechanical results obtained in the laboratory, the new concretes with GO showed increases of 13% in the modulus of elasticity, 19.56% in compressive strength, 75.62% in flexural-tensile strength, and 31.57% in ductility, compared to the compressive strength. Furthermore, the density of the concrete was reduced by almost 3%. These factors are decisive in the earthquake-resistant behavior of buildings.
- (2)
- Analysis of the spectral acceleration record used in relation to the European Regulation (EC-8)
When comparing the design spectral accelerations of the European Earthquake Standard (EC-8) with the actual spectral accelerations from actual records of the Turkish earthquake, very significant differences are observed; the accelerations are approximately seven times higher than those considered in EC-8. This fact could be one of the main factors causing the seismic catastrophe that will occur in Turkey and Syria in 2023.
To conclude this research, the results obtained from the structural analyses (push-over and time-history) performed on the proposed models will be analyzed. Both analyses reach the same conclusion: increasing the height of the structures significantly influences the improvement in the structural behavior of the models using this new material, a characteristic influenced by the mechanical improvements of the new mix in relation to the increase in compressive, flexural-tensile, and ductility strengths, as well as the reduction in weight.
- (3)
- Results of incremental static analysis (push-over)
As demonstrated in this study and other existing research, the initial resistance of frame structures with infill walls is primarily due to the infill walls themselves and not to the sections comprising the frames (beams and columns), due to the greater initial stiffness and strength provided by these elements in the frames. Once the infill walls collapse, the resistance behavior of the structural frames continues with the resistance offered by the main sections of the bare frames (beams and columns), as shown in their capacity curves. This is observed in the capacity curves, where the addition of infill walls significantly increases the slope and initial resistance of the structures behavior. After the collapse of the infill walls, the curves descend sharply, continuing with the curves showing the behavior of the bare structural frames.
The increase in structural strength (Fu) increases significantly with the addition of infill walls, due to the greater resistance of these elements relative to the frame elements (columns and beams). On the other hand, the strength differences between traditional concrete structures and those with GO concrete are not significant for five- and ten-story frames. This is due to the greater rigidity of these structures due to their “low” height and to the fact that much of the strength of these structures is due to the reinforcement of the structural sections and not to the concrete, as has been demonstrated in other research in the scientific literature. Furthermore, comparing frames with infill walls, their strengths are observed to be practically the same. This is because the strength of these structures is due to the infill walls and not to the main sections that make up the frames (beams and columns). However, the greater structural demands on the taller frames translate into increases of 4%, which may be due to the improved ductility and flexural-tensile strength of the new GO concretes. Regarding displacements, there are no significant differences in ultimate displacements (du) between the cases, with slight decreases in the cases with GO concrete, caused by the improved mechanical strength of this new material compared to the traditional one (TC).
Regarding ductility (µ), there are significant variations between the frames using GO in concrete. In 5-story structures, increases of 7% were observed for bare frames and 4% for frames with walls, while in 10-story structures, increases of 4% were observed for bare frames and 3% for frames with walls. Finally, in 20-story structures, increases of 10% were observed for bare frames and 2% for frames with walls. These conclusions are consistent with the main conclusion of this study, which is that the greater structural demands of taller buildings, without considering highly rigid and resistant elements such as infill walls, could be related to the generation of a more ductile material.
Regarding elastic stiffness (Kelas), there are significant variations among frames using GO in concrete. In 5-story structures, increases of 9% were observed for bare frames and 5% for frames with walls, and in 10-story structures, increases of 11% were observed for bare frames and 6% for frames with walls. In 20-story structures, increases of 74% were observed for bare frames and 28% for frames with walls. The use of a material with significant mechanical increases would be in line with the greater resistance demands of taller structures. These differences are more significant in cases without walls, structures that depend primarily on the strength properties of the main frame elements (beams and columns). As previously demonstrated in frames with walls, the strength and structural behavior depend on these elements and not on the elements that make up the frames.
Regarding the performance points (IO, LS, and CP), significant reductions in displacements are observed in frames with infill walls. However, when comparing the displacement reduction considering the two types of concrete in the frame sections (beams and columns), the differences are not significant. This conclusion is due to the initial stiffness and strength that the infill walls exert on the frames, which cause the behavior of these structures.
- (4)
- Results of dynamic analyses (time-history)
When analyzing structures with infill walls, significant reductions in displacements are observed, due to the significant increase in structural rigidity resulting from the incorporation of infill walls. On the other hand, slight reductions in maximum displacements are observed between structures with the two types of concrete, although these are not significant, because the mechanical differences between the concretes are not as great as the differences existing with frames with walls. Furthermore, the steel that composes the structural sections is the same for the different cases analyzed, which concludes that the behavior of the structures does not vary much in bare frames, as has been demonstrated in the scientific literature regarding the structural effect of steel on reinforced concrete sections. The differences in absolute displacements and accelerations are not significant between the structural frames using both types of concrete, although they become more pronounced with increasing structural height, as demonstrated by the collapse of the 20-story structures using traditional concrete (TC) prior to the completion of the dynamic analyses. The increase in absolute accelerations of the structures with walls is due to the greater structural rigidity of these elements.
It can be concluded that the introduction of GO in the mixtures significantly improves the damage states of the analyzed structures, considering the displacements of the structures in relation to the capacity curves obtained from the nonlinear static (push-over) analyses. These differences become more pronounced with increasing structural height.
The limitation of this research calls for future studies that continue with this idea, suggesting the study of other, more optimized dosages of graphene oxide in concrete and the use of other structural typologies such as shear walls, in addition to using structures with different heights than those used in this research. This new GO material, with significant increases in flexural-tensile strength and ductility compared to traditional material (TC), could be beneficial in taller structures. Furthermore, other, more economical graphene derivatives, such as graphite, could be used in similar studies, increasing the economic viability of structures for widespread use in buildings.
Funding
This research was funded by [Chilean National Commission on Research and Development (ANID)] grant number [FONDECYT REGULAR grant number 1240156)].
Data Availability Statement
Data will be made available on request.
Acknowledgments
This work is supported by the Chilean National Commission on Research and Development (ANID) [FONDECYT REGULAR grant number 1240156].
Conflicts of Interest
The authors declare that they have no known competing financial interests or personal relationships that could have appeared to influence the work reported in this paper.
References
- Sanzana, V.M.S. Análisis de los Efectos del Terremoto del 27 de Febrero de 2010 en Estanques de Acero Inoxidable de Pared Delgada (EAIPD) con Patas y Desarrollo de un Sistema de Protección Sísmica para estas Estructuras; Pontificia Universidad Catolica de Chile (Chile): Santiago, Chile, 2011. [Google Scholar]
- Molina, C.R.; Varela, C.A. Terremoto de Turquía: Vistazo a una de las mayores catástrofes de las últimas décadas. Rev. Fasecolda 2023, 189, 18–22. [Google Scholar]
- Guzman, S. El sismo de L’Aquila, 6 de Abril del 2009, sus repercusiones. Temas Biol. Geol. NOA 2012, 2, 1–15. [Google Scholar]
- Nola, I.A. Los terremotos y sus impactos ambientales, médicos y de salud pública. Salud Pública México 2018, 60, 16–22. [Google Scholar] [CrossRef] [PubMed]
- Brookshire, D.S.; Chang, S.E.; Cochrane, H.; Olson, R.A.; Rose, A.; Steenson, J. Direct and indirect economic losses from earthquake damage. Earthq. Spectra 1997, 13, 683–701. [Google Scholar] [CrossRef]
- Daniell, J.E.; Khazai, B.; Wenzel, F.; Vervaeck, A. The worldwide economic impact of historic earthquakes. In Proceedings of the 15 World Conference on Earthquake Engineering, Lisbon, Portugal, 24–28 September 2012; Volume 15. [Google Scholar]
- Shinozuka, M.; Rose, A.; Eguchi, R.T. Engineering and Socioeconomic Impacts of Earthquakes; MCEER: Buffalo, NY, USA, 1998. [Google Scholar]
- Sinha, A.K.; Kumar, S. Economic consequences of earthquakes. Rehabilitation 2017, 8, 21–28. [Google Scholar]
- Aksoy, C.G.; Chupilkin, M.; Koczan, Z.; Plekhanov, A. DP19193 Unearthing the Economic and Social Consequences of Earthquakes; CEPR Discussion Paper No. 19193; CEPR Press: Paris, France; London, UK, 2024. [Google Scholar]
- Daniell, J.E. The socioeconomic impact of earthquake disasters. In Earthquake Hazard, Risk and Disasters; Academic Press: Cambridge, MA, USA, 2014; pp. 203–236. [Google Scholar]
- Yön, B.; Sayın, E.; Onat, O. Earthquakes and structural damages. In Earthquakes-Tectonics, Hazard and Risk Mitigation; InTechOpen: London, UK, 2017; pp. 319–339. [Google Scholar]
- Saatcioglu, M. Structural damage caused by earthquakes. In Encyclopedia of Natural Hazards; Springer: Dordrecht, The Netherlands, 2013; pp. 947–959. [Google Scholar]
- Okada, S.; Takai, N. Classifications of structural types and damage patterns of buildings for earthquake field investigation. In Proceedings of the 12th World Conference on Earthquake Engineering, Auckland, New Zealand, 30 January–4 February 2000; Volume 30. [Google Scholar]
- Housner, G.W. Behavior of structures during earthquakes. J. Eng. Mech. Div. 1959, 85, 109–129. [Google Scholar] [CrossRef]
- Shahjalal, M.; Yahia, A.K.M.; Morshed, A.S.M.; Tanha, N.I. Earthquake-resistant building design: Innovations and challenges. Glob. Mainstream J. Innov. Eng. Emerg. Technol. 2024, 3, 101–119. [Google Scholar] [CrossRef]
- Dowrick, D.J. Earthquake Resistant Design and Risk Reduction; John Wiley & Sons: Hoboken, NJ, USA, 2009. [Google Scholar]
- Otani, S. Earthquake resistant design of reinforced concrete buildings past and future. J. Adv. Concr. Technol. 2004, 2, 3–24. [Google Scholar] [CrossRef][Green Version]
- Agrawal, P.; Shrikhande, M. Earthquake Resistant Design of Structures; PHI Learning Pvt. Ltd.: Delhi, India, 2006. [Google Scholar]
- IS 1893: Part 1; Criteria for Earthquake Resistant Design of Structures. Bureau of Indian Standards: New Delhi, India, 2016.
- Barbot, S.; Luo, H.; Wang, T.; Hamiel, Y.; Piatibratova, O.; Javed, M.T.; Braitenberg, C.; Gurbuz, G. Slip distribution of the February 6, 2023 Mw 7.8 and Mw 7.6, Kahramanmaraş, Turkey earthquake sequence in the East Anatolian fault zone. Seismica 2023, 2, 1–17. [Google Scholar] [CrossRef]
- Dal Zilio, L.; Ampuero, J.P. Earthquake doublet in Turkey and Syria. Commun. Earth Environ. 2023, 4, 71. [Google Scholar] [CrossRef]
- Türkcan, B. Impacts of Earthquakes on Economic Growth and Income Inequality in Independent Turkic States. Acad. Platf. J. Nat. Hazards Disaster Manag. 2024, 5, 58–75. [Google Scholar] [CrossRef]
- Mavroulis, S.; Argyropoulos, I.; Vassilakis, E.; Carydis, P.; Lekkas, E. Earthquake environmental effects and building properties controlling damage caused by the 6 February 2023 Earthquakes in East Anatolia. Geosciences 2023, 13, 303. [Google Scholar] [CrossRef]
- Cifuentes-Faura, J. Political corruption and earthquakes: Governance in Turkey under Erdogan’s rule. Governance 2025, 38, e12869. [Google Scholar] [CrossRef]
- Ertas, N. Autocratization, disaster management, and the politics of public administration in Turkey. Public Integr. 2024, 26, 624–634. [Google Scholar] [CrossRef]
- Cifuentes-Faura, J. Corruption in Turkey and earthquakes: Policies for tackling corruption in the construction sector. Manag. Decis. Econ. 2024, 45, 1808–1816. [Google Scholar] [CrossRef]
- Polat, O.; Ozer, C.; Ozturk, S. Seismological Aspects of Doublet Earthquakes Mw 7.8, and Mw 7.6, 6th February 2023, Türkiye/Syria Earthquake and Its Aftershocks: Causes and Consequences. In Seismotectonics of the East Mediterranean-Red Sea region; Springer Nature: Cham, Switzerland, 2025; pp. 287–307. [Google Scholar]
- Lagomarsino, S.; Penna, A. “Guidelines for the Implementation of the II Level Vulnerability Methodology. WP4: Vulnerability Assessment of Current Buildings”, Technical Presentation RISK-UE Project: An Advanced Approach to Earthquake Risk Scenarios with Application to Different European Towns. 2003. Available online: https://cordis.europa.eu/project/rcn/54199/factsheet/en (accessed on 3 April 2024).
- Avcil, F. Investigation of precast reinforced concrete structures during the 6 February 2023 Türkiye Earthquakes. Sustainability 2023, 15, 14846. [Google Scholar] [CrossRef]
- Kurt, N.G.; Oğuztürk, H.; Akgün, F.E.; Çetin, C.; Mutlu, R.İ. The 6th February 2023 Turkey Earthquake and emergency department admissions: A catastrophic disaster. Glob. Emerg. Crit. Care 2023, 24, 80–89, Erratum in Turk. J. Emerg. Med. 2024, 24, 80–89. [Google Scholar] [CrossRef]
- Shi, P.; Liu, L.; Fang, W.; Liu, J.; Wu, J.; Jiang, L.; Chen, B.; Zhang, G.; Zheng, H.; Zhang, Y. The 2023 earthquake in Türkiye and implications for China’s response to catastrophe. Int. J. Disaster Risk Sci. 2023, 14, 1044–1053. [Google Scholar] [CrossRef]
- Pavlenko, O.V.; Pavlenko, V.A. Rupture Directivity Effects of Large Seismic Sources, Case of February 6th 2023 Catastrophic Earthquakes in Turkey. Izvestiya Phys. Solid Earth 2023, 59, 912–928. [Google Scholar] [CrossRef]
- Tonkaz, G.; Sengul, D.; Bekci, T.; Sengul, I.; Cakir, I.M.; Onder, R.O.; Aksoy, I.; Bayar, A.E.; Tonkaz, M.; Aslan, S. A needful, unique, and in-place evaluation of the injuries in earthquake victims with computed tomography, in catastrophic disasters! The 2023 Turkey-Syria earthquakes: Part II. Rev. Assoc. Méd. Bras. 2023, 69, e20230550. [Google Scholar] [CrossRef]
- Li, X.; Li, C.; Liu, Y.; Chen, S.J.; Wang, C.M.; Sanjayan, J.G.; Duan, W.H. Improvement of mechanical properties by incorporating graphene oxide into cement mortar. Mech. Adv. Mater. Struct. 2018, 25, 1313–1322. [Google Scholar] [CrossRef]
- Long, W.J.; Zheng, D.; Duan, H.B.; Han, N.; Xing, F. Performance enhancement and environmental impact of cement composites containing graphene oxide with recycled fine aggregates. J. Clean. Prod. 2018, 194, 193–202. [Google Scholar] [CrossRef]
- Shi, D.; Geng, Y.; Li, S.; Gao, J.; Hou, D.; Jin, Z.; Liu, A. Efficacy and mechanism of graphene oxide modified silane emulsions on waterproof performance of foamed concrete. Case Stud. Constr. Mater. 2022, 16, e00908. [Google Scholar] [CrossRef]
- Jing, G.; Ye, Z.; Wu, J.; Wang, S.; Cheng, X.; Strokova, V.; Nelyubova, V. Introducing reduced graphene oxide to enhance the thermal properties of cement composites. Cem. Concr. Compos. 2020, 109, 103559. [Google Scholar] [CrossRef]
- Rafiee, M.A.; Rafiee, J.; Wang, Z.; Song, H.; Yu, Z.Z.; Koratkar, N. Enhanced mechanical properties of nanocomposites at low graphene content. ACS Nano 2009, 3, 3884–3890. [Google Scholar] [CrossRef]
- Tang, Y.; Yang, X.; Wang, R.; Li, M. Enhancement of the mechanical properties of graphene–copper composites with graphene–nickel hybrids. Mater. Sci. Eng. A 2014, 599, 247–254. [Google Scholar] [CrossRef]
- Tang, L.C.; Wan, Y.J.; Yan, D.; Pei, Y.B.; Zhao, L.; Li, Y.B.; Wu, L.B.; Jiang, J.X.; Lai, G.Q. The effect of graphene dispersion on the mechanical properties of graphene/epoxy composites. Carbon 2013, 60, 16–27. [Google Scholar] [CrossRef]
- Kumar, A.; Sharma, K.; Dixit, A.R. A review of the mechanical and thermal properties of graphene and its hybrid polymer nanocomposites for structural applications. J. Mater. Sci. 2019, 54, 5992–6026. [Google Scholar] [CrossRef]
- Shamsaei, E.; de Souza, F.B.; Yao, X.; Benhelal, E.; Akbari, A.; Duan, W. Graphene-based nanosheets for stronger and more durable concrete: A review. Constr. Build. Mater. 2018, 183, 642–660. [Google Scholar] [CrossRef]
- Du, H.; Gao, H.J.; Pang, S.D. Improvement in concrete resistance against water and chloride ingress by adding graphene nanoplatelet. Cem. Concr. Res. 2016, 83, 114–123. [Google Scholar] [CrossRef]
- Cano, M.; Khan, U.; Sainsbury, T.; O’Neill, A.; Wang, Z.; McGovern, I.T.; Maser, W.K.; Benito, A.M.; Coleman, J.N. Improving the mechanical properties of graphene oxide based materials by covalent attachment of polymer chains. Carbon 2013, 52, 363–371. [Google Scholar] [CrossRef]
- Wang, Y.; Colas, G.; Filleter, T. Improvements in the mechanical properties of carbon nanotube fibers through graphene oxide interlocking. Carbon 2016, 98, 291–299. [Google Scholar] [CrossRef]
- Pathak, A.K.; Borah, M.; Gupta, A.; Yokozeki, T.; Dhakate, S.R. Improved mechanical properties of carbon fiber/graphene oxide-epoxy hybrid composites. Compos. Sci. Technol. 2016, 135, 28–38. [Google Scholar] [CrossRef]
- Wan, Y.J.; Tang, L.C.; Gong, L.X.; Yan, D.; Li, Y.B.; Wu, L.B.; Jiang, J.X.; Lai, G.Q. Grafting of epoxy chains onto graphene oxide for epoxy composites with improved mechanical and thermal properties. Carbon 2014, 69, 467–480. [Google Scholar] [CrossRef]
- Gao, Y.; Liu, L.Q.; Zu, S.Z.; Peng, K.; Zhou, D.; Han, B.H.; Zhang, Z. The effect of interlayer adhesion on the mechanical behaviors of macroscopic graphene oxide papers. ACS Nano 2011, 5, 2134–2141. [Google Scholar] [CrossRef] [PubMed]
- Devi, S.C.; Khan, R.A. Effect of graphene oxide on mechanical and durability performance of concrete. J. Build. Eng. 2020, 27, 101007. [Google Scholar] [CrossRef]
- Fonseka, I.; Mohotti, D.; Wijesooriya, K.; Lee, C.K.; Mendis, P. Influence of graphene oxide properties, superplasticiser type, and dispersion technique on mechanical performance of graphene oxide-added concrete. Constr. Build. Mater. 2024, 428, 136415. [Google Scholar] [CrossRef]
- Pan, Z.; He, L.; Qiu, L.; Korayem, A.H.; Li, G.; Zhu, J.W.; Collins, F.; Li, D.; Duan, W.H.; Wang, M.C. Mechanical properties and microstructure of a graphene oxide–cement composite. Cem. Concr. Compos. 2015, 58, 140–147. [Google Scholar] [CrossRef]
- Reddy, P.V.R.K.; Prasad, D.R. Investigation on the impact of graphene oxide on microstructure and mechanical behaviour of concrete. J. Build. Pathol. Rehabil. 2022, 7, 30. [Google Scholar] [CrossRef]
- Peng, H.; Ge, Y.; Cai, C.S.; Zhang, Y.; Liu, Z. Mechanical properties and microstructure of graphene oxide cement-based composites. Constr. Build. Mater. 2019, 194, 102–109. [Google Scholar] [CrossRef]
- Liu, C.; Chen, F.; Wu, Y.; Zheng, Z.; Yang, J.; Yang, B.; Yang, J.; Hui, D.; Luo, Y. Research progress on individal effect of graphene oxide in cement-based materials and its synergistic effect with other nanomaterials. Nanotechnol. Rev. 2021, 10, 1208–1235. [Google Scholar] [CrossRef]
- Zeng, H.; Qu, S.; Tian, Y.; Hu, Y.; Li, Y. Recent progress on graphene oxide for next-generation concrete: Characterizations, applications and challenges. J. Build. Eng. 2023, 69, 106192. [Google Scholar] [CrossRef]
- Green, A.A.; Hersam, M.C. Emerging Methods for Producing Monodisperse Graphene Dispersions. J. Phys. Chem. Lett. 2010, 1, 544–549. [Google Scholar] [CrossRef]
- Divya, S.; Praveenkumar, S.; Akthar, A.S.; Karthiksoundar, N. Performance variation of graphene nanoplatelets reinforced concrete concerning dispersion time. Mater. Today Proc. 2023. [Google Scholar] [CrossRef]
- Nanjundappa, V.S.; Ramakrishnappa, T.; Kempahanumakkagari, S.; Prakash, H.R.; Praveen, B.M. Efficient strategies to produce Graphene and functionalized graphene materials: A review. Appl. Surf. Sci. Adv. 2023, 14, 100386. [Google Scholar] [CrossRef]
- Zaaba, N.I.; Foo, K.L.; Hashim, U.; Tan, S.J.; Liu, W.W.; Voon, C.H. Synthesis of graphene oxide using modified hummers method: Solvent influence. Procedia Eng. 2017, 184, 469–477. [Google Scholar] [CrossRef]
- Alam, S.N.; Sharma, N.; Kumar, L. Synthesis of graphene oxide (GO) by modified hummers method and its thermal reduction to obtain reduced graphene oxide (rGO). Graphene 2017, 6, 1. [Google Scholar] [CrossRef]
- Rabchinskii, M.K.; Shiyanova, K.A.; Brzhezinskaya, M.; Gudkov, M.V.; Saveliev, S.D.; Stolyarova, D.Y.; Torkunov, M.K.; Chumakov, R.G.; Vdovichenko, A.Y.; Cherviakova, P.D.; et al. Chemistry of Reduced Graphene Oxide: Implications for the Electrophysical Properties of Segregated Graphene–Polymer Composites. Nanomaterials 2024, 14, 1664. [Google Scholar] [CrossRef]
- Indukuri, C.S.R.; Nerella, R.; Madduru, S.R.C. Effect of graphene oxide on microstructure and strengthened properties of fly ash and silica fume based cement composites. Constr. Build. Mater. 2019, 229, 116863. [Google Scholar] [CrossRef]
- Yang, H.; Cui, H.; Tang, W.; Li, Z.; Han, N.; Xing, F. A critical review on research progress of graphene/cement based composites. Compos. A Appl. Sci. Manuf. 2017, 102, 273–296. [Google Scholar] [CrossRef]
- Domínguez-Santos, D.; Muñoz, P.; Morales-Ferreiro, J.O.; Acuña, C.; Diaz-Droguett, D.E.; Villaro, E. Reinforced Concrete with Graphene Oxide: Techno-Economic Feasibility for Reduced Cement Usage and CO2 Emissions. Int. J. Concr. Struct. Mater. 2025, 19, 52. [Google Scholar] [CrossRef]
- Qureshi, T.S.; Panesar, D.K. Nano reinforced cement paste composite with functionalized graphene and pristine graphene nanoplatelets. Compos. Part B Eng. 2020, 197, 108063. [Google Scholar] [CrossRef]
- Dhemla, P.; Somani, P.; Swami, B.L.; Gaur, A. Optimizing the design of sintered fly ash light weight concrete by Taguchi and ANOVA analysis. Mater. Today Proc. 2022, 62, 495–503. [Google Scholar] [CrossRef]
- Balaji, S.; Swathika, A. Review on mechanical and microstructural properties of cementitious composites with graphene oxide. Mater. Today Proc. 2022, 50, 2280–2287. [Google Scholar] [CrossRef]
- Kurda, R.; Salih, A.; Shakor, P.; Saleh, P.; Alyousef, F.; Ahmed, H.; Aslani, F. Mix design of concrete: Advanced particle packing model by developing and combining multiple frameworks. Constr. Build. Mater. 2022, 320, 126218. [Google Scholar] [CrossRef]
- ISO 20290-1:2021; Aggregates for Concrete—Test Methods for Mechanical and Physical Properties Part 1: Determination of Bulk Density, Particle Density, Particle Mass-Per-Volume and Water Absorption. ISO: Geneva, Switzerland, 2021.
- Dominguez-Santos, D.; Velasco, P.M. Evaluation and optimisation of regular RC frame structures of varying heights with graphene oxide. Sci. Rep. 2025, 15, 28078. [Google Scholar] [CrossRef]
- ISO 1920-2:2016; Testing of Concrete. Part 2: Properties of Fresh Concrete. ISO: Geneva, Switzerland, 2016.
- ISO 1920-4:2020; Testing of Concrete. Part 4: Strength of Hardened Concrete. ISO: Geneva, Switzerland, 2020.
- Małkowski, P.; Ostrowski, Ł.; Brodny, J. Analysis of Young’s modulus for Carboniferous sedimentary rocks and its relationship with uniaxial compressive strength using different methods of modulus determination. J. Sustain. Min. 2018, 17, 145–157. [Google Scholar] [CrossRef]
- ATC-40; Seismic Evaluation and Rehabilitation of Concrete Buildings. Applied Technology Council, EEUU: Redwood City, CA, USA, 1996.
- Federal Emergency Management Agency of the U.S. Department of Homeland Security; Building Seismic Safety Council of the National Institute of Building Sciences. NEHRP Recommended Seismic Provisions for New Buildings and Other Structures Volume II: Part 3 Resource Papers FEMA P-1050-2/2015 Edition; Building Seismic Safety Council: Washington, DC, USA, 2015.
- Devasena, M.; Karthikeyan, J. Investigation on strength properties of graphene oxide concrete. Int. J. Eng. Sci. Invent. Res. Dev. 2015, 1, 307–310. [Google Scholar]
- Cao, M.; Zhang, H.; Zhang, C. Effect of graphene on mechanical properties of cement mortars. J. Cent. South Univ. 2016, 23, 919–925. [Google Scholar] [CrossRef]
- Preethi, G.R.; Chikkanagoudar, R.S. A study on influence of graphene oxide powder on compressive strength of concrete. Int. Res. J. Eng. Technol. 2019, 6, 23. [Google Scholar]
- Yee, K.; Ghayesh, M.H. A review on the mechanics of graphene nanoplatelets reinforced structures. Int. J. Eng. Sci. 2023, 186, 103831. [Google Scholar] [CrossRef]
- Yeke, L.; Yu, Z. Effect of graphene oxide on mechanical properties of UHPC and analysis of micro-control mechanism. Mater. Res. Express 2021, 8, 095001. [Google Scholar] [CrossRef]
- Horszczaruk, E.; Mijowska, E.; Kalenczuk, R.J.; Aleksandrzak, M.; Mijowska, S. Nanocomposite of cement/graphene oxide—Impact on hydration kinetics and Young’s modulus. Constr. Build. Mater. 2015, 78, 234–242. [Google Scholar] [CrossRef]
- Hau Hong, D.L.; Mohammed, B.S.; Al-Fakih, A.; Wahab, M.M.A.; Liew, M.S.; Amran, Y.H.M. Deformation Properties of Rubberized ECC Incorporating Nano Graphene Using Response Surface Methodology. Materials 2020, 13, 2831. [Google Scholar] [CrossRef] [PubMed]
- Fraser, V. Building the New World: Studies in the Modern Architecture of Latin America 1930–1960; Verso: Brooklyn, NY, USA, 2000. [Google Scholar]
- Dominguez, D.; Muñoz, V.P.; Muñoz, V.L. Impact of using lightweight eco-bricks as enclosures for individual houses of one story on zones of high seismicity. Mater. Constr. 2017, 67, e133. [Google Scholar] [CrossRef]
- Panagiotakos, T.B.; Fardis, M.N. Seismic response of infilled RC frames structures. In Proceedings of the 11th World Conference on Earthquake Engineering, Acapulco, Mexico, 23–28 June 1996; Volume 23, p. 28. [Google Scholar]
- Xiao, J.; Sun, Y.; Falkner, H. Seismic performance of frame structures with recycled aggregate concrete. Eng. Struct. 2006, 28, 1–8. [Google Scholar] [CrossRef]
- López-Almansa, F.; Domínguez, D.; Benavent-Climent, A. Vulnerability analysis of RC buildings with wide beams located in low-to-mid seismicity regions. Eng. Struct. Eng. Struct. 2013, 46, 687–702. [Google Scholar] [CrossRef]
- Domínguez, D.; López-Almansa, F.; Benavent-Climent, A. Would RC wide-beam buildings in Spain have survived Lorca earthquake (11-05-2011)? Eng. Struct. 2016, 108, 134–154. [Google Scholar] [CrossRef]
- EN 1992-1-1:2004; Eurocódigo 2: Diseño de Estructuras de Hormigón—Parte 1-1: Reglas Generales y Reglas para Edificios. European Standard: London, UK, 1992.
- UNE-EN 1998-1:2018; Eurocódigo 8: Proyecto de Estructuras Sismorresistentes. Parte 1: Reglas Generales, Acciones Sísmicas y reglas para Edificación. UNE: Geneva, Switzerland, 1998.
- de la Edificación, C.T. Documento Básico de Seguridad Estructural. Bases De Cálculo RD 2006, 314-2006. [Google Scholar]
- Mohamed, H.; Romão, X. Analysis of the performance of strut models to simulate the seismic behavior of masonry infills in partially infilled RC frames. Eng. Struct. 2020, 222, 111124. [Google Scholar] [CrossRef]
- Nicola, T.; Leandro, C.; Guido, C.; Enrico, S. Masonry infilled frame structures: State-of-the-art review of numerical modelling. Earthq. Struct. 2015, 8, 225–251. [Google Scholar] [CrossRef]
- Rodrigues, H.; Varum, H.; Costa, A. Simplified macro-model for infill masonry panels. J. Earthq. Eng. 2010, 14, 390–416. [Google Scholar] [CrossRef]
- Eren, N.; Brunesi, E.; Nascimbene, R. Influence of masonry infills on the progressive collapse resistance of reinforced concrete framed buildings. Eng. Struct. 2019, 178, 375–394. [Google Scholar] [CrossRef]
- SeismoSoft. A Computer Program for Static and Dynamic Nonlinear Analysis of Framed Structures. 2018. Available online: http://www.seismosoft.com (accessed on 3 April 2024).
- UNE-EN 1996-3:2011; Eurocódigo 6: Proyecto de Estructuras de Fábrica. Parte 3: Métodos Simplificados de Cálculo para Estructuras de Fábrica sin Armar. UNE: Geneva, Switzerland, 2011.
- Smyrou, E.; Blandon, C.; Antoniou, S.; Pinho, R.; Crisafulli, F. Implementation and verification of a masonry panel model for nonlinear dynamic analysis of infilled RC frames. Bull. Earthq. Eng. 2011, 9, 1519–1534. [Google Scholar] [CrossRef]
- Domínguez, D.; López Almansa, F.; Benavent Climent, A. Comportamiento, para el terremoto de Lorca de 11-05-2011, de edificios de vigas planas proyectados sin tener en cuenta la acción sísmica. Inf. Construcción 2014, 66, 1–9. [Google Scholar] [CrossRef]
- Spears, R.E.; Jensen, S.R. Approach for selection of Rayleigh damping parameters used for time history analysis. J. Press. Vessel. Technol. 2012, 134, 061801. [Google Scholar] [CrossRef]
- Jagota, V.; Sethi, A.P.S.; Kumar, K. Finite element method: An overview. Walailak J. Sci. Technol. 2013, 10, 1–8. [Google Scholar]
- Bathe, K.-J. Finite element method. Wiley: Hoboken, NJ, USA, 2007; pp. 1–12. [Google Scholar] [CrossRef]
- Ferreira, M.; Providência, P.; Gala, P.; Almeida, J. Improved displacement based alternative to force based finite element for nonlinear analysis of framed structures. Eng. Struct. 2017, 135, 95–103. [Google Scholar] [CrossRef]
- Mander, J.B.; Priestley, M.J.; Park, R. Theoretical stress-strain model for confined concrete. J. Struct. Eng. 1988, 114, 1804–1826. [Google Scholar] [CrossRef]
- Mander, J.B.; Priestley, M.J.N.; Park, R. Observed stress-strain behavior of confined concrete. J. Struct. Eng. 1988, 114, 1827–1849. [Google Scholar] [CrossRef]
- Chang, G.A.; Mander, J.B. Seismic Energy Based Fatigue Damage Analysis of Bridge Columns: Part I—Evaluation of Seismic Capacity; National Center for Earthquake Engineering Research: Buffalo, NY, USA, 1994; p. 222. [Google Scholar]
- Ferrara, E.; Bosco, M.; Ghersi, A.; Marino, E.M.; Rossi, P.P. Improvement of the Model Proposed by Menegotto and Pinto for Steel. Eng. Struct. 1983, 124, 442–456. [Google Scholar]
- Appino, C.; Ferrara, E.; Fiorillo, F.; Ragusa, C.; de la Barrière, O. Static and dynamic energy losses along different directions in GO steel sheets. J. Magn. Magn. Mater. 2020, 500, 166281. [Google Scholar] [CrossRef]
- Zienkiewicz, O.C.; Taylor, R.L. The Finite Element Method for Solid and Structural Mechanics; Elsevier: Burlington, MA, USA, 2005. [Google Scholar]
- Neuenhofer, A.; Filippou, F.C. Evaluation of nonlinear frame finite-element models. J. Struct. Eng. 1997, 123, 958–966. [Google Scholar] [CrossRef]
- Wang, T.; Hsu, T.T. Nonlinear finite element analysis of concrete structures using new constitutive models. Comput. Struct. 2001, 79, 2781–2791. [Google Scholar] [CrossRef]
- Scott, M.H.; Fenves, G.L.; McKenna, F.; Filippou, F.C. Software Patterns for Nonlinear Beam-Column Models. J. Struct. Eng. 2008, 134, 562–571. [Google Scholar] [CrossRef]
- Inel, M.; Ozmen, H.B. Effects of plastic hinge properties in nonlinear analysis of reinforced concrete buildings. Eng. Struct. 2006, 28, 1494–1502. [Google Scholar] [CrossRef]
- Zhao, X.M.; Wu, Y.F.; Leung, A.Y.T. Analyses of plastic hinge regions in reinforced concrete beams under monotonic loading. Eng. Struct. 2012, 34, 466–482. [Google Scholar] [CrossRef]
- Scott, M.H.; Fenves, G.L. Plastic Hinge Integration Methods for Force-Based Beam–Column Elements. J. Struct. Eng. 2006, 132, 244–252. [Google Scholar] [CrossRef]
- Calabrese, A.; Almeida, J.P.; Pinho, R. Numerical issues in distributed inelasticity modelling of RC frame elements for seismic analysis. J. Earthq. Eng. 2010, 14, 38–68. [Google Scholar] [CrossRef]
- Zhao, X.; Wu, Y.F.; Leung, A.Y.; Lam, H.F. Plastic hinge length in reinforced concrete flexural members. Procedia Eng. 2011, 14, 1266–1274. [Google Scholar] [CrossRef]
- Ning, C.L.; Li, B. Probabilistic approach for estimating plastic hinge length of reinforced concrete columns. J. Struct. Eng. 2016, 142, 04015164. [Google Scholar] [CrossRef]
- Bae, S.; Bayrak, O. Plastic hinge length of reinforced concrete columns. ACI Struct. J. 2008, 105, 290. [Google Scholar] [CrossRef]
- Mergos, P.E.; Kappos, A.J. Estimating fixed-end rotations of reinforced concrete members at yielding and ultimate. Struct. Concr. 2015, 16, 537–545. [Google Scholar] [CrossRef]
- Taibi, H.; Ait Youcef, M.; Khellafi, M. Seismic vulnerability assessment using the macroseismic method proposed in the framework of the Risk-UE project, based on the recommendations of the Algerian seismic code RPA99/Version 2003. Asian J. Civ. Eng. 2020, 21, 59–66. [Google Scholar] [CrossRef]
- Topçu, İ.B.; Uğurlu, A. TS 500/2000 Standardının Beton Açısından İncelenmesi. In Proceedings of the ECAS2002 Uluslararası Yapı ve Deprem Mühendisliği Sempozyumu, Ankara, Türkiye, 14 October 2002; Volume 14, pp. 492–499. [Google Scholar]
- Code, T.E. Specifications for Buildings to Be Built in Seismic Areas; Ministry of Public Works and Settlement: Ankara, Turkey, 2007.
- Katona, M.C.; Zienkiewicz, O.C. A unified set of single step algorithms part 3: The beta-m method, a generalization of the Newmark scheme. Int. J. Numer. Methods Eng. 1985, 21, 1345–1359. [Google Scholar] [CrossRef]
- Salehi, M.; Sideris, P. Enhanced Rayleigh Damping Model for Dynamic Analysis of Inelastic Structures. J. Struct. Eng. 2020, 146, 04020216. [Google Scholar] [CrossRef]


Disclaimer/Publisher’s Note: The statements, opinions and data contained in all publications are solely those of the individual author(s) and contributor(s) and not of MDPI and/or the editor(s). MDPI and/or the editor(s) disclaim responsibility for any injury to people or property resulting from any ideas, methods, instructions or products referred to in the content. |
© 2025 by the author. Licensee MDPI, Basel, Switzerland. This article is an open access article distributed under the terms and conditions of the Creative Commons Attribution (CC BY) license (https://creativecommons.org/licenses/by/4.0/).