Abstract
Aldehyde dehydrogenase 1A1 (ALDH1A1) has emerged as a significant biomarker associated with tumor progression, chemoresistance, and poor prognosis in various cancers, including breast, lung, prostate, and lymphoma. Current diagnostic methods for ALDH1A1, such as flow cytometry and ELISA, are limited by long detection times, the need for labeling, and a reduced sensitivity in complex biological matrices. This study presents a novel optical fiber biosensor based on magnesium silicate nanoparticle-doped fibers for the label-free detection of ALDH1A1. The biosensor design incorporated protein G for enhanced antibody orientation and binding efficiency and anti-ALDH1A1 antibodies for specific recognition. Several sensor configurations were fabricated using a semi-distributed interferometer (SDI) format, and their performances were evaluated across a wide concentration range (10 fM–100 nM) in both phosphate-buffered saline (PBS) and fetal bovine serum (FBS). Our findings demonstrated that the inclusion of protein G significantly improved sensor sensitivity and reproducibility, achieving a limit of detection (LoD) of 172 fM in PBS. The sensor also maintained a positive response trend in FBS, indicating its potential applicability in clinically relevant samples. This work introduces the first reported optical fiber biosensor for soluble ALDH1A1 detection, offering a rapid, label-free, and highly sensitive approach suitable for future use in cancer diagnostics.
1. Introduction
Cancer is a multifactorial disease characterized by uncontrolled cellular proliferation, genetic mutations, and the ability to invade surrounding tissues and metastasize to distant organs. Despite advances in treatment modalities, the global burden of cancer continues to rise, with over 19 million new cases and nearly 10 million deaths reported in 2020 alone [1]. Among top cancer cases are lung, female breast, colorectal, and prostate cancers in 2022, with 12.4%, 11.6%, 9.6%, and 7.3% of all cases, respectively [2]. Early detection remains a critical factor in improving survival rates and treatment efficacy. In this context, the early detection of malignant cancer development in patients is crucial, and biomarkers come into play as a crucial tool. Biomarkers are biological molecules (i.e., proteins, nucleic acids) that are measurable and serve as indicators of normal biological or pathogenic processes or responses. In cancer diagnostics, they can be found in tissues, blood, urine, or other body fluids. Therefore, biomarkers serve several important functions in cancer research and the medical field to help patients, such as in early detection, screening, staging, and the monitoring of cancer disease progression.
One of these biomarkers that has been of significant interest among researchers is aldehyde dehydrogenase (ALDH). ALDH is a superfamily of enzymes consisting of 19 isozymes. In the cell, they are responsible for processes like the inhibition of reactive oxygen species (ROS) production, the detoxification of reactive aldehydes into carboxylic acids, and the synthesis of retinoic acid [3,4]. The ALDH1A1 and ALDH1A3 isoforms are especially significant, as they have shown drug and radiation resistance. Specifically, ALDH1A1 was upregulated in breast cancer and lung cancer, and was reported as the reason for chemoresistance to cyclophosphamide [5], doxorubicin [6], and paclitaxel [7], respectively. Moreover, an increased expression of ALDH1A1 was reported in specific types of cancer diseases. The occurrence of lymph node metastases was substantially correlated with colorectal cancer (CRC) tissues, which may be a possible prognostic indicator in CRC patients [8]. In malignant prostate cancer cells, there was a positive correlation between prostate cancer growth, malignancy, and ALDH1A1 presence [9]. In the case of non-Hodgkin’s lymphoma (NHL), there was a strong correlation between a high expression of ALDH1A1 and a poor prognosis in NHL [10].
Moreover, cancer stem cells, a subpopulation of tumor cells with stem-like properties such as the ability to differentiate and self-renew into various cell types within a tumor, have been of significant interest for many years. They play a critical role in cancer initiation, metastasis, resistance to therapy, and tumor relapse. High ALDH1A1 activity has shown a positive relationship between cancer cell stemness, their metastasis, and chemoresistance in various cancers: prostate [11], ovarian [12,13], and breast [14] cancer stem cells. Therefore, studying ALDH1A1 as a functional marker has the potential to reveal the mechanisms behind cancer cell stemness and help in diagnostics and treatment.
Recent advancements in molecular biology and high-throughput technologies, including next-generation sequencing and proteomics, have accelerated the discovery and validation of novel cancer biomarkers. Despite this progress, challenges in translating these biomarkers into routine clinical practice still exist. Issues such as sensitivity, specificity, reproducibility, and accessibility need to be addressed to maximize their impact. There is the ALDEFLUOR™ assay, which is an agent used in flow cytometry that emits green fluorescent light in ALDH-expressing cells [15]. Despite the ALDEFLUOR™ assay being reliable and efficient, it bears slightly low contrast due to its “always-on” feature and is used in vitro only. There are alternatives called CS5-A and CS7-A, which work in deep red or near-infrared spectra and turn on only after interaction with ALDH1A1 [16]. Another popular tool for ALDH1A1 detection is the ELISA kit with the sensitivity of 220 pg/mL [17], and it was used in the detection of the protein in non-small cell lung cancer (NSCLC) taken from patients [18]. Despite those methods being sensitive to ALDH1A1 and being utilized reliably, sometimes even for in vivo applications, they rely on labeled fluorescent molecules or suffer from background noise. Most importantly, the detection time takes from 15 min to 3 h.
Optical fiber biosensors are another alternative for developing a sensing tool that is not only as reliable and sensitive as the abovementioned tools, but is also fast. And some variations can be made label-free. The binding of target molecules on the tip of the fiber changes the incident light’s intensity or wavelength, and the light is reflected back to be recorded by the interrogator. There are many types of optical fiber biosensors, depending on the method of fabrication and sensing material. Optical fiber biosensors offer advantages like high sensitivity and specificity, real-time and label-free detection, miniaturization and portability, immunity to electromagnetic interference, and working with complex samples (blood, serum, saliva) [19,20]. They can be metal-based, nanoparticle-based, and attached with receptors like antibodies, aptamers, or molecularly imprinted polymers (MIP) [21]. The successful utilization of optical fiber biosensors like ball tip fibers for the detection of colon and gastric or breast cancers was reported earlier for the CD44 biomarker [19] and sHER2 [20], respectively, at ultra-low-level concentrations. Recently, Mg-silicate-based nanoparticle-doped optical fibers have been used to detect the vascular endothelial growth factor down to the 26.6 fg/mL level for the purpose of fabricating biosensing tools for the early diagnosis of diabetic retinopathy [22].
As of now, there are no reported optical fiber biosensors designed to detect ALDH1A1 proteins, especially label-free ones. Specifically, currently there are no published works on surface plasmon resonance, interferometric biosensors, optical fiber biosensors, and surface-enhanced Raman scattering (SERS)-based biosensors for the detection of ALDH1A1. Only fluorescent probes targeting cytosolic ALDH1A1 are present as discussed in the sections above. Therefore, this work aims to cover this gap in knowledge and explore the possibility of designing optical fiber biosensors for the detection of the ALDH1A1 biomarker. However, it is important to find out the normal levels of presence of ALDH1A1 in the blood, as the ultimate goal of this research is to develop a biosensing tool that can detect the protein in the human serum. Serum analysis in healthy individuals and patients with lung cancer has shown that normal ALDH1A1 levels range between 5 and 8 ng/mL in healthy controls, while protein levels above 10 ng/mL were considered to be found in patients with lung cancer [18]. Another study on serum ALDH1A1 levels based on the chemiluminescence sandwich immunoassay indicated that normal levels of the protein ranged around 1.05 ng/mL and depended on the kit sensitivity [23]. They showed that, compared to CD44 protein in serum, ALDH1A1 is not a good prognostic biomarker in breast cancer. However, other studies on lung, cervical, and colon cancer showed the relevance of using serum ALDH1A1 as a cancer biomarker. The protein was more elevated in non-small-cell lung cancer patients with advanced disease, and it was better in distinguishing cancer from benign illness or healthy conditions compared to a carcinoembryonic antigen. However, combining these proteins could boost the diagnosis rate of this type of lung cancer [24]. The protein was also elevated in the serum of cervical cancer patients, and this finding correlates with the elevated levels of mRNA. The cancerous tissues had significantly higher levels of ALDH1A compared to adjacent healthy tissues [25]. In a study using serum protein in colorectal cancer, ALDH1A1, together with another biomarker (hepsin), was significantly increased in patients after chemotherapy (581.060 ± 240.426 ng/mL vs. 66.433 ± 34.389 ng/mL) [26].
Ideas of enhancing the sensitivity and specificity of biosensors were of great interest from the early years of biosensor development. One of the targeted ways in this field is the utilization of protein G as a scaffold to increase the functionalization success and make the orientation of antibodies used for detection more specific and better, thus increasing the overall sensitivity of the biosensor [27]. Gold nanorods and gold nanoparticles treated with protein G prior to antibody immobilization have shown increased sensitivity; a gold nanoparticle-based sensor even showed an ultra-low detection of 0.34 pg/mL [28,29].
In this work, Mg-silicate nanoparticle-doped optical fiber, in combination with protein G, will be used to fabricate an interferometer functionalized with an anti-ALDH1A1 antibody for the detection of the ALDH1A1 biomarker. It is expected that the successful orientation of antibodies on the surface of the tip will increase the sensitivity of the optical fiber biosensor during the detection of the biomarker.
2. Materials and Methods
2.1. Materials
Phosphate-buffered saline (PBS), sulfuric acid, hydrogen peroxide, methanol, (3-Aminopropyl)triethoxysilane (APTMS), and glutaraldehyde (GA) were purchased from Sigma Aldrich (Darmstadt, Germany). Methoxy polyethylene glycol amine (mPEG-amine) and recombinant Protein G (cat# 101200) were purchased from Thermofisher Scientific (Waltham, MA, USA). Anti-ALDH1A1 monoclonal antibody (cat# MAE824Hu21) and recombinant ALDH1A1 protein (target biomarker) (cat# RPE824Hu01) were purchased from Cloud Clone Corp (Wuhan, China).
2.2. Fabrication and Calibration of Sensors
Standard single-mode fiber (SMF-28) and enhanced backscattering fiber (EBF) doped with Mg-silicate nanoparticles were used to fabricate sensors. Fiber cleaver (Fujikura CT-08) and standard telecom splicer (Fujikura 36-S) were used to provide fibers with a flat end face and to splice two types of fibers, respectively. SMF and EBF doped with nanoparticles were used in a simple fabrication process named “splice and cut,” which results in a semi-distributed interferometer (SDI). Basically, SMF and EBF were fused together, creating one long fiber structure. Then, joint EBF was cut in such a way that approximately 1 mm of length remains connected to the SMF, which results in a cavity. An illustration of the process is shown in Figure 1. The cavity plays the role of a mirror that reflects back some of the incident light coming from the interrogator system.
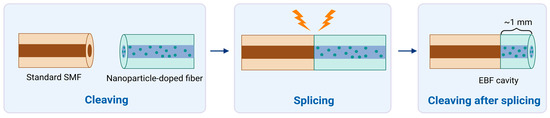
Figure 1.
Fabrication and interrogation of the semi-distributed interferometer (SDI) sensors for refractive index sensing, highlighting the splice-and-cleave operation. Standard single-mode fiber (SMF) is spliced with nanoparticle-doped fibers and is cleaved at the tip to produce enhanced-backscattering fiber (EBF). Created in BioRender. Bekmurzayeva, A. (2025) https://BioRender.com/44jwh9n.
Fabricated SDIs were further calibrated by using sucrose solution. Fibers were put into a custom-made plastic vial with 6 mL of 10% sucrose solution, and the signal reflected back by the EBF side was recorded by the HYPERION si255 optical backscatter reflectometer (Luna Inc., Atlanta, GA, USA). In a stepwise manner, 400 µL of 40% sucrose solution was added five more times, and the signal was recorded after each addition. This gradual increase in concentration created a gradient of refractive index change, which affected the reflected light signal and was recorded via the instrument. Later, these data were analyzed using MATLAB™ software (2014 version), and the sensitivity values of fibers were obtained. The fibers were filtered out by their sensitivity: the fibers with good sensitivity were considered to be ones with maximum sensitivity values above 50 dB/RIU.
2.3. Functionalization of Sensors
In order to produce the ALH1A1 biosensor, sensors with good sensitivity were further functionalized as shown in Figure 2. First, Piranha solution (sulfuric acid + hydrogen peroxide in a 4:1 ratio) was used for 15 min to clean any organic residues and increase the hydroxyl groups (-OH) on the surface of the tip. After treatment with the Piranha solution, fibers were rinsed with distilled water and left to air dry, or they were dried with nitrogen gas. Later, fibers were immersed in a 1% APTMS in methanol solution for 30 min for the silanization process. As a result, the surface of the fiber tip was modified to have amino groups attached to it. Next, fibers were heated in the oven at 110 °C for 1 h to facilitate the cross-linking between silane molecules. Then, fibers were incubated for another hour in 25% glutaraldehyde (GA) in PBS solution. Silane groups attached in the previous step enabled the binding of GA molecules, modifying the fiber tip further. This step was crucial because GA is susceptible to further modifications, and it could create a cross-link between proteins (i.e., antibodies) and other organic molecules.
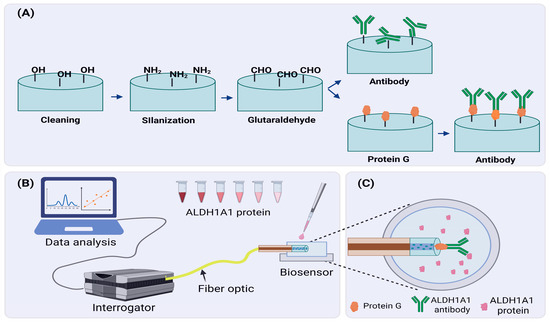
Figure 2.
Developing an ALDH1A1 biosensor. (A) A schematic of the functionalization process of the fiber tip surface; (B) A schematic overview of an experimental setup designed for detection of the ALDH1A1 biomarker; (C) ALDH1A1 biosensor in protein solution. Created in BioRender. Bekmurzayeva, A. (2025) https://BioRender.com/t4k6jnl.
After chemical modification, we stepped into the phase of immobilization of anti-bodies on the surface of the fiber tip. Due to modifications performed in previous steps, antibody molecules were able to attach to the surface of the fiber tip. For this, fibers were incubated with 4 µg/mL of antibodies in PBS for 1 h. In the case of modification with protein G, first, fibers were incubated in protein G (1 µg/mL) solution in PBS for 1 h, and then they were incubated in antibody solution. After these steps, fibers were put into a 10% mPEG-amine solution in PBS for blocking purposes. Free spaces of GA cross-linkers were blocked by mPEG-amine molecules to decrease the chances of random binding of target proteins during the detection. Some fibers were not immobilized with antibodies but were treated with mPEG-amine blocking solution to use them as a negative control.
2.4. Studying Surface Morphology Using Atomic Force Microscope
Surface morphology of the fibers during the functionalization steps was analyzed using the SmartSPM 1000 (AIST-NT Inc., Novato, CA, USA) scanning probe microscope. The analysis was performed in alternating current, non-contact mode. All measurements were performed with a scanning rate of 1 Hz; the scan range was set to 1 µm × 1 µm in X-Y with height Z set to automatic mode. MagneticMulti75-G silicon AFM probes (Budget Sensors, Misato, Japan) with cobalt alloy tip coating, aluminum reflective coating with a force constant of 3 N/m, and a resonance frequency of 75 kHz in air were used for analysis.
2.5. Measuring Analytes Using Biosensors and Analyzing Specificity
Successfully functionalized fibers were further used in the detection. ALDH1A1 protein solutions with various concentrations were prepared and used for the detection purposes. The ALDH1A1 protein biomarker was diluted in the PBS. The starting concentration was considered to be PBS. The lowest ALDH1A1 protein concentration used was 10 fM and the highest concentration was 100 nM, respectively. Fibers connected to the HYPERION si255 instrument were placed into the plastic cap with 200 µL of either PBS or protein solutions. Biomarkers were measured starting from the lowest to the highest concentration. Each concentration of biomarkers was measured for 10 consecutive minutes, and the signal was detected every minute. Obtained data were analyzed via MATLAB software, and the detection curves were designed. For specificity studies, the response of the fully functionalized biosensors, i.e., sensors functionalized with ALDH1A1 antibodies with and without protein G, were compared to sensors without antibodies (functionalization as in Section 2.3. omitting incubation with antibodies).
The limit of detection (LoD) was evaluated according to [30], according to the following equation: LoD = f−1(yblank + 3σmax) where y = f(x) is the measurement function estimated using log-linear regression, yblank is the blank level, and σmax is the maximum of standard deviation (10 consecutive measurements).
3. Results and Discussion
3.1. Sensitivity of the Fabricated Sensors
After the SMF-28 fibers were spliced with the fibers containing nanoparticles (EBF) to produce SDI sensors, they were filtered out based on a calibration experiment. Fibers that showed a sensitivity of ≥50 dB/RIU (refractive index unit) or over were selected for further surface modification. Each sensor trace was processed in MATLAB™ using a custom code to extract relevant performance metrics. Peak-finding algorithms were applied to identify local maxima (peaks) and minima (valleys) across the spectrum. Figure S1 displays an example of a well-performing sensor (Trace 1), where strong, repeatable peaks and valleys are observed. These features are well-pronounced and distinct, allowing for reliable tracking under changing RI conditions. Figure S1a shows the full spectra of the SDI sensor at a wavelength ranging from 1480 to 1620 nm in a sucrose solution as it is recorded by the interrogator. The highest peak in the spectra belongs to the FBG fiber, which played a dual role during the experiments: temperature control and facilitating spectral detection by the interrogator. In the right picture, the sensitivity spectra of the same SDI fiber with its peaks and valleys are illustrated. To measure the sensor’s responsiveness to RI variations, the sensitivity in dB/RIU was determined by monitoring the movement of specific peaks and valleys through the RI variations. In the high-performing sensor (Figure S1b), specific spectral characteristics showed sensitivities surpassing 50 dB/RIU, meeting the criteria for biofunctionalization. This specific SDI had a maximum sensitivity of 92.4 dB/RIU as shown in Figure S1b, but that was not the only factor to be considered. The fiber’s sensitivity spectra were also analyzed for overall peaks and valleys. In general, this SDI had several valleys with good sensitivities closer to the maximum sensitivity. Based on these two factors, the selected sensors were used in the next functionalization step to produce the ALDH1A1 biosensor.
3.2. Surface Morphology Analysis of the Functionalized Sensors
Sensitive sensors were then functionalized with antibodies against ALDH1A1 with and without protein G before measuring the target protein. AFM is very useful in determining nanoscale changes on modified surfaces [31]; this includes the analysis of modified sensor surfaces for biosensor production [32,33]. Figure 3 below shows AFM images displaying representative morphologies (3D) of fiber sensor tips during the functionalization steps and root mean square roughness (RMS Sq) of the surfaces. Treating optical fibers with Piranha solution is performed to obtain a clean surface with increased hydroxyl groups available for the next step—silanization. The glass after cleaning (Figure 3A) shows a mostly flat surface with the height of particles close to 0 (±0.3 nm), with some higher particles (1–1.5 nm). After silanization (Figure 3B and Figure S2), the roughness of the sensor increases with particles ranging from 0.8 to 1.5 nm. After treating the surface with glutaraldehyde, the overall surface roughness (RMS Sq) increases, while the bigger areas in the surface become smoother as in other work [22]. Such a roughening of the surface with each subsequent treatment is in accordance with another study, which used a similar surface treatment (Piranha-silanization with APTES (not APTMS)-glutaraldehyde-antibody) [33].
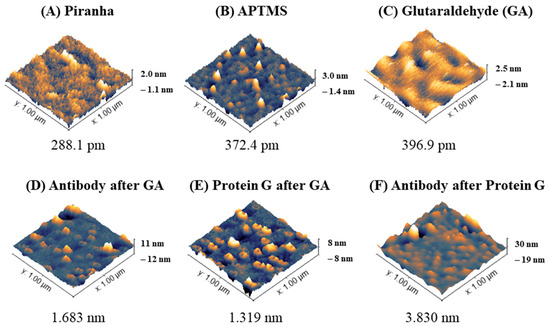
Figure 3.
Surface morphology analysis of optical fibers during functionalization to produce biosensor for ALDH1 protein detection. Three-dimensional images (scan area 1 µm × 1 µm) and root mean square roughness (RMS Sq [nm]) of the surfaces analyzed in an AC mode are shown.
The next step in the surface modification was attaching the ligand (anti-ALDH antibodies), or firstly protein G before the antibodies. The amine groups of the amino acids on both protein G and the antibodies are supposed to covalently bind with glutaraldehyde to form amide bonds. AFM characterization of the fibers after anti-ALDH1A1 after GA, protein G after GA, and anti-ALDH1A1 after protein G are shown in Figure 3D–F and their cross-sectional profile in Figure S3. The roughness of antibodies on GA was higher than protein G on GA, which might be due to the smaller size of protein G. The average height of protein G reported by Lee et al. was 1.35 nm [34]. AFM results for IgG molecules in the scientific literature are different: the height of an individual molecule of the IgG antibody on an aldehyde-treated (2.5% glutaraldehyde) surface (most likely mostly in a head-on orientation) was reported to be 5.416 nm [35], while FITC-labeled rabbit IgG on a glutaraldehyde-treated surface was 2 ± 1 nm and the roughness of the antibody layer was 0.5 ± 0.7 nm [36]. According to Ierardi et al. [37], the height range of the antibody on AFM is from 4 to 6.5 nm. Gole et al. concluded that the average height of IgG was 1.9 ± 0.3 nm. A monolayer of IgG was reported to be 4 nm thick [38]. The discrepancy of the reported results most likely depends on the type and mode of AFM (cryo- vs. air/buffer, tapping mode vs. contact mode), the concentration of the antibodies, the nature of the substrate, and the way molecules were immobilized or absorbed, among other factors. The analysis of antibodies after protein G showed the formation of larger complexes compared to antibodies or protein G alone, as shown in Figure 3 and Figure S3. The complexes of antibody–antigen (e.g., BSA-anti-BSA) were also shown to form larger structures on AFM than the individual molecules of study [39].
3.3. Characterizing the Performance of Optical Fiber Biosensor with Protein G
After the full functionalization with protein G and antibodies against ALDH1A1, the performance of the optical fiber biosensor was tested in an increasing concentration of the analyte of interest and was analyzed from different perspectives. Figure 4 shows an overall response of the biosensor, with increasing concentrations of the protein where the highest peak corresponds to the signal from the FBG. The inset in the figure shows the peak in the range of 1526–1526.5 nm, which was used for a detailed analysis of the response showing a lowering of the signal as the concentration of ALDH1A1 increases. The soluble form of ALDH1A1 was also found to be a biomarker for cervical cancer [25], a diagnostic and prognostic biomarker for non-small cell lung cancer [24], and was elevated after chemotherapy (together with hepsin) in colorectal cancer [26]. Table S1 shows various available assays for analysis of this protein. As can be seen from the table, most of the assays target the cytoplasmic or cell-expressed form of the protein. The assays for the soluble form of ALDH1A1 are limited, with ELISA being the main method to detect. A simple and minimally intrusive method of evaluating tumor biology may be provided by bloodstream protein expression. Additionally, serum proteomics can reveal details on systemic reactions to the tumor, including immunological response, angiogenesis, and inflammation, that might not be shown by histology or clinical parameters. Additionally, longitudinal measurements of serum proteins enable tracking the course of the disease and the effectiveness of treatment over time [40].
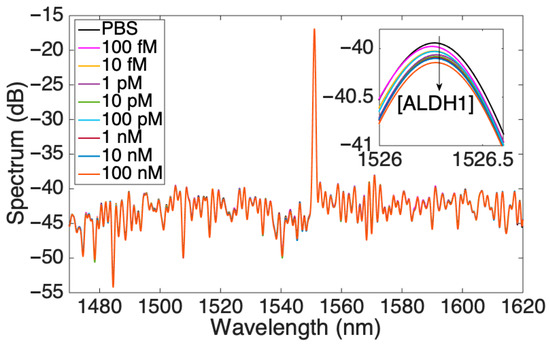
Figure 4.
Spectrum of the SDI sensor for various concentrations of ALDH1 protein; the inset shows one peak at 1526 nm.
While Figure 4 shows the overall signal as obtained by the interrogator, Figure 5 presents a rainbow heatmap of one of the SDI biosensors to display the change in the signal intensity throughout the wavelength range tracked by the interrogator as the concentration of the protein increases with time. It is an alternative way to illustrate the real-time dynamic intensity changes for each spectral peak of the biosensor. The upper color scalebar shows the dB change in the signal response, while the lower axis indicates both the ALDH1A1 concentrations starting from 10 fM to 100 nM and a timescale which shows that each concentration was measured for 10 consecutive minutes. As can be seen from the figure, there is a consistent change in intensity towards the red region at some of the wavelength values, suggesting an increase in RI due to increased binding of the ALDH1 on the sensor surface. This change is more prominent at the 30th minute, which most likely is attributed to an increased binding of the analyte on the sensor surface, which results in more prominent changes in the surrounding RI detectable by the biosensor.
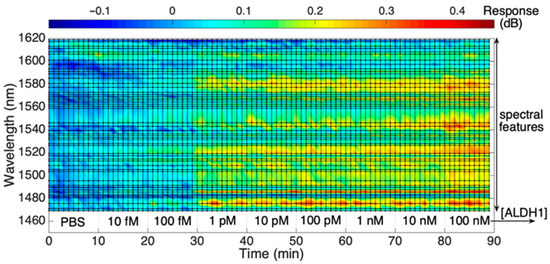
Figure 5.
Response of the SDI spectral peaks, measured from the reference value, during exposure to ALDH1 concentration from 10 fM to 100 nM in PBS.
As the concentration of ALDH1A1 grows (with regard to the reference condition), the intensity change for each peak and valley are examined. Since each spectral feature has a different sensitivity, the whole spectral features of the dataset are fit into a Gaussian probability distribution function (PDF). Reconstructed as a Gaussian function, the PDF for the ALDH1 biosensor exhibits a broadening of the distribution and a rightward shift with increasing concentrations of the ALDH1A1 protein, as seen in Figure 6.
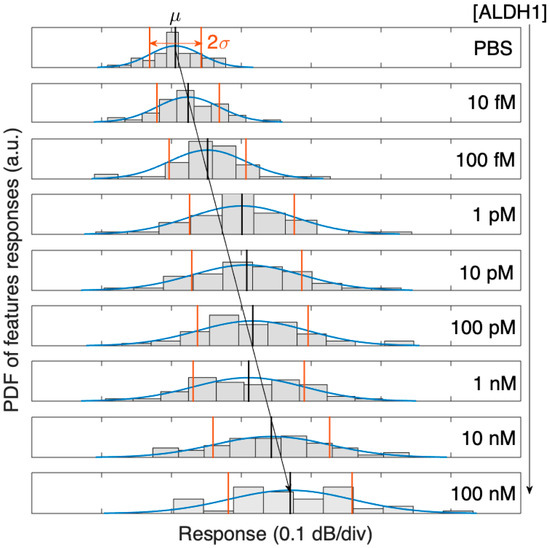
Figure 6.
Probability density function (PDF) of the 50 spectral peaks of the SDI spectrum, evolving with concentrations of ALDH1 from 10 fM to 100 nM, and its Gaussian distribution fit (μ = mean value, 2σ = two-sided standard deviation).
The real-time dynamic response of the biosensor with an increasing concentration of the protein in PBS was also studied and is shown to be stepwise; in general, the increment change is similar among all transitions between the concentrations except for two transitions, as can be seen in Figure 7a. The timed-average response (shaded blue region) indicates a gradual increase in response as the protein concentration grows with a more prominent increase in the signal at the 30th minute, which is consistent with the results shown in Figure 5. In addition, further analysis of the response change with increased protein concentrations in Figure 4 was performed to estimate the LoD of the biosensor, which was equal to 172 fM, as shown in Figure 7b. As with the results based on the signal change (in dB), the PBS signal was set as a background and was removed from the signal peak values (in dB) of other concentrations (10 fM–100 nM). Then, that difference is graphed in the figures below. Considering that the molecular weight of the ALDH1A1 is 55 kDA, the LoD obtained in this work equals 9.46 ng/mL. This is higher than the normal ALDH1A1 levels of healthy patients, but enough to detect the ALDH1A1 in the blood of lung cancer patients, as it had been shown to be higher than 10 ng/mL [18]. The obtained LoD is also higher than that of the commercial ELISA, as shown in Table S1 (220 pg/mL). However, the primary disadvantages of ELISA are the long analysis time (several incubation and washing steps), the use of substrates for enzymes and fluorescently tagged molecules, and that measurement is not performed in real time. The biosensor developed in this study is fabricated using telecommunication-grade fiber, and the measurement is performed in a label-free and real-time manner. Moreover, biosensors based on similar platforms used in this work were successfully used for the multiplexed detection of relevant soluble protein biomarkers [22] and could be translated in the case of ALDH1A1 given its significance as a co-biomarker in colorectal cancer (together with hepsin [26]) and in lung cancer (together with carcinoembryonic antigen [24]).
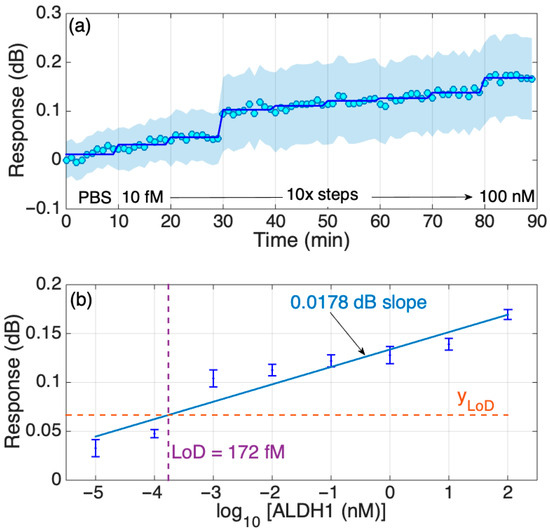
Figure 7.
Response of the SDI sensor in PBS. (a) Dynamic response, changing concentration every 10 min from 10 fM to 100 nM in 10-fold steps. The chart reports the real-time and the time-average trace, and the two-sided standard deviation (shadowed trace). (b) Response of the sensor in FBS; the error bars report ± standard deviation over 10 consecutive measurements.
3.4. Comparison with Sensors Without Protein G and Without Antibodies
One type of methodological non-specificity (as opposed to immunological non-specificity) which can occur during the development of antibody-based assays is the mis-orientation of proteins [41]. The random modification of antibodies on the sensor surface, especially when the antibody is immobilized with its Fab fragment, frequently results in a diminished antibody activity and a reduced capacity to identify antigens, which leads to a lowered sensitivity [42]. Unlike random or passive adsorption, using protein G ensures that the antibodies are attached to the biosensor surface in a predictable, functional orientation. This can increase the number of functional binding sites for the target analyte. Thus, a lowered non-specific adsorption of the analytes (extracellular vesicles) on the biosensor surface was observed when proteins A/G were used for oriented antibody immobilization in one study [34]. Another work on fiber-optic biosensors reported an enhanced sensitivity by 4.3-fold while lowering the LoD by 2.6-fold when the antibodies were immobilized in an oriented form using a boronic acid–tosylate linker [42]. Antibodies immobilized on protein G (engineered to have a cysteine residue for immobilization on gold) showed an enhanced antigen binding capacity and reduced non-specific binding when exposed to a high BSA (control protein) concentration [43].
In our study, we have also tested the performance of the optical fiber biosensor with protein G to sensors without protein G. The comparative chart of the detection of ALDH1A1 protein in PBS by SDI biosensors with different surface chemistries is shown in Figure 8. As such, it displays the slopes of signal response change during the detection of various concentrations of ALDH1A1 (10 fM–100 nM) in a logarithmic scale for different SDI sensors. Slopes were made based on mean values of repetitive experiments. Error bars indicate the standard deviation from mean values. As we can observe, SDI fibers with or without protein G treatment and without immobilized antibodies (two upper graphs in Figure 8) had a straight slope with the lowest values, which indicates that they were not sensitive to the protein’s concentration change as expected.
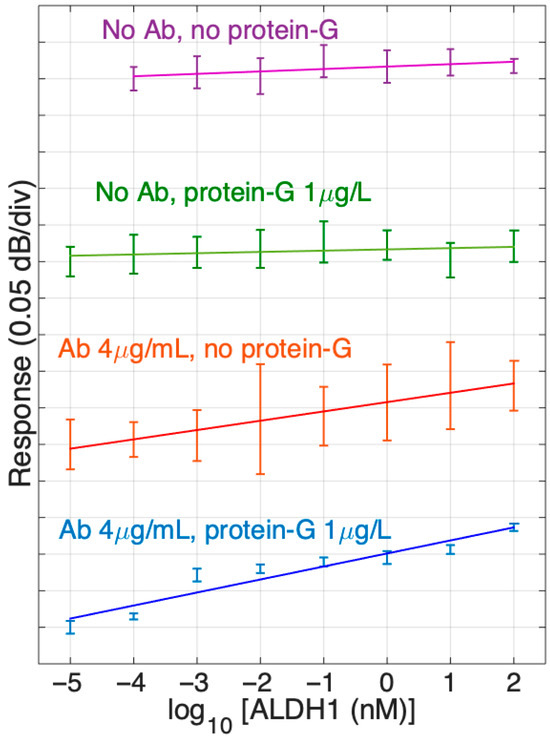
Figure 8.
Response of different SDI sensors in ALDH1 concentrations from 10 fM to 100 nM, from the PBS reference. The data report sensor functionalized with ALDH1 antibodies (4 μg/mL) and without antibodies, and with protein G (1 μg/mL) and without protein G. Slopes are estimated using log-linear regression (from bottom to top: 0.0178 dB, 0.0127 dB, 0.0017 dB, 0.0033 dB). Error bars show ± standard deviation over 10 consecutive measurements.
On the other hand, the SDIs immobilized with antibodies showed a positive slope several times larger than the previous groups discussed. The SDIs not treated with protein G and treated with 1 µg/mL of protein G before antibody immobilization demonstrated an increase in response (dB/concentration) and had positive slopes, such as 0.0127 dB and 0.0178 dB, respectively. Also, it is worth noting that the SDIs treated with both protein G and antibodies (4 µg/mL) had a higher slope compared to the group only treated with antibodies. Moreover, standard deviation is much smaller in the last group, which indicates the enhancement of sensitivity due to the protein G treatment.
Figure 9 shows the response of the sensors reported in Figure 9 for the two highest ALDH1A1 concentrations in a bar scale format for a better visualization of the specificity study results. The signals from the antibody-functionalized sensors are markedly higher than those of the sensors without ligands. When comparing sensors with ligands, the sensor with protein G showed growth with the increasing protein and smaller error bars than the sensor without protein G. Specificity studies involving no antibody sensors were performed to ensure that the signal change with the increased protein target concentration is happening due to the specific binding of the target to the antibodies on the surface.
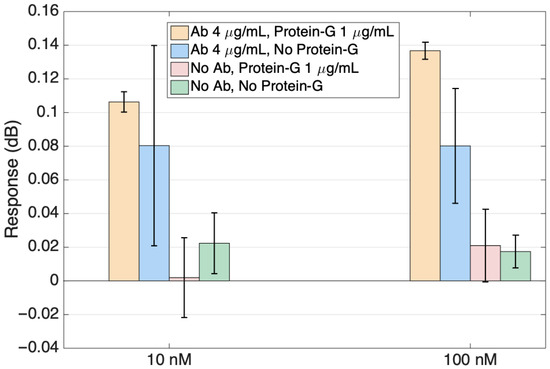
Figure 9.
Specificity of the ALDH1 detection, comparing the response of sensors functionalized with ALDH1 antibodies (with and without protein G functionalization) with sensors functionalized without antibodies. Data are reported at the highest concentration (10 nM, 100 nM).
3.5. Detection of ALDH1A1 Protein in Fetal Bovine Serum Using Protein G-Enhanced Biosensor
The biomarker detection experiments in FBS, which is closer in complexity to human serum compared to PBS, also showed a positive correlation between an increase in the ALDH1A1 concentration and the response signal (Figure 10). The SDI modification was the same as in the most successful 4th group shown in Figure 8, treated with both protein G and antibodies. Despite the slope of the sensitivity being smaller than the group tested in PBS, it was still higher than the group without antibodies (two upper graphs of Figure 8). However, we can observe a slight decrease in the signal response slope throughout the ALDH1A1 concentrations tested in FBS. Even the standard deviation became larger compared to the groups tested in PBS, despite being functionalized the same way. This most probably resulted due to the combined effect of multiple physicochemical characteristics of FBS. Protein fouling is likely the most crucial factor, as it directly obstructs recognition sites, leading to a decreased sensitivity and increased signal variability. Viscosity impacts mass transport to the sensor surface, potentially restricting the binding kinetics. Ultimately, matrix absorption and interference play crucial roles, especially for optical sensors, since the intricate biological elements can capture light and generate background noise, which directly affects the signal and its consistency. These difficulties highlight the necessity for advanced surface anti-fouling techniques when moving biosensors from regulated buffer solutions to authentic biological samples. An important thing to note is that the anti-ALDH1A1 antibodies used in the experiments were collected from the ascites of mice. So, some remnants of non-filtered ascites might have played a role in the random binding of other proteins during the measurements in FBS.
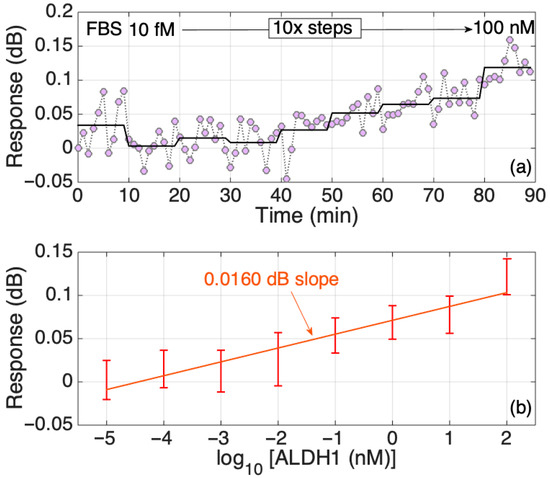
Figure 10.
Response of the SDI sensor in FBS. (a) Dynamic response, changing concentration every 10 min from 10 fM to 100 nM in 10-fold steps. The chart reports the real-time and the time-average trace. (b) Response of the sensor in FBS; the error bars report ± standard deviation over 10 consecutive measurements.
4. Conclusions
Overall, this work was able to demonstrate a successful experimental setup for detecting the ALDH1A1 cancer biomarker via an optical fiber biosensor and show the positive effect of the oriented immobilization of antibodies in increasing sensitivity. This project successfully showed the efficacy of a novel approach of combining existing methods to increase the sensitivity and specificity of SDI fibers with anti-ALDH1A1 antibodies to detect ALDH1A1 biomarkers. The experiments demonstrated a reliable fabrication and functionalization process of SDIs for the detection of the ALDH1A1 biomarker at femtomolar levels. Moreover, the protein G treatment of fibers before antibody immobilization proves to be efficient in increasing the sensitivity of the fiber. Despite that, there is still work to be performed in this project. To the best of our knowledge, this is the first biosensor which was built to detect the ALDH1A1 protein. This is definitely the beginning of new explorations and enhancements towards the goal of manufacturing fast, label-free, and highly sensitive biosensors.
Future perspectives for this research include the further optimization of the antibody immobilization process through a systematic variation in protein G and antibody concentrations, as well as exploring alternative surface modification chemistries to improve the binding stability and reduce nonspecific interactions. To further reduce non-specific adsorption on the biosensor surface due to incomplete/patchy coverage of the surface by protein G/antibodies, a number of strategies could be employed in the future, such as further tuning the concentration of protein G and/or increasing the concentration of the blocking reagent (mPEG-amine). Cross-linking of the protein G with the antibodies using bifunctional cross-linkers as reported by Gao et al. [44] might also be a method of choice for improving the anti-fouling properties of the sensor. Moreover, integrating this approach into multiplexed biosensing platforms could allow for the simultaneous detection of multiple cancer stem cell biomarkers, significantly improving diagnostic accuracy and clinical applicability.
Additionally, testing the biosensor in more clinically relevant samples, such as human serum or plasma, is a critical next step for evaluating its real-world performance and robustness in complex biological environments. Topographical studies using atomic force microscopy (AFM) after detection experiments with different conditions of functionalization could also offer deeper insights into the morphological changes on the fiber surface, potentially correlating these changes with sensing performance.
Supplementary Materials
The following supporting information can be downloaded at: https://www.mdpi.com/article/10.3390/fib13100131/s1, Figure S1: Results of calibration of the fabricated sensor. (a) Spectra of the SDI sensor in sucrose solution. (b) Sensitivity spectra of the SDI sensor. Maximum sensitivity at 1572 nm is 92.4 dB/RIU; Table S1: Different available assays for analyzing ALH1A1 (aldehyde dehydrogenase 1 family, member A1). References: [9,23,24,25,26,45,46,47,48]. Figure S2: Surface morphology analysis of optical fibers during functionalization to produce biosensor for ALDH1 protein detection for cleaning, silanization and cross-linking (glutaraldehyde) steps. Upper row: 1 µm × 1 µm images; bottom row: cross-sectional profile along the indicated linescans are shown. Figure S3: Surface morphology analysis of optical fibers during functionalization to produce biosensor for ALDH1 protein detection showing immobilization of antibodies after glutaraldehyde, Protein G after glutaraldehyde, and antibodies after Protein G. Upper row: 1 µm × 1 µm images; bottom row: cross-sectional profile along the indicated linescans are shown.
Author Contributions
Conceptualization, Z.Y. and A.B.; methodology, Z.Y., A.B., Z.A., D.T. and W.B.; software, D.T.; validation, Z.Y. and M.F.; formal analysis, D.T.; investigation, Z.Y. and M.F.; data curation, D.T.; writing—original draft preparation, Z.Y., M.F., A.B., Z.A., D.T. and W.B.; writing—review and editing, Z.Y. and A.B.; visualization, Z.Y., M.F. and D.T.; supervision, D.T.; funding acquisition, Z.A. and D.T. All authors have read and agreed to the published version of the manuscript.
Funding
This research has been funded by the Science Committee of the Ministry of Science and Higher Education of the Republic of Kazakhstan (Grant No. AP19679717), and by Nazarbayev University under Faculty Development grant, code: 20122022FD4134 (Project M2O-DISK).
Data Availability Statement
Data will be available upon request.
Conflicts of Interest
The authors declare no conflicts of interest.
References
- Sung, H.; Ferlay, J.; Siegel, R.L.; Laversanne, M.; Soerjomataram, I.; Jemal, A.; Bray, F. Global Cancer Statistics 2020: GLOBOCAN estimates of incidence and mortality worldwide for 36 cancers in 185 countries. CA Cancer J. Clin. 2021, 71, 209–249. [Google Scholar] [CrossRef]
- Bray, F.; Laversanne, M.; Sung, H.; Ferlay, J.; Siegel, R.L.; Soerjomataram, I.; Jemal, A. Global cancer statistics 2022: GLOBOCAN estimates of incidence and mortality worldwide for 36 cancers in 185 countries. CA Cancer J. Clin. 2024, 74, 229–263. [Google Scholar] [CrossRef]
- Poturnajova, M.; Kozovska, Z.; Matuskova, M. Aldehyde dehydrogenase 1A1 and 1A3 isoforms–mechanism of activation and regulation in cancer. Cell. Signal. 2021, 87, 110120. [Google Scholar] [CrossRef]
- Xia, J.; Li, S.; Liu, S.; Zhang, L. Aldehyde dehydrogenase in solid tumors and other diseases: Potential biomarkers and therapeutic targets. MedComm 2023, 4, e195. [Google Scholar] [CrossRef]
- Sládek, N.E. Leukemic Cell Insensitivity to Cyclophosphamide and other Oxazaphosphorines Mediated by Aldehyde Dehydrogenase(s). In Clinically Relevant Resistance in Cancer Chemotherapy, 1st ed.; Andersson, B., Murray, D., Eds.; Cancer Treatment and Research; Springer: New York, NY, USA, 2002; pp. 161–175. [Google Scholar] [CrossRef]
- Croker, A.K.; Allan, A.L. Inhibition of aldehyde dehydrogenase (ALDH) activity reduces chemotherapy and radiation resistance of stem-like ALDHhiCD44+ human breast cancer cells. Breast Cancer Res. Treat. 2011, 133, 75–87. [Google Scholar] [CrossRef] [PubMed]
- Sun, Q.L.; Sha, H.F.; Yang, X.H.; Bao, G.L.; Lu, J.; Xie, Y.Y. Comparative proteomic analysis of paclitaxel sensitive A549 lung adenocarcinoma cell line and its resistant counterpart A549-Taxol. J. Cancer Res. Clin. Oncol. 2010, 137, 521–532. [Google Scholar] [CrossRef]
- Yang, W.; Wang, Y.; Wang, W.; Chen, Z.; Bai, G. Expression of aldehyde dehydrogenase 1A1 (ALDH1A1) as a prognostic biomarker in colorectal cancer using immunohistochemistry. Med. Sci. Monit. 2018, 24, 2864–2872. [Google Scholar] [CrossRef]
- Li, T.; Su, Y.; Mei, Y.; Leng, Q.; Leng, B.; Liu, Z.; Stass, S.A.; Jiang, F. ALDH1A1 is a marker for malignant prostate stem cells and predictor of prostate cancer patients’ outcome. Lab. Investig. 2010, 90, 234–244. [Google Scholar] [CrossRef] [PubMed]
- Song, Y.H.; Zhong, M.Z.; Chai, Q.; Gong, K.Y.; Tan, X.L.; Hu, J.Y.; Wang, G.-A. The role of aldehyde dehydrogenase 1A1 in B-cell non-Hodgkin’s lymphoma. Oncol. Rep. 2018, 39, 1261–1268. [Google Scholar] [CrossRef] [PubMed]
- Püschel, J.; Dubrovska, A.; Gorodetska, I. The multifaceted role of aldehyde dehydrogenases in prostate cancer stem cells. Cancers 2021, 13, 4703. [Google Scholar] [CrossRef]
- Meng, E.; Mitra, A.; Tripathi, K.; Finan, M.A.; Scalici, J.; McClellan, S.; da Silva, L.M.; Reed, E.; Shevde, L.A.; Palle, K.; et al. ALDH1A1 maintains ovarian cancer stem Cell-Like properties by altered regulation of cell cycle checkpoint and DNA repair network signaling. PLoS ONE 2014, 9, e107142. [Google Scholar] [CrossRef]
- Landen, C.N.; Goodman, B.; Katre, A.A.; Steg, A.D.; Nick, A.M.; Stone, R.L.; Miller, L.D.; Mejia, P.V.; Jennings, N.B.; Gershenson, D.M.; et al. Targeting aldehyde dehydrogenase cancer stem cells in ovarian cancer. Mol. Cancer Ther. 2010, 9, 3186–3199. [Google Scholar] [CrossRef]
- Charafe-Jauffret, E.; Ginestier, C.; Iovino, F.; Tarpin, C.; Diebel, M.; Esterni, B.; Houvenaeghel, G.; Extra, J.-M.; Bertucci, F.; Jacquemier, J.; et al. Aldehyde dehydrogenase 1–Positive cancer stem cells mediate metastasis and poor clinical outcome in inflammatory breast cancer. Clin. Cancer Res. 2009, 16, 45–55. [Google Scholar] [CrossRef] [PubMed]
- ALDEFLUORTM Kit for ALDH Assays. Available online: https://www.stemcell.com/products/brands/aldefluor-aldh-assay.html (accessed on 21 September 2025).
- Oe, M.; Miki, K.; Ueda, Y.; Mori, Y.; Okamoto, A.; Funakoshi, Y.; Minami, H.; Ohe, K. Deep-Red/Near-Infrared Turn-On fluorescence probes for aldehyde dehydrogenase 1A1 in cancer stem cells. ACS Sens. 2021, 6, 3320–3329. [Google Scholar] [CrossRef]
- Human ALDH1A1 ELISA Kit, Colorimetric, 90-min ELISA (ab214024)|Abcam 2022. Available online: https://www.abcam.com/en-us/products/elisa-kits/human-aldh1a1-elisa-kit-ab214024# (accessed on 21 September 2025).
- Rossi, A.; Voigtlaender, M.; Klose, H.; Schlüter, H.; Schön, G.; Loges, S.; Paolini, M.; Bokemeyer, C.; Reck, M.; Tarro, G.; et al. High Aldehyde Dehydrogenase Levels Are Detectable in the Serum of Patients with Lung Cancer and May Be Exploited as Screening Biomarkers. J. Oncol. 2019, 2019, 8970645. [Google Scholar] [CrossRef] [PubMed]
- Bekmurzayeva, A.; Ashikbayeva, Z.; Assylbekova, N.; Myrkhiyeva, Z.; Dauletova, A.; Ayupova, T.; Shaimerdenova, M.; Tosi, D. Ultra-wide, attomolar-level limit detection of CD44 biomarker with a silanized optical fiber biosensor. Biosens. Bioelectron. 2022, 208, 114217. [Google Scholar] [CrossRef]
- Sypabekova, M.; Amantayeva, A.; Vangelista, L.; González-Vila, Á.; Caucheteur, C.; Tosi, D. Ultralow Limit Detection of Soluble HER2 Biomarker in Serum with a Fiber-Optic Ball-Tip Resonator Assisted by a Tilted FBG. ACS Meas. Sci. Au 2022, 2, 309–316. [Google Scholar] [CrossRef]
- Lyu, S.; Wu, Z.; Shi, X.; Wu, Q. Optical Fiber Biosensors for protein Detection: A review. Photonics 2022, 9, 987. [Google Scholar] [CrossRef]
- Seipetdenova, S.; Oladejo, T.O.; Bekmurzayeva, A.; Tan, C.K.L.; Yang, M.; Blanc, W.; Tosi, D. Label-free multiplexed detection of diabetic retinopathy biomarkers using fiber optic biosensors: Towards lab-in-the-tear. Opt. Lasers Eng. 2025, 189, 108943. [Google Scholar] [CrossRef]
- Kong, Y.; Lyu, N.; Wu, J.; Tang, H.; Xie, X.; Yang, L.; Li, X.; Wei, W.; Xie, X. Breast cancer stem cell markers CD44 and ALDH1A1 in serum: Distribution and prognostic value in patients with primary breast cancer. J. Cancer 2018, 9, 3728–3735. [Google Scholar] [CrossRef]
- Cao, Y.; Li, J.; Wang, Y.; Fu, Y.; Xu, J. Serum ALDH1A1 is a tumor marker for the diagnosis of non-small cell lung cancer. Tumori J. 2014, 100, 214–218. [Google Scholar] [CrossRef] [PubMed]
- Liu, C.; Zhang, Y.; Liang, S.; Ying, Y. Aldehyde dehydrogenase 1, a target of miR-222, is expressed at elevated levels in cervical cancer. Exp. Ther. Med. 2020, 19, 1673–1680. [Google Scholar] [CrossRef]
- Tieng, F.; Abu, N.; Sukor, S.; Azman, Z.; Nadzir, N.; Lee, L.; Ab Mutalib, N. L1CAM, CA9, KLK6, HPN, and ALDH1A1 as Potential Serum Markers in Primary and Metastatic Colorectal Cancer Screening. Diagnostics 2020, 10, 444. [Google Scholar] [CrossRef]
- Ebrahim-Habibi, M.B.; Ghobeh, M.; Mahyari, F.A.; Rafii-Tabar, H.; Sasanpour, P. An investigation into non-covalent functionalization of a single-walled carbon nanotube and a graphene sheet with protein G: A combined experimental and molecular dynamics study. Sci. Rep. 2019, 9, 1273. [Google Scholar] [CrossRef]
- Centi, S.; Ratto, F.; Tatini, F.; Lai, S.; Pini, R. Ready-to-use protein G-conjugated gold nanorods for biosensing and biomedical applications. J. Nanobiotechnol. 2018, 16, 5. [Google Scholar] [CrossRef]
- Elshafey, R.; Tavares, A.C.; Siaj, M.; Zourob, M. Electrochemical impedance immunosensor based on gold nanoparticles–protein G for the detection of cancer marker epidermal growth factor receptor in human plasma and brain tissue. Biosens. Bioelectron. 2013, 50, 143–149. [Google Scholar] [CrossRef]
- Socorro-Leránoz, A.; Santano, D.; Del Villar, I.; Matias, I. Trends in the design of wavelength-based optical fibre biosensors (2008–2018). Biosens. Bioelectron. X 2019, 1, 1000015. [Google Scholar] [CrossRef]
- Albert, J.; Lepinay, S.; Caucheteur, C.; DeRosa, M.C. High resolution grating-assisted surface plasmon resonance fiber optic aptasensor. Methods 2013, 63, 239–254. [Google Scholar] [CrossRef]
- Sun, D.D.; Ran, Y.; Wang, G.J. Label-Free Detection of Cancer Biomarkers Using an In-Line Taper Fiber-Optic Interferometer and a Fiber Bragg Grating. Sensors 2017, 17, 2559. [Google Scholar] [CrossRef] [PubMed]
- Ribaut, C.; Loyez, M.; Larrieu, J.C.; Chevineau, S.; Lambert, P.; Remmelink, M.; Wattiez, R.; Caucheteur, C. Cancer biomarker sensing using packaged plasmonic optical fiber gratings: Towards in vivo diagnosis. Biosens. Bioelectron. 2017, 92, 449–456. [Google Scholar] [CrossRef]
- Lee, J.; Park, H.; Jung, Y.; Kim, J.; Jung, S.; Chung, B. Direct immobilization of protein G variants with various numbers of cysteine residues on a gold surface. Anal. Chem. 2007, 79, 2680–2687. [Google Scholar] [CrossRef]
- Lu, M.; Weng, Y.; Yang, Y. Single-Molecule Ex Situ Atomic Force Microscopy Allows Detection of Individual Antibody-Antigen Interactions on a Semiconductor Chip Surface. Adv. Nanobiomed Res. 2021, 1, 2000035. [Google Scholar] [CrossRef]
- Blinka, E.; Loeffler, K.; Hu, Y.; Gopal, A.; Hoshino, K.; Lin, K.; Liu, X.; Ferrari, M.; Zhang, J. Enhanced microcontact printing of proteins on nanoporous silica surface. Nanotechnology 2010, 21, 415302. [Google Scholar] [CrossRef]
- Ierardi, V.; Ferrera, F.; Millo, E.; Damonte, G.; Filaci, G.; Valbusa, U. Bioactive surfaces for antibody-antigen complex detection by Atomic Force Microscopy. In Proceedings of the 6th Vacuum and Surface Sciences Conference of Asia and Australia (VASSCAA-6), Islamabad, Pakistan, 9–13 October 2012. [Google Scholar]
- Gole, M.; Dronadula, M.; Aluru, N.; Murphy, C. Immunoglobulin adsorption and film formation on mechanically wrinkled and crumpled surfaces at submonolayer coverage. Nanoscale Adv. 2023, 5, 2085–2095. [Google Scholar] [CrossRef]
- BrowningKelley, M.; WaduMesthrige, K.; Hari, V.; Liu, G. Atomic force microscopic study of specific antigen/antibody binding. Langmuir 1997, 13, 343–350. [Google Scholar] [CrossRef]
- Lichtenberg, J.Y.; Ling, Y.; Kim, S. Non-Specific Adsorption Reduction Methods in Biosensing. Sensors 2019, 19, 2488. [Google Scholar] [CrossRef]
- Karihtala, P.; Leivonen, S.; Puistola, U.; Urpilainen, E.; Jääskeläinen, A.; Leppä, S.; Jukkola, A. Serum protein profiling reveals an inflammation signature as a predictor of early breast cancer survival. Breast Cancer Res. 2024, 26, 61. [Google Scholar] [CrossRef] [PubMed]
- Gao, S.-Y.; Chang, H.-E.; Wang, C.-H.; Chi, M.; Lin, C.-C.; Chaing, C.; Wang, C.-H.; Huang, C.-J.; Li, P.-J.; Chau, L.-K. Oriented immobilization of antibodies on suspended nanoparticle and substrate surfaces via one-step catch-and-link approach for development of biosensors. Microchem. J. 2025, 210, 112967. [Google Scholar]
- Parkkila, P.; Härkönen, K.; Ilvonen, P.; Laitinen, S.; Viitala, T. Protein A/G-based surface plasmon resonance biosensor for regenerable antibody-mediated capture and analysis of nanoparticles. Colloids Surf. A Physicochem. Eng. Asp. 2022, 654, 130015. [Google Scholar] [CrossRef]
- Gao, S.; Guisán, J.; Rocha-Martin, J. Oriented immobilization of antibodies onto sensing platforms—A critical review. Anal. Chim. Acta 2022, 1189, 338907. [Google Scholar] [CrossRef]
- Huang, Y.K.; Wang, T.M.; Chen, C.Y.; Li, C.Y.; Wang, S.C.; Irshad, K.; Pan, Y.; Chang, K.C. The role of ALDH1A1 in glioblastoma proliferation and invasion. Chem.-Biol. Interact. 2024, 402, 111202. [Google Scholar]
- Xu, S.L.; Zeng, D.Z.; Dong, W.G.; Ding, Y.Q.; Rao, J.; Duan, J.J.; Liu, Q.; Yang, J.; Zhan, N.; Liu, Y.; et al. Distinct patterns of ALDH1A1 expression predict metastasis and poor outcome of colorectal carcinoma. Int. J. Clin. Exp. Pathol. 2014, 7, 2976. [Google Scholar] [PubMed]
- Yang, L.; Ren, Y.; Yu, X.; Qian, F.; Bian, B.S.; Xiao, H.L.; Wang, W.G.; Xu, S.L.; Yang, J.; Cui, W.; et al. ALDH1A1 defines invasive cancer stem-like cells and predicts poor prognosis in patients with esophageal squamous cell carcinoma. Mod. Pathol. 2014, 27, 775–783. [Google Scholar] [PubMed]
- MacDonagh, L.; Gallagher, M.F.; Ffrench, B.; Gasch, C.; Breen, E.; Gray, S.G.; Nicholson, S.; Leonard, N.; Ryan, R.; Young, V.; et al. Targeting the cancer stem cell marker, aldehyde dehydrogenase 1, to circumvent cisplatin resistance in NSCLC. Oncotarget 2017, 8, 72544–72563. [Google Scholar] [CrossRef]


Disclaimer/Publisher’s Note: The statements, opinions and data contained in all publications are solely those of the individual author(s) and contributor(s) and not of MDPI and/or the editor(s). MDPI and/or the editor(s) disclaim responsibility for any injury to people or property resulting from any ideas, methods, instructions or products referred to in the content. |
© 2025 by the authors. Licensee MDPI, Basel, Switzerland. This article is an open access article distributed under the terms and conditions of the Creative Commons Attribution (CC BY) license (https://creativecommons.org/licenses/by/4.0/).