Abstract
Acrylic hydrogels have been used in agriculture to increase the availability of water in the soil; cause faster plant growth and increase plant survival to water stress; allow controlled release of fertilizers; and, therefore, increase crop yields. On the other hand, Aloe vera gel production generates a large amount of solid waste as cuticles, which is currently underutilized despite that it is a good source of cellulose nanofibers that could be used to improve the swelling capacity of commercial acrylic hydrogels. In this work, both morphology (SEM) and particle size (TEM) of the cellulose nanofibers obtained from A. vera cuticles by the acid hydrolysis method combined with ultrasound were analyzed; as well as the presence of functional groups (FITR) and thermal stability (TGA). Then, acrylic hydrogels were synthesized by the solution polymerization method, and nanofibers were added to these hydrogels at different concentrations (0% w w−1, 3% w w−1, 5% w w−1, and 10% w w−1). These concentrations had a nonlinear relationship with the swelling capacity, and the hydrogel reinforced at 3% cellulose nanofiber was chosen as the best formulation in this work, as this one improved the swelling capacity of hydrogels at equilibrium (476 g H2O g hydrogel−1) compared to the hydrogel without nanofiber (310 g H2O g hydrogel−1), while hydrogels with 10% nanofiber had a similar swelling capacity to the non-reinforced hydrogel (295 H2O g hydrogel−1). Therefore, cellulose-based superabsorbent hydrogels with potential application in agriculture were developed in this work.
1. Introduction
Hydrogels are three-dimensional polymers able to absorb and retain considerable volumes of water through hydrophilic functional groups attached to the skeleton of the polymer [1]. According to their structure, hydrogels are divided into polyacrylate, polyacrylamide, silicone-modified hydrogels, and others [2]. Recently, hydrogels have been used for mostly biomedical [3,4,5]; but also for pharmaceutical [6,7], bioelectronic [8], environmental [9], and agricultural [10] applications.
Due to the increase in demand for agricultural products, there is greater intensification in the use of land for crops, and, consequently, a greater water demand [11]. Currently, about 70% of available water is used for crop irrigation, and the United Nations (UN) project a severe water crisis by 2050 since the planet will require roughly 95% of fresh water for agriculture production [12]. Consequently, agriculture is the cause of water scarcity in the world, and hydrogels could contribute in this regard [13].
It is important to explore technologies aimed at reducing the use of water for irrigation by boosting its availability in the soil for a longer time. In this regard, hydrogels could represent an alternative to improve the water-holding capacity of soils, cutting irrigation frequency by as much as 90%, improving soil compaction, and reducing the loss through infiltration. This would improve seed germination, increasing the growth of plants and slowing wilting under drought conditions, a problem that will worsen over the years due to the current climate emergency [10].
For agricultural purposes, hydrogels are generally synthesized from acrylates or similar monomers due to their high swelling capacity and kinetics, lack of toxicity, biological inertness, and ability to keep their original shape [10,14]. It is expected that the global hydrogel market size will reach USD 15 billion in 2022, increasing at a compound annual growth rate (CAGR) of approximately 6% from 2017 to 2022. The rising consumption of healthcare, hygiene, and personal care products is one of the major factors driving the growth of the hydrogel market. According to the composition (polyacrylate, polyacrylamide, or silicon), the polyacrylate market segment had the highest CAGR during 2017–2022, owing to its superior properties such as flexibility and high water-retention capacity. Hence, the agricultural segment of the hydrogel market grew at the highest CAGR as the use of hydrogels helps prevent soil erosion and enhance crop yields [15].
On the other hand, agricultural activity generates a significant amount of solid residues from crops or crop fractions [16], e.g., Aloe barbadensis Miller (better known as Aloe vera) cuticle (also known as green rind of leaf cuticle) is a residual product of gel extraction that contributes 20–30% of A. vera leaf weight [17]. Colombian farmers indicate that the cuticle of A. vera is an underutilized waste since it is only used for composting, even though this residual bark is a viable alternative to obtain nanofibers for material reinforcement because it contains about 42% cellulose and 16% hemicellulose [18].
Based on a circular economy model, our research group is committed to the revalorization of waste from the Colombian agroindustry. Therefore, as in our previous works [10,14,19,20], this study proposes a feasible option to revalorize waste from the Colombian agroindustry of A. vera. Thus, the objectives of this research were (i) to isolate native nanofibers from A. vera rind; (ii) to produce reinforcing nanofibers by acid treatment combined with ultrasound; (iii) to demonstrate the efficiency of the proposed method through scanning electron microscopy (SEM), infrared analysis (FITR), transmission electron microscopy (TEM), and thermogravimetric analysis (TGA); (iv) to reinforce acrylic hydrogels with the obtained cellulose nanofibers to create acrylic superabsorbent hydrogels, (v) to verify the reinforcement of hydrogels by SEM; and (vi) to determine the effect of the addition of cellulose nanofibers on the swelling capacity of hydrogels.
2. Materials and Methods
2.1. Reagents
Acrylamide (crystals, Sigma-Aldrich, Cali, Colombia), acrylic acid (99%, Merck, Cali, Colombia), ammonium hydroxide (Sigma-Aldrich, Cali, Colombia), glacial acetic acid (CH3COOH, 99.7%, Merck, Cali, Colombia), hydrochloric acid solution (HCl, 37% w v−1, Sigma-Aldrich, Cali, Colombia), N,N′-methylenebis(acrylamide) (NMBA, crystals, Sigma-Aldrich, Cali, Colombia), nitrogen (99.99%, Linde, Cali, Colombia), potassium hydroxide (KOH, pellets, Merck, Cali, Colombia), potassium persulfate (K2S2O8, crystals, Panreac, Cali, Colombia), sodium chlorite (NaClO2, crystals, Sigma-Aldrich, Cali, Colombia), sodium hydroxide (NaOH, pellets, Merck, Cali, Colombia), and sulfuric acid solution in water type II (H2SO4, 96%, Merck, Cali, Colombia) were all used as received.
2.2. Vegetal Waste
A. vera cuticles were obtained from a farm based in Dagua (Valle del Cauca, Colombia). Samples were washed with distilled water, cut into pieces of roughly 10 mm, freeze-dried (Freezone 6 Plus, Labconco, Kansas City, MO, USA) for 24 h at −50 °C and 0.01 mbar, and ground in a blade mill to 38 µm.
2.3. Nanofiber Obtention
2.3.1. Obtention of Native Nanofibers
To remove oil and pectin from samples, dried samples were treated with 0.01 N HCl solution at 70 °C for 2 h. Ammonium hydroxide was then added to pH 9.5. Then, fibers were vacuum filtered, washed with distilled water to neutral pH, and dried until constant weight at 50 °C in a forced convection oven (UN 110, Memmert, Schwabach, Germany), thus obtaining native nanofibers (AV-N) [20].
2.3.2. Nanofibers Production by Acid Treatment Combined with Ultrasound
Native fibers from A. vera cuticles (AV-N) were both delignified and bleached to obtain AV-DB. At the time of delignification, AV-N and 4% w v−1 aqueous NaOH solution were mixed (1:25 ratio) for 4 h at 600 rpm and 90 °C (hot plate, Corning®, Corning, NY, USA). For bleaching, an aqueous NaClO2 solution (1.7% w v−1) and an acetate buffer solution (75 mL CH3COOH L water−1 + 27 g NaOH) were mixed (1:1 ratio). This blend and the previously delignified fiber were then mixed (20:1 ratio) and stirred for 6 h at 600 rpm and 80 °C. The obtained fibers were vacuum filtered (Millipore, Merck, Germany), washed with water until neutral pH, and dried until a constant weight in an oven at 50 °C [10,19,20].
To obtain nanofibers through acid hydrolysis (i.e., AV-H), 5 g of AV-DB and 125 mL of H2SO4 6,5 M were stirred for 24 h at 400 rpm and 50 °C. Later, this blend was mixed with 300 mL of water and 1600 mL of 4% aqueous NaOH solution. Then, the precipitate was vacuum filtered (Millipore, Merck, Germany), washed with water, dried for 24 h at 50 °C, suspended in water (1% w v−1), and well mixed for 15 min with an ULTRA-TURRAX® (T25, IKA, Staufen, Germany) at 10,000 rpm.
The final step was the ultrasound treatment to obtain AV-HUS. For this, the previously obtained suspension was ultrasonically homogenized (SFX550, Branson, Barcelona, Spain) for 30 min with a ½″ diameter cylindrical probe at 20 kHz and 550 W, keeping the mixture between 25 °C and 30 °C in an ice bath. Finally, the suspension was freeze-dried for 24 h at −40 °C and 0.01 mbar and stored in hermetic containers at 5 °C for further analysis.
2.4. Characterization of the Nanofibers
Cellulose nanofibers obtained were characterized by SEM, FITR, TEM, and TGA [20].
2.4.1. Scanning Electron Microscopy (SEM)
The morphology of the nanofibers was recorded by scanning electron microscopy (SEM, JEOL Model JSM-6490, Akishima, Japan). The sample was fixed on a double-sided carbon tape attached to the sample holder and coated with gold (layer thickness of 5 nm) using a Cressington 108 Auto Sputter Coater (Ted Pella, Redding, CA, USA). An acceleration voltage of 20 kV and high vacuum conditions were used.
2.4.2. Infrared Analysis (FITR)
Fourier transform infrared spectra (FTIR, Shimadzu, Kyoto, Japan) were recorded from 400 cm−1 to 4000 cm−1. Commercial microcrystalline cellulose (CC) was used as a control treatment.
2.4.3. Thermogravimetric Analysis (TGA)
Thermograms (DSC/TGA 2STAR system, Mettler Toledo, Columbus, OH, USA) were obtained from 30 °C to 600 °C at 10 °C min−1, with nitrogen supply (20 mL min−1), and alumina crucibles with approximately 8 mg of sample. CC was used as a control treatment.
2.4.4. Transmission Electron Microscopy (TEM)
The obtained nanofibers were assessed by transmission electron microscopy (TEM, JEOL JEM 1.011, Akishima, Japan). For this purpose, 0.1% w w−1 nanofibers water dispersions were prepared and mounted on copper grids. The diameters and lengths of the nanofibers were estimated using the image processing software Image J (National Institutes of Health, Bethesda, MD, USA).
2.5. Hydrogels Reinforcement
Acrylic hydrogels were reinforced with cellulose nanofibers from A. vera cuticles according to a previous report of our research group [10]. For this, non-reinforced acrylic hydrogels (AV-R0) and acrylic hydrogels reinforced with 3% w w−1 (AV-R3), 5% w w−1 (AV-R5), and 10% w w−1 (AV-R10) cellulose nanofiber suspensions previously obtained were synthesized using the solution polymerization method proposed by Zhong et al. [21] with slight modifications.
The reaction was performed in a 500 mL ground-glass lid reactor equipped with reflux, nitrogen inlet and outlet, and magnetic stirring. Batches of 200 mL were prepared. The monomer solution was made by mixing 14 g of acrylamide with 22 g of potassium acrylate, which was previously obtained by neutralizing 16 g of acrylic acid with a KOH solution. Batches of 200 mL were prepared. First, 80 mL nanofiber suspensions (AV-R0, AV-R3, AV-R5, and AV-R10) were dispersed using ULTRA-TURRAX at 9000 rpm for 10 min. Then, nanofiber suspension and monomer solutions were mixed and stirred for 10 min. Afterward, K2S2O8 (0.3% by weight with respect to the monomers) as an initiator and NMBA (0.085% by weight with respect to the monomers) as a crosslinker were added to the mixture. Subsequently, 200 mL of suspension was placed in a volumetric flask, brought to reflux, and bubbled with 20 mL nitrogen min−1 for 20 min. Finally, the system was heated at 70 °C for 6 h to complete the polymerization reaction. The final product was cut into 1 mm to 2 mm width cubes, washed with ethanol (1:2 ratio), and dried at 70 °C until a constant weight was achieved.
2.5.1. Swelling Study
The swelling behavior of AV-R0, AV-R3, AV-R5, and AV-R10 was analyzed according to the methodology proposed by Karadag et al. [22] and Spagnol et al. [15,23]; and already reported by our research group [10]. For this, 0.2 g of dried hydrogel was soaked in a 400-mesh sieve in distilled water for 5 min, 10 min, 15 min, 30 min, 60 min, 90 min, 120 min, 180 min, 240 min, 300 min, and 360 min. The surface water was removed with a cloth. The swollen material was weighed and, subsequently, the swelling ratio was calculated according to Equation (1).
where W is the swelling ratio at time t (g H2O g hydrogel−1), mt is the mass of the swollen material at time t (g), and m0 is the mass of the dried material (g).
For the swelling of polymers such as those used in this work, the pseudo-second-order kinetic relationship shown in Equation (2) can be used as described by Schott [24].
where the reciprocal of the initial swelling rate (A) and the inverse of the maximum or equilibrium swelling (B) are described by Equations (3) and (4), respectively, as described by Spagnol et al. [15].
where kS is the swelling rate constant ((g H2O g hydrogel−1) min−1), and Wt is a theoretical swelling value at equilibrium (g H2O g hydrogel−1). Finally, the initial swelling rate can be described by Equation (5).
where kis is the equilibrium swelling ((g H2O g hydrogel−1) min−1), and Weq is the swelling value at equilibrium (g H2O g hydrogel−1). Weq and Wt were the focus of study in this work.
2.5.2. Scanning Electron Microscopy (SEM)
Hydrogel formulations were observed with a scanning electron microscope with an acceleration voltage of 20 kV and high vacuum conditions.
2.6. Experimental Design and Statistical Analysis
A single-factor, completely randomized design was implemented. This factor was set as the concentration of nanofibers used to reinforce the hydrogel. For this, a non-reinforced acrylic hydrogel (AV-R0) and acrylic hydrogels reinforced with 3% w w−1 (AV-R3), 5% w w−1 (AV-R5), and 10% w w−1 (AV-R10) cellulose nanofibers from A. vera cuticle were tested. Experiments were performed in triplicate and the analyses were repeated twice (n = 2 × 3). The mean and standard deviation were calculated for all data. Response variables were submitted to analysis of variance (ANOVA). When statistical differences (p ≤ 0.05) were found, the Tukey test was applied (Minitab 18, Minitab Inc., State College, PA, USA).
3. Results and Discussion
First, the obtained cellulose nanofibers were characterized by SEM, FITR, TEM, and TGA. Afterward, the obtained reinforced hydrogel formulations were analyzed in terms of morphology (SEM) and swelling behavior.
3.1. Morphology of Cellulose Nanofibers
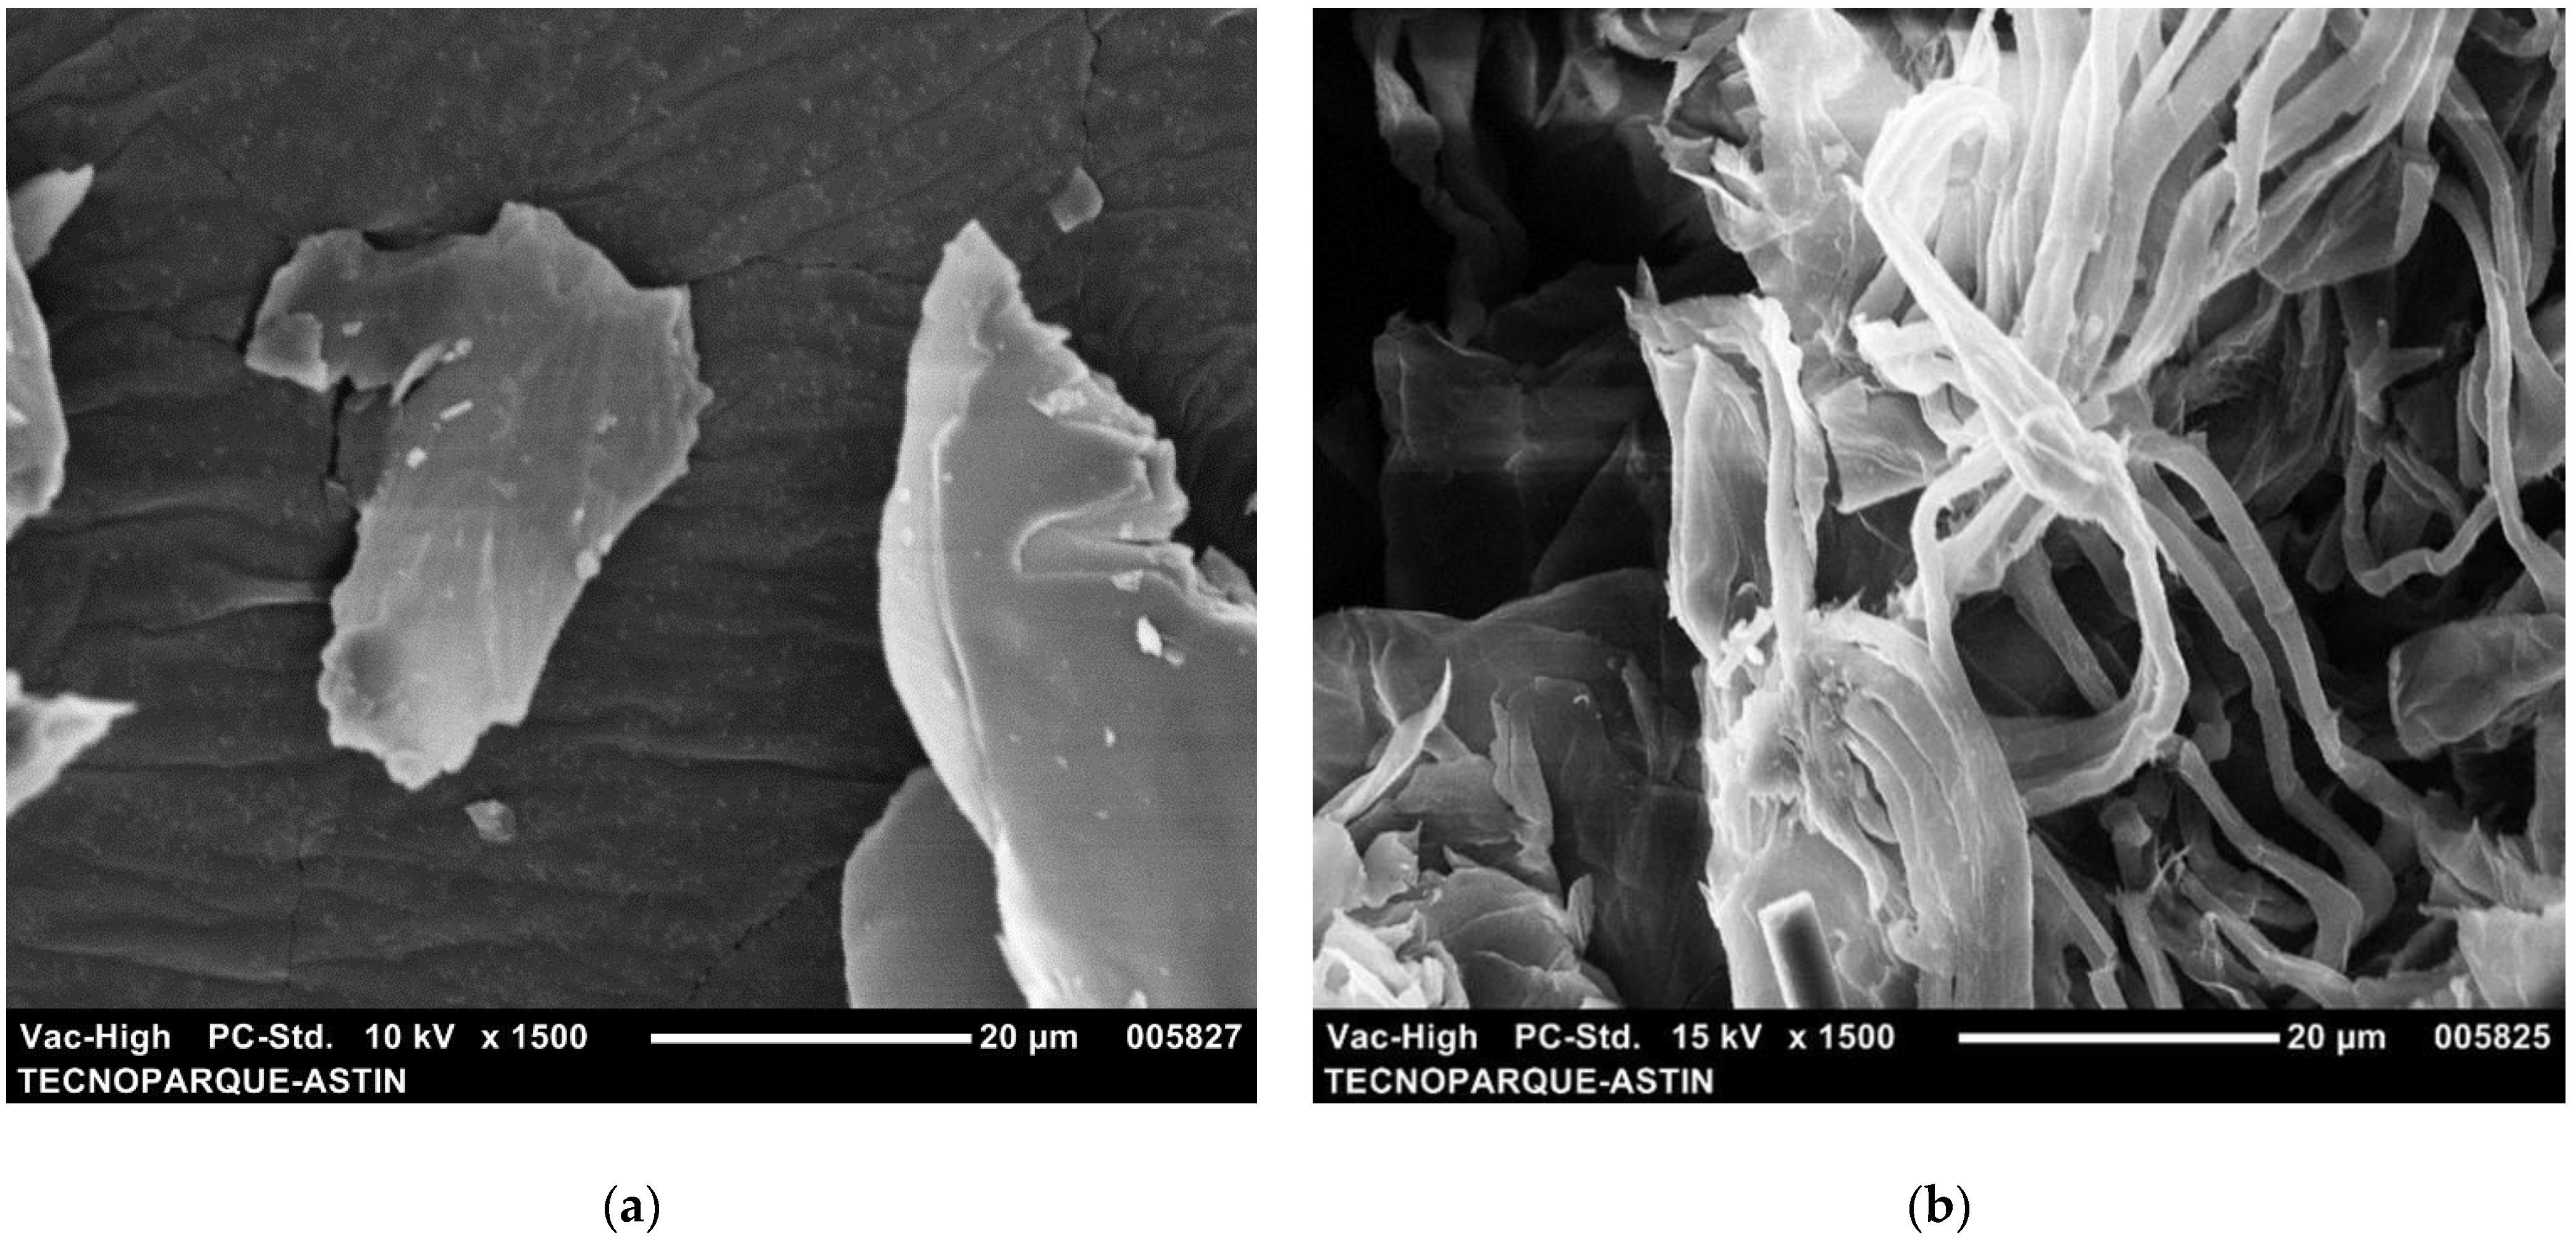
SEM micrographs were taken to verify that the lignin in AV-N was properly removed by the bleaching process. Figure 1 shows a comparison of the morphology of the nanofibers without (AV-N in Figure 1a) and with the bleaching treatment (AV-DB in Figure 1b).
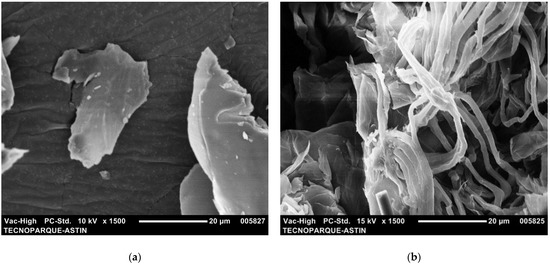
Figure 1.
SEM images of (a) native (AV-N) and (b) delignified-bleached (AV-DB) nanofibers from Aloe vera cuticles.
Figure 1a shows agglutinated cellulose chains, while Figure 1b shows fibrous structures with a defined and uniform diameter (about 1.8 µm), so it can be inferred that the binders that prevented defibrillation (i.e., lignin, hemicellulose, pectin) were removed by the effect of the delignification and bleaching process applied [20,25].
3.2. Functional Groups of Cellulose Nanofibers
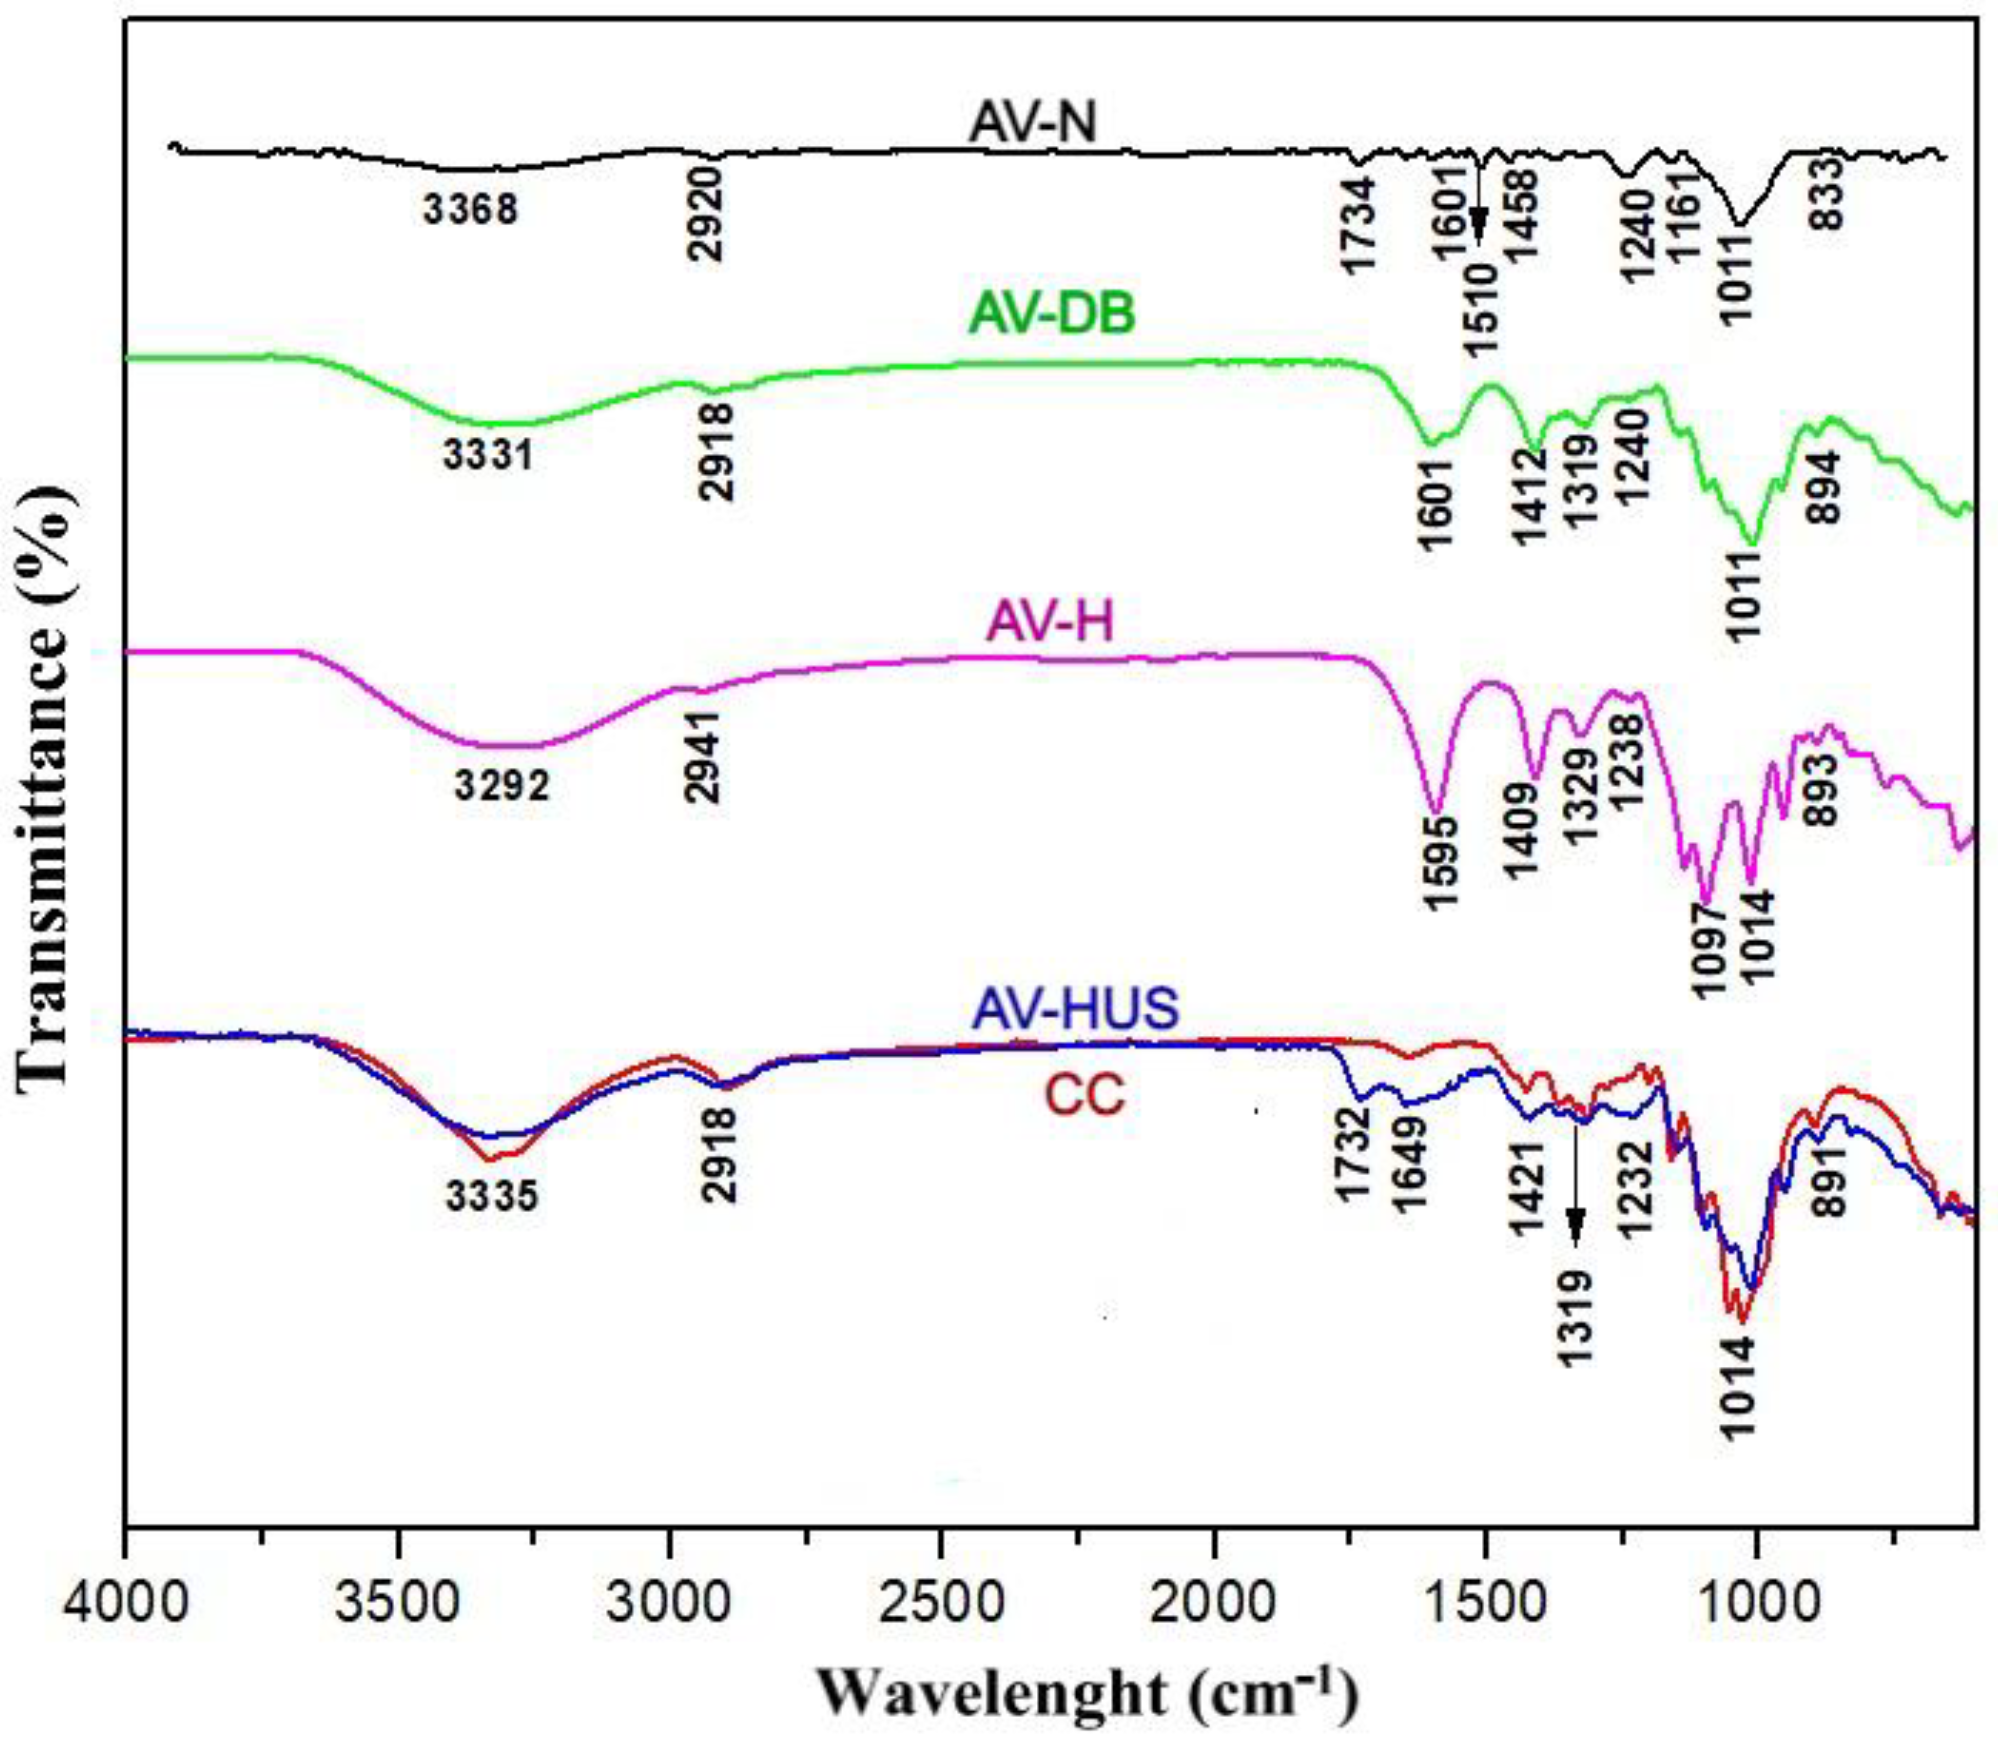
To verify the efficiency of the bleaching treatment and to demonstrate the successful acid hydrolysis and ultrasound treatment, FTIR spectra (see Figure 2) and thermal stability analysis were obtained for samples AV-N, AV-DB, AV-H, and AV-HUS.
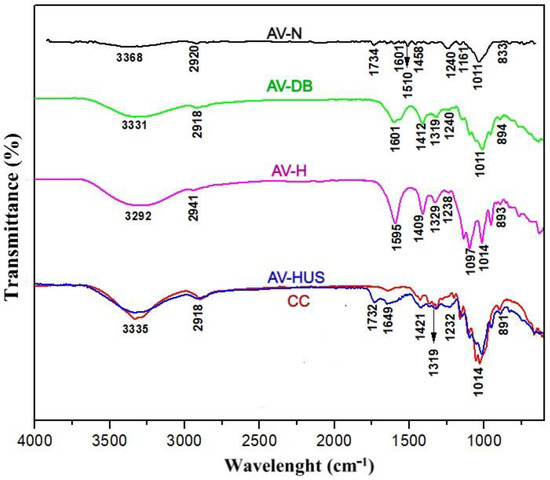
Figure 2.
Infrared spectra (FITR) of native (AV-N), delignified-bleached (AV-DB), hydrolyzed (AV-H), and ultrasound-treated (AV-HUS) nanofibers from A. vera cuticles; along with the commercial microcrystalline cellulose (CC).
Regarding the FTIR spectrum of AV-N in Figure 2, two absorption zones (600–1750 cm−1 and 2800–3400 cm−1) were observed. An absorption band corresponding to the stretching of the hydroxyl groups (–OH) for AV-N at 3368 cm−1 was noted. The band around 1600 cm−1 belonged to vibrations of the –OH group corresponding to absorbed water due to the hydrophilic behavior of the fiber [26]. Additionally, a peak was observed around 1000 cm−1 due to the C–O–C vibration of the β-1,4-glycosidic bond of D-glucose units included in cellulose [27].
Several indications of the presence of the previously mentioned binders (lignin, hemicellulose, pectin) in the AV-N sample can be seen in Figure 2. First, a peak could be seen at 1734 cm−1 due to the C=O vibrations in –COO– and H3CO– (i.e., ester groups) belonging to hemicellulose or the carboxylic group –COOH (i.e., ester bond) of p-coumaric and ferulic acids of lignin [28,29]. In addition, a peak at 1240 cm−1 was revealed due to the –C–O–C– vibration coming from bonds between the methoxy groups and aromatic ring from lignin [30]. As for the FTIR spectrum of AV-DB, Figure 2 shows the disappearance of the bands around 1240 cm−1 and 1734 cm−1, thus proving the correct removal of lignin and hemicellulose after the delignification-bleaching process [20].
The intensity increase at about 1000 cm−1, 3300 cm−1, and 2900 cm−1 in Figure 2 was attributed to the cellulose functional groups [27], which were pronounced in the AV-H and AV-HUS spectra. The presence of bands around 890 cm−1, 1300 cm−1, and 1100 cm−1 were also observed, which were intensified by the effect of the acid treatment with ultrasound [20]. The appearance of the band around 1400 cm−1 and the rise in the intensity of the bands at about 1320 cm−1 in the AV-HUS spectrum were also highlighted, which was in agreement with previous reports, suggesting that strong signals around 1370–2900 cm−1 and 1426–897 cm−1 indicated the crystalline band of cellulose [20,27].
3.3. Thermal Stability Analysis of Cellulose Nanofibers
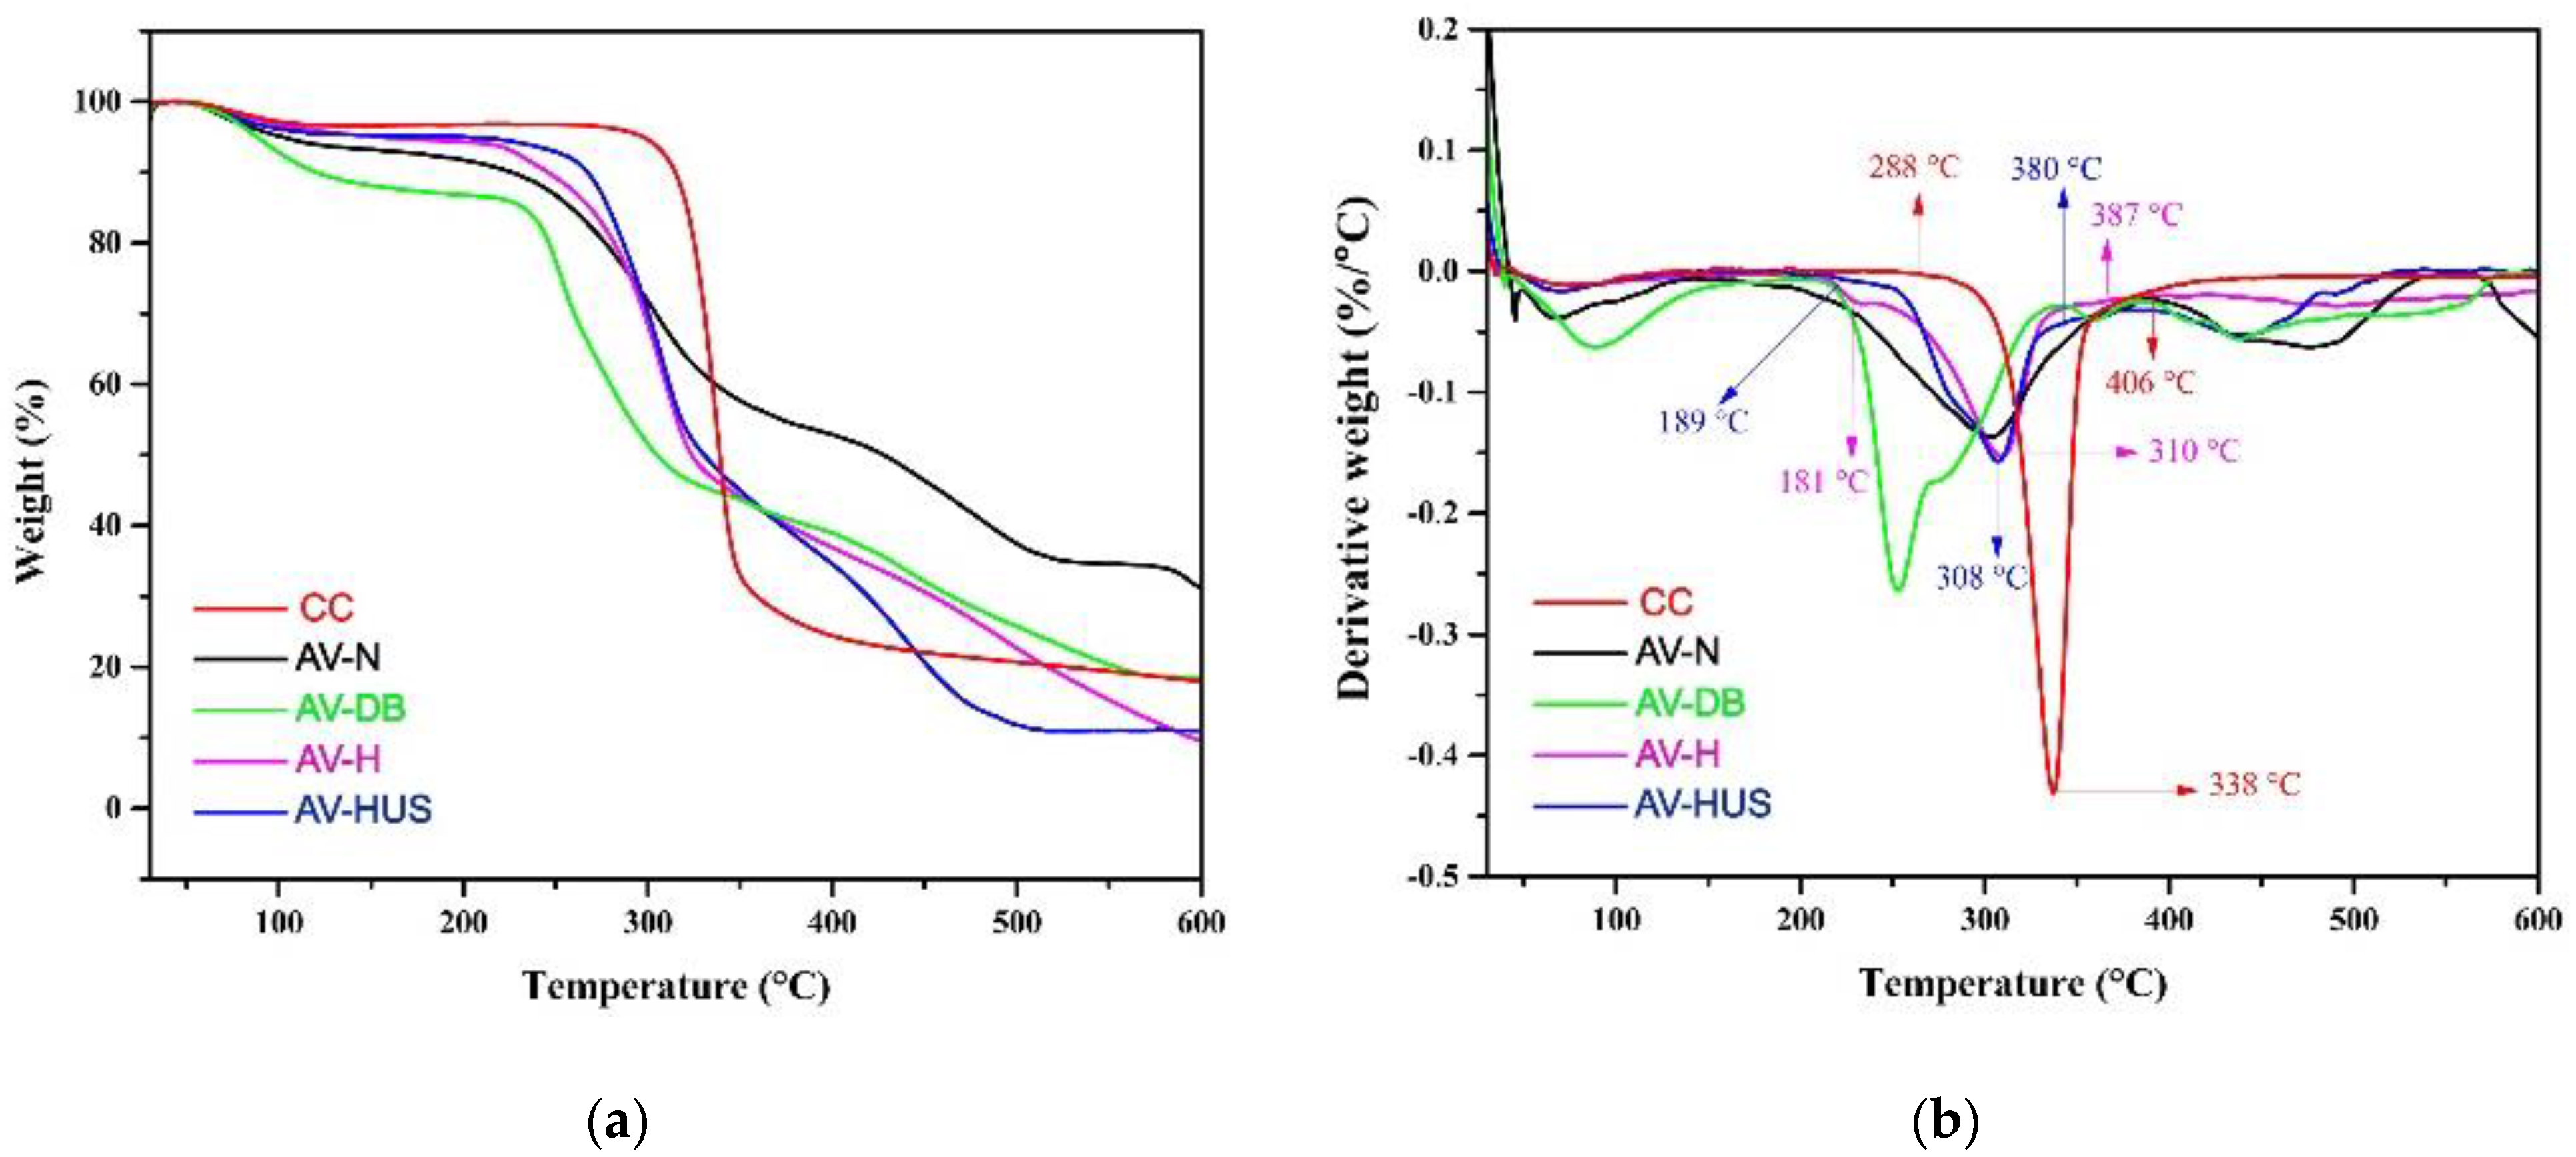
The mass loss and thermogravimetric derivatives of AV-N, AV-DB, AV-H, and AV-HUS samples are shown in Figure 3a and Figure 3b, respectively.
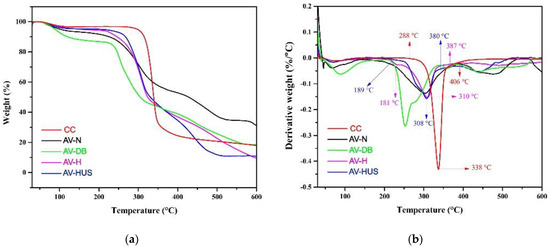
Figure 3.
(a) Thermogravimetric and (b) derivative thermogravimetric analysis of native (AV-N), delignified-bleached (AV-DB), hydrolyzed (AV-H), and ultrasound-treated (AV-HUS) nanofibers from A. vera cuticles; along with the commercial microcrystalline cellulose (CC).
Figure 3 show a first peak, weakly pronounced, between 50 °C and 150 °C for all samples, which corresponded to the water evaporation process. Additionally, it was clear to notice degradation peaks between 200–400 °C and 400–500 °C. In addition, a single maximum degradation point was observed for AV-H and AV-HUS at around 310 °C, which indicated a slightly higher thermal stability than AV-N. This small difference could be due to the removal of hemicellulose and pectin by the chemical treatments combined with ultrasound, which are thermally less stable components [31].
Finally, it could also be evidenced that AV-HUS (308 °C) had a lower degradation temperature than CC (338 °C), which could be due to the higher amount of free terminal chains of the AV-HUS sample that decomposed at lower temperatures. In addition, with the acid hydrolysis required to obtain AV-HUS, there was a considerable reduction in the degradation temperature and a rise in the maximum degradation temperature range between 189 °C and 380 °C, which led to the insertion of sulfate groups in chains of cellulose [20].
3.4. Particle Size Analysis of Cellulose Nanofibers
To obtain the diameter and length of AV-HUS, TEM images were taken. In this regard, Figure 4 shows TEM micrographs (see Figure 4a) and size distribution (see Figure 4b) of AV-HUS nanofibers. According to Figure 4, after acid treatment combined with ultrasound, nanofibers with a length of 3811 nm ± 397 nm and a diameter of 31 nm ± 7 nm, respectively, were obtained. The elongated shape and sizes of the cellulose nanofibers produced in this work agreed with those reported by other studies [20,32,33].
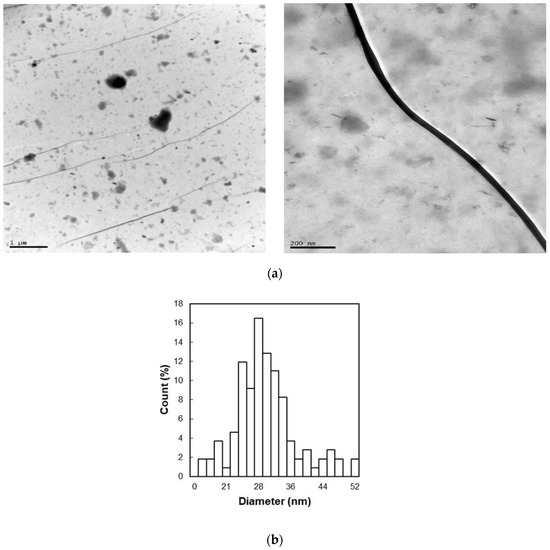
Figure 4.
(a) TEM images and (b) size distribution of produced nanofibers by acid treatment combined with ultrasound (AV-HUS) from A. vera cuticles.
3.5. Morphology of Reinforced Hydrogels
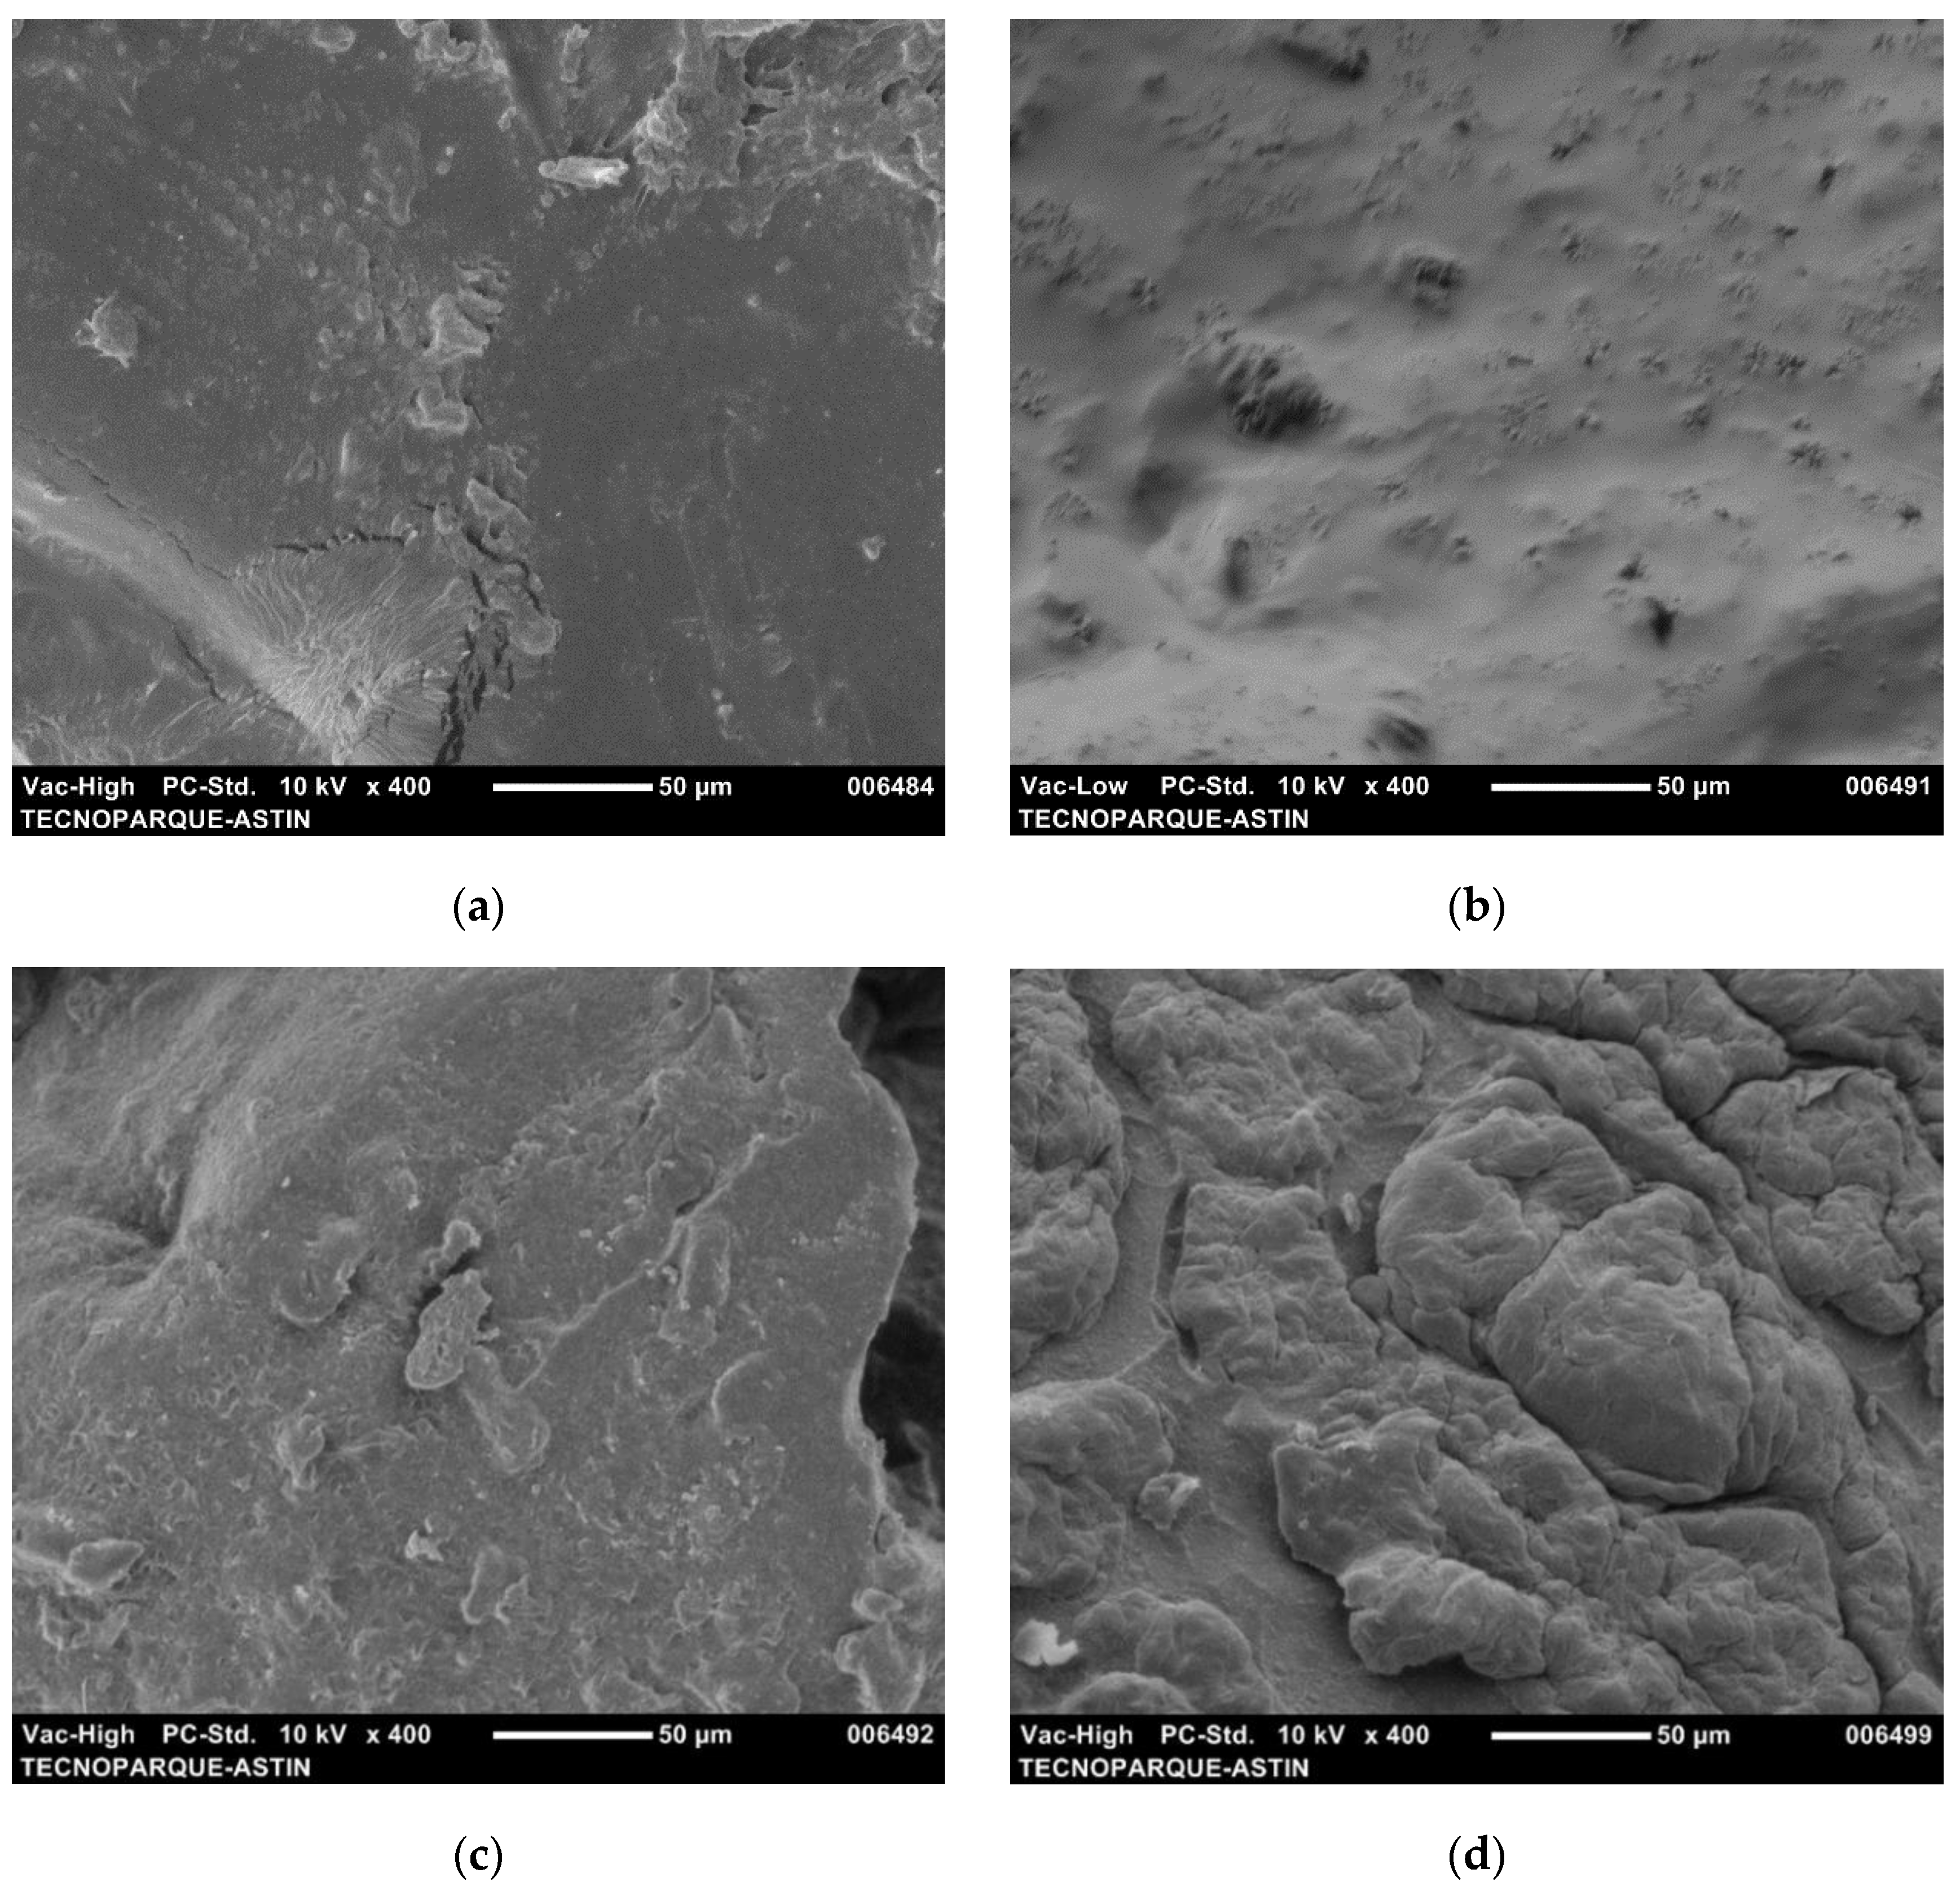
SEM micrographs of hydrogels synthesized via the solution polymerization method are shown in Figure 5. In general, the surface of hydrogels reinforced at 3% (see AV-R3 in Figure 5b) showed a characteristic roughness compared to those non-reinforced (see AV-R0 in Figure 5a), reinforced at 5% (see AV-R5 in Figure 5c), and reinforced at 10% nanofibers (see AV-R10 in Figure 5d).

Figure 5.
SEM images of (a) non-reinforced acrylic hydrogel (AV-R0); along with (b) acrylic hydrogel reinforced with 3% w w−1 (AV-R3), (c) 5% w w−1 (AV-R5), and (d) 10% w w−1 (AV-R10) cellulose nanofibers from A. vera waste.
3.6. Swelling Capacity and Kinetics of Reinforced Hydrogels
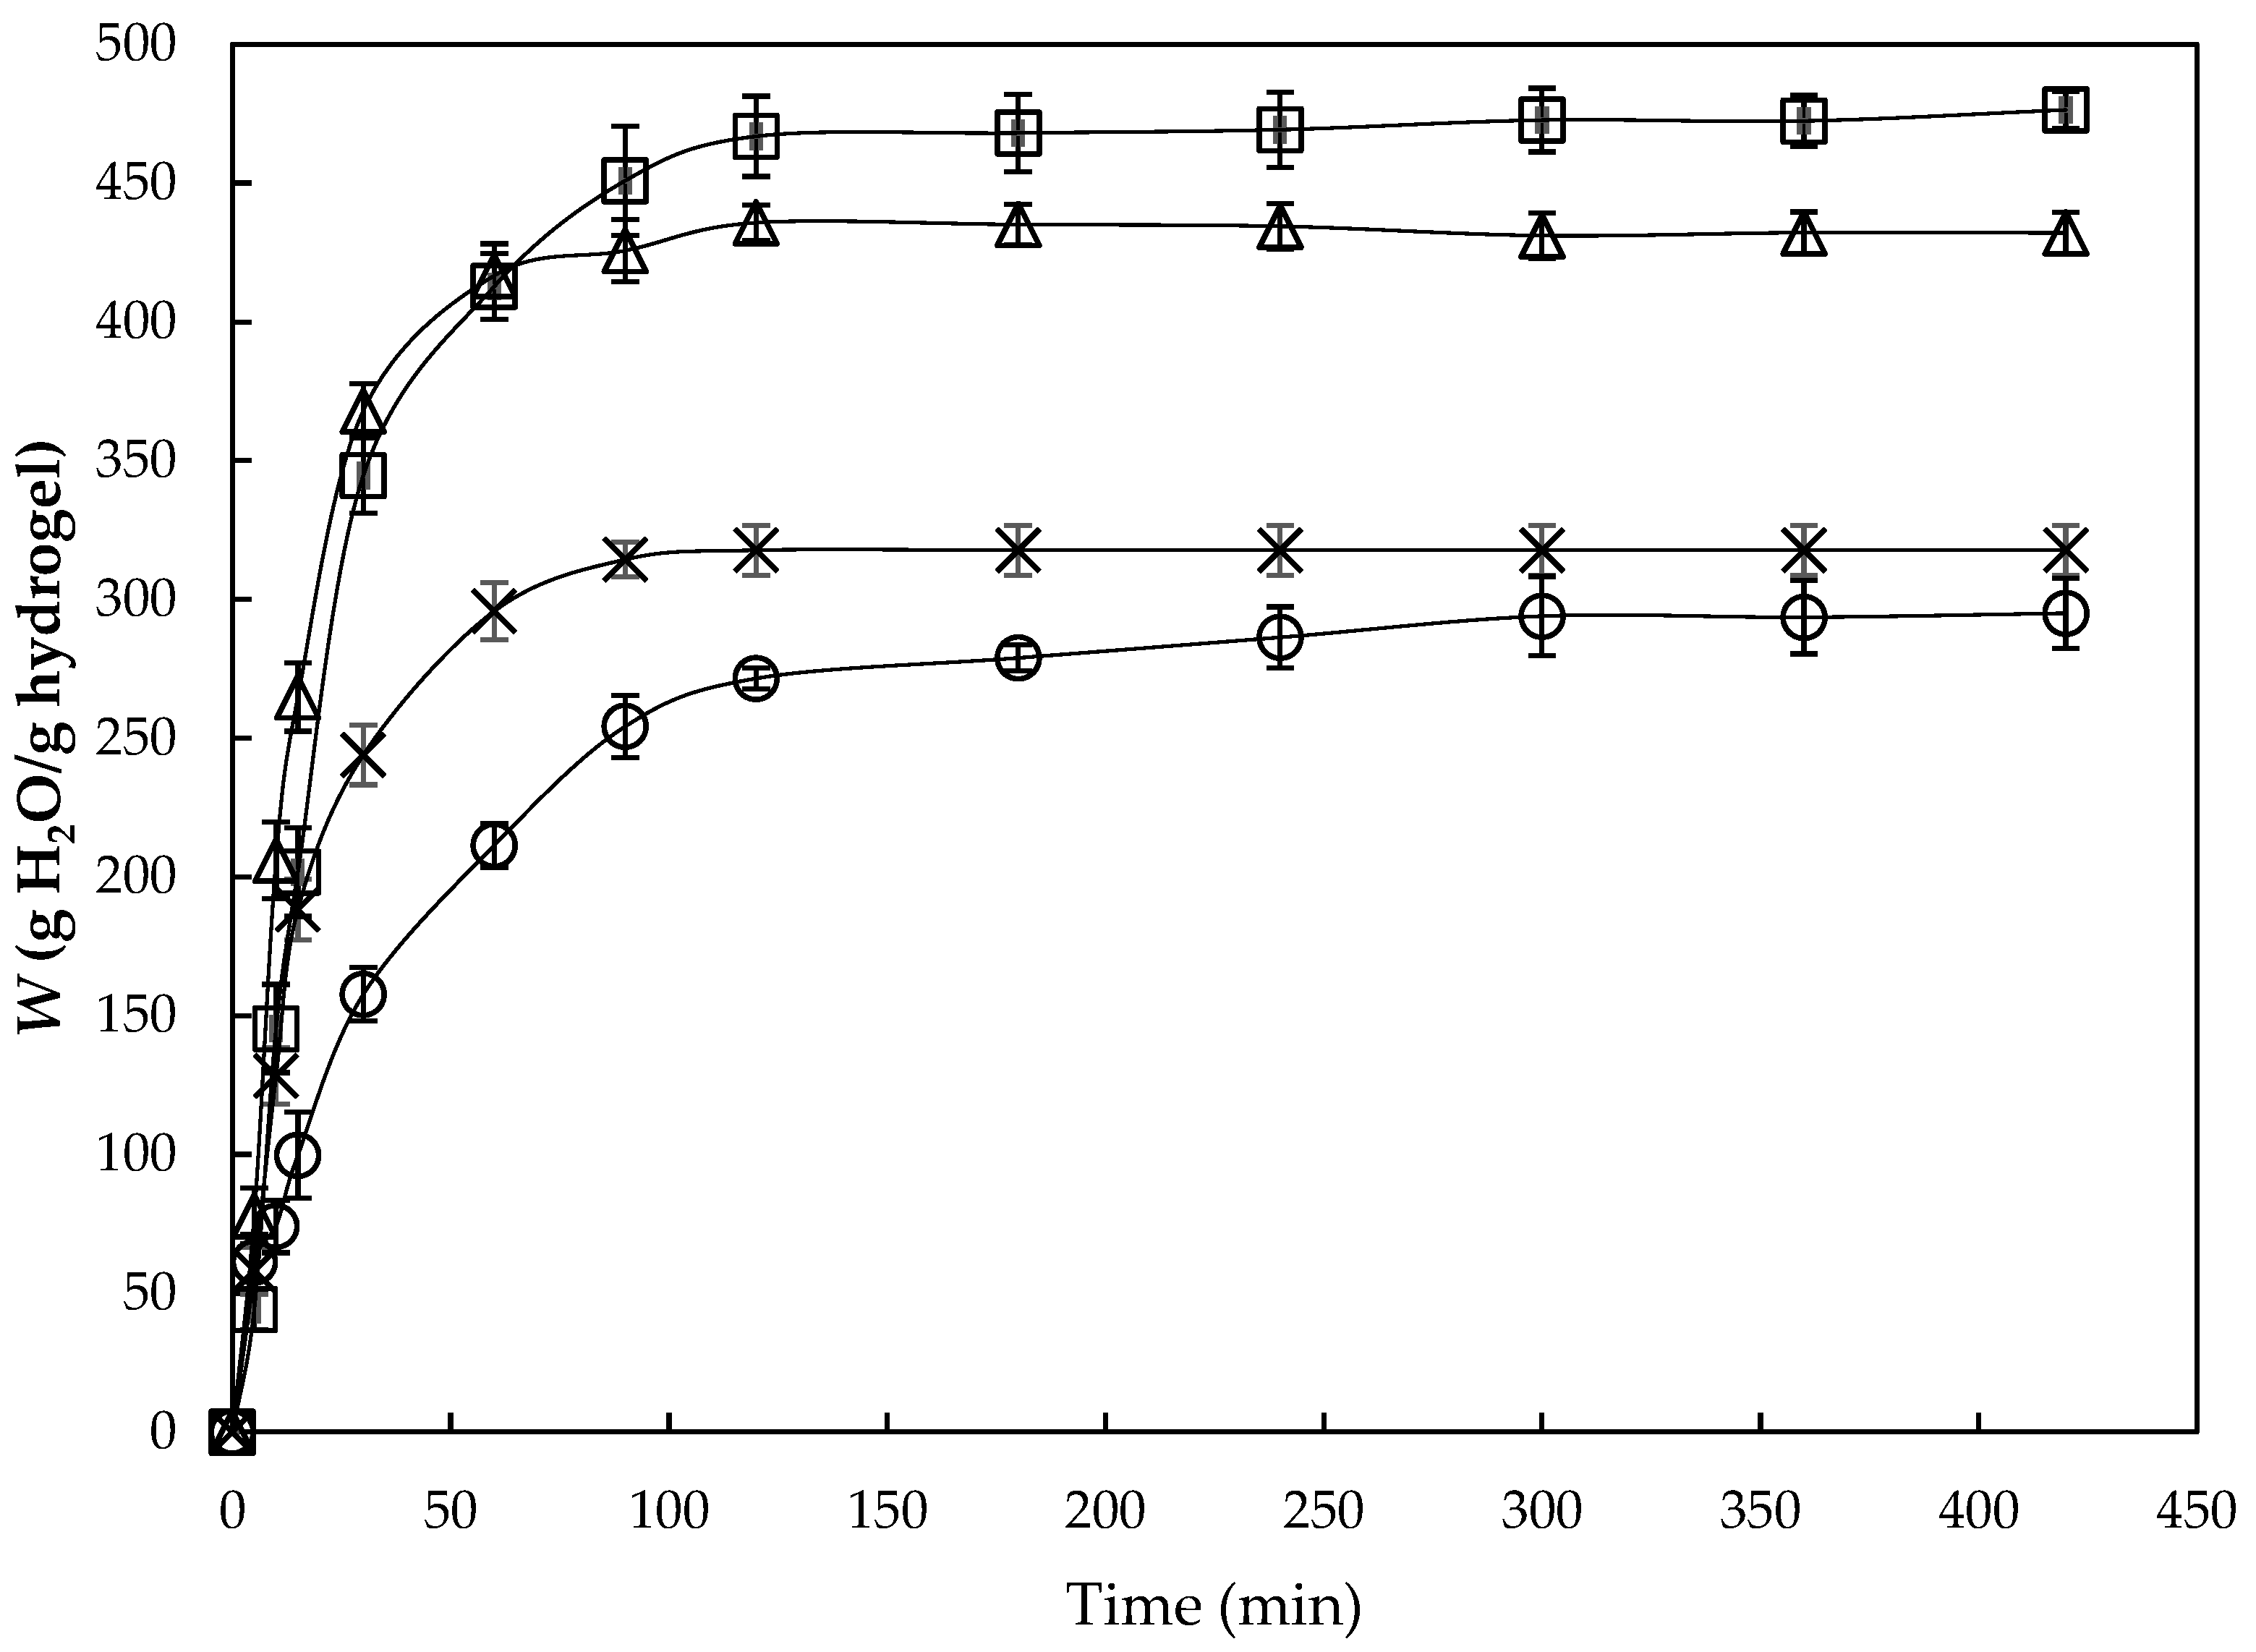
Figure 6 shows swelling isotherms of acrylic hydrogels and acrylic hydrogels reinforced with nanofibers synthesized using the solution polymerization method. As can be seen in Figure 6, for all samples, the swelling trend was similar in the first 30 min of immersion, reaching about 99%, 96%, 98%, and 89% of the equilibrium value (Weq) around 90 min for 0%, 3%, 5%, and 10% reinforcement, respectively. This point was followed by a slower process until Weq was achieved at roughly 120 min. This behavior has been reported in other works [15,22,23], including a previous work from our research group [19].

Figure 6.
Swelling isotherms of AV-R0 (×); AV-R3 (□), AV-R5 (∆), and AV-R10 (○).
On the other hand, Figure 7 shows the linear regression of the swelling curves obtained by Equation (2) for AV-R0, AV-R3, AV-R5, and AV-R10. The pseudo-second-order kinetic relationship had a good fit since the correlation coefficients (R2) were roughly 0.99 in all cases.
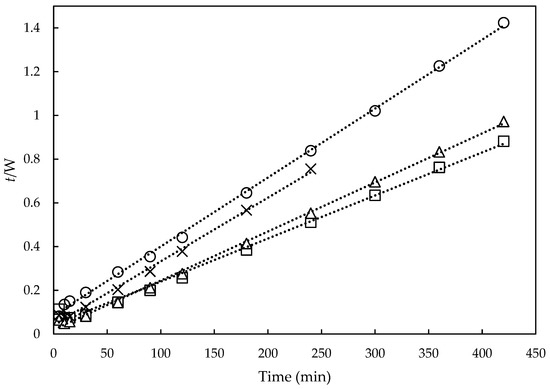
Figure 7.
Swelling rate curves for AV-R0 (×); AV-R3 (□), AV-R5 (∆), and AV-R10 (○).
Table 1 shows Weq and Wt for AV-R0, AV-R3, AV-R5, and AV-R10. These data were retrieved by using Equations (2)–(5) and calculated from the slope and the intersection of the lines in Figure 7.

Table 1.
Parameters of the swelling kinetics.
Table 1 shows that, due to the effect of the addition of cellulose nanofibers, the swelling capacity (Weq) of unreinforced hydrogel (310 g H2O g hydrogel−1) increased to 476 g H2O g hydrogel−1 and 432 g H2O g hydrogel−1 with 3% and 5% in nanofiber content, respectively. It is clear in Table 1 that 3% nanofiber reinforcement gave the best swelling capacity to the acrylic hydrogels, followed by 5% nanofiber addition. The swelling capacity for unreinforced and 10% reinforced hydrogels was virtually the same.
The above results are explained as the low nanofiber contents induced a higher swelling capacity due to the increase of hydrophilic functional groups provided by the –OH groups of the cellulose, which produced the formation of water cells within the polymeric networks by the effect of the interaction by hydrogen bonds, causing a higher swelling capacity [19]. On the contrary, higher nanocellulose content decreased the swelling capacity because they saturated the free spaces of the polymeric network [34]. Additionally, it may have been due to increased physical crosslinking and reduced porosity in the hydrogels [35].
4. Conclusions
The scientific literature does not report the use of A. vera cuticles to obtain nanocellulose nor their use as a reinforcement material for hydrogels. Furthermore, considering that the A. vera gel industry is growing at a CAGR of approximately 9% from 2020 to 2025 [36], an increase in the generation of waste from this industry at a global scale should be expected at the same rate. Regarding the aforementioned, it was confirmed in this work that A. vera rinds can be valorized through acid treatments combined with ultrasound to obtain cellulose nanofibers. SEM, FITR, TEM, and TGA analysis showed the efficiency of this method to obtain nanofibers. In addition, it was found that the concentration of nanofibers in hydrogels and the swelling capacity had a nonlinear relationship.
By increasing the concentration of nanofibers by 3%, increased interactions between the polymer matrix and the nanofibers were achieved, improving the stability of the network. However, above 3% a higher viscosity of the reactive system was found, which resulted in a decrease in motion of the polymer chains and, thus, impairment to the cross-linking process. Therefore, the hydrogel reinforced at 3% cellulose nanofiber was chosen as the best formulation in this work.
The inclusion of cellulose nanofibers in unreinforced commercial hydrogels can increase the swelling capacity of these materials. This aspect is of high relevance in agriculture, especially in crops where water stress is a growth restrictor. The reinforced hydrogels of this work are a new class of cellulose-based superabsorbent materials with a clear potential for application in the agricultural sector, which needs immediate solutions to the land drought problems that are currently occurring and will worsen each year due to the climate emergency. In addition, these synthesized materials would help reduce the use of fertilizers, which have increased in price this past year due to the global pandemic related to COVID-19 and the European conflict.
Author Contributions
Conceptualization, M.A.G.-C., L.S.-C. and D.F.T.; data curation, M.A.G.-C.; formal analysis, M.A.G.-C. and D.F.T.; funding acquisition, L.S.-C.; investigation, M.A.G.-C.; methodology, M.A.G.-C., L.S.-C. and D.F.T.; project administration, L.S.-C.; resources, M.A.G.-C. and L.S.-C.; software, M.A.G.-C. and D.F.T.; supervision, L.S.-C. and D.F.T.; validation, L.S.-C. and D.F.T.; visualization, M.A.G.-C. and D.F.T.; writing—original draft, M.A.G.-C., L.S.-C. and D.F.T.; writing—review and editing, D.F.T. All authors have read and agreed to the published version of the manuscript.
Funding
This research was funded by ASTIN-SENA (project reference 11796) and Universidad Nacional de Colombia (project reference 55159).
Institutional Review Board Statement
Not applicable.
Informed Consent Statement
Not applicable.
Data Availability Statement
The data that support the findings of this study are available on request from all authors, upon reasonable request.
Acknowledgments
The authors would like to thank the Research Group on Development of Materials and Products (GIDEMP, ASTIN), students of the Technology in Chemistry Applied to Industry (SENA), and the biotechnology laboratories of Tecnoparque Nodo Cali.
Conflicts of Interest
The authors declare no conflict of interest. The funders had no role in the design of the study; in the collection, analyses, or interpretation of data; in the writing of the manuscript, or in the decision to publish the results.
References
- Mohd Kanafi, N.; Abdul Rahman, N.; Rosdi, N.H.; Bahruji, H.; Maarof, H. Hydrogel nanofibers from carboxymethyl sago pulp and its controlled release studies as a methylene blue drug carrier. Fibers 2019, 7, 56. [Google Scholar] [CrossRef]
- Cakir Hatir, P. Light-induced hydrogels derived from poly(ethylene glycol) and acrylated methyl ricinoleate as biomaterials. J. Appl. Polym. Sci. 2022, 139, e52754. [Google Scholar] [CrossRef]
- Ling, Y.; Chen, L.; Huang, M.; Zhou, C.; Yang, L.; Niu, H.; Su, L.; Yang, Y.; Pirraco, R.P.; Reis, R.L.; et al. A novel method for the preparation of poly (acrylamide−co−acrylonitrile) upper critical solution temperature thermosensitive hydrogel by the partial dehydration of acrylamide grafted polypropylene sheets. Gels 2022, 8, 345. [Google Scholar] [CrossRef] [PubMed]
- Yudaev, P.; Mezhuev, Y.; Chistyakov, E. Nanoparticle-containing wound dressing: Antimicrobial and healing effects. Gels 2022, 8, 329. [Google Scholar] [CrossRef]
- Xie, Y.; Guan, Q.; Guo, J.; Chen, Y.; Yin, Y.; Han, X. Hydrogels for exosome delivery in biomedical applications. Gels 2022, 8, 328. [Google Scholar] [CrossRef]
- Goulis, P.; Kartsonakis, I.A.; Charitidis, C.A. Synthesis and characterization of a core-shell copolymer with different glass transition temperatures. Fibers 2020, 8, 71. [Google Scholar] [CrossRef]
- Wu, R.; Niamat, R.; Sansbury, B.; Borjigin, M. Fabrication and evaluation of multilayer nanofiber-hydrogel meshes with a controlled release property. Fibers 2015, 3, 296–308. [Google Scholar] [CrossRef]
- Jin, S.; Kim, Y.; Son, D.; Shin, M. Tissue adhesive, conductive, and injectable cellulose hydrogel ink for on-skin direct writing of electronics. Gels 2022, 8, 336. [Google Scholar] [CrossRef]
- Lubasova, D.; Netravali, A.N. A novel method for electrospinning nanofibrous 3-D structures. Fibers 2020, 8, 27. [Google Scholar] [CrossRef]
- Guancha-Chalapud, M.A.; Serna-Cock, L.; Tirado, D.F. Hydrogels are reinforced with Colombian fique nanofibers to improve techno-functional properties for agricultural purposes. Agriculture 2022, 12, 117. [Google Scholar] [CrossRef]
- Pérez-Blanco, C.D.; Hrast-Essenfelder, A.; Perry, C. Irrigation technology and water conservation: A review of the theory and evidence. Rev. Environ. Econ. Policy 2020, 14, 216–239. [Google Scholar] [CrossRef]
- United Nations. World Population Prospects the 2017 Revision: Key Findings and Advance Tables; United Nations: New York, NY, USA, 2017. [Google Scholar]
- Serna Cock, L.; Guancha-Chalapud, M.A. Natural fibers for hydrogels production and their applications in agriculture. Acta Agronómica 2017, 66, 495–505. [Google Scholar] [CrossRef]
- Spagnol, C.; Rodrigues, F.; Pereira, A.; Fajardo, A.; Rubira, A.; Muniz, E. Superabsorbent hydrogel composite made of cellulose nanofibrils and chitosan-graft-poly(acrylic acid). Carbohydr. Polym. 2012, 87, 2038–2045. [Google Scholar] [CrossRef]
- Markets and MarketsTM Research Private Ltd. Hydrogel Market. Available online: https://www.marketsandmarkets.com/Market-Reports/hydrogel-market-181614457.html (accessed on 5 June 2022).
- Joseph, O.O.; Babaremu, K.O. Agricultural waste as a reinforcement particulate for aluminum metal matrix composite (AMMCs): A review. Fibers 2019, 7, 33. [Google Scholar] [CrossRef]
- Cheng, S.; Panthapulakkal, S.; Sain, M.; Asiri, A. Aloe vera rind cellulose nanofibers-reinforced films. J. Appl. Polym. Sci. 2014, 131, 40592. [Google Scholar] [CrossRef]
- Ramezani Kakroodi, A.; Cheng, S.; Sain, M.; Asiri, A. Mechanical, thermal, and morphological properties of nanocomposites based on polyvinyl alcohol and cellulose nanofiber from Aloe vera rind. J. Nanomater. 2014, 2014, 903498. [Google Scholar] [CrossRef]
- Guancha-Chalapud, M.A.; Gálvez, J.; Serna-Cock, L.; Aguilar, C.N. Valorization of Colombian fique (Furcraea bedinghausii) for production of cellulose nanofibers and its application in hydrogels. Sci. Rep. 2020, 10, 11637. [Google Scholar] [CrossRef]
- Guancha-Chalapud, M.A.; Serna-Cock, L.; Tirado, D.F. Valorization of pineapple residues from the colombian agroindustry to produce cellulose nanofibers. Appl. Sci. 2022, 12, 6956. [Google Scholar] [CrossRef]
- Zhong, K.; Zheng, X.-L.; Mao, X.-Y.; Lin, Z.-T.; Jiang, G.-B. Sugarcane bagasse derivative-based superabsorbent containing phosphate rock with water–fertilizer integration. Carbohydr. Polym. 2012, 90, 820–826. [Google Scholar] [CrossRef]
- Karadağ, E.; Bariş Üzüm, Ö.; Saraydin, D. Water uptake in chemically crosslinked poly(acrylamide-co-crotonic acid) hydrogels. Mater. Des. 2005, 26, 265–270. [Google Scholar] [CrossRef]
- Spagnol, C.; Rodrigues, F.H.; Neto, A.G.V.C.; Pereira, A.G.B.; Fajardo, A.R.; Radovanovic, E.; Rubira, A.F.; Muniz, E.C. Nanocomposites based on poly(acrylamide-co-acrylate) and cellulose nanowhiskers. Eur. Polym. J. 2012, 48, 454–463. [Google Scholar] [CrossRef]
- Schott, H. Swelling kinetics of polymers. J. Macromol. Sci. Part B 1992, 31, 1–9. [Google Scholar] [CrossRef]
- Xie, J.; Hse, C.-Y.; Li, C.; Shupe, T.F.; Hu, T.; Qi, J.; De Hoop, C.F. Characterization of microwave liquefied bamboo residue and its potential use in the generation of nanofibrillated cellulosic fiber. ACS Sustain. Chem. Eng. 2016, 4, 3477–3485. [Google Scholar] [CrossRef]
- Célino, A.; Fréour, S.; Jacquemin, F.; Casari, P. The hygroscopic behavior of plant fibers: A review. Front. Chem. 2014, 1, 43. [Google Scholar] [CrossRef] [PubMed]
- Julie Chandra, C.S.; George, N.; Narayanankutty, S.K. Isolation and characterization of cellulose nanofibrils from arecanut husk fibre. Carbohydr. Polym. 2016, 142, 158–166. [Google Scholar] [CrossRef]
- Li, R.; Fei, J.; Cai, Y.; Li, Y.; Feng, J.; Yao, J. Cellulose whiskers extracted from mulberry: A novel biomass production. Carbohydr. Polym. 2009, 76, 94–99. [Google Scholar] [CrossRef]
- Zhang, P.P.; Tong, D.S.; Lin, C.X.; Yang, H.M.; Zhong, Z.K.; Yu, W.H.; Wang, H.; Zhou, C.H. Effects of acid treatments on bamboo cellulose nanocrystals. Asia-Pacific J. Chem. Eng. 2014, 9, 686–695. [Google Scholar] [CrossRef]
- Xie, J.; Hse, C.; De Hoop, C.F.; Hu, T.; Qi, J.; Shupe, T.F. Isolation and characterization of cellulose nanofibers from bamboo using microwave liquefaction combined with chemical treatment and ultrasonication. Carbohydr. Polym. 2016, 151, 725–734. [Google Scholar] [CrossRef]
- Carrier, M.; Loppinet-Serani, A.; Denux, D.; Lasnier, J.; Ham-Pichavant, F.; Cansell, F.; Aymonier, C. Thermogravimetric analysis as a new method to determine the lignocellulosic composition of biomass. Biomass Bioenergy 2011, 35, 298–307. [Google Scholar] [CrossRef]
- Song, Y.K.; Leng Chew, I.M.; Yaw Choong, T.S.; Tan, J.; Tan, K.W. Isolation of Nanocrystalline Cellulose from oil palm empty fruit bunch—A response surface methodology study. MATEC Web Conf. 2016, 60, 04009. [Google Scholar] [CrossRef]
- Vieyra, H.; Figueroa-López, U.; Guevara-Morales, A.; Vergara-Porras, B.; San Martín-Martínez, E.; Aguilar-Mendez, M.Á. Optimized monitoring of production of cellulose nanowhiskers from Opuntia ficus-indica (nopal cactus). Int. J. Polym. Sci. 2015, 2015, 871345. [Google Scholar] [CrossRef]
- Udeni Gunathilake, T.; Ching, Y.; Chuah, C. Enhancement of curcumin bioavailability using nanocellulose reinforced chitosan hydrogel. Polymers 2017, 9, 64. [Google Scholar] [CrossRef] [PubMed]
- Jayaramudu, T.; Ko, H.-U.; Kim, H.C.; Kim, J.W.; Kim, J. Swelling behavior of polyacrylamide–cellulose nanocrystal hydrogels: Swelling kinetics, temperature, and pH effects. Materials 2019, 12, 2080. [Google Scholar] [CrossRef] [PubMed]
- Ayala-Aponte, A.A.; Cárdenas-Nieto, J.D.; Tirado, D.F. Aloe vera gel drying by Refractance Window®: Drying kinetics and high-quality retention. Foods 2021, 10, 1445. [Google Scholar] [CrossRef] [PubMed]


Publisher’s Note: MDPI stays neutral with regard to jurisdictional claims in published maps and institutional affiliations. |
© 2022 by the authors. Licensee MDPI, Basel, Switzerland. This article is an open access article distributed under the terms and conditions of the Creative Commons Attribution (CC BY) license (https://creativecommons.org/licenses/by/4.0/).