
Influence of Draw Ratio and Take-Up Velocity on Properties of Ultrafiltration Hollow Fiber Membranes from Polyethersulfone


 , and
, and 
Abstract
:1. Introduction
- Draw ratio [16].
2. Materials and Methods
2.1. Materials
2.2. Asymmetric Hollow Fiber Spinning and Characterization
3. Results and Discussion
4. Conclusions
Author Contributions
Funding
Acknowledgments
Conflicts of Interest
References
- Guillen, G.R.; Pan, Y.; Li, M.; Hoek, E.M.V. Preparation and characterization of membranes formed by nonsolvent induced phase separation: A review. Ind. Eng. Chem. Res. 2011, 50, 3798–3817. [Google Scholar] [CrossRef]
- Bildyukevich, A.V.; Plisko, T.V.; Liubimova, A.S.; Volkov, V.V.; Usosky, V.V. Hydrophilization of polysulfone hollow fiber membranes via addition of polyvinylpyrrolidone to the bore fluid. J. Membr. Sci. 2017, 524, 537–549. [Google Scholar] [CrossRef]
- Qin, J.-J.; Chung, T.-S. Effects of orientation relaxation and bore fluid chemistry on morphology and performance of polyethersulfone hollow fibers for gas separation. J. Membr. Sci. 2004, 229, 1–9. [Google Scholar] [CrossRef]
- Susanto, H.; Ulbricht, M. Characteristics, performance and stability of polyethersulfone ultrafiltration membranes prepared by phase separation method using different macromolecular additives. J. Membr. Sci. 2009, 327, 125–135. [Google Scholar] [CrossRef]
- Idris, A.; Zain, N.; Noordin, M.Y. Synthesis, characterization and performance of asymmetric polyethersulfone (PES) ultrafiltration membranes with polyethylene glycol of different molecular weights as additives. Desalination 2007, 207, 324–339. [Google Scholar] [CrossRef]
- Bildyukevich, A.V.; Hliavitskaya, T.A.; Kavalenka, M.N. The modification of polyethersulfone membranes using a synperonic f108 block copolymer and their application for the fractionation of thermomechanical pulp mill process water. Membr. Membr. Technol. 2020, 2, 210–216. [Google Scholar] [CrossRef]
- Matveev, D.N.; Vasilevsky, V.P.; Kutuzov, K.A. Properties of polysulfone hollow fiber membranes depending on the method of the spinning solution preparing. Key Eng. Mater. 2020, 869, 443–448. [Google Scholar] [CrossRef]
- Wang, K.Y.; Matsuura, T.; Chung, T.-S.; Guo, W.F. The effects of flow angle and shear rate within the spinneret on the separation performance of poly(ethersulfone) (PES) ultrafiltration hollow fiber membranes. J. Membr. Sci. 2004, 240, 67–79. [Google Scholar] [CrossRef]
- Qin, J.-J.; Chung, T.-S. Effect of dope flow rate on the morphology, separation performance, thermal and mechanical properties of ultrafiltration hollow fibre membranes. J. Membr. Sci. 1999, 157, 35–51. [Google Scholar] [CrossRef]
- Qin, J.-J.; Gu, J.; Chung, T.-S. Effect of wet and dry-jet wet spinning on the shear-induced orientation during the formation of ultrafiltration hollow fiber membranes. J. Membr. Sci. 2001, 182, 57–75. [Google Scholar] [CrossRef]
- Tang, Y.; Li, N.; Liu, A.; Ding, S.; Yi, C.; Liu, H. Effect of spinning conditions on the structure and performance of hydrophobic PVDF hollow fiber membranes for membrane distillation. Desalination 2012, 287, 326–339. [Google Scholar] [CrossRef]
- Bildyukevich, A.V.; Hliavitskaya, T.A.; Melnikova, G.B. Structure and properties of polyethersulfone membranes based on polyethersulfone–nonsolvent–solvent systems. Membr. Membr. Technol. 2020, 2, 283–295. [Google Scholar] [CrossRef]
- Bildyukevich, A.V.; Hliavitskaya, T.A.; Pratsenko, S.A.; Melnikova, G.B. The Modification of polyethersulfone membranes with polyacrylic acid. Membr. Membr. Technol. 2021, 3, 24–35. [Google Scholar] [CrossRef]
- Chung, T.-S.; Xu, Z.-L.; Lin, W. Fundamental understanding of the effect of air-gap distance on the fabrication of hollow fiber membranes. J. Appl. Polym. Sci. 1999, 72, 379–395. [Google Scholar] [CrossRef]
- Peng, N.; Chung, T.S. The effects of spinneret dimension and hollow fiber dimension on gas separation performance of ultra-thin defect-free Torlon® hollow fiber membranes. J. Membr. Sci. 2008, 310, 455–465. [Google Scholar] [CrossRef]
- Matveev, D.N.; Kutuzov, K.A.; Vasilevsky, V.P. Effect of draw ratio on the morphology of polysulfone hollow fiber membranes. Membr. Membr. Technol. 2020, 2, 351–356. [Google Scholar] [CrossRef]
- Feng, C.Y.; Khulbe, K.C.; Matsuura, T.; Ismail, A.F. Recent progresses in polymeric hollow fiber membrane preparation, characterization and applications. Sep. Purif. Technol. 2013, 111, 43–71. [Google Scholar] [CrossRef]
- Cao, C.; Chung, T.S.; Chen, S.B.; Dong, Z.J. The study ofelongation and shear rates in spinning process and its effect ongas separation performance ofpoly(ether sulfone) (PES)hollow fiber membranes. Chem. Eng. Sci. 2004, 59, 1053. [Google Scholar] [CrossRef]
- Kumar, R.; Ismail, A.F. Fouling control on MF/ UF membranes: Effect of morphology, hydrophilicity and charge. J. Appl. Polym. Sci. 2015, 132, 42042. [Google Scholar] [CrossRef]
- Sagle, A.; Van Wagner, E.; Ju, H.; McCloskey, B.; Freeman, B.; Sharma, M. PEG-coated reverse osmosis membranes: Desalination properties and fouling resistance. J. Membr. Sci. 2009, 340, 92–108. [Google Scholar] [CrossRef]
- Hoek, E.; Bhattacharjee, S.; Elimelech, M. Effect of membrane surface roughness on colloid–membrane DLVO interactions. Langmuir 2003, 19, 4836–4847. [Google Scholar] [CrossRef]
- Hashino, M.; Katagiri, T.; Kubota, N.; Ohmukai, Y.; Maruyama, T.; Matsuyama, H. Effect of membrane surface morphology on membrane fouling with sodium alginate. J. Membr. Sci. 2011, 366, 258–265. [Google Scholar] [CrossRef]
- Hashino, M.; Katagiri, T.; Kubota, N.; Ohmukai, Y.; Maruyama, T.; Matsuyama, H. Effect of surface roughness of hollow fiber membranes with gear-shaped structure on membrane fouling by sodium alginate. J. Membr. Sci. 2011, 366, 389–397. [Google Scholar] [CrossRef]
- Gohari, R.; Lau, W.; Matsuura, T.; Ismail, A. Effect of surface pattern formation on membrane fouling and its control in phase inversion process. J. Membr. Sci. 2003, 446, 326–331. [Google Scholar] [CrossRef]
- Ivanov, M.V.; Dibrov, G.A.; Loyko, A.V.; Varezhkin, A.V.; Kagramanov, G.G. Techniques to manage geometry characteristics of hollow fiber membranes. Theor. Found. Chem. Eng. 2016, 50, 316–324. [Google Scholar] [CrossRef]
- Ma, Y.; Shi, F.; Ma, J.; Wu, M.; Zhang, J.; Gao, C. Effect of PEG additive on the morphology and performance of polysulfone ultrafiltration membranes. Desalination 2011, 272, 51–58. [Google Scholar] [CrossRef]
- Liu, Y.; Koops, G.H.; Strathmann, H. Characterization of morphology controlled polyethersulfone hollow fiber membranes by the addition of polyethylene glycol to the dope and bore liquid solution. J. Membr. Sci. 2003, 223, 187–199. [Google Scholar] [CrossRef]
- Hansen, C. Hansen Solubility Parameters: A User’s Handbook, 2nd ed.; CRC Press: Boca Raton, FL, USA, 2007; 544p. [Google Scholar]
- Dibrov, G.; Kagramanov, G.; Sudin, V.; Grushevenko, E.; Yushkin, A.; Volkov, A. Influence of sodium hypochlorite treatment on pore size distribution of polysulfone/polyvinylpyrrolidone membranes. Membranes 2020, 10, 356. [Google Scholar] [CrossRef]
- Dibrov, G.; Ivanov, M.; Semyashkin, M.; Sudin, V.; Kagramanov, G. High-pressure aging of asymmetric Torlon® hollow fibers for helium separation from natural gas. Fibers 2018, 6, 83. [Google Scholar] [CrossRef] [Green Version]
- Dibrov, G.; Ivanov, M.; Semyashkin, M.; Sudin, V.; Fateev, N.; Kagramanov, G. Elaboration of high permeable macrovoid free polysulfone hollow fiber membranes for air separation. Fibers 2019, 7, 43. [Google Scholar] [CrossRef] [Green Version]
- Zeman, L.J.; Zydney, A. Microfiltration and Ultrafiltration: Principles and Applications, 1st ed.; Marcel Dekker: New York, NY, USA, 1996; pp. 197–201. [Google Scholar]
- Khulbe, K.C.; Feng, Y.; Matsuura, T. Nodular structure of polymers in the membrane. In Synthetic Polymeric Membranes; Pasch, P., Ed.; Springer: Heidelberg/Berlin, Germany, 2008; pp. 47–100. [Google Scholar]
- Khulbe, K.; Feng, C.; Matsuura, T.; Kapantaidakis, G.; Wessling, M.; Koops, G. Characterization of polyethersulfone-polyimide hollow fiber membranes by atomic force microscopy and contact angle goniometery. J. Membr. Sci. 2003, 226, 63–73. [Google Scholar] [CrossRef]


| Substance | δD | δP | δH | δ | Ra |
|---|---|---|---|---|---|
| PES | 19.6 | 10.8 | 9.2 | 24.20 | - |
| N-Methyl-2-pyrrolidone (NMP) | 18.0 | 12.3 | 7.2 | 22.96 | 4.1 |
| N,N-dimethylformamide (DMF) | 17.4 | 13.7 | 11.3 | 24.86 | 5.7 |
| Dimethylacetamide (DMAc) | 16.8 | 11.5 | 10.2 | 22.77 | 5.7 |
| Dimethyl sulfoxide (DMSO) | 18.4 | 16.4 | 10.2 | 26.68 | 6.2 |
| PEG-400 | 17.88 | 4.0 | 13.85 | 22.97 | 8.9 |
| PEG-200 | 17.97 | 6.06 | 17.3 | 25.67 | 9.9 |
| PVP | 21.4 | 11.6 | 21.6 | 32.54 | 12.9 |
| H2O | 15.5 | 16.0 | 42.3 | 47.81 | 34.5 |
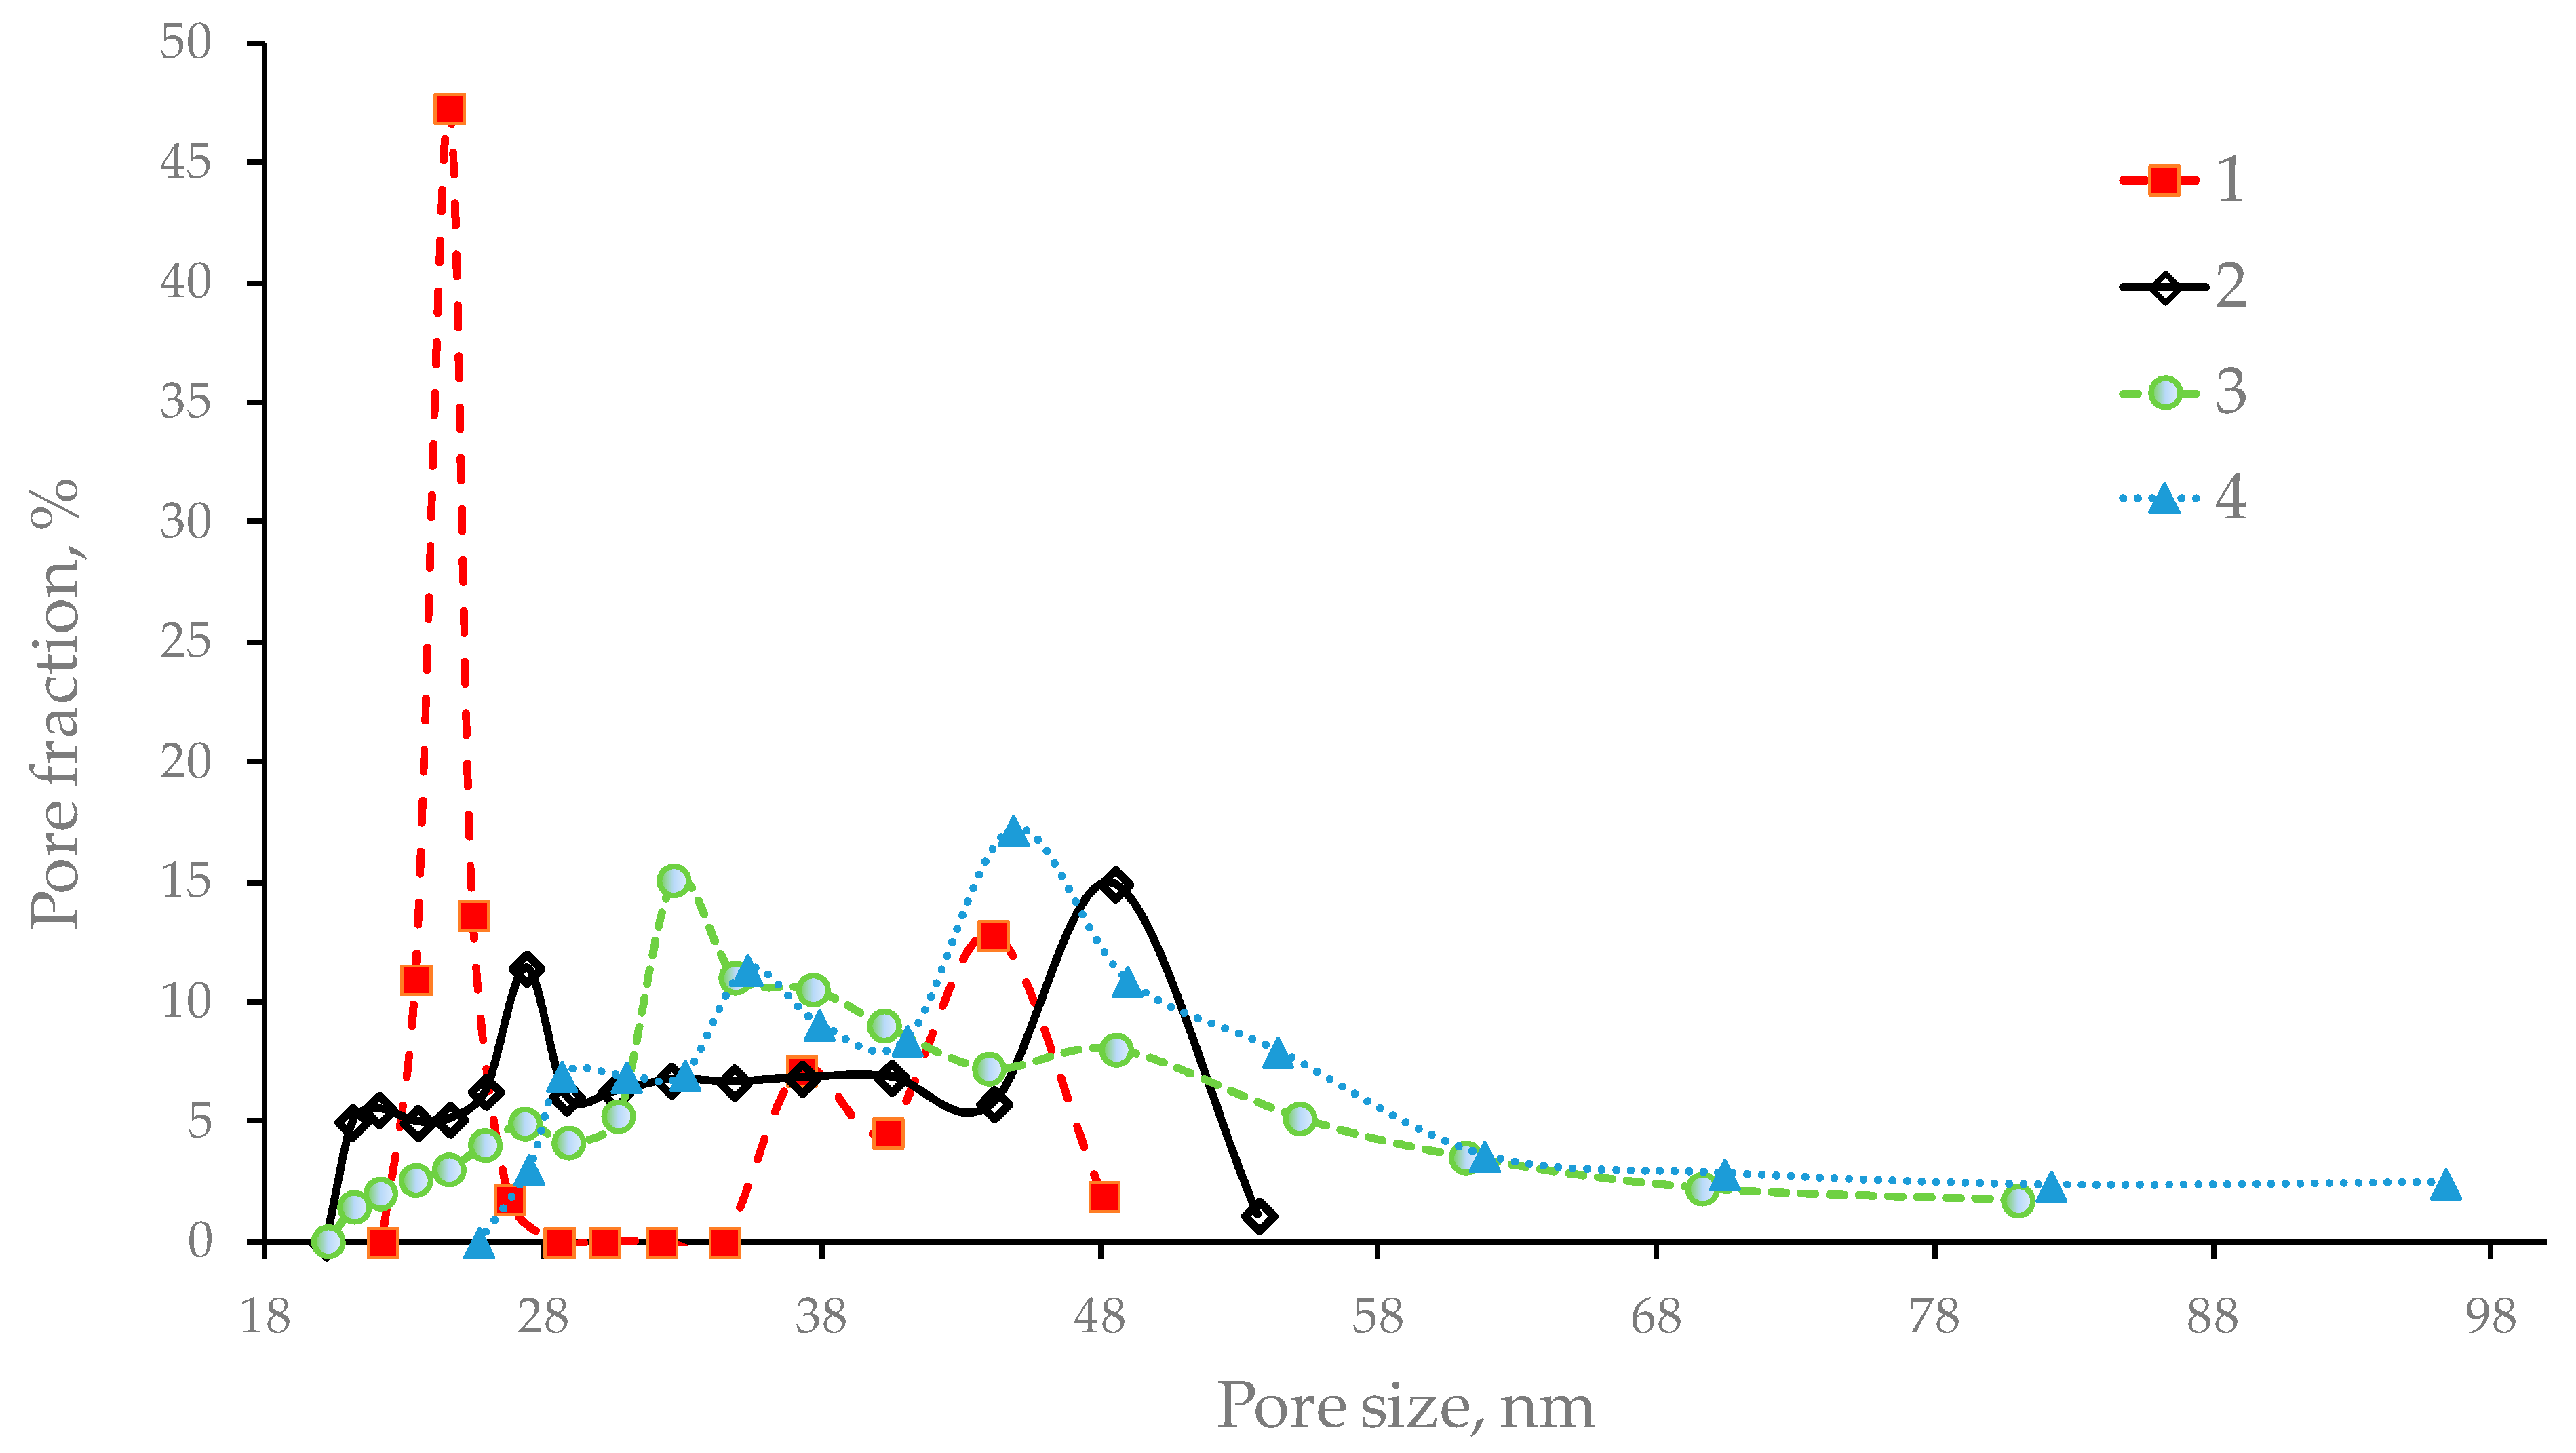
| Sample # | 1 | 2 | 3 | 4 |
|---|---|---|---|---|
| Draw ratio | 1.2 | 3.0 | 1.2 | 3.0 |
| Take-up velocity, m/min | 5.5 | 5.5 | 11 | 11 |
| P/l, l/(m2·h·bar) | 1000 | 950 | 1020 | 1030 |
| Pburst(H2O), bar | 10 | 10 | 10 | 10 |
| Pburst (BuOH/H2O), bar | 4.6 | 4.6 | 4.4 | 4.7 |
| Mean pore size (LLDP), nm | 25 | 33 | 35 | 45 |
| Maximum pore size (LLDP), nm | 48 | 54 | 81 | 96 |
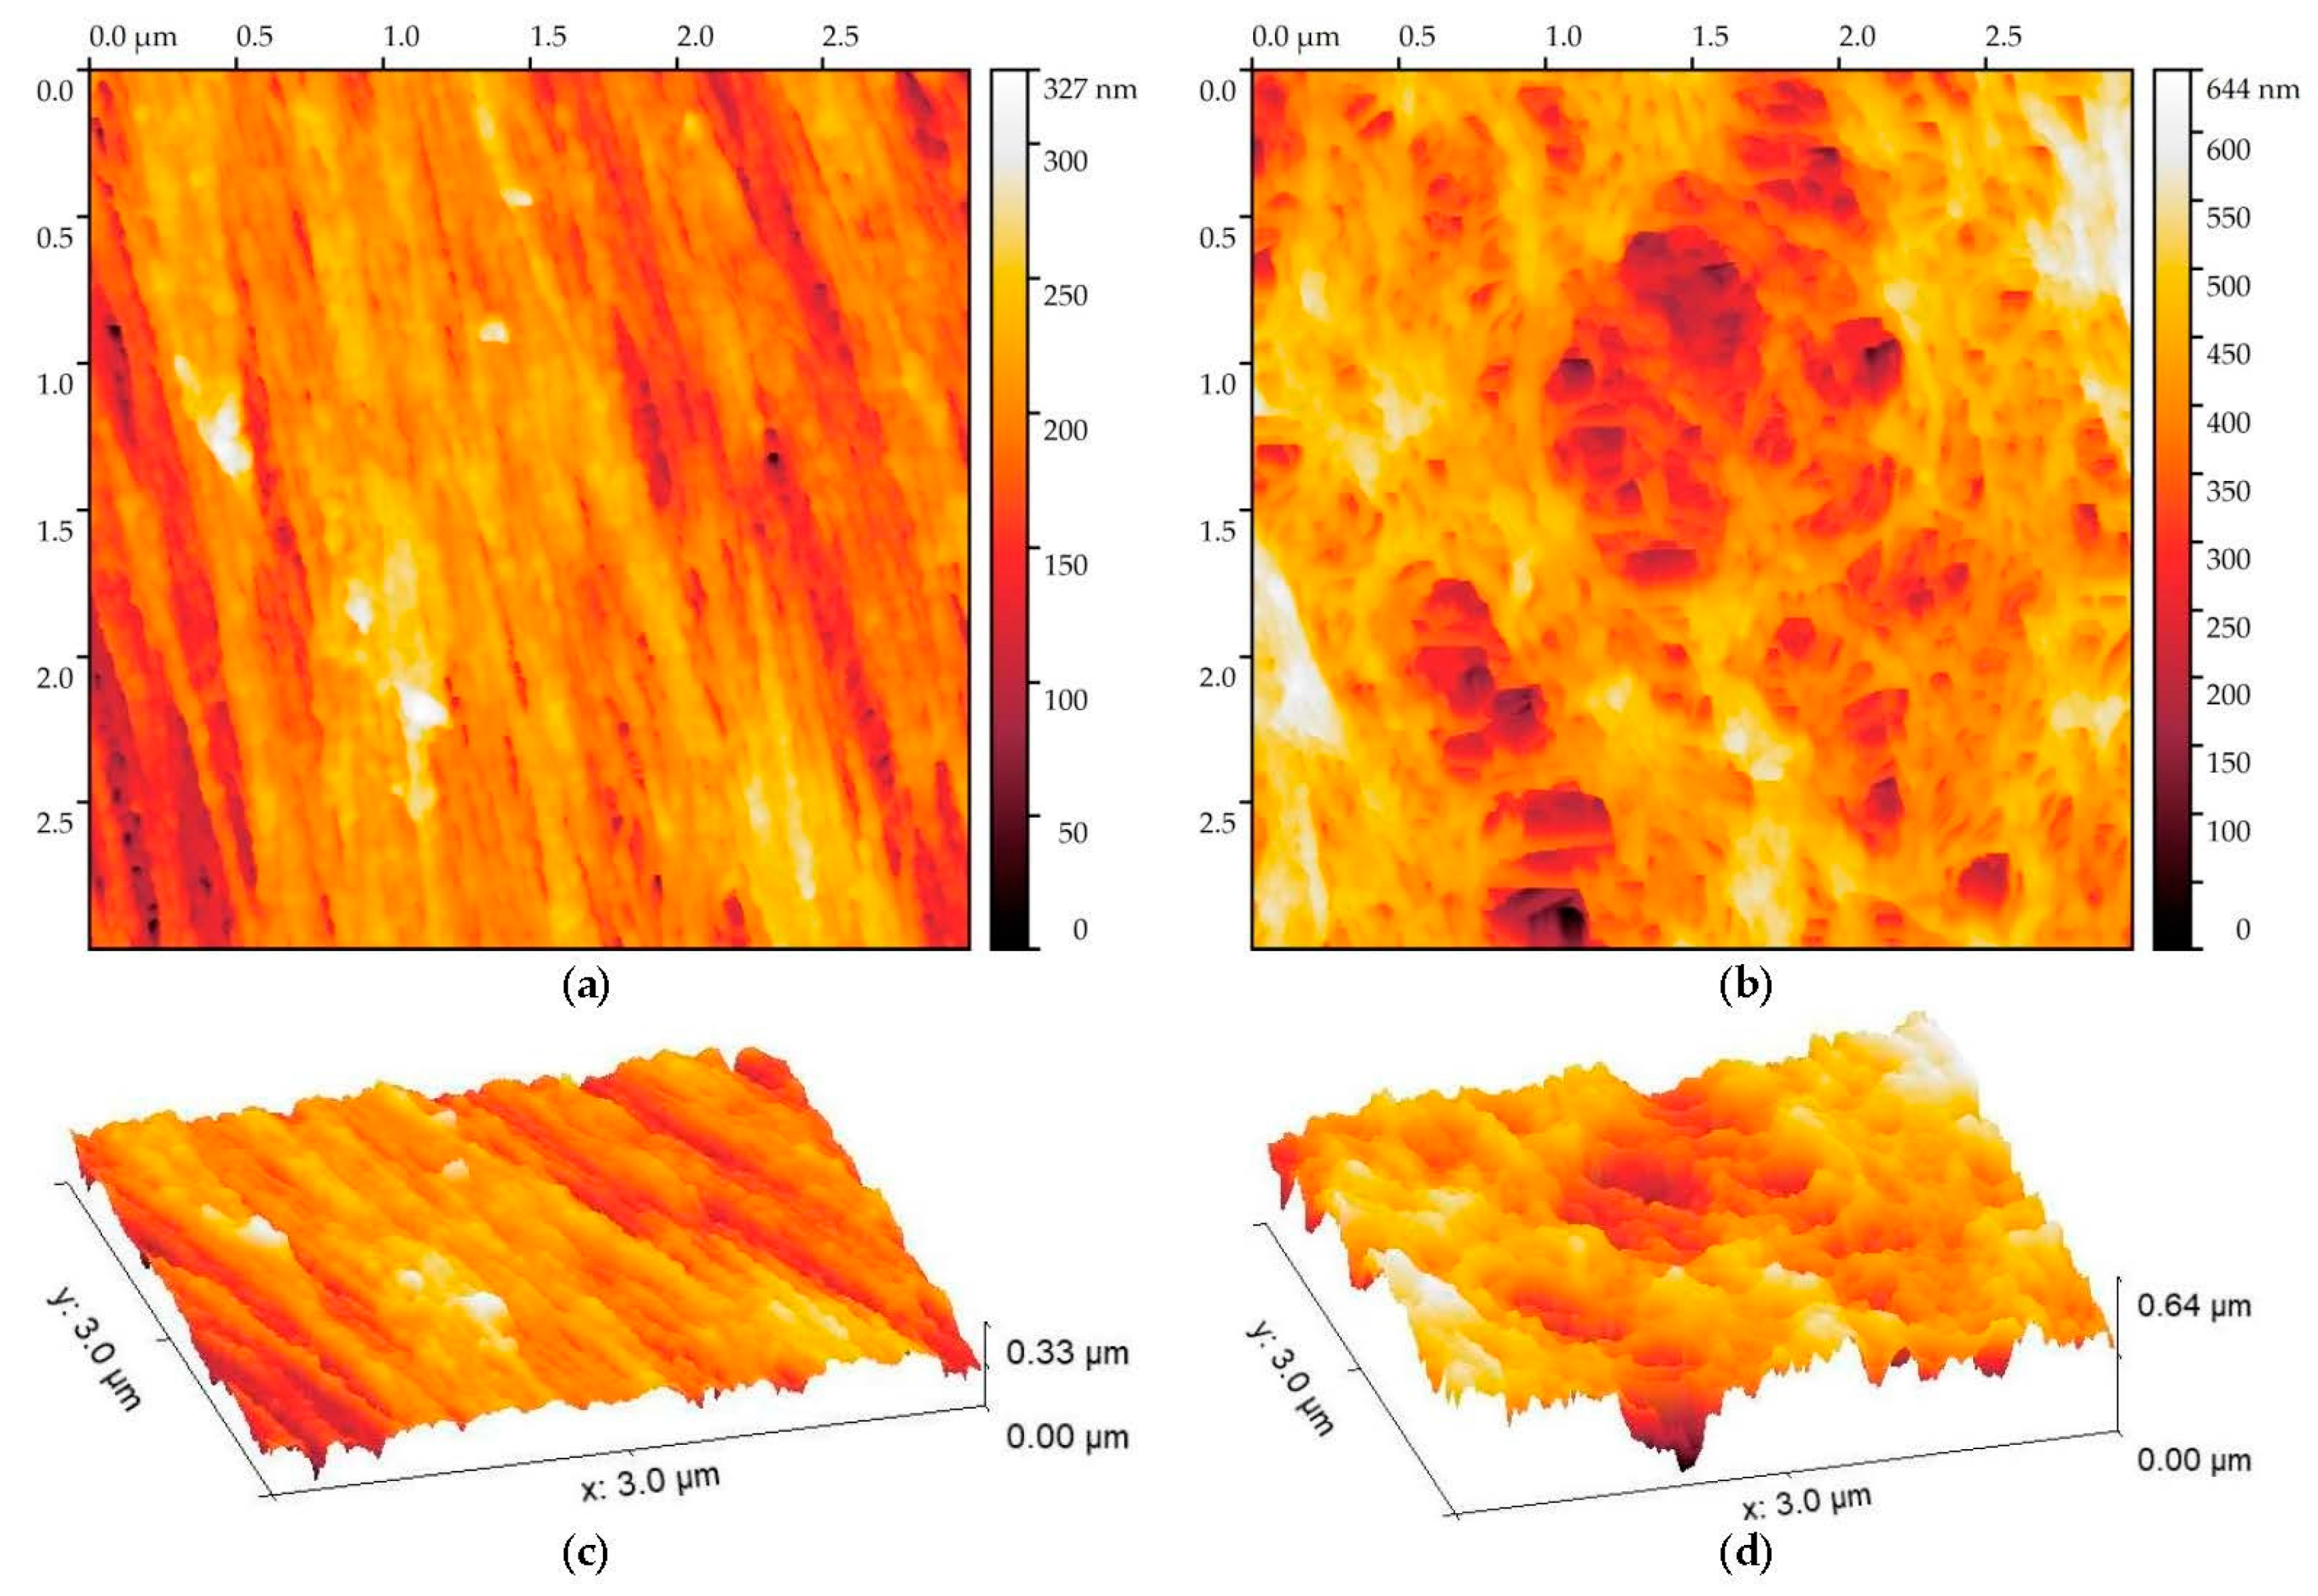
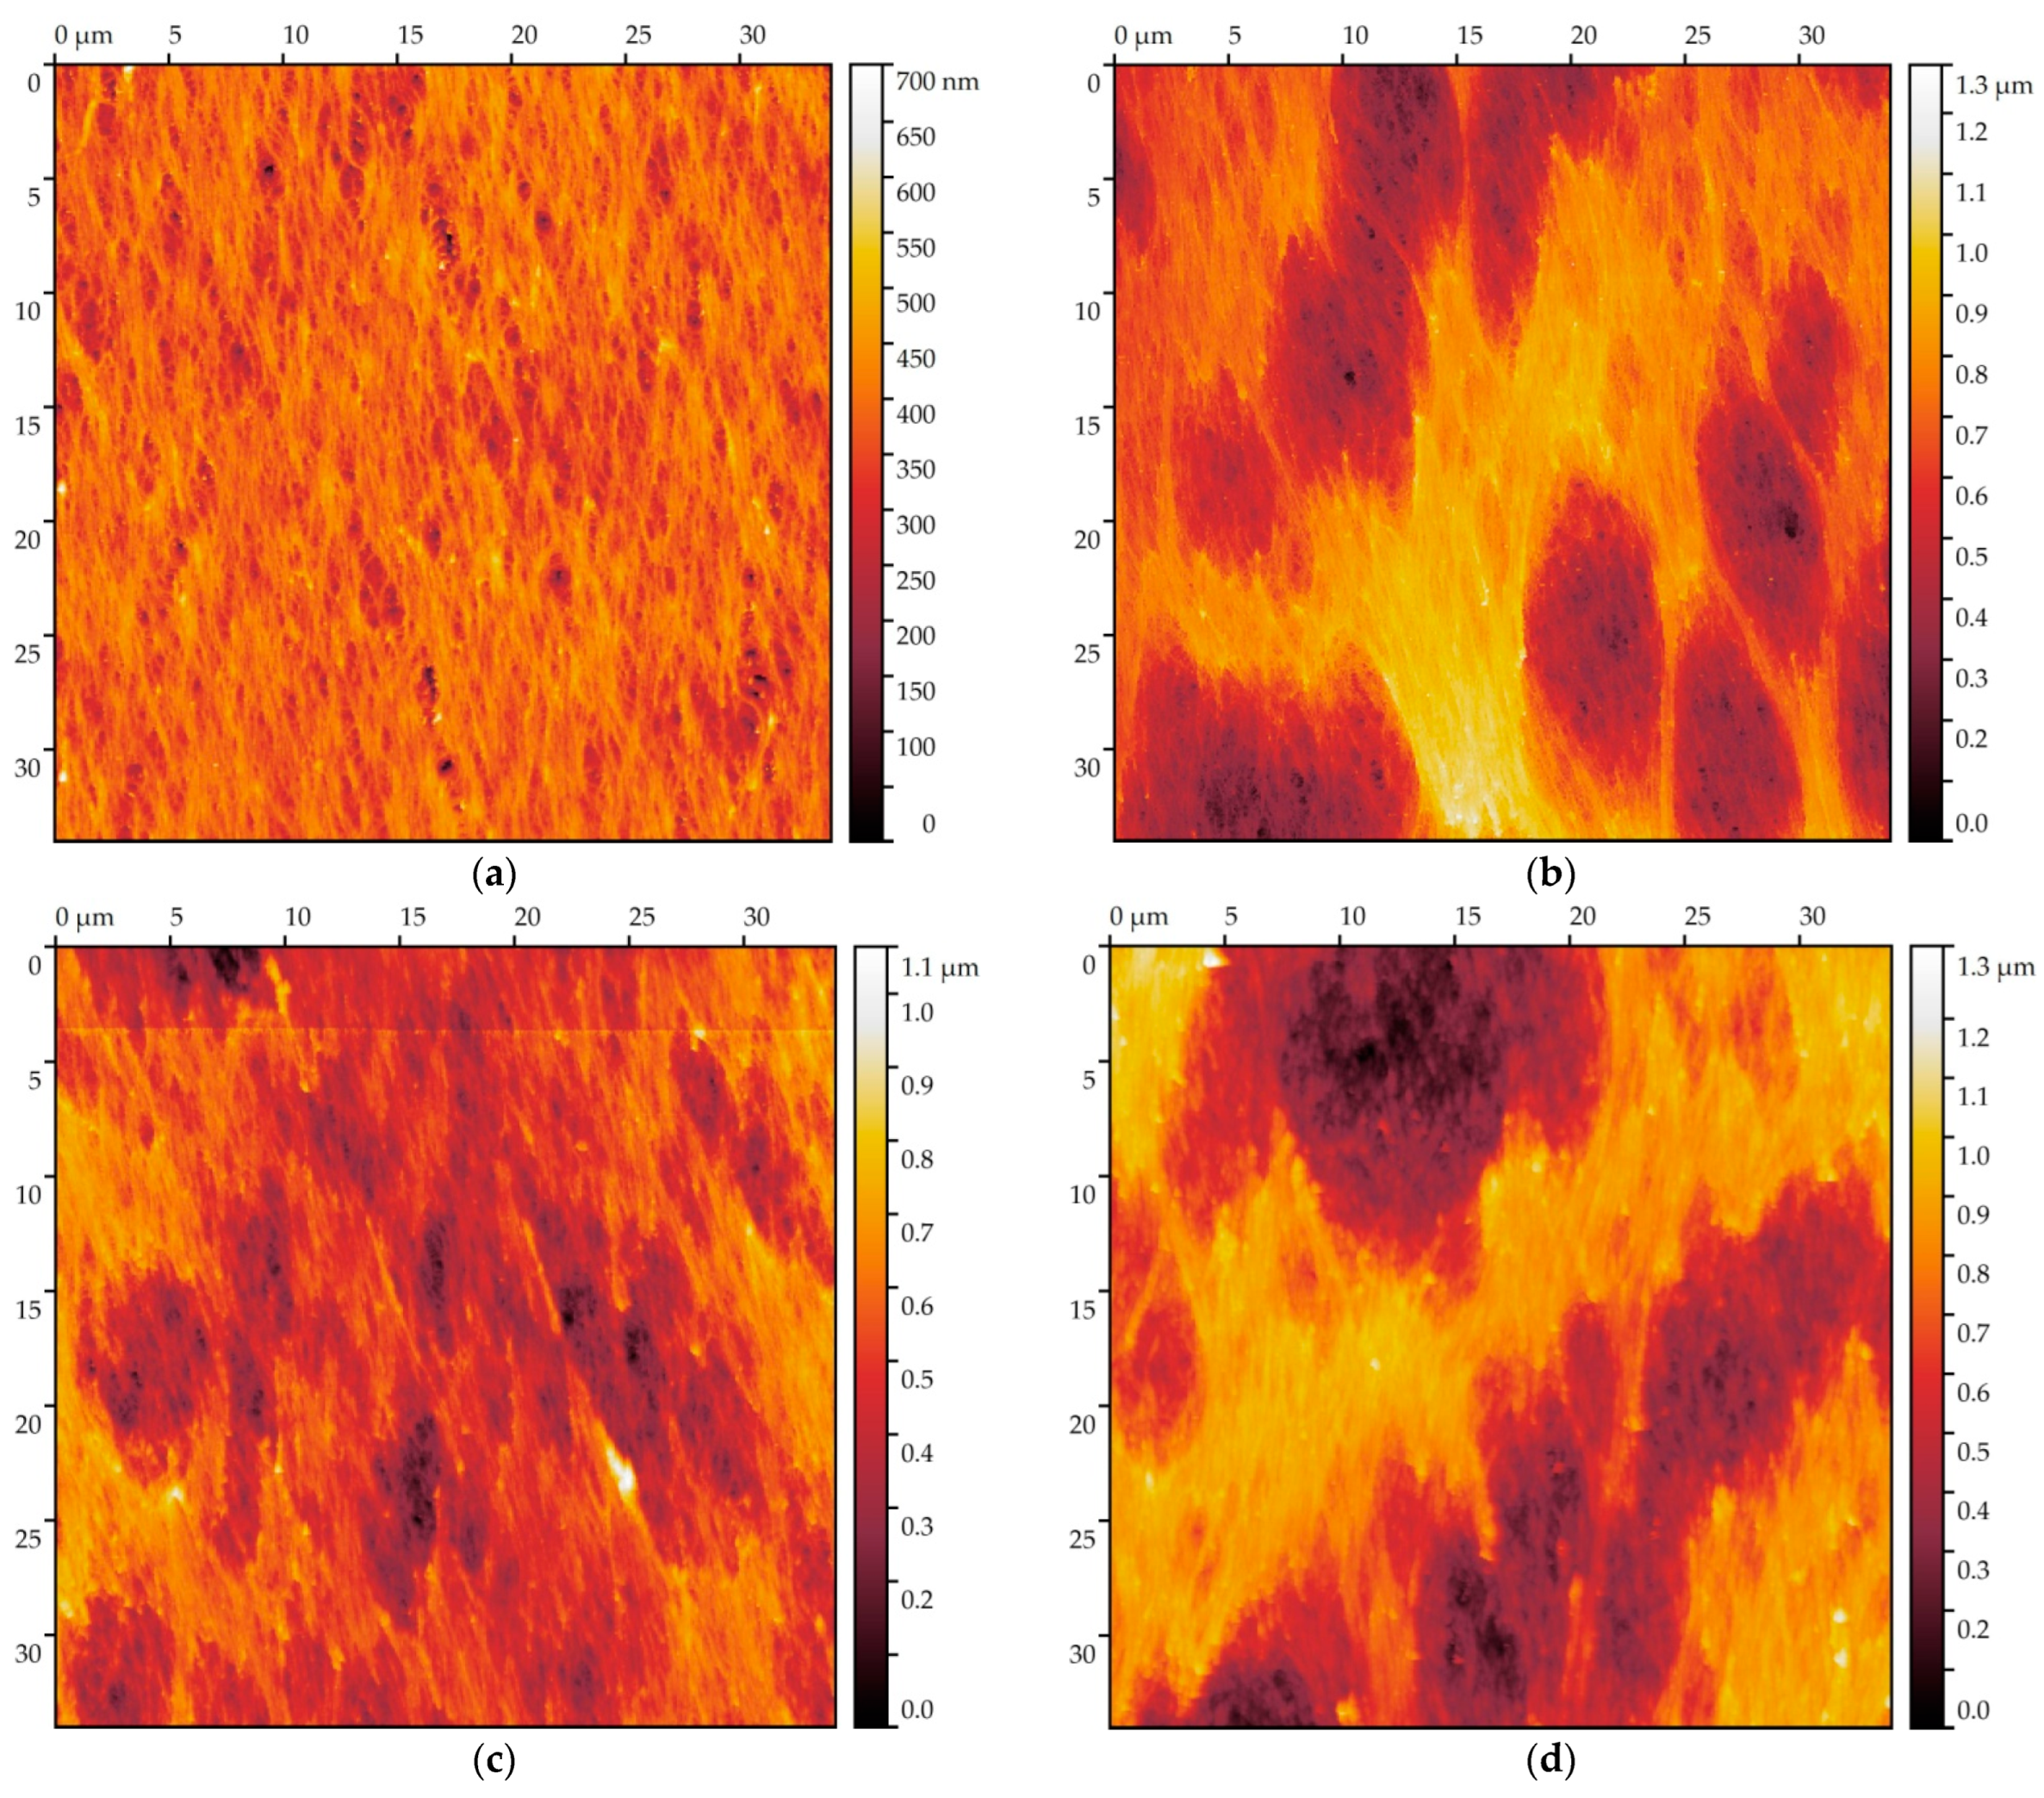
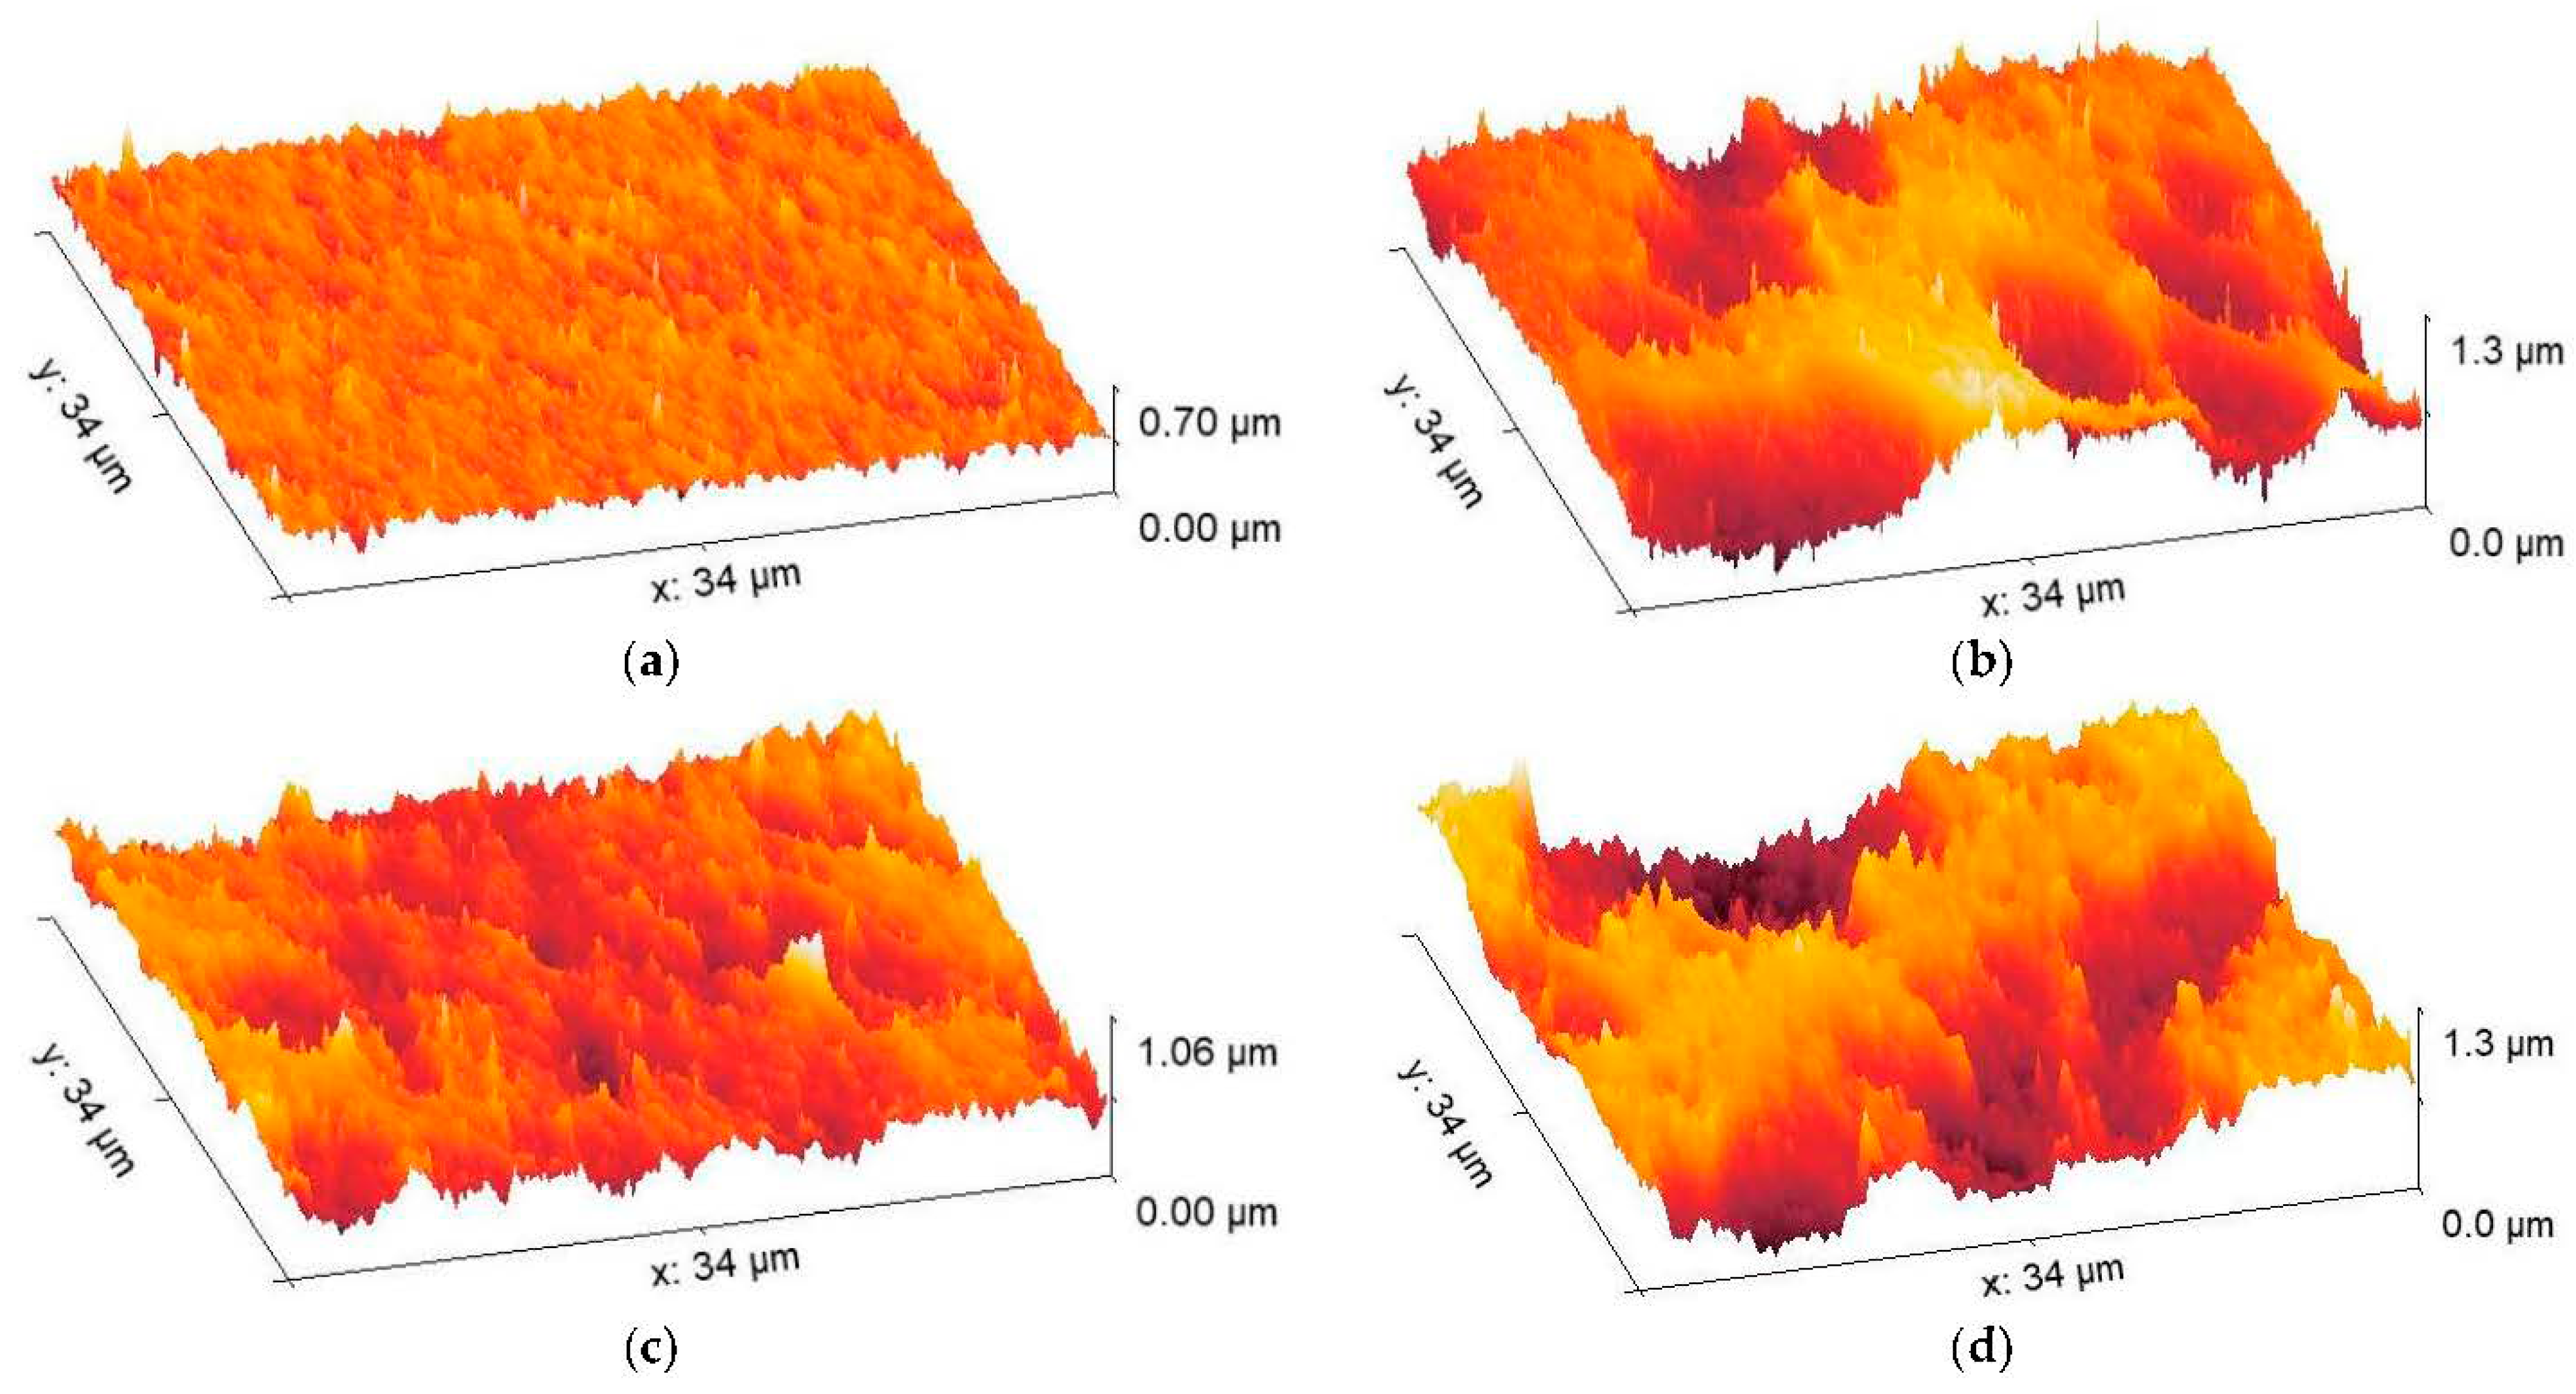
| Sample # | Size, μm | Ra, nm | Rq, nm | Rt, nm | Rtm, nm | Rvm, nm | Rpm, nm |
|---|---|---|---|---|---|---|---|
| 1 | 35 × 35 | 17 | 22 | 159 | 109 | 58 | 52 |
| 3 | 35 × 35 | 25 | 32 | 195 | 132 | 66 | 66 |
| 2 | 35 × 35 | 29 | 36 | 231 | 172 | 96 | 78 |
| 4 | 35 × 35 | 35 | 45 | 313 | 192 | 94 | 98 |
| 4 (phase 1) | 3.5 × 3.5 | 8 | 11 | 126 | 52 | 28 | 23 |
| 4 (phase 2) | 3.5 × 3.5 | 20 | 25 | 178 | 110 | 67 | 51 |
Publisher’s Note: MDPI stays neutral with regard to jurisdictional claims in published maps and institutional affiliations. |
© 2022 by the authors. Licensee MDPI, Basel, Switzerland. This article is an open access article distributed under the terms and conditions of the Creative Commons Attribution (CC BY) license (https://creativecommons.org/licenses/by/4.0/).
Share and Cite
Dibrov, G.; Kagramanov, G.; Sudin, V.; Molchanov, S.; Grushevenko, E.; Yushkin, A.; Volkov, V. Influence of Draw Ratio and Take-Up Velocity on Properties of Ultrafiltration Hollow Fiber Membranes from Polyethersulfone. Fibers 2022, 10, 29. https://doi.org/10.3390/fib10030029
Dibrov G, Kagramanov G, Sudin V, Molchanov S, Grushevenko E, Yushkin A, Volkov V. Influence of Draw Ratio and Take-Up Velocity on Properties of Ultrafiltration Hollow Fiber Membranes from Polyethersulfone. Fibers. 2022; 10(3):29. https://doi.org/10.3390/fib10030029
Chicago/Turabian StyleDibrov, George, George Kagramanov, Vladislav Sudin, Sergey Molchanov, Evgenia Grushevenko, Alexey Yushkin, and Vladimir Volkov. 2022. "Influence of Draw Ratio and Take-Up Velocity on Properties of Ultrafiltration Hollow Fiber Membranes from Polyethersulfone" Fibers 10, no. 3: 29. https://doi.org/10.3390/fib10030029
APA StyleDibrov, G., Kagramanov, G., Sudin, V., Molchanov, S., Grushevenko, E., Yushkin, A., & Volkov, V. (2022). Influence of Draw Ratio and Take-Up Velocity on Properties of Ultrafiltration Hollow Fiber Membranes from Polyethersulfone. Fibers, 10(3), 29. https://doi.org/10.3390/fib10030029