Abstract
The purpose of this qualification work is to study the physical and mechanical behavior of concrete with the addition of 0.5% and 1% coconut fiber, which has been subjected to two chemical treatments to reduce its degradation. The coconut fibers were extracted from the raw material and cut into pieces 4 cm long. Subsequently, the fibers were subjected to two chemical treatments. The first involved immersing the fibers in 4% sodium hydroxide (NaOH) solution, and the second treatment involved coating them with gum arabic and silica fume. A total of 50 samples of fibers were collected in their natural and post-treated state to be tested. The dosage was prepared for design strengths of 210 and 240 kg/cm2 (20.59 and 23.54 MPa), so that the percentages of 0.5% and 1% volume of coconut fiber, for the two treatments selected, replaced the respective volume of coarse aggregates. The cylinders with 1% addition of fibers had the best performance for the design strength of 20.59 MPa, including the cylinders without fibers. Those with 0.5% addition of fibers presented better performance for the 23.54 MPa dosage, although this was lower than the cylinders without fibers. In all cases, the cylinders with NaOH-treated fibers outperformed their counterparts with fibers treated with gum arabic and silica fume. Finally, a CO2 balance was determined, and an environmental gain up to 14 kg in CO2 emissions was established for each cubic meter of composite concrete.
1. Introduction
Concrete is a dominantly used construction material worldwide. Its manufacture involves the release of quantities of greenhouse-gas emissions to the atmosphere each year, accounting for 5% of global anthropogenic CO2 emissions [1]. Growing environmental awareness has led to several efforts to reduce concrete greenhouse emissions, without undermining its physical and mechanical properties. Different strategies, such as the addition of fly ash and furnace slags [1,2] and the inclusion of recycled PET fiber [3] or recycled concrete aggregates and agriculture and industry by-products [4,5], have been applied. Research on the usage of natural fibers, owing to their economy, low energy consumption, and wide availability [6,7,8] has also been conducted.
As a by-product of the coconut industry, coconut husk fiber is used in concrete manufacturing, representing a possibility of obtaining a composite material with improved mechanical characteristics and low cost [9]. An additional, less evident benefit is the CO2 sequestration achieved by encapsulating the fibers in the mixture because the final disposal method of coconut husk, owing to various circumstances, is usually incineration [10,11].
Despite the economic and environmental advantages listed above, the organic nature of coir fibers renders them vulnerable to degradation, owing to the environmental conditions in which the composite material is found and to the chemical aggressiveness of the cementitious matrix [12,13]. For this reason, mitigation measures, including different chemical treatments, are necessary to use. Fiber-matrix adhesion also plays an important role in composite concrete performance [12]. Some of these treatments are of the hydrophobic type, i.e., their purpose is to reduce the hydrophilic behavior of the fibers and improve fiber-matrix adhesion [14]. Hydrophobic treatments include acetylation and mercerization, as well as the use of sodium chloride, methacrylate, isocyanate, and silane, among others [14]. An alternative approach is to protect the fiber by adding silica fume, thereby producing a local pozzolanic effect (in the vicinity of the fiber) that increases the protection against chlorides [15].
The length of the fiber included in the concrete mix is a variable of significant influence on the mechanical performance of the final product. Previous studies have shown that specimens with better characteristics are obtained with lengths close to 5 cm, compared with 2.5 and 7.5 cm [16].
The present study sought to identify important differences in the physical and mechanical characteristics between composite concrete cylinders with coir fibers cut to 4 cm long. The latter was subjected to two different treatments (mercerization and silica fume coating) to make the fibers more endurable to degradation and adherent to the cementitious matrix, both highly desirable qualities in fibers [12]. The goal of this research was to include chemical treatment as an additional influential variable in coconut-fiber composite concrete performance. We also explored how these chemical treatments influenced the strength of the fibers alone. We further estimated the environmental benefit of using coconut fibers in concrete, estimating the potential amount of carbon dioxide produced by burning coconut husk or fiber, accounting for in-concrete fiber and husk remainders (pith) from fiber extraction. These remainders, if not incinerated, would be returned to land, thereby further decreasing CO2 emissions.
2. Materials and Methods
2.1. Materials
Coconut husk was purchased from farmers in the town of Cojimíes, Ecuador. Aggregates and cement were purchased from Holcim, Ecuador. Caustic soda and gum arabic were purchased from La Casa del Químico S.A. Silica fume (SikaFumeTM) was purchased from Aplika S.A.
The cement and coarse and fine aggregates were subjected to several essays to examine their properties and used later to determine the mix design. Table 1 shows the values for coarse and fine aggregates, extracted and processed from andesites in Pifo, Ecuador.

Table 1.
Properties of coarse and fine aggregates.
In the case of cement, Holcim FuerteTM type I was used. Its properties are shown in Table 2.
Table 2.
Properties of concrete.
The husk was progressively soaked and cleaned so that the fibers could be separated from the pith. Once the fiber was sufficiently clean, its properties were found in a similar way to the aggregates, as shown in Table 3. These properties were used to determine the fiber amounts in each mix and the fiber dry mass for CO2-footprint estimations.
Table 3.
Properties of coconut fiber.
Subsequently, the fiber was cut into pieces 40 mm long according to the criteria of [16,24]. A portion of the staple fibers was immersed in a 4% by weight solution of sodium hydroxide (NaOH) for 24 h [25]. Afterwards, the fibers were rinsed in tap water until a neutral pH was reached and allowed to drain for storage. The other part of the fibers was dipped in liquid gum arabic for 1 min to generate bonding, followed by the adhesion of silica fume around them [26]. The fibers were left to dry in the shade for later storage. Figure 1 shows the appearance of the fibers during the different chemical treatments.
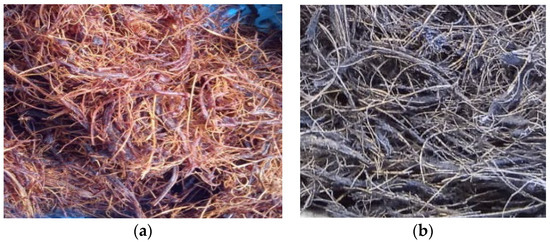
Figure 1.
(a) Appearance of fibers during NaOH treatment, and (b) silica-fume treatment.
A sample of uncut fibers was collected and subjected to the treatments described above. Another part was left untreated (50 specimens by typology). These were labeled, and their weight and length were taken. They were tested at the Polytechnic Textile Center from the National Polytechnic School (EPN). An Instron 3345 tensile testing equipment was used, following the guidelines of the ASTM D2256 standard [27]. The specimens were located in the apparatus and tensile loads at a crosshead speed of 30 mm/minute were applied until break. Breaking force (N) and elongation (mm/mm) were measured using the machine, obtaining the toughness (N/tex) as a result of dividing the breaking force over linear density (tex), and the latter was calculated with the specimen’s weight and length.
2.2. Specimen Preparation and Testing
The specimens were prepared and tested at the Laboratory of Materials Strength, Soil Mechanics, Pavements, and Geotechnics of the Pontifical Catholic University of Ecuador. Cylinders 30 cm in height and 15 cm in diameter were prepared. Cylinders with and without fibers were manufactured for design strengths of 20.59 and 23.54 MPa at ages 14, 28, and 56 days. The cylinders to which fiber was added were distinguished by the volume percentage of fiber (0.5% and 1%) and by the treatment to which the fiber was subjected (mercerization or silica-fume treatment). The design mixes were elaborated starting from the ACI 211.1 standard [28], and then changes were introduced to reach the design strengths. The final mix designs are detailed in Table 4.
Table 4.
Mix designs.
Seven cylinders were manufactured for each category (mix design, cylinder age, fiber content, and fiber treatment), giving a total of 210 cylinders.
At their corresponding ages, the cylinders were subjected to the compression test following the procedure dictated in the ASTM C39 standard [29]. Additionally, for the 56-day cured cylinders, the modulus of elasticity was determined in accordance with ASTM C469 [30]. An example of the specimens during the respective tests is shown in Figure 2.
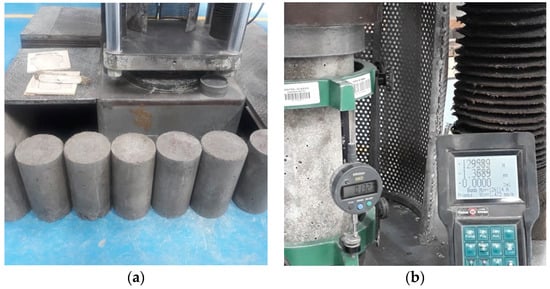
Figure 2.
(a) Specimen for compression test, and (b) modulof elasticity test.
2.3. Determination of Compressive Strength and Modulus of Elasticity
With the maximum strength results obtained from the compression tests of the cylinders, the maximum compressive stress or f’c (MPa) was obtained by dividing the maximum load resisted by the cylinder over its cross-sectional area.
Two out of seven fifty-five-day cylinders were selected for the modulus of elasticity test. The data used were provided by a compressometer, which recorded the applied loads and deformations as the test was performed. Each one of these values enabled the calculation of stress (MPa) by dividing the maximum load resisted by the cylinder over its cross-sectional area. The unit strain was computed by dividing the length variation taken from the compressometer over the average length of the cylinder. and were used to obtain the modulus of elasticity according to ASTM C469 standards [30].
2.4. Carbon-Footprint Determination
To determine the carbon footprint, we started by accounting for the organic components of the husk (i.e., fiber and pith) and dry fiber, as obtained from [31,32]. The carbon percentage of each one of them was determined according to the work of Vilela [10] and Encinas Soto [33]. With the above information, a weighted sum of the carbon contributions by component was made. Accordingly, we were finally able to establish the CO2 equivalent. The details are shown in Table 5.
Table 5.
Percentage of carbon in dry husk and fiber (discounting moisture).
Once the percentage of carbon was obtained, the mass of CO2 was determined by mass balance, which was similar to Vilela’s method [10], as indicated in Equation (1).
where is the molecular mass of CO2, equal to 44.01 g/mol, is the molecular mass of carbon, equal to 12.01 g/mol, and is the mass of carbon per unit of matter (fiber and husk, dimensionless).
Laboratory calculations (based on Table 3 data) yielded a dry bulk density of 237.04 kg/m3 of coconut fiber (including possible voids). Thus, having the proposed percentages in the volumes of 0.5% and 1% of coconut fiber enabled us to determine the dry mass of fiber of 1.18 and 2.37 kg per m3 of the concrete mix, respectively.
Considering the research of Puentes and Joya [31], who found that the dry weight of the coconut fiber represents about 30% of the husk as a whole, we estimated that producing the above-mentioned amounts of dry coconut fiber required the use of 3.95 and 7.90 kg of coconut husk. Thus, the CO2 emissions saved (directly or indirectly) can be found using Equation (2).
where is the dry mass of matter (kg) and is the mass of CO2 per unit of matter (fiber or husk, dimensionless).
3. Results and Discussion
3.1. Physical and Mechanical Characteristics of the Fiber
The fibers were divided into the following three typologies: NT (untreated fibers), CS (fibers treated with caustic soda or NaOH), and SF (fibers treated with silica fume). The results are illustrated in Figure 3. The NaOH or caustic soda treatment promoted a slight increase in the maximum elongation of the fibers compared with the NT and SF fibers. Likewise, a higher linear density was found in relation to the other typologies. However, a lower value of average breaking strength (and consequently, of toughness) was obtained for the CS fibers in relation to the NT and SF fibers. The high dispersion of the observed values was primarily due to the heterogeneity of coir fibers, which can present imperfections and defects in significant quantities [34].
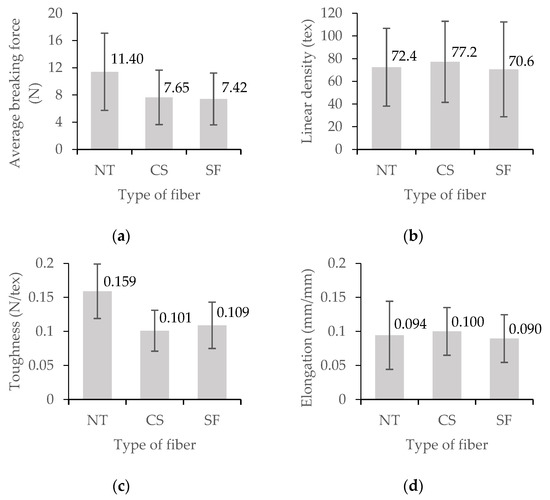
Figure 3.
(a) Average breaking strength, (b) linear density, (c) toughness, and (d) elongation.
In general, the mechanical properties of coconut fiber were lower than those of other natural and synthetic fibers, which could mean less load transfer from the composite to fiber, and thus lower composite strength [35]. Nonetheless, the decrease in CS and SF properties could be balanced with better fiber-matrix adhesion, meaning better composite properties [35].
3.2. Composite Concrete Density
We found that adding fibers at the proposed percentages had little effect on the density of the composite concrete, finding values between 2265 and 2298 kg/m3 in the case of the design strength of 20.59 MPa and between 2260 and 2274 kg/m3 in the case of the design strength of 23.54 MPa. This result agreed with that of Ismail [36], who found that the effect of fiber addition on the density had little significance in low fiber–cement ratios.
3.3. Compressive Strength
Table 6 shows the compressive strengths obtained for the different types of cylinders for design strengths of 20.59 MPa, i.e., NF (without fiber), CS (fibers with caustic soda treatment), and SF (fibers with silica-fume treatment), at fiber contents of 0.5% and 1% and ages of 14, 28, and 56 days.
Table 6.
Compressive strength results for base dosage of 20.59 MPa.
Figure 4 shows the effect of the fibers with their respective treatments on the compressive strength of the cylinders for the base dosage of 20.59 MPa. In this case, the cylinders with fibers generally presented higher compressive strengths than those without fibers. Particularly, better results were generally obtained with the cylinders that contained CS fiber in their composition.
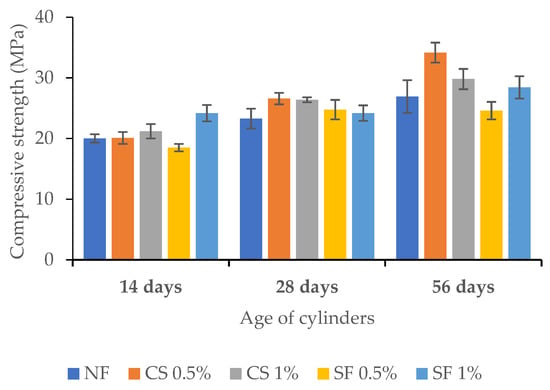
Figure 4.
Effect of fiber percentage on compressive strength (base dosage of 20.59 MPa).
Moreover, except for the case of SF 1% at 14 days, the strengths of the SF cylinders were lower than that of the CS cylinders. In the case of CS cylinders, the results can be compared with those of Yan et al. [37], who used a design strength at the age of 28 days of 20 MPa, fiber length of 50 mm, and an amount of fibers equal to 1% by mass of cement. As in the present research, better results are obtained in the composite concrete with NaOH-treated fibers than in the concrete without fibers.
Table 7 shows the compressive strengths obtained for the different types of cylinders for design strengths of 23.54 MPa as aforementioned, and for the ages of 14, 28, and 56 days.
Table 7.
Compressive strength results for base dosage of 23.54 MPa.
Figure 5 shows the effect of fibers with their respective treatments on the strength of the cylinders. In this case, CS and SF cylinders had lower compressive strengths than those without fibers. For high design strengths, coir fibers tended to produce a reduction in the compressive strength of the composite concrete, as demonstrated by Ogunbode et al. [38] SF cylinders, for the ages of 14 and 28 days, exceeded the CS cylinders’ compressive strength by 0.5% in volume fiber content and by 1% fiber content and 56 days’ age (0.5% and 1% volume fiber content).
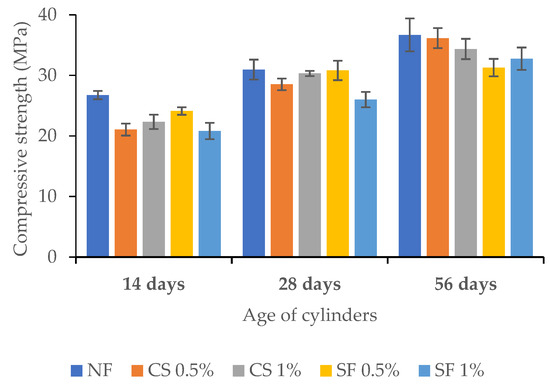
Figure 5.
Effect of fiber percentage on compressive strength (base dosage of 23.54 MPa).
3.4. Modulus of Elasticity
Figure 6 shows the results of the modulus of elasticity for the different types of cylinders prepared for the design strength of 20.59 MPa. Cylinders with fibers had a lower modulus of elasticity than those without fibers (related to a slight reduction in stiffness and inferior toughness), similar to what Ali [39] obtained for the same fiber content and length. Cylinders with 1% fiber also had higher modulus of elasticity values than those with 0.5%. Among the two types with fiber, CS cylinders had a higher modulus of elasticity than SF cylinders.
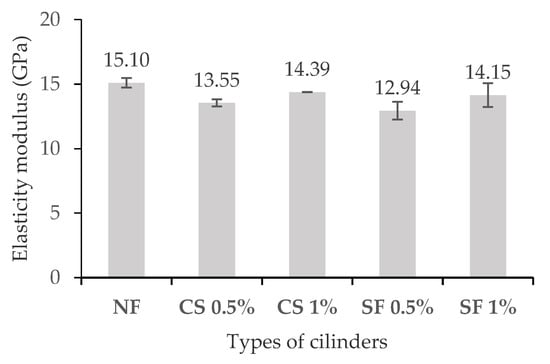
Figure 6.
Modulus of elasticity for design strength of 20.59 MPa.
Figure 7 shows the results of the modulus of elasticity for the different types of cylinders produced and for a design strength of 23.54 MPa. Once again, the values of modulus of elasticity were higher in the case of cylinders without fibers or NF, and among the cylinders with fibers, the highest values were provided by CS cylinders. In this case, the values were slightly higher with a volume fraction of fibers of 0.5%, in relation to the volume fraction of 1%.
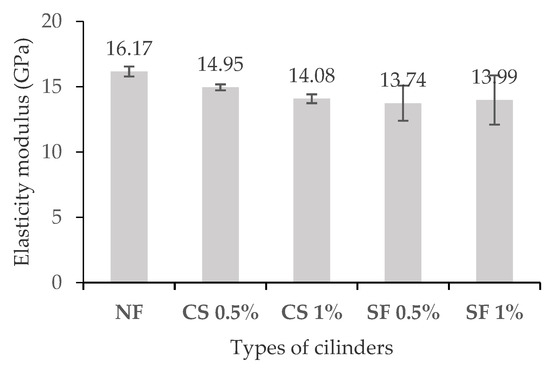
Figure 7.
Modulus of elasticity for design strength of 23.54 MPa.
3.5. CO2-Emission Savings
Figure 8 shows an estimate of the emissions saved by encapsulating the carbon contained in the fibers. In the case of direct CO2 emissions savings, this value amounts to 4.55 kg CO2 emissions for concrete with 1% fiber. However, if the emissions saved by the other husk components that were needed to obtain the fiber from the mix were considered, and after processing the fiber were also used for other purposes, it accounted for 14.49 kg CO2 emissions. Flower and Sanjayan [1] estimated that a typical 25 MPa concrete production releases 290 kg CO2 per m3. With 1% fiber replacement, it would enable a CO2 emission reduction of around 5%, which increases with decreased design strength, owing to less cement inclusion (the most polluting concrete component) [1].
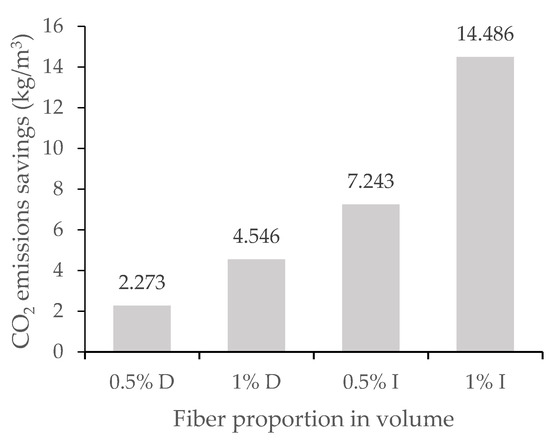
Figure 8.
Direct and indirect CO2 emissions saved per cubic meter of concrete.
4. Conclusions
Experiments with coconut-fiber composite concrete were performed by changing the fiber treatment, fiber volume proportion, mix design, and cylinder ages. The maximum values of the studied properties can be observed in a combination of NaOH-treated fibers, with lower design strength, and lower fiber volume proportion. Fiber-matrix adhesion played a key role in improving the performance of CS cylinders compared with SF cylinders. Fiber inclusion in concrete mixes was a feasible strategy to reduce greenhouse-gas emissions during concrete manufacturing, owing to the acceptable mechanical properties and complementarity to the corresponding strategies reviewed in the literature. Based on our results, the following conclusions were drawn:
- The best results were obtained for concrete cylinders made with a design strength of 20.59 MPa, including a 0.5% volume fraction of NaOH-treated fibers, which slightly exceeded that of fiber-free concrete. Mostly, increasing the fiber volume fraction and design compressive strength led to a major disadvantage in compressive strength and modulus of elasticity of composite concrete, compared with fiber-free concrete.
- Concrete density was not significantly affected by the volume fractions used in this research. More coconut fiber would be needed in the concrete mix to achieve lower densities.
- The mechanic properties of the fibers were similar among the CS and SF fibers. We observed a reduction in their features compared with the NT fibers, except for elongation and linear density, for which CS fibers achieved better performance.
- In all cases, the dosages of composite concrete with fibers exceeded the expected compressive strengths of 20.59 and 23.54 MPa, demonstrating the feasibility of adding 0.5% and 1% fibers and maintaining admissible mechanical properties.
- Emission savings of up to 4.54 kg CO2 were observed, considering only the contribution of the fibers and up to 14.49 kg CO2 per cubic meter of concrete, considering the non-incineration of all components of the original husk, with the addition of 1% of fibers.
Author Contributions
Conceptualization, R.R., E.V. and E.D.M.; methodology, E.V.; software, E.V.; validation, R.R., E.V. and N.B.Y.G.; formal analysis, N.B.Y.G.; investigation, R.R. and E.V.; resources, N.B.Y.G., R.R. and E.V.; data curation, N.B.Y.G.; writing—original draft preparation, R.R. and E.V.; writing—review and editing, R.R. and E.V.; visualization, E.V.; supervision, L.H.; project administration, L.H.; funding acquisition, N.B.Y.G., J.A.-S. and M.I.C. All authors have read and agreed to the published version of the manuscript.
Funding
This research received no external funding.
Institutional Review Board Statement
Not applicable.
Informed Consent Statement
Not applicable.
Data Availability Statement
Not applicable.
Acknowledgments
The authors acknowledge Hilda Trujillo of the Department of Chemical Engineering—Polytechnic Textile Center, National Polytechnic School (EPN) for her support in fiber testing.
Conflicts of Interest
The authors declare no conflict of interest.
References
- Flower, D.J.M.; Sanjayan, J.G. Green house gas emissions due to concrete manufacture. Int. J. Life Cycle Assess. 2007, 12, 282–288. [Google Scholar] [CrossRef]
- Miller, S.A.; Horvath, A.; Monteiro, P.J.M. Readily implementable techniques can cut annual CO2 emissions from the production of concrete by over 20%. Environ. Res. Lett. 2016, 11, 074029. [Google Scholar] [CrossRef]
- Koo, B.M.; Kim, J.H.J.; Kim, S.B.; Mun, S. Material and Structural Performance Evaluations of Hwangtoh Admixtures and Recycled PET Fiber-Added Eco-Friendly Concrete for CO2 Emission Reduction. Materials 2014, 7, 5959–5981. [Google Scholar] [CrossRef] [PubMed]
- Bostanci, S.C.; Limbachiya, M.; Kew, H. Use of recycled aggregates for low carbon and cost effective concrete construction. J. Clean. Prod. 2018, 189, 176–196. [Google Scholar] [CrossRef]
- Alnahhal, M.F.; Alengaram, U.J.; Jumaat, M.Z.; Abutaha, F.; Alqedra, M.A.; Nayaka, R.R. Assessment on engineering properties and CO2 emissions of recycled aggregate concrete incorporating waste products as supplements to Portland cement. J. Clean. Prod. 2018, 203, 822–835. [Google Scholar] [CrossRef]
- Mastali, M.; Abdollahnejad, Z.; Pacheco-Torgal, F. Carbon dioxide sequestration of fly ash alkaline-based mortars containing recycled aggregates and reinforced by hemp fibers: Mechanical properties and numerical simulation with a finite element method. Carbon Dioxide Sequestration Cem. Constr. Mater. 2018, 373–391. [Google Scholar]
- Sai, P.P.; Murali, K.; Purnachandra Sai, P.; Murali, K.; Sravan Kumar, G. Study on Properties of Natural Fibre Reinforced Concrete Made with Coconut Shells and Coir Fibre. Artic. Int. J. Civ. Eng. Technol. 2018, 9, 416–422. [Google Scholar]
- Zhou, C.; Shi, S.Q.; Chen, Z.; Cai, L.; Smith, L. Comparative environmental life cycle assessment of fiber reinforced cement panel between kenaf and glass fibers. J. Clean. Prod. 2018, 200, 196–204. [Google Scholar] [CrossRef]
- Sera, E.E.; Robles-Austriaco, L.; Pama, R.P. Natural Fibers as Reinforcement. J. Ferrocem. 1990, 20, 109–124. [Google Scholar]
- Vilela, J. Sensibilización Sobre La Importancia Del Manejo De Desechos De Estopa De Cocotero Frente Al Cambio Climático. Caso De Estudio Manglar De La Remacam, En Las Comunidades Pampanal De Bolívar Y Tambillo. Periodo 2015–2019. Master’s Thesis, FLACSO Ecuador, Quito, Ecuador, 2020. [Google Scholar]
- Obeng, G.Y.; Amoah, D.Y.; Opoku, R.; Sekyere, C.K.K.; Adjei, E.A.; Mensah, E. Coconut Wastes as Bioresource for Sustainable Energy: Quantifying Wastes, Calorific Values and Emissions in Ghana. Energies 2020, 13, 2178. [Google Scholar] [CrossRef]
- Campilho, R.D.S.G. Natural Fiber Composites; CRC Press: Boca Raton, FL, USA, 2016; Volume 4, ISBN 9781482239010. [Google Scholar]
- da Silva, E.J.; Marques, M.L.; Velasco, F.G.; Fornari Junior, C.; Luzardo, F.M.; Tashima, M.M. A new treatment for coconut fibers to improve the properties of cement-based composites—Combined effect of natural latex/pozzolanic materials. Sustain. Mater. Technol. 2017, 12, 44–51. [Google Scholar] [CrossRef]
- Ali, A.; Shaker, K.; Nawab, Y.; Jabbar, M.; Hussain, T.; Militky, J.; Baheti, V. Hydrophobic treatment of natural fibers and their composites—A review. J. Ind. Text. 2016, 47, 2153–2183. [Google Scholar] [CrossRef]
- Sudhakaran Pillai, M.; Sivaraja, M.; Kandasamy, S. Effect of silica fume surface treatment on natural fibres in resisting chloride resistance in concrete. Mater. Sci. Res. India 2010, 7, 209–214. [Google Scholar] [CrossRef]
- Ahmad, W.; Farooq, S.H.; Usman, M.; Khan, M.; Ahmad, A.; Aslam, F.; Yousef, R.A.; Abduljabbar, H.A.; Sufian, M.; Alyousef, R.; et al. Effect of Coconut Fiber Length and Content on Properties of High Strength Concrete. Materials 2020, 13, 1075. [Google Scholar] [CrossRef]
- ASTM C136; Standard Test Method for Sieve Analysis of Fine and Coarse Aggregates. American Society for Testing and Materials: West Conshohocken, PA, USA, 2012.
- ASTM C127; Standard Test Method for Relative Density (Specific Gravity) and Absorption of Coarse Aggregate. American Society for Testing and Materials: West Conshohocken, PA, USA, 2016.
- ASTM C128; Standard Test Method for Relative Density (Specific Gravity) and Absorption of Fine Aggregate. American Society for Testing and Materials: West Conshohocken, PA, USA, 2016.
- ASTM C138/C138M; Standard Test Method for Density (Unit Weight), Yield, and Air Content (Gravimetric) of Concrete. American Society for Testing and Materials: West Conshohocken, PA, USA, 2017.
- ASTM C566; Standard Test Method for Total Evaporable Moisture Content of Aggregate by Drying. American Society for Testing and Materials: West Conshohocken, PA, USA, 2019.
- ASTM C188; Standard Test Method for Density of Hydraulic Cement. American Society for Testing and Materials: West Conshohocken, PA, USA, 2017.
- ASTM C187; Standard Test Method for Amount of Water Required for Normal Consistency of Hydraulic Cement Paste. American Society for Testing and Materials: West Conshohocken, PA, USA, 2016.
- ACI 544.1R-96; (Reapproved 2009) State-of-the-art report on fiber reinforced concrete. American Concrete Institute: Farmington Hills, MI, USA, 1997.
- Karthikeyan, A.; Balamurugan, K.; Kalpana, A. The effect of sodium hydroxide treatment and fiber length on the tensile property of coir fiber-reinforced epoxy composites. Sci. Eng. Compos. Mater. 2014, 21, 315–321. [Google Scholar] [CrossRef]
- Vivek, S.S.; Prabalini, C. Experimental and microstructure study on coconut fibre reinforced self compacting concrete (CFRSCC). Asian J. Civ. Eng. 2020, 22, 111–123. [Google Scholar] [CrossRef]
- ASTM D2256; Standard Test Method for Tensile Properties of Yarns by the Single-Strand Method. American Society for Testing and Materials: West Conshohocken, PA, USA, 2021.
- ACI 211.1-91; Standard Practice for Selecting Proportions for Normal, Heavyweight, and Mass Concrete. American Concrete Institute: Farmington Hills, MI, USA, 1991; ISBN 9780870310171.
- ASTM C39/C39M; Standard Test Method for Compressive Strength of Cylindrical Concrete Specimens. American Society for Testing and Materials: West Conshohocken, PA, USA, 2021.
- ASTM C469; Standard Test Method for Static Modulus of Elasticity and Poisson’s Ratio of Concrete in Compression. American Society for Testing and Materials: West Conshohocken, PA, USA, 2014.
- Puentes, L.H.; Joya, E. Reconocimiento de Características, Obtención y Utilización de la Estopa de Coco; Artesanías De Colombia S.A.: Bogotá, Colombia, 2005; pp. 1–68. [Google Scholar]
- Puspaningrum, T.; Haris, Y.H.; Sailah, I.; Yani, M.; Indrasti, N.S. Physical and mechanical properties of binderless medium density fiberboard (MDF) from coconut fiber. IOP Conf. Ser. Earth Environ. Sci. 2020, 472, 1–9. [Google Scholar] [CrossRef]
- Encinas Soto, K.K. Determinación Del Mecanismo De Hidrólisis Ácida De Hemicelulosa De Cenchrus Ciliaris. Master’s Thesis, Universidad de Sonora, Hermosillo, Mexico, 2016. [Google Scholar]
- Monteiro, S.N.; Margem, F.M.; Guimarães Santafé Júnior, H.P.; de Souza Martins, L.B.; Oliveira, M.P. Correlation between the Diameter and the Density of Coir Fiber Using the Weibull Statistic Methodology. Mater. Sci. Forum 2014, 775–776, 266–271. [Google Scholar]
- Zhang, W.; Lilargem Rocha, D.; Urbano Durlo Tambara Júnior, L.; Teixeira Marvila, M.; Cristina Pereira, E.; Souza, D.; Rangel Garcez de Azevedo, A. A Review of the Use of Natural Fibers in Cement Composites: Concepts, Applications and Brazilian History. Polymers 2022, 14, 2043. [Google Scholar]
- MA Ismail, D. Compressive and Tensile Strength of Natural Fibre-reinforced Cement base Composites. Coll. Eng. Univ. Mosul 2007, 15, 42–51. [Google Scholar] [CrossRef]
- Yan, L.; Chouw, N.; Huang, L.; Kasal, B. Effect of alkali treatment on microstructure and mechanical properties of coir fibres, coir fibre reinforced-polymer composites and reinforced-cementitious composites. Constr. Build. Mater. 2016, 112, 168–182. [Google Scholar] [CrossRef]
- Ogunbode, E.B.; Egba, E.I.; Olaiju, O.A.; Elnafaty, A.S.; Kawywa, S.A. Microstructure and Mechanical Properties of Green Concrete Composites Containing Coir Fibre. Chem. Eng. Trans. 2017, 61, 1879–1884. [Google Scholar]
- Ali, M.; Liu, A.; Sou, H.; Chouw, N. Mechanical and dynamic properties of coconut fibre reinforced concrete. Constr. Build. Mater. 2012, 30, 814–825. [Google Scholar] [CrossRef]


Publisher’s Note: MDPI stays neutral with regard to jurisdictional claims in published maps and institutional affiliations. |
© 2022 by the authors. Licensee MDPI, Basel, Switzerland. This article is an open access article distributed under the terms and conditions of the Creative Commons Attribution (CC BY) license (https://creativecommons.org/licenses/by/4.0/).