Article

The Influence of Electrophoretic Deposition Parameters and Heat Treatment on the Microstructure and Tribological Properties of Nanocomposite Si3N4/PEEK 708 Coatings on Titanium Alloy

by
Aleksandra Fiołek
1,
Sławomir Zimowski
2,
Agnieszka Kopia
1 and
Tomasz Moskalewicz
1,*
1
Faculty of Metals Engineering and Industrial Computer Science, AGH University of Science and Technology, Czarnowiejska 66, 30-054 Kraków, Poland
2
Faculty of Mechanical Engineering and Robotics, AGH University of Science and Technology, Mickiewicza Av. 30, 30-059 Kraków, Poland
*
Author to whom correspondence should be addressed.
Coatings 2019, 9(9), 530; https://doi.org/10.3390/coatings9090530
Submission received: 20 July 2019 / Revised: 14 August 2019 / Accepted: 19 August 2019 / Published: 21 August 2019

Abstract

:
Nanocomposite Si3N4/PEEK 708 coatings were successfully fabricated on the Ti-6Al-4V alloy substrate by electrophoretic deposition (EPD) and post-EPD heat treatment. The addition of chitosan polyelectrolyte into ethanolic-based suspensions enabled the cathodic co-deposition of ceramic and polymeric particles. Zeta potential measurements allowed the elaboration of stable suspensions. The selection of the optimal EPD voltage and time enabled uniform coatings to be obtained. Heating above the PEEK melting point and cooling with a furnace or in water resulted in the formation of dense coatings with semi-crystalline or amorphous polymer structures, respectively. Both coatings with a thickness in the range of 90–105 µm had good adhesion and scratch resistance to the substrates, despite the presence of relatively high degrees of open porosity. The coatings improved the tribological properties of the titanium alloy. However, a strong relationship between the polymeric matrix structure and wear resistance was observed. Semi-crystalline coatings proved to be significantly more wear resistant than amorphous ones.

1. Introduction

Titanium and titanium alloys are widely used in aerospace, automotive and medical applications due to their many advantages, such as a high strength-to-weight ratio, good electrochemical corrosion resistance, low density, relatively low modulus of elasticity and biological inertness [1,2,3]. Among titanium alloys, the two-phase (α + β) Ti-6Al-4V alloy is used in more than half of the commercial applications. This alloy exhibits a good balance of strength and plastic properties and it is also the most investigated titanium alloy [2,4]. However, the tribological applications of this alloy are limited because of its high coefficient of friction (COF) and poor wear resistance [3,5]. Numerous technological processes were developed to improve the tribological properties of titanium alloys, such as heat treatment [6], thermochemical treatment [7,8] or coating deposition [9,10]. In this study, electrophoretic deposition (EPD) and heat treatment were used to produce nanocomposite Si3N4/polyetheretherketone (PEEK 708) coatings on the Ti-6Al-4V alloy substrates for tribological applications in mechanical engineering.
EPD is a fast-growing surface engineering method, which allows titanium alloys to be coated with different polymeric [11,12] or ceramic materials [13,14], including nanomaterials [15,16], as well as to co-deposit polymers with ceramics to fabricate composite coatings [17]. The process is based on the movement of charged particles in the electric field to an oppositely charged electrode and then deposition on it. Heat treatment is often applied to densify the coatings, thus the temperature and time of heating as well as cooling rate are also important [18,19].
Polyetheretherketone (PEEK) is an aromatic thermoplastic polymer with the basic formula of (–C6H4–O–C6H4–O–C6H4–CO–)n [12]. The structure of this polymer depends on the processing route and may be amorphous or semi-crystalline [20,21]. The polymer exhibits outstanding properties, such as thermal stability, chemical inertness, easy processing, high mechanical strength and elastic modulus [22,23,24,25]. PEEK also has good tribological properties, especially high wear and abrasion resistance. Therefore, it can be used as a coating to improve the tribological properties of metals [26,27]. PEEK may also be used as a matrix in composites for different purposes, such as to reduce COF in combination with polytetrafluoroethylene (PTFE) [28] or increase bioactivity in combination with hydroxyapatite [29]. As far as the authors are aware, in the available literature there is little information about the tribological properties of Si3N4-filled PEEK composites. For example, Balaji et al. [30] have investigated that the 10 wt % of Si3N4 content in the PEEK matrix increases microhardness by 20%. Qihua et al. [31] stated that COF decreases with increased Si3N4 content in the composite and the lowest value is obtained for the 15 vol % of Si3N4 content. In the case of wear rate, it decreases only to the Si3N4 content of 7.5 vol % and starts to increase with the Si3N4 concentration. However, there is no knowledge on the tribological properties of Si3N4/PEEK 708 coated metallic materials, including titanium alloys. In our previous work [32], the EPD of Si3N4/PEEK 704 coatings was developed and a mechanism of electrophoretic co-deposition of Si3N4 and PEEK 704 on the near-β Ti-13Nb-13Zr alloy substrate was indicated. In the present paper, we have focused on determination of the influence of EPD and post heat treatment on coating microstructure, surface topography and tribological properties of the Ti-6Al-4V alloy.
Silicon nitride (Si3N4) is an important ceramic material, also considered as a promising engineering material, due to its unique properties, such as thermal shock resistance, chemical stability, corrosion resistance, high thermal conductivity and low coefficient of thermal expansion (CTE) [33,34,35]. Si3N4 also exhibits good mechanical and tribological properties, like high hardness, high mechanical strength, high wear and abrasion resistance, as well as excellent creep resistance [36,37,38]. Thus, it is widely used in nanocomposite materials as a reinforcement of the polymer matrix, such as polypropylene [39], polyethylene [40], epoxy [41] or polyetheretherketone [30]. However, due to their high surface energy, Si3N4 nanoparticles have a strong tendency to agglomerate, which may lead to a poor connection with the polymer matrix. Thus, nanoparticle modification with surfactants [42], small molecular coupling agents [43] or macromolecular coupling agents [44] may be necessary to obtain a uniform dispersion of nanoparticles in the polymer matrix [32,45,46].
The aims of this work were (i) to study the electrophoretic deposition of homogeneous nanocomposite Si3N4/PEEK 708 coatings on Ti-6Al-4V alloy substrates, (ii) determination of the influence of post-deposition heat treatment on coating microstructure and surface topography, as well as (iii) the investigation of coating impact on the tribological properties of the Ti-6Al-4V alloy.

2. Materials and Methods

The PEEK 708 polymer and Si3N4 nanoparticles were used as coating components. PEEK 708 was delivered by Victrex Europa GmbH (Hofheim am Taunus, Germany). According to the manufacturer, the density of PEEK 708 is 1.32 g/cm3, particle size up to 10 μm, and melting and glass transition temperatures of 374 °C and 157 °C, respectively. Si3N4 nanoparticles with a particle size in the range of 15–30 nm and density 3.4 g/cm3 were delivered by Nanostructured & Amorphous Materials, Inc. (Houston, Texas, USA).
The coatings were deposited onto two-phase (α + β) Ti-6Al-4V titanium alloy substrates. The alloy was delivered by BÖHLER Edelstahl GmbH (Koln, Germany) in a hot-rolled and annealed (750 °C/2 h) condition, in the form of a bar with a diameter of 22 mm. The chemical composition of the alloy (according to the manufacturer’s data) is presented in Table 1. In order to prepare the samples for coating deposition, the bar was cut into discs of 3 mm thickness. The discs were ground with successively finer grits of sandpaper, from 200 to 3000 grit, and polished with the standard colloidal silica suspension (OP-S, 0.04 μm) of Struers. Directly before deposition, the samples were washed with distilled water and technical ethanol.
In order to deposit the coatings, three different suspensions containing a constant content of 1.5 g of PEEK 708 and 0.02 g of Si3N4 were prepared. The 50 mL of the dispersing phase contained ethanol (with 99.8% purity) and a chitosan solution with the content of 15, 25 or 50 vol %. Chitosan delivered by Sigma-Aldrich (Poznań, Poland) with medium molecular weight and a deacetylation degree of about 75%–85% was used as a cationic dispersant in the suspensions. The chitosan solution consisted of 0.5 g/L chitosan powder, 1 vol % acetic acid and distilled water. After preparation, each suspension was magnetically stirred for 5 min and then ultrasonically dispersed for 10 min to eliminate the agglomerates. The zeta potential of the particles in the suspension as a function of pH was measured using a Zetasizer Nano ZS 90 of Malvern Instruments Ltd., (Malvern, UK). Each measurement was carried out three times in order to average the results. The pH of the suspensions was lowered with citric acid or increased with sodium hydroxide, and the value was measured using an ELMETRON CPC-505 pH-meter (Zabrze, Poland).
Electrophoretic deposition was carried out using an EX752M PSU Multi-mode power supply (Huntingdon, UK), in a standard two electrode system. The titanium alloy substrate was a cathode, while the AISI316L austenitic stainless steel was used as an anode. Constant voltage in the range of 10–110 V, with 10 V changes, a constant deposition time of 90 s and constant distance between the electrodes of 15 mm were used. During the deposition process, changes in current density with deposition time were recorded using a Tektronix DMM 4040 multimeter (Beaverton, Oregon, USA). The influence of voltage and time on deposit weight was investigated. Based on these measurements, deposition yield and deposition rate were determined. In the first case, the coatings were deposited at voltages in the range of 10–110 V, with 20 V changes, and a constant time of 90 s, while in the second case a constant voltage of 90 V and a constant time in the range of 10–110 s, with 20 s changes, were applied. In both cases, the coatings after deposition and drying were weighed with an analytical weight from Ohaus Europe GmbH (Greifensee, Switzerland) with an accuracy of 0.1 mg, and each deposition was carried out three times in order to average the results. The as-coated samples were heat treated at the temperature of 390 °C for 40 min. The heating rate of 4.5 °C/min and two cooling rates were applied, (i) cooling with a furnace (2 °C/min) and (ii) cooling in water at room temperature (RT). Heat treatment was carried out in a Carbolite-Gero LHT 4/30 laboratory oven, (Derbyshire, UK).
Microstructural investigations were carried out using a scanning electron microscope (SEM), FEI Nova NanoSEM 450 (Eindhoven, the Netherlands), and a transmission electron microscope (TEM), JEOL JEM-2010 ARP (Tokyo, Japan). Thin foils from Si3N4 nanoparticles for TEM investigations were prepared by dispersing the particles in ethanol and placing a drop of the suspension on a 300 mesh copper grid covered with carbon and drying. Thin foils from suspensions used for EPD were prepared by placing a droplet of the stable suspension on the copper grid coated by carbon film and dried. Thin foils from the alloy (cross-section of the bar) were prepared by dimpling followed by ion-beam thinning with the Precision Ion Polishing System (PIPS) of Gatan (Pleasanton, California, USA). The lamellae from the coatings for TEM studies were prepared by a focused ion beam (FIB) using an FEI QUANTA 3D 200i device (Eindhoven, The Netherlands). Chemical composition of the coatings was investigated by energy dispersive X-ray spectroscopy (SEM-EDS, TEM-EDS). Phase identification was performed with the use of selected area electron diffraction (SAED) and X-ray diffraction (XRD) in Bragg–Brentano geometry using a Panalytical Empyrean DY1061 diffractometer (Almelo, The Netherlands) applying Cu-Kα radiation on plan-view specimens. Surface topography of coatings was investigated by an atomic force microscope (AFM), Dimension® Icon ™ SPM (Santa Barbara, California, USA).
Coating thickness was measured by a profilometric method using a Micro-Combi Tester (MCT) (CSM Instruments, Peseux, Switzerland). The measuring length set at 15 mm started in the uncoated area of the substrate and finished on the coating surface. The microhardness and elastic modulus were determined by an instrumented indentation method with the use of a Vickers diamond indenter. The measurements were performed with a load of 100 mN and a loading and unloading rate of 200 mN/min, as well as with 15 s of dwell time at the maximum load. At least 10 measurements were taken every time in the new area several hundred micrometers away. The scratch tests were carried out on the MCT using a Rockwell C diamond stylus with a radius of 200 μm. The load increased linearly in the range of 0.01–30 N on a scratch length of 5 mm and the sample linear velocity was 5 mm/min. In the scratch tests, the critical load indicating the characteristic failure of the coating was determined. The tribological properties of the uncoated and coated alloy were investigated at RT in dry sliding contact using a ball-on-disc tribometer (ITeE, Radom, Poland). The Al2O3 ball with a diameter of 6 mm was used as a counter element. The following test parameters were set: normal load of 5 N, sliding speed of 0.05 m/s and sliding distance of 2000 m. Before each test, the surfaces of the coating and the ball were washed with ethanol and left to dry. COF was determined from the following equation:
COF = F t F n
where Ft is the friction force (N) and Fn is the applied normal load (N). The wear resistance of the coatings was described by the specific wear rate calculated from the equation:
W v = V F n · s
where V is the volume of removed material of the coating (mm3), Fn—normal load (N), and s—sliding distance (m).

3. Results and Discussion

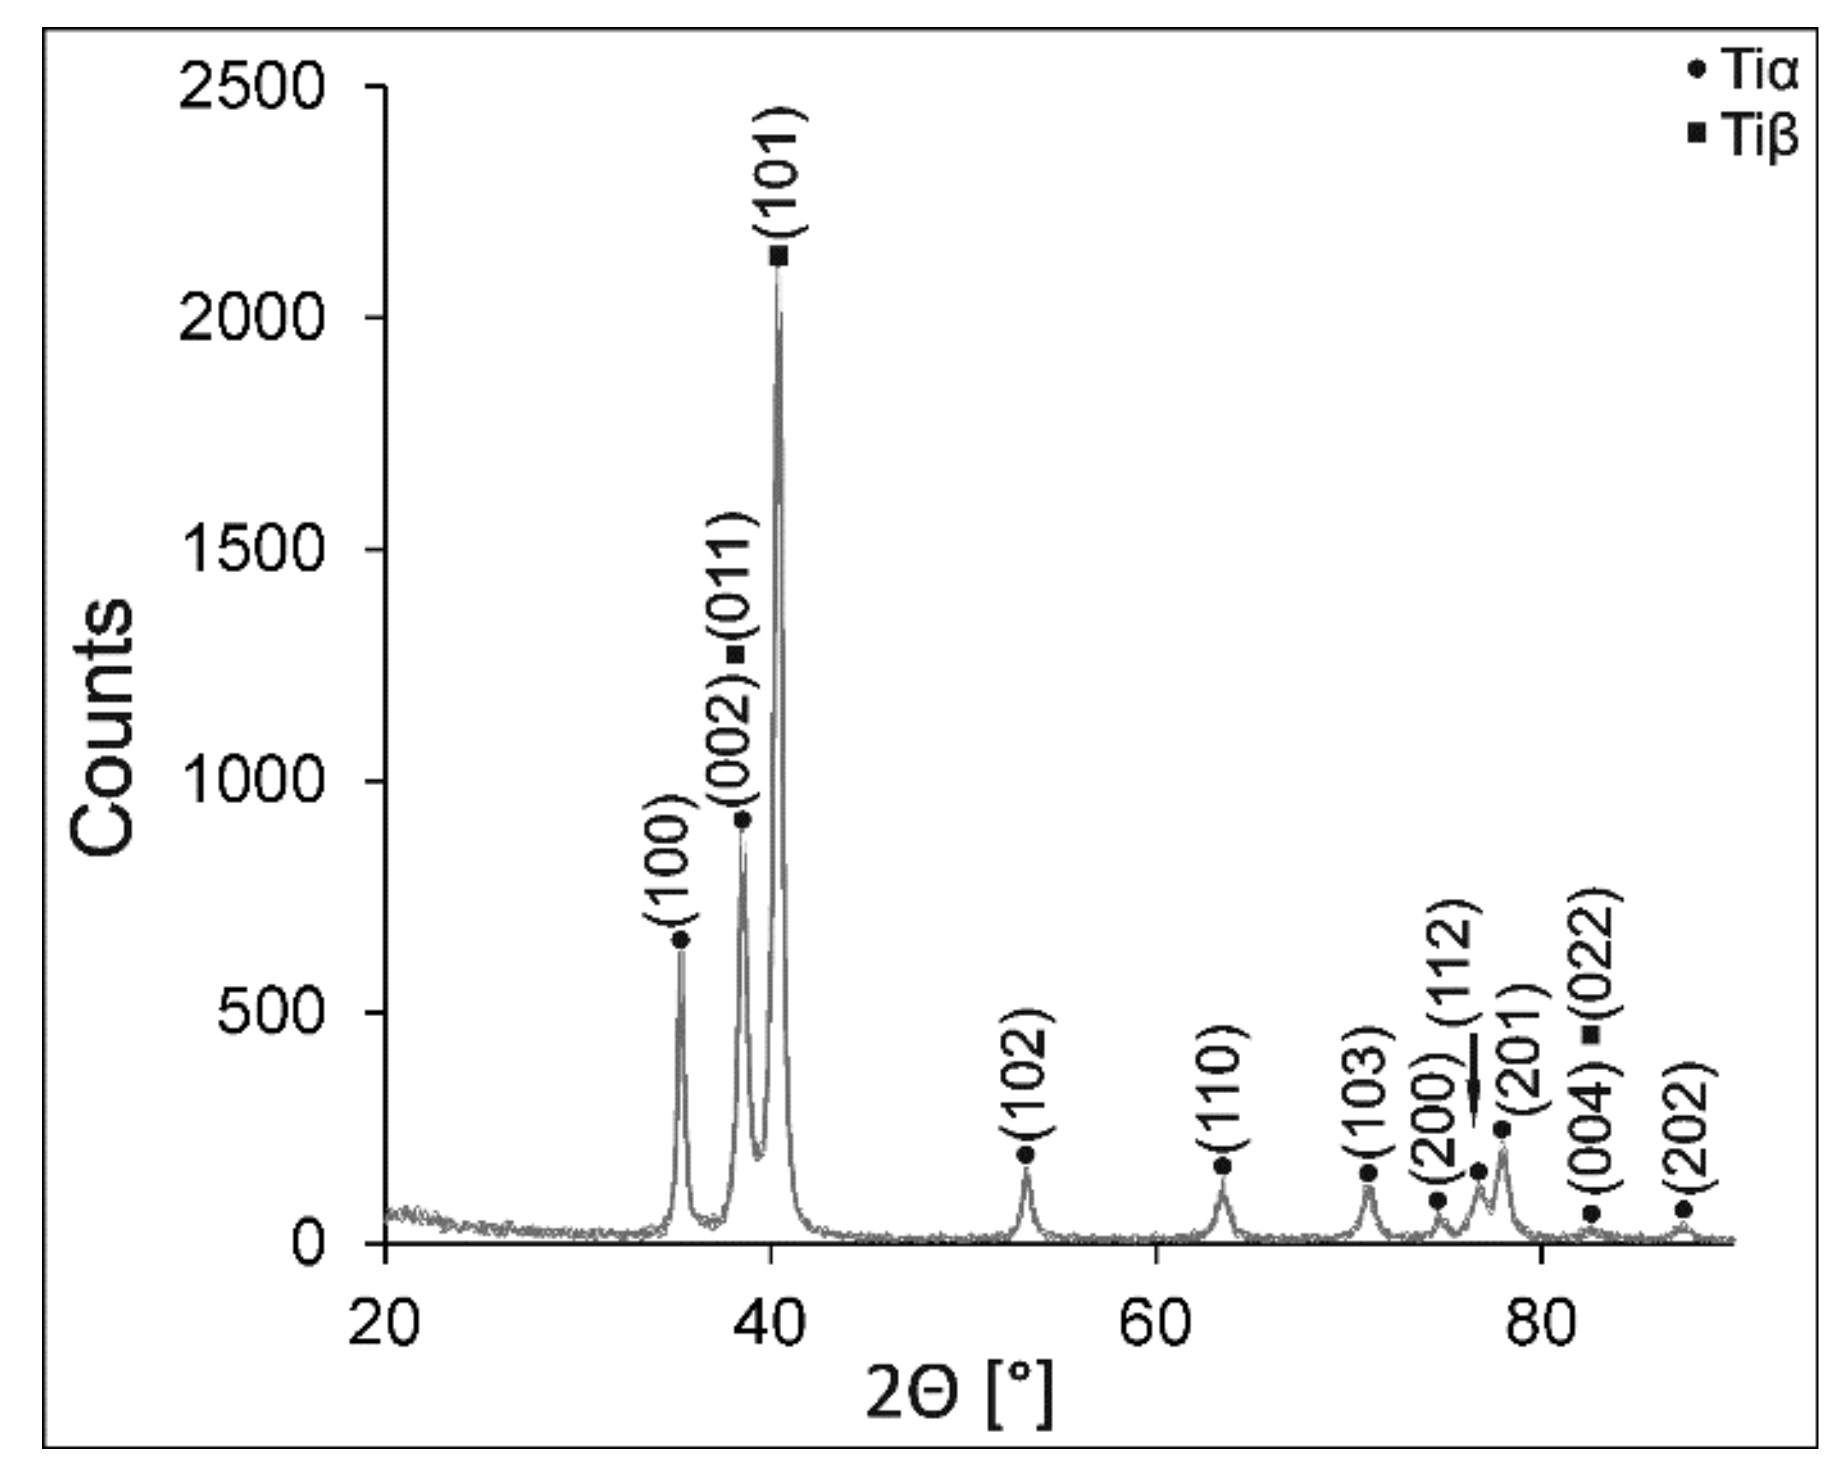
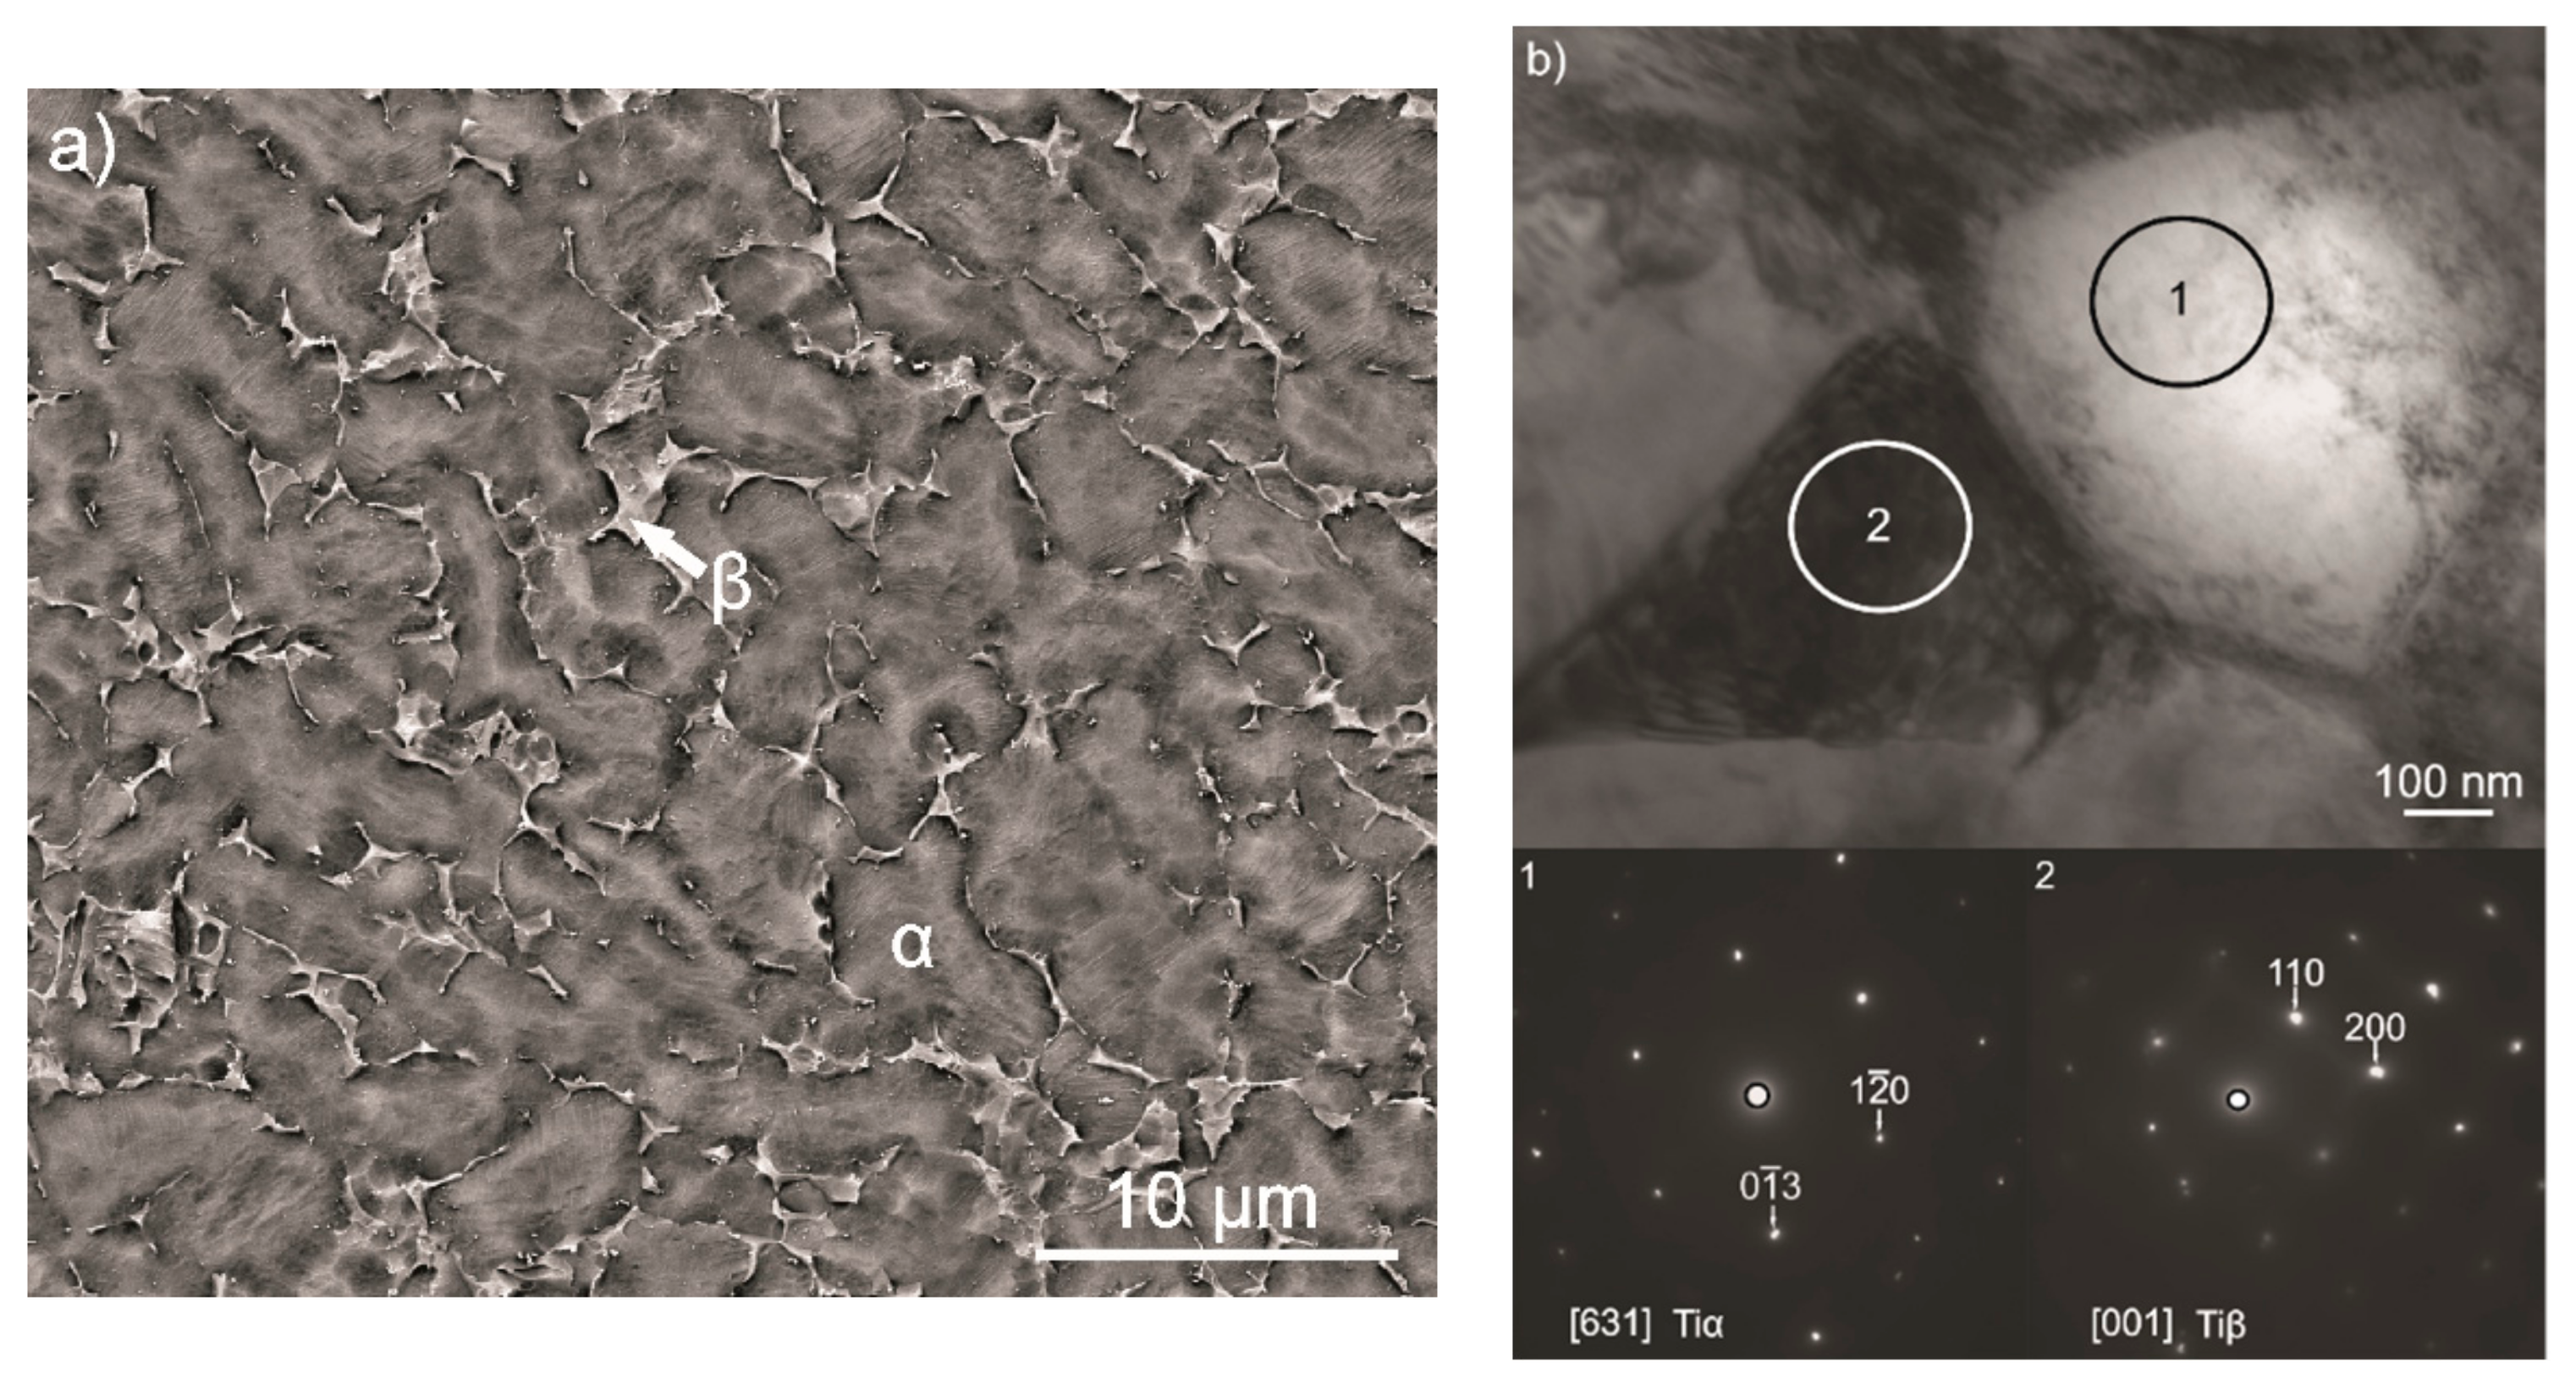
3.1. Microstructure of the Ti-6Al-4V Alloy

XRD investigation revealed that mainly the Ti α (hexagonal close-packed, hcp) and some Ti β (body-centered cubic, bcc) phases were present in the alloy microstructure. The diffraction peaks from the α phase are clearly visible in the pattern (Figure 1). Following the imposition of the 2 theta angles, the peaks from the β phase are not directly visible but the presence of the β phase has been confirmed during SEM and TEM investigation. An SEM image of the alloy microstructure is shown in Figure 2a. It was found that the microstructure was composed of α phase and β phase grains with the size (equivalent circle diameter, ECD) up to 2.5 μm and 1 μm, respectively. A TEM micrograph of the alloy microstructure is shown in Figure 2b. SAED pattern analysis taken from individual grains confirmed the presence of Ti α (hcp) and Ti β (bcc) phases.

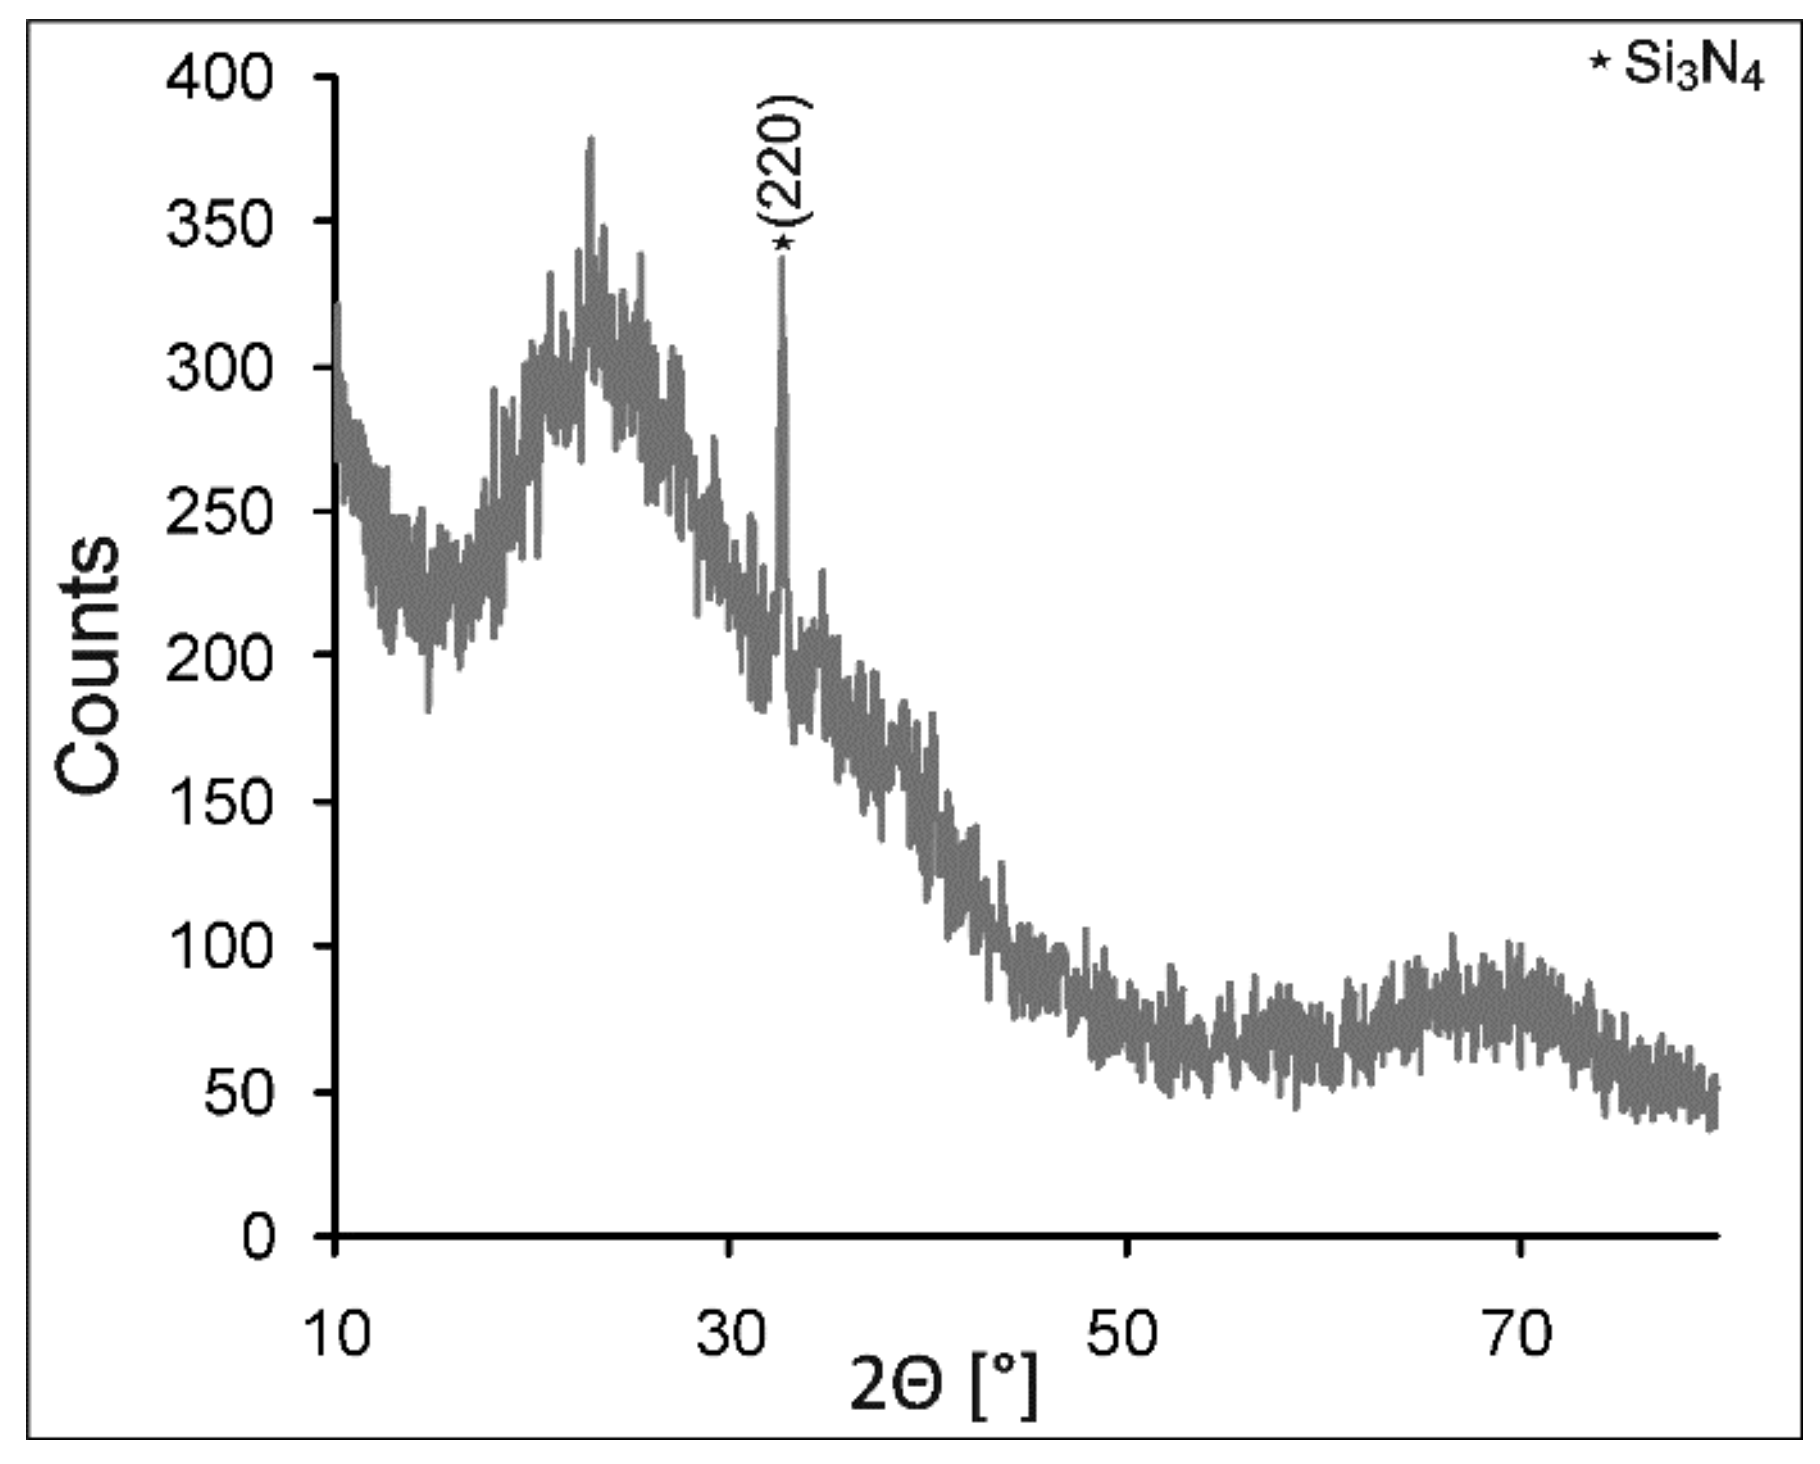
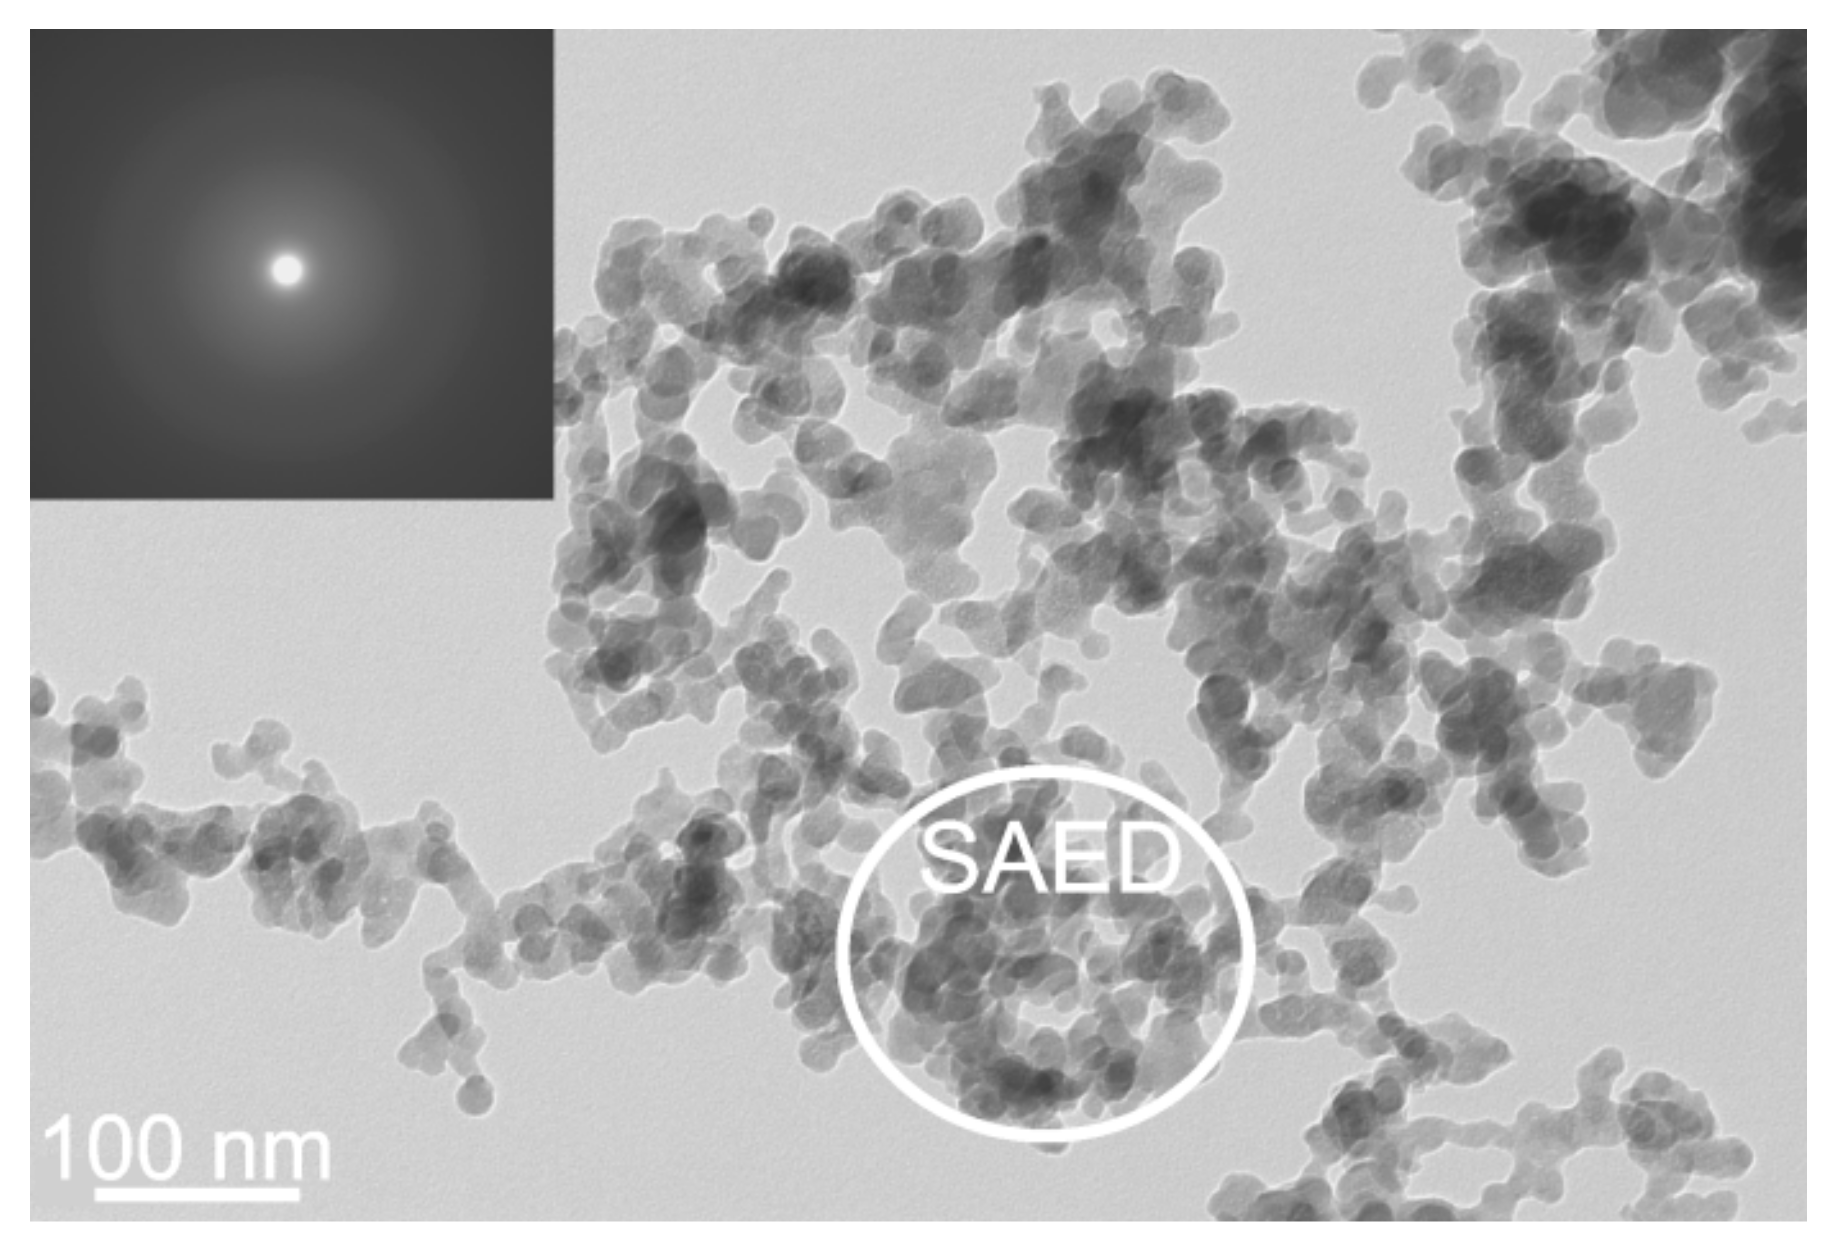
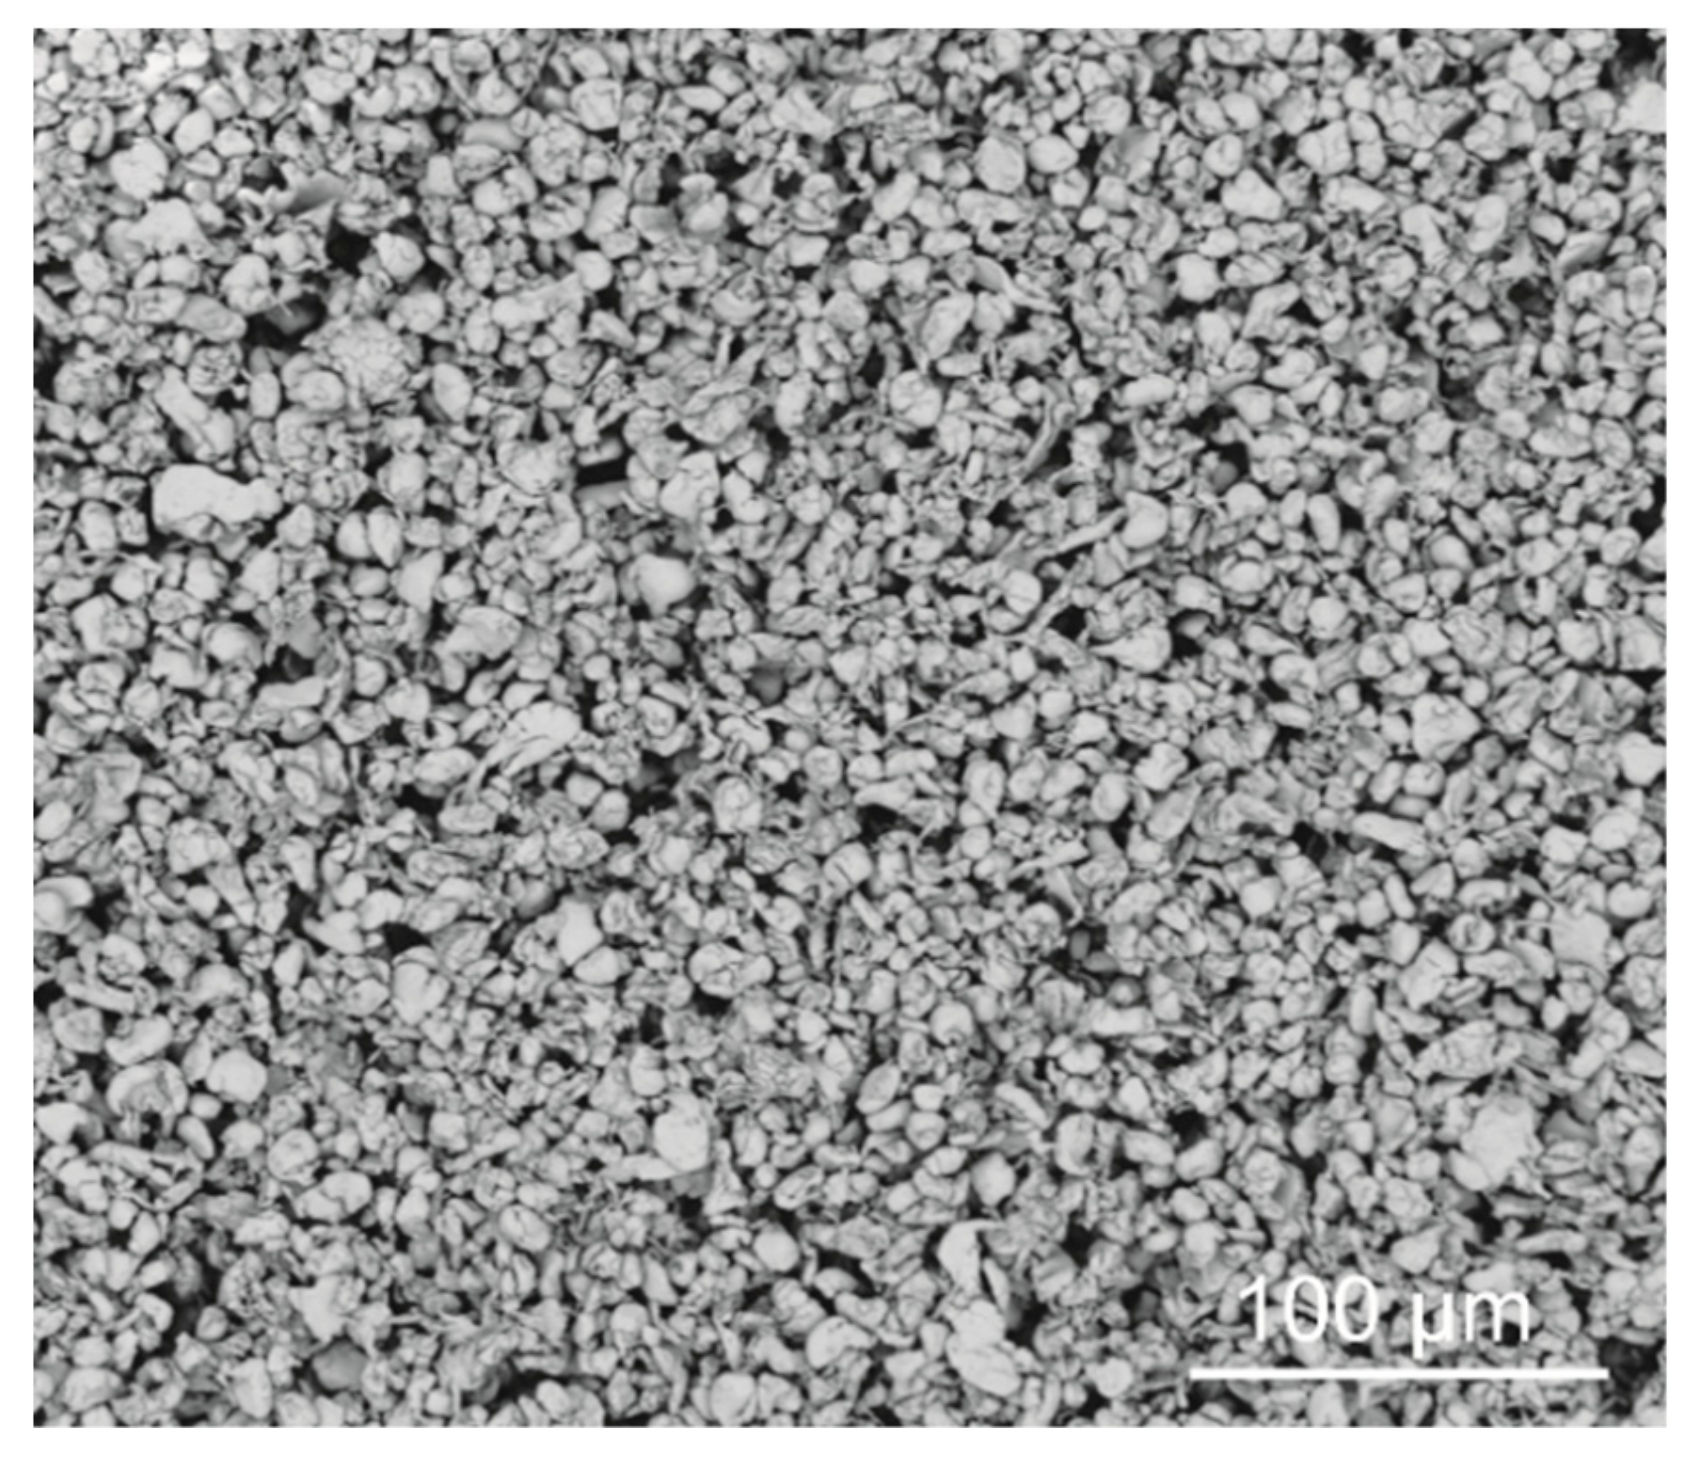
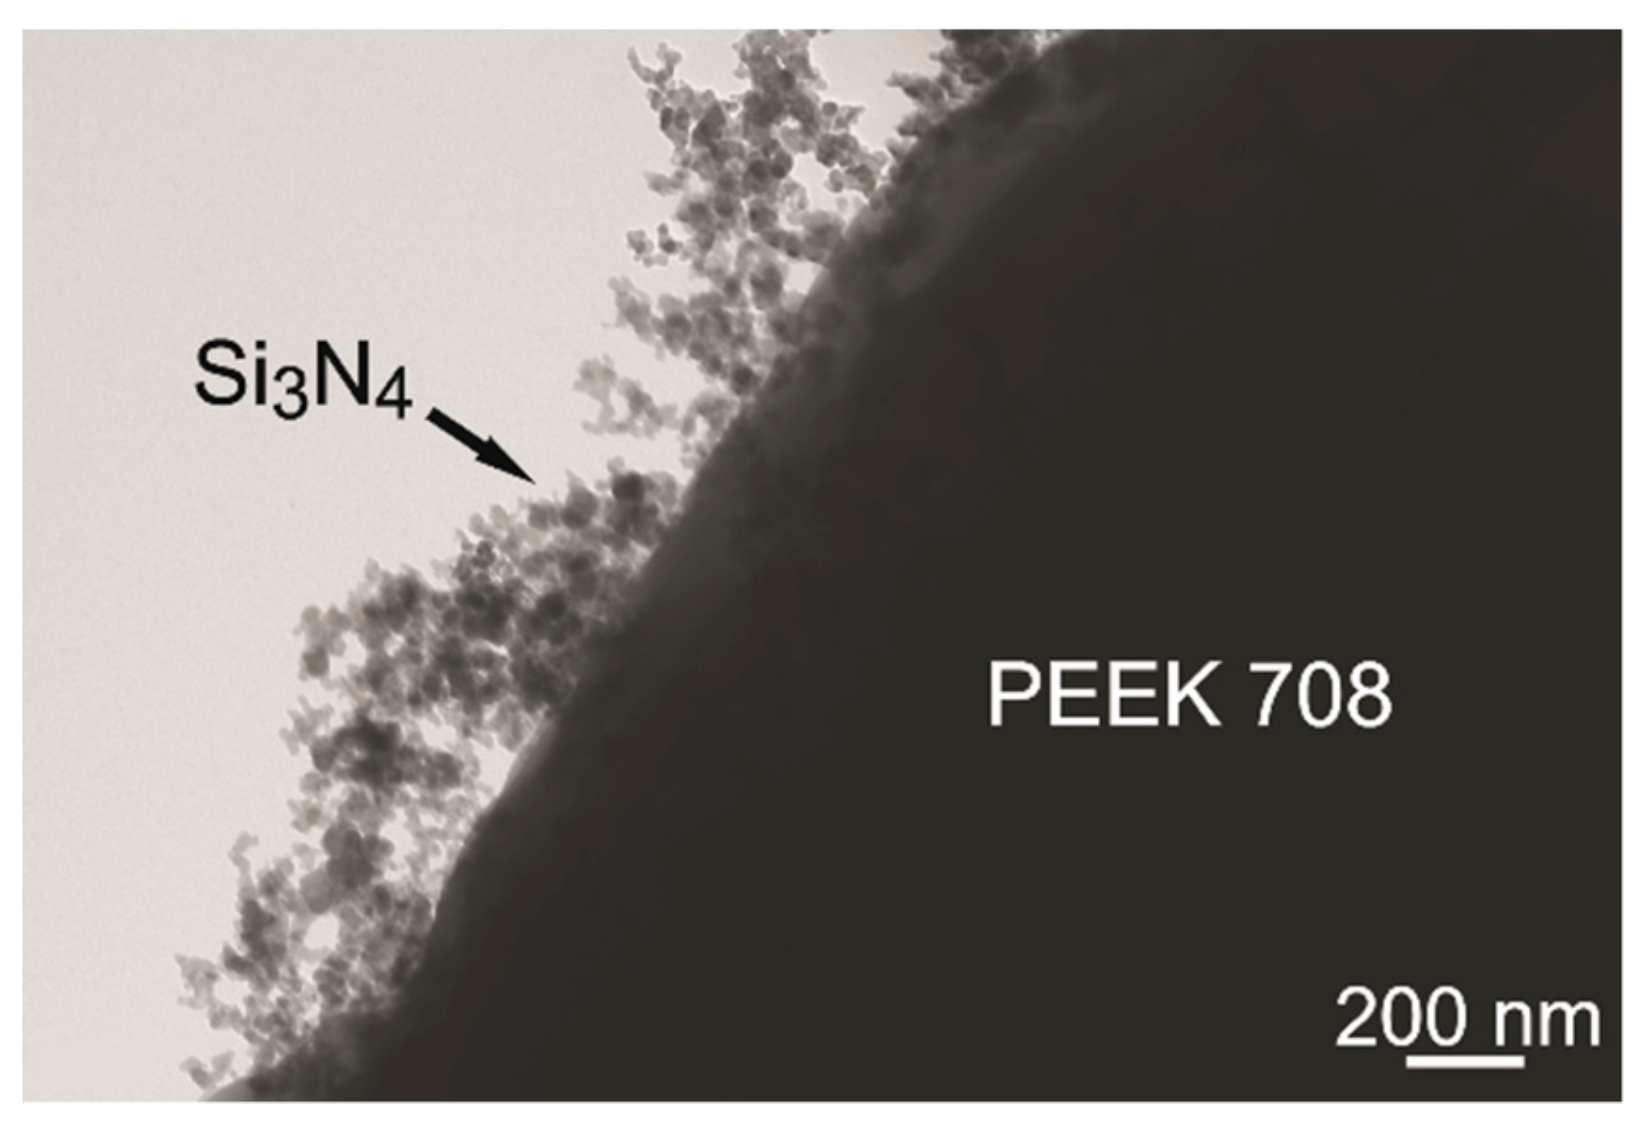
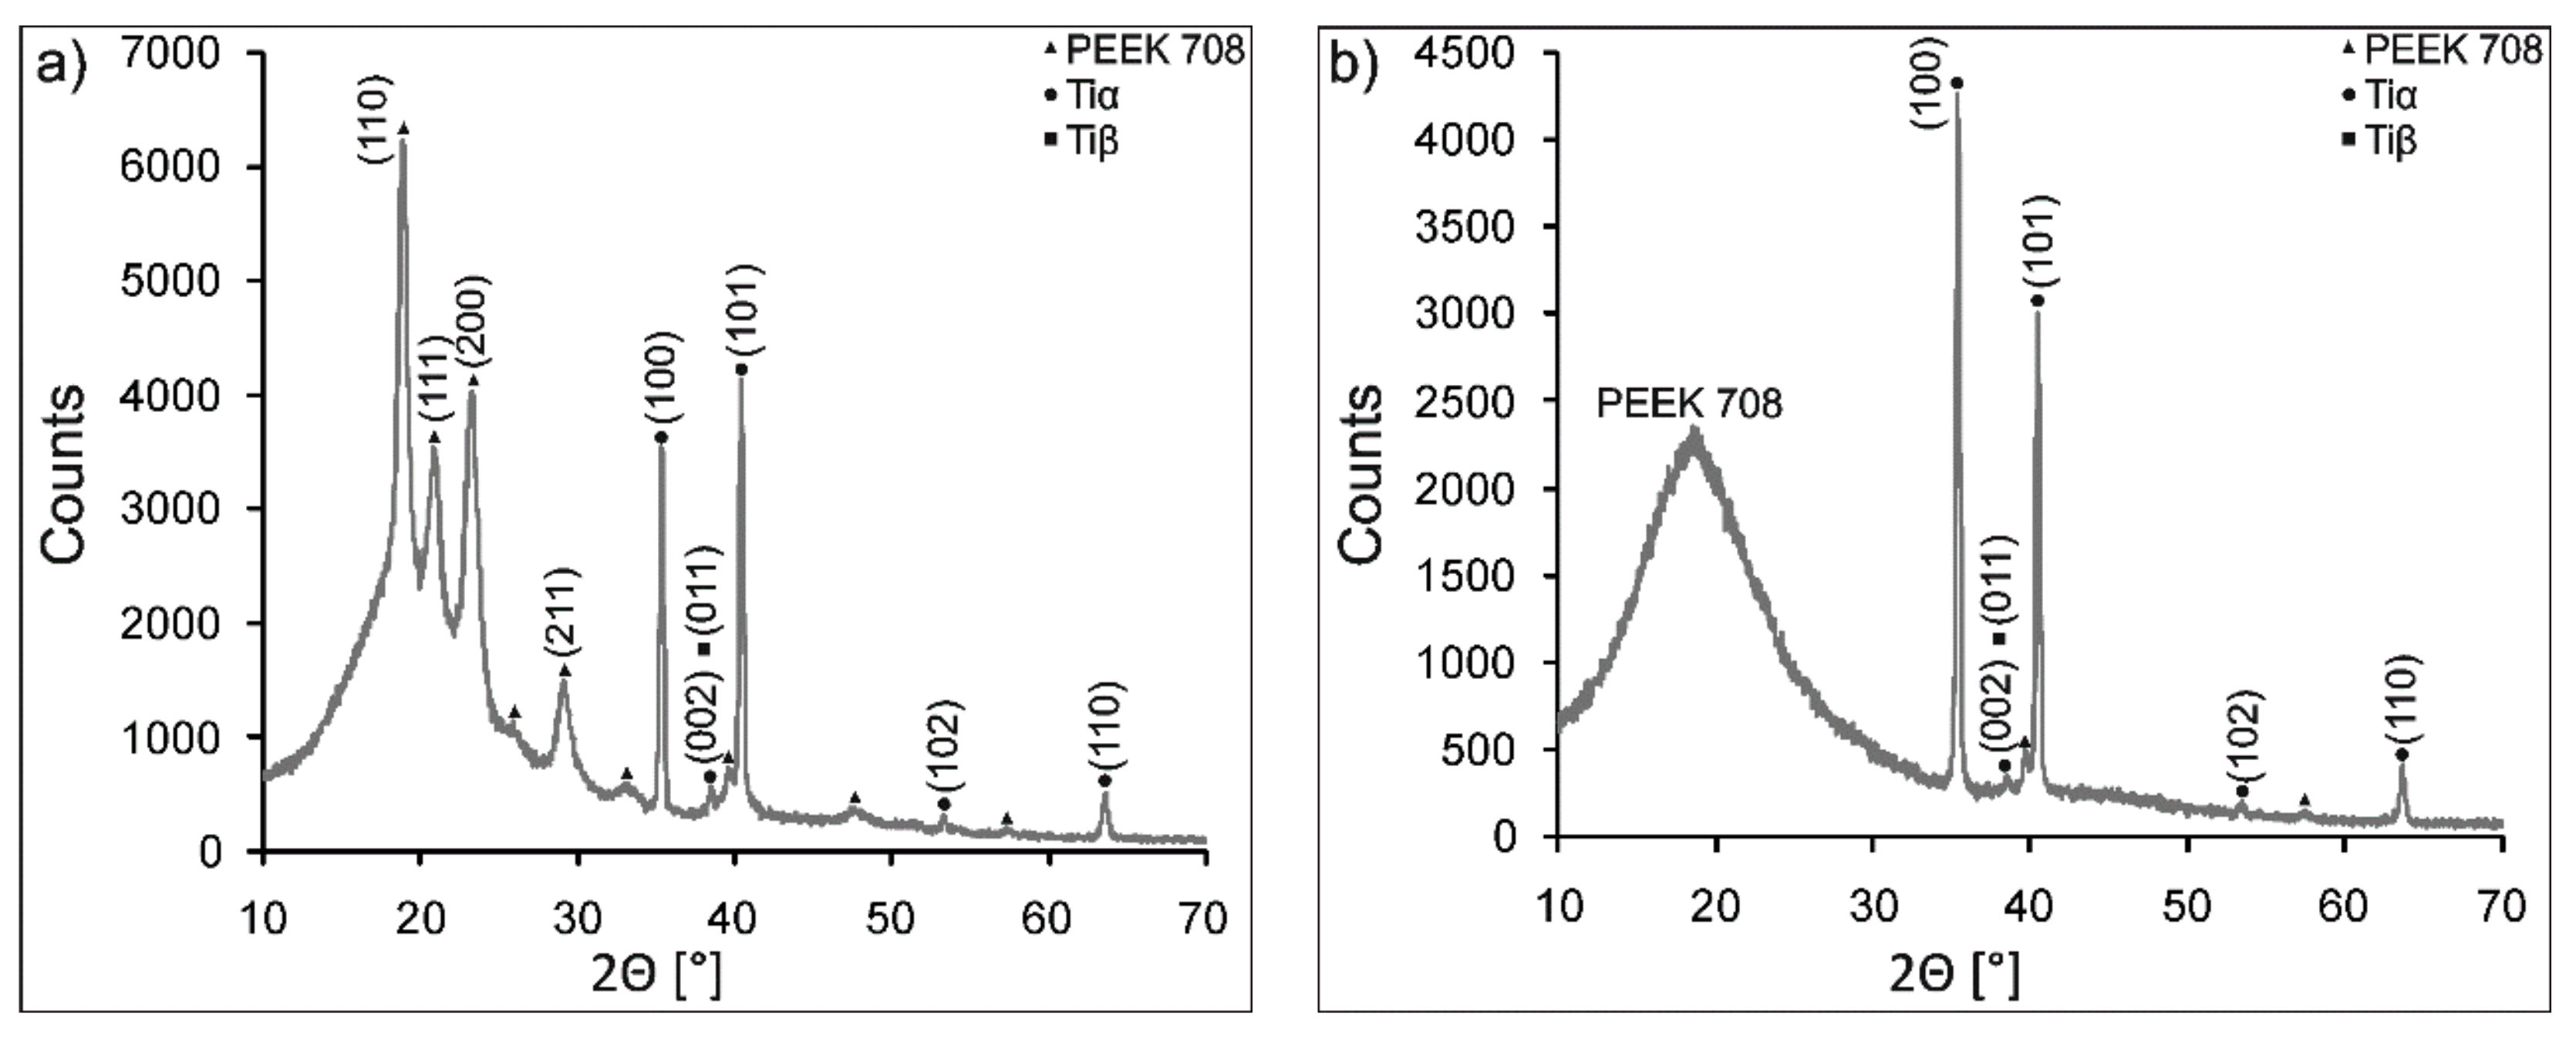
3.2. Characterization of Coating Components

Before the deposition process, the as-received powders used for coating deposition were examined. XRD investigation of the Si3N4 powder revealed its amorphous structure (Figure 3). Two amorphous diffraction peaks with the maximum at the 2 theta angles 22.9° and 69.3° were present in the pattern. However, the presence of a single crystalline peak at the 2 theta angle of 32.7° was also found. TEM investigations of Si3N4 nanoparticles revealed their spherical and irregular shape with sizes in the range of 5–30 nm (Figure 4). SAED pattern analysis confirmed the amorphous structure of the powder.
The PEEK 708 particles have been thoroughly examined in our previous work [47]. They exhibited an almost completely amorphous structure, as evidenced in the XRD pattern by one wide diffraction peak, and there were also three very weak diffraction peaks from the crystalline phase. SEM observations of the PEEK 708 powder have shown that most of the particles exhibited a globular shape but there were also a small number of particles with an irregular shape (Figure 5). The particle size determined as ECD from SEM images was in the range of 2–15 μm.

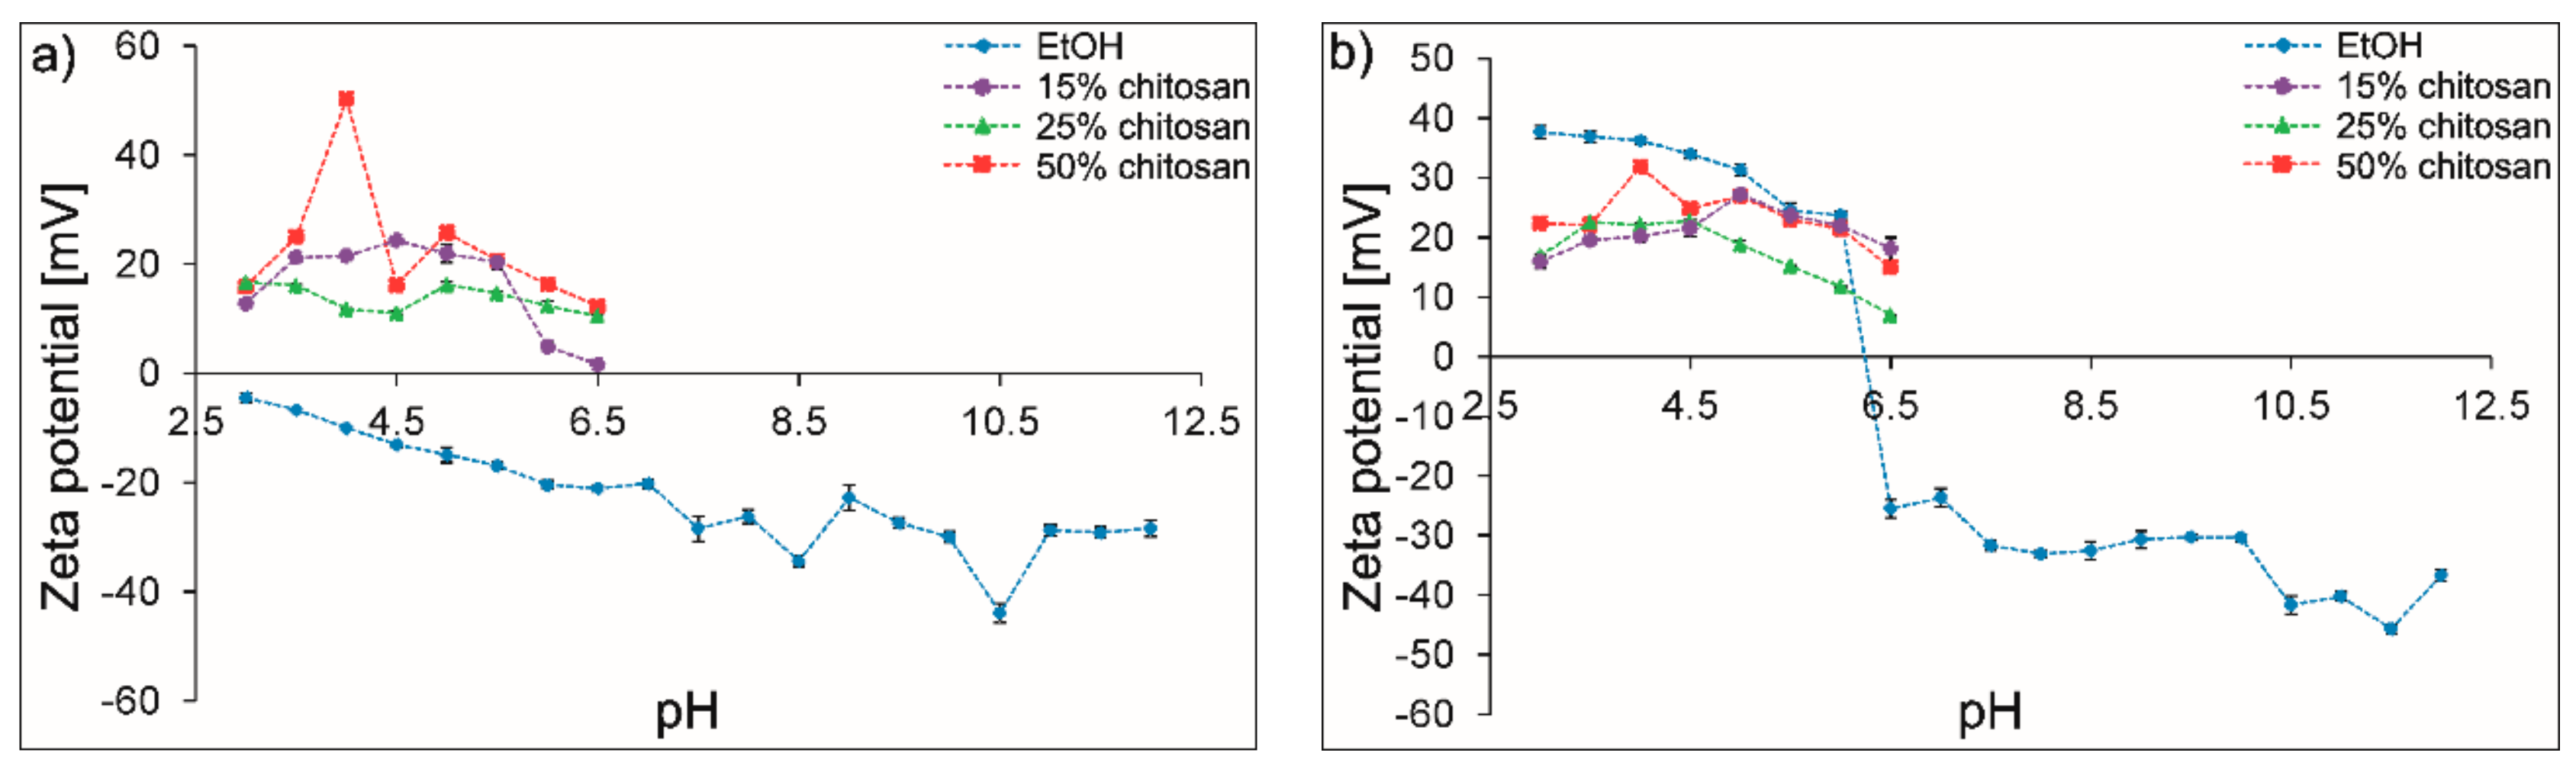
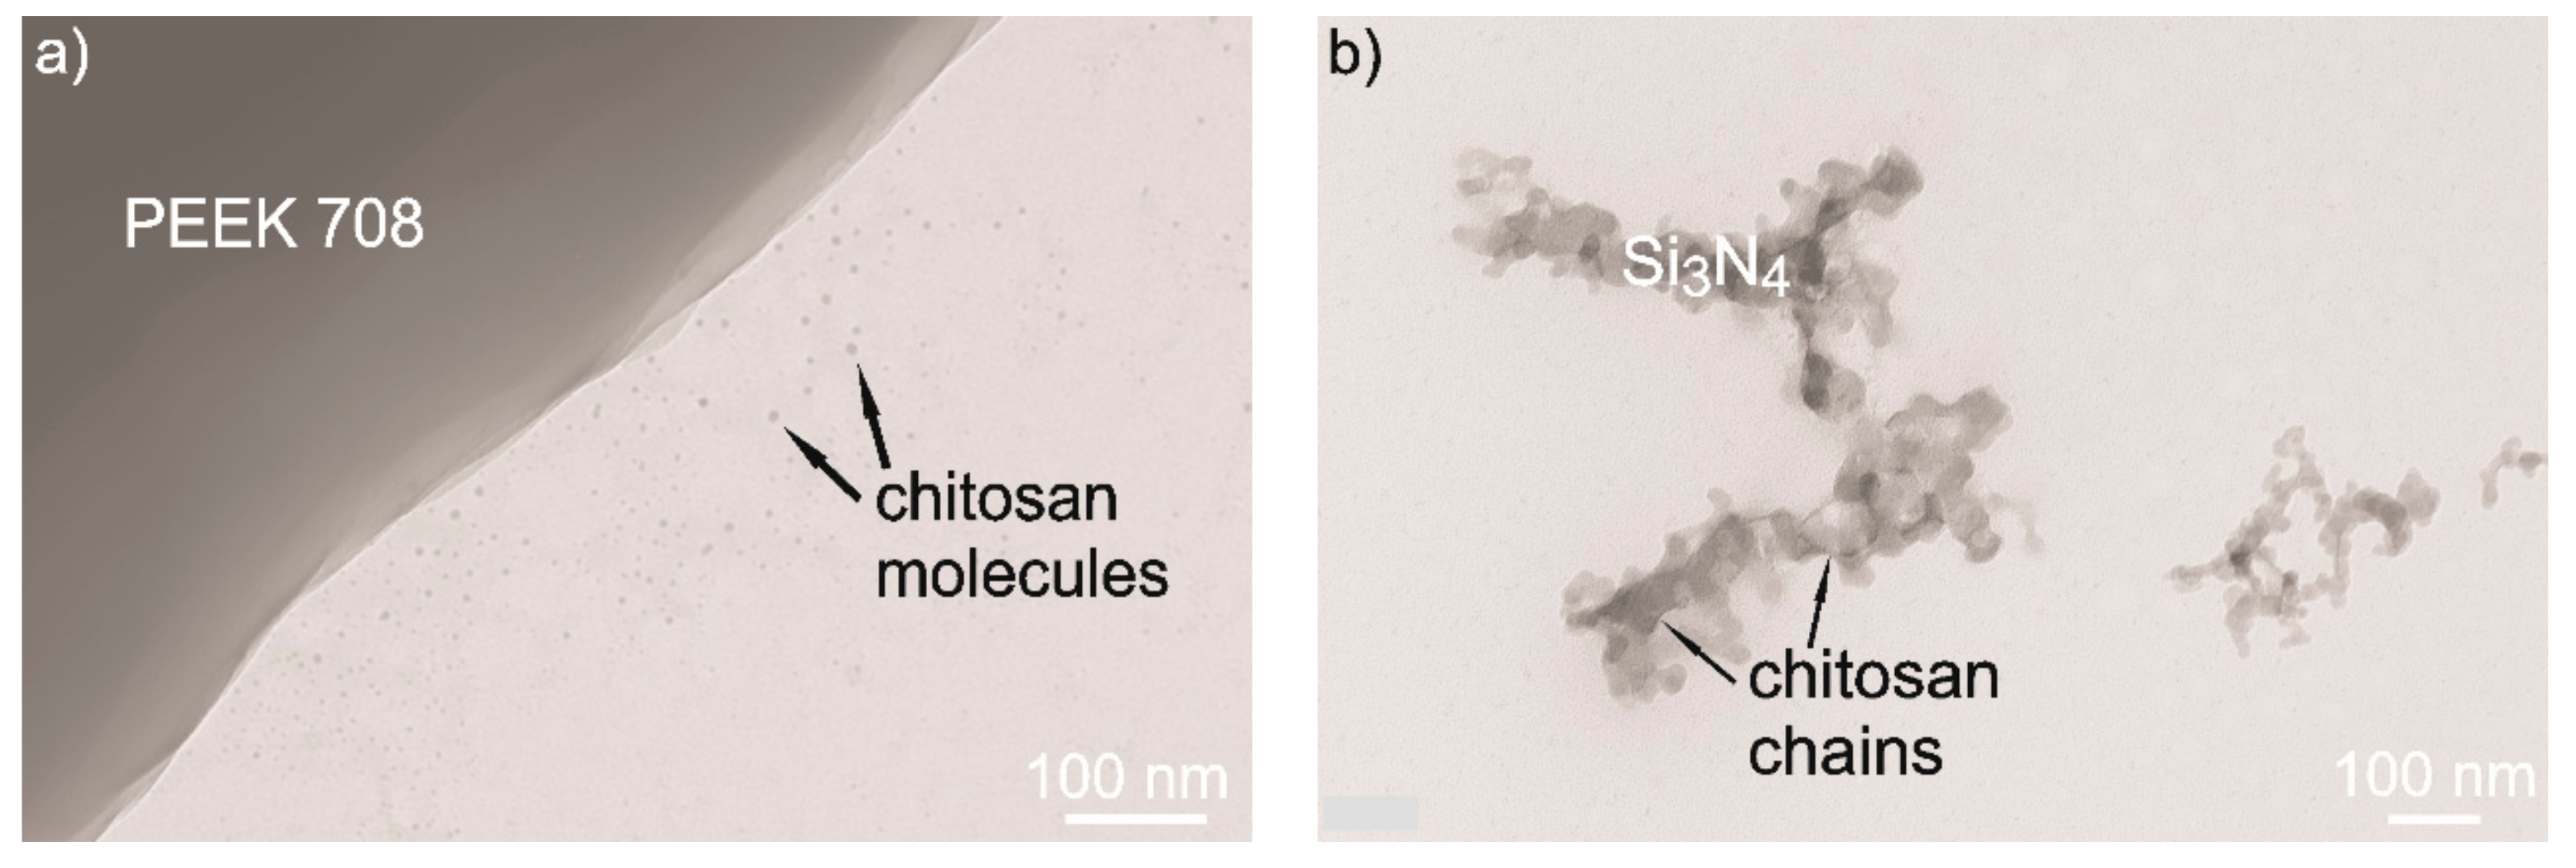
3.3. Elaboration of Suspensions for EPD

In the first suspension prepared for deposition, pure ethanol was used as a dispersion medium. However, it was impossible to obtain a coating from that suspension. It was necessary to add polyelectrolyte, which would change the potential of particles and increase the stability of the suspension, as well as reduce their tendency to agglomerate. There are two types of polymeric stabilization, (i) steric and (ii) electrostatic stabilization. These two methods can also occur simultaneously as electrosteric stabilization [48]. Based on our previous studies [32,49], a cationic chitosan polyelectrolyte was used. To determine the stability of suspensions, a zeta potential of Si3N4 and PEEK 708 particles were examined in pure ethanol and in ethanol-based dispersion media containing the addition of 15, 25 and 50 vol % of chitosan polyelectrolyte. In the case of the pure ethanol suspension, the pH range of 3–12 was used. The results indicated that the zeta potential of PEEK micro-particles was negative over the entire pH range (Figure 6a). In the case of Si3N4 nanoparticles, an isoelectric point was found between pH 6 and 6.5 (Figure 6b). The zeta potential of the particles was positive below this point and negative above it. Despite the relatively high values of zeta potential, deposition was not observed, probably due to the huge difference in particle size and the rapid sedimentation of PEEK particles in the suspension. In the case of suspensions with the addition of chitosan polyelectrolyte, the zeta potential measurements were carried out in a pH range of 3.0–6.5 due to the fact that chitosan is only soluble up to pH = 6 and begins to precipitate above this value [50]. The addition of chitosan polyelectrolyte caused a change in the charge of PEEK particles from negative into positive, and the highest values were recorded for the suspension containing 50 vol % of chitosan polyelectrolyte (Figure 6a). The highest zeta potential values were found for suspensions with pH = 4. These values equaled 50.25 ± 1.02 mV and 18.42 ± 0.19 mV for suspensions with 50 vol % and 25 vol % of chitosan polyelectrolyte, respectively. A suspension containing 15 vol % of chitosan polyelectrolyte reached its maximum zeta potential at pH = 4.5 and it was 24.32 ± 0.44 mV. It should be mentioned that, due to the large size and relatively high content of PEEK in real suspensions, as well as the methods used for measurements based on laser beam scattering, the zeta potential investigations were carried out for highly diluted suspensions (0.05 g of PEEK in 50 mL of an adequate dispersion medium). Thus, the values may differ for real undiluted suspensions. During the zeta potential measurements, the laser beam incident on the sample is scattered across the particles. A high concentration of particles and their agglomerates can be an issue during measurements because they can cause multiple beam scattering, which significantly complicates the interpretation of results. Si3N4 nanoparticles also exhibited a positive zeta potential over the entire measured pH range (Figure 6b). The highest values in this case were different and depended on the content of chitosan polyelectrolyte in the suspension and equaled 31.90 ± 0.58 mV at pH = 4, 22.78 ± 1.09 mV at pH = 4.5 and 27.20 ± 0. 29 mV at pH = 5, for the suspension containing 50, 25 and 15 vol % of chitosan polyelectrolyte, respectively. Three suspensions were selected for TEM investigations of the interaction between particles (i) 0.02 g of Si3N4 and 1.5 g of PEEK 708 in 50 mL of ethanol, (ii) 1.5 g of PEEK 708 in 50 mL of the suspension containing 75 vol % of ethanol and 25 vol % of chitosan polyelectrolyte and (iii) 0.02 g of Si3N4 in 50 mL of the suspension containing 75 vol % of ethanol and 25 vol % of chitosan polyelectrolyte. The results indicated electrostatic interactions between the ceramic nanoparticles and the polymeric microparticles in a pure ethanol suspension. Agglomerates of Si3N4 nanoparticles with sizes up to 1.2 μm adsorbed on the surface of PEEK particles are clearly visible in Figure 7. In the suspension containing chitosan polyelectrolyte, the chitosan molecules and chains were adsorbed on PEEK and Si3N4 particles and provided steric stabilization at both types of particles (Figure 8). Thus, zeta potential measurements and TEM observations clearly indicate that the addition of chitosan changes the surface potential of the particles and increases the stability of the suspension, which enables the co-deposition of the polymer and ceramic particles on the cathode during EPD. The interaction of chitosan with PEEK particles and the suspension stabilization mechanism was described previously by Luo and Zhitomirsky [51]. According to them, electrochemical decomposition of water occurs at the cathode and results in a local pH increase. Charge neutralization of chitosan amino groups and accumulation of PEEK particles with adsorbed protonated chitosan causes cathodic deposition.

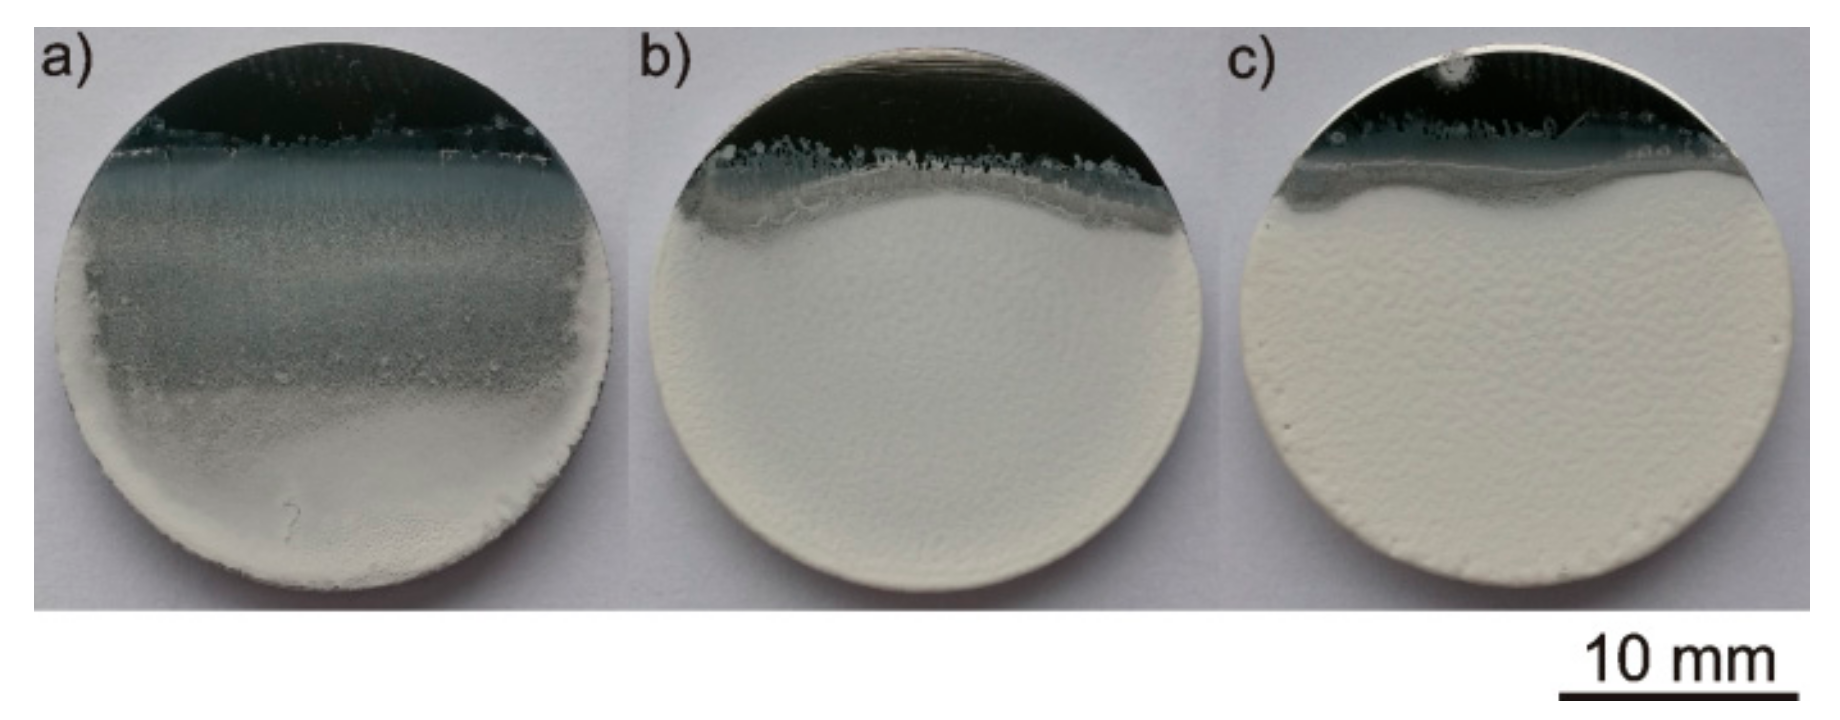
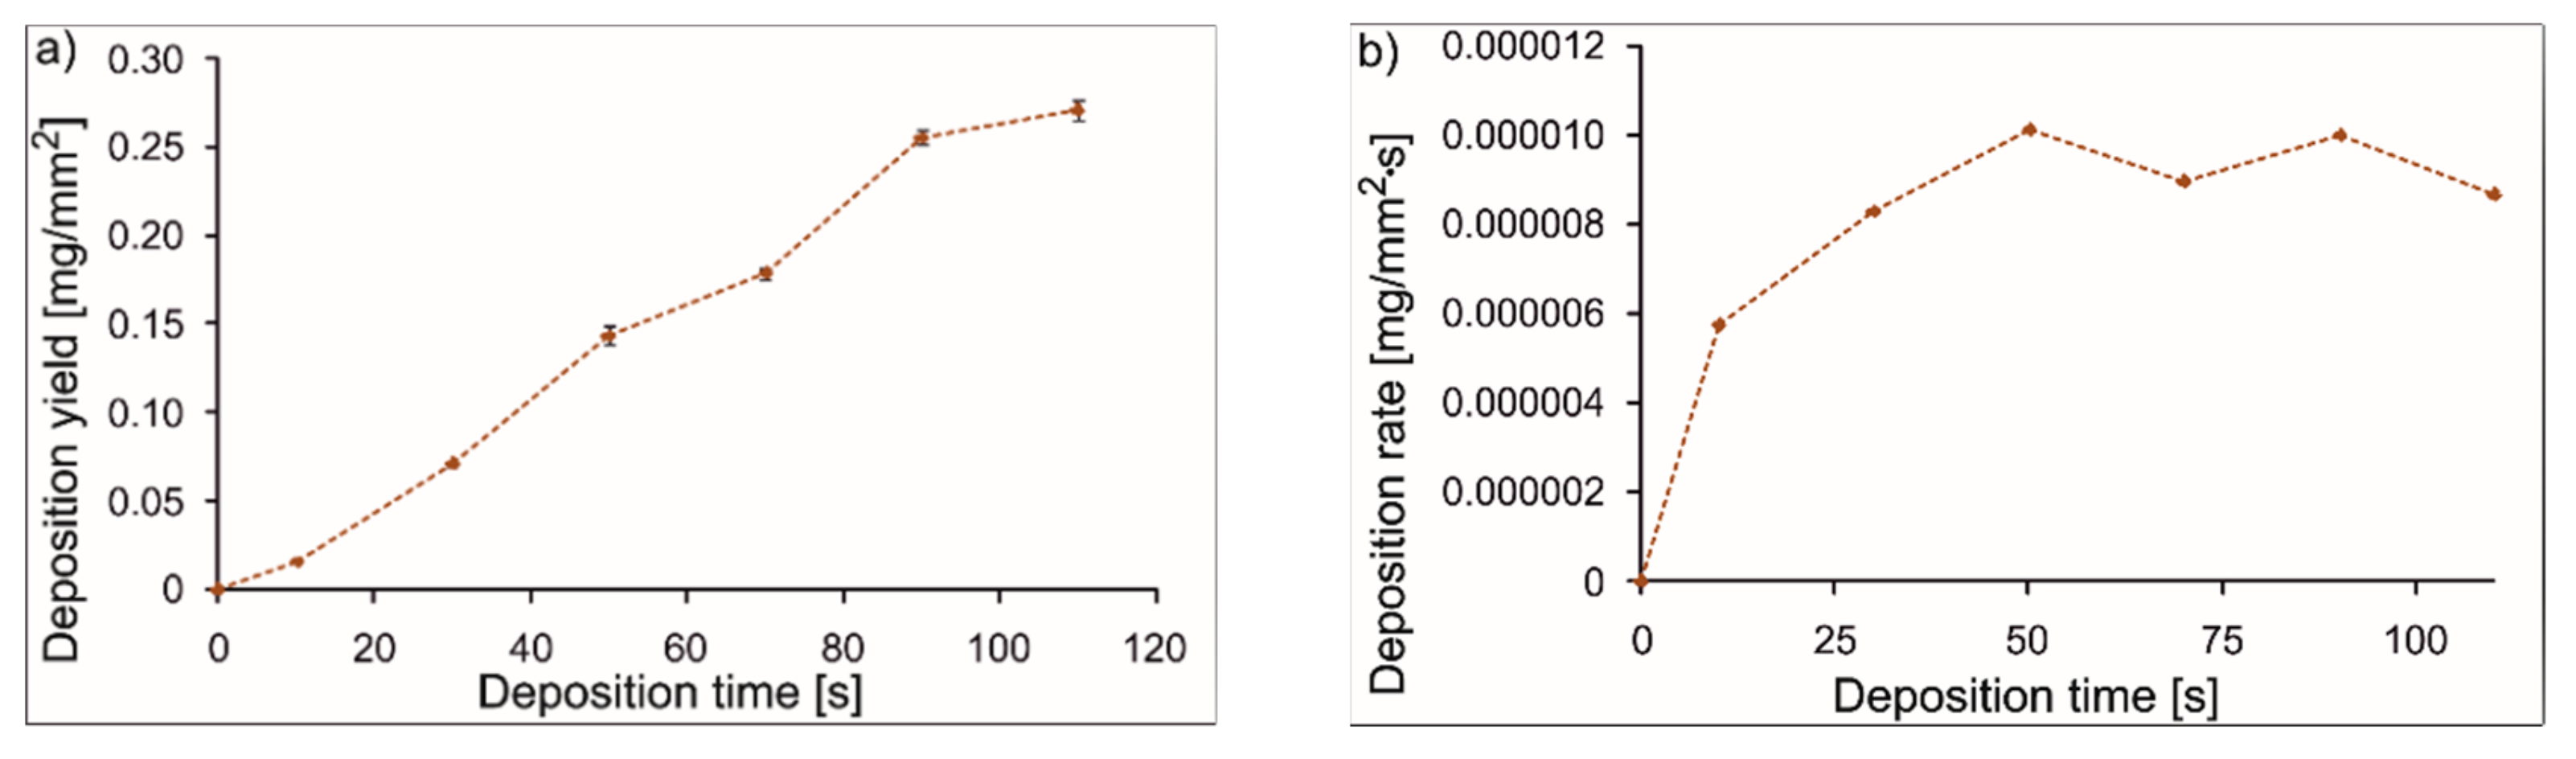
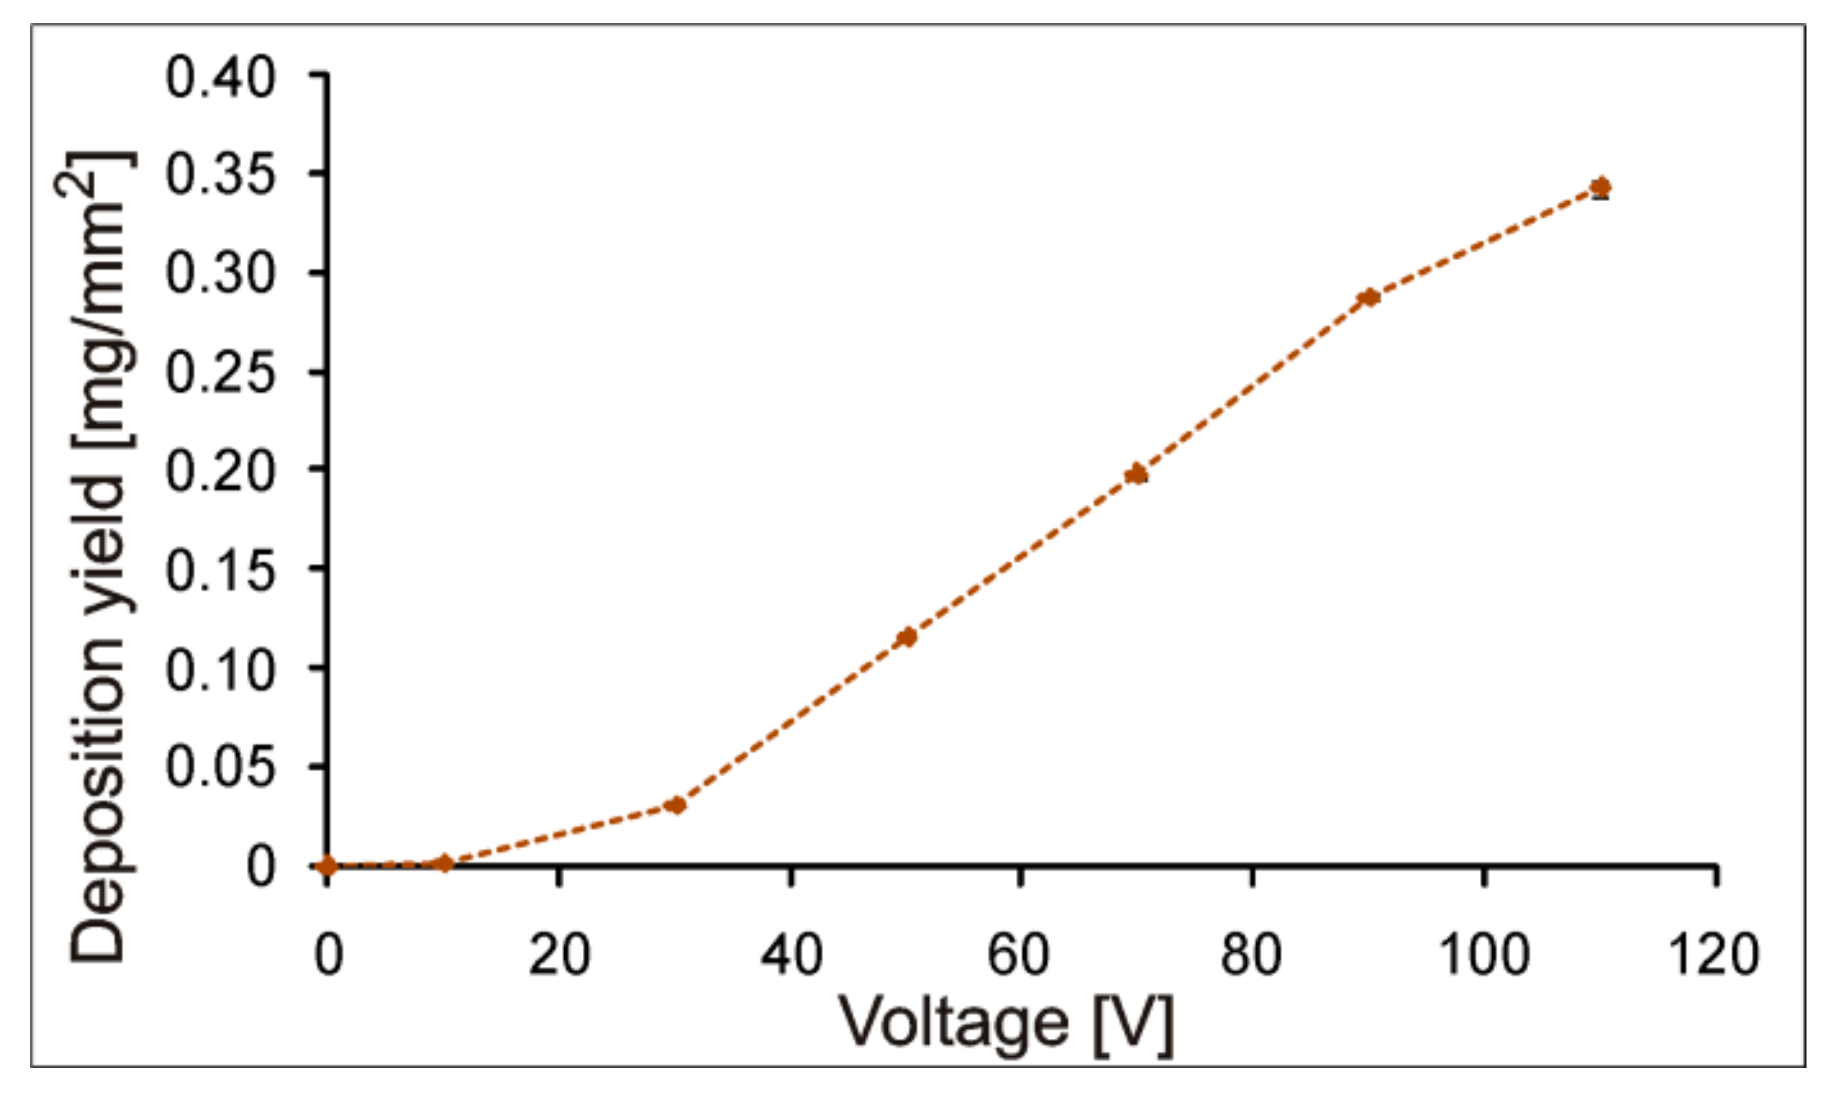
3.4. EPD of Coatings

In order to obtain homogeneous coatings, deposition parameters, voltage and time were selected by a trial-and-error approach. Although the zeta potential for the suspension containing 50 vol % of chitosan polyelectrolyte was the highest, high open porosity was observed in the coatings deposited from this suspension, which could be associated with an excessively high content of chitosan in the coatings. The zeta potential for the suspension with 15 vol % of chitosan polyelectrolyte was also relatively high, but the as-deposited coatings were macroscopically inhomogeneous and highly porous, almost spongy. Coatings with the highest homogeneity were obtained from a suspension containing 25 vol % of chitosan polyelectrolyte. Macroscopic images of coatings deposited from the suspension consisting of 1.5 g of PEEK 708 powder and 0.02 g of Si3N4 powder, in 50 mL of the dispersion medium containing 75 vol % of ethanol and 25 vol % of chitosan polyelectrolyte, at different voltages and a constant deposition time of 90 s are shown in Figure 9. Deposition was not observed below the voltage of 40 V. Coatings deposited at 40 V and 50 V were inhomogeneous. Uniform coatings were obtained in the voltage range of 60–110 V, but below the voltage of 80 V the coatings were relatively thin. Finally, a coating deposited at a constant voltage of 90 V and a time of 90 s was selected for further investigations. There are two possible ways to control the mass of coatings and, consequently, their thickness. One of them is changing the deposition time. Figure 10a shows that coating weight at a constant voltage of 90 V increases significantly with deposition time. Figure 10b presents the relationship between deposition rate and deposition time and indicates that deposition rate grows rapidly with the first 50 s but afterwards decreases slightly, and oscillates around a value of 0.000009 mg/mm2·s. The second way of controlling the coating thickness is to change the voltage. This way is more difficult, because coatings are mostly homogeneous only in a narrow range of voltages [18]. The investigations show that the coating weight also grows with increasing voltage (Figure 11). SEM observations of the coatings directly after deposition showed a relatively even distribution of polymeric and ceramic particles in the coating (Figure 12). Si3N4 separate nanoparticles and their small agglomerates, with a size up to 1.2 μm, were adsorbed on large PEEK particles.

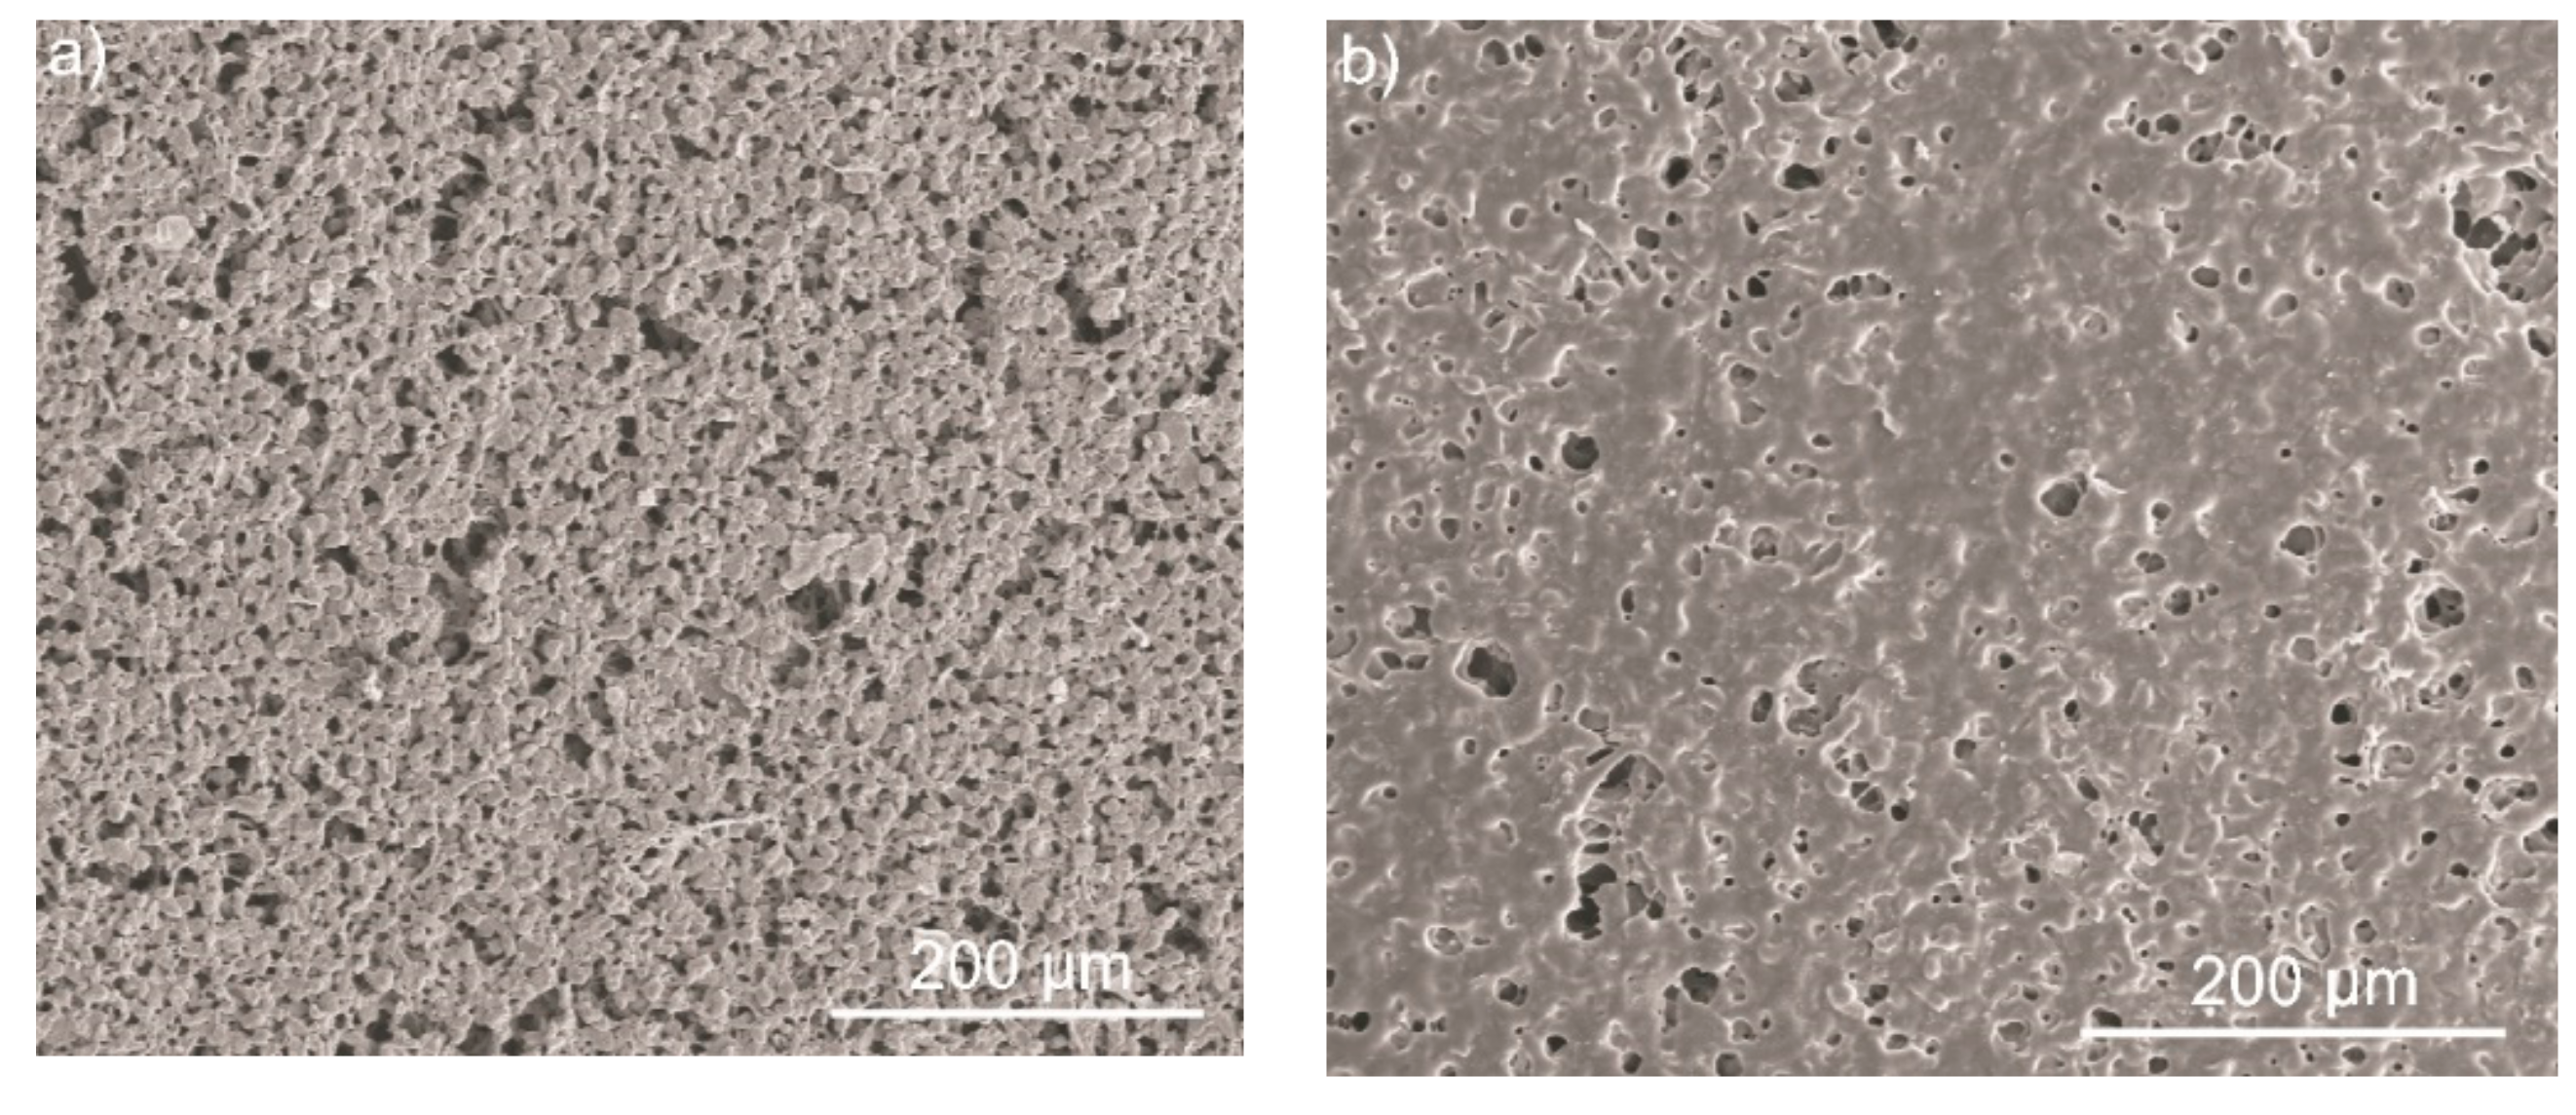
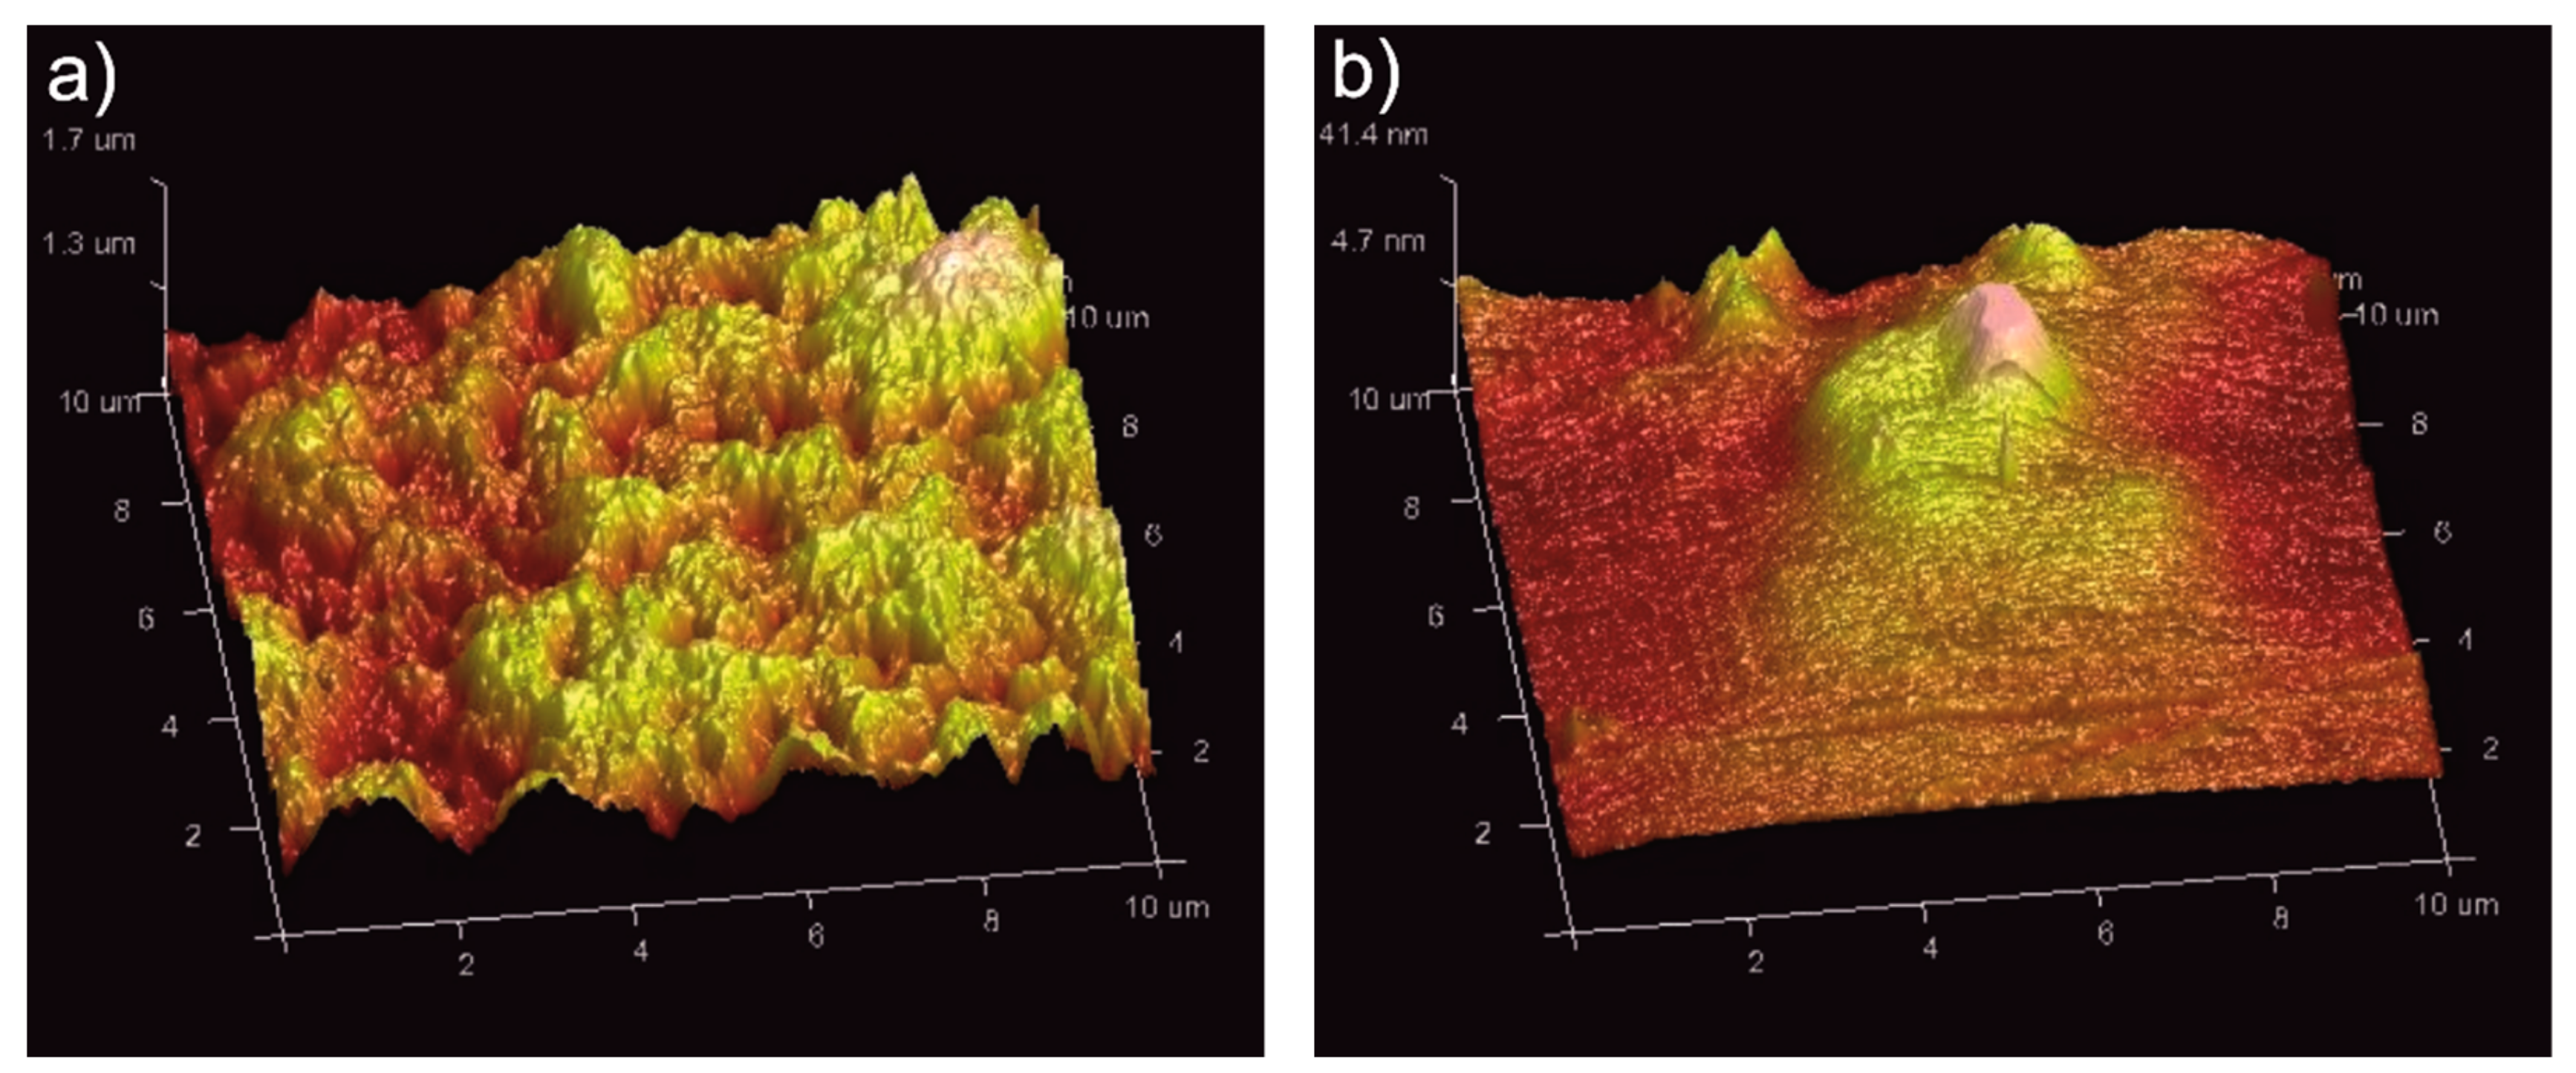
3.5. Influence of Heat Treatment on Coating Microstructure and Surface Topography

The as-deposited coatings were densified by heating at 390 °C for 40 min. Two cooling rates were applied, cooling with a furnace (2 °C/min) and cooling in water at RT. SEM images of both coatings after heat treatment are shown in Figure 13. The post-heat treatment caused the formation of a dense polymer matrix as a result of heating above the melting point. The coatings exhibited a relatively high degree of open porosity related with the degradation of chitosan during heat treatment. Heating temperature and time are parameters that have decisive influence on the degradation of chitosan during heat treatment. Decomposition of chitosan occurs in a very wide temperature range of 30–340 °C [52]. Increasing the temperature or extending the heating time could reduce the degree of open porosity in the coatings. The average thickness of the Si3N4/PEEK 708 semi-crystalline coatings was 90 μm and the amorphous ones was 105 μm. XRD investigations showed a significant effect of the cooling rate after heating on the PEEK structure (Figure 14). Cooling with a furnace resulted in a change of the PEEK structure from nearly completely amorphous for PEEK powder into semi-crystalline (Figure 14a). In contrast, the coating cooled in water showed an amorphous structure (Figure 14b). Moreover, small diffraction peaks from the crystalline phase present in the XRD pattern taken from the PEEK powder also disappeared. The difficulty in identifying Si3N4 is due to the fact that the main amorphous peak coincides with a huge amorphous diffraction peak of PEEK. However, the TEM investigations of coatings carried out on FIB lamellae, imaging and EDS microanalysis, confirmed the presence of separate Si3N4 particles, as well as their small agglomerates, within the polymer matrix. The particles were located not only in the areas close to the surface of the coating (Figure 15a) but also at a greater distance from the coating surface (Figure 15b).
The results of the microanalysis of chemical composition revealed the presence of silicon and nitrogen from the reinforcement phase, as well as carbon and oxygen from the polymer matrix.
Surface topography of the coatings was examined by the use of AFM (Figure 16). Selected surface topography parameters were determined, such as root mean square roughness (Rq), average roughness (Ra), maximum vertical distance between the highest and lowest points in the image (Rmax) and image surface area difference, ISAD (difference between the image’s three-dimensional surface area and its two-dimensional footprint area) [53,54]. It was found that the semi-crystalline coating exhibited higher roughness and higher surface development evidenced by ISAD compared to the amorphous one (Table 2). This may be due to the longer presence of this coating at elevated temperature during heat treatment and PEEK crystallization. A similar behavior was observed in our previous work [47] in the polymer PEEK 708 coatings. The amorphous coating was very smooth compared to the semi-crystalline one, which was much more developed, due to the presence of spherulites in its microstructure.

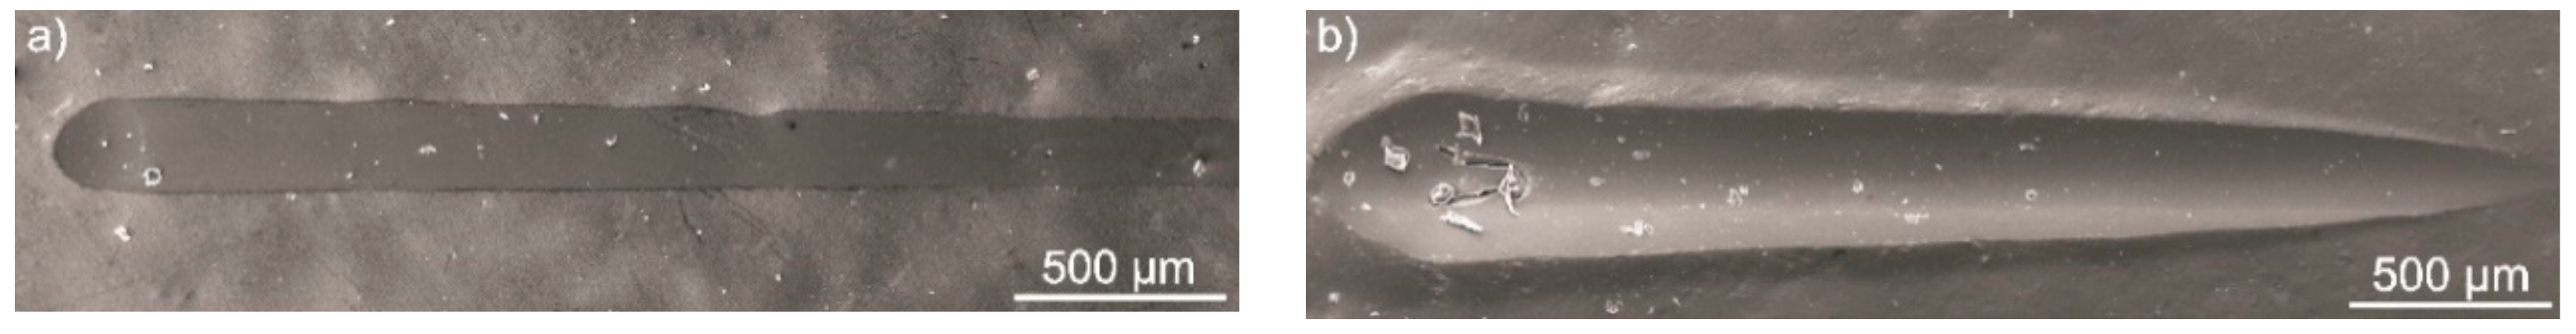
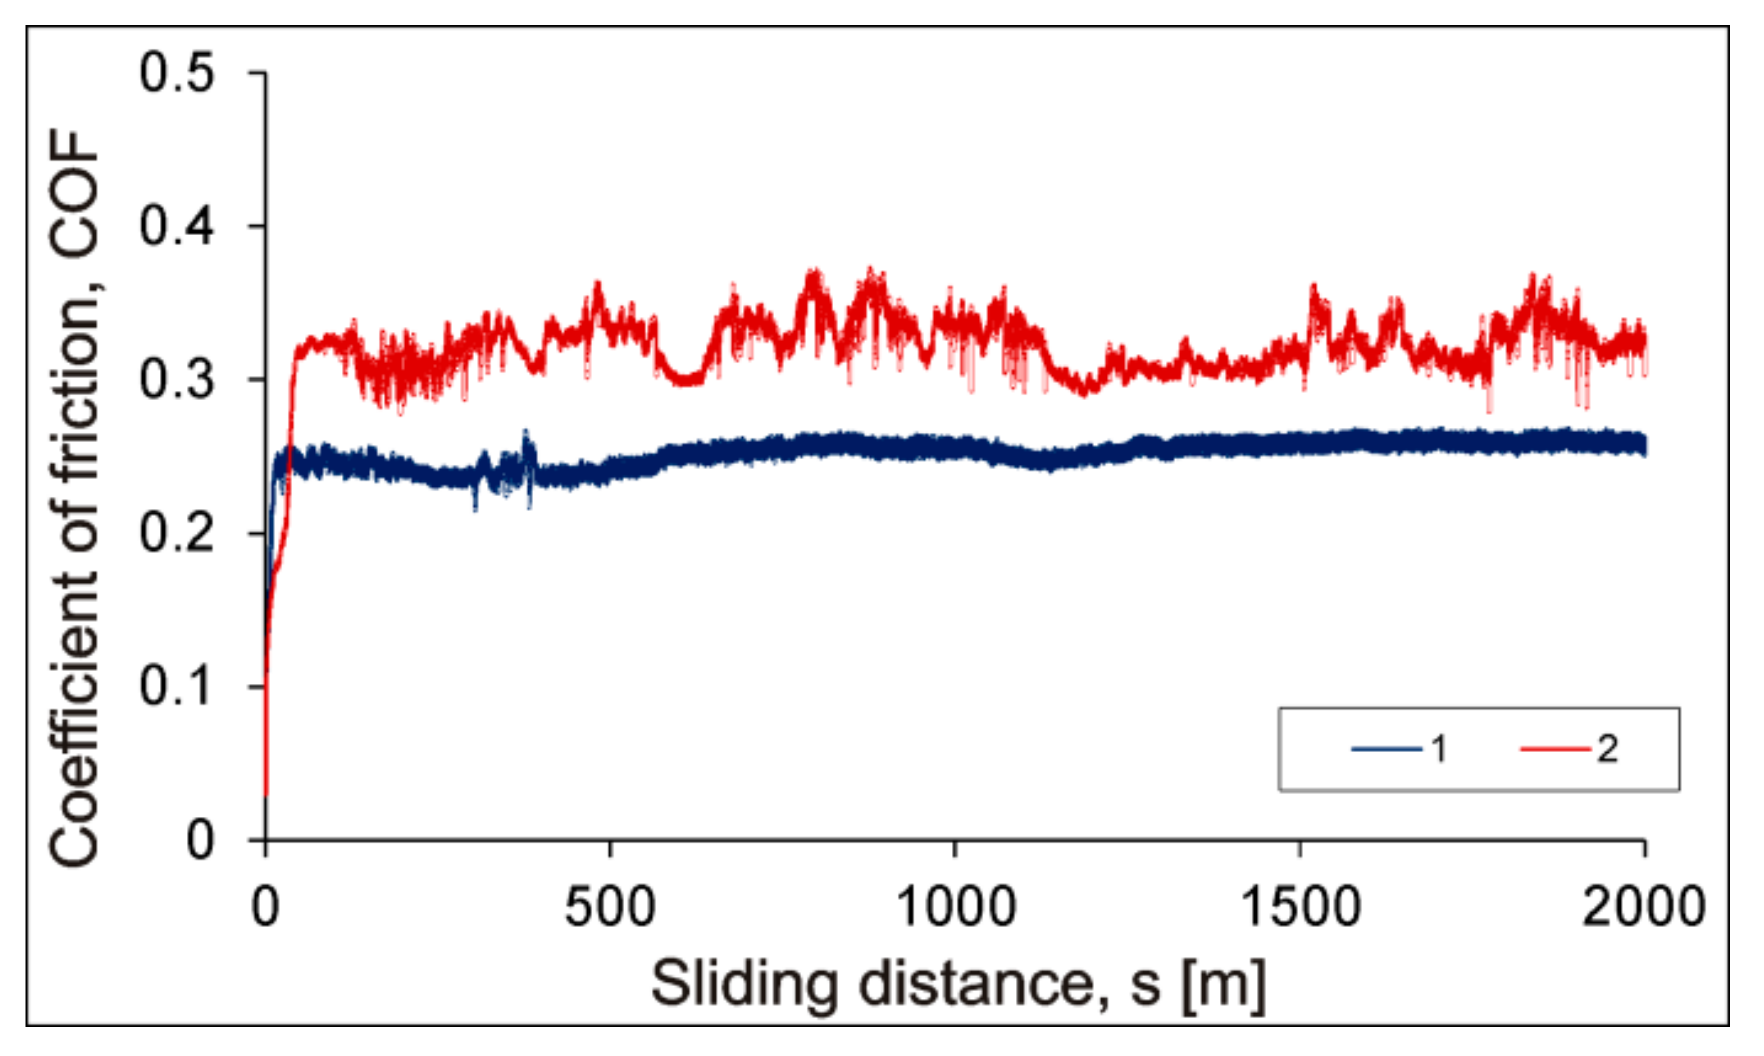
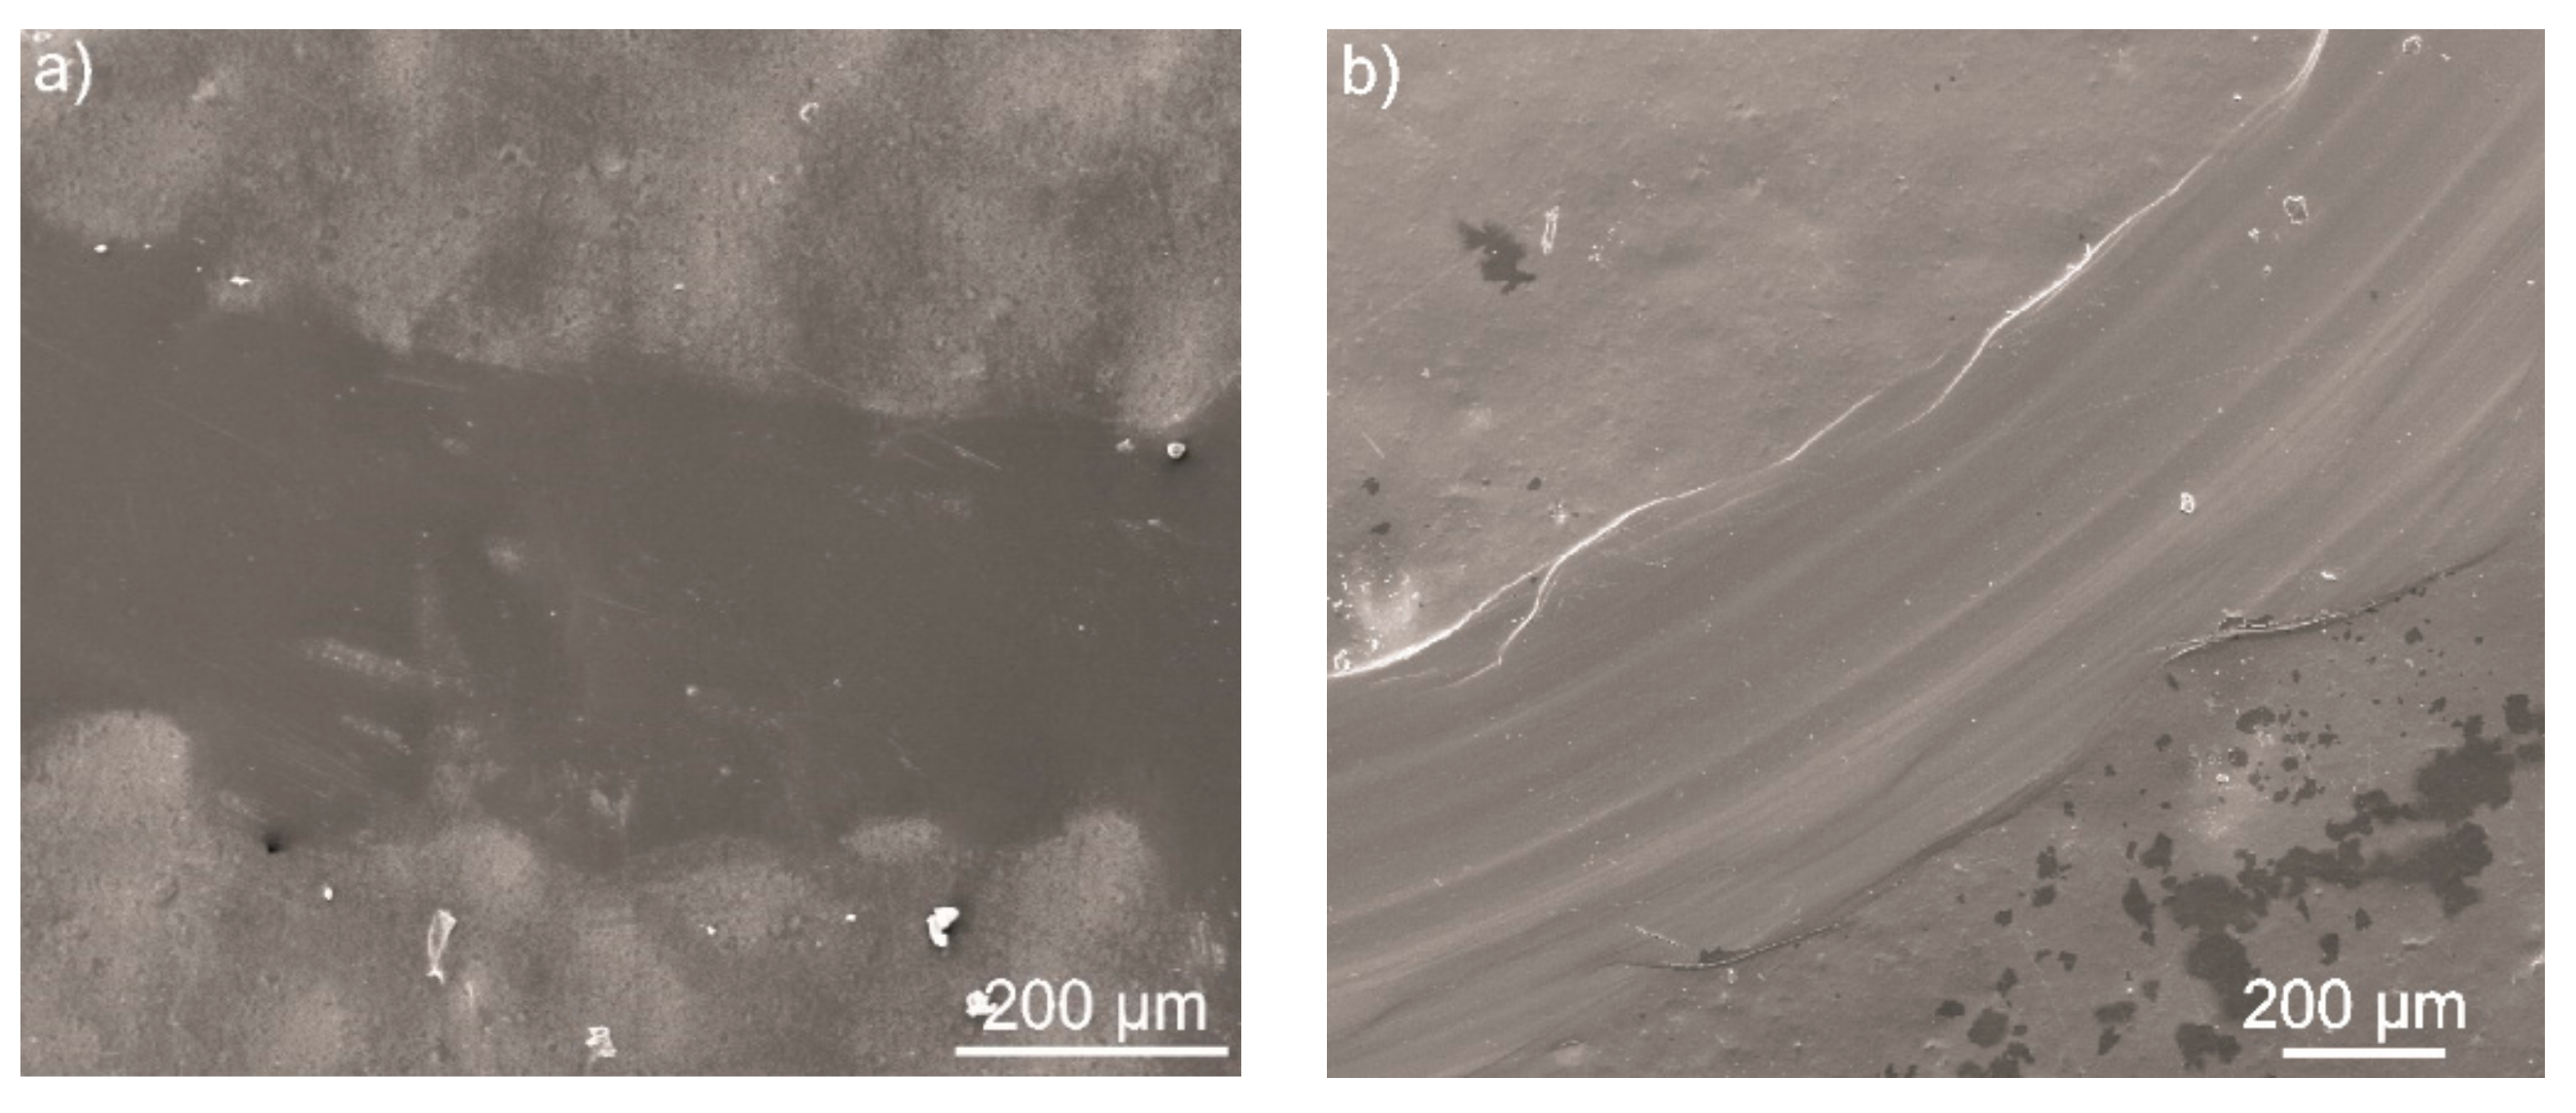
3.6. Micromechanical and Tribological Properties of the Coatings

In the hardness and elastic modulus investigations, the penetration depth of the Vickers indenter, at an indentation load of 100 mN, reached average values of 4270 nm and 4630 nm for the semi-crystalline and amorphous Si3N4/PEEK 708 coatings, respectively. Differences in the penetration depth were the result of a higher load-carrying ability through the stiffer coatings with a semi-crystalline structure. There were significant differences in the micromechanical properties of the coatings. Both hardness HIT = 0.3 ± 0.02 GPa and elastic modulus EIT = 5.4 ± 0.2 GPa of the Si3N4/PEEK 708 semi-crystalline coating were higher compared to HIT = 0.24 ± 0.02 GPa and EIT = 4.8 ± 0.15 GPa for the amorphous coating.
Semi-crystalline Si3N4/PEEK 708 coatings also show greater scratch resistance and wear resistance compared to amorphous coatings. In the scratch tests, no adhesive failures were found in either of the semi-crystalline and amorphous Si3N4/PEEK 708 coatings up to the load of 30 N, the maximum load of MCT (Figure 17). However, a single crack in the semi-crystalline coating was observed at a maximum load, but this was a result of some fold formed during scratching of the porous creased surface. In the scratch tests up to the load of 30 N, the coatings undergo mainly large plastic deformation, which was higher for the amorphous coating. At a load of 15 N, the penetration depth of the Rockwell stylus was 40 µm and 50 µm for the semi-crystalline and amorphous coatings, respectively. The Si3N4/PEEK 708 coatings deposited on the Ti-6Al-4V alloy revealed the high scratch resistance and good adhesion to the substrate, despite the presence of open porosity.
Research has shown that the tribological properties of the Si3N4/PEEK 708 coatings depend on the degree of crystallinity of the PEEK 708 polymer. The lowest COF = 0.26 and specific wear rate Wv = 1.41 × 10⁻⁶ mm3/Nm were determined for the semi-crystalline coating. The coatings with the amorphous structure were considerably less resistant to wear and exhibited higher average values of Wv = 4.74 × 10⁻⁶ mm3/Nm as well as COF = 0.31. During friction of this amorphous coating, less stable cooperation with the counter-element was also observed (Figure 18). Wear of the coatings was mainly abrasive with greater intensity for the amorphous coating, where numerous small grooves occurred in the friction track (Figure 19). The wear products were located mostly outside of the wear friction track. Moreover, during friction the amorphous coating was additionally plastic deformed. Si3N4/PEEK 708 coatings had a comparable COF to polymer PEEK 708 coatings, regardless of whether the coating structure was semi-crystalline or amorphous. The wear rates of amorphous Si3N4/PEEK 708 and PEEK 708 coatings were also similar. An important difference was observed for semi-crystalline coatings, with the Si3N4/PEEK 708 coating showing a significantly lower wear rate compared to the polymer coating, for which Wv = 2.61 × 10⁻⁶ mm3/Nm.
The applied Si3N4/PEEK 708 coatings, even those with an amorphous structure, repeatedly increased the abrasion wear resistance of the coated alloy, for which the wear rate reached the value of Wv = 720 × 10−6 mm3/Nm and COF = 0.7 under identical friction conditions [47].

4. Conclusions

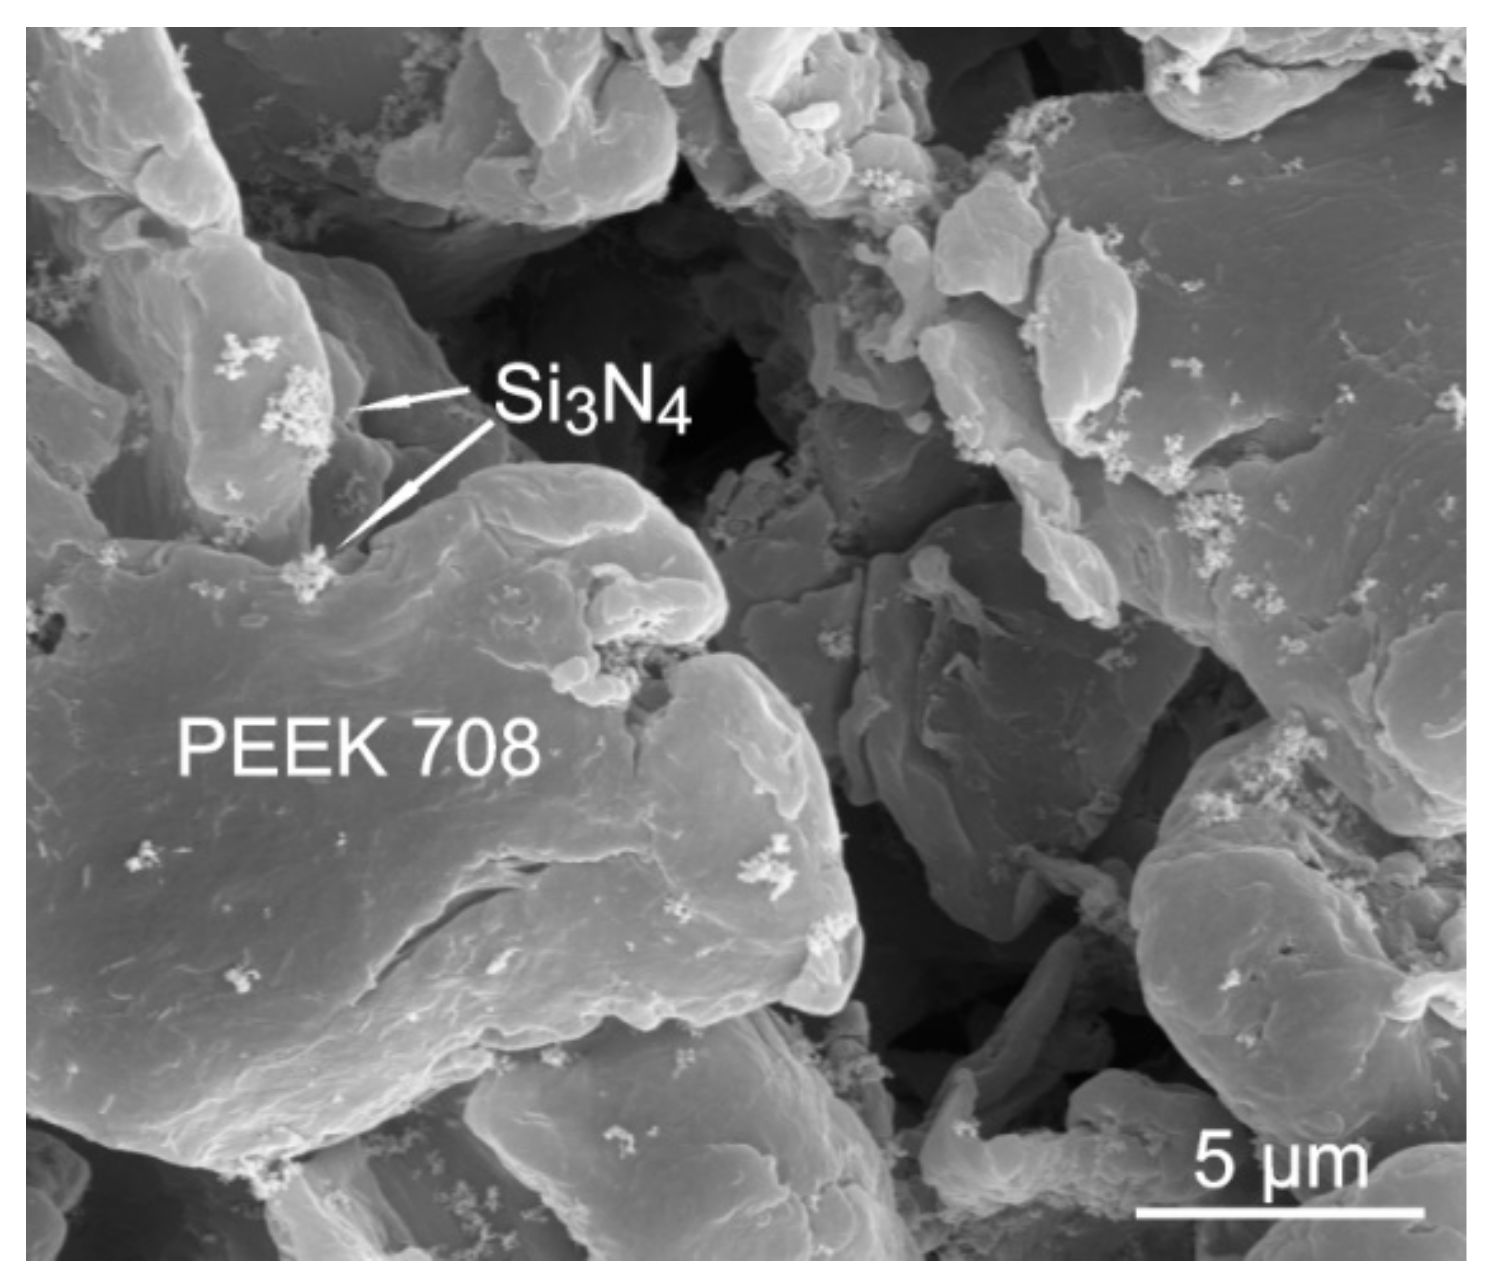
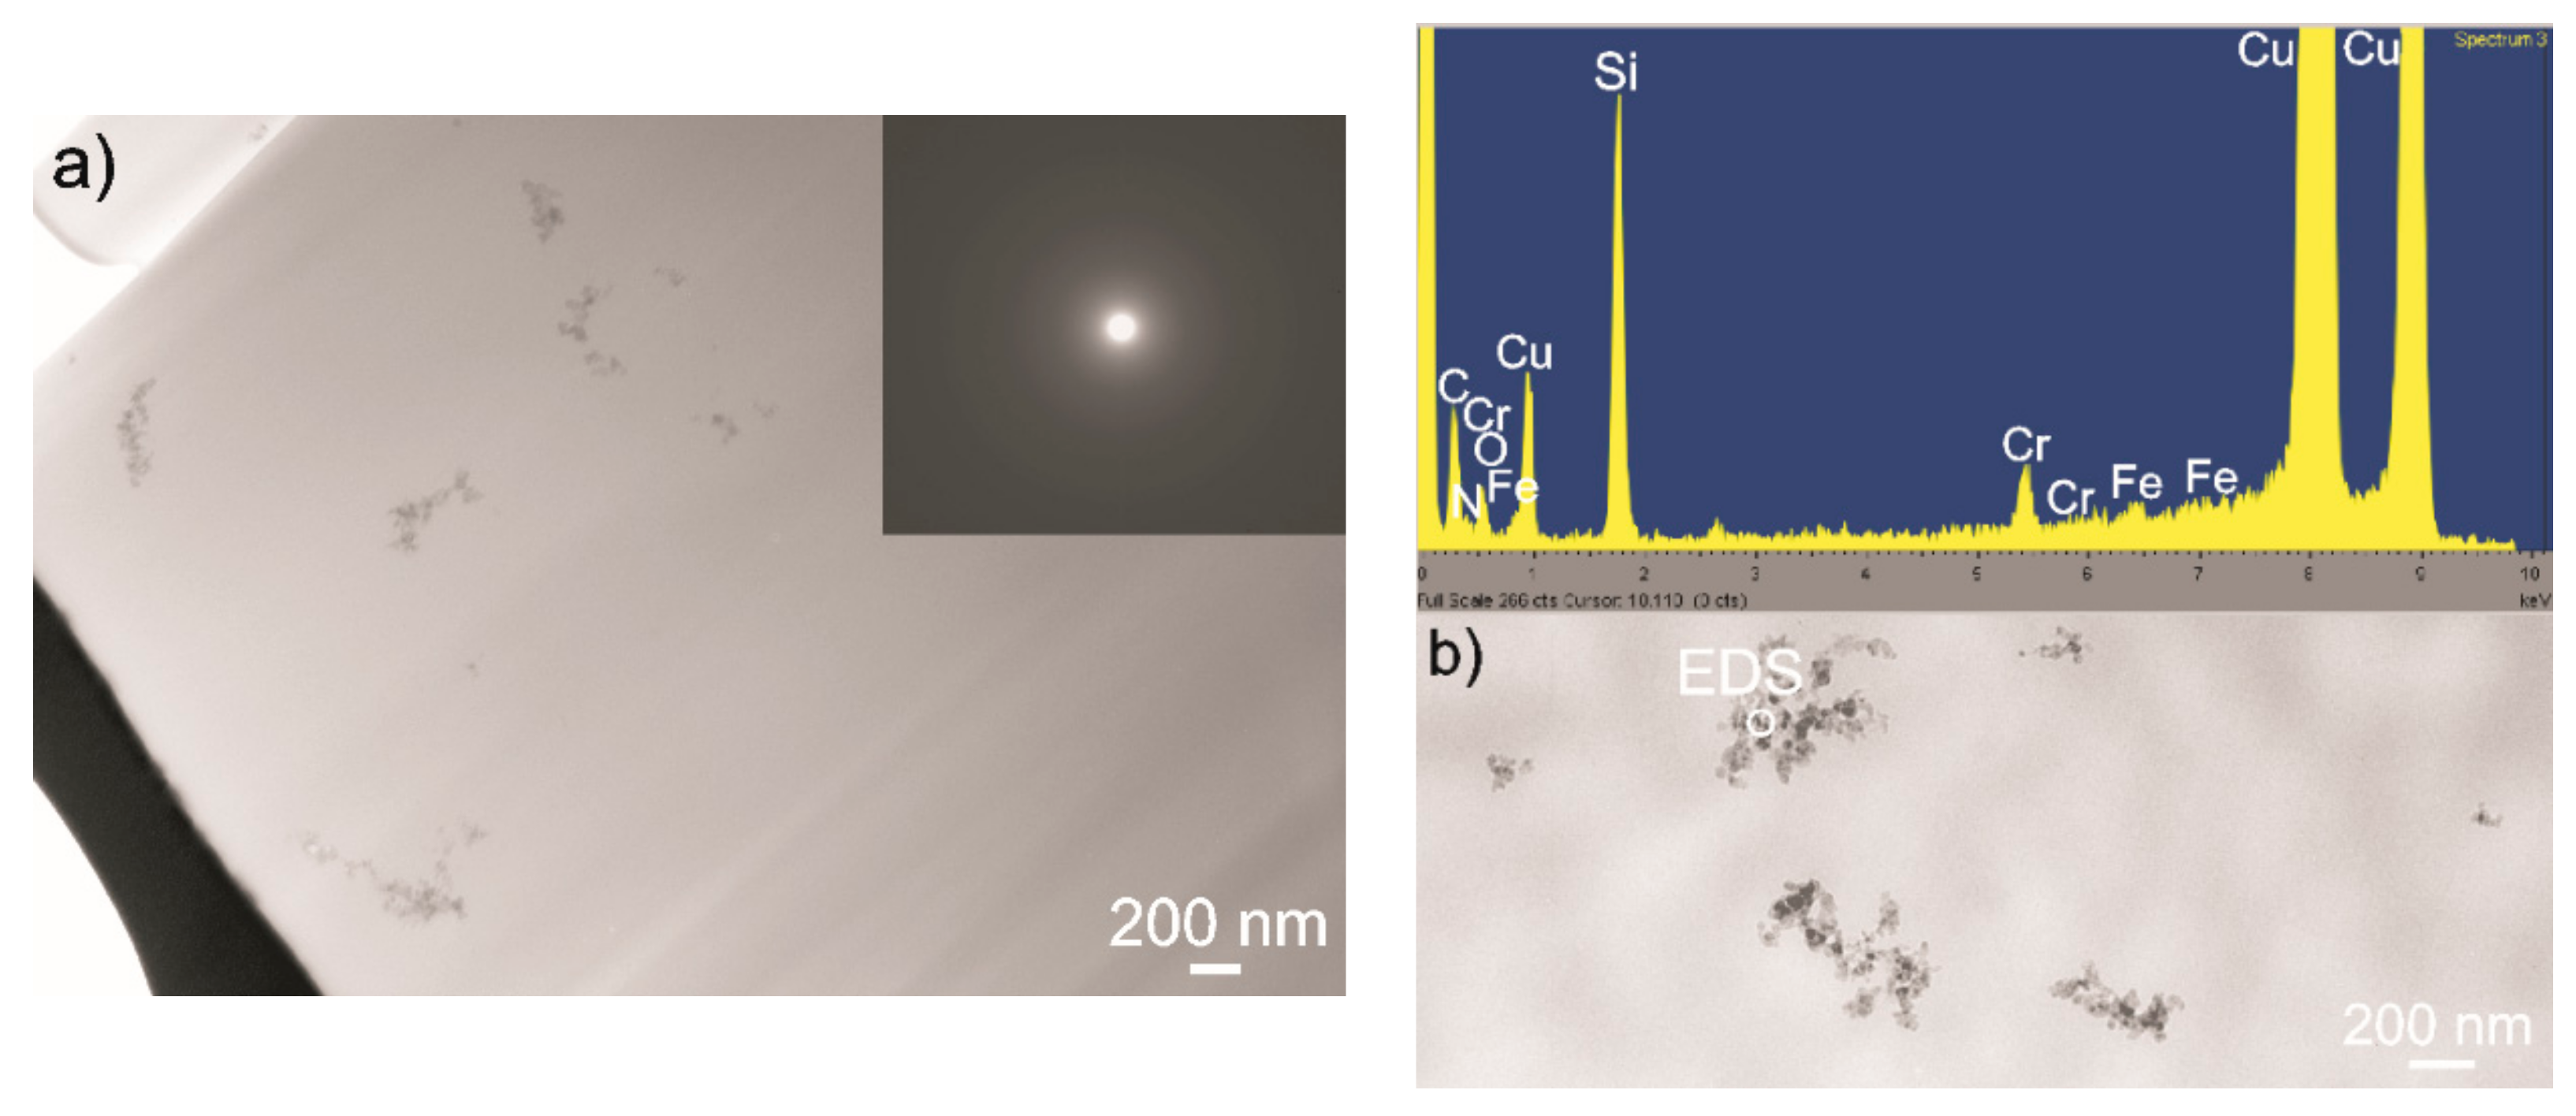
  • The addition of chitosan polyelectrolyte changed the surface potential of the PEEK 708 particles and increased the stability of the suspension. Coatings with the highest homogeneity were obtained from a suspension containing 25 vol % of chitosan polyelectrolyte. Zeta potential measurements and TEM observations clearly indicate the mechanisms of interactions between the ceramic nanoparticles and the polymeric micro-particles. The electrostatic interaction between Si3N4 and PEEK particles was indicated in pure ethanol. The steric stabilization of both types of particles by chitosan molecules and chains were indicated in suspensions containing chitosan polyelectrolyte.
  • Appropriate selection of the EPD parameters allows uniform coatings to be obtained with relatively even distributions of polymeric particles and ceramic particles adsorbed to them. Macroscopically homogeneous coatings were obtained using a constant voltage of 90 V and a deposition time of 90 s.
  • The post EPD heat treatment caused the formation of a dense polymer matrix as a result of heating above the PEEK 708 melting point. The coating structure was semi-crystalline or amorphous depending on the cooling rate after heating, with a furnace and in water at RT, respectively.
  • The semi-crystalline coatings exhibited higher roughness and higher surface development compared to the amorphous ones, due to the longer presence at elevated temperature during heat treatment and PEEK crystallization.
  • Both hardness and elastic modulus of the semi-crystalline coating were higher compared to the amorphous one. However, both coatings revealed high scratch resistance and good adhesion to the substrate, despite the presence of open porosity.
  • Both coatings increased the wear resistance and decreased the COF of the Ti-6Al-4V alloy. However, this improvement was more significant in the case of the semi-crystalline coating as the amorphous coating exhibited significantly poorer tribological properties.

Author Contributions

Conceptualization, A.F. and T.M.; formal analysis, A.F., S.Z., A.K. and T.M.; funding acquisition, T.M.; investigation, A.F., S.Z., A.K. and T.M.; project administration, T.M.; resources, T.M.; supervision, T.M.; validation, A.F., S.Z., A.K. and T.M.; visualization, A.F. and T.M.; writing—original draft, A.F.; writing—review and editing, S.Z. and T.M.

Funding

This research was funded by the National Science Centre, Poland (decision no DEC-2016/21/B/ST8/00238).

Acknowledgments

The authors appreciate the valuable contribution of Ł. Cieniek for SEM investigation.

Conflicts of Interest

The authors declare no conflict of interest. The funders had no role in the design of the study; in the collection, analyses, or interpretation of data; in the writing of the manuscript, or in the decision to publish the results.

References

  1. Oh, I.-H.; Nomura, N.; Masahashi, N.; Hanada, S. Mechanical properties of porous titanium compacts prepared by powder sintering. Scr. Mater. 2003, 49, 1197–1202. [Google Scholar] [CrossRef]
  2. Muhammad, M.; Masoomi, M.; Torries, B.; Shamsaei, N.; Haghshenas, M. Depth-sensing time-dependent response of additively manufactured Ti-6Al-4V alloy. Addit. Manuf. 2018, 24, 37–46. [Google Scholar] [CrossRef]
  3. Niu, Q.L.; Zheng, X.H.; Ming, W.W.; Chen, M. Friction and Wear Performance of Titanium Alloys against Tungsten Carbide under Dry Sliding and Water Lubrication. Tribol. Trans. 2013, 56, 101–108. [Google Scholar] [CrossRef]
  4. Peters, M.; Hemptenmacher, J.; Kumpfert, J.; Leyens, C. Structure and Properties of Titanium and Titanium Alloys. In Titanium and Titanium Alloys, Fundamentals and Applications; Leyens, C., Peters, M., Eds.; Wiley-VCH: Weinheim, Germany, 2003. [Google Scholar] [CrossRef]
  5. Moskalewicz, T.; Wendler, B.; Zimowski, S.; Dubiel, B.; Czyrska-Filemonowicz, A. Microstructure, micro-mechanical and tribological properties of the nc-WC/a-C nanocomposite coatings magnetron sputtered on non-hardened and oxygen hardened Ti-6Al-4V alloy. Surf. Coat. Technol. 2010, 205, 2668–2677. [Google Scholar] [CrossRef]
  6. Amanov, A.; Pyun, Y.S. Local heat treatment with and without ultrasonic nanocrystal surface modification of Ti-6Al-4V alloy: Mechanical and tribological properties. Surf. Coat. Technol. 2017, 326, 343–354. [Google Scholar] [CrossRef]
  7. Samanta, A.; Bhattacharya, M.; Ratha, I.; Chakraborty, H.; Datta, S.; Ghosh, J.; Bysakh, S.; Sreemany, M.; Rane, R.; Joseph, A.; et al. Nano- and micro-tribological behaviours of plasma nitrided Ti6Al4V alloys. J. Mech. Behav. Biomed. Mater. 2018, 77, 267–294. [Google Scholar] [CrossRef] [PubMed]
  8. Duan, H.; Han, Y.; Lu, W.; Mao, J.; Wang, L.; Zhang, D. Effect of solid carburization on surface microstructure and hardness of Ti-6Al-4V alloy and (TiB+La2O3)/Ti-6Al-4V composite. Trans. Nonferr. Met. Soc. China (Engl. Ed.) 2016, 26, 1871–1877. [Google Scholar] [CrossRef]
  9. Movassagh-Alanagh, F.; Abdollah-zadeh, A.; Aliofkhazraei, M.; Abedi, M. Improving the wear and corrosion resistance of Ti–6Al–4V alloy by deposition of TiSiN nanocomposite coating with pulsed-DC PACVD. Wear 2017, 390–391, 93–103. [Google Scholar] [CrossRef]
  10. Rahmati, B.; Sarhan Ahmed, A.D.; Zalnezhad, E.; Kamiab, Z.; Dabbagh, A.; Choudhury, D.; Abas, W.A.B.W. Development of tantalum oxide (Ta-O) thin film coating on biomedical Ti-6Al-4V alloy to enhance mechanical properties and biocompatibility. Ceram. Int. 2016, 42, 466–480. [Google Scholar] [CrossRef]
  11. Wang, Y.; Pang, X.; Zhitomirsky, I. Electrophoretic deposition of chiral polymers and composites. Colloids Surf. B Biointerfaces 2011, 87, 505–509. [Google Scholar] [CrossRef] [PubMed]
  12. Wang, C.; Ma, J.; Cheng, W. Formation of polyetheretherketone polymer coating by electrophoretic deposition method. Surf. Coat. Technol. 2003, 173, 271–275. [Google Scholar] [CrossRef]
  13. Narkevica, I.; Stradina, L.; Stipniece, L.; Jakobsons, E.; Ozolins, J. Electrophoretic deposition of nanocrystalline TiO2 particles on porous TiO2-x ceramic scaffolds for biomedical applications. J. Eur. Ceram. Soc. 2017, 37, 3185–3193. [Google Scholar] [CrossRef]
  14. Charlot, A.; Deschanels, X.; Toquer, G. Submicron coating of SiO2 nanoparticles from electrophoretic deposition. Thin Solid Film. 2014, 553, 148–152. [Google Scholar] [CrossRef]
  15. Fraczek-Szczypta, A.; Jantas, D.; Ciepiela, F.; Grzonka, J.; Bernasik, A.; Marzec, M. Carbon nanomaterials coatings—Properties and influence on nerve cells response. Diam. Relat. Mater. 2018, 84, 127–140. [Google Scholar] [CrossRef]
  16. Jeun, J.H.; Kim, W.S.; Hong, S.H. Electrophoretic deposition of carbon nanoparticles on dendritic Sn foams fabricated by electrodeposition. Mater. Lett. 2013, 112, 109–112. [Google Scholar] [CrossRef]
  17. Bartmanski, M.; Cieslik, B.; Glodowska, J.; Kalka, P.; Pawlowski, L.; Pieper, M.; Zielinski, A. Electrophoretic deposition (EPD) of nanohydroxyapatite - nanosilver coatings on Ti13Zr13Nb alloy. Ceram. Int. 2017, 43, 11820–11829. [Google Scholar] [CrossRef]
  18. Besra, L.; Liu, M. A review on fundamentals and applications of electrophoretic deposition (EPD). Prog. Mater. Sci. 2007, 52, 1–61. [Google Scholar] [CrossRef]
  19. Corni, I.; Ryan, M.P.; Boccaccini, A.R. Electrophoretic deposition: From traditional ceramics to nanotechnology. J. Eur. Ceram. Soc. 2008, 28, 1353–1367. [Google Scholar] [CrossRef]
  20. Simsiriwong, J.; Shrestha, R.; Shamsaei, N.; Lugo, M.; Moser, R.D. Effects of microstructural inclusions on fatigue life of polyether ether ketone (PEEK). J. Mech. Behav. Biomed. Mater. 2015, 51, 388–397. [Google Scholar] [CrossRef] [PubMed]
  21. Dandy, L.O.; Oliveux, G.; Wood, J.; Jenkins, M.J.; Leeke, G.A. Accelerated degradation of Polyetheretherketone (PEEK) composite materials for recycling applications. Polym. Degrad. Stab. 2015, 112, 52–62. [Google Scholar] [CrossRef] [Green Version]
  22. Corni, I.; Neumann, N.; Eifler, D.; Boccaccini, A.R. Polyetheretherketone (PEEK) coatings on stainless steel by electrophoretic deposition. Adv. Eng. Mater. 2008, 10, 559–564. [Google Scholar] [CrossRef]
  23. Clavijo, S.; Membrives, F.; Boccaccini, A.R.; Santillán, M.J. Characterization of polyetheretherketone particle suspensions for electrophoretic deposition. J. Appl. Polym. Sci. 2014, 131, 2–7. [Google Scholar] [CrossRef]
  24. Li, E.Z.; Guo, W.L.; Wang, H.D.; Xu, B.S.; Liu, X.T. Research on tribological behavior of PEEK and glass fiber reinforced PEEK composite. Phys. Procedia 2013, 50, 453–460. [Google Scholar] [CrossRef]
  25. Regis, M.; Bellare, A.; Pascolini, T.; Bracco, P. Characterization of thermally annealed PEEK and CFR-PEEK composites: Structure-properties relationships. Polym. Degrad. Stab. 2017, 136, 121–130. [Google Scholar] [CrossRef]
  26. Lu, Z.P.; Friedrich, K. On sliding friction and wear of PEEK and its composites. Wear 1995, 183, 624–631. [Google Scholar] [CrossRef]
  27. Zhang, G.; Liao, H.; Coddet, C. Friction and wear behavior of PEEK and its composite coatings. Tribol. Interface Eng. Ser. 2008, 55, 458–482. [Google Scholar] [CrossRef]
  28. Vail, J.R.; Krick, B.A.; Marchman, K.R.; Sawyer, W.G. Polytetrafluoroethylene (PTFE) fiber reinforced polyetheretherketone (PEEK) composites. Wear 2011, 270, 737–741. [Google Scholar] [CrossRef]
  29. Baştan, F.E.; Atiq Ur Rehman, M.; Avcu, Y.Y.; Avcu, E.; Üstel, F.; Boccaccini, A.R. Electrophoretic co-deposition of PEEK-hydroxyapatite composite coatings for biomedical applications. Colloids Surf. B. 2018, 169, 176–182. [Google Scholar] [CrossRef]
  30. Balaji, V.; Tiwari, A.N.; Goyal, R.K. Study on High-Performance Poly(etheretherketone)/Si3N4Nanocomposites: New Electronic Substrate Materials. Polym. Eng. Sci. 2011, 51, 509–517. [Google Scholar] [CrossRef]
  31. Qihua, W.; Jinfen, X.; Weichang, S.; Weimin, L. An investigation of the friction and wear properties of nanometer Si3N4 filled PEEK. Wear 1996, 196, 82–86. [Google Scholar] [CrossRef]
  32. Moskalewicz, T.; Zych, A.; Kruk, A.; Kopia, A.; Zimowski, S.; Sitarz, M.; Cieniek, Ł. Electrophoretic deposition and microstructure development of Si3N4/polyetheretherketone coatings on titanium alloy. Surf. Coat. Technol. 2018, 350, 633–647. [Google Scholar] [CrossRef]
  33. Li, B.; Zhang, W. Microstructural, surface and electrochemical properties of pulse electrodeposited Ni-W/Si3N4 nanocomposite coating. Ceram. Int. 2018, 44, 19907–19918. [Google Scholar] [CrossRef]
  34. Xia, R.; Zhang, Y.; Zhu, Q.; Qian, J.; Dong, Q.; Li, F. Surface Modification of Nano-Sized Silicon Nitride with BA-MAA-AN Tercopolymer. J. Appl. Polym. Sci. 2008, 107, 562–570. [Google Scholar] [CrossRef]
  35. Liu, X.; Yi, X.; Guo, R.; Li, Q.; Nomura, T. Formation mechanisms of Si3N4 microstructures during silicon powder nitridation. Ceram. Int. 2017, 43, 16773–16779. [Google Scholar] [CrossRef]
  36. Lu, X.; Blawert, C.; Scharnagl, N.; Kainer, K.U. Influence of incorporating Si3N4 particles into the oxide layer produced by plasma electrolytic oxidation on AM50 Mg alloy on coating morphology and corrosion properties. J. Magnes. Alloy. 2013, 1, 267–274. [Google Scholar] [CrossRef]
  37. Golla, B.R.; Ko, J.W.; Kim, J.M.; Kim, H.D. Effect of particle size and oxygen content of Si on processing, microstructure and thermal conductivity of sintered reaction bonded Si3N4. J. Alloy. Compd. 2015, 595, 60–66. [Google Scholar] [CrossRef]
  38. Wu, Z.; Zhang, Z.; Yun, J.; Yan, J.; You, T. Synthesis of α-Si3N4crystallon by a solvothermal method at a low temperature of 180 °C. Phys. B Condens. Matter. 2013, 428, 10–13. [Google Scholar] [CrossRef]
  39. Hao, W.; Yang, W.; Cai, H.; Huang, Y. Non-isothermal crystallization kinetics of polypropylene/silicon nitride nanocomposites. Polym. Test. 2010, 29, 527–533. [Google Scholar] [CrossRef]
  40. Deepthi, M.V.; Sailaja, R.R.N.; Sampathkumaran, P.; Seetharamu, S.; Vynatheya, S. High density polyethylene and silane treated silicon nitride nanocomposites using high-density polyethylene functionalized with maleate ester: Mechanical, tribological and thermal properties. Mater. Des. 2014, 56, 685–695. [Google Scholar] [CrossRef]
  41. Kusunose, T.; Yagi, T.; Firoz, S.H.; Sekino, T. Fabrication of epoxy/silicon nitride nanowire composites and evaluation of their thermal conductivity. J. Mater. Chem. A 2013, 1, 3440–3445. [Google Scholar] [CrossRef]
  42. Nsib, F.; Ayed, N.; Chevalier, Y. Selection of dispersants for the dispersion of carbon black in organic medium. Prog. Org. Coat. 2006, 55, 303–310. [Google Scholar] [CrossRef]
  43. Cheng, G.; Qian, J.; Tang, Z.; Ding, G.; Zhu, J. Dispersion stability of Si3N4 nano-particles modified by γ-methacryloxypropyltrimethoxysilane (MAPTMS) in organic solvent. Ceram. Int. 2015, 41, 1879–1884. [Google Scholar] [CrossRef]
  44. Su, F.; Zhang, S. Tribological properties of polyimide coatings filled with PTFE and surface-modified nano-Si3N4. J. Appl. Polym. Sci. 2014, 131, 1–11. [Google Scholar] [CrossRef]
  45. Sun, N.; Meng, X.; Xiao, Z. Functionalized Si3N4 nanoparticles modified with hydrophobic polymer chains by surface-initiated atom transfer radical polymerization (ATRP). Ceram. Int. 2015, 41, 13830–13835. [Google Scholar] [CrossRef]
  46. Tai, Y.; Miao, J.; Qian, J.; Xia, R.; Zhang, Y. An effective way to stabilize silicon nitride nanoparticles dispersed in rubber matrix by a one-step process. Mater. Chem. Phys. 2008, 112, 659–667. [Google Scholar] [CrossRef]
  47. Kruk, A.; Zimowski, S.; Łukaszczyk, A.; Cieniek, Ł.; Moskalewicz, T. The influence of heat treatment on the microstructure, surface topography and selected properties of PEEK coatings electrophoretically deposited on the Ti-6Al-4V alloy. Prog. Org. Coat. 2019, 133, 180–190. [Google Scholar] [CrossRef]
  48. Hang, J.; Shi, L.; Feng, X.; Xiao, L. Electrostatic and electrosteric stabilization of aqueous suspensions of barite nanoparticles. Powder Technol. 2009, 192, 166–170. [Google Scholar] [CrossRef]
  49. Moskalewicz, T.; Kruk, A.; Sitarz, M.; Kopia, A. Effect of the Processing and Heat Treatment Route on the Microstructure of MoS2/Polyetheretherketone Coatings Obtained by Electrophoretic Deposition. J. Electrochem. Soc. 2019, 166, 151–161. [Google Scholar] [CrossRef]
  50. Chung, Y.C.; Tsai, C.F.; Li, C.F. Preparation and characterization of water-soluble chitosan produced by Maillard reaction. Fish. Sci. 2006, 72, 1096–1103. [Google Scholar] [CrossRef]
  51. Luo, D.; Zhitomirsky, I. Electrophoretic Deposition of Polyetheretherketone Composites, Containing Huntite and Alumina Platelets. J. Electrochem. Soc. 2015, 162, 3057–3062. [Google Scholar] [CrossRef]
  52. Szymańska, E.; Winnicka, K. Stability of Chitosan—A Challenge for Pharmaceutical and Biomedical Applications. Mar. Drugs 2015, 13, 1819–1846. [Google Scholar] [CrossRef] [PubMed]
  53. Oraby, S.E.; Alaskari, A.M. Atomic Force Microscopy (AFM) Topographical Surface Characterization of Multilayer-Coated and Uncoated Carbide Inserts. Int. J. Mech. Aerosp. Ind. Mechatron. Manuf. Eng. 2010, 4, 977–988. [Google Scholar] [CrossRef]
  54. Raposo, M.; Ferreira, Q.; Ribeiro, P.A. A Guide for Atomic Force Microscopy Analysis of Soft-Condensed Matter. Mod. Res. Educ. Top. Microsc. 2006, 38, 679–681. [Google Scholar]
Figure 1. XRD pattern of the Ti-6Al-4V alloy.
Coatings 09 00530 g001
Figure 2. Microstructure of the Ti-6Al-4V alloy, from a SEM secondary electron image (a), and TEM micrograph as well as SAED patterns (b) taken from grains marked as 1 and 2, and their identification as 1—Tiα, 2—Tiβ, from cross-section specimens cut from the as-delivered bar.
Coatings 09 00530 g002
Figure 3. XRD pattern of the Si3N4 powder.
Coatings 09 00530 g003
Figure 4. Si3N4 nanoparticles used for electrophoretic deposition (EPD) and the SAED pattern taken from the area marked in the figure, as per TEM.
Coatings 09 00530 g004
Figure 5. An SEM secondary electron image of polyetheretherketone (PEEK) 708 micro-particles used for the EPD of coatings.
Coatings 09 00530 g005
Figure 6. Zeta potential as a function of pH for the pure ethanol suspension and with the addition of different vol % of chitosan polyelectrolyte, containing 0.05 g of PEEK 708 (a) and 0.02 g of Si3N4 (b).
Coatings 09 00530 g006
Figure 7. Agglomerates of Si3N4 nanoparticles adsorbed on the surface of large PEEK 708 micro-particles, as per TEM.
Coatings 09 00530 g007
Figure 8. Chitosan molecules and chains adsorbed on PEEK 708 particles (a) and Si3N4 nanoparticles (b), as per TEM.
Coatings 09 00530 g008
Figure 9. Macroscopic images of coatings deposited at the voltage of 40 V (a), 60 V (b) and 90 V (c), and a constant time of 90 s.
Coatings 09 00530 g009
Figure 10. The relationships between deposition yield vs. deposition time (a) and deposition rate vs. deposition time (b) at a constant voltage of 90 V.
Coatings 09 00530 g010
Figure 11. The relationship between deposition yield and voltage at a constant deposition time of 90 s.
Coatings 09 00530 g011
Figure 12. Microstructure of as-deposited Si3N4/PEEK 708 coatings, as per the SEM plan-view specimen.
Coatings 09 00530 g012
Figure 13. Microstructure of Si3N4/PEEK 708 coatings after heating at 390 °C for 40 min and cooling with a furnace (a) and in water at room temperature (RT) (b), as per SEM plan-view specimens.
Coatings 09 00530 g013
Figure 14. XRD patterns of Si3N4/PEEK 708 coatings after heating at 390 °C for 40 min and cooling with a furnace (a) and in water at RT (b).
Coatings 09 00530 g014
Figure 15. Microstructure of the Si3N4/PEEK 708 coating on the Ti-6Al-4V alloy after heat treatment observed in the area close to the coating surface (a) and in the area of the coating approx. 10 μm from the coating surface (b), as per TEM. The EDS spectrum taken from the area marked in Figure 15b is shown as an insert in Figure 15b. The Cu present in the spectrum was generated from the lamellae holder and TEM sample holder. The Fe and Cr peaks generated from the pole piece of the microscope lens are also visible.
Coatings 09 00530 g015
Figure 16. Surface topography images of the semi-crystalline (a) and amorphous (b) Si3N4/PEEK 708 coatings, as per AFM.
Coatings 09 00530 g016
Figure 17. Scratch tracks of the semi-crystalline (a) and amorphous (b) Si3N4/PEEK 708 coatings on the Ti-6Al-4V alloy, as per SEM.
Coatings 09 00530 g017
Figure 18. Coefficient of friction of the semi-crystalline (1) and amorphous Si3N4/PEEK 708 (2) coatings against the Al2O3 ball at RT.
Coatings 09 00530 g018
Figure 19. Worn tracks of the semi-crystalline (a) and amorphous (b) Si3N4/PEEK 708 coatings after the wear test at RT, as per SEM.
Coatings 09 00530 g019
Table 1. The chemical composition of the Ti-6Al-4V alloy, manufacturer’s data.
ElementContent (wt %)
MinimumMaximum
Al6.126.15
V3.904.00
Fe0.170.18
N0.010.01
C0.030.03
O0.110.12
H0.0040.005
Y0.00200.0021
TiBalance
Table 2. Selected surface topography parameters of the semi-crystalline and amorphous Si3N4/PEEK 708 coatings.
ParameterSemi-Crystalline CoatingAmorphous Coating
Value
Rq125.5 ± 26.615.4 ± 6.2
Ra100.7 ± 20.511.9 ± 4.5
Rmax829.1 ± 264.6125.3 ± 45.1
ISAD16.9 ± 5.10.06 ± 0.03

