3.1. Cr–C, Cr–C/Ni and Cr–C/Cu Electrodeposition
Figure 1a,b shows cross-sectional micrographs of the non-heated and heat-hardened Cr–C- coated samples. Some through-coating cracks with a width of 1 μm were found in the non-heated Cr–C coating. As shown in
Figure 1b, the crack width in the Cr–C coating is about 5 μm after flame-heating for 1 s, although the hardness of the Cr–C coating can be remarkablely increased from 650 to 1600 HV [
19,
20]. That is, the cracks in the non-heated Cr–C coating tend to become wider after flame heating for 1 s. In the non-heated Cr–C coating, a few through-coating cracks were also found, which could possibly act as active corrosive paths by exposing the steel substrate to a corrosive environment [
15]. Based on the results of our previous work [
22], the corrosion resistance of hexavalent Cr-coated steel is not affected by the cracks developed in the hexavalent Cr coating because the cracks do not penetrate through the Cr coating after electrodeposition. Because the through-coating cracks in the Cr–C coating became wider obviously after flame heating for 1 s, it can be expected that the corrosion resistance of the heated Cr–C-coated sample would be insufficient.
In our previous work [
17], the corrosion resistance of a Cr–C–coated sample could be significantly improved by pre-electrodeposition of a soft metal undercoating on the steel substrate. This improvement was attributed to the thin or even nil cracks in the Cr–C coating that could be achieved by means of pre-electrodeposition a soft metal undercoating on the steel substrate. In this study, Ni or Cu is used as an undercoating on the steel substrate for subsequent a Cr-C electrodeposition. Cross-sectional micrographs of the non-heated and heat-hardened Cr–C/Ni- and Cr–C/Cu-coated samples are shown in
Figure 2 and
Figure 3, respectively. As expected, the cracks and crack density in the Cr–C coating were apparently reduced when a Ni or Cu undercoating was pre-electrodeposited on the steel substrate (see
Figure 2a and
Figure 3a). Apparently, some fine cracks, which are almost perpendicular to the undercoating, could be observed in the non-heated Cr–C coating. As shown in
Figure 2a, only few cracks propagated from the coating surface to the interface between the coating and the undercoating. That is, the cracks in the Cr–C/Ni-coated sample would probably provide active corrosion paths during an electrochemical corrosion test. The crack width in non-heated Cr–C/Ni-coated samples was about 0.5 μm. It must be noted that relatively thinner cracks and a lower crack density in the Cr–C coating could be observed when a Cu undercoating was pre-electrodeposited on the steel substrate. This lower crack density indicated that pre-electrodeposition of an undercoating of Ni or Cu could be expected to improve the corrosion resistance of Cr–C/Ni and Cr–C/Cu-coated steel samples. However, the cracks became broader after flame heating for 1 s (see
Figure 2b and
Figure 3b). It must be noted that the cracks in the Cr–C coating on the steel substrate without an undercoating are much wider than those with a Ni or Cu undercoating. The cracks in the heat-hardened Cr–C coating with a soft undercoating become slightly wider because a relatively low-tension stress was deduced from the constraint effect of the soft Cu or Ni undercoating [
23]. This indicates that the constraint effect of the soft undercoating can decrease the crack width in the Cr–C coating after flame heating. Moreover, this crack broadening implies that an increase in the surface hardness of a Cr–C-coated sample could possibly accompany a decrease in its corrosion resistance. To clarify the effect of undercoatings and flame heating on their corrosion resistance behaviour, non-heated and heat-hardened Cr–C/Ni- and Cr–C/Cu-coated samples were electrochemically tested in 0.1 M H
2SO
4 + 1 g/L NaCl solution.
3.2. Electrochemical Corrosion Test
Figure 4 shows the anodic polarisation curves of the non-heated and heat-hardened Cr–C, Cr–C/Ni- and Cr–C/Cu-coated samples in 0.1 M H
2SO
4 + 1 g/L NaCl solution. The anodic polarisation data is shown in
Table 2. The corrosion current densities of all Cr–C, Cr–C/Ni- and Cr–C/Cu-coated samples were lower than 2 × 10
−4 A·cm
−2. Conversely, a relatively high corrosion current density of ca. 4.38 × 10
−4 A·cm
−2 and an anodic current density were measured from the steel substrate. This indicates that the corrosion resistance of the steel substrate could be improved through electrodeposition a Cr–C, Cr–C/Ni- or Cr–C/Cu-coated. As shown in
Figure 4, the corrosion current density and the anodic current density of the Cr–C/Ni-coated sample were slightly smaller than those of the Cr–C-coated sample. The anodic current density of the Cr–C/Ni-coated sample was obviously increased after flame-heating for 1 s, indicating an obvious decrease in its corrosion resistance. Because the anodic polarisation behavior of prepared Cr–C-coated samples was potentiodynamically tested at a relatively high scan rate of 5 mV·s
−1, the electrochemical corrosion behavior of prepared coated samples cannot be fully recognized from their anodic polarisation cures. To realise the electrochemical corrosion behavior of prepared Cr–C-coated samples, the potentiostatic test will be further conducted. The anodic current densities of all of the coated samples increased with increasing anodic potential. Non-heated and heat-hardened Cr–C/Cu-coated samples had comparatively high electrochemical corrosion resistance. Their corrosion current densities were about 1 × 10
−5 A·cm
−2. Moreover, they had higher corrosion potentials by ca. −0.15 V compared to the Cr–C- and Cr–C/Ni-coated samples. As shown in
Figure 4, different corrosion potentials between Cr–C/Ni- and Cr–C/Cu-coated samples were measured. The Cr–C-coated steel samples with a Cu undercoating have apparently higher corrosion potentials than those with a Ni undercoating. This implies that the electrochemical corrosion behavior of Cr–C-coated steel samples could be affected by the Ni and Cu undercoatings. Obviously, when the scanning potential was over 0.5 V, the current density of non-heated and heat-hardened Cr–C/Cu-coated samples were dramatically increased. As shown in
Figure 4, the anodic polarisation behavior of prepared Cr–C-coated steel samples was determined by using apotentiodynamic test with a scan rate of 5 mV·s
−1, which is relatively high for the electrochemical corrosion test. It can be expected that a higher anodic current density could be measured with a high potential scan rate. The corrosion potentials among the Cr–C-coated samples can be well evaluated via the potentiodynamic test. To further study the electrochemical corrosion behaviour of the coated samples, anodic potentiostatic etching at 0 and 0.5 V was conducted, respectively.
Figure 5 shows the variation of anodic current densities in the Cr–C-, Cr–C/Ni- and Cr–C/Cu-coated samples during potentiostatic etching at 0 V in the 0.1 M H
2SO
4 + 1 g/L NaCl solution. As shown in
Figure 5, the anodic current density of the non-heated Cr–C-coated sample obviously increased from 0.0045 to 0.012 A·cm
−2 when the etching time was longer than 600 s. This increase in anodic current density showed that the Cr–C coating had no protective function when the potentiostatic etching period was longer than 600 s at 0 V. On the contrary, very low anodic current densities were observed from the non-heated and heat-hardened Cr–C/Cu-coated samples, whereas relatively high anodic current densities of 0.015 A·cm
−2 were observed from the non-heated and heat-hardened Cr–C/Ni-coated samples, suggesting that the Cr–C/Cu-coated samples had better electrochemical corrosion resistance at 0 V. This result is fully in agreement with the cross-sectional micrographs shown in
Figure 2, in which thinner cracks and a lower crack density in the non-heated and heat-hardened Cr–C coatings were observed when pre-electrodeposition of a Cu undercoating on the steel substrate was conducted. Otherwise, relatively high anodic current densities of the non-heated and heat-hardened Cr–C/Ni-coated samples may correspond to their anodic polarisation curves polarised at 0 V. The anodic current density of Cr–C/Ni-coated d samples significantly increased after flame-heating (see
Figure 4). This means that the electrochemical corrosion rate of heat-hardened Cr–C/Ni-coated steel sample could be higher than that of non-heated sample. This result is fully in agreement with the cross-sectional micrographs shown in
Figure 6.
Figure 6a–d shows the cross-sectional micrographs of the non-heated and heat-hardened Cr–C/Ni- and Cr–C/Cu-coated samples after potentiostatic etching at 0 V for 2 h. As shown in
Figure 6a, the Ni undercoating of the non-heated Cr–C/Ni-coated steel sample was preferentially etched at 0 V. As shown in
Figure 6a, the preferred etching sites of the Ni undercoating could be observed under the through-coating cracks in the Cr–C coating. The anodic current density of the heat-hardened Cr–C/Ni-coated sample was a little higher than that of the non-heated one, and delamination of the Cr–C coating of the heat-hardened Cr–C/Ni-coated sample was seen after potentiostatic etching at 0 V for 2 h, as shown in
Figure 6b. On the other hand, the cross-sections of the non-heated and heat-hardened Cr–C/Cu-coated samples seemed not to be corroded after potentiostatic etching at 0 V for 2 h, as shown in
Figure 6c,d. Therefore, the Cr–C/Cu-coated samples had better electrochemical corrosion resistance at 0 V in the 0.1 M H
2SO
4 + 1 g/L NaCl solution.
Figure 7a,b shows the variation of anodic current densities of the Cr–C, Cr–C/Ni- and Cr–C/Cu-coated steel samples during potentiostatic etching at 0.5 V. The variation of the anodic current density of the non-heated Cr–C-coated sample is also presented for comparison. As shown in
Figure 7a, very low anodic current densities (<1 × 10
−5 A·cm
−2) were measured from the non-heated and heat-hardened Cr–C/Ni-coated samples during potentiostatic etching at 0.5 V, whereas the current density of the non-heated Cr–C-coated sample was ca. 0.047 A·cm
−2, which was more than three-orders of magnitude as high as that of the Cr–C/Ni-coated samples. Thus, a low electrochemical corrosion rate of the Cr–C/Ni-coated samples was seen at 0.5 V, although their anodic current densities, or electrochemical corrosion rates, were comparatively higher during potentiostatic etching at 0 V.
Figure 7b shows the variation of anodic current densities of the non-heated and heat-hardened Cr–C/Cu-coated samples during potentiostatic etching at 0.5 V. A high anodic current density of ca. 0.06 A·cm
−2 was measured from the heat-hardened Cr–C/Cu-coated sample when potentiostatic etching at 0.5 V was carried out for longer than 1200 s. This anodic current density was even higher than that of the Cr–C-coated sample, which had a lack of corrosion resistance, because of having many wide through-coating cracks in the Cr–C coating. An anodic current density of ca. 0.003 A·cm
−2 was measured from the non-heated Cr–C/Cu-coated sample during potentiostatic etching at 0.5 V.
From the results of potentiostatic etching at 0 and 0.5 V, the anodic corrosion resistance of the Cr–C/Cu-coated samples was much worse at 0.5 V than at 0 V; on the other hand, the anodic corrosion resistance of the Cr–C/Ni-coated samples was much better at 0.5 V than at 0 V, implying that the electrochemical corrosion behaviour of Cr–C-coated samples depends strongly on the anodic polarisation potential applied and on the undercoating used.
Figure 8a–d shows the cross-sectional micrographs of Cr–C/Ni- and Cr–C/Cu-coated samples after two-hour potentiostatic etching at 0.5 V. As expected, the non-heated and heat-hardened Cr–C/Ni-coated samples were not etched and had better electrochemical corrosion resistance (see
Figure 8a,b). On the contrary, the obviously etched Cu undercoatings of the non-heated and heat-hardened Cr–C/Cu-coated samples were evident after two-hour potentiostatic etching at 0.5 V, as shown in
Figure 8c,d. It can be clearly seen that the etched sites on the Cu undercoating were preferentially beneath the through-coating cracks in the Cr–C coating, as shown in
Figure 8c. This electrochemical corrosion behaviour of the Cu undercoating was almost identical to that of the Ni undercoating polarised at 0 V. As shown in
Figure 8d, the Cu undercoating and the steel substrate of the heat-hardened Cr–C/Cu-coated steel sample were severely etched after two-hour potentiostatic etching at 0.5 V. The Cu undercoating was almost etched out; on the other hand, the Cr–C coating was only slightly etched after potentiostatic etching at 0.5 V.
From the anodic polarisation data shown in
Table 2, the corrosion potentials of the Cr–C/Cu-coated samples were ca. −0.15 V, which were higher than those of the Cr–C/Ni-coated samples at ca. −0.37 V, indicating that the anodic polarisation behaviour of the Cr–C/Cu- and Cr–C/Ni-coated samples was affected by the Ni and Cu undercoatings. The results of the potentiostatic etching at 0 and 0.5 V demonstrate the effect of the Cu and Ni undercoatings on the electrochemical corrosion behaviour of Cr–C-coated samples. Upon potentiostatic etching at 0 V, the Ni undercoating was preferentially corroded at sites beneath the through-coating cracks of the Cr–C coating, whereas the Cr–C/Cu-coated samples had a better electrochemical corrosion resistance at 0 V. After potentiostatic etching at 0.5 V, the Cu undercoating was preferentially corroded, but a better electrochemical corrosion resistance was measured from the Cr–C/Ni-coated samples. It must be noted that the Cr–C coating was almost not corroded during potentiostatic etching at both 0 and 0.5 V. The preferred etching sites were found on the Ni or Cu undercoating beneath the through-coating cracks in the Cr–C coating. This means that these through-coating cracks provide active corrosion paths to the Ni or Cu undercoatings during potentiostatic etching. Moreover, the Cr–C coating seemed to be passivated during the potentiostatic etching. Although thinner cracks and a lower crack density of the Cr–C coating were achieved by using a Ni or Cu undercoating, few through-coating cracks existed in the Cr–C coating. This was determined from observation of the etched Ni undercoating at 0 V and the etched Cu undercoating at 0.5 V, where the corrosive sites of the undercoatings were located directly under the through-coating cracks in the Cr–C coating.
3.3. Reduction Behaviour of Cu2+ Ions after Potentiostatic Etching
Figure 9a shows the surface morphology of the non-heated Cr–C/Cu-coated steel sample after potentiostatic etching for 2 h at 0.5 V in 0.1 M H
2SO
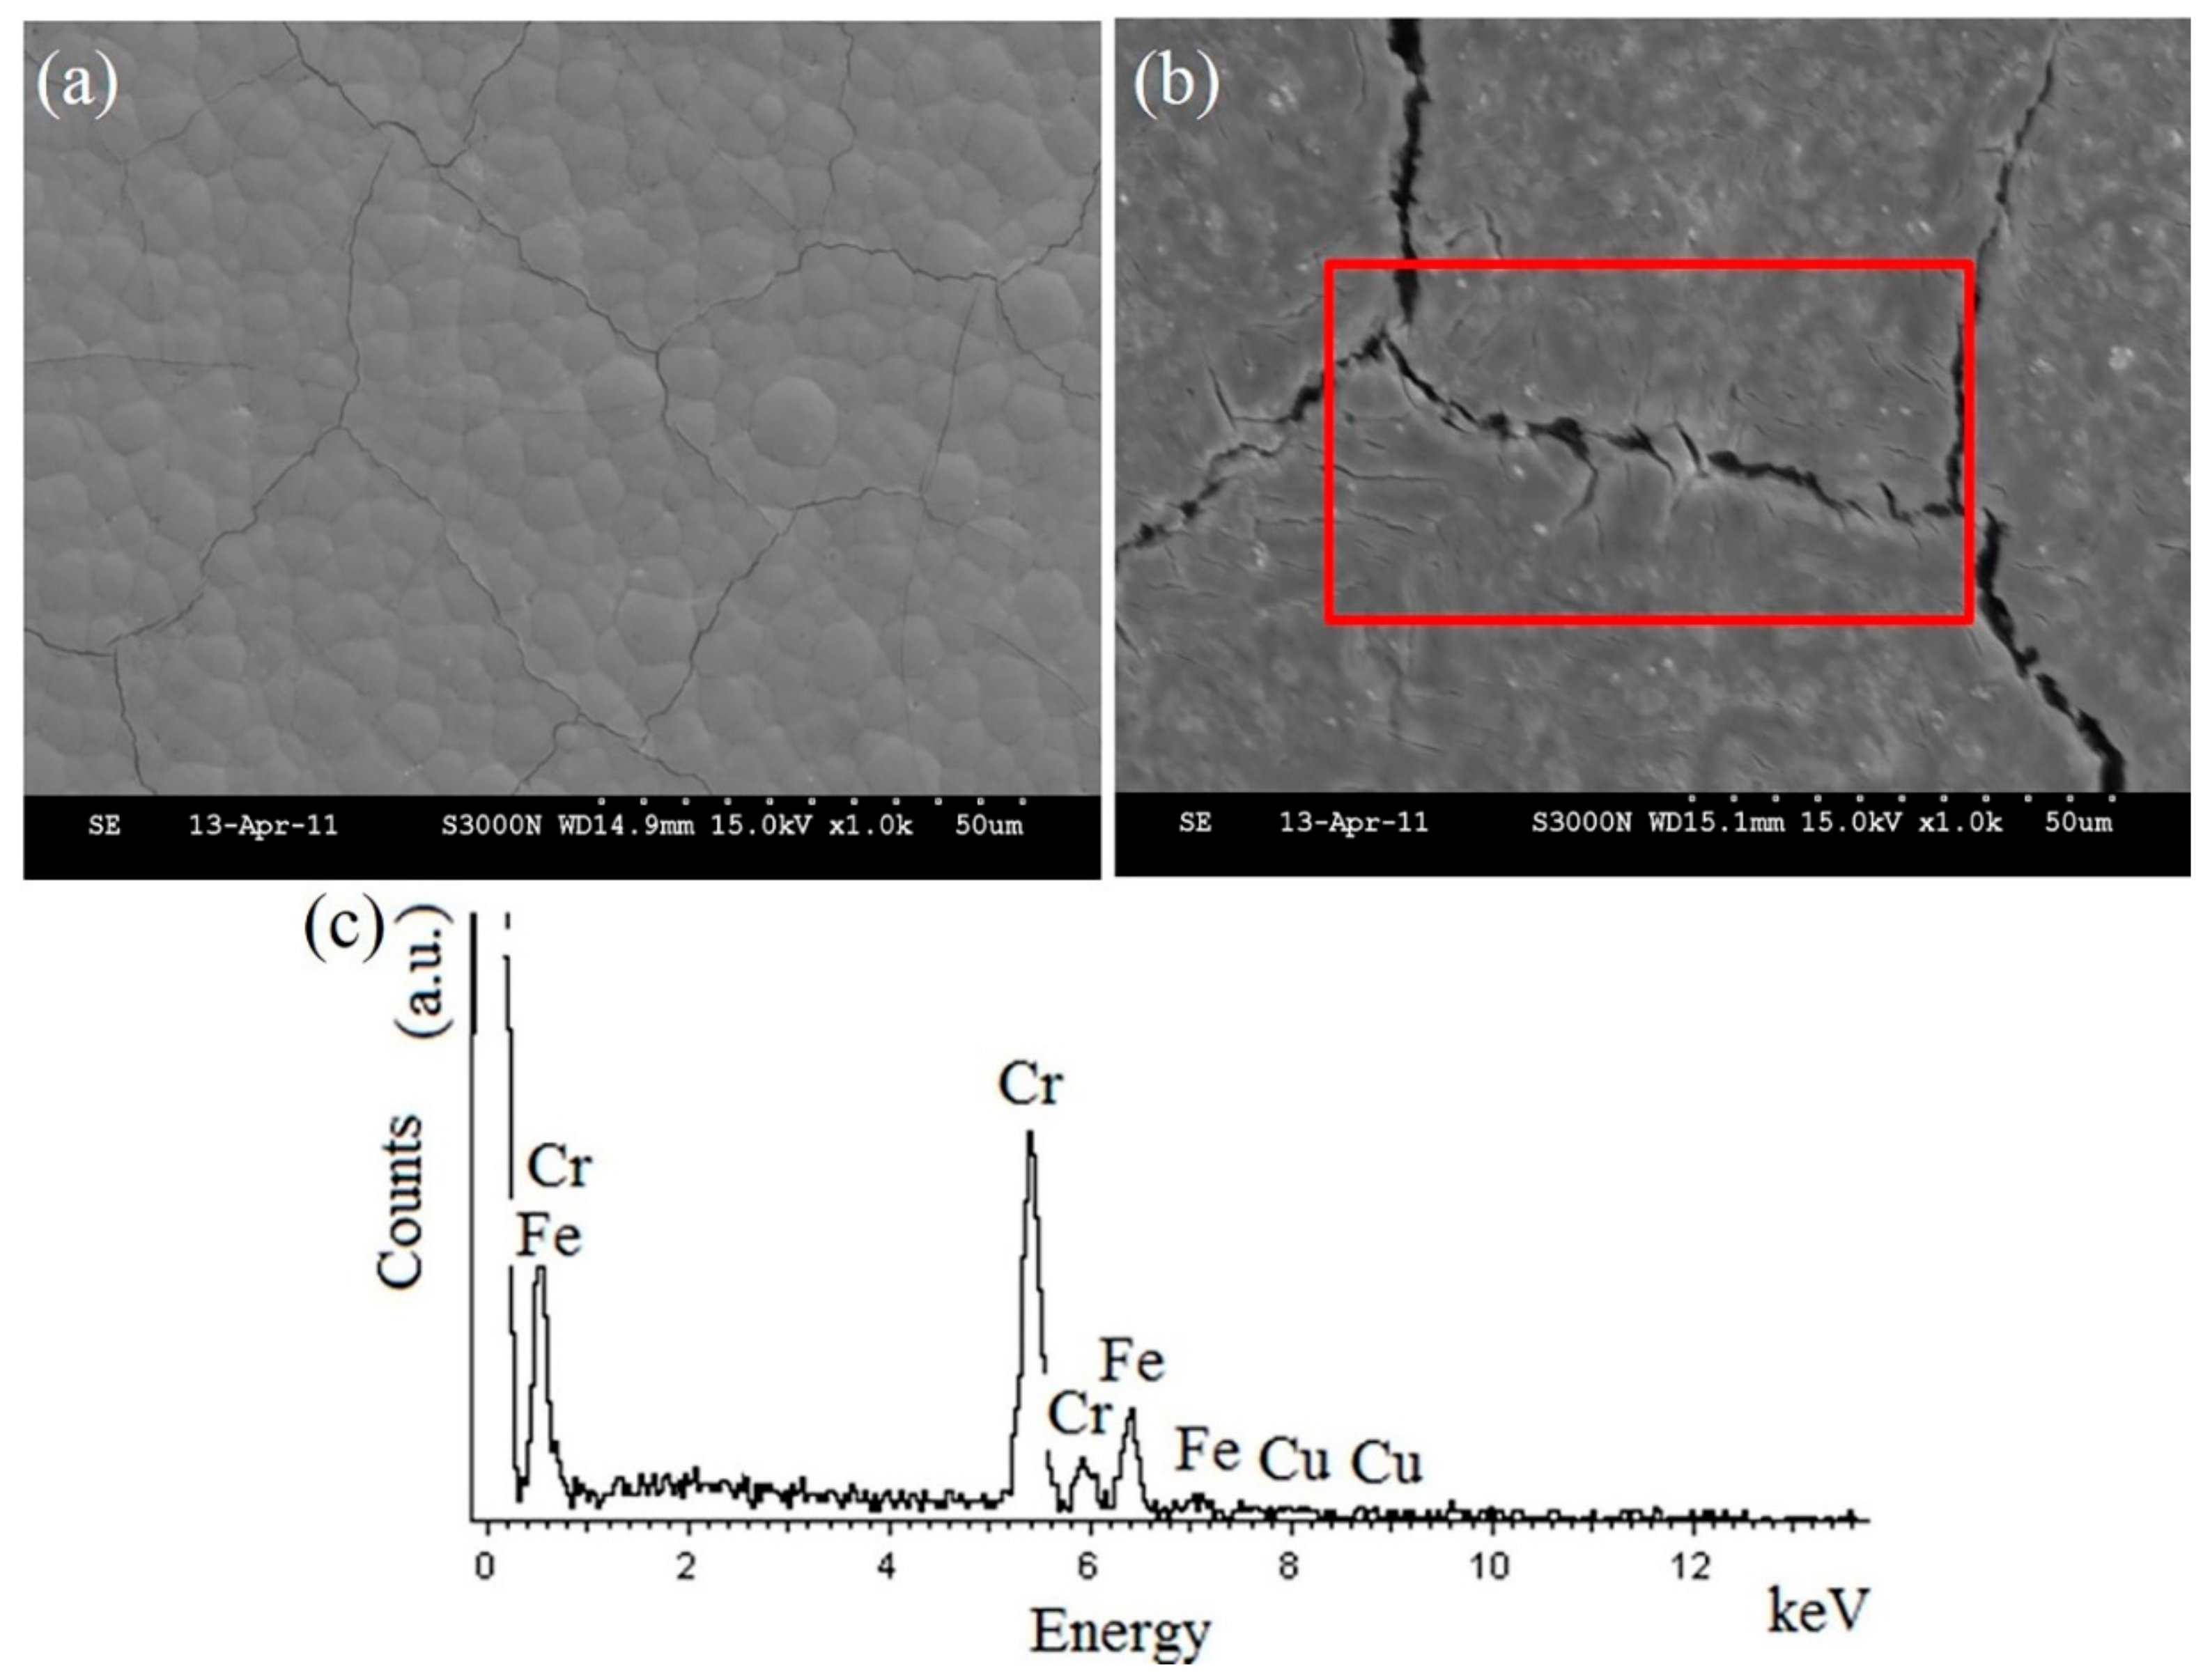
4 + 1 g/L NaCl solution. Although the Cu undercoating was obviously etched, the nodular surface of the Cr–C coating was not corroded or changed. This means that the electrochemical corrosion rate of the Cr–C coating was very low during the potentiostatic etching procedure at 0.5 V. Although its Cu undercoating was almost etched (see
Figure 8d), a slightly etched Cr–C coating of the heat-hardened Cr–C/Cu-coated sample was observed after potentiostatic etching for 2 h at 0.5 V. This etching was recognised from the surface morphology shown in
Figure 9b.
Figure 9c shows the results of EDS analysis of the surface of the heat-hardened Cr–C/Cu-coated sample after the potentiostatic etching procedure at 0.5 V. In addition to Cr, Fe and Cu were detected on the Cr–C coating, implying that a reduction of Cu and Fe ions occurs after the potentiostatic etching at 0.5 V.
As shown in
Figure 7, an obvious increase in the anodic current density of the heat-hardened Cr–C/Cu-coated sample was seen after 900 s. To study its anodic etching behaviour, two Cr–C/Cu-coated samples that had been potentiostatically etched at 0.5 V for 900 and 1200 s, respectively, were prepared for SEM observation. Their surface morphologies are shown
Figure 10a–d. Interestingly, nano-sized Cu coatings in a plane shape were observed adjacent to the cracks in the Cr–C coating after the potentiostatic etching at 0.5 V for 900 s, as shown in
Figure 10a,b. This pattern of Cu coatings indicated that highly concentrated Cu
2+ ions were in the vicinity of the wide cracks in the heat-hardened Cr–C coating. Based on the Nernst equation for evaluation of the reduction potential of Cu
2+ ions on a Cr–C coating, the more dissolution of the Cu undercoating that occurs, the higher the concentration of the Cu
2+ ions that exist, and the higher the reduction potential of the Cu
2+ ions becomes. Once the potentiostatic etching at 0.5 V was stopped, the highly concentrated Cu
2+ ions were directly reduced near wide cracks in the heat-hardened Cr–C coating surface. The same trend was recognised in the micrographs shown in
Figure 10c,d, where some Cu-coated clusters precipitated adjacent to the wide cracks in the heat-hardened Cr–C/Cu-coated steel sample after potentiostatic etching at 0.5 V for 1200 s. This suggests that these Cu coatings were developed through the reduction of dissolved Cu
2+ ions that concentrated within and adjacent to wide cracks in the heat-hardened Cr–C coating by dissolution of Cu undercoating. It should be noted that the Cu reduction phenomenon was not observed with the non-heated Cr–C/Cu-coated sample after 2 h of potentiostatic etching at 0.5 V (see
Figure 9a), although a severe attack of Cu coatings was found. This attack could possibly be attributed to the relatively low concentration of dissolved Cu
2+ ions or thin cracks in the Cr–C coating.
According to the law of charge conservation for an electrochemical process, a reduction reaction of Cu2+ ions must accompany an electrochemical corrosion reaction of the Cr–C substrate. Some exposed places on the Cr–C coating surface must have dissolved and provided electrons near the dissolved places for the reduction of Cu2+ ions when the potentiostatic etching procedure at 0.5 V was stopped. To study the deposition behaviour of Cu ions on the heat-hardened Cr–C/Cu-coated sample, an immersion test was conducted with the non-heated and heat-hardened Cr–C/Cu-coated samples after potentiostatic etching at 0.5 V for 900 s. The Cr–C/Cu-coated steel samples were flushed with deionised water for ca. 20 s and then immersed in a 200 g/L CuSO4·5H2O + 70 g/L H2SO4 solution at 30 °C. Furthermore, a non-heated Cr–C/Cu-coated sample without potentiostatic etching at 0.5 V was also immersed in this solution to study the reduction behaviour of Cu2+ ions, and the results were compared with those of the two samples mentioned above. The acidic immersion solution had a high concentration of Cu2+ ions, which would react with the Cu-coated Cr–C surface during immersion. Therefore, the variation of open-circuit potential was measured during the immersion test and observed afterwards on the sample surfaces to study the reduction behavior of the Cu2+ ions.
Figure 11 shows the variation of the open-circuit potentials of all Cr–C/Cu-coated samples in the immersion solution. The open-circuit potential of the pre-etched heat-hardened Cr–C/Cu-coated sample increased from 0.1 to ca. 0.32 V when the immersion period was longer than 60 s. This suggests that the surface of the heat-hardened Cr–C/Cu-coated sample after potentiostatic etching at 0.5 V has a lot of corrosion products, which were composed of copper and iron. Those corrosion products become a nucleation site for Cu
2+ ions to reduce on the surface of the pre-etched, heat-hardened Cr–C/Cu-coated sample during the immersion test. Conversely, after 900 s of potentiostatic etching at 0.5 V, the non-heated Cr–C/Cu-coated sample had a relatively low and stable open-circuit potential of ca. 0.06 V during the immersion test. The open-circuit potential of the non-heated Cr–C/Cu-coated sample without potentiostatic etching, slowly decreased from 0.05 to 0.02 V at the start of the 100-s immersion period and then, afterwards, remained at 0.02 V. The results of the immersion test showed that the open-circuit potential of the heat-hardened Cr–C/Cu-coated sample, which potentiostatically etched at 0.5 V for 900 s, could shift to a notable potential of 0.32 V, but the non-heated Cr–C/Cu-coated sample remained at a relatively active potential of 0.06 V when it was pre-etched at 0.5 V. The same trend was measured from the non-heated Cr–C/Cu-coated steel sample, from which an open-circuit potential of 0.02 V was detected.
Figure 12a–c shows the surface morphologies of the above-mentioned three samples after the immersion test. It can be clearly seen that the surface morphologies of non-heated Cr–C/Cu-coated samples with and without potentiostatic etching at 0.5 V were unchanged, although their open-circuit potentials were different during the immersion tests. No Cu coatings were observed on the surfaces of these two samples after the immersion test. On the contrary, after the immersion test, an obvious Cu layer was observed on the pre-etched heat-hardened Cr–C/Cu-coated steel sample. Moreover, more than 80% of the Cr coating surface was covered by a Cu layer, as shown in
Figure 12c. This means a reduction of Cu
2+ ions took place on the surface of the pre-etched heat-hardened Cr–C/Cu-coated sample during the immersion test. Because the reduction of Cu
2+ ions consumes electrons, electrochemical corrosion of the Cr–C surface possibly occurs to provide electrons for Cu deposition. This suggests that the Cr–C surface was no longer passivated when the Cu deposition took place. It should be noted that a Cu layer was not observed on the pre-etched non-heated Cr–C/Cu-coated sample, as its Cu undercoating was also corroded. A Cu layer was not found on the non-heated Cr–C/Cu-coated sample pre-etched at 0.5 V, which could be possibly be attributed to a lack of Cu nuclei on the non-heated Cr–C coating. Specifically, without Cu nuclei, the reduction of Cu
2+ ions is relatively difficult. On the other hand, a nano-sized Cu-coated Cr–C coating was observed on the heat-hardened Cr–C/Cu-coated sample potentiostatically etched at 0.5 V for 900 s (see
Figure 10a,b). The nano-sized Cu nuclei on the heat-hardened Cr–C/Cu-coated sample could provide a further reduction of Cu
2+ ions to overcome the surface energy needed for Cu nucleation.
Figure 13a–c shows the cross-sectional and surface micrographs of the pre-etched heat-hardened Cr–C/Cu-coated sample after an immersion test in 200 g/L CuSO
4·5H
2O + 70 g/L H
2SO
4 solution at 30 °C. Cu deposition within the cracks and adjacent to the cracks on the Cr–C coating were observed in
Figure 13a. Serious etching of the steel substrate of the heat-hardened Cr–C/Cu-coated sample was not found after potentiostatic etching at 0.5 V for 900 s; however, as shown in
Figure 13a,b, the Cu undercoating and the steel substrate were heavily corroded after the immersion test. This indicated that a reduction of Cu
2+ ions on the heat-hardened Cr–C coating led to further dissolution of the Cr and the steel substrate. As expected, the steel substrate had the highest active potential among the other coating elements. Once the Cu undercoating was thoroughly etched and part of the steel substrate was exposed to the immersion solution, the exposed steel surface preferentially corroded during the reduction of the Cu
2+ ions. That can be recognised from the results of the EDS analysis at position B shown in
Figure 13c, in which obvious Fe and Cu peaks were detected near the Cr–C coating cracks (see
Figure 13e). On the other hand, only Cu was detected at position A on the Cu-coated Cr–C coating (see
Figure 13d). This means the dissolution behaviour of the steel substrate is enhanced by reduction of the Cu
2+ ions.


