Article

Characterization of Biofilm Formation and Coating Degradation by Electrochemical Impedance Spectroscopy

1
Department of Civil and Environmental Engineering, Florida International University, Miami, FL 33174, USA
2
Florida Department of Transportation, Gainesville, FL 32609, USA
*
Author to whom correspondence should be addressed.
Coatings 2019, 9(8), 518; https://doi.org/10.3390/coatings9080518
Submission received: 27 July 2019 / Revised: 11 August 2019 / Accepted: 13 August 2019 / Published: 15 August 2019

Abstract

:
Recent findings showed severe localized corrosion of submerged steel bridge piles in a Florida bridge and was associated with microbial activity in the presence of marine foulers. Microbiologically influenced corrosion (MIC) can cause severe degradation of submerged steel infrastructure with the presence of biofilm associated with microorganisms such as sulfate reducing bacteria (SRB). Coatings have been developed to mitigate MIC and marine fouling. Coating degradation and disbondment can occur as a result of microbial attack due to the production of metabolites that degrade coating chemical and physical properties. In the work described here, electrochemical impedance spectroscopy (EIS) was conducted to identify microbial activity and degradation of an antifouling coating exposed to SRB-inoculated modified Postgate B solution. The measurements resulted in complicated impedance with multiple loops in the Nyquist diagram associated with the coating material, development of surface layers (biofilm), and the steel interface. Deconvolution of the impedance results and fitting to equivalent circuit analogs were made to identify coating characteristics and surface layer formation. EIS test results revealed coating degradation and subsequent formation of surface layers associated with SRB due to coating self-polishing and depletion of biocide components.

1. Introduction

For steel civil infrastructure, protective coatings (including organic and metallic coatings) can be applied to mitigate corrosion of the metal substrate by providing a barrier to the service environment [1]. Also, coating components such as active metallic layers or pigments can provide beneficial cathodic polarization of the steel substrate. In environments susceptible to marine fouling, biocides (i.e., titanium oxide and zinc oxide) may be incorporated to prevent attachment and growth of bacteria and fouling organisms. The biocides would also inherently be beneficial to mitigate growth of bacteria associated with microbially influenced corrosion, MIC. In the former case, the settlement and growth of marine fouling organisms is influenced by the environmental conditions and there is indication that the initial presence of biofilms are required before the settlement of marine fouling organisms [2,3,4,5]. Biofilm development from certain bacteria can allow for the development of microbially influenced corrosion (MIC) [6]. The biofilm can influence the corrosion process either by creating oxygen differential aeration cells or generating acidic substances and cathodic reactant depending on the type of bacteria. Sulfate-reducing bacteria (SRB) has received much attention in the study of MIC of steel developed in natural waters [6,7,8]. As identified in recent work, the presence of marine fouling of submerged steel bridge piles can exacerbate MIC [9,10,11,12]. Application of a commercially available antifouling coating (that contains both antifouling and anti-bacterial components) was assessed in part to identify strategies to mitigate marine fouling that promote MIC [9]. Work to characterize the mechanisms, to which antifouling coatings can degrade and allow subsequent biofilm development and to which MIC can develop, by the application of electrochemical impedance spectroscopy (EIS), was undertaken.
EIS has been widely used to evaluate the condition and degradation of coatings applied on steel. Application of EIS for polymeric coatings include efforts to identify water absorption, coating holiday defects, and coating disbondment [13,14,15,16]. Potentiostatic EIS measurements over a wide range of perturbation frequencies can identify the electrical characteristics associated with the coating material, steel substrate, surface films, and surface polarizability. Identification of these characteristics provides information on the coating condition, its degradation, film development, and steel corrosion activity. Little and Mansfield, 1998, conducted EIS to identify the impact of MIC on the degradation of 12 protective coatings exposed to natural seawater in California and Florida [17]. The extent of coating disbondment was correlated to the breakpoint frequency, fb, by visual rating, ascribing fb = 1/(2πRC) where R and C were the resistive and capacitive impedance components of the coating. Also, for some data sets, the disbonded coating area was resolved by relating the time-dependent polarization resistance, Rp (Ω), to a specific surface polarization resistance (Ω·cm2). Other researchers [18,19,20,21] also used EIS to study the effect of MIC on coating durability by comparative assessment of total impedance, coating pore resistance, as well as polarization resistance in the presence of bacteria. In general, coated specimens with scratches, pinholes and holidays can be more susceptible to localized corrosion by bacteria colonization and higher bacteria activity can develop at defects due to attraction to the iron corrosion product.
In the work described here, EIS was conducted to identify microbial activity and degradation of an antifouling coating. The impedance response of a commercially-available water-based copper-free ablative antifouling coating with organic metal-free biocide (Econea: 4-bromo-2-(4-chlorophenyl)-5-(trifluoromethyl)-1H-pyrrole-3-carbonitrile [22]), ZnO, TiO2 and zinc pyrithione, applied on steel immersed in solutions inoculated with sulfate-reducing bacteria, was assessed to identify its efficacy to reduce bacterial growth as well as coating corrosion durability. Comparative testing with polyurea coated steel specimens were made as well.

2. Methodology

Testing was made on 6 antifouling-coated and 6 polyurea-coated steel coupons for 25 days. Each coated steel coupon (12.7 cm × 7.6 cm × 0.32 cm) with composition of 0.02% C, 0.16% Mn, 0.006% S and 0.03% Si, accommodated two test cells by placement of two separate cylindrical acrylic test vessels (diameter 5 cm) on the steel plate surface as shown in Figure 1. The steel surfaces were initially ground to a uniform 60 grit size (265 µ) finish prior to application of the coating. The commercially available water-based copper-free self-polishing antifouling coating consisted of a metal primer, two coats of a tie coat and one coat of the antifouling coating also incorporating biocides. The polyurea coated specimens had 2 coats applied by spray. The average coating thicknesses for antifouling and polyurea were 0.1–0.3 mm and 0.63–1.37 mm, respectively.
Experimental conditions for testing included SRB inoculation, de-aeration, and coating defects. Scribed samples with coating defects were made by drilling a 0.16 cm diameter hole in the middle of the specimen. Electrical connection to the steel coupon was made with a bolt stud mechanically tapped into the steel coupon. Activated titanium wire and saturated calomel (SCE) electrodes were used as reference electrodes. An activated titanium mesh was used as a counter electrode.
Test cells were filled with 80 mL of deionized water (DI) and 10 mL of modified Postgate B solution (Table 1) [23] and the pH of all test solutions was ~6.5–8 for the duration of testing. For the inoculated test conditions, 10 mL of inoculated Postgate B broth containing SRB cultures (previously isolated from water samples collected from the field) were used [24]. For de-aerated test conditions, high purity nitrogen gas was bubbled through the solution for 10 minutes on the first day and a thin layer of mineral oil was added. For naturally aerated-conditions, the head space above the test solution was open to the atmosphere. All test cells were fabricated with sterile components and test specimens were rinsed in deionized (DI) water and sterilized with ethanol solution prior to testing.
EIS measurements were made with a Reference 600 potentiostat and impedance analyzer (Gamry Instruments, Warminster, PA, USA). EIS was conducted at the open-circuit potential (OCP) condition with a 10 mV AC perturbation voltage from 1 MHz > f > 1 Hz to identify dielectric characteristics of the coating and interfacial characteristics of the steel. The impedance response would ideally elucidate coating degradation, steel corrosion rates, and the development of surface layers that may include biofilm and surface oxides. Microbial activity was assessed by sulfide production during testing as well as final sessile bacteria population at the end of the test. A hydrogen sulfide color disc test kit was used for the sulfide measurements. Biotechnology Solutions (Houston, TX, USA) sessile test kits (where sections of the coated steel specimens were swabbed at locations with visual surface films) were used for detection of sessile sulfate reducing bacteria by serial dilution in Modified Postgate B (MPB) following NACE standard TM0194-2014 [24].

3. Results and Discussion

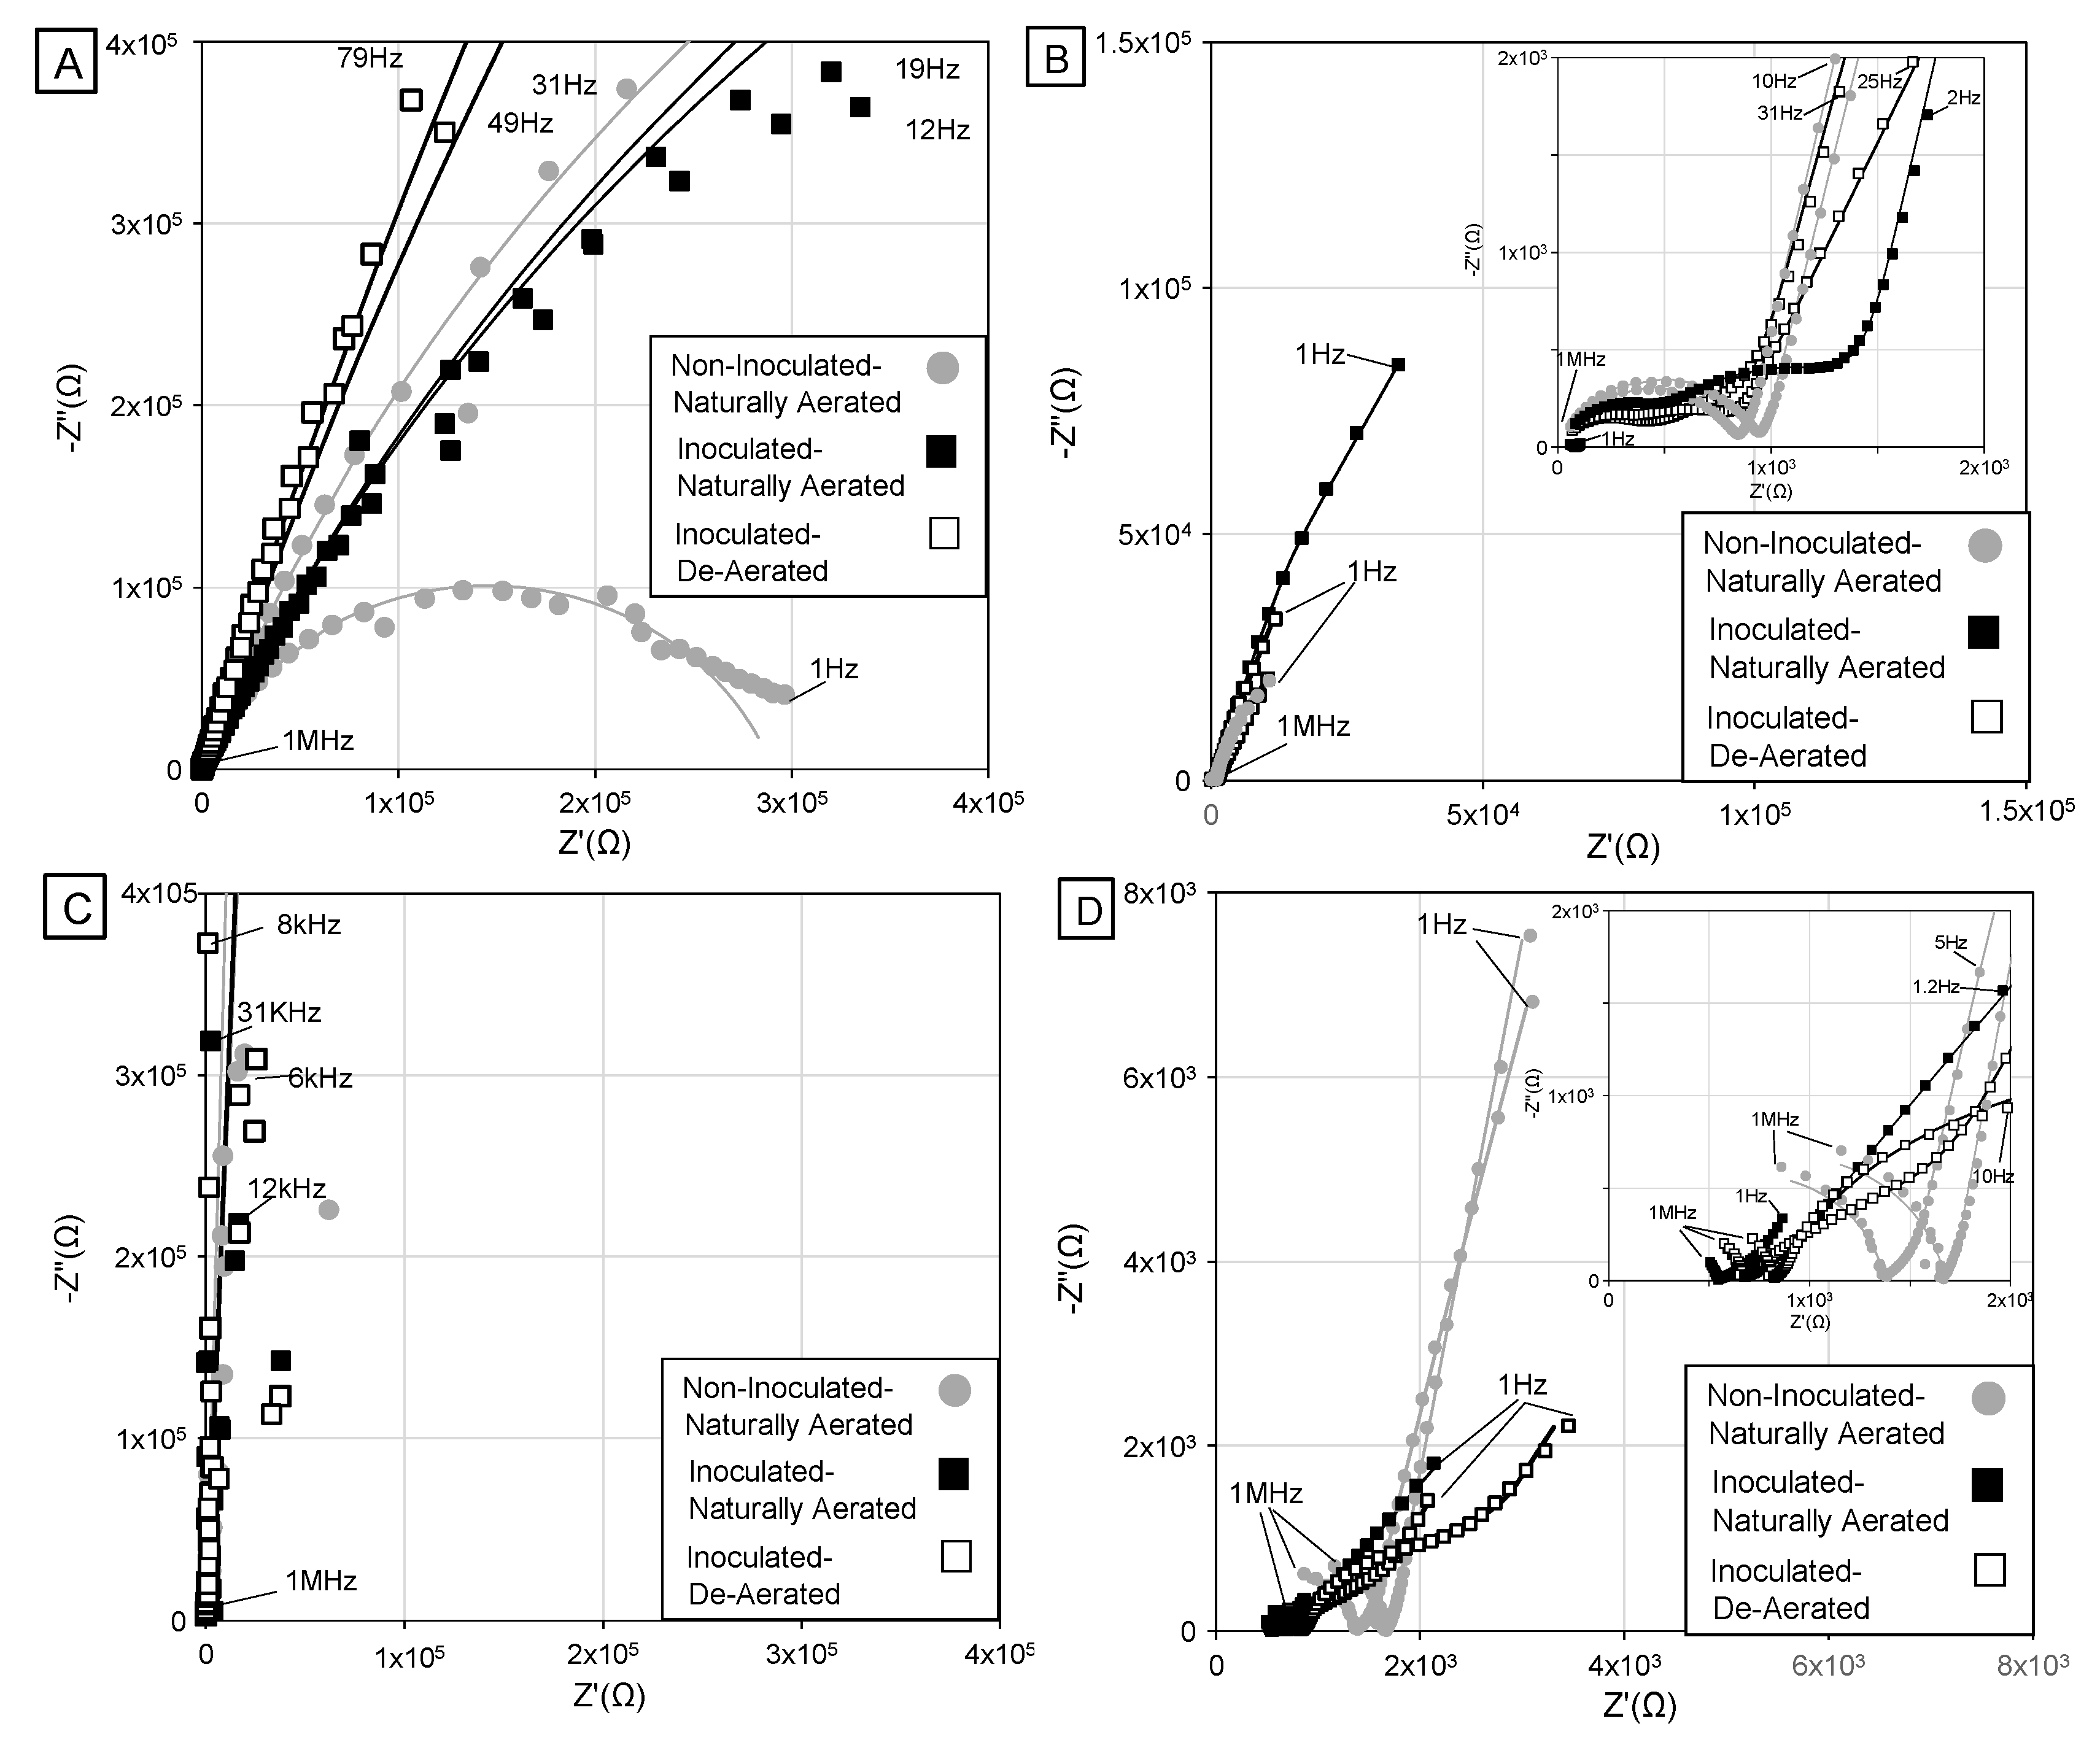
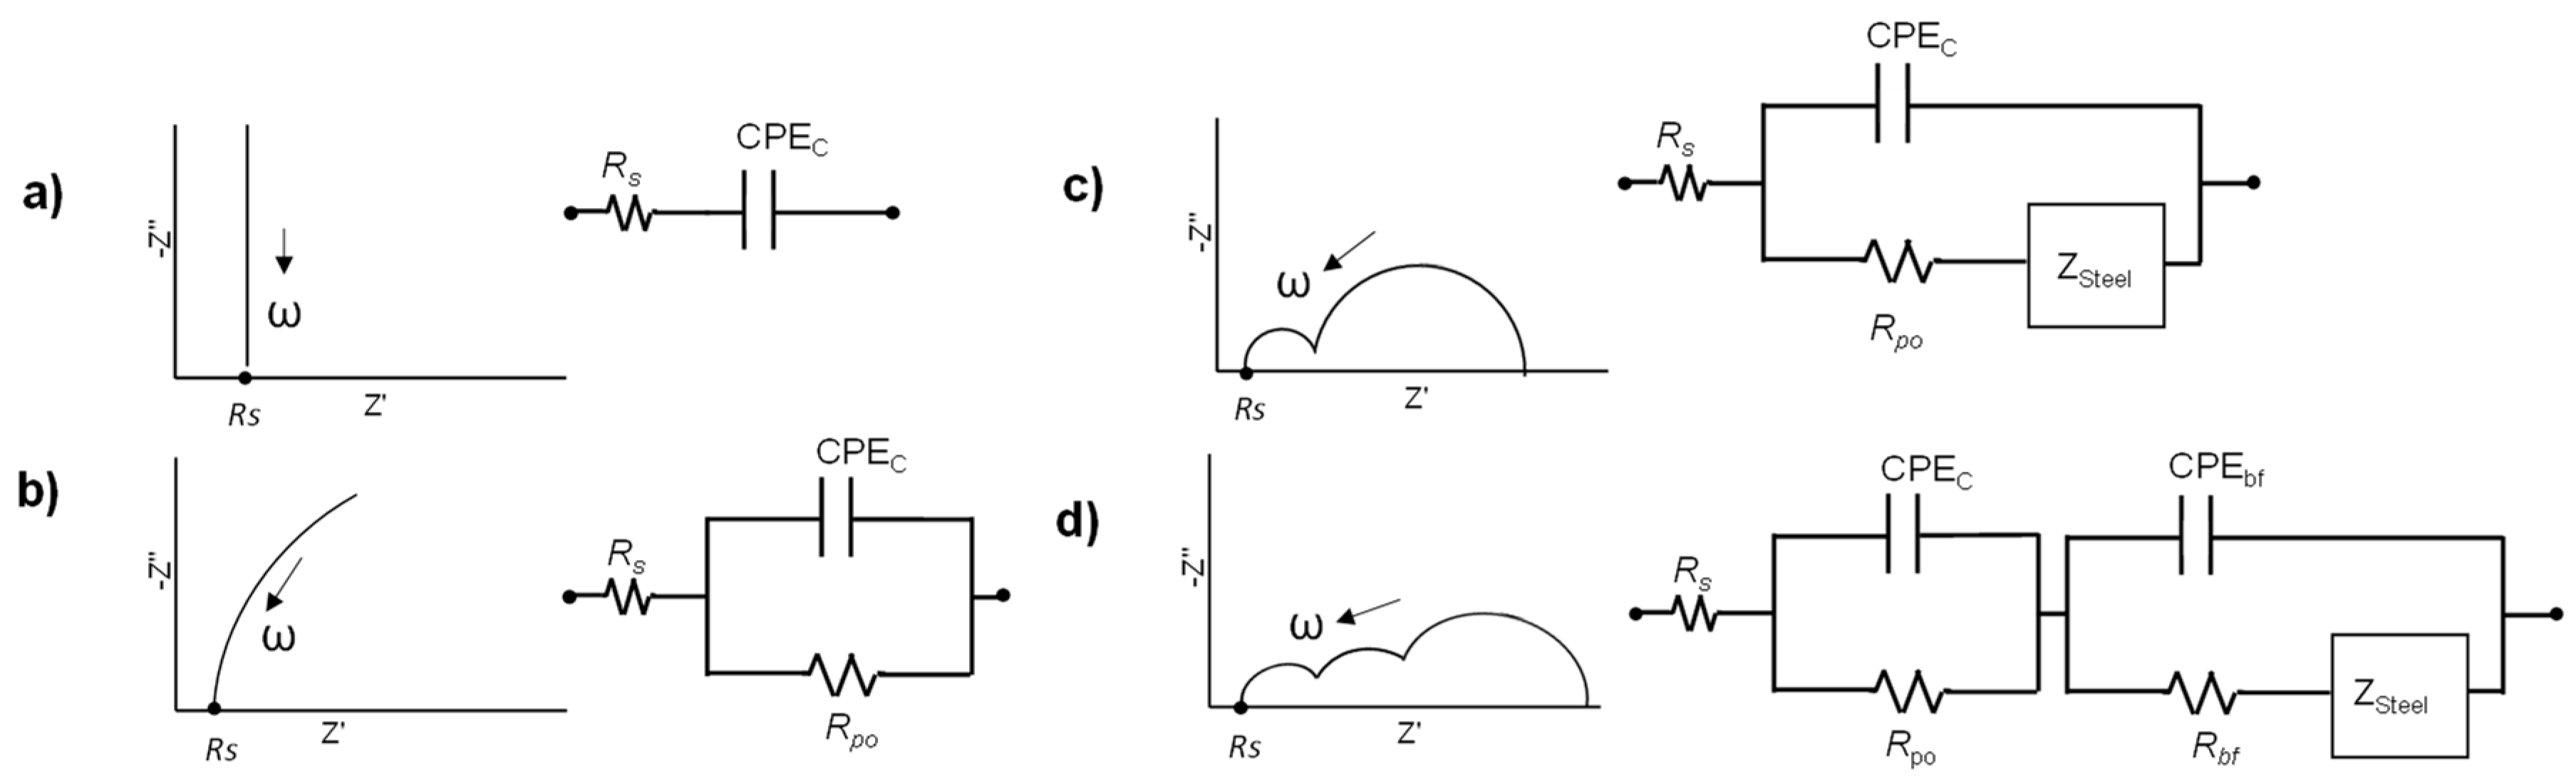
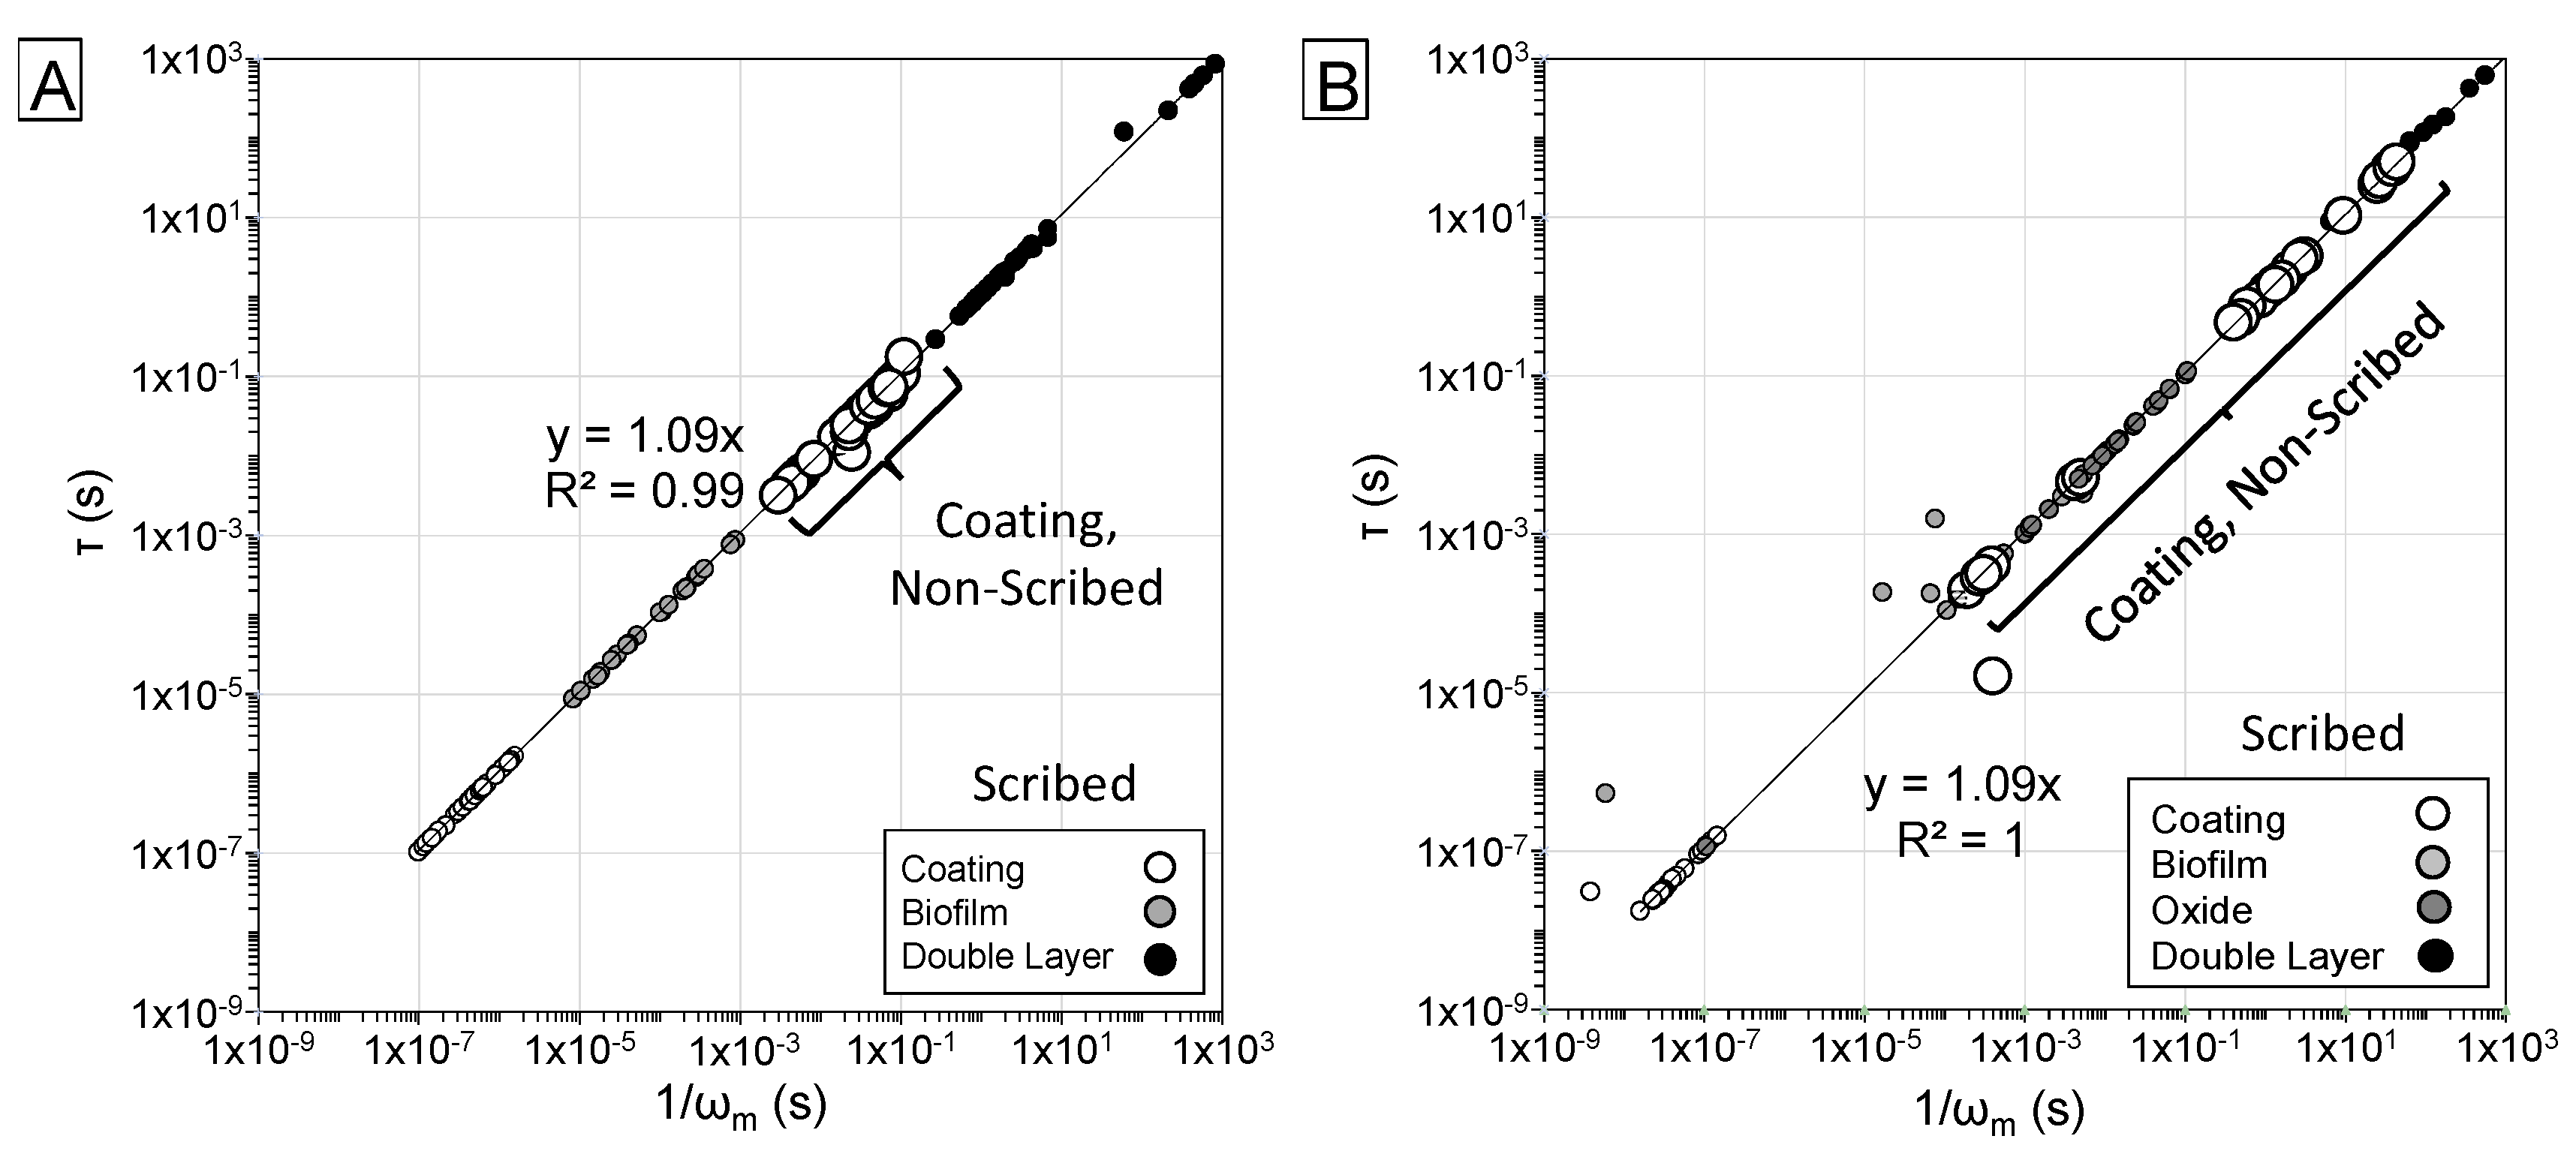
3.1. Overview of Impedance Response

The impedance data presented in Nyquist diagrams (Figure 2) generally showed varied responses that reflected the different surface and interfacial characteristics. One or more impedance loops characteristic of coated steel with varying levels of coating defects (possibly associated with coating degradation in presence of SRB growth and MIC) was evident, although was sometimes convoluted with the presence of multiple time constants.
Based on the results of EIS testing for the coated steel specimens exposed in solution, idealized coating conditions and equivalent circuit analogs were posited as shown in Figure 3. Defects in surface layers can be characterized by a resolved resistance term where the defects are typically idealized as a population of cylindrical pores. The electrical resistance of the defects, R, can be described by ohm’s Law in the form R = ρL/Apo where ρ is the resistivity of the medium within the defect, L is the length of the pore, and Apo is the pore area. This treatment has been commonly used to describe defects such as holidays in polymeric coatings and defines a pore resistance Rpo where L = d (coating thickness). Similar treatments can be used to describe other layers including porous biofilm (R = Rbf) and oxide layers (R = Rox) where L = t (thickness of the layer). All equivalent circuit analogs incorporated constant phase elements (CPE) with impedance Z = 1/Yo(jω)n where Yo is the pre-exponential admittance term and 0 < n < 1.
As shown in Figure 2, the equivalent circuit analogs were shown to adequately fit the experimental data during the test exposure in the research. In order to provide quantitative comparison of the impedance response, an approach following Hsu and Mansfield to estimate capacitive behavior was followed [25]. As shown in Figure 2, the complicated impedance response prohibited easy differentiation of time constants, τ, especially impedance behavior at intermediate frequencies. Due to the conflation of combined impedance responses of the various surface layers (and as proposed in Figure 3), the nested impedance time constants were computationally decoupled [26] by plotting the impedance of a parallel combination of separate capacitive and resistive components previously fitted as part of the proposed analog circuits. By doing so, the characteristic frequency where the imaginary impedance component associated with capacitance could be identified. The frequency associated with the maximum imaginary component of impedance, fm, could be isolated and capacitance was estimated by Equation (1).
C = Yo × (2πfm)n−1
An example of the decoupled impedance response for specimens showing three separate time constants is shown in Figure 4. Table A1 in the Appendix A, shows the resolved impedance parameters from equivalent circuit fitting, resolved fm, and calculated nominal capacitances for all test specimens at time 0 and 18 days for the antifouling-coated specimens and at time 4 and 26 days for the polyurea-coated specimens. The decoupled impedance resolved with the calculated capacitance showed that the associated phase angle was 45° at fm indicating that fm is the breakpoint frequency where C = 1/(2πfmR) and τ = 1/(2πfm).
As shown in Figure 5, fm for each time constant was shown to visually coincide with the breakpoint of capacitive and resistive behavior in the Bode plots as well as local maxima of −Z”, even for complicated impedance spectra with convoluted time constants. The calculation approach for capacitance and equivalent circuit fitting identified different and unique time constants (shown to be consistently proportional to 1/(2πfm) as shown in Figure 6) apparently relating to the various surface components described earlier. The calculation approach provided a useful means to compare admittances for the various time constants even when CPE n terms indicated non-ideal capacitive behavior (n as low as 0.3) such as for some cases of surface film development and the steel interface. Also, the effect of non-ideal current distribution due to coating degradation may be compared as well, especially to defects that may be induced by microbial activity as described later.
Figure 7 relates the impedance dispersion for antifouling- and polyurea-coated specimens with and without coating defects. τ values representative of the polymer coating was observed for the specimens without the intentional defect as expected, as impedance of the coating would dominate. On the other hand, distinct separation of time constants with characteristic behavior of polymeric coatings (at high frequencies) and the steel interface (low frequencies) as well as intermediate frequency dispersion was apparent for the specimens with coating defects. A separate time constant at an intermediate range (10−3 to 10−4 s−1) only developed in test conditions inoculated with SRB indicating the effect of microbial activity such as biofilm development or possible non-uniform polarization due to the presence and activity of the microbes.

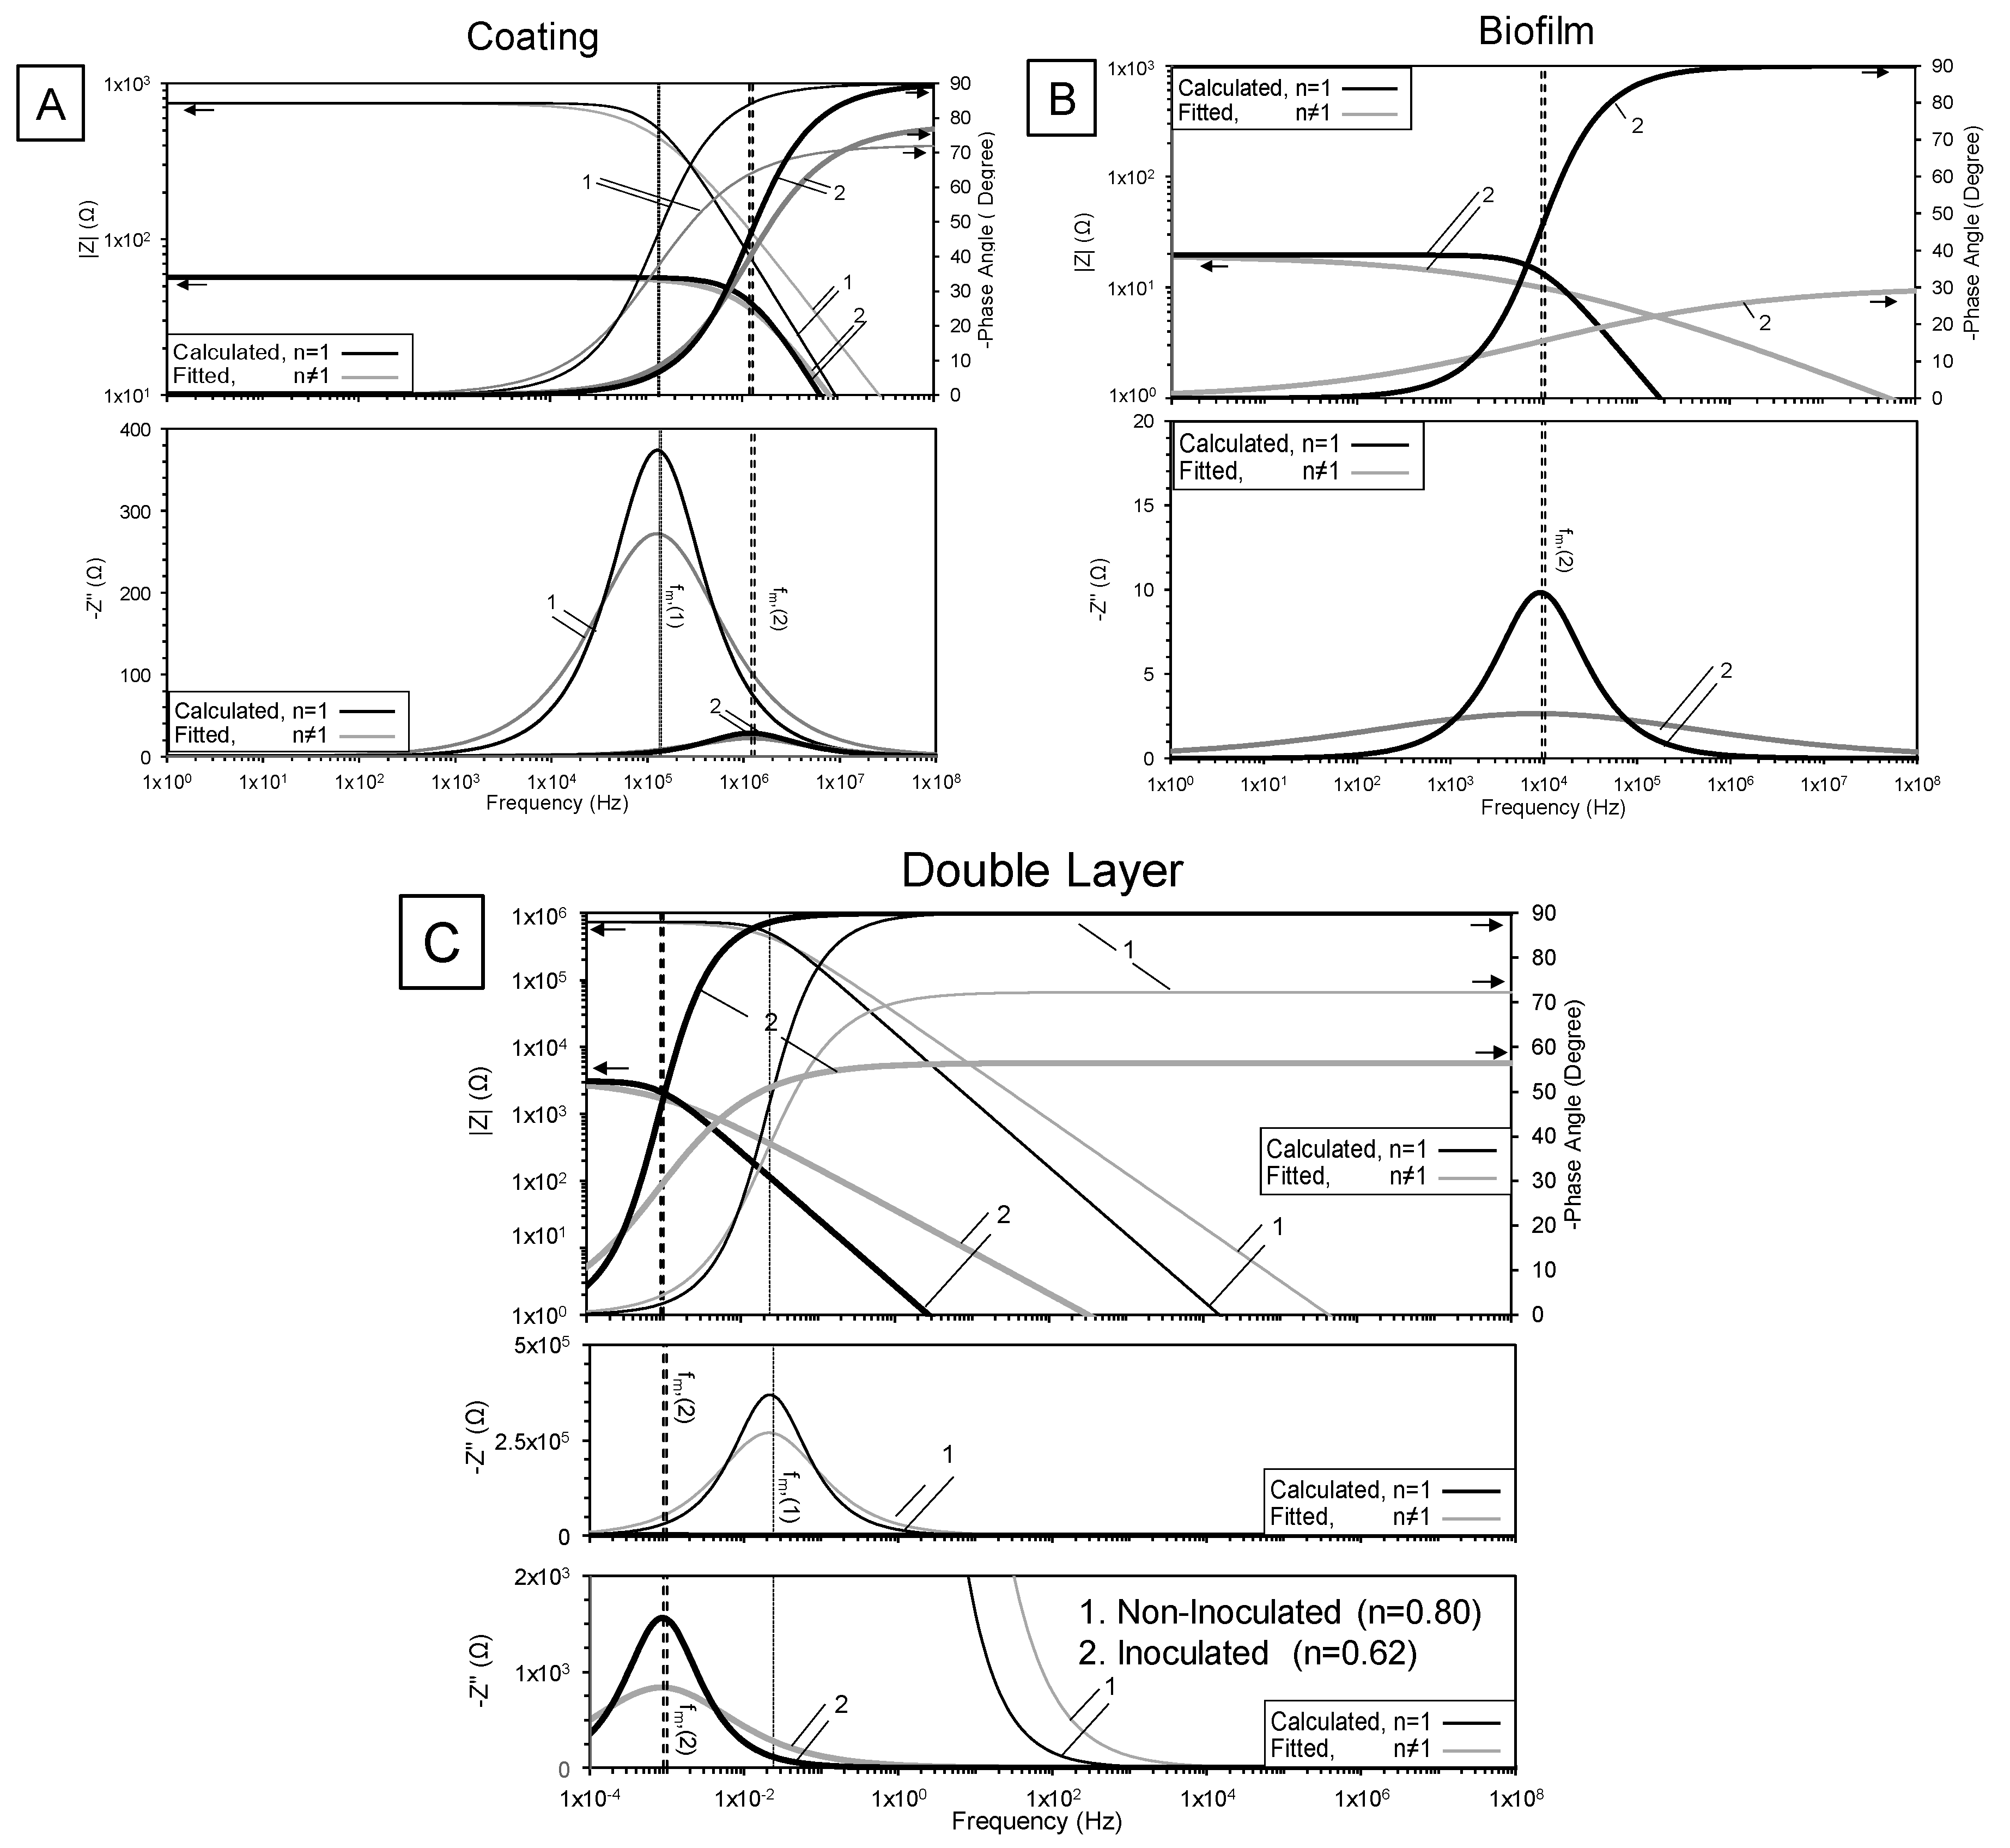
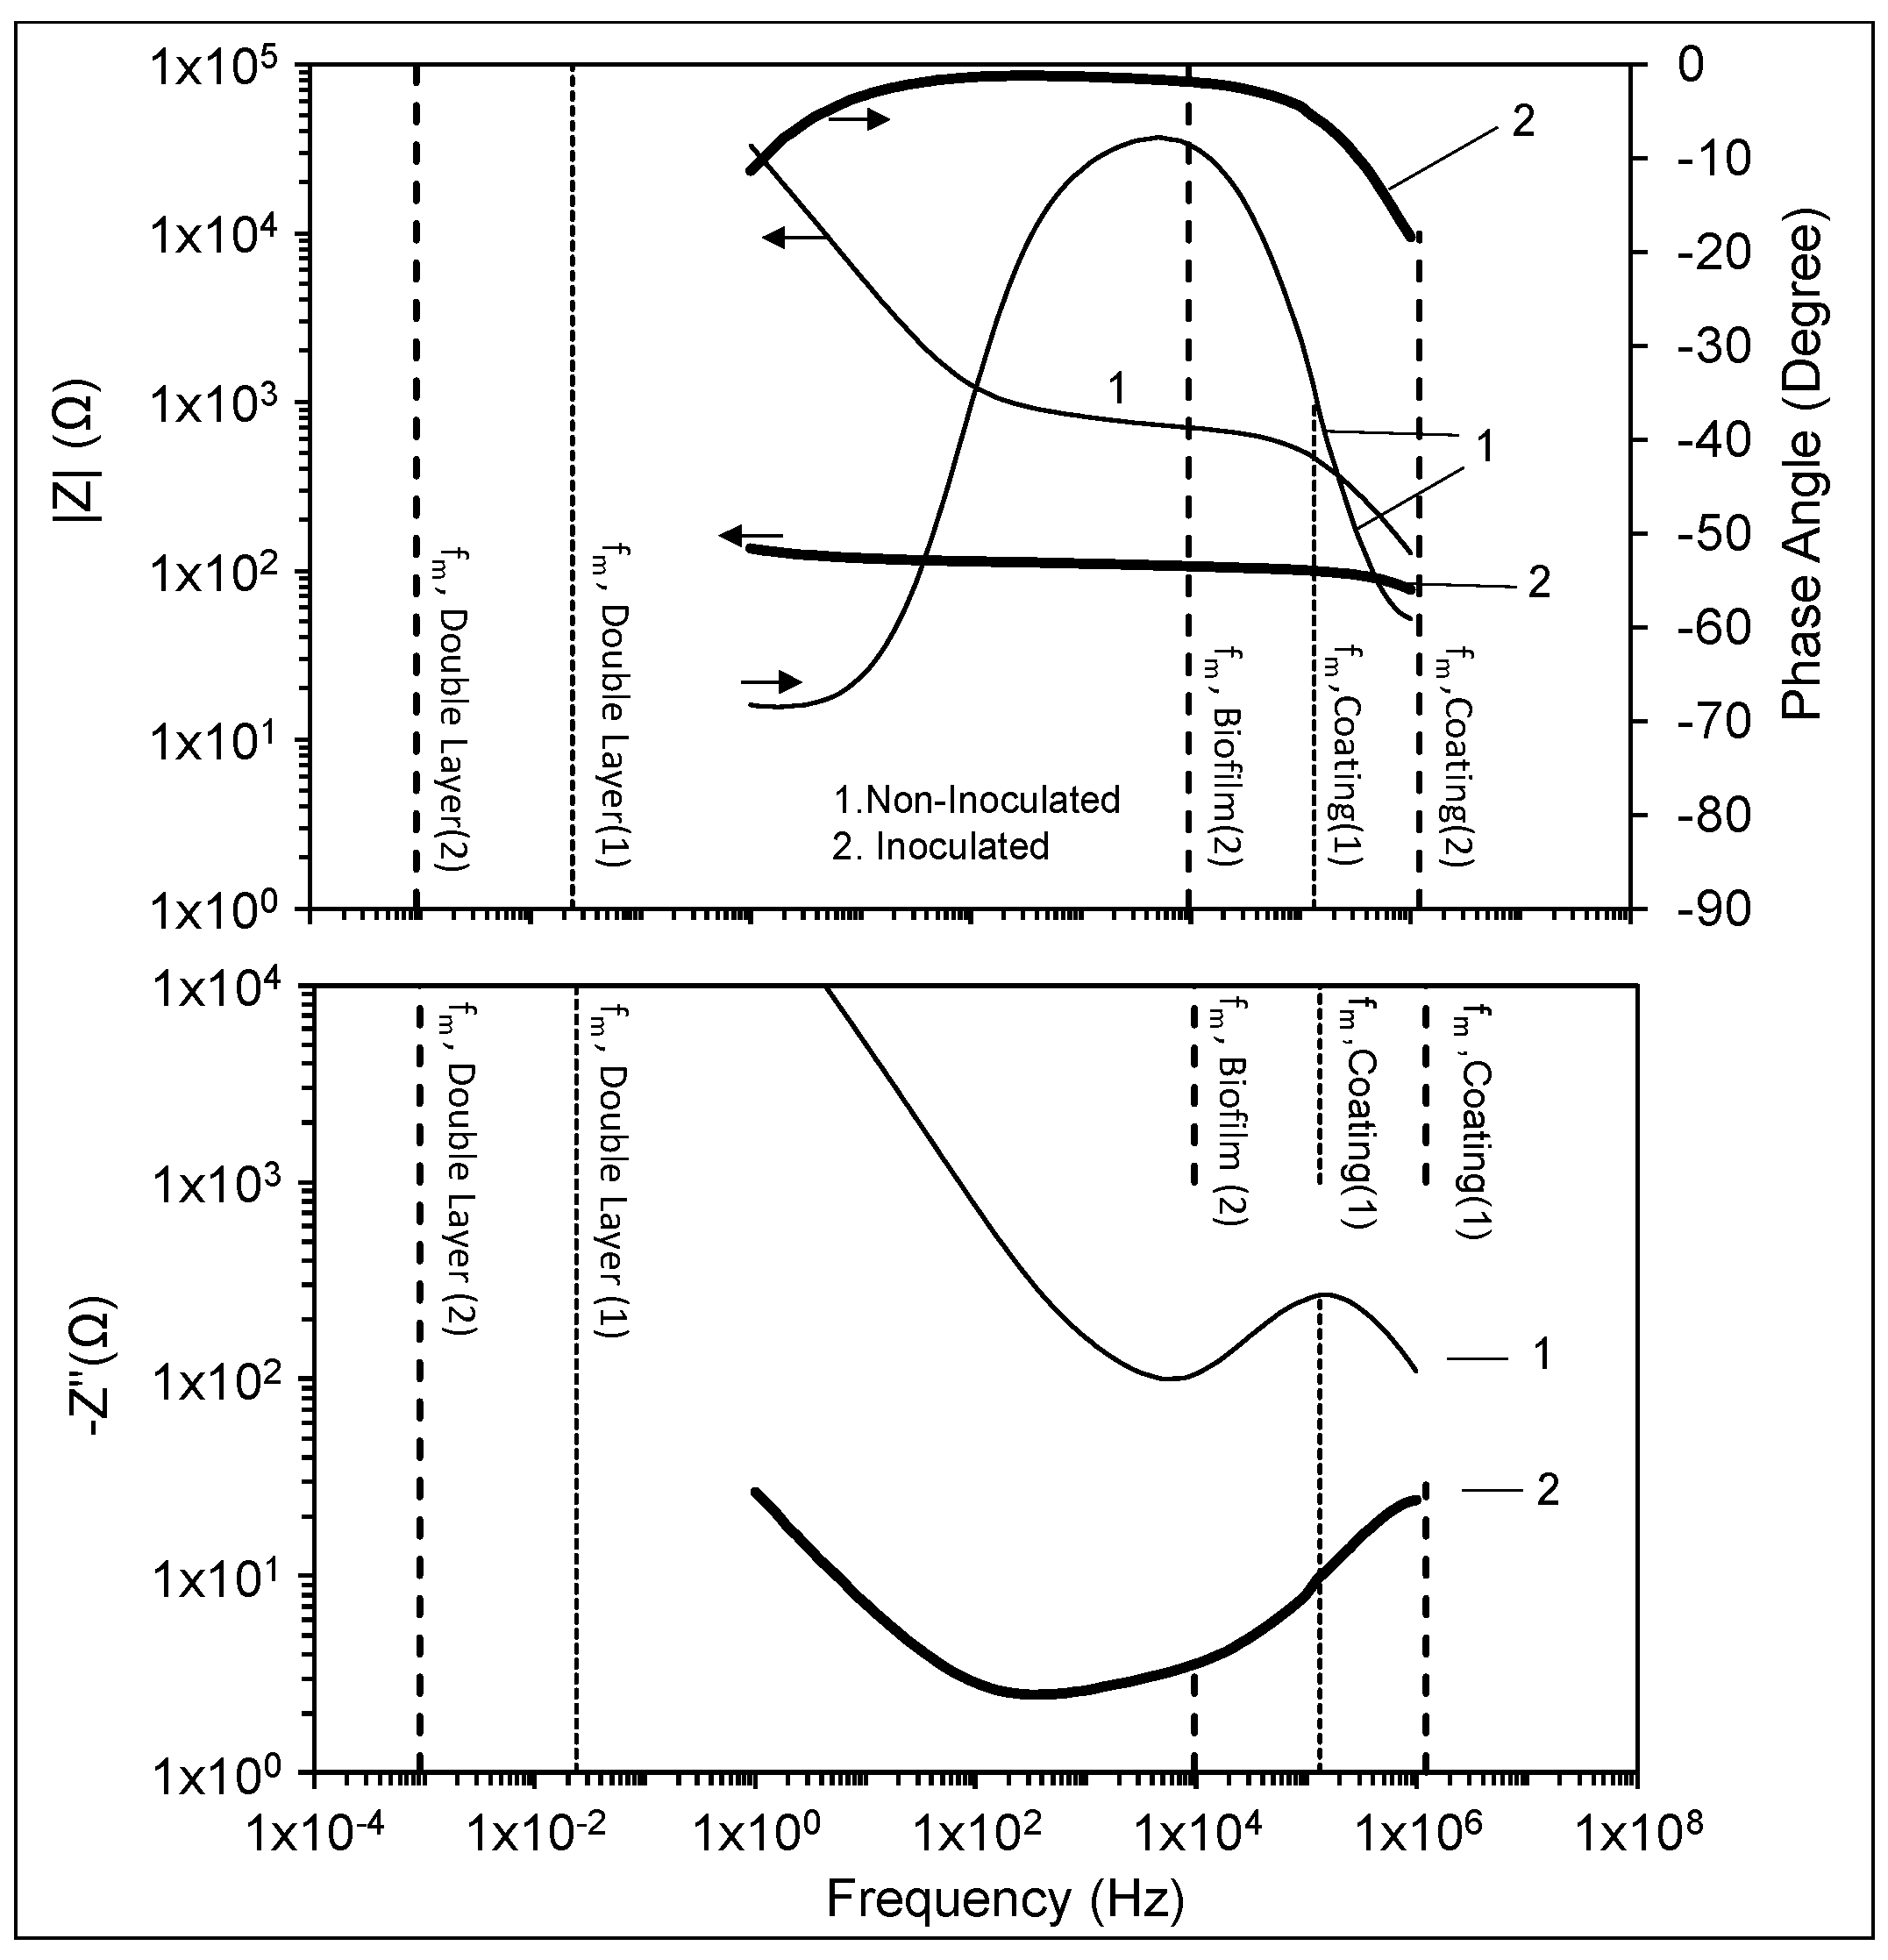
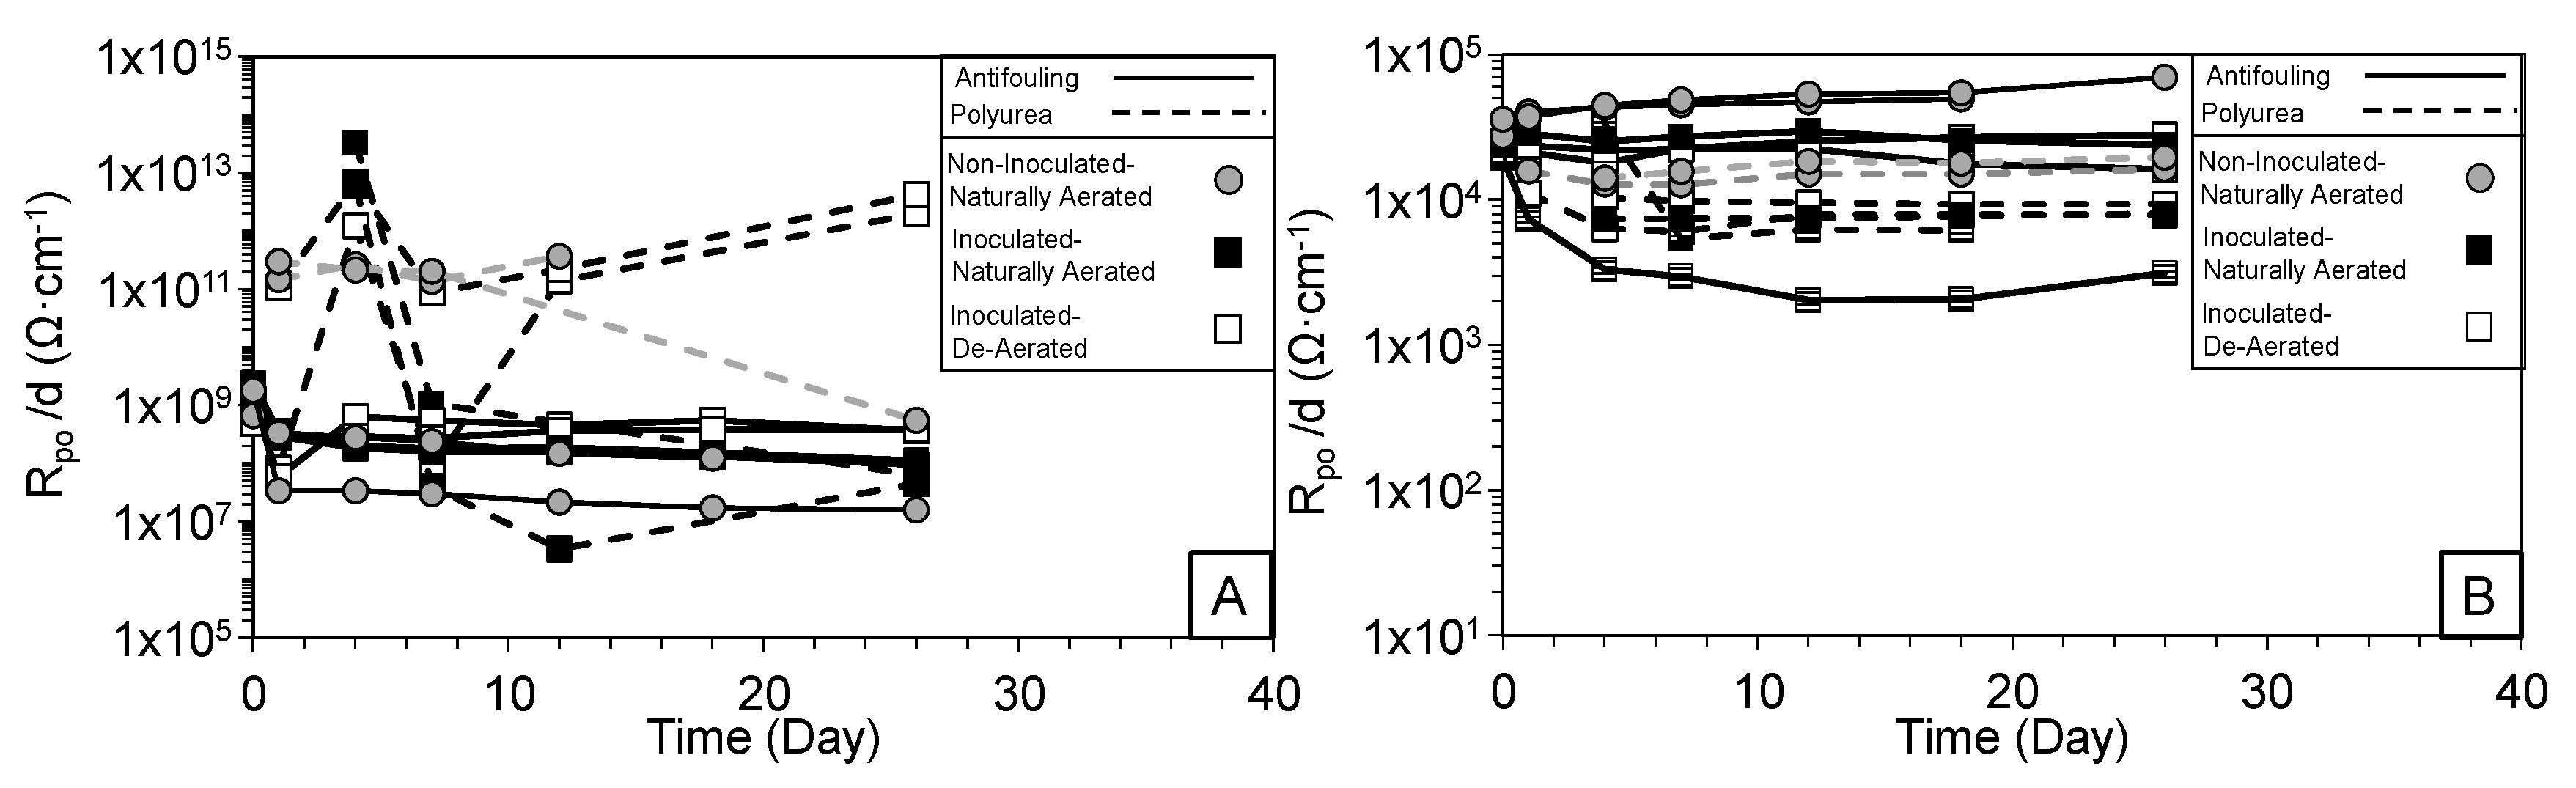
3.2. High-Frequency Impedance Behavior

As expected, the impedance of the polymeric coatings showed near ideal capacitive behavior. Coating capacitance can be described in terms of the material dielectric parameter (ε) as C = εεoAs/d, where εo is the permittivity of free space, As is the coating surface area, and d is the coating thickness. In the absence of coating defects, the impedance would show ideal capacitive behavior as shown in Figure 2A. A high-frequency impedance loop develops with the presence of small coating defects (with a lower high-frequency limit at Rs + Rpo) as shown in Figure 2B–D. The impedance of antifouling and polyurea coating would in part ideally identify behavior characteristic of polymer dielectric capacitance and resistance.
As a first approach, the total impedance at 1 Hz was compared to identify general coating characteristics. As shown in Figure 8, the specimens coated with the antifouling coating with no exposed steel showed initially large impedance (~1 GΩ) that dropped after a few days (~1 MΩ). The polyurea coated specimens with no exposed steel also showed large impedances characteristic of a capacitor (exceeding 1 TΩ) throughout the testing regardless of SRB activity. Large impedance is indicative of barrier coating characteristics, and the decrease in impedance of the antifouling coating could be related to water absorption or possibly some form of coating degradation during the time of testing. In this vein, the total impedance for the antifouling and polyurea coating with intentional coating defects, as expected, showed lower values.
The impedance response was further assessed by consideration of the equivalent circuit analogs described earlier and the coating impedance components are shown in Figure 9 and Figure 10. As was presented before, coating capacitive behavior was initially fit with a CPE even though the capacitive behavior was typically near ideal with resolved n terms consistently greater than 0.8. The calculated coating capacitance was in the order of 10−8 to 10−10 Farad for both antifouling and polyurea coatings. The calculated coating dielectric constant for the antifouling (d ≈ 0.02 cm) and polyurea (d ≈ 0.1 cm) coating was in the order of 10–100 and <10, respectively, consistent for polymeric materials and polymeric coatings in saturated moisture conditions [14].
Due to the dissimilarity in initial coating thickness between the antifouling and polyurea coating, Rpo was normalized by the average d for each coating. The resolved nominal coating pore resistance for the antifouling and polyurea coating specimens without coating defects (107 to 1012 Ω·cm−1) as expected were significantly higher than comparative samples with the coating scribe (103–105 Ω·cm−1). The high nominal resistance (~108 Ω·cm−1) resolved for the non-scribed antifouling-coated specimens related to initial coating imperfections, and the higher nominal resistance (~1012 Ω·cm−1) for the polyurea coating indicated better surface conditions there. Fluctuations of the resolved Rpo values for the polyurea specimens were due to noise in measurements at the large impedance values. SRB presence in testing of non-scribed specimens had not a major contribution on Rpo, indicating generally good overall coating adhesion and barrier characteristics for both coating types.
In contrast, for the scribed specimens, the nominal Rpo for specimens immersed in inoculated solutions were lower than those in non-inoculated solutions. An antifouling-coated specimen inoculated with SRB that had greater sulfide production levels throughout the test period (Figure 11) and surface rusting, showed a significant drop in the nominal Rpo, likely reflecting topcoat degradation due to biocide depletion and subsequent corrosion.
Nominal Rpo for polyurea specimens (that showed tendency to disbond) also showed a decrease early in the exposure, especially in inoculated solutions. The drop was ascribed enhanced coating disbondment around the coating defect site that was exacerbated by microbial activity. The results indicated that microbial activity could create conditions that would promote coating degradation.
The general increase in coating capacitance for the antifouling coating and general trends in pore resistance was related to phenomena relating to the self-polishing characteristic of the coating. The increase in coating capacitance would relate to greater water presence in the coating after immersion and to some extent reduction of the topcoat thickness especially in solutions with active SRB. As detailed in previous work [27], there was a resulting 3–20% decrease of the total coating thickness due to the topcoat self-polishing characteristics but that alone would not account for the 3–6 times increase in capacitance calculated by EIS. Water absorption during early exposure would account for the increase due to its higher dielectric constant. The drop in Rpo would also in part relate to an increase in the effective pore solution conductivity as macropores in the coating become wetted.
Polyurea is a hard coating that does not exhibit characteristics of the antifouling coating. Near uniform coating capacitance and pore resistance was resolved throughout testing due to the good barrier characteristics of the bulk material in the non-scribed condition. Disbondment developed and moisture accessibility from the coating defect allowed larger steel exposure resulting in early decreases in Rpo/d.

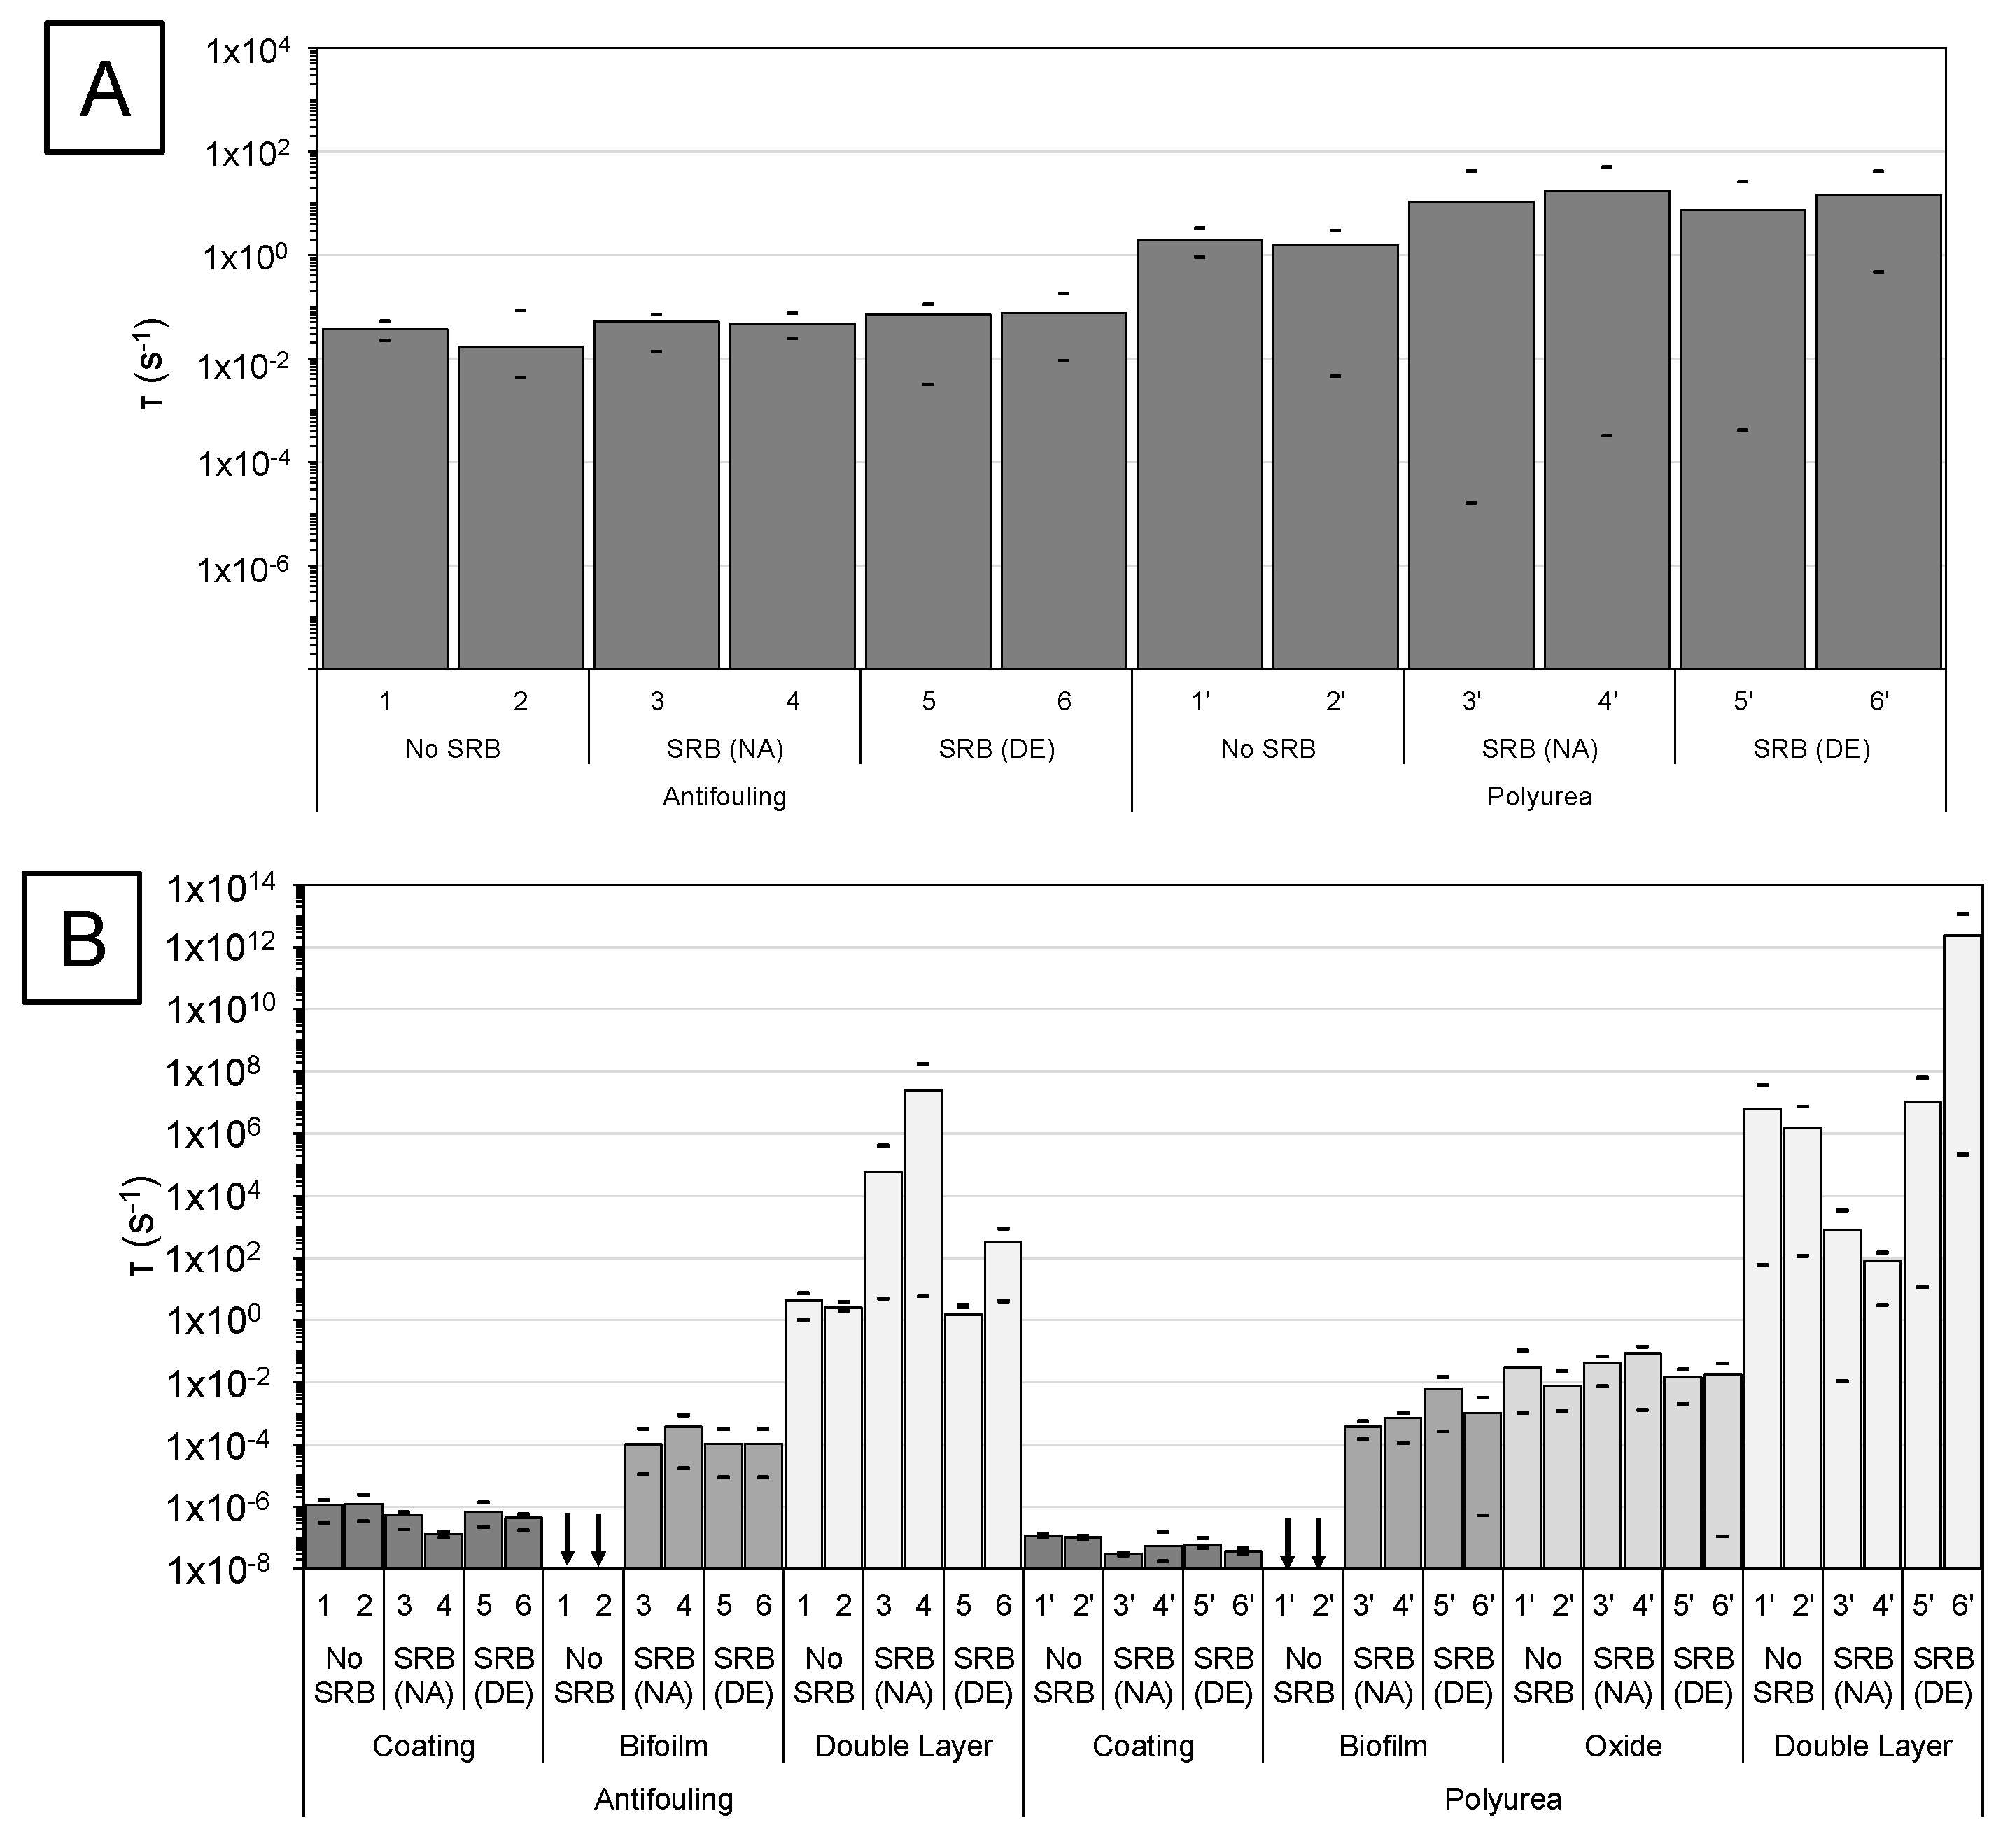
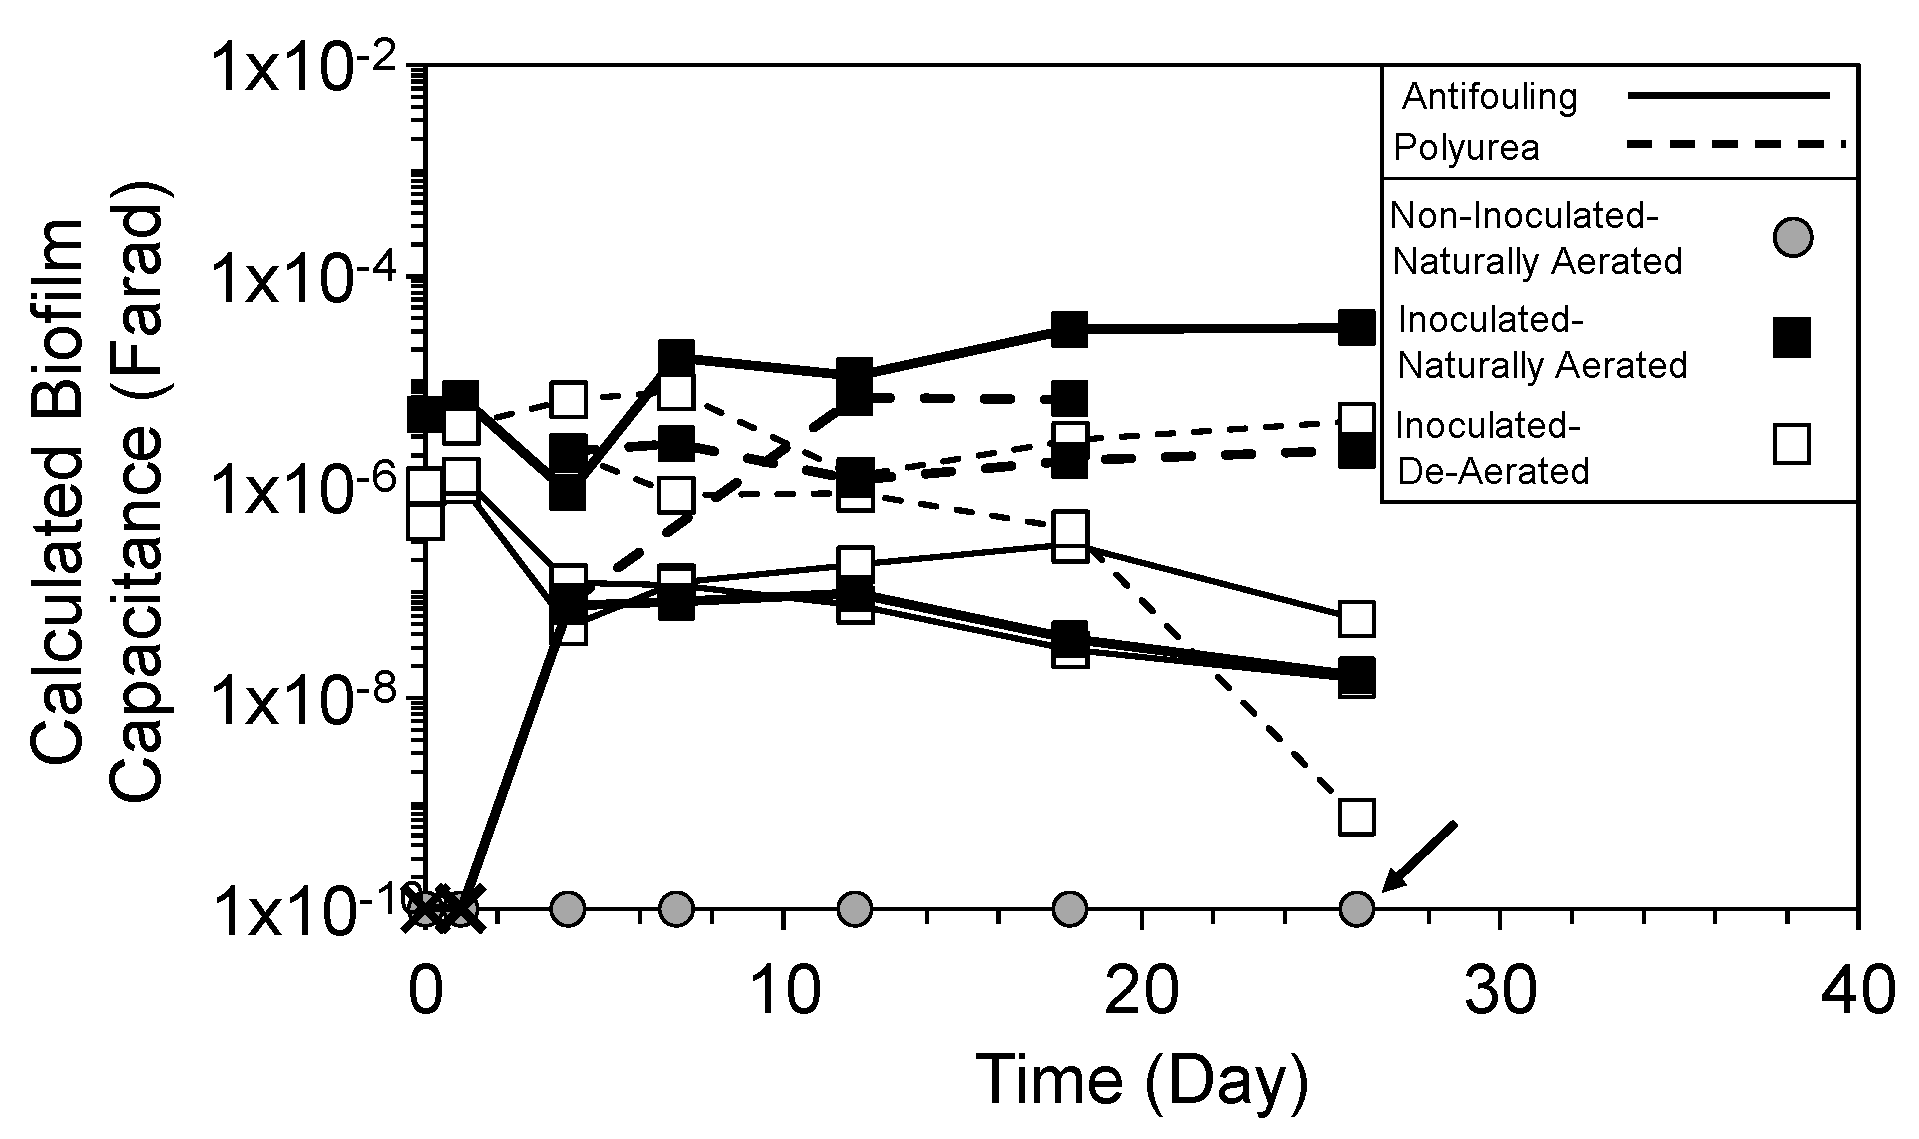
3.3. Intermediate Frequency and Biofilm Development

As described earlier, an intermediate frequency impedance loop (10−4 < τ < 10−3 s−1) only developed for scribed specimens for both coating types immersed in inoculated solutions even at early times. This intermediate frequency impedance loop was associated with SRB activity whether it be bulk biofilm characteristics or the effects on current distribution through coating defects due to the bacteria. It was posited that the impedance loop characterized the electrical characteristics of biofilm that form within the coating defect sites. Resolved nominal biofilm capacitance is shown in Figure 12. With the assumption that the dielectric constant for biofilm is ε ≈ 70 [28], the resolved capacitance for the antifouling and comparative polyurea coating (in the order 10−4 to 10−8 F) would result in a calculated film thickness t < 10−4 mm [29].
The biofilm-associated impedance was typically resolved at day 0 for the polyurea coating and after some days for the commercially available antifouling coating. The polyurea coating would not mitigate biofilm development within the coating defects but the antifouling coating should provide some mitigation due to the presence of biocides. The results did show indication of benefit provided by the biocides at early times. The initial bacteria activity in the laboratory testing was due to the localized inoculation. The calculated film capacitance generally decreased until day 12 for the polyurea coating and day 4 for the antifouling coating, consistent with initial film growth. The times coincided with prolonged SRB activity in the polyurea specimens and the early SRB activity in the antifouling specimens as indicated by the sulfide production levels as described earlier (Figure 11). Another intermediate frequency loop (1 × 10⁻² < τ < 1 × 10⁻¹) developed for polyurea coated samples regardless of inoculation and is discussed in the next section. Due to the self-polishing characteristics of the antifouling coating, it was evident that the biocide concentration in the topcoat can decrease and later reduce its efficacy to control microbe activity.

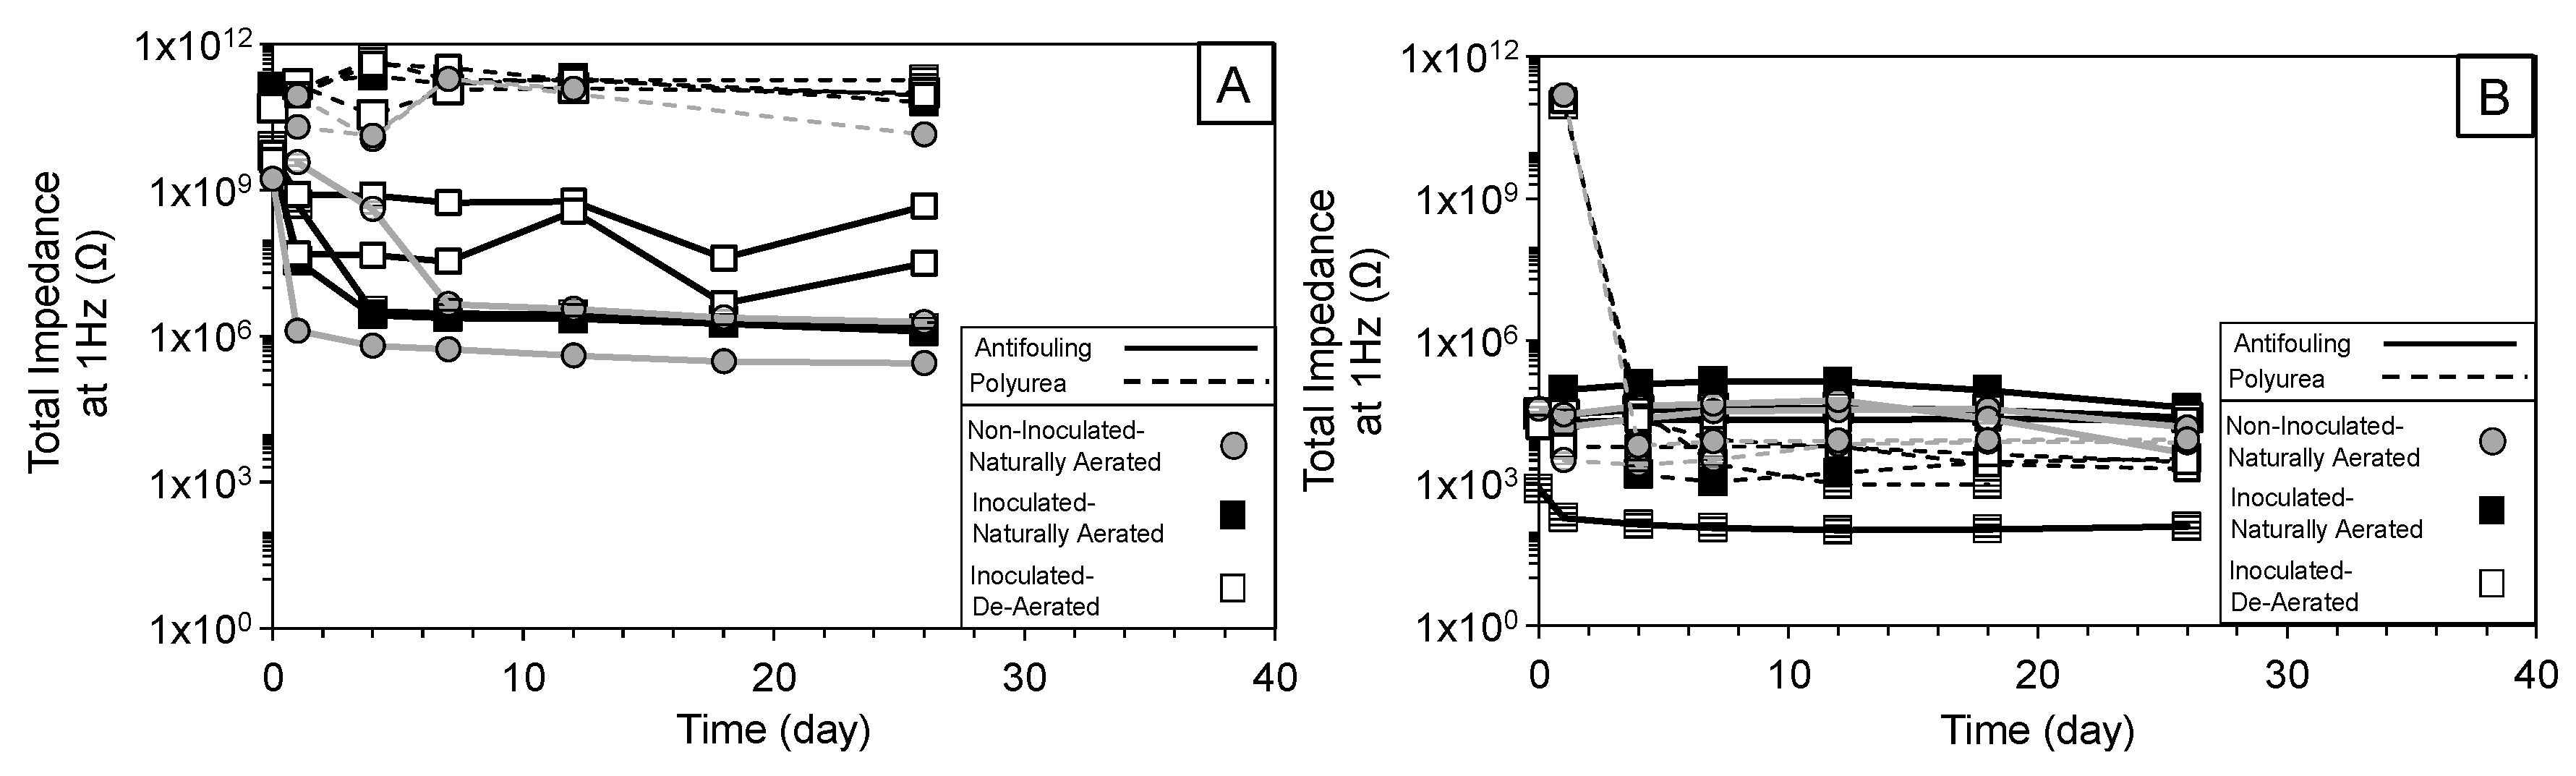
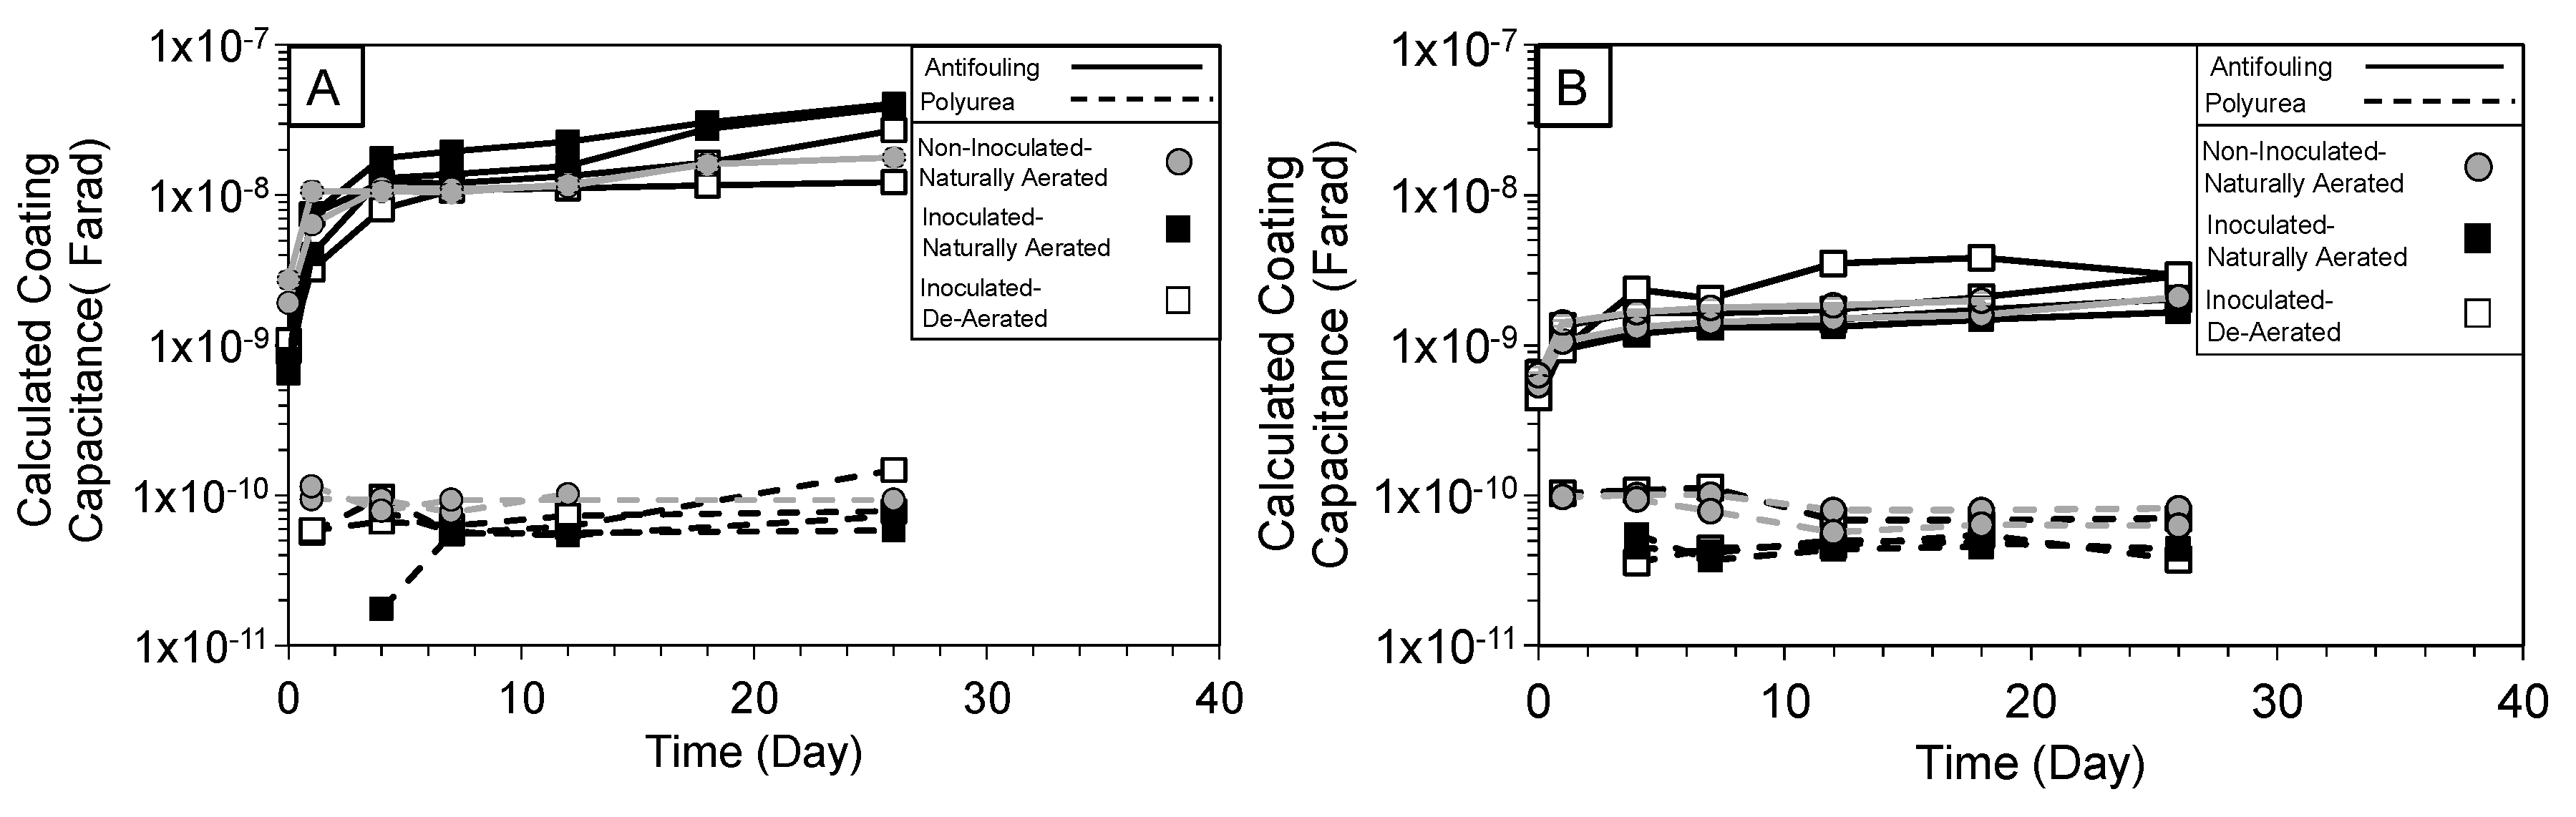
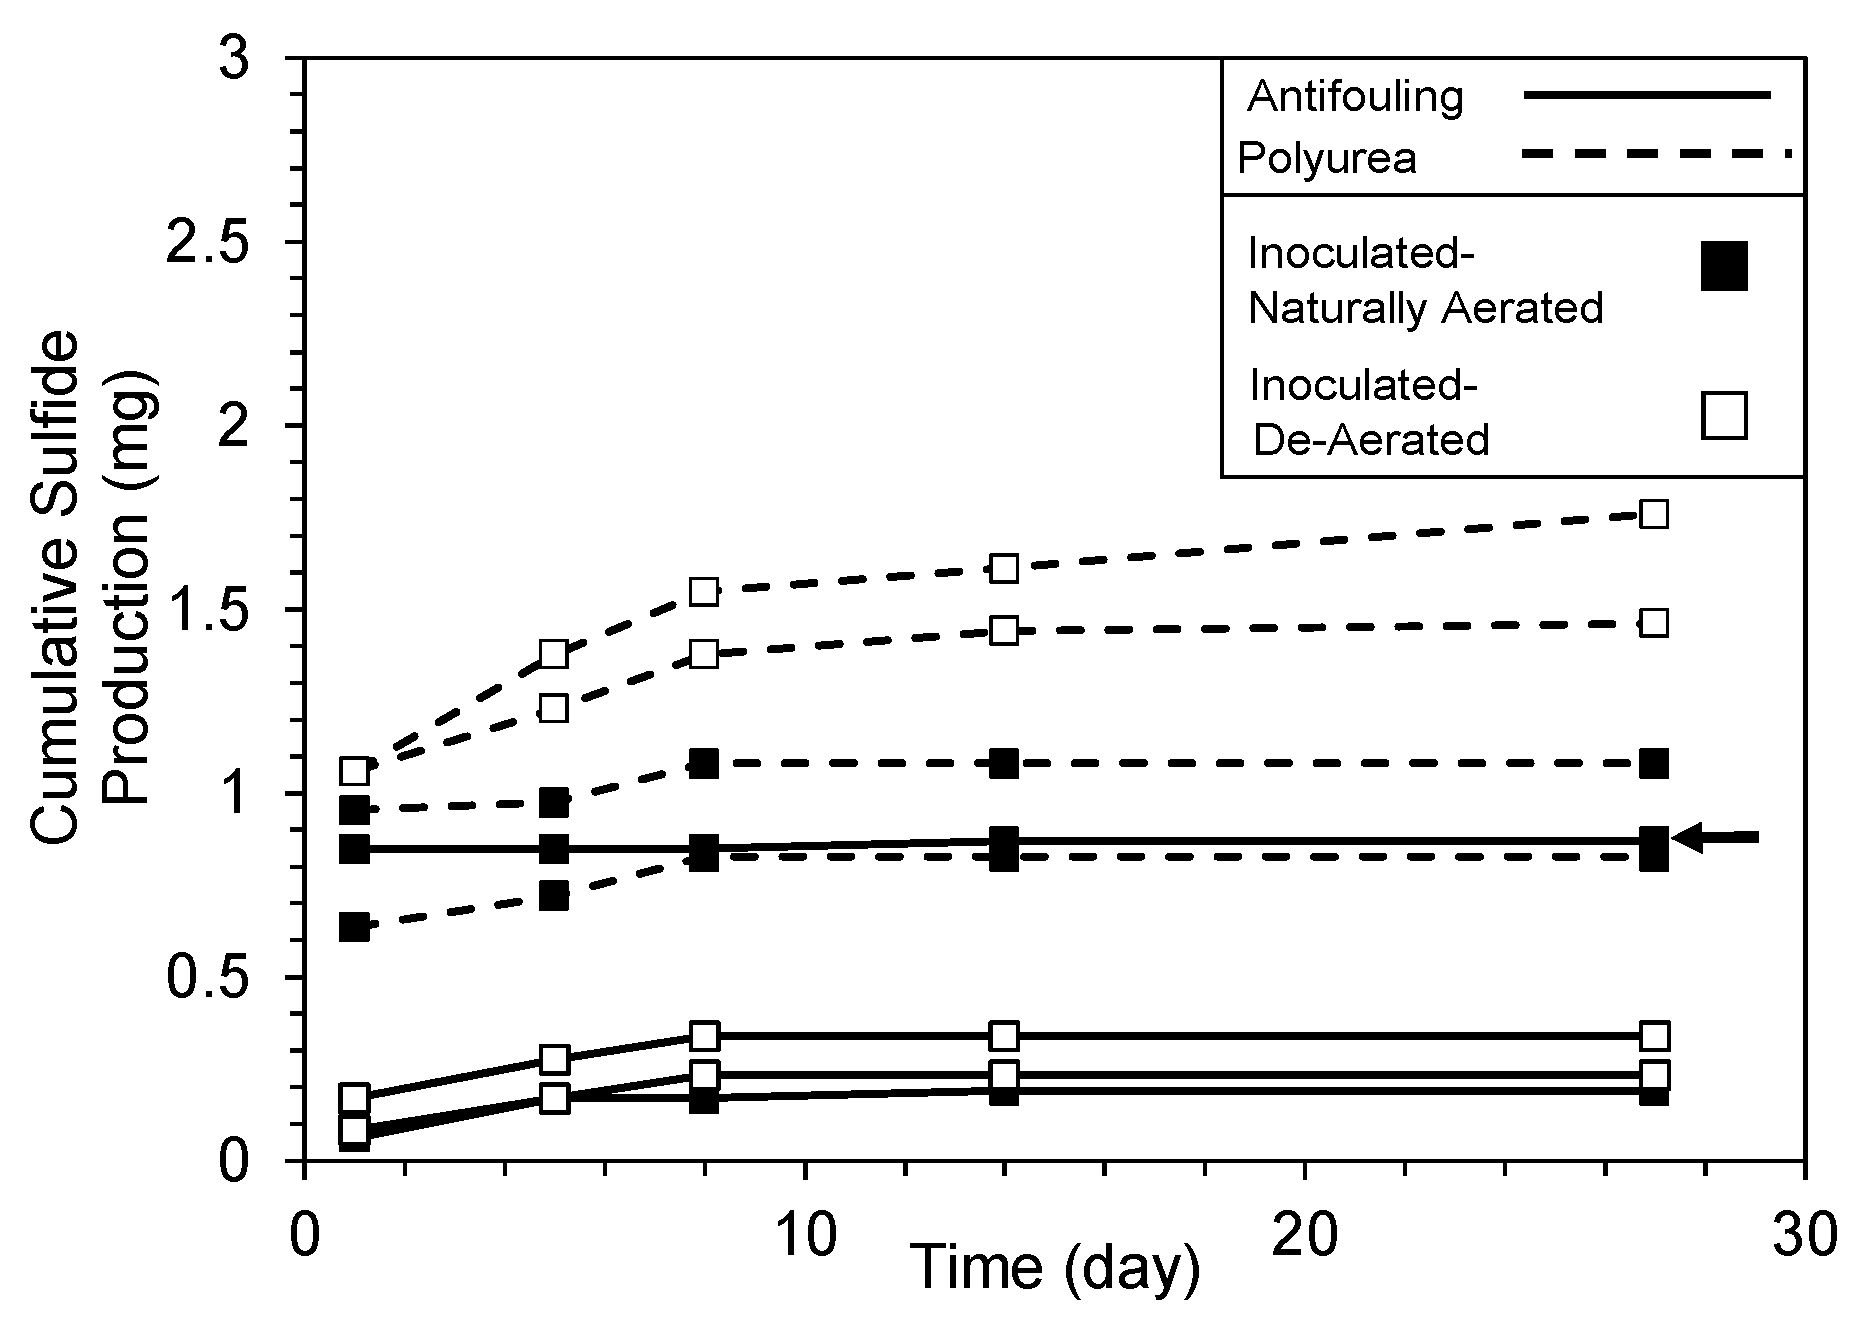
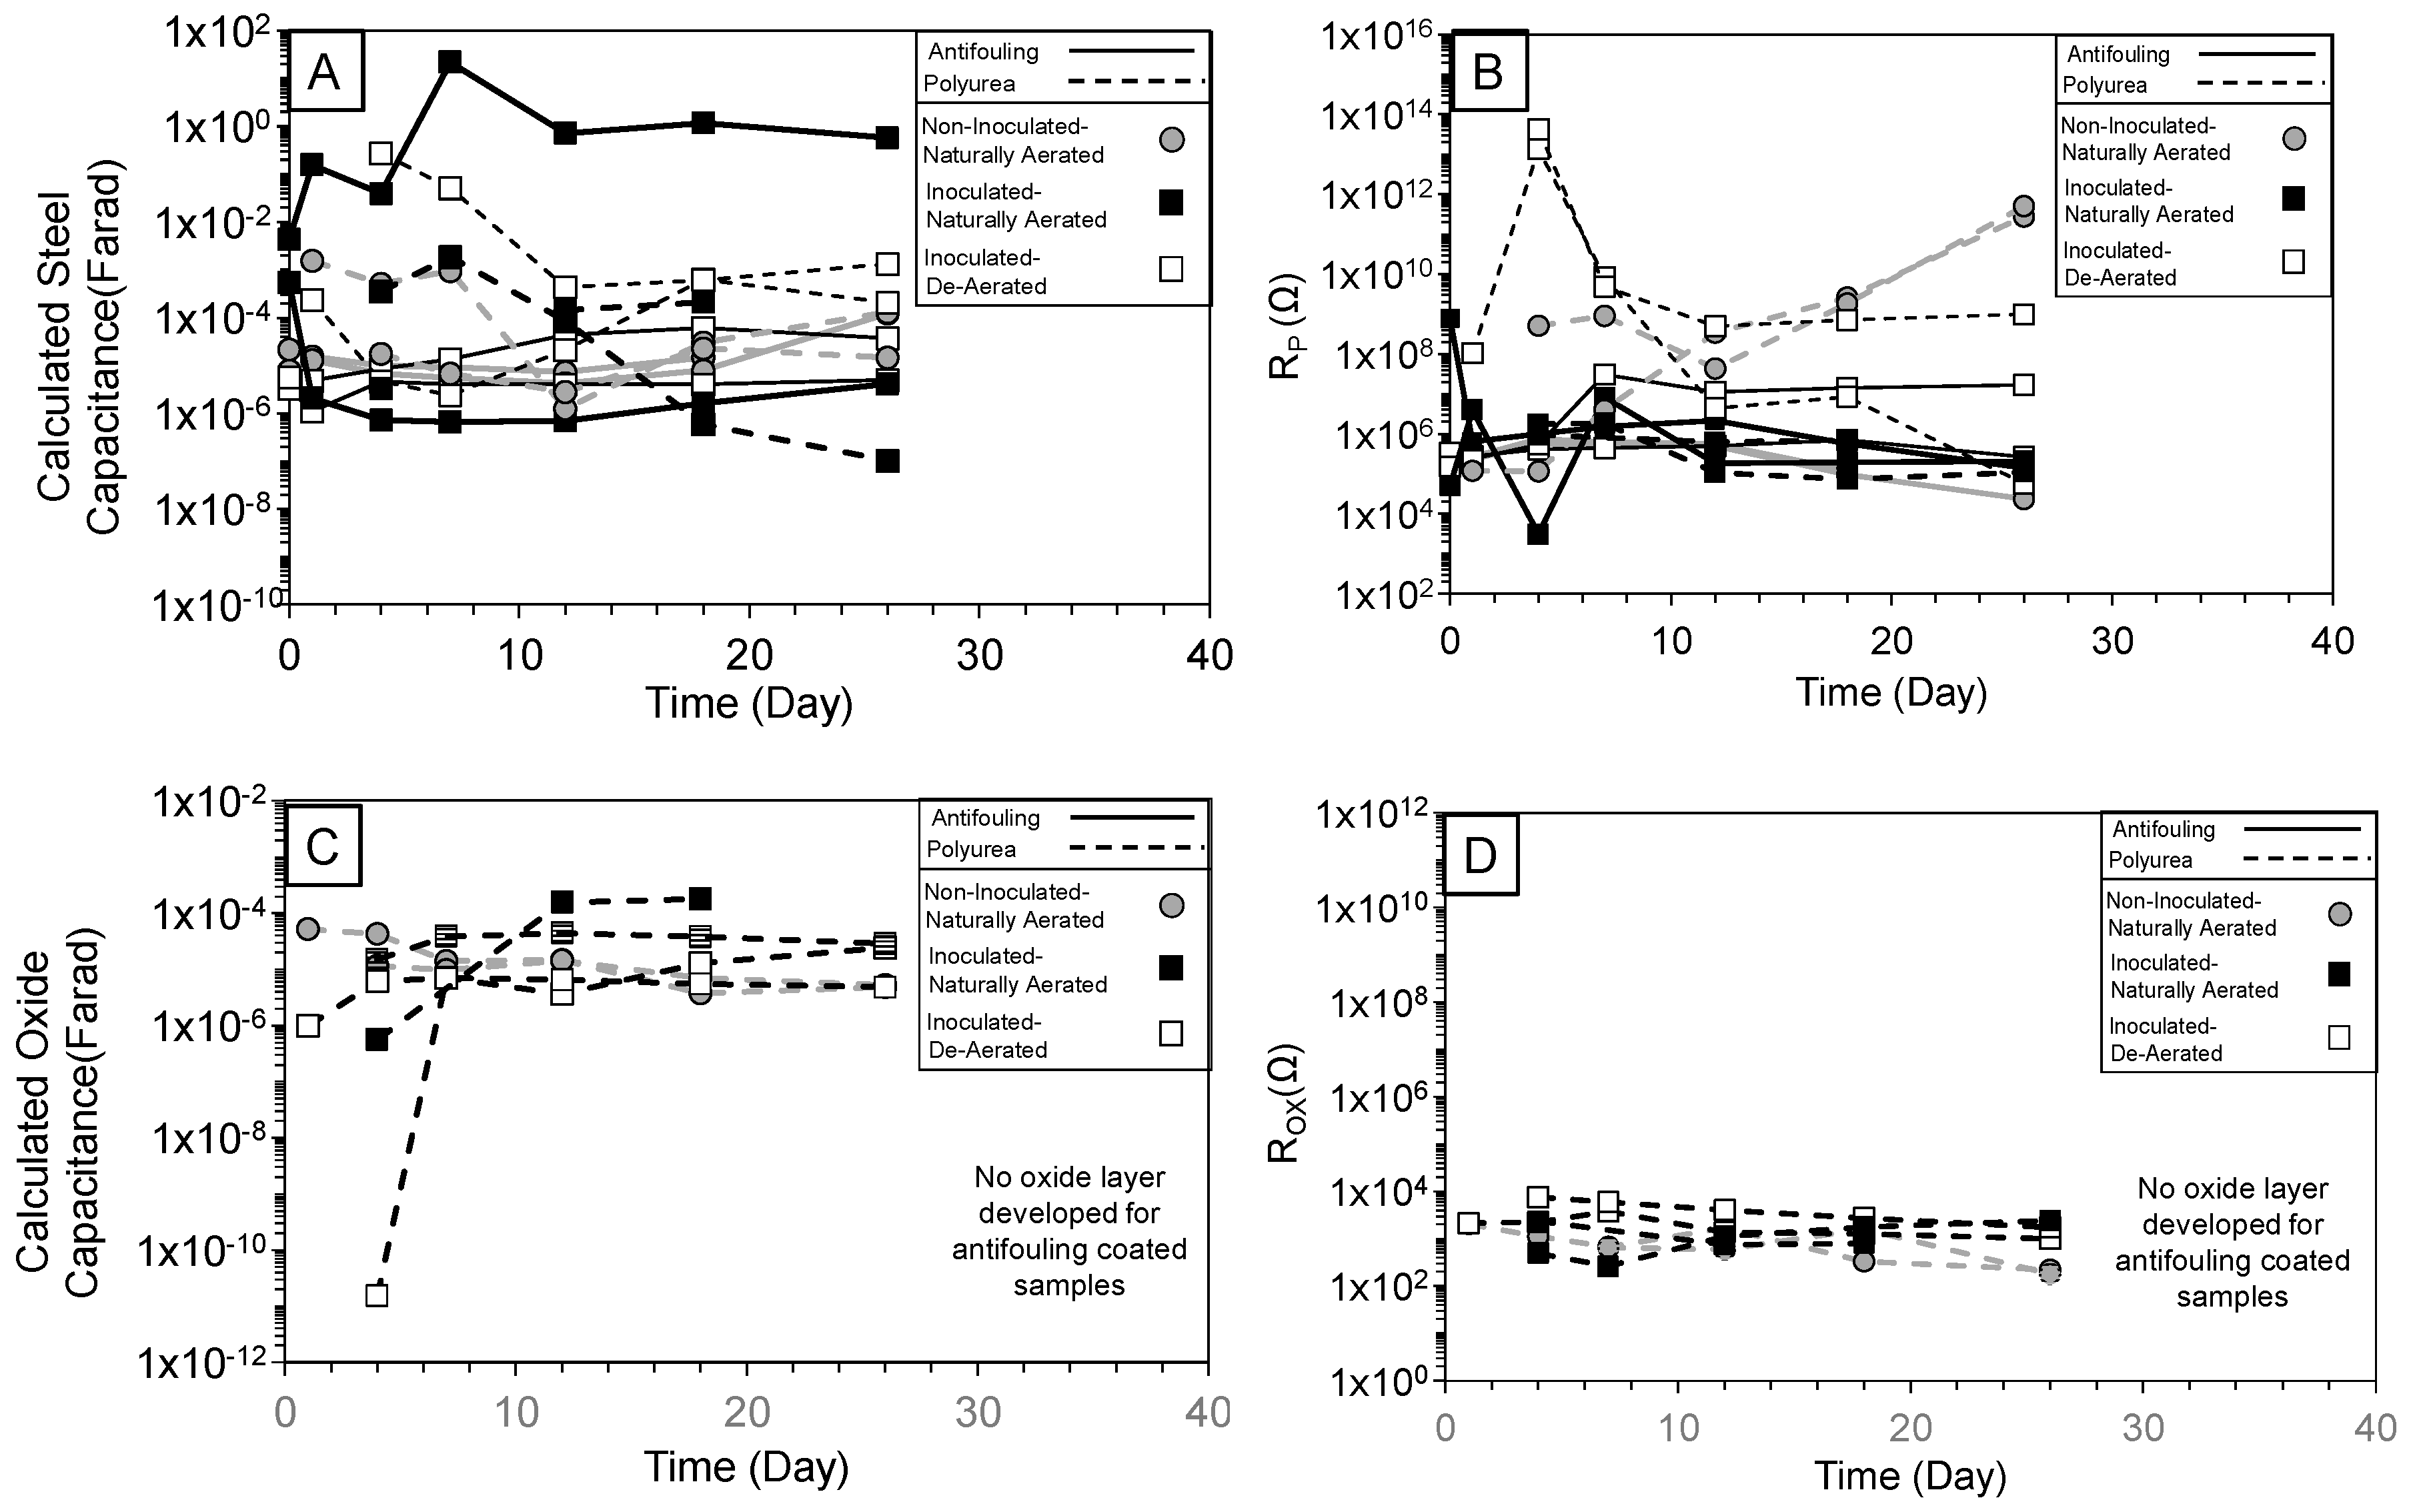
3.4. Low-Frequency Behavior

The impedance of other surface reaction components including surface and steel interfacial layers typically have non-ideal capacitive behavior. Steel interfacial impedance, ZSteel, relating to the double layer capacitance and charge transfer resistance (represented by parallel combinations as in the Randles circuit) would develop with electrolytic contact. ZSteel may also incorporate extended reactive surfaces related to porous surface oxides or surfaces under crevices. Resolved impedance parameters are shown in Figure 13. In general, the resolved steel interfacial capacitance was in the order of 10−3 to 10−7 F (10−1 to 10−5 F/cm2). The antifouling-coated specimen in naturally aerated inoculated solution with discrepant impedance results described earlier, likewise showed diverging trends and higher nominal interfacial capacitance (~1 F). Consistent with earlier discussion, greater coating degradation in the specimen would allow larger exposed steel area and account the trend to higher capacitance. The polarization resistance resolved by EIS resulted in corrosion currents in the order of ~0.026 and ~0.0026 µA/cm2 for antifouling and polyurea, respectively, given icorr = B/Rp where B was assumed to be 26 mV. The resolved polarization resistance was generally consistent with values obtained by linear polarization resistance measurements described in previous works [9].
The impedance associated with the oxide layer observed for scribed polyurea samples was attributed to undercoating corrosion that developed due to the disbondment of the polyurea coating and electrolytic interaction from the coating defect opening. Visual observations of a black surface layer that reddened after sample autopsy indicated corrosion oxide products that remained under the coating during testing.

4. Conclusions

EIS results for coating samples showed impedance behavior where the Nyquist diagrams showed varied responses. Scribed coating samples showed convoluted responses with the presence of multiple time constants that reflected the different surface and interfacial characteristics associated with coating material, steel substrate, surface films (biofilm and oxide).
The proposed equivalent circuit analogs were shown to adequately describe different and unique time constants for each impedance loop and provided a useful means to compare admittances for the various time constants even when CPE n terms indicated non-ideal capacitive behavior. A calculation approach was described to decouple the complicated impedance responses to identify the characteristic frequency of each parallel resistive and capacitive terms associated with each time constant.
An increase in coating capacitance for the antifouling coating was related to the self-polishing characteristic of the coating leading to biocide depletion. The results indicated that microbial activity could further create conditions that would promote coating degradation. It was confirmed that the intermediate frequency impedance loop in inoculated samples was associated with SRB activity whether it be bulk biofilm characteristics or the effects on current distribution through coating defects due to the bacteria.

Author Contributions

Writing—Review and Editing, S.P., K.L. and M.D.; Project Administration, M.D.

Funding

This investigation was supported by the Florida Department of Transportation (FDOT). The opinions, findings and conclusions expressed here are those of the authors and not necessarily those of the FDOT or the U.S Department of Transportation.

Acknowledgments

Support from the FDOT State Materials Office is acknowledged here. The assistance in sample preparation by Mayren Boan Echeverria, Harpreet Sidhar, Bin Li, and Arvind Argawal is acknowledged.

Conflicts of Interest

The authors declare no conflict of interest.

Appendix A

Table A1. Resolved impedance parameters from equivalent circuit fitting.
TestDayRs (Ω)Coating 1Biofilm 2Oxide 2Double Layer 3
Rpo (Ω)Yoc (nSs n)ncfm (Hz)Cc (nF)Rbf (Ω)Yobf (µSs n)nbffm (Hz)Cbf (µF)Rox (Ω)Yoox (µSs n)noxfm (Hz)Cox (µF)Rp (kΩ)Yodl (µSs n)ndlfm (mHz)Cdl (µF)
AOCN00
0.45
1.2 × 10⁷
3.1 × 10⁷
2.9
3.5
0.89
0.91
78
2.1
1.9
2.7
180
9.9
2.1 × 10⁶
2.9 × 10⁵
34
56
0.78
0.77
4.9
37
16
16
AOBN017.1
20.6
1.7 × 10⁷
4.1 × 10⁷
1.0
0.75
0.95
0.96
13
6.6
0.81
0.66
180
0
2.3 × 10⁶
2.6 × 10⁶
64
57
0.73
0.73
2.5
2.4
31
27
AOBD014.4
14.6
1.9 × 10⁷
8.4 × 10⁶
1.1
1.4
0.95
0.95
10
19
0.91
1.1
188.2
10.9
9.6 × 10⁶
6.6 × 10⁶
17
26
0.82
0.81
1.6
1.6
12
12
-
AXCN00
4.8
475
620
5.0
2.0
0.86
0.91
5.8 × 10⁵
5.2 × 10⁵
0.63
0.54
150
280
16
6.6
0.76
0.76
54
79
21
7.9
186.2
12
854
942
33
20
0.79
0.81
1.0 × 10⁵
1.1 × 10⁵
1.9
1.6
120
95
13
8.4
0.87
0.86
81
231
15
7.9
AXBN05
0.2
432
333
1.3
2.7
0.93
0.88
9.2 × 10⁵
1.2 × 10⁶
0.44
0.45

78

56

0.69

450

4.9
7.6 × 10⁵
52
9.2
574
0.68
0.62
0.004
0.76
545
4330
1822.6
38
442
35
12.5
43.3
0.85
0.84
2.6 × 10⁵
1.3 × 10⁶
1.5
3.8
1100
29
0.52
5880
0.82
0.85
4100
180
0.4
31.4
570
190
1.6
9060
0.89
0.61
192
0.007
1.6
1.2 × 10⁶
AXBD08
0
347
366
2.8
3.1
0.90
0.88
7.4 × 10⁵
1.0 × 10⁶
0.6
0.5
237
293
4.8
8.6
0.75
0.74
1500
570
0.5
1.0
342
151
3.2
5.8
0.83
0.88
155
205
3.2
5.6
180
22
463
305
133
16.2
0.70
0.85
1.8 × 10⁵
3.3 × 10⁵
2.1
1.7
700
550
2.7
0.7
0.74
0.71
840
1.9 × 10⁴
0.3
0.03
702
1.4 × 10⁴
3.6
11
0.88
0.74
63
0.2
4
61.4
POCN40
0
2.3 × 10¹⁰
1.9 × 10¹⁰
0.09
0.08
0.97
0.99
0.08
0.12
0.09
0.08
26
0

4.9 × 10⁷

0.09

0.99

38.5

0.09
POBN40
0
5.3 × 10¹¹
2.9 × 10¹²
0.07
0.02
0.97
0.99
0.004
0.004
0.08
0.02
260
0
4.1 × 10⁶
5.5 × 10⁶
0.1
0.02
0.95
0.99
600
520
0.07
0.06
POBD40
0
1.8 × 10¹¹
6.1 × 10¹¹
0.09
0.06
0.96
0.98
0.017
0.004
0.1
0.07
260
0
1.8 × 10¹¹
3.7 × 10¹¹
0.1
0.07
0.95
0.97
0.006
0.006
0.1
0.08
PXCN4168
350
1134
1246
0.1
0.06
0.98
0.99
1.5 × 10⁶
1.5 × 10⁶
0.1
0.09
1104
657
147
26
0.59
0.83
3.5
22
42
22
116
5.1 × 10⁵
113
10
0.59
0.83
2.9
0.03
513
17
263
3
1436
1735
0.2
0.2
0.92
0.94
1.5 × 10⁶
1.6 × 10⁶
0.08
0.06
217
225
14
14
0.83
0.85
160
140
4.8
5.3
2.8 × 10⁸
5.1 × 10⁸
16
10
0.83
0.85
5.0 × 10⁻⁶
0.02
131
15
PXBN40
0
649
2894
0.4
0.2
0.88
0.93
6.0 × 10⁶
1.1 × 10⁶
0.05
0.05
187
1365
85
3.9
0.53
0.58
400
1500
2.2
0.08
490
2353
53
0.8
0.74
0.94
23
130
15
0.5
1745
932
137
2.8
0.85
0.84
0.29
55
356
3.3
260
708
1.6
0.79
5.5 × 10⁶
0.04
257
32
0.64
290
2.2
2390
75
0.64
2.5
28
110
0.7
0.57
15
0.1
PXBD4143
107
558
914
0.6
0.9
0.89
0.81
2.8 × 10⁶
5.2 × 10⁶
0.1
0.03
1545
2602
34
7.8
0.65
0.75
16
1.3 × 10⁶
6.8
2.1
2271
7619
3.4
0.4
0.99
0.36
12
30
6
0.01
1 × 10¹⁰
4 × 10¹⁰
7.1
5.9
0.99
0.54
3 × 10⁻⁶
1 × 10⁻¹¹
4.7
2.7 × 10⁵
260
0
693
829
0.4
0.3
0.9
0.89
3.5 × 10⁶
4.2 × 10⁷
0.07
0.04
715
9.2
40
4.5
0.61
0.54
55
2 × 10⁷
4.2
7 × 10⁻³
978
1719
112
15
0.6
0.76
7
20
24
4.8
57.2
9.9 × 10⁵
157
204
0.87
0.79
17
0.02
208
1330
Test Specimen Identification: A: Antifouling (at 0 and 18 day); P: Polyurea (at 4 and 26 day); X: Scribed; O: Non-scribed; C: Non-inoculated; B: Inoculated; N: Naturally Aerated; D: De-aerated. Impedance Parameters: Rs: Solution resistance; Rpo: Coating pore resistance; Rp: Polarization resistance; Yo: CPE pre-exponential admittance term; n: CPE n term. f: breakpoint frequency; C: Capacitance; Subscripts: c: Coating, bf: Biofilm, ox: Oxide, dl: Double layer.1 Coating area: 19.63 cm2; 2 Nominal area (defect area): 0.02 cm2; 3 Exposed steel area: 0.02 cm2.

References

  1. Munger, C.G. Corrosion Prevention by Protective Coatings; U.S. Department of Energy, Office of Scientific and Technical Information: Oak Ridge, TN, USA, 1985.
  2. Crisp, D.J. Factors influencing the settlement of marine invertebrate larvae. Chemorecept. Mar. Org. 1974, 22, 177–265. [Google Scholar]
  3. Neville, A.; Hodgkiess, T. Comparative study of stainless steel and related alloy corrosion in natural sea water. Br. Corros. J. 1998, 33, 111–120. [Google Scholar] [CrossRef]
  4. Egan, S.; James, S.; Holmström, C.; Kjelleberg, S. Correlation between pigmentation and antifouling compounds produced by Pseudoalteromonas tunicata. Environ. Microbiol. 2002, 4, 433–442. [Google Scholar] [CrossRef] [PubMed]
  5. Keough, M.J.; Raimondi, P.T. Responses of settling invertebrate larvae to bioorganic films: Effects of different types of films. J. Exp. Mar. Biol. Ecol. 1995, 185, 235–253. [Google Scholar] [CrossRef]
  6. Little, B.J.; Lee, J.S. Microbiologically Influenced Corrosion; John Wiley & Sons: Hoboken, NJ, USA, 2007; Volume 3. [Google Scholar]
  7. Borenstein, S. Microbiologically Influenced Corrosion Handbook; Elsevier: Amsterdam, The Netherlands, 1994. [Google Scholar]
  8. Melchers, R.E.; Wells, T. Models for the anaerobic phases of marine immersion corrosion. Corros. Sci. 2006, 48, 1791–1811. [Google Scholar] [CrossRef]
  9. Permeh, S.; Boan, M.E.; Tansel, B.; Lau, K. Susceptibility of Bridge Steel and Concrete Components to Microbiological Influenced Corrosion (MIC) and Microbiological Influenced Deterioration (MID) in Florida; Final Report to Florida Department of Transportation, Contract No. BDV29-97726; Florida Department of Transportation: Tallahasse, FL, USA, 2019. [Google Scholar]
  10. Permeh, S.; Reid, C.; Boan, M.E.; Lau, K.; Tansel, B.; Duncan, M.; Lasa, I. Microbiological influenced corrosion (MIC) in Florida marine environment: A case study. In Proceedings of the Corrosion 2017, New Orleans, LA, USA, 26–30 March 2017; NACE International: Houston, TX, USA, 2017. [Google Scholar]
  11. Permeh, S.; Li, B.; Echeverría, M.; Tansel, B.; Lau, K.; Duncan, M. Microbially influenced steel corrosion with crevice conditions in natural water. In Proceedings of the Corrosion 2018, Phoenix, AZ, USA, 15–19 April 2018; NACE International: Houston, TX, USA, 2018. [Google Scholar]
  12. Permeh, S.; Boan, M.E.; Tansel, B.; Lau, K.; Duncan, M. Exploration of the influence of microbe availability on MIC of steel marine fouling environments. In Proceedings of the Corrosion 2019, Nashville, TN, USA, 24–28 March 2019; NACE International: Houston, TX, USA, 2019. [Google Scholar]
  13. Kelly, R.G.; Scully, J.R.; Shoesmith, D.; Buchheit, R.G. Electrochemical Techniques in Corrosion Science and Engineering; CRC Press: Boca Raton, FL, USA, 2002. [Google Scholar]
  14. Mansfeld, F. Use of electrochemical impedance spectroscopy for the study of corrosion protection by polymer coatings. J. Appl. Electrochem. 1995, 25, 187–202. [Google Scholar] [CrossRef]
  15. Mansfeld, F. Electrochemical impedance spectroscopy. In Analytical Methods in Corrosion Science and Engineering; Mansfeld, F., Marcus, P., Eds.; CRC Press: Boca Raton, FL, USA, 2005; pp. 463–507. [Google Scholar]
  16. Hirayama, R.; Haruyama, S. Electrochemical impedance for degraded coated steel having pores. Corrosion 1991, 47, 952–958. [Google Scholar] [CrossRef]
  17. Mansfield, F.; Lee, C.C.; Han, L.T.; Zhang, G.; Little, B. The Impact of Microbiologically Influenced Corrosion on Protective Polymer Coatings; Department of Materials Science and Engineering, University of Southern California Los Angeles: Los Angeles, CA, USA, 1998. [Google Scholar]
  18. Kim, T.; Kang, J.; Lee, J.H.; Yoon, J. Influence of attached bacteria and biofilm on double-layer capacitance during biofilm monitoring by electrochemical impedance spectroscopy. Water Res. 2011, 45, 4615–4622. [Google Scholar] [CrossRef] [PubMed]
  19. Pérez, E.J.; Cabrera-Sierra, R.; González, I.; Ramírez-Vives, F. Influence of Desulfovibrio sp. biofilm on SAE 1018 carbon steel corrosion in synthetic marine medium. Corros. Sci. 2007, 49, 3580–3597. [Google Scholar] [CrossRef]
  20. Castaneda, H.; Benetton, X.D. SRB-biofilm influence in active corrosion sites formed at the steel-electrolyte interface when exposed to artificial seawater conditions. Corros. Sci. 2008, 50, 1169–1183. [Google Scholar] [CrossRef]
  21. Galicia, M.; Goujon, V.V.; Aguirre-Ramírez, M.; Castaneda, H. Interfacial and corrosion characterization of zinc rich-epoxy primers with carbon nanotubes exposed to marine bacteria. In Proceedings of the Corrosion 2017, New Orleans, LA, USA, 26–30 March 2017; NACE International: Houston, TX, USA, 2017. [Google Scholar]
  22. Downs, R.; Dean, J.; Downer, A.; Perry, J. Determination of the biocide Econea® in artificial seawater by solid phase extraction and high-performance liquid chromatography mass spectrometry. Separations 2017, 4, 34. [Google Scholar] [CrossRef]
  23. Postgate, J.R. The Sulphate-Reducing Bacteria; Cambridge University Press (CUP Archive): London, UK, 1979. [Google Scholar]
  24. TM0194-2014. Field Monitoring of Bacterial Growth in Oil and Gas Systems; NACE Standard: Houston, TX, USA, 2014. [Google Scholar]
  25. Hsu, C.H.; Mansfeld, F. Technical note: Concerning the conversion of the constant phase element parameter Y0 into a capacitance. Corrosion 2001, 57, 747–748. [Google Scholar] [CrossRef]
  26. Mansfeld, F. Recording and analysis of AC impedance data for corrosion studies. Corrosion 1981, 37, 301–307. [Google Scholar] [CrossRef]
  27. Permeh, S.; Lau, K.; Duncan, M. Mitigation of microbiologically influenced corrosion by application of antifouling coatings: development of biofilm. Struct. Infrastruct. Eng. 2019. submitted. [Google Scholar]
  28. Hoog, N.A.; Mayer, M.J.J.; Miedema, H.; Olthuis, W.; Tomaszewska, A.A.; Paulitsch-Fuchs, A.H.; van den Berg, A. Online monitoring of biofouling using coaxial stub resonator technique. Sens. Biol. Sens. Res. 2015, 3, 79–91. [Google Scholar] [CrossRef] [Green Version]
  29. Liu, H.; Huang, L.; Huang, Z.; Zheng, J. Specification of sulfate reducing bacteria biofilms accumulation effects on corrosion initiation. Mater. Corros. 2007, 58, 44–48. [Google Scholar] [CrossRef]
Figure 1. Laboratory test setup. (a) Schematic of test cell; (b) Examples picture of antifouling coated coupon in inoculated test solution.
Coatings 09 00518 g001
Figure 2. Electrochemical impedance spectroscopy Nyquist diagrams for coated steel samples immersed in inoculated and non-inoculated solutions at day 18, (A) Antifouling (Non-scribed); (B) Antifouling (Scribed); (C) Polyurea (Non-scribed); (D) Polyurea (Scribed). Line shows the fitted curve.
Coatings 09 00518 g002
Figure 3. Idealized electrochemical characteristics of coated steel specimens. (a,b) Non-scribed, (c,d) Scribed.
Coatings 09 00518 g003
Figure 4. Example of decoupled fitted and calculated impedance response for antifouling non-inoculated (1) and inoculated (2) test specimens from impedance at day 4, (A) Coatings; (B) Biofilm; (C) Double Layer.
Coatings 09 00518 g004
Figure 5. Bode and −Z” plots of measured impedance for antifouling non-inoculated (1) and inoculated (2) test specimens at day 4. 1 MHz > fm > 1 Hz.
Coatings 09 00518 g005
Figure 6. Correlation of τ from equivalent circuit fitting and ωm resolved from decoupled impedance. (A) Antifouling coating; (B) Polyurea coating.
Coatings 09 00518 g006
Figure 7. Dispersion of characteristic time constants for isolated impedance components. (A) Non-scribed; (B) Scribed. Arrows indicate that no impedance response was associated with biofilm.
Coatings 09 00518 g007
Figure 8. Total Impedance at 1 Hz and 1 MHz for laboratory coated samples. (A) Non-scribed; (B) Scribed.
Coatings 09 00518 g008
Figure 9. Calculated coating capacitance. (A) Non-scribed; (B) Scribed.
Coatings 09 00518 g009
Figure 10. Resolved nominal coating pore resistance. (A) Non-scribed; (B) Scribed.
Coatings 09 00518 g010
Figure 11. Sulfide production due to sulfate-reducing bacterial (SRB) activity. Arrow indicates antifouling coating specimen with greater SRB activity.
Coatings 09 00518 g011
Figure 12. Calculated biofilm capacitance. Arrow indicates that no biofilm developed in the non-inoculated test conditions.
Coatings 09 00518 g012
Figure 13. Calculated interface capacitance and resolved interface resistance. (A) Double layer capacitance; (B) Polarization resistance; (C) Oxide layer capacitance; (D) Oxide layer resistance.
Coatings 09 00518 g013
Table 1. Composition of modified Postgate B medium.
ConstituentsComposition (%)
Potassium Phosphate (KH2PO4)0.05
Ammonium Chloride (NH4Cl)0.1
Sodium Sulfate (Na2SO4)0.1
Sodium Chloride (NaCl)2.5
Iron Sulfate (FeSO4·7H2O)0.05
Sodium Lactate0.5
Yeast extract0.1

