Article

Optical Analysis of RF Sputtering Plasma through Colour Characterization

Centre for Advanced Materials, School of Engineering, London South Bank University, 103 Borough Road, London SE1 0AA, UK
*
Authors to whom correspondence should be addressed.
Coatings 2019, 9(5), 315; https://doi.org/10.3390/coatings9050315
Submission received: 24 February 2019 / Revised: 30 April 2019 / Accepted: 6 May 2019 / Published: 10 May 2019

Abstract

:
The photometric properties of an radio frequency (RF)-based sputtering plasma source were monitored through optical spectroscopy. The colour of the plasma source was deduced based on conventional chromaticity index analysis and it was compared to the direct spectral data plots of the emission peaks to investigate the possibility of characterising the plasma based on its specific colour and exploring the potential of defining a new method by which the plasma sputtering process can be addressed based on the plasma colour parameters. The intention of this investigation is to evaluate the possibility of simplifying the monitoring and assessment of the sputtering process for applied scientists operating plasma sputter deposition systems. We demonstrate a viable potential for this technique in terms of providing information regarding the stability of the plasma, chamber pressure, and plasma power; however, further work is underway to verify and assess a relationship between the quality of the thin film coating and the colour characteristics of the deposition plasma. Here, we only focus on the feasibility of such an approach and demonstrate interesting observations. We observed a linear relationship between the colour functions and the plasma power, while the stability of the sputtering plasma can be assessed based on the plasma colour functions. The colour functions also follow a unique pattern when the working gas pressure is increased.

1. Introduction

Transparent conductive oxides (TCO) are materials that have attracted a significant amount of interests due to their vast application areas. They are an essential part of various optoelectronic devices, solar cell modules, light emitting diodes, and flexible electronics that involve optical elements and the physical vapor deposition (PVD) viz. sputtering under vacuum is one of the methods of depositing a range of materials as a thin film coating, mobile phone touch screens, perovskite solar cells, and OLEDs are examples of technologies that rely on TCOs [1]. When sputter deposition of complex materials, such as metal oxides belonging to the TCO family of materials, is carried out, one can imagine how vital the sputtering conditions are to the way that the atoms are deposited and laid on the substrate surface, which will ultimately define the work function, electron affinity, band-gap, and all of the relevant functional parameters of the as-deposited material. However, plasma sputter deposition technique does not behave like a standard chemical reaction or a process with defined steps. For example, researchers who apply this technique for TCO preparation usually report their findings by stating the condition of the sputtering process, such as chamber pressure, plasma power and the gas composition of the chamber during deposition. However, from one sputter machine to another, depending on the dimensions of the chamber, the size of the targets, and a few other design related issues, TCO coatings with different properties are obtained, even if the sputtering conditions are maintained according to an earlier report. The authors have constantly experienced this ambiguity. We believe there is another way of defining the sputtering conditions. Surely, the plasma in the sputtering procedure is the core of the reaction and is fundamental to the deposition of the thin film coatings. By evaluating the plasma, we can define a set standard for deposition procedures, regardless of the machine being used. We explore this concept by considering the sputtering target surface and the plasma as a light source. However, characterising plasma through optical spectroscopy is nothing new. Currently, plasma physicists study and investigate plasma by means of Emission spectroscopic techniques [2,3,4,5,6,7,8]. The diagnosis of laboratory plasma is usually carried out by optical emission spectroscopy (OES), through which numerous analytical techniques are established to determine the plasma properties, such as electron density, plasma temperature, elements recognition, and quantification of elements that are present in the plasma.
The radiative behavior of the atomic constituents of any plasma can only be predicted if the expected populations of possible states are known and the atoms obey the Boltzmann distribution for every possible state and radiation energy density. Subsequently, it can be assumed that a thermal equilibrium condition is present [4,5,6,7,8,9]. However, creating such a condition in the laboratory would be almost impossible, and hence the concept of local thermal equilibrium (LTE) condition is considered. LTE can be described as a state where the Boltzmann and Saha equation, which governs the distribution of energy level excitation and ionization temperature, are equal to the Maxwell–Boltzmann distribution of free electron velocities [8,9,10]. Achieving the LTE condition depends on defining the plasma by a common temperature T and the existence of sufficient large electron density. McWhirter proposed a criterion where there is a need for a critical amount of electron density for LTE conditions to exist. This criterion is demonstrated by Equation (1), where Ne is the electron density, T is the plasma temperature, and ∆E is the energy gap [11,12,13,14].
N e 1.6 × 10 12 T 1 2 ( E ) 3   cm 3
The temperatures of ions and electrons are directly proportional to their random average kinetic energy, and the distribution of velocities for each particle is governed by the Maxwell distribution when thermal equilibrium conditions apply. Under the LTE conditions, the same temperature is assumed for electrons, ions, and atoms in the plasma and the plasma temperature is referred to as the temperature of the electron [4]. Various methods of plasma temperature determination exist, however, the simplest method by far is the Ratio method, which utilises the intensity of two spectral lines for calculating the temperature of the plasma. The intensity of a spectral line associated with a transition is expressed by Equation (2). In this equation, Iij is the intensity of transition from state i to state j, Aij is the transition probability between the two states, c is the speed of light, N is the number density of electrons, h is the plank constant, gj is the statistical weight of the upper level (j) and λij is the wavelength corresponding to the transition, Ej is the energy of level (j), T is the excitation temperature and k is the Boltzmann constant, and the U(T) is referred to as the partition coefficient, which accounts for the probability and degeneracy of the two states (i and j).
I i j = h c A i j g j N λ i j U ( T ) e E j k T
From the spectral data obtained, two spectral lines can be chosen from the same species and their ionization stages, e.g., Ar I, where there is a large difference in the upper energy level. By taking a ratio (I1)/(I2) of the intensities of the two selected lines, the constants cancel each other out and we will be left with Equation (3), where I1 and I2 are the intensity of comparative peaks due to their respective ij transition [15].
I 1   I 2 = g 1 g 2 A 1 A 2 λ 2 λ 1 e [ ( E 1 E 2 k T ) ]
Solving Equation (3) will give the value of T in electron volts. This method is the simplest method of calculating the temperature of the plasma, and its accuracy is conditional upon using two lines with a maximum difference in their upper energy states.
As an alternative to the ratio method discussed, a method that is referred to as the Boltzmann method can be applied to calculate the temperature of the electron. This method also utilises Equation (2); however, with a rearrangement. The equation is rearranged to give Equation (4). Taking the natural logarithm of both sides of Equation (4) would give us Equation (5) [4,12,13,14,15].
( λ i j I i j h c A i j g i j ) = N U ( T ) e E j k T
ln ( λ i j I i j h c A i j g i j ) = 1 k T ( E j ) + ln ( N U ( T ) )
By plotting the first term of Equation (5) against Ej, the slope of the plot can give us the value of 1/kT, from which value of T can be extracted.
The electron density can be calculated by using various methods, for example, by applying the Stark broadening relationships. The Stark broadening is caused by the electric field of electrons and ions interfering, which results in the broadening of the spectral line. The interference of the mentioned electric fields causes fluctuations in the field of plasma as the radiating atoms are surrounded by the interfering electrons and ions. The electric field of the electrons or ions causes a perturbation of energy levels that are close to the continuum, while simultaneously affecting the externally applied electric field, which ultimately causes the observed spectral broadening. The magnitude of this broadening in terms of its full width half maximum (FWHM) ∆λ1/2 is given by Equation (6).
λ 1 / 2 = 2 ω ( N e 10 16 ) + 3.5 A ( N e 10 16 ) 1 4 ( 1 1.2 N D 1 3 ) ω ( N e 10 16 )
In this equation, ω is the electron impact parameter, A is ionic impact broadening parameter, Ne is the electron density, and ND is the Debye shielding parameter. The first term in this equation is associated with broadening that is caused by electrons and the second term is associated with the broadening that is caused by ions [16]. As the emissions from argon species is considered for the measurements, we can hence eliminate the second term of the equation that relates to the other ions to obtain Equation (7) [15,16,17]. Hence, rearranging the equation and obtaining the ∆λ1/2 value can calculate the Ne.
λ 1 / 2 = 2 ω ( N e 10 16 )
All of the methods that we have mentioned so far are some of the OES methods of measuring the electron density and electron temperature in a plasma. These methods are familiar among plasma physicists; however, when it comes to the application of sputtering plasma and thin film analysis, using the above-mentioned techniques will require the necessary expertise and precision spectroscopy and data interpretation. Many scientists or operators who use plasma deposition for the preparation of thin film coatings would ultimately require a machine that would be easy to use and produce consistent thin film coatings. Our objective is to simplify the operation of the sputtering technique for the users and possibly propose a simpler monitoring diagnostic methodology for the plasma deposition process.
We are reporting a novel strategy of the in-situ characterization of plasma in a sputtering process by translating the emission spectra into a colour indexing (chromaticity) pattern that is able to quickly monitor any changes in the plasma character with a change in the operating parameter conditions during the course of the process, which in turn provides a better handle to reflect the instabilities of the tool and its optimizing parameters. This is a radical conceptual proposition that can potentially simplify the evaluation of the sputtering plasma for applied scientists by theorising a unique characterisation parameter for particular plasma deposition conditions, just like a fingerprint. As an analogy, to clarify our objective, we can divert our attention to the human genome that defines each individual person based on the composition and arrangement of billions of complex genetic coding embedded within each person’s DNA, complex laboratory procedures can be used to sequence and encode the genetic makeup of individuals; however, a simpler approach to distinguish people from one another is to check their fingerprint or iris patterns, rather than conducting the complex genetic complexity that defines the individual. Indeed, that is the objective of this communication. By considering the plasma as a light source, we will focus on its most apparent character; its colour. We will be focusing on the colour of the sputtering plasma light and identifying patterns that may relate its colour to certain fundamental parameters that are involved in generating the plasma, such as the driving power, the working gas, and its pressure. Plans are underway to further investigate the relationship between the thin film coatings that are deposited via this technique and the plasma colour with reports in due time. The colour of any light source can be mathematically described through what is known as colour spaces. A colour space is a completely-specified scheme for describing the colour of light, ordinarily using three numerical values (called coordinates). An important colour space, defined by the International Commission on Illumination (CIE, the initials of its French name), is the CIE XYZ colour space [18]. However, it is wholly defined in terms of human’s perception of light through their eyes. If two instances of light appear to a viewer to be the same colour, they are the same colour. Colour is usually recognized by the viewer as having two aspects:
  • Luminance, as an indication of the “brightness” of the light.
  • Chromaticity, the property that distinguishes colours.
Colour is not a primary physical property, like the temperature or pressure of a gas. Colour is related to the energy of photons that make up the light. Plotting the intensity of the photon energies (power) that are associated with the relevant wavelength will produce a spectral plot. The intensity and distribution of the emitted wavelengths that ultimately shape the plot determine the chromaticity of the light; its overall “vertical scale” determines its luminance [
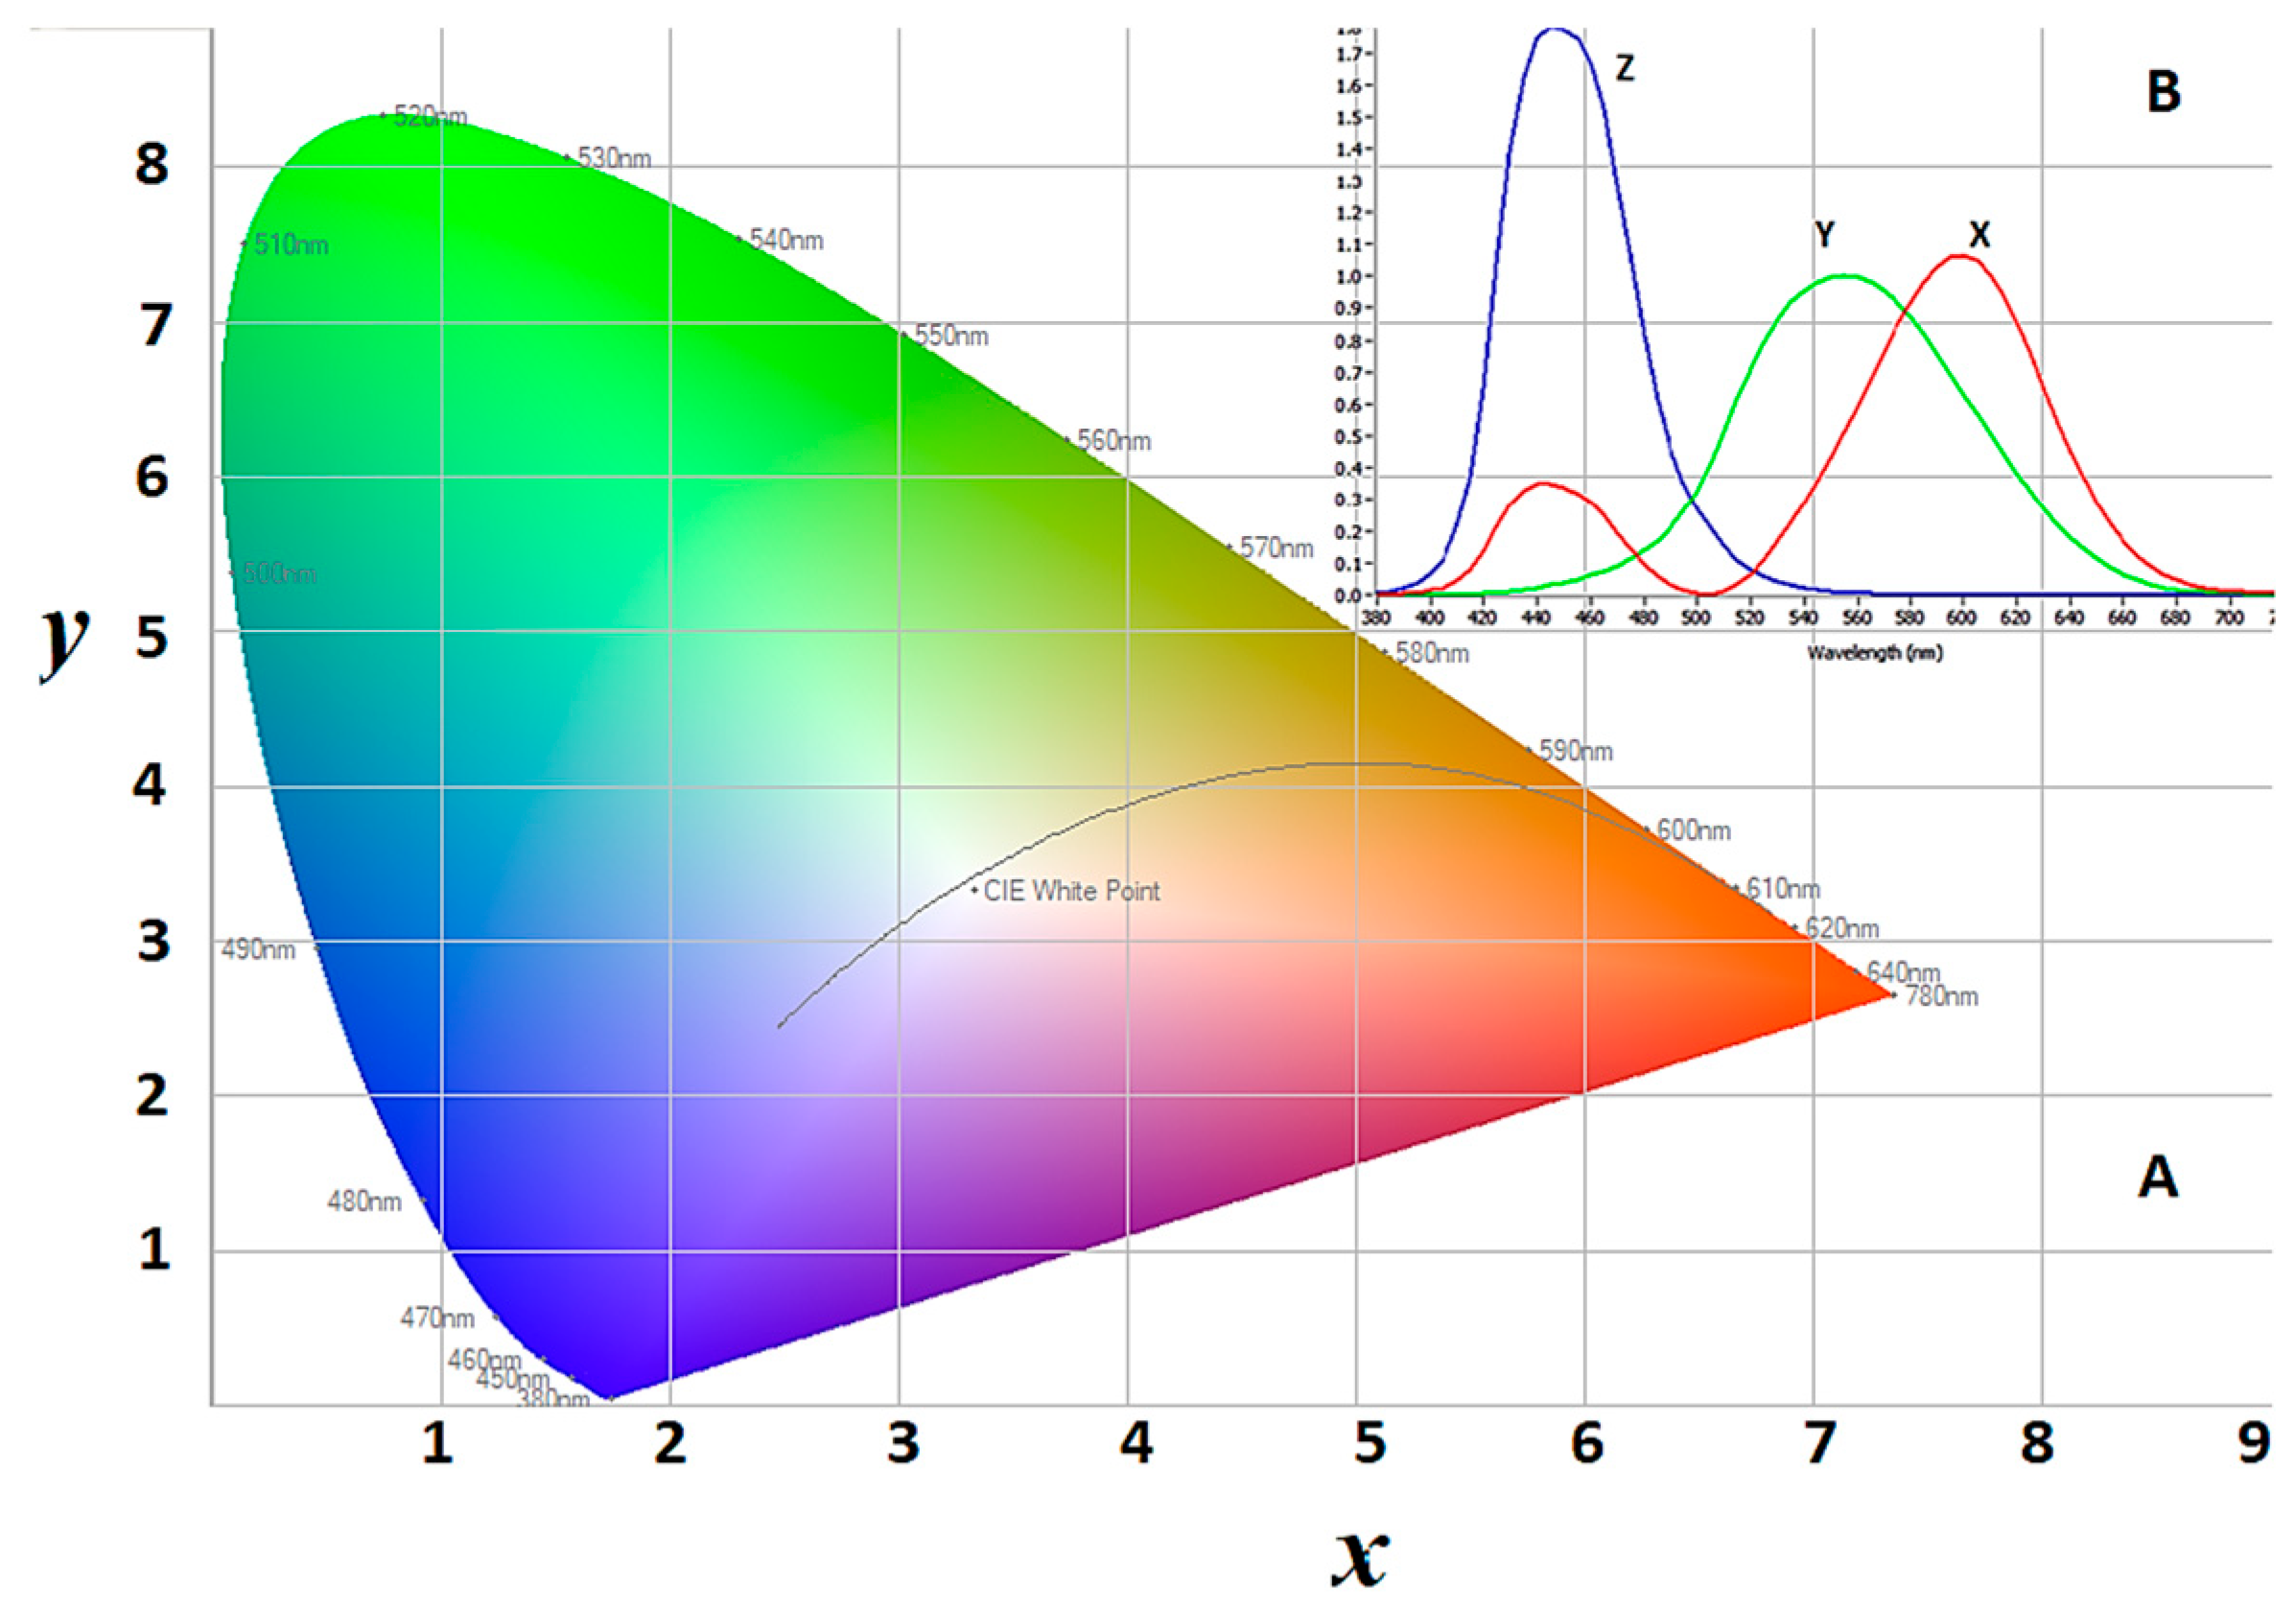
18]. In fact, there can be several instances of light with different spectrums, which nevertheless have the same colour. This situation is called metamerism. Through mathematics, the XYZ colour spaces are used to construct the x,y colour function, which is presented in Figure 1A, where the specified area under the defined emission spectrums are used to calculate the coordinates in Figure 1B.
A luminance-chromaticity space (Figure 1B) is then constructed by defining two values; x and y, as follows:
x = X Z + Y + X
y = Y Z + Y + X
In these equations, as described in Figure 1B, the X, Y, and Z represent the area under emission peaks in the regions. By plotting the x against y, the CIE x, y chromaticity diagram is constructed and is used to give a specific sense to a particular colour (Figure 1B).
Another photometric parameter is the radiance and spectral radiance of the plasma light. The radiance indicates how much radiant flux is emitted by a surface when it is received by an optical system looking at that surface. The radiance value is calculated by measuring the Radiant flux of an emission source, which is the radiant energy emitted per unit time. Spectral radiance expresses radiance as a function of frequency or wavelength and the spectral plot of the emission is based on the radiance value as a magnitude of intensity [18].
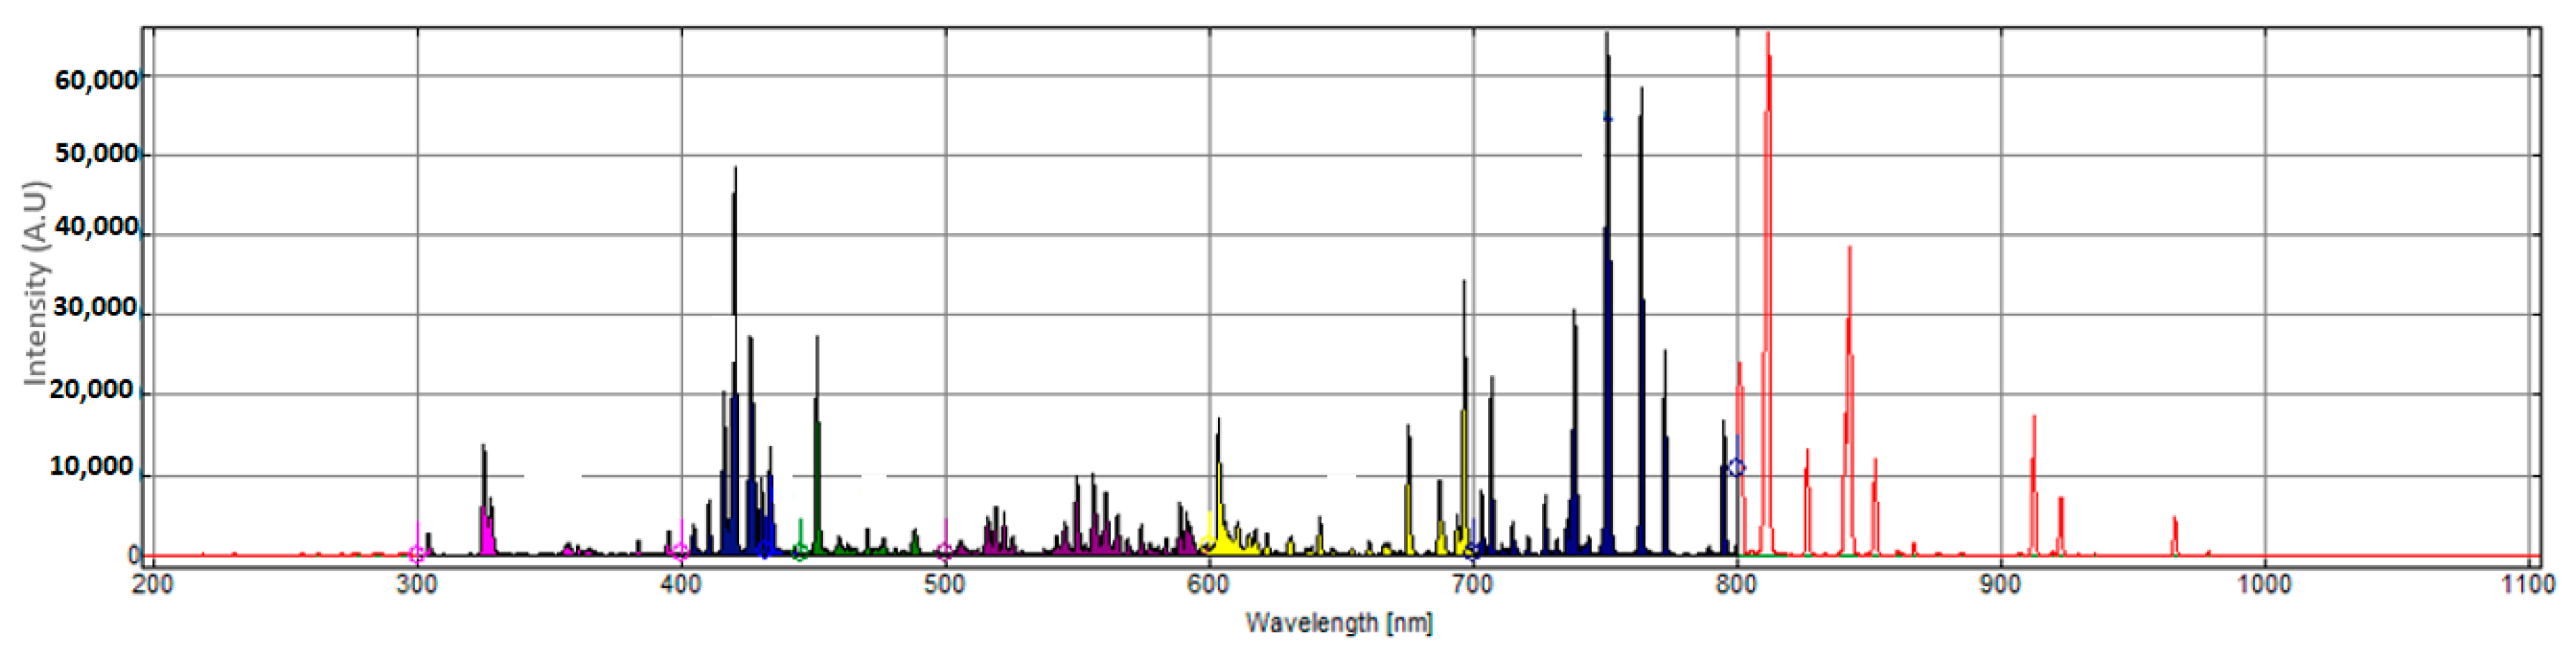
Within a sputtering plasma, a significant number of energy transitions are occurring, leading to a complex emission spectrum. These emissions ultimately define and construct the spectral plot of the plasma as a light source that is observed in plasma. The efficiency and characteristics of the sputtering process depend on the characteristics of the plasma, which in turn depend on the density of the particles and energies within the plasma [19]. Through complex procedures, some of which we already discussed, the electron temperature and electron density, meta-stable atoms, and ions can be deduced and estimated from the spectral plot [20,21,22,23]. If the colour parameters can be identified and linked to the existing plasma analysis techniques, it can benefit applied scientists to perform and conduct thin film depositions and can have an easier method of assessing the specifics of the plasma being used.
Due to the extensive optoelectronic applications, high interest in transparent conductive oxides, such as ITO, AZO, and IZO, and their deposition characteristics via plasma sputtering exists and there is plenty of literature available from various research groups [24,25]. These materials are of high interest to many photovoltaic researchers, and hence we have focused on evaluating the light from a sputtering magnetron plasma source that was fitted with an IZO target and the objective here is to take a radical diversion from the complexity of the conventional plasma characterisation techniques and observe the colour of the plasma and explore the feasibility of exploiting the colour characteristics of the plasma as an indicator of the coating process. The authors realise that, still, a significant number of energy transitions occur in the UV and IR region of the spectrum that are not accounted for when constructing a conventional chromaticity diagram; however, this work is an initial focus on clarifying the feasibility of such a radical approach, after which further efforts can be invested on to modelling a plasma colour analysis system that can provide a shortcut into the characterisation of a sputtering plasma.

2. Experimental

The sputtering machine used for these experiments was a V6000 unit that was manufactured by scientific vacuum systems limited (SVS Ltd., Wokingham, UK) with a vacuum chamber of ~40 cm × 40 cm × 40 cm. The magnetron of the V6000 unit was fitted with a six inch 99.99% pure Indium Zinc Oxide (IZO) target material with copper indium back bond for efficient thermal dissipation. Spectral data from the plasma was obtained by placing an in-vacuum collimator optic probe that was made by Plasus GmbH (Mering, Germany). The probe was installed on the magnetron, so that it horizontally collected light from ~1.5 cm away from the surface of the target and at a distance of 4 cm from the edge of the target (Figure 2A). The unique feature of the optic collimator is the honeycomb structure of the photon inlet, which traps the sputtering particle and prevents gradual coating of the collimators quartz window. This is highly important, as any coating of the inlet quartz window will undermine the reliability of the data obtained. We tested the quartz lens for any possible coating by running a continuous 5 h deposition experiment followed by dismantling the collimators (Plasus GmbH, Mering, Germany) and using UV/VIS spectroscopy (Bibby Scientific Ltd, Staffs, UK) to check the inlet quartz window for any coatings formed to ensure the data were not undermined (Figure 3A). The collected light was then guided to two different spectrometers; a Jeti Specbos 1201 spectrometer (Jena, Germany) that calculates the chromaticity index of the light, the Jeti was programmed, so that, for each measurement, it took 20 readings and inputted the average. A second spectrometer; Plasus Emicon Spectrometer (Mering, Germany) that generates a detail spectral plot of the emission was used for detailed spectral analysis.
Using the IZO target fitted onto the magnetron, a series of tests were carried out by igniting and running the plasma under various conditions. The working gas, working gas pressure, and radio frequency (RF) plasma power were varied and data were collected. Two types of working gases were used, pure Argon (Gas Ar) and 95% Argon: 5% Hydrogen (Gas ArH). Table 1 defines the experimental regime undertaken.

3. Results

3.1. Chromaticity of the Plasma Emissions

The emission characteristics in terms of the whole spectral plot and the chromaticity index were obtained for each test group.
Test 1, from the moment that the plasma is ignited, the spectral data can be obtained from it. However, by plotting the chromaticity x, y values of the plasma light from a cold start, these values will keep varying for up to 2 h. After 2 h, the variance in the x and y values that were obtained will significantly reduce; this is the point where we can consider the plasma to be stabilized or more stable. Figure 4 presents this observation.
To demonstrate the complexity of relying on the conventional methods, such as the peak intensity ratio method, to monitor the progress of the plasma toward stability, the spectral plot of the 100 W Argon plasma over a period of one hundred and thirty minutes post-plasma ignition are presented in Figure 5. As an example, particular transitions that were previously evaluated by other authors for measuring electron temperature and density were chosen to measure these data [26]. The ratio plot that is presented in Figure 5A is related to the intensity ratio of 404.44 nm (Ar-I) transition 3s23p5(2P°1/2)5p 2[3/2] 2 to 3s23p5(2P°3/2)4s 2[3/2]° 1 and 426.62 nm (Ar-I) transition 3s23p5(2P°3/2)5p 2[3/2] 2 to 3s23p5(2P°3/2)4s 2[3/2]° 1. The ratio plot presented in Figure 5B is related to the intensity ratio of 480.60 nm (Ar-II) transition 3s23p4(3P)4p 4P° [5/2] to 3s23p4(3P)4s 4P [5/2] and the 470.23 nm (Ar-I) transition 3s23p5(2P°3/2)5p 2[1/2] 1 to 3s23p5(2P°1/2)4s 2[1/2]° 1. It can be seen that it will be challenging to apply the peak intensity method as an instant real time monitoring technique. This highlights the novelty of using colour function as a mean to monitor the plasma stability as the chromaticity plot of the x and y values clearly demonstrates a linear path toward the stable x, y chromaticity values.
Test 2, the RF power that was used to ignite and run the plasma is the source of energy for ionising the working gas and driving the sputtering process. Higher energy will result in more excited and metastable atoms to be created, and consequently will increase the bombardment of the target surface. During this part of our investigation, after stabilising the plasma at 100 W, the power was increased up to 300 W and data was collected at ~9 s intervals under argon. A clear linear relationship can be observed between the chromaticity value and the plasma power, as presented in Figure 6. The values of x and y decrease with increasing the RF power and a shift toward blue in a linear manner is also observed.
In Test 3, an interesting pattern is observed by increasing the pressure of the chamber under each Gas (Ar or ArH), after the plasma has been stabilized, which is highlighted in Figure 7 and Figure 8. The test was started with the lowest pressure achievable based on the mass flow controller of the machine (1.2 × 10⁻³ mbar) and then the pressure was increased. With increasing the pressure, the x and y values start to increase, but, at a certain point, a loop is made (a U-turn shape) and it starts to decrease with higher pressure.
The spectral plot of the plasma emission under various pressures clearly shows an increase in the intensity of some of the transition lines with increasing the pressure, which ultimately affects the x and y reading (for example, the data obtained from IZO target and Argon gas at various pressures is presented in Figure 9).
The rise in the intensity of all the peaks is simply due to the larger number of excited atoms and well known, however, the exact mechanism by which the x, y values make such a U-turn pattern is possibly related to complex switching of the electronic transitions, and hence it is related to the area under emission peaks of certain transitions across the spectrum and these peak areas are related to the microenvironment of the plasma and the interaction of the plasma constituents, distribution of energy, electron temperature, and charge densities involved, but the exact mechanism needs further attention and research, this suggests that there is a possibility of correlating the colour to the plasma’s physical state.
This is currently being investigated by the authors through the monitoring of the above-mentioned factors affecting the plasma constituents and will be reported separately. Here, the core of the current communication is a focus on the currently observed data in terms of colour indications.
Finally, another particular observation was made; once the IZO target material is exposed to gas ArH and under a stable plasma, switching from ArH to Ar does not lead into a direct swift stable reading, rather for a period up to ~1 h, the values of x and y fluctuate. The fluctuation is only observed when going from gas ArH to Ar, and not from Ar to ArH under the same protocol, which indicates the possible incorporation of hydrogen into the target material similar to the target poisoning process, however this cannot be verified prior to close investigation of the target material. Figure 10 presents this observation.

3.2. Optical Emission Spectroscopy of the Plasma Emissions

In the previous section, we focused on the chromaticity (colour) of the emission, parallel to these studies we obtained the optical emission spectroscopy of the plasma, and here we shall demonstrate the results that are associated with the experiments involving only the Argon gas as a comparative guide to enable to discuss the observations seen through chromaticity analysis.
During Test 1, the stability of the plasma was monitored through the colour functions, at the same time, we obtained the optical emission data of the spectra and divided the spectrum to seven sections: a, b, c, d, e, f, and the UV. Figure 11 presents these sections: the UV covered emissions from 300–400 nm, a: 400–430, b: 431–449, c: 450–500, d: 500–600, e: 600–700, and f: 700–800 nm. Figure 12 and Figure 13 represent the possible emission transitions in these regions. The area under each region was calculated and monitored. The area via integral under each peak region was then used for further analysis of the data to monitor the variations of the area as a dependent of various experimental parameters that was already discussed: duration of emission stability, RF power applied to the magnetron, and the various operating Argon pressures.
The area under all of the regions was summed, and then the ratio of the area under each section of the study was calculated as a percentage of the total area under the peaks to visualise how the emissions from the associated transition changed during plasma stabilisation and when the parameters, i.e., power and Argon pressure, were changed. In Figure 14, the stability of the plasma over time is monitored over a total period of 5000 s at intervals 1000 s, e.g., T1: 0 to 1000 s, T2: 1000–2000 s, etc.
It can be seen that some of these regions demonstrate a progressive increase in their emission ratio when compared to the overall ratio, while some demonstrate a reduced ratio of emission to the whole emission intensity. Ultimately, the area under the peak readings tend to move toward stabilisation, and is this very much in agreement with our observation of the chromaticity data.
Figure 15 presents the effect of the RF power applied to the magnetron on the emission peak areas of the spectral segments, where it is clearly noticeable that an increase in the emission ratio is observed in sections a, b, and c, while d, e, and f demonstrate a reduction. There seems to be a linear trend in both cases. This is interesting and it matches our observation of the chromaticity indices, which also demonstrated a linear relationship with plasma generating power.
Figure 16 presents the effect of the chamber pressure on the regions of the emission spectrum and the ratio of the peak areas to the overall area covered. Just like the previous cases, we can see that the different sections of the spectrum demonstrate different trends in terms of increase or decrease of the peak areas. Once again, each section is demonstrating either an increasing or decreasing ratio of emission areas to the overall spectral emission area under the peaks. Although the UV emission region (300–400 nm) and the f section of the spectrum (700 to 800 nm) are not used for calculating the chromaticity indicates, the data were presented here to demonstrate the spectral property of the plasma at those regions. The results for the UV section of the spectrum are separately presented in Figure 17. Where the UV emissions peak area demonstrate an increasing trend over the 5000 s period and demonstrate a linearly increasing relationship with the plasma power, the higher chamber pressure seems to reduce the ratio of the UV emissions to the overall emission within the spectrum.

4. Discussion

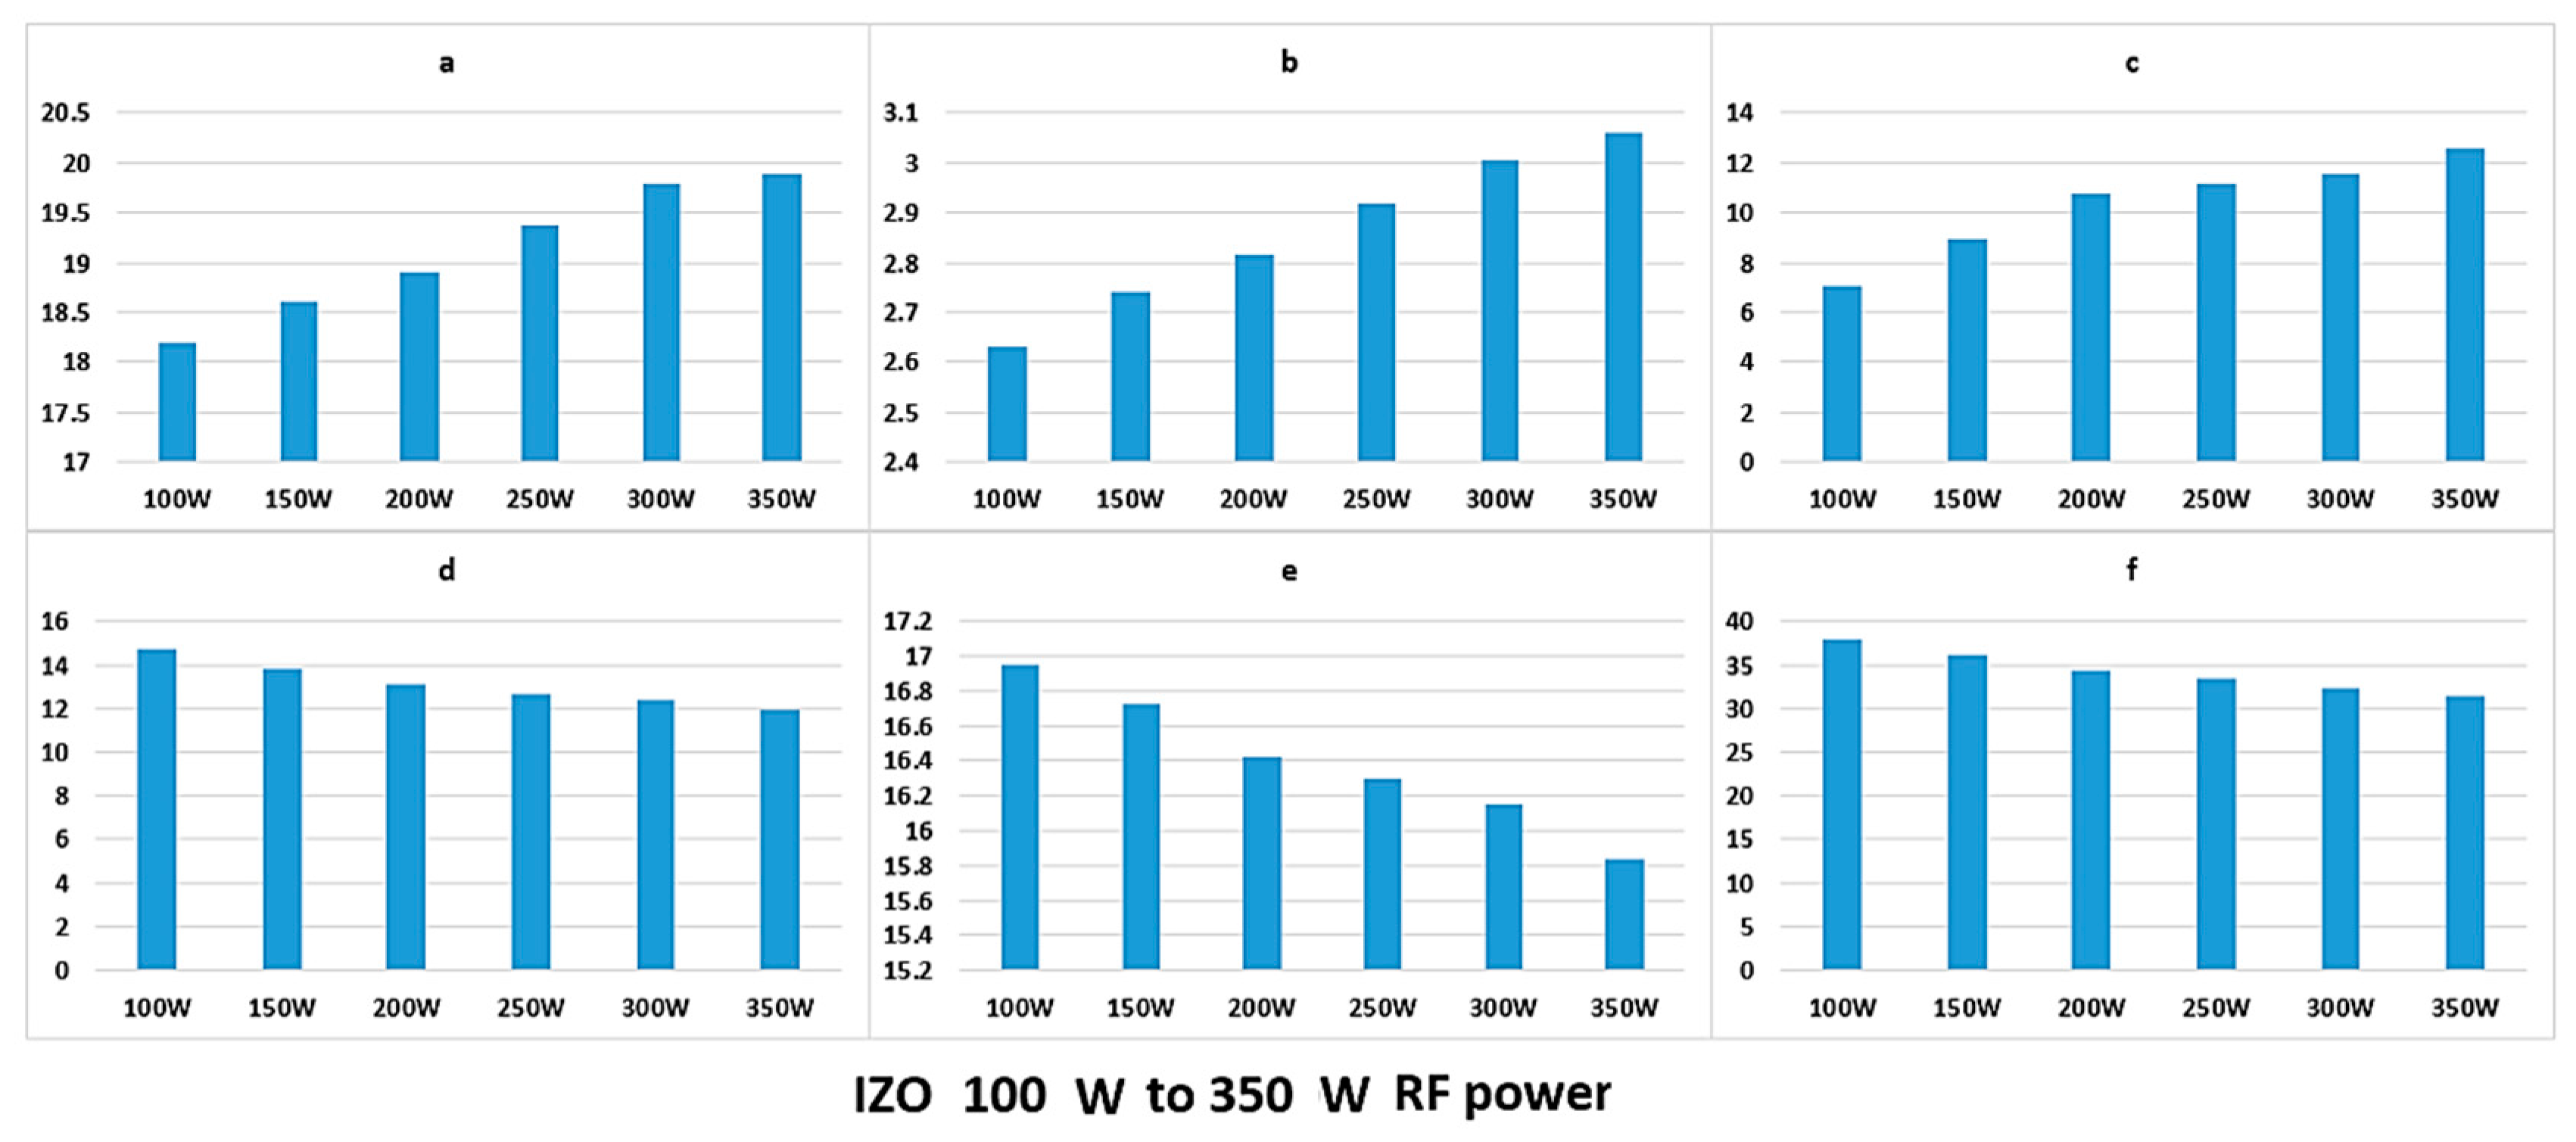
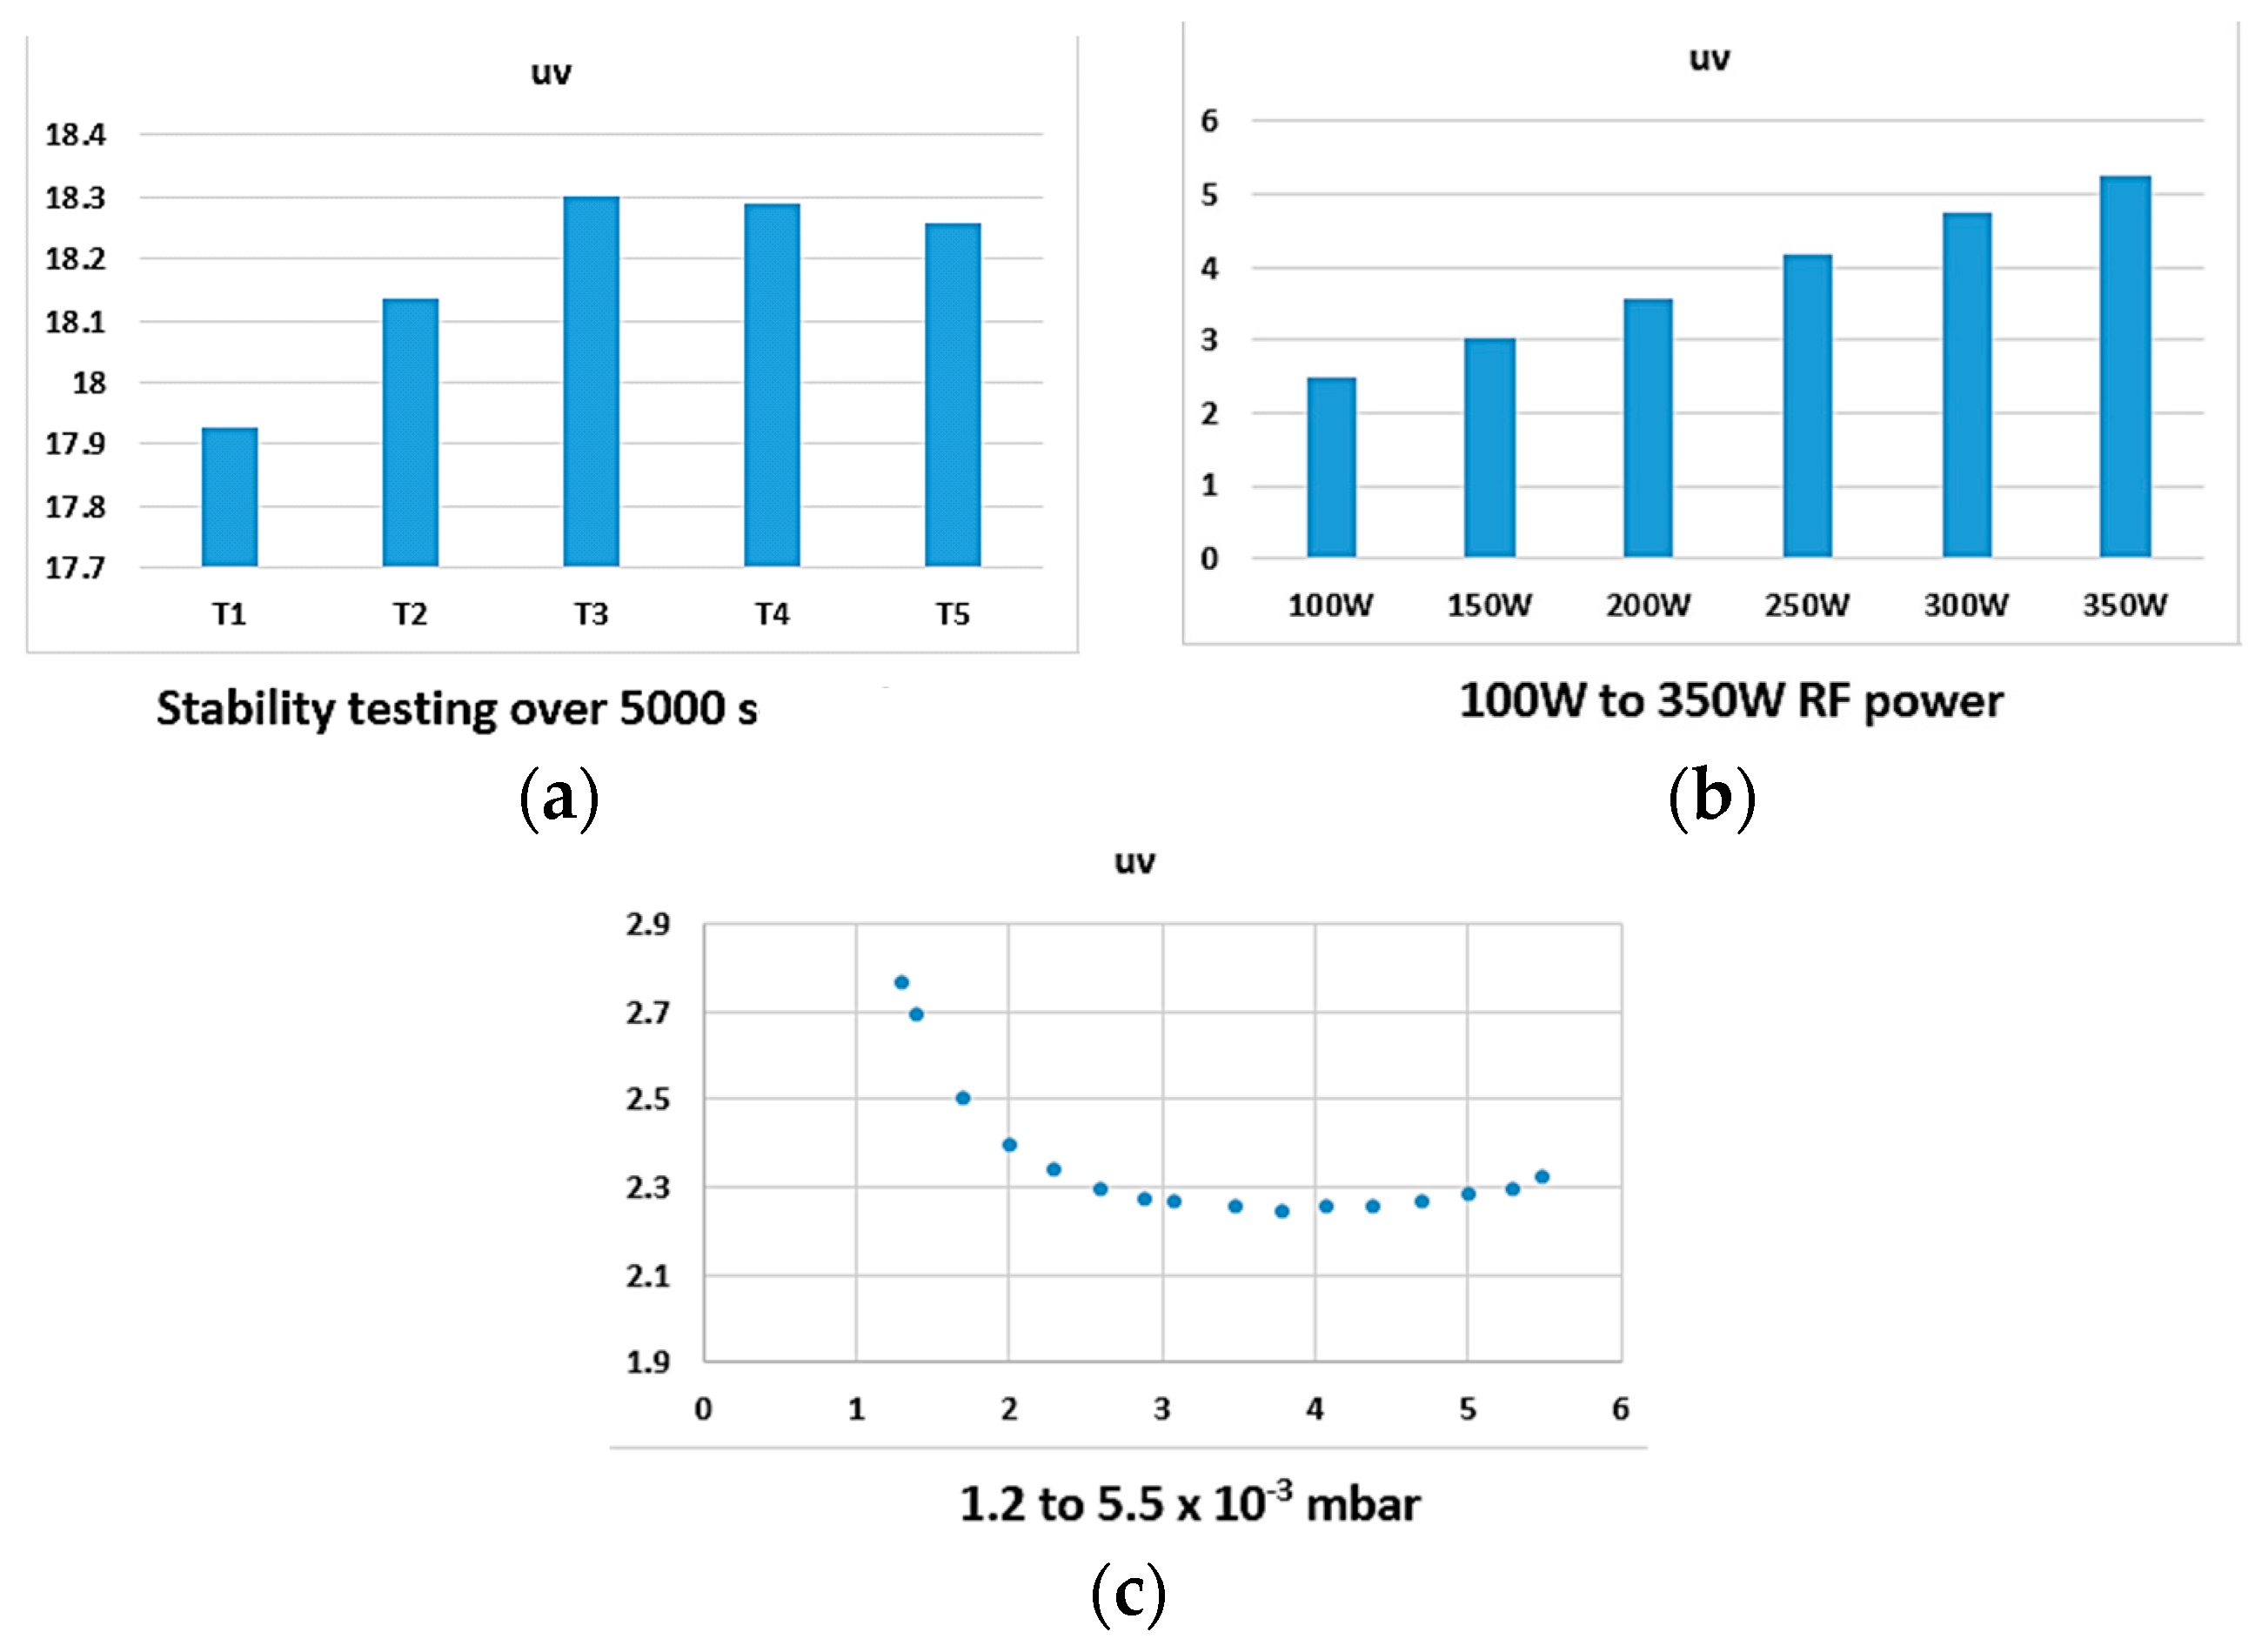
Here, we have demonstrated how the complex analysis of the emission spectrum can be summarised by applying the colour coordinates of the plasma light. The calculation of the colour functions is extracted through the area that is covered under the emission peaks of the plasma light that are affected by various parameters. Higher plasma power simply provides more energy toward the ionization of the working gas atoms. A higher density of ionized atoms, in turn, give a higher flux of emission and, as such, increase the intensity of the spectra. By increasing the power of the plasma, the number and momentum of the argon ions and sputtering particles are both increased, which results in higher bombardment rate of the target surface and higher mobility of the atoms at the deposited thin film surface. The higher mobility of the atoms will reduce the stress at the thin film surface, and hence facilitates further crystallisation [27].
The discharge current linearly increases with increasing the plasma power, irrespective of the chamber pressure. The energy of the sputtered atoms arriving at the surface of the substrate increases with increasing the plasma power. Parallel to this, the effect of high energy bombardment of the substrate surface is also increased, providing thermal energy at the surface atoms to become more mobile. Overall, the higher plasma power should lead to more crystalline deposition of thin films. However, excessive power can have an adverse effect by causing degradation of the thin film surface, resulting in high defect density [28]. We have demonstrated that the colour functions demonstrate a linear relationship with the plasma power, hence giving this technique the potential of defining a relationship between the film properties and the x and y colour coordinates, we will be exploring this further in future work.
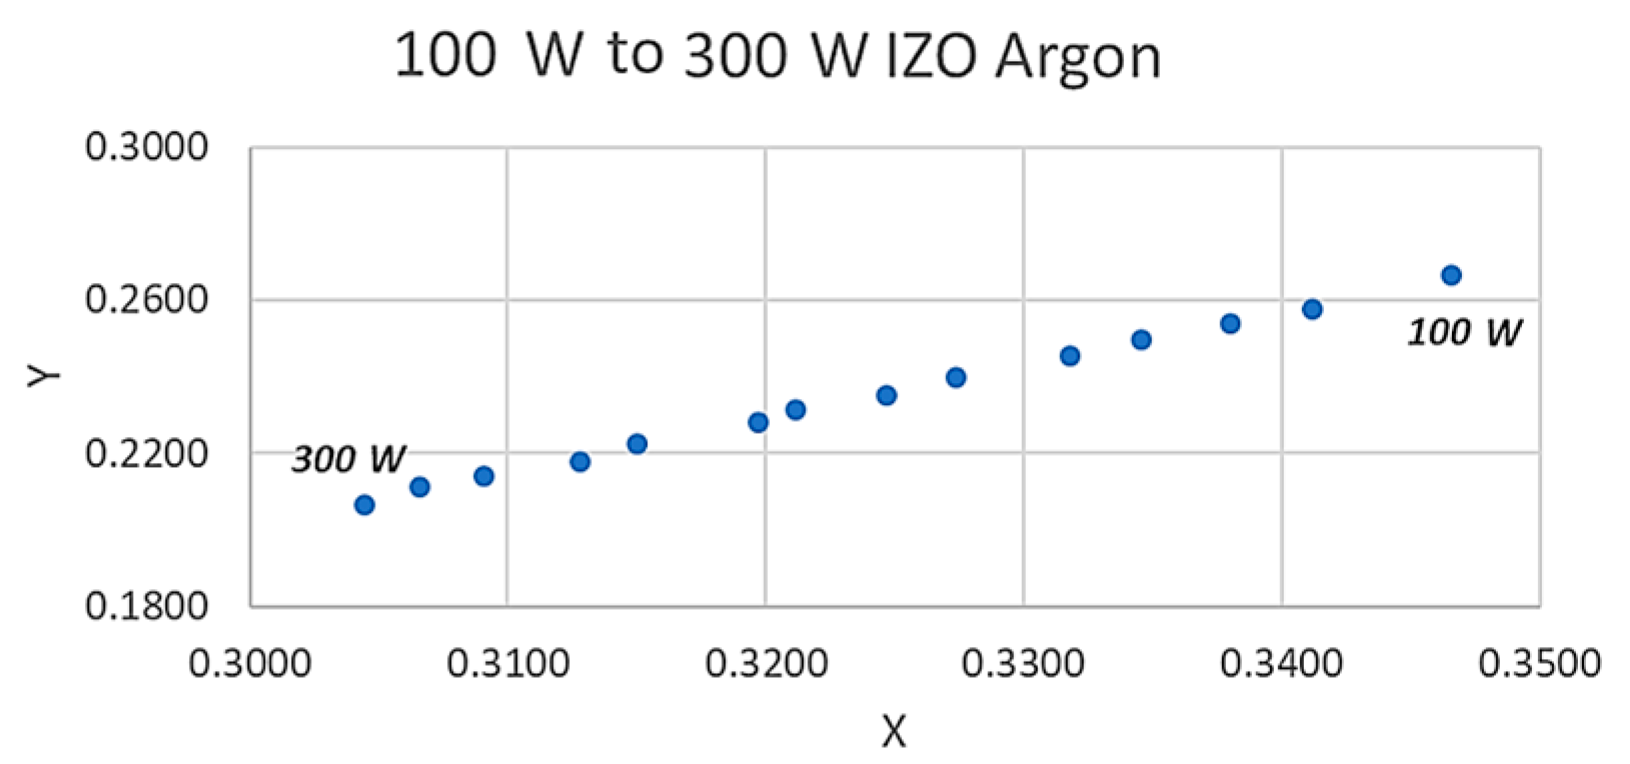
If all of the peaks would increase at the same rate with increasing the power, the chromaticity parameters should not change, but in Figure 6 we observed a linear trend in how the x and y values are plotted against each other. This indicates that as the plasma power is increased and different energy bands tend to respond to the higher magnitude of the power. This is currently under our investigation and the reason that we have the section 400 to 500 nm section of the spectrum divided into three sections is part of our efforts on understanding this observation; however, as yet, our findings are not conclusive and hence no further explanation or claims can be made at present. However, from an applied scientist or an operator of a plasma deposition system, the relationship observed in figure six is a simple observational method if in depth an operator does not require theoretical knowledge. The broadening of the spectral lines, as discussed in the introduction, are ultimately related to the electron density via the stark broadening process. The colour functions are calculated from the area under the emission peaks, hence this broadening is taken into consideration during the colour coordinate measurements and present a simplified form of data for the operator, who may be only interested in basic monitoring protocols and not necessarily wish to indulge in to the complex statistical mechanics of the plasma. A similar argument can be applied for the emission line shapes which are strongly influenced by the interaction of the radiating atoms or ions with surrounding particles. All of the spectral data that were obtained during these experiments were carried out using the same distance between the collimator head and the plasma. It is important to acknowledge that this distance is highly important and it can influence the spectra of the plasma and it is part of our ongoing research objectives to investigate various distances of the collimator and the plasma. Through the data presented in 
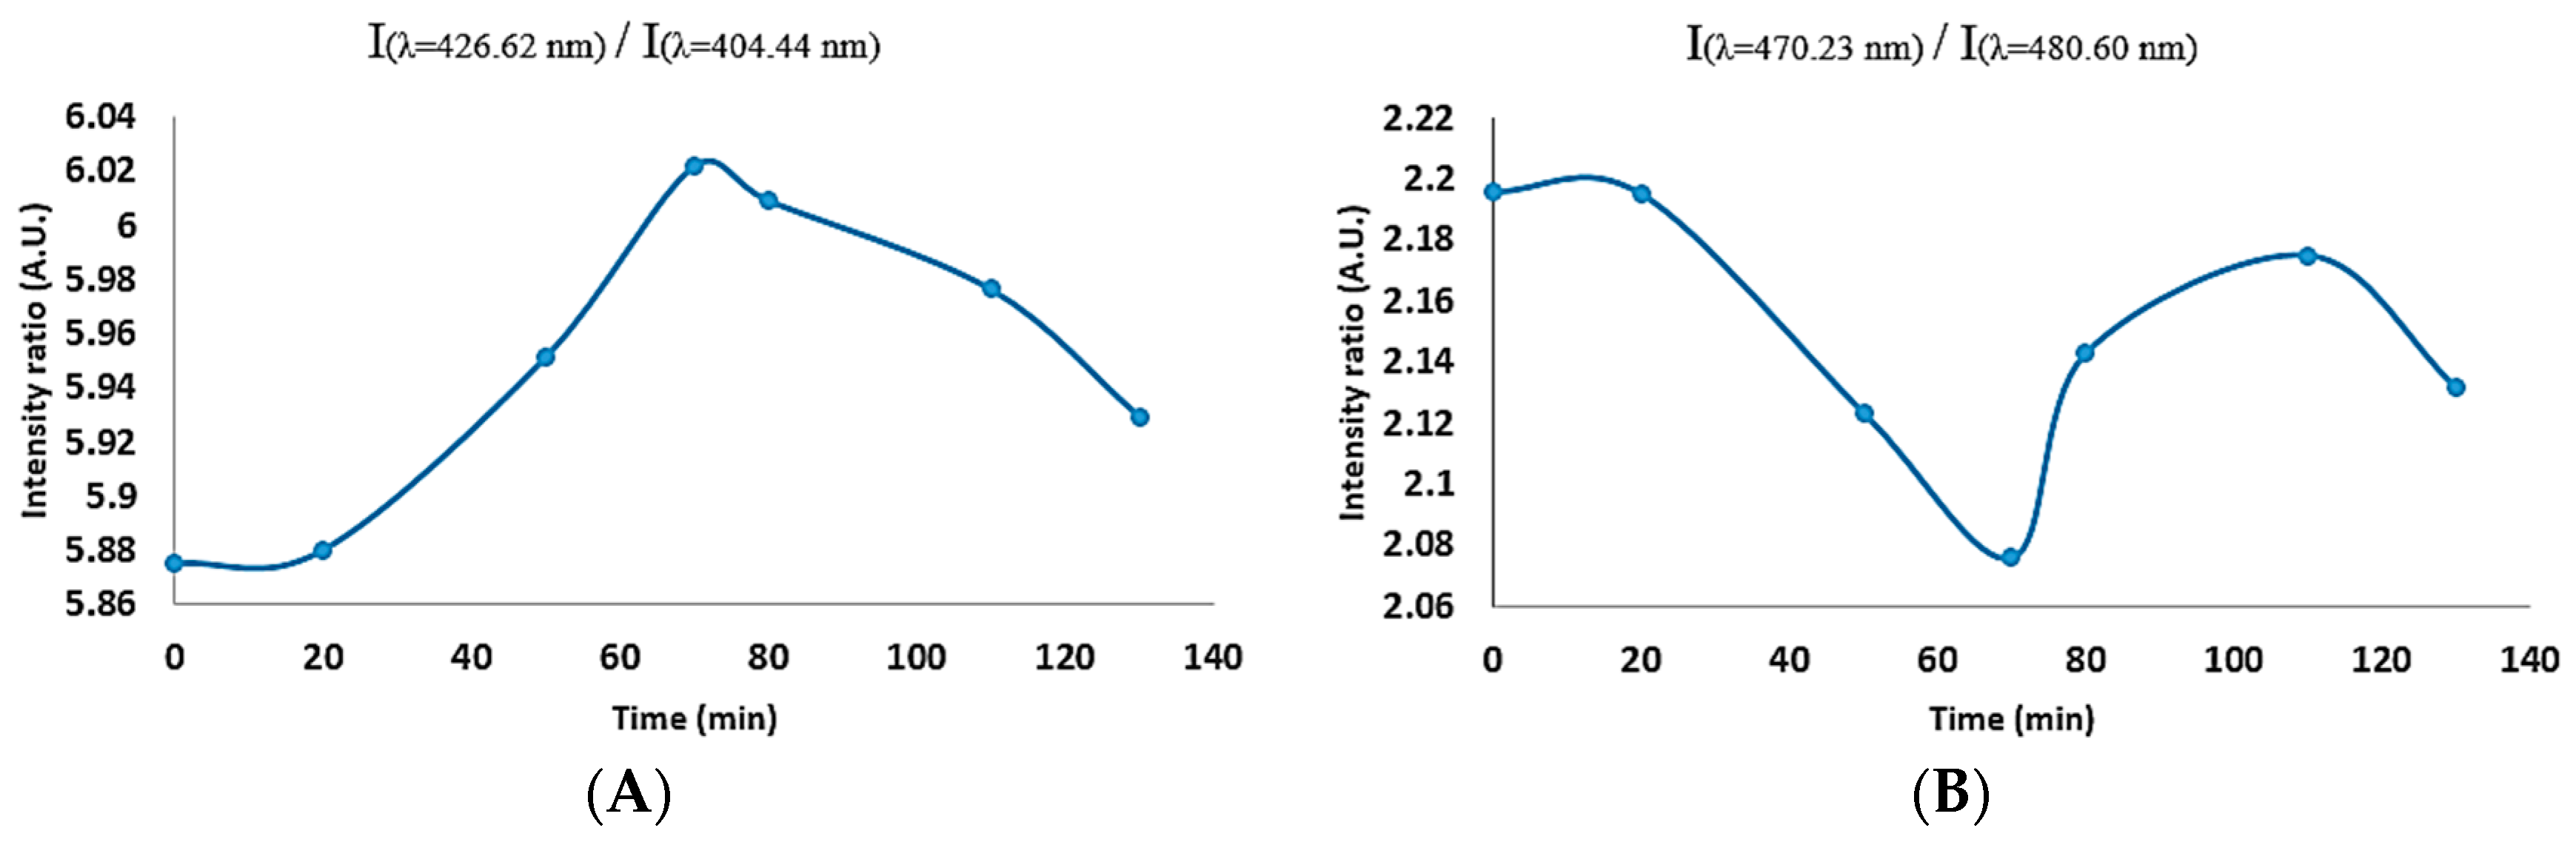
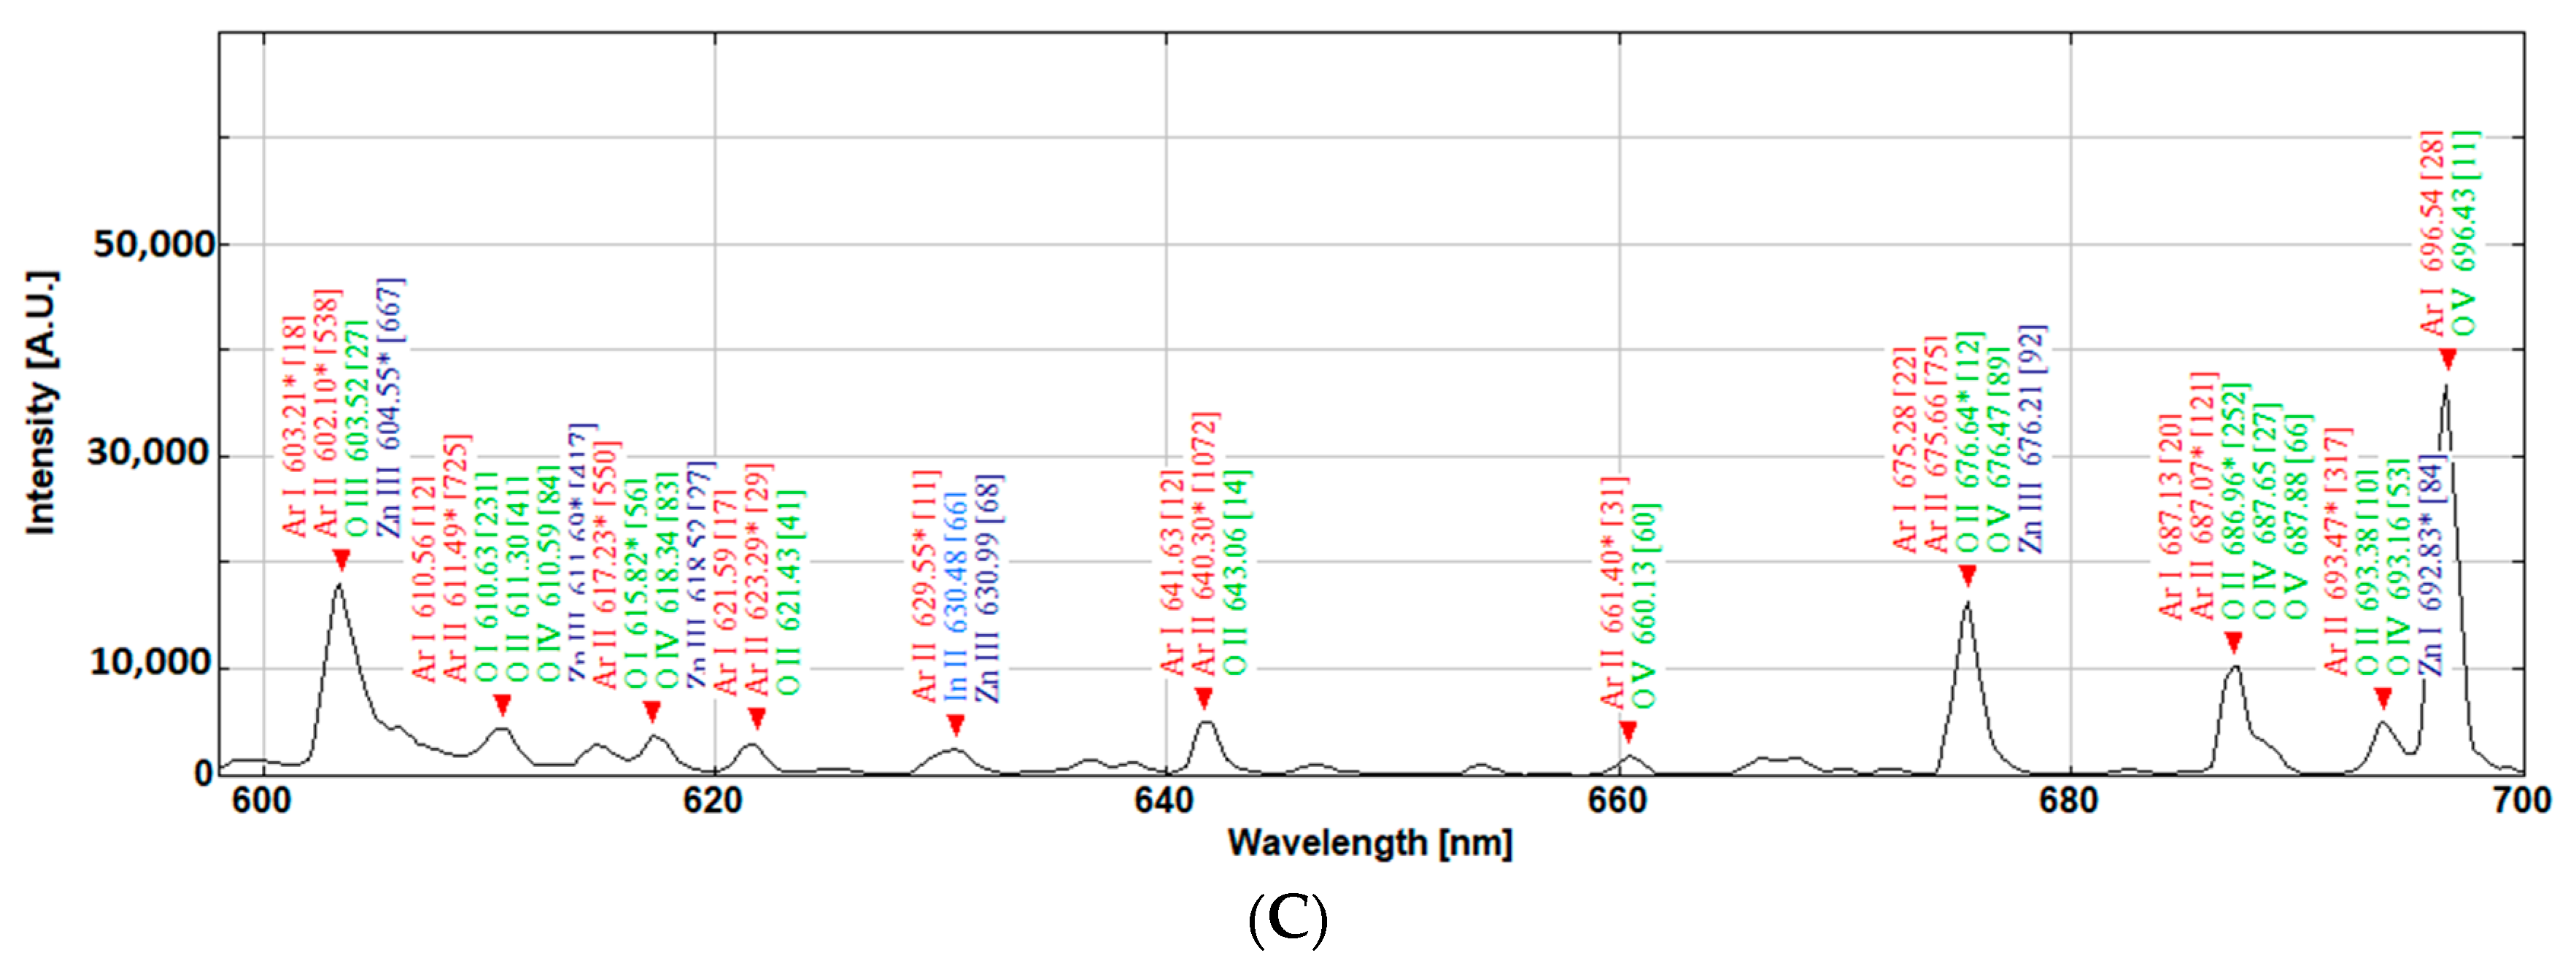
Figure 5, we also demonstrated that, when trying to identify the stability of the plasma through the line ratio method, there may be confusion as certain peaks may increase or decrease, irrespective of their initial magnitude and ratio, while our proposed colour index values can provide a simple root to follow. 
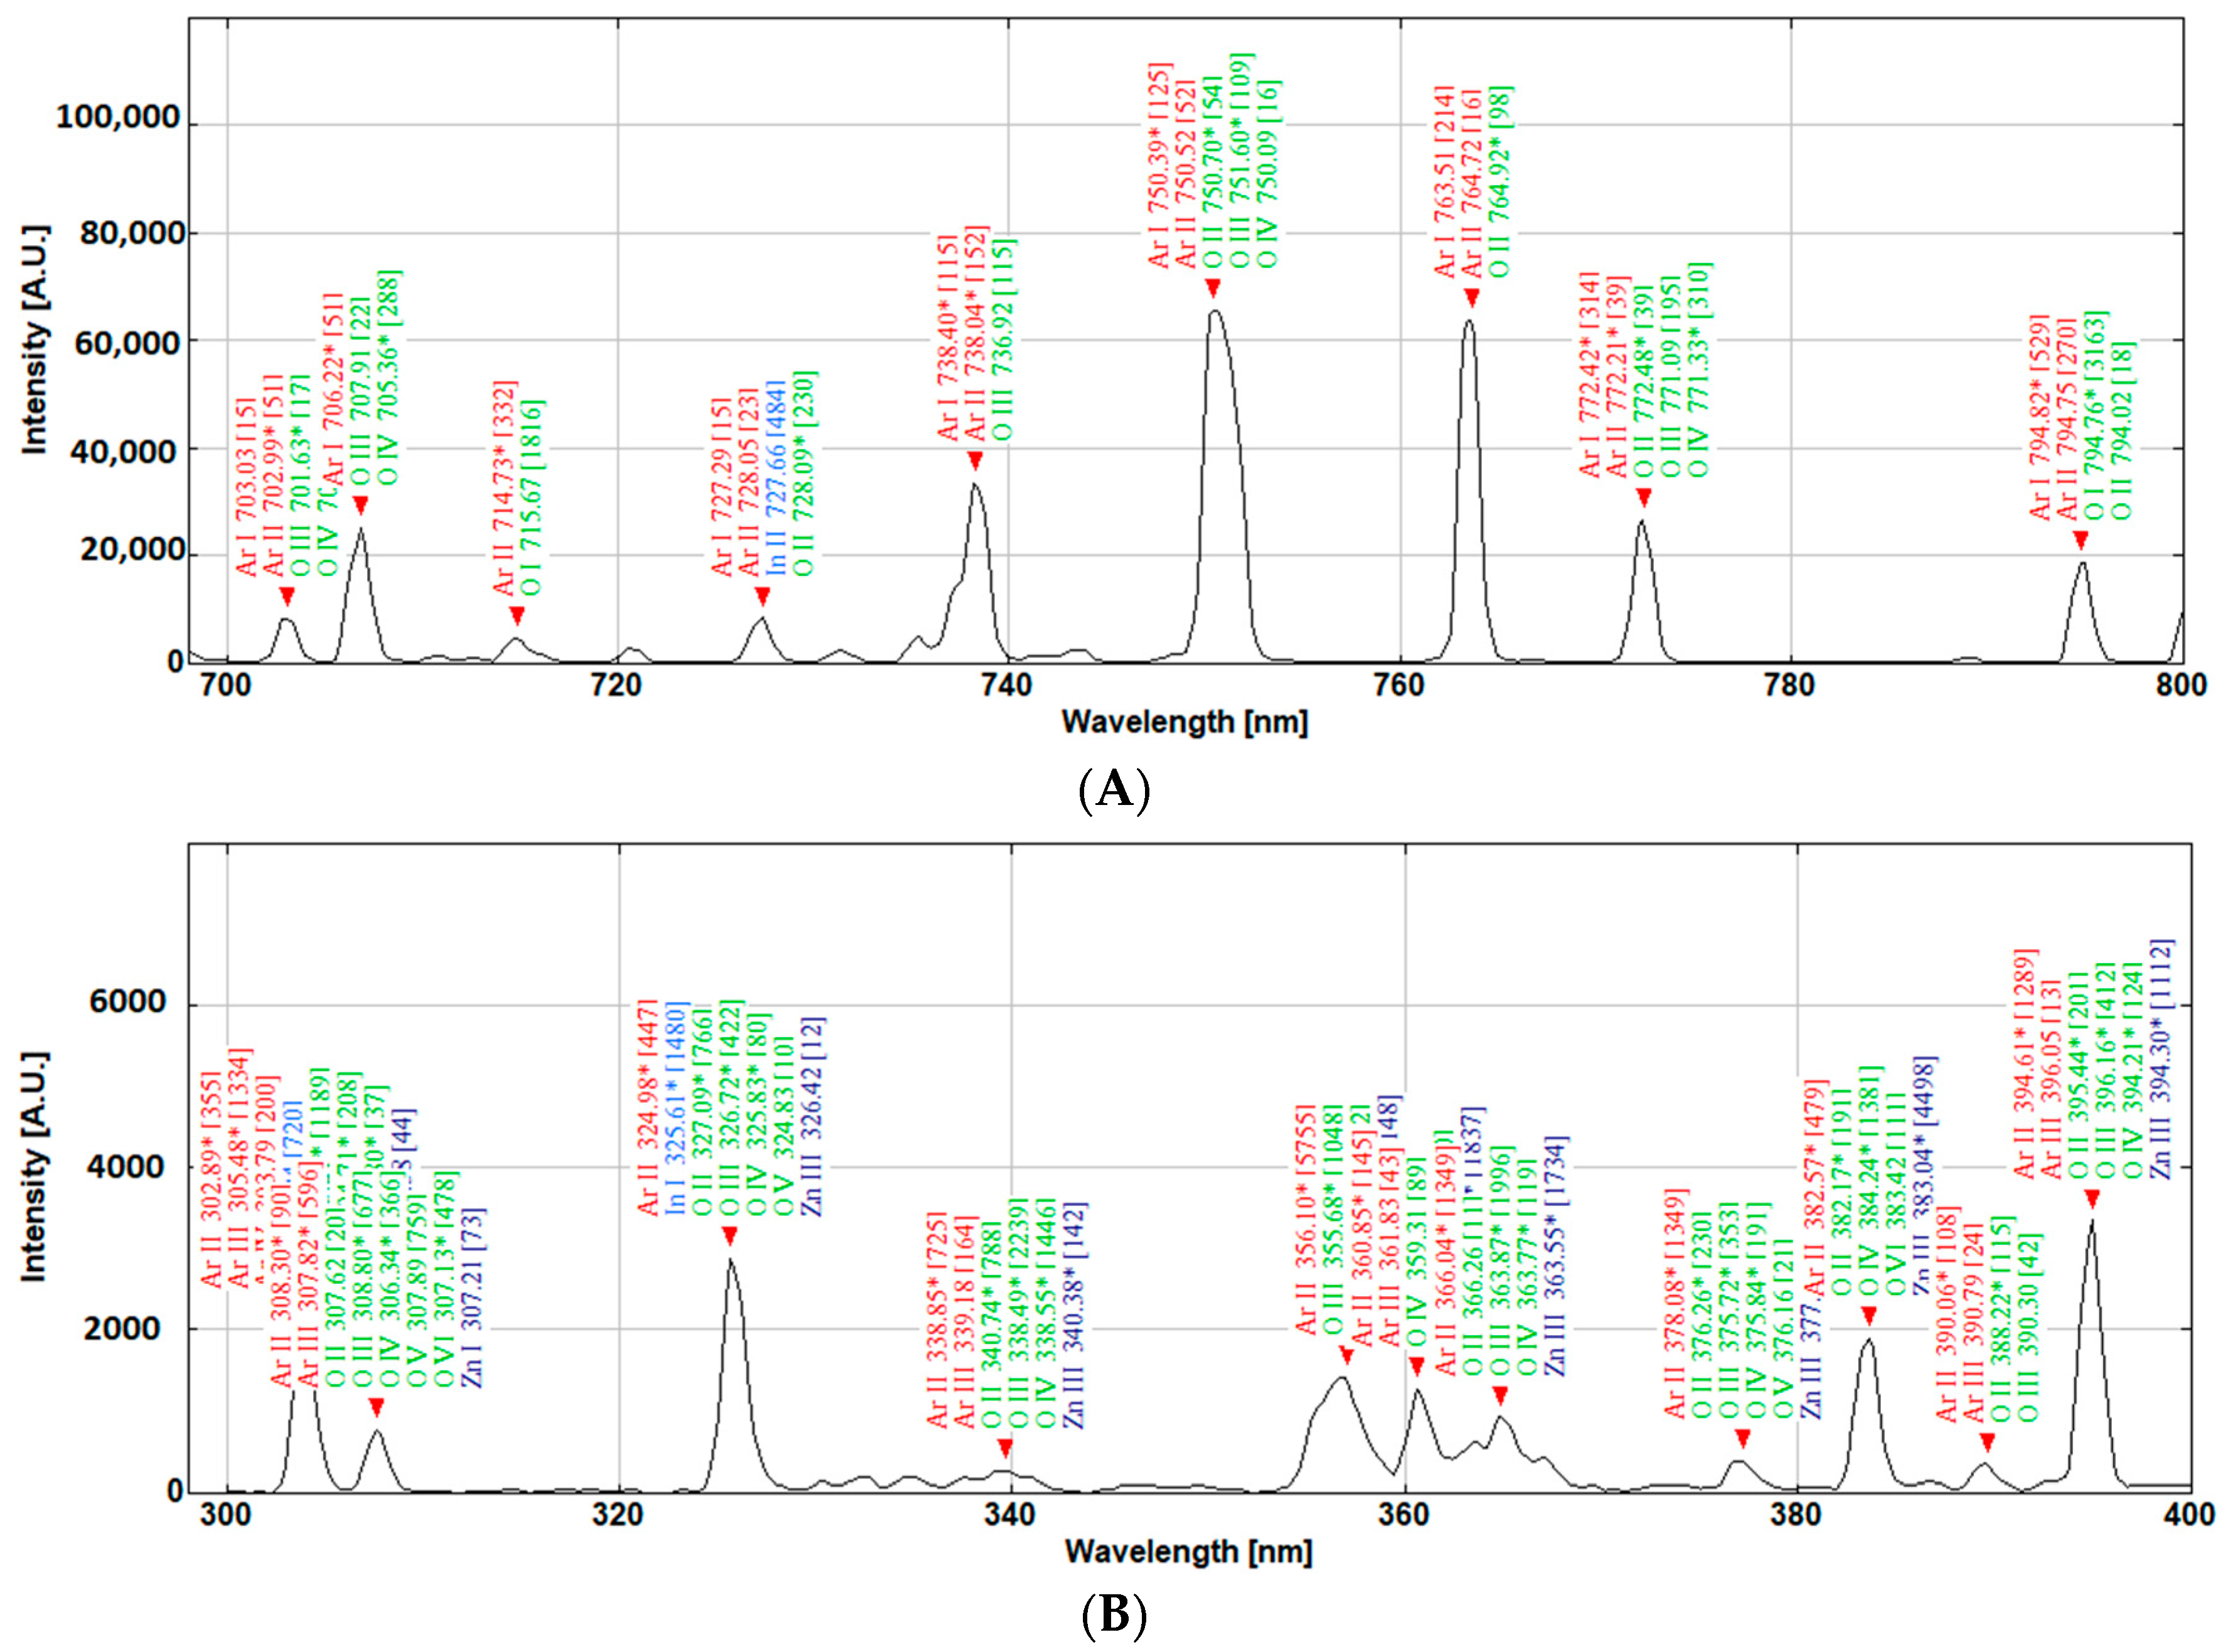
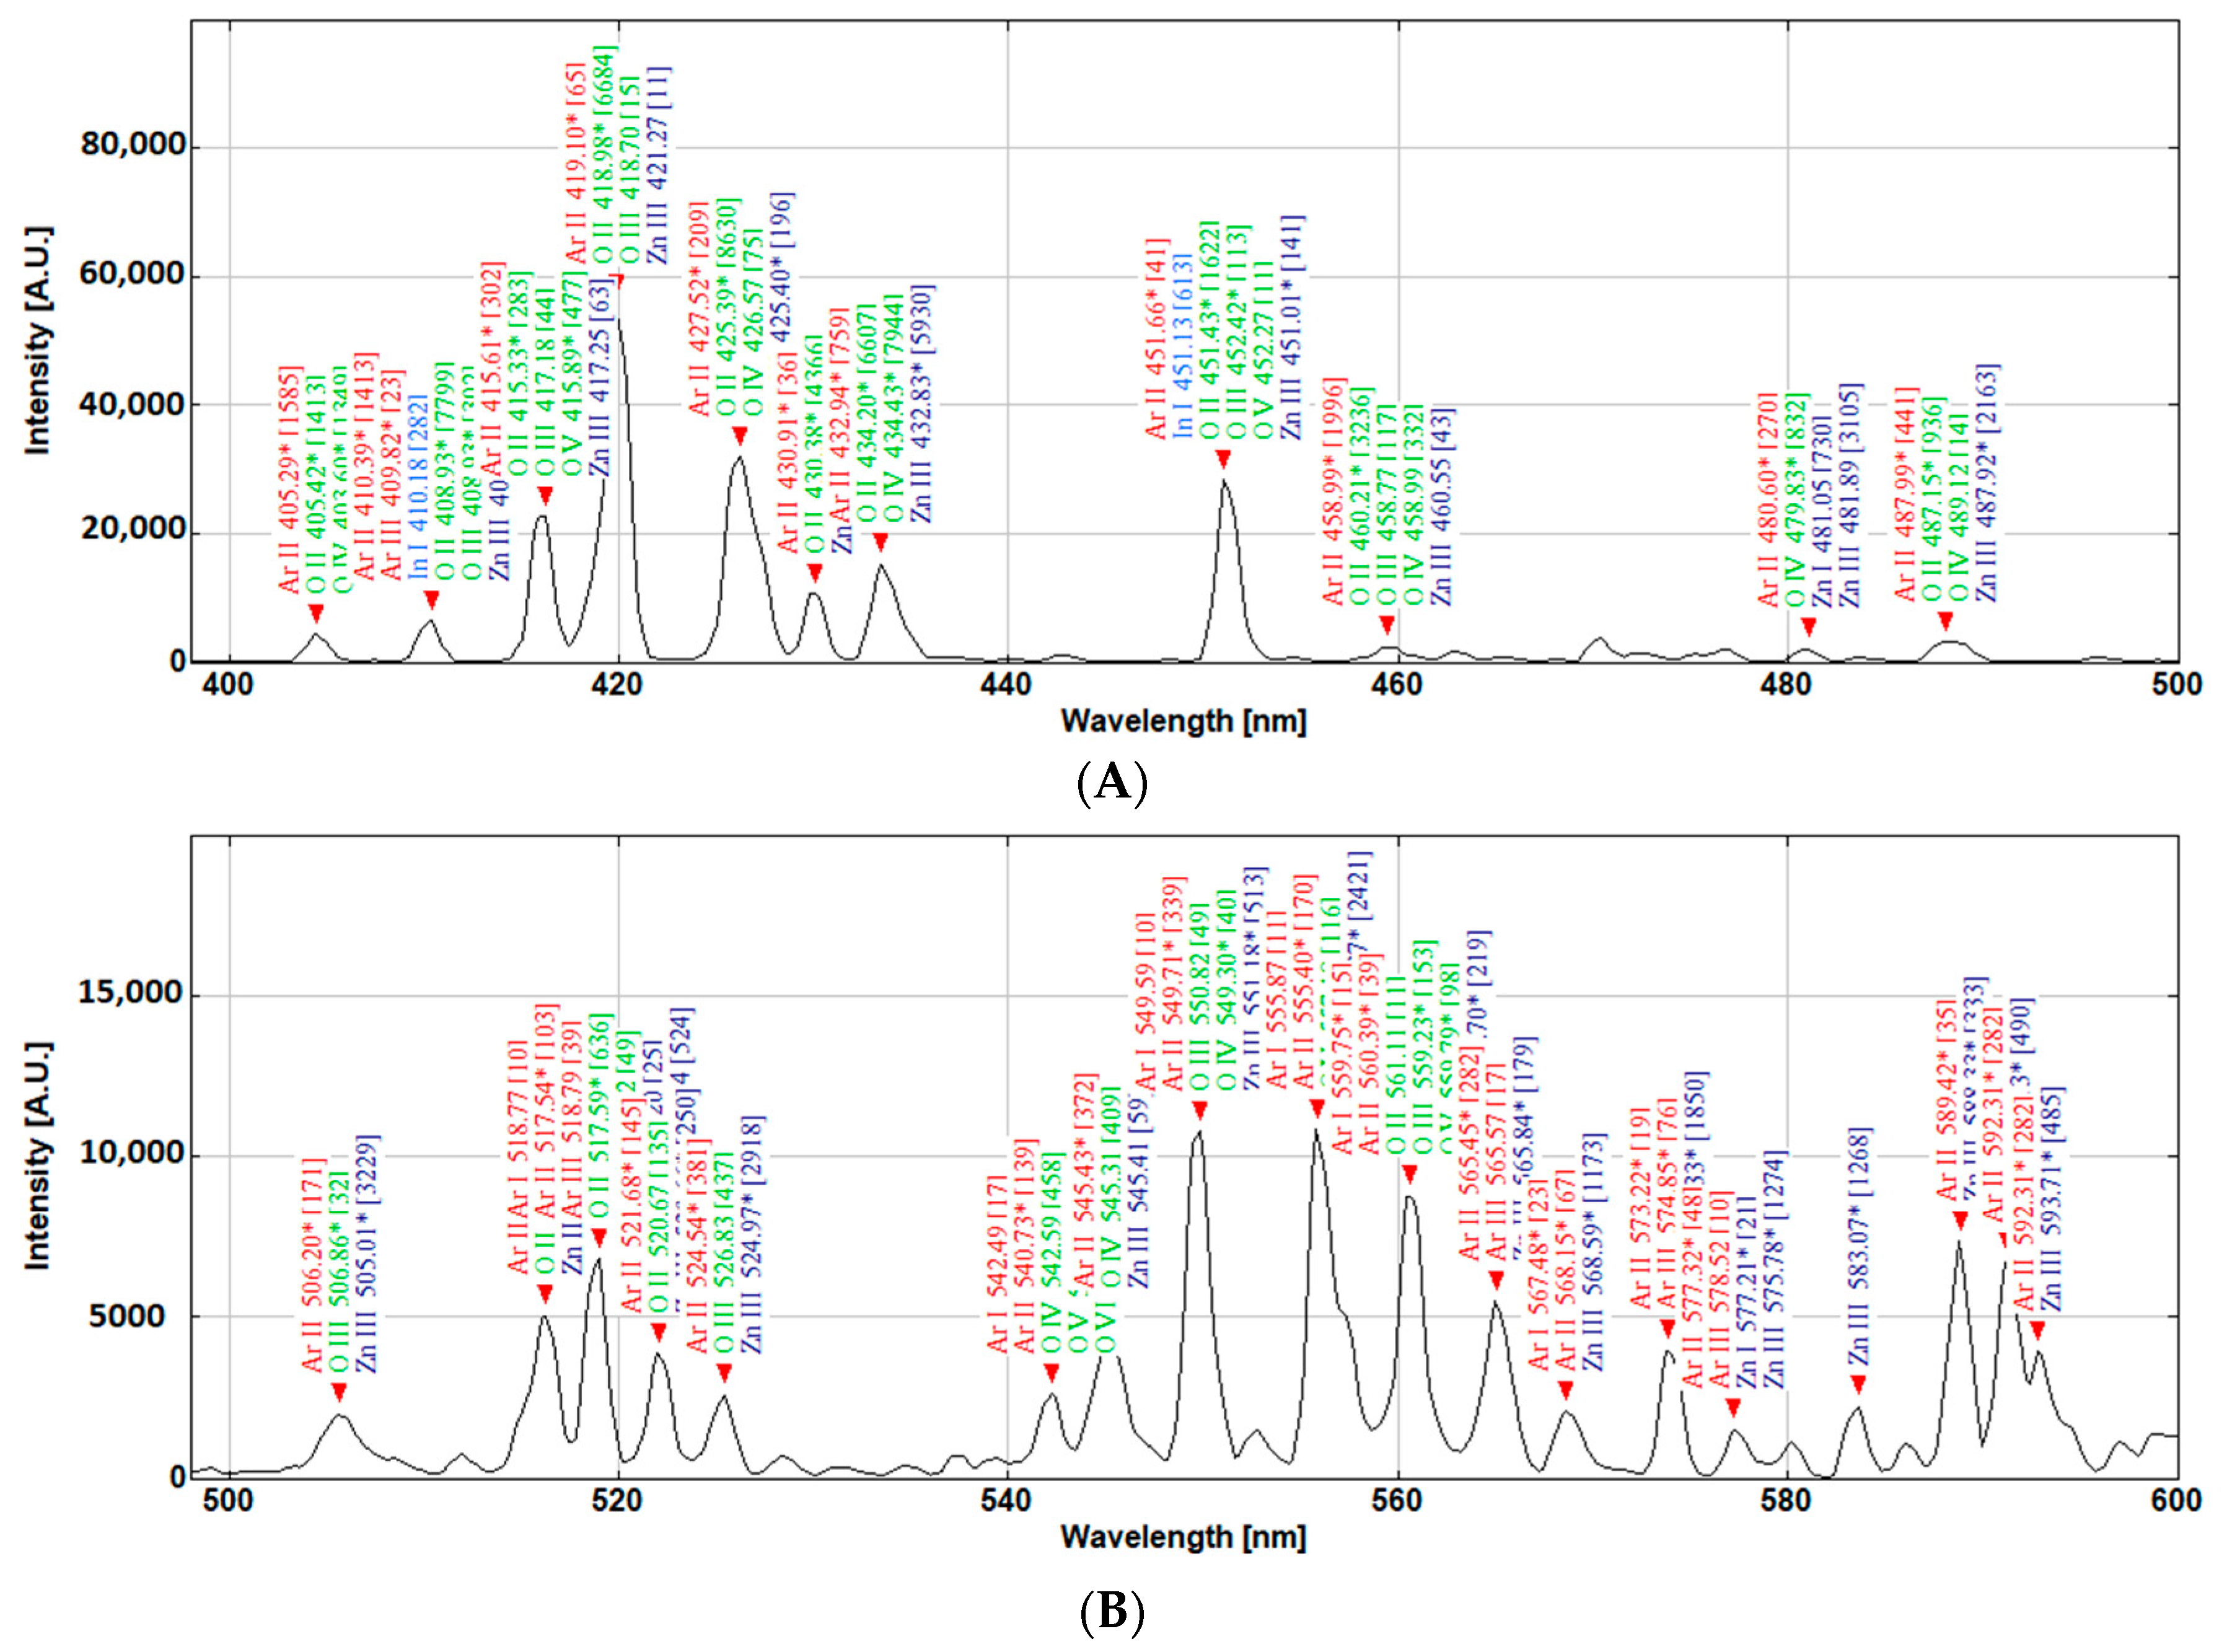
Figure 13 presents some of the possible transitions that need assessment when using the conventional line intensity techniques, while, through colour coordinate calculations, the overall area of the peaks is considered, hence simplifying the monitoring process for a user with limited need of extensive plasma physic knowledge. However, the colour coordinates do not take into consideration the emissions in the UV and far-red part of the spectrum. Hence, an alternative colour function for this application can be envisaged. If this method is matured in the future, then it can be beneficial for applied scientists and those who utilise plasma sputtering for thin film coatings and depositions. The colour of the plasma is derived by the quantity and state of various meta-stable atoms and ions that constitute it. In an analogical overview, a simplified shortcut can be established to characterise the plasma by being able to identify the relationship between the colour of the plasma and physical events within the plasma, just as the fingerprint pattern is used to characterise people rather than their individual genome sequence.
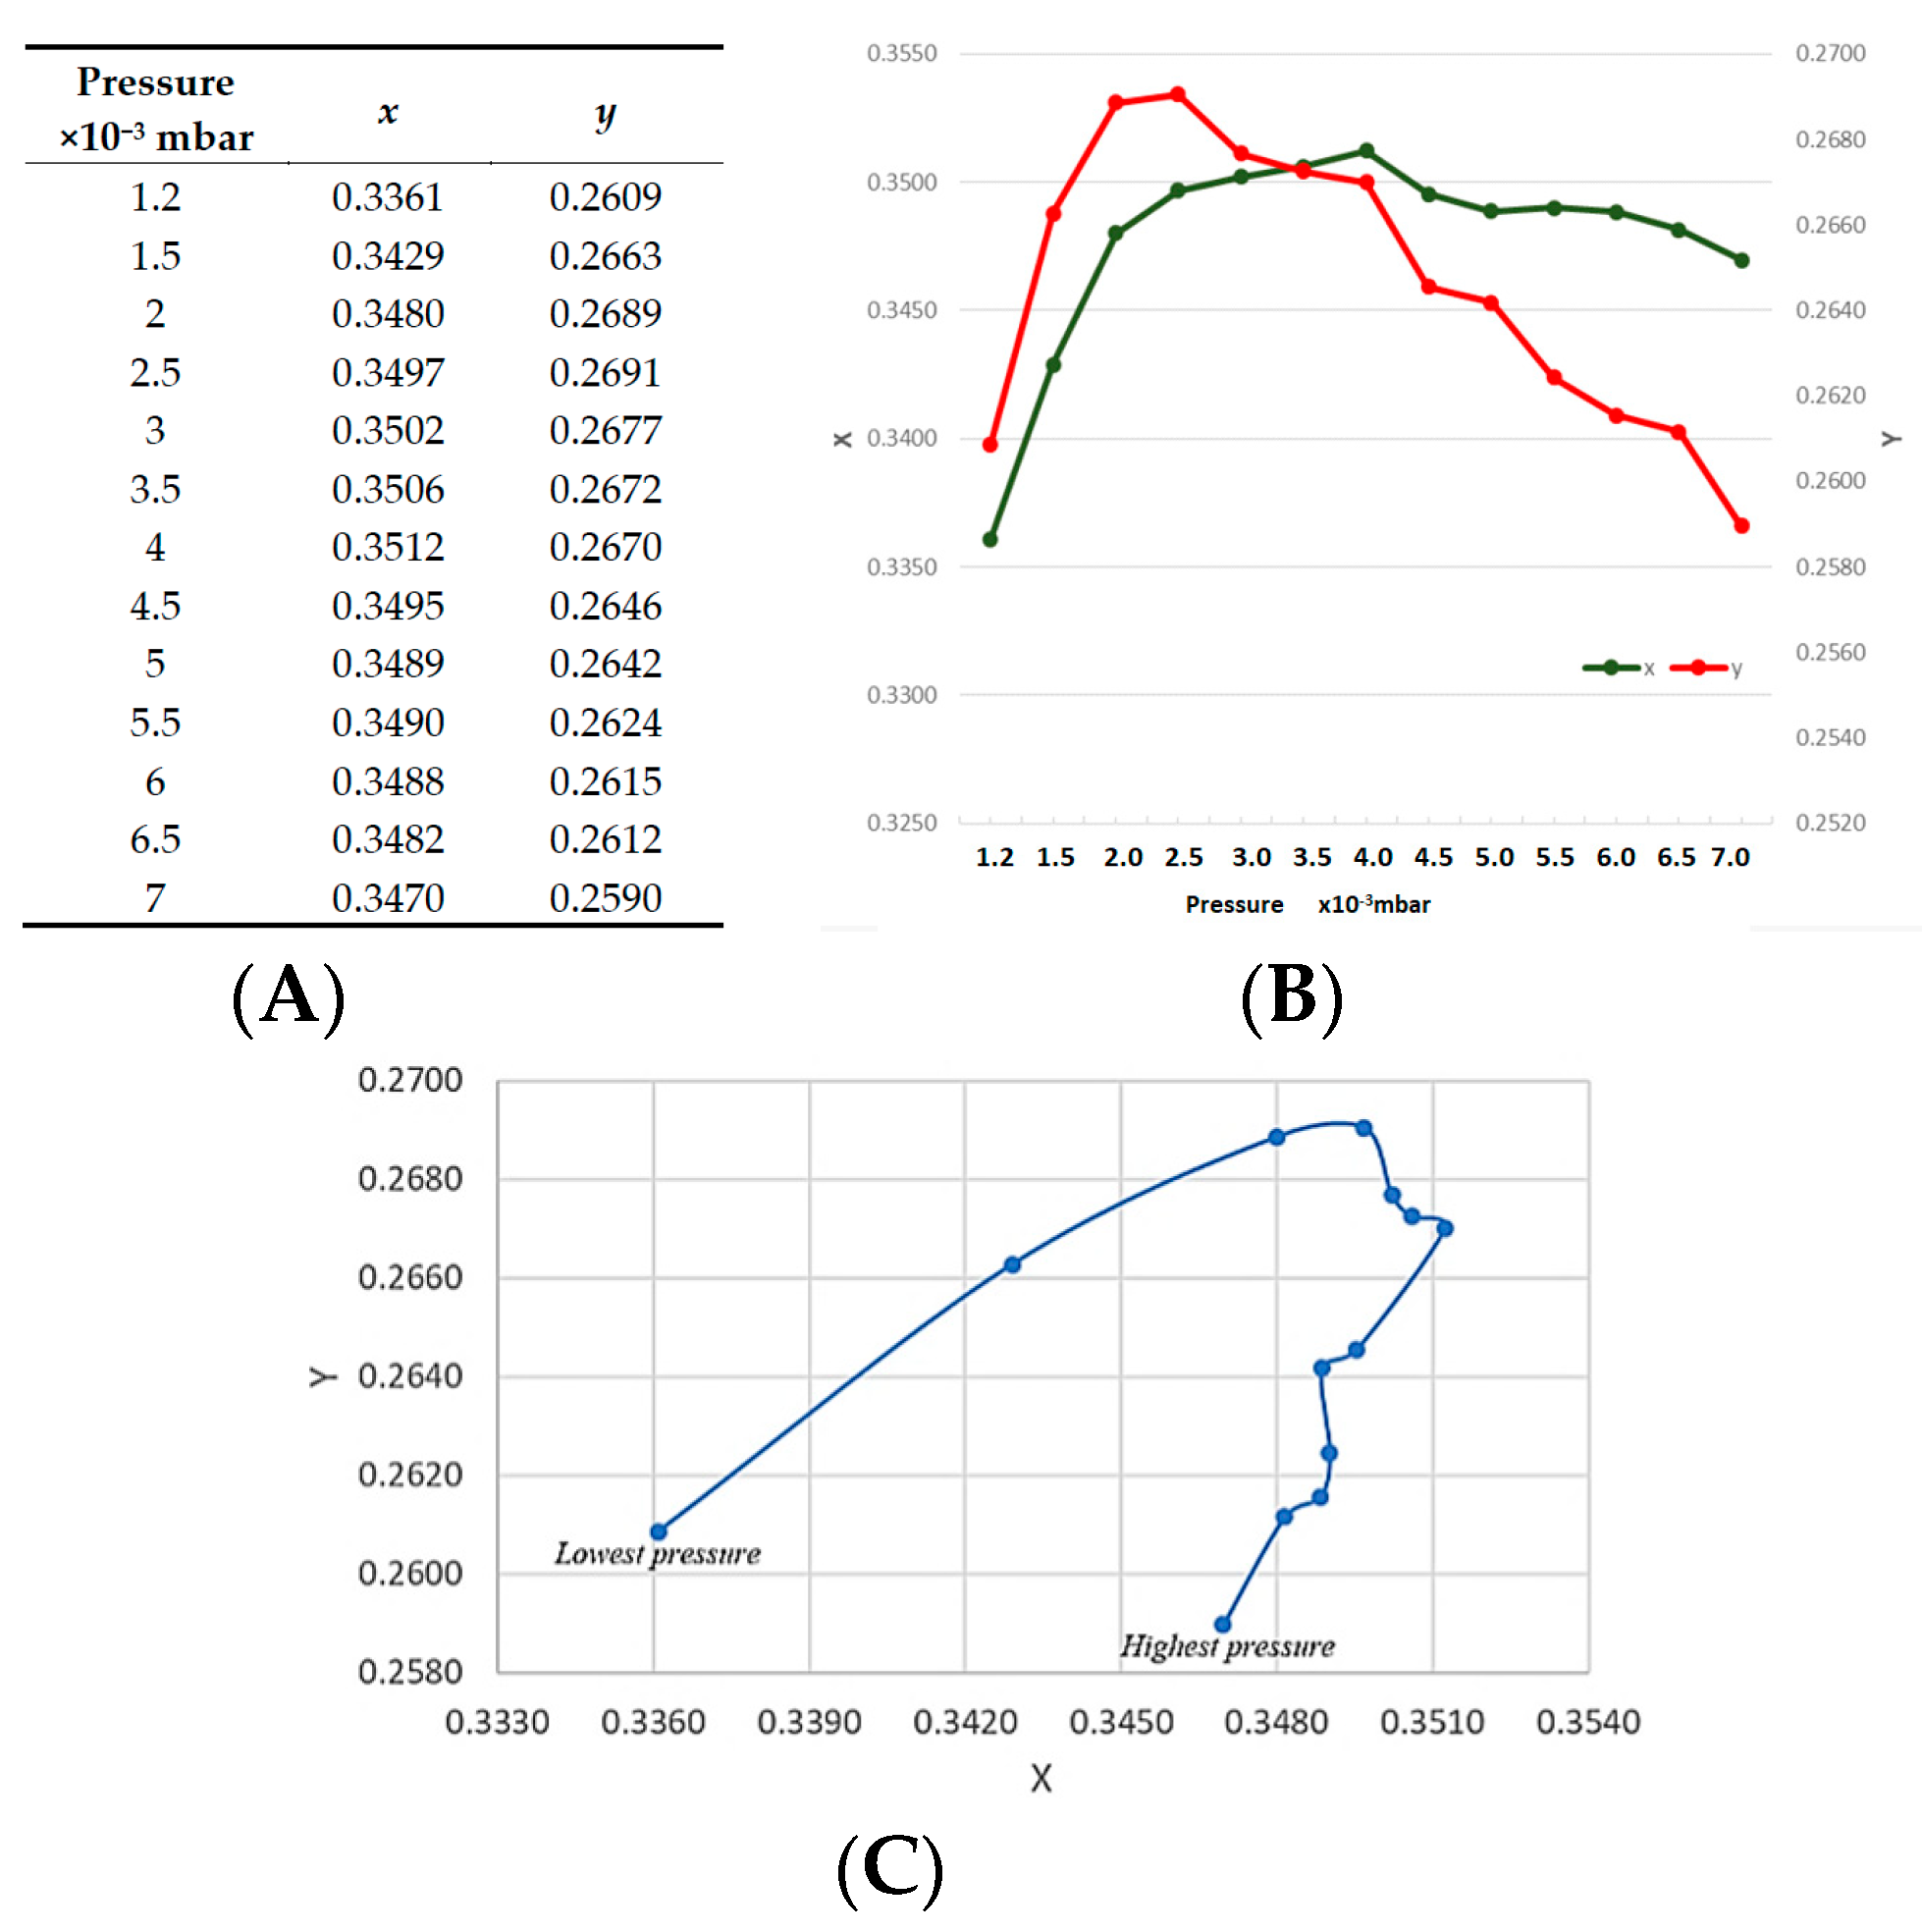
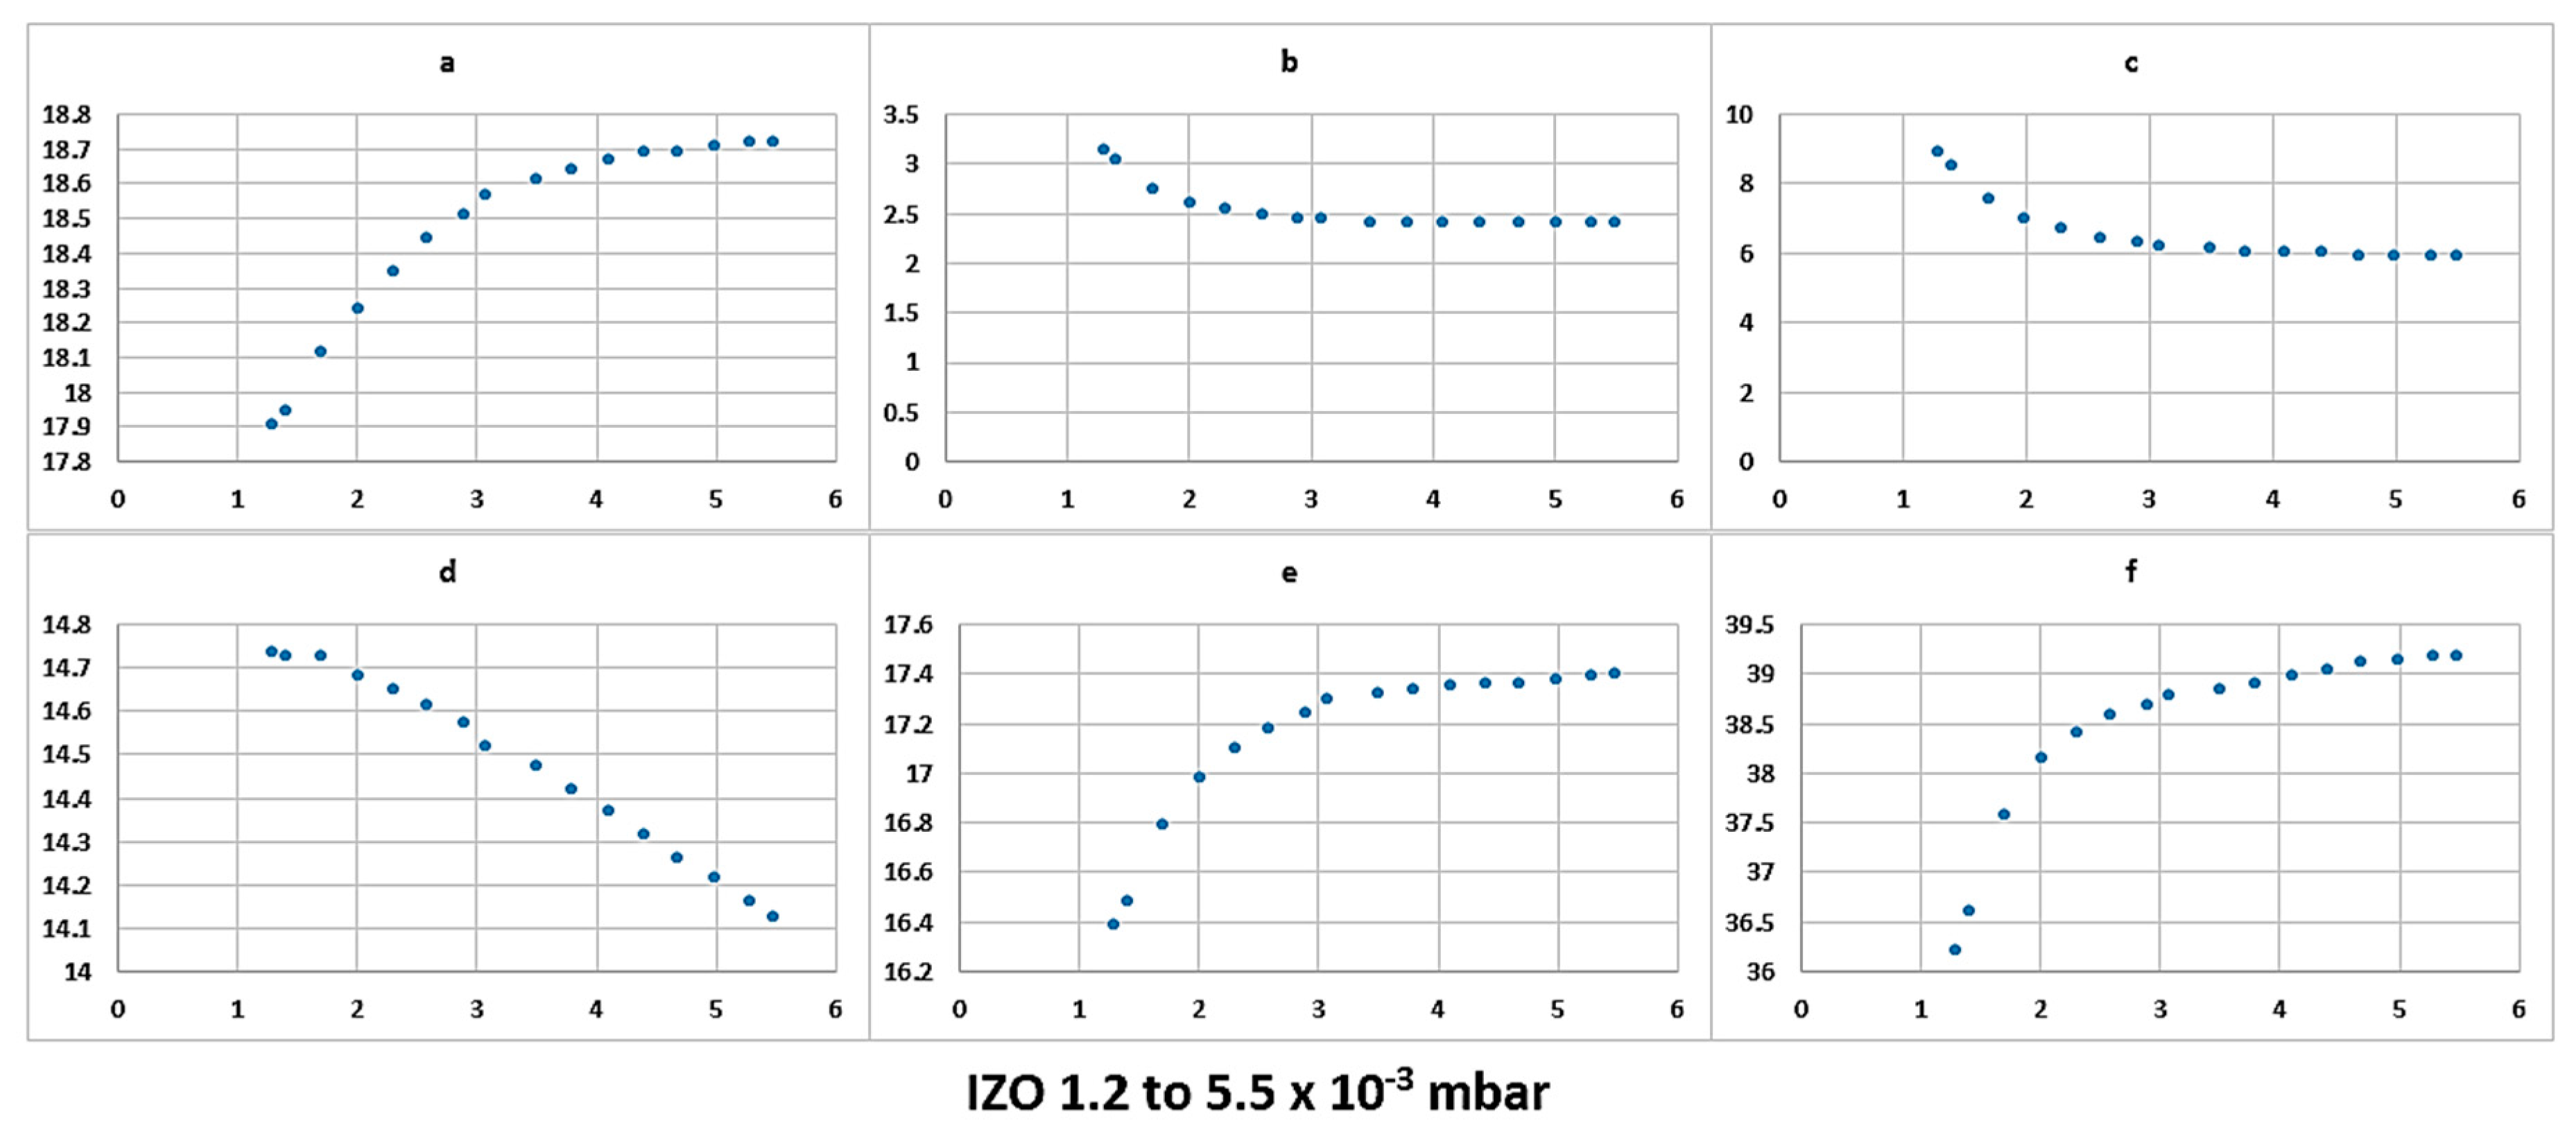
Higher chamber pressure lowers the voltage at which the plasma can be ignited and maintained. This is because higher chamber pressure increases the probability of the ionisation process of argon. Higher chamber pressure on the other hand means that more argon atoms are available to be energised to bombard the target surface; however, a higher concentration of argon atoms means that there will more collision between the sputtered atoms or ions and argon atoms. These collisions can lead to lesser energetic atoms arriving at the surface of the substrate [29]. A correlation can clearly be seen between the x and y coordinates of the chromaticity index of the plasma light and certain parameters, such as plasma stability, the working gas and the associated chamber pressure and the plasma power that affect the x and y values. This highlights a clear potential of pursuing and investigating the proposed concept and, if successful for a given target material to be sputtered, regardless of the manufacturer of the sputtering deposition machine, matching the colour parameters can indicate exact similar plasma operating conditions. Meanwhile, theoretically, there is a possibility of operating a plasma under two different conditions and getting similar colour values, we have partially investigated this, where, by altering the chamber pressure and plasma power, similar x or y values can be mimicked, but having an identical x and y values at the same time so far has not been observed, this itself will be a future experimental protocol.
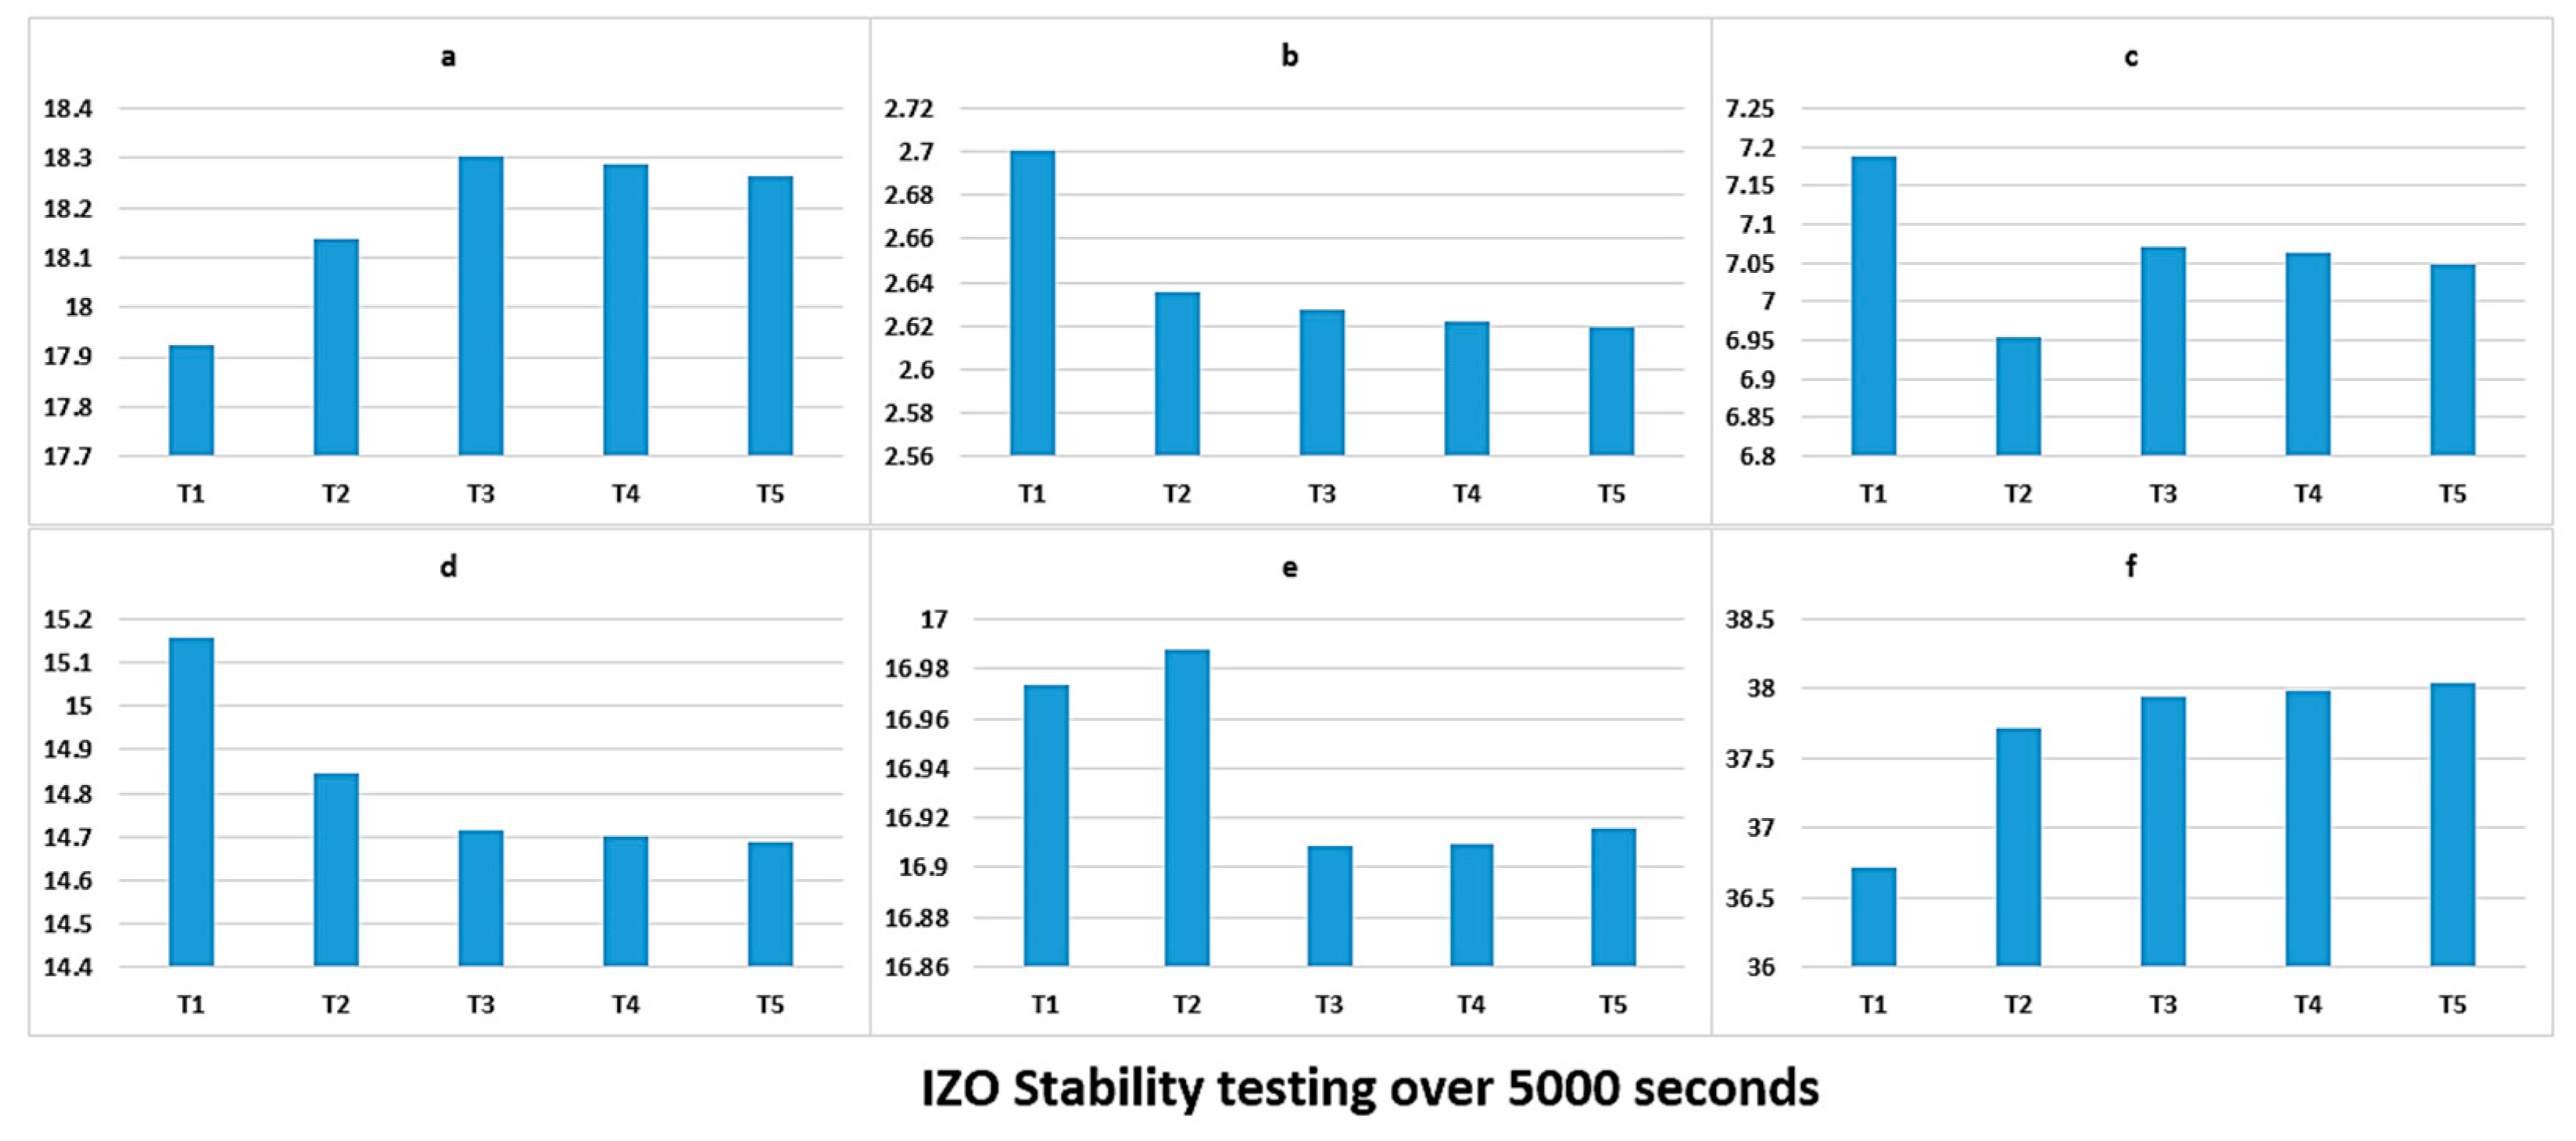
The x and y coordinates can give an excellent, easy indication of the point at which the plasma is stable when compared to more complex calculation methods. The stabilisation process itself is an interesting concept to consider, slight variation in parameters that are required for driving plasma can create unstable conditions, and the colour factor can be an excellent indicator of this.
We have demonstrated that, under unique chamber pressure and plasma power, we can have a distinct x and y value that can be utilised by the operators of the machine to create a library of the thin film property relevant to particular x and y coordinate values, making the process of monitoring the thin film quality significantly easy. However, what has been reported here is just the beginning of a concept that bears potential. The colour coordinates that are driven from the plasma here do not take into consideration the UV and IR emissions. Additionally, in future efforts, the relationship between the coating properties and the plasma photometric need to be established. Future efforts on further investigation of this concept require establishing the relationship between the chromaticity parameters and the plasma’s inner parameters, such as electron temperature and charge density, to enable us to generate a reliable relationship between the mentioned factors. Thereby, the first step in any future development of this concept is to prepare and create an alternative colour coding that will take the UV and IR emissions into account and will create a colour index beyond our vision.

Author Contributions

Conceptualization, A.S. and H.U.; Methodology, A.S.; Software, R.H.; Validation, A.S. and H.U.; Formal Analysis, A.S. and R.H.; Investigation, A.S.; Resources, H.U.; Data Curation, A.S., R.H., and A.H.; Writing—Original Draft Preparation, A.S.; Writing—Review & Editing, R.H. and H.U.; Visualisation, A.S.; Supervision, H.U. and A.S.; Project Administration, H.U.; Funding Acquisition, H.U.

Funding

This research was funded by Grand Challenge Research Fund (GCRF) toward the SUNRISE program, No. EP/P032591/1.

Acknowledgments

We would like to thank Scientific Vaccum Systems UK and Brunel University London for their support on this project.

Conflicts of Interest

The authors declare no conflict of interest.

References

  1. Lewis, B.G.; Paine, D.C. Applications and processing of transparent conducting oxides. MRS Bull. 2000, 25, 22–27. [Google Scholar] [CrossRef]
  2. Crintea, D.L.; Czarnetzki, U.; Iordanova, S.; Koleva, I.; Luggenhölscher, D. Plasma diagnostics by optical emission spectroscopy on argon and comparison with Thomson scattering. J. Phys. D 2009, 42, 045208. [Google Scholar] [CrossRef]
  3. Zhu, X.; Pu, Y. Optical emission spectroscopy in low-temperature plasmas containing argon and nitrogen: Determination of the electron temperature and density by the line-ratio method. J. Phys. D 2010, 43, 403001. [Google Scholar] [CrossRef]
  4. Trevizan, L.C.; Santos, D., Jr.; Samad, R.E.; Vieira, N.D., Jr.; Nunes, L.C.; Rufini, I.A.; Krug, F.J. Evaluation of laser induced breakdown spectroscopy for the determination of micronutrients in plant materials. Spectrochim. Acta Part B Atomic Spectrosc. 2009, 64, 369–377. [Google Scholar] [CrossRef]
  5. Unnikrishnan, V.K.; Alti, K.; Nayak, R.; Bernard, R.; Khetarpal, N.; Kartha, V.B.; Santhosh, C.; Gupta, G.P.; Suri, B.M. Optimized LIBS setup with echelle spectrograph-ICCD system for multi-elemental analysis. J. Instrum. 2010, 5, P04005. [Google Scholar] [CrossRef]
  6. Bastiaans, G.J.; Mangold, R.A. The calculation of electron density and temperature in Ar spectroscopic plasmas from continuum and line spectra. Spectrochim. Acta Part B Atomic Spectrosc. 1985, 40, 885–892. [Google Scholar] [CrossRef]
  7. Iordanova, S.; Koleva, I. Optical emission spectroscopy diagnostics of inductively-driven plasmas in argon gas at low pressures. Spectrochim. Acta Part B Atomic Spectrosc. 2007, 62, 344–356. [Google Scholar] [CrossRef]
  8. Gurnett, D.A.; Bhattacharjee, A. Introduction to Plasma Physics: With Space and Laboratory Applications; Cambridge University press: Cambridge, UK, 2005. [Google Scholar]
  9. Bellan, P.M. Fundamentals of Plasma Physics; Cambridge University Press: Cambridge, UK, 2008. [Google Scholar]
  10. Unnikrishnan, V.K.; Alti, K.; Kartha, V.B.; Santhosh, C.; Gupta, G.P.; Suri, B.M. Measurements of plasma temperature and electron density in laser-induced copper plasma by time-resolved spectroscopy of neutral atom and ion emissions. Pramana 2010, 74, 983–993. [Google Scholar] [CrossRef]
  11. McWhirter, R.W.P. Plasma Diagnostic Techniques; Huddlestone, R.H., Leonard, S.L., Eds.; Academic Press: New York, NY, USA, 1965. [Google Scholar]
  12. Diwakar, P.; Hahn, D. Study of early laser-induced plasma dynamics: Transient electron density gradients via Thomson scattering and Stark Broadening, and the implications on laser-induced breakdown spectroscopy measurements. Spectrochim. Acta Part B Atomic Spectrosc. 2008, 63, 1038–1046. [Google Scholar] [CrossRef]
  13. Shaikh, N.M.; Rashid, B.; Hafeez, S.; Jamil, Y.; Baig, M.A. Measurement of electron density and temperature of a laser-induced zinc plasma. J. Phys. D 2006, 39, 1384. [Google Scholar] [CrossRef]
  14. Tawfik, W.; Mohamed, Y.; Askar, A. Study of the matrix effect on the plasma characterization of heavy elements in soil sediments using LIBS with a portable Echelle spectrometer. Prog. Phys. 2007, 1, 46–52. [Google Scholar]
  15. Hong, Y.J.; Kwon, G.C.; Cho, G.; Shin, H.M.; Choi, E.H. Measurement of electron temperature and density using stark broadening of the coaxial focused plasma for extreme ultraviolet lithography. IEEE Trans. Plasma Sci. 2010, 38, 1111–1117. [Google Scholar] [CrossRef]
  16. Diao, C.Y.; Chen, C.S.; Man, B.Y.; Wang, C.; Fu, H.B. Influence of distances between the lens and the target on the characteristic of laser induced lead plasma. Eur. Phys. J. D 2011, 63, 123–128. [Google Scholar] [CrossRef]
  17. Konjević, N.; Lesage, A.; Fuhr, J.R.; Wiese, W.L. Experimental Stark widths and shifts for spectral lines of neutral and ionized atoms (a critical review of selected data for the period 1989 through 2000). J. Phys. Chem. Ref. Data 2002, 31, 819–927. [Google Scholar] [CrossRef]
  18. Wyszecki, G.; Stiles, W.S. Color Science Concepts and Methods, Quantative Data and Formulae, 2nd ed.; Wiley: New York, NY, USA, 1982. [Google Scholar]
  19. Conrads, H.; Schmidt, M. Plasma generation and plasma sources. Plasma Sources Sci. Technol. 2000, 9, 441. [Google Scholar] [CrossRef]
  20. Alder, J.; Bombelka, R.; Kirkbright, G. Electronic excitation and ionization temperature measurements in a high frequency inductively coupled argon plasma source and the influence of water vapor on plasma parameters. Spectrochim. Acta Part B Atomic Spectrosc. 1980, 35, 163–175. [Google Scholar] [CrossRef]
  21. Bogaerts, A.; Neyts, E.; Gijbels, R.; Van der Mullen, J. Gas discharge plasmas and their applications. Spectrochim. Acta Part B Atomic Spectrosc. 2002, 57, 609–658. [Google Scholar] [CrossRef]
  22. Wagatsuma, K.; Hirokawa, K. Characterization of atomic emission lines from argon, neon, and nitrogen glow discharge plasmas. Anal. Chem. 1985, 57, 2901–2907. [Google Scholar] [CrossRef]
  23. Angeli, J.; Bengtson, A.; Bogaerts, A.; Hoffmann, V.; Hodoroaba, V.D.; Steers, E. Glow discharge optical emission spectrometry: Moving towards reliable thin film analysis—A short review. J. Anal. Atomic Spectrom. 2003, 18, 670–679. [Google Scholar] [CrossRef]
  24. Ablikim, M.; An, Z.H.; Bai, J.Z.; Berger, N.; Bian, J.M.; Cai, X.; Cao, G.F.; Cao, X.X.; Chang, J.F.; Chen, C.; et al. Design and construction of the BESIII detector. Nucl. Inst. Methods Phys. Res. 2010, 614, 345–399. [Google Scholar] [CrossRef] [Green Version]
  25. Wang, F.H.; Yang, C.F.; Liou, J.C.; Chen, I.C. Effects of hydrogen on the optical and electrical characteristics of the sputter-deposited Al2O3-doped zno thin films. J. Nanomater. 2014, 2014, 857641. [Google Scholar] [CrossRef]
  26. Qayyum, A.; Ikram, M.; Zakaullah, M.; Waheed, A.; Murtaza, G.; Ahmad, R.; Majeed, A.; Khattak, N.A.D.; Mansoor, K.; Chaudhary, K.A. Characterization of argon plasma by use of optical emission spectroscopy and Langmuir probe measurements. Int. J. Mod. Phys. B 2003, 17, 2749–2759. [Google Scholar] [CrossRef]
  27. Kwak, D.; Park, M.; Sung, Y. Discharge power dependence of structural and electrical properties of Al-doped ZnO conducting film by magnetron sputtering (for PDP). Vacuum 2008, 83, 113–118. [Google Scholar] [CrossRef]
  28. Yan, L.; Rath, J.; Schropp, R. Electrical properties of vacuum-annealed titanium-doped indium oxide films. Appl. Surf. Sci. 2011, 257, 9461–9465. [Google Scholar] [CrossRef]
  29. Sultan, M.S. Effect of gas pressure and flow rate on the plasma power and deposition rate in magnetron sputtering system. Res. J. Nanosci. Eng. 2018, 2, 1–8. [Google Scholar]
Figure 1. (A) The x,y International Commission on Illumination (CIE) chromaticity index. (B) The CIE XYZ colour function diagram where the curves are the CIE standard colour matching functions, the values for x and y are obtained from the spectral plot of the emitting light, by calculating integral of the peaks X, Y, and Z and applying Equations (8) and (9). These peaks represent the emission wavelengths from the light source at the specific wavelengths, for example, Z, represents the area under emission peak from 380 to 550 nm.
Coatings 09 00315 g001
Figure 2. (A) In-vacuum collimator optics was placed adjacent to the magnetron and the emission data were transferred to the spectrometers via quartz fiber, the distance between the collimator and target edge was 4 cm. (B) The Collimator.
Coatings 09 00315 g002
Figure 3. (A) The quartz lens of the collimator was tested using UV/VIS transmission spectroscopy (320 to 900 nm) to ensure the lens was not coated during the experiments. (B) The unique feature of the optic collimator is the honeycomb structure of the photon inlet which traps the sputtering particle and prevents gradual coating of the collimators quartz window.
Coatings 09 00315 g003
Figure 4. The x and y data obtained from the plasma during the first hour of ignition at 100 W for a magnetron fitted with Indium Zinc Oxide (IZO) target under gas Ar (A,B) and gas ArH (C,D) along with data obtained 2 h after ignition. During this 1 h interval the plots remain relatively stable as presented in the right side figures. The stabilized data were gathered over an additional thirty minutes period. As it can be seen (A,C) prior to stabilisation the x,y coordinates are scattered across the plot area until the plasma is stabilized at which point the plots fall within close proximity (B,D).
Coatings 09 00315 g004
Figure 5. The intensity ration of four peaks are presented over 130 min. (A) The intensity ratio of the (Ar I) 404.44 nm and the (Ar I) 426.62 nm emission peaks. (B) The intensity ratio of the (Ar I) 470.4 nm and the 480.60 nm emission peaks. It can be seen that through time the increase or decrease of intensity ratios is not uniform across all of the selected peaks, hence why it will be challenging to use a method, such as peak intensity method for identifying stable plasma state during the operation of apparatus.
Coatings 09 00315 g005
Figure 6. The relationship between the power of plasma (radio frequency (RF)) and the x and y values. The plasma power was raised from 100 to 300 W at a rate of 100 W per minutes and the x and y values were obtained every ~9 s. It can be seen that the x and y values are reduced and the plot demonstrates a linear trend when the sputtering power is increased. These plots indicate that the colour of the plasma is shifting toward deep blue with increasing the power.
Coatings 09 00315 g006
Figure 7. The x and y data obtained by Jeti spectrometer from the plasma at 100 W 2 h after stabilization for a magnetron fitted with IZO target under gas Ar at various pressures (A). Newly added, please confirm. As the Argon pressure is increased, the x and y values increase until about 2.5 × 10⁻³ mbar and then start to decrease (B). The x and y plot demonstrates a U-turn formation, indicating that the colour is initially shifting toward white and then reverting toward blue (C).
Coatings 09 00315 g007
Figure 8. The x and y data obtained By Jeti spectrometer from the plasma at 100 W 2 h after stabilization for a magnetron fitted with IZO target under gas ArH at various pressures (A). As the Argon Hydrogen mix pressure is increased, the x and y values increase until about 2.5 × 10⁻³ mbar and then start to decrease (B). The x and y plot demonstrates a U-turn formation, indicating that the colour is initially shifting toward white and then reverting toward blue (C).
Coatings 09 00315 g008
Figure 9. The effect of working gas pressure observed on the spectral plot (200 to 600 nm) of the plasma with IZO target and Argon gas only at various working gas pressures. When compared to the x and y plots in Figure 7 and Figure 8, it can be seen that all we observe from the spectra is an increase in the intensity of certain peaks which makes the assessment of the data complex with further evaluation. All of these increases in intensity can be summarised as presented in Figure 7 and Figure 8 by evaluating the colour of the plasma light. The inset in the second section of the plot demonstrates the complexity of analysing every single peak for the amount of slight increase in one of the peaks. (A): spectral plot 200 to 400 nm; (B): spectral plot from 400 to 600 nm.
Coatings 09 00315 g009
Figure 10. Switching back and forth from Ar gas to ArH gas. (A) Switching from Ar to ArH occurs swiftly. (B) Switching from ArH to Ar, the plasma colour demonstrates a colour change as the x,y values change over the course of ~1 h prior to stabilisation in a linear fashion after the target has been exposed to Argon hydrogen mixture. This observation can be interpreted as either the rate by which hydrogen is disappearing from the chamber and/or possible formation of target hydrogen compounds at the surface of the target (target poisoning by hydrogen) and the time that is required for the target to revert back its original state while switching from Ar to ArH does not demonstrate any pattern, rather a swift instant jump is observed.
Coatings 09 00315 g010
Figure 11. The emission spectra of the plasma were segmented into seven sections: a, b, c, d, e, f and UV. Where the UV covered emissions from 300–400 nm. a: 400–430, b: 431–449, c: 450–500, d: 500–600, e: 600–700, and f: 700–800 nm. The area under each region was calculated and monitored.
Coatings 09 00315 g011
Figure 12. The emission spectrum and the associated Argon, Indium, Zinc and Oxygen states within far infra-red (A) and the UV section (B) of the spectrum obtained from the sputtering plasma. These regions are not accounted for when the chromaticity indices are calculated through the colour functions.
Coatings 09 00315 g012
Figure 13. The emission spectrum and the associated Argon, Indium, Zinc, and Oxygen states within the 400–700 nm section of the spectrum obtained from the sputtering plasma. These are the areas (including the unmarked peaks) used for calculating the colour coordinates by measuring the area under the peaks as discusses earlier and elaborated in Figure 1. Spectral range, (A): 400–500 nm, (B) 500–600 nm, (C): 600–700 nm.
Coatings 09 00315 g013aCoatings 09 00315 g013b
Figure 14. These data demonstrate the ratio to the total spectral cover from 300 to 800 nm of the area under the peak in each of the segments during the first 5000 s from the ignition of the plasma. The time series is divided into five sections of 1000 s. As can be seen, the plasma emission is changing through the time, in terms of the total area being covered under the peaks in each segment. Regions (a,f) demonstrate an increase in peak area while (be) are gradually reducing.
Coatings 09 00315 g014
Figure 15. These data demonstrate the ratio (to the total spectral cover from 300 to 800 nm) of the area under the peak in each of the segments in response to the RF plasma power applied for maintaining the plasma. The peak area associated with segment (ac) tend to be increasing with increasing the applied power, while emissions associated with sections (df) are reducing.
Coatings 09 00315 g015
Figure 16. These data demonstrate the ratio (to the total spectral cover from 300 to 800 nm) of the area under the peak in each of the segments in response to varying the chamber pressure. Sections (a,e,f) demonstrate and increase while (bd) demonstrate a decrease of intensity when increasing the chamber pressure to 5.5 × 10⁻³ mbar.
Coatings 09 00315 g016
Figure 17. These data demonstrate the ratio (to the total spectral cover from 300 to 800 nm) of the area under the peak in the UV section (300–400 nm) of the spectrum. The UV emissions demonstrate an increasing trend over the 5000 s period, followed by a slight decline and they demonstrate a linearly increasing relationship with the plasma power. The higher chamber pressure seems to be reducing the ratio of the UV emissions to the overall emission within the spectrum. (a): Plot tsability test over 5000 s period, (b): Effect of plasma power on UV emission ratio, (c): Effect of pressure on UV emission ratio.
Coatings 09 00315 g017
Table 1. The experimental regime conducted to obtain the spectral results from the plasma light source under various conditions in 3 separate test groups. Test 1: where the stability of the plasma was monitored at 100 W under 1.9 × 10⁻³ mbar of working gas pressure, under Ar and ArH gas; Test 2: The spectral emission of the plasma was monitored while increasing the power of stabilized plasma from 100 to 300 W under 1.9 × 10⁻³ mbar of Ar; Test 3: The spectral emission of an stabilized plasma was monitored at 100 W plasma power under various Ar and ArH gas pressures. (Note: separate spectral analysis of the plasma power was carried out up to 350 W).
Test RegimeVariable ParameterPower (RF)Working GasPressure (mbar)
Test 1Time100 WAr, ArH1.9 × 10−3
Test 2Plasma power100 W → 300 W
@ 100 W per min
Ar1.9 × 10−3
Test 3Gas pressure100 WAr, ArH1.2 × 10−3 → 7 × 10⁻³
@5 × 10⁻⁴ per min

