Article

On the Applicability of ATR-FTIR Microscopy to Evaluate the Blending between Neat Bitumen and Bituminous Coating of Reclaimed Asphalt

1
EMIB Research Group, Faculty of Applied Engineering, University of Antwerp, Groenenborgerlaan 171, 2020 Antwerp, Belgium
2
BioGEM Research Group, Faculty of Applied Engineering, University of Antwerp, Salesianenlaan 90, 2060 Antwerp, Belgium
*
Author to whom correspondence should be addressed.
Coatings 2019, 9(4), 240; https://doi.org/10.3390/coatings9040240
Submission received: 21 March 2019 / Revised: 4 April 2019 / Accepted: 6 April 2019 / Published: 9 April 2019
(This article belongs to the Collection Pavement Surface Coatings)

Abstract

:
The utilization of Reclaimed Asphalt (RA) in the road construction sector induces considerable economic and ecological benefits. The blending of the recycled material with new components is believed to be of great importance for the mixture’s properties. An extensive knowledge of the blending of the materials is crucial in optimizing the use of RA, especially at higher recycling rates. In this paper, the applicability of Fourier transform infrared (FTIR) microscopy in attenuated total reflectance (ATR) mode to study the bituminous coating of RA granulates is investigated. This method is a promising alternative to trace heterogeneous areas within the coating compared to methods that require extraction and recovery of bitumen. A method for sample preparation and FTIR spectra analysis is proposed. Four different samples were analyzed: a reference RA granulate, two types of RA granulates mixed with neat bitumen, and a RA granulate with rejuvenator. The results show that the use of ATR-FTIR microscope allows the tracing of different components, indications of blending, as well as proof of rejuvenation of the aged bituminous area.

1. Introduction

When asphalt pavements reach their end-of-life point, their layers must be renewed. The material removed from these layers is known as Reclaimed Asphalt (RA) (EN 13108-8:2016, [1]). RA is in fact an asphalt mixture consisting of aggregates and bitumen. The removed material is typically crushed in agglomerations of different sizes. Asphalt recycling is not only economically viable, since a considerable amount of bitumen can be replaced by the RA bitumen in the new asphalt mixture, but also environmentally friendly [2]. Previous research has shown the potential benefits of using RA on the mechanical performance of bituminous mixtures [3] and also provided recommendations concerning the proper exploitation of the material [4].
When a new bituminous mixture with the incorporation of RA is designed, in most design procedures, the assumption of full blending between the aged RA bitumen and the new bitumen is still being used. The mobilization or activation of RA bitumen is, till today, a “black box” for the asphalt sector; the actual degree of blending between new and aged bitumen is under research. Many studies question this practice and have demonstrated cases of partial blending [5,6] or zones where the phenomenon of “black rock” is present, meaning that part of the bitumen in the RA is inactive [7]. This gap in the scientific knowledge is of great importance, since overestimating the degree of blending can lead to mixtures with less active bitumen, which could significantly influence the mechanical performance of bituminous mixtures [8].
Previous studies have approached this problem in different ways. The first approach is by investigating the diffusion between two bituminous layers and studying the response of the blend by means of Dynamic Shear Rheometer (DSR) [9,10]. Other studies have modelled the activated bitumen modulus response by using the stiffness modulus of the corresponding mixture [11]. Researchers have also performed staged extractions to RA granulates in order to assess the properties of the recovered bitumen layer by layer in terms of shear modulus and infrared spectra analysis [12,13,14]. The latter approach contains some risks for interpretation of the results, as it is still unclear whether the solvents influence the bitumen structure and what their impact is on the properties of the recovered binder [15].
The past years, increasing attempts have demonstrated the ability of non-destructive tests to evaluate this problem. Attenuated total reflectance (ATR) spectra obtained by Fourier transform infrared (FTIR) spectroscopy is a widely utilized non-destructive test to study bitumen and especially to trace ageing evolution [16,17,18], to evaluate rejuvenation [19,20] or to evaluate the modification of bitumen [21,22]. ATR-FTIR spectroscopy is suitable to evaluate homogeneous individual components but not a heterogeneous composite material (such as an asphalt mixture), since it can only be applied in a single spot averaging the measuring spectra. For that purpose, more and more researchers draw attention to FTIR microscopy techniques.
ATR-FTIR imaging has been used on asphalt concrete samples with RA in order to demonstrate a method to evaluate the different components highlighting that sample imperfections strongly effect the quality of the measurements [23]. Besides ATR-FTIR imaging, X-ray fluorescence and infrared microscopy have been used in an additional study. The analysis was applied on the bitumen level using markers to track the mobilization of artificially aged bitumen. The conclusion was that ATR imaging was the most successful technique [24]. Other studies have evaluated the blending of asphalt concrete enriched with titanium dioxide (TiO2) as a tracer using Computer Tomography (CT), in macro- and micro-scale [25], and using environmental scanning electron microscopy (ESEM) [7,25]. A scanning electron microscope/energy dispersive spectrometer (SEM/EDS) evaluated the degree of blending of mixtures, with various RA quantities, again using TiO2 as a tracer [26]. Research has also been conducted using atomic force microscopy (AFM) on bitumen levels [26,27]. Another attempt at investigating the blending between two different bituminous binders was by nano-CT scanning images and nano-indentation tests, which did not provide clear and direct conclusions [28].
In order to study the blending process between aged and new bituminous layers, previous research simulated the ageing state of the RA bitumen with artificially aged bitumen in the laboratory; it has been demonstrated that long-term laboratory ageing techniques do not always correspond to field ageing [29,30]. On the other hand, several studies have used actual RA but with the addition of tracers to mark the mobilization, such as the TiO2. The question that might arise here is to what extent markers can influence the mobilization. Furthermore, earlier studies considered the mobilization of only bitumen or focused only on the diffusion process between two bituminous binders. The aforementioned procedures highlight the need of evaluating field-aged asphalt materials and focus on the actual blending conditions as it will happen in the bituminous coating of an RA granulate. In reality, the stones in the asphalt mixture are bonded not by pure bitumen but by the bituminous mortar (Figure 1). For clarification purposes, the following definitions are given: asphalt mortar is a combination of bitumen and fine particles (filler and sand smaller than 0.5 mm) and asphalt mastic is a combination of bitumen and filler.
In this study, actual RA granulates are used without the addition of foreign tracers and provide the opportunity to study the spatial distribution of neat bitumen within the mortar scale by means of ATR-FTIR microscopic measurements. This research aims firstly to assess the application of FTIR microscopy directly on actual RA granulates, secondly to fingerprint the different zones of components, and thirdly to trace rejuvenating agents and mobilization of neat bitumen within the coating of the granulates.

2. Materials and Methods

For the purpose of achieving the aims of this research, an FTIR microscope (LUMOS by Bruker, Billerica, MA, USA) in ATR-mode was used to evaluate the coating of various RA samples. Characteristic absorbance bands were selected, which were typical for the components that form the final sample, i.e., bitumen, fines, rejuvenator, and resin (see Section 2.3). After the definition of the spectra, which is a graphical visualization of the infrared light absorbance as a function of the wavelength in the mid-infrared region of 4000—600 cm−1, data concerning the integration of the characteristic areas were analyzed and formed into a chemical imaging of the area studied (see Section 2.3). The integrated areas were further analyzed to inspect the numerical distribution of carbonyl levels within the bituminous zone (Section 3.2).

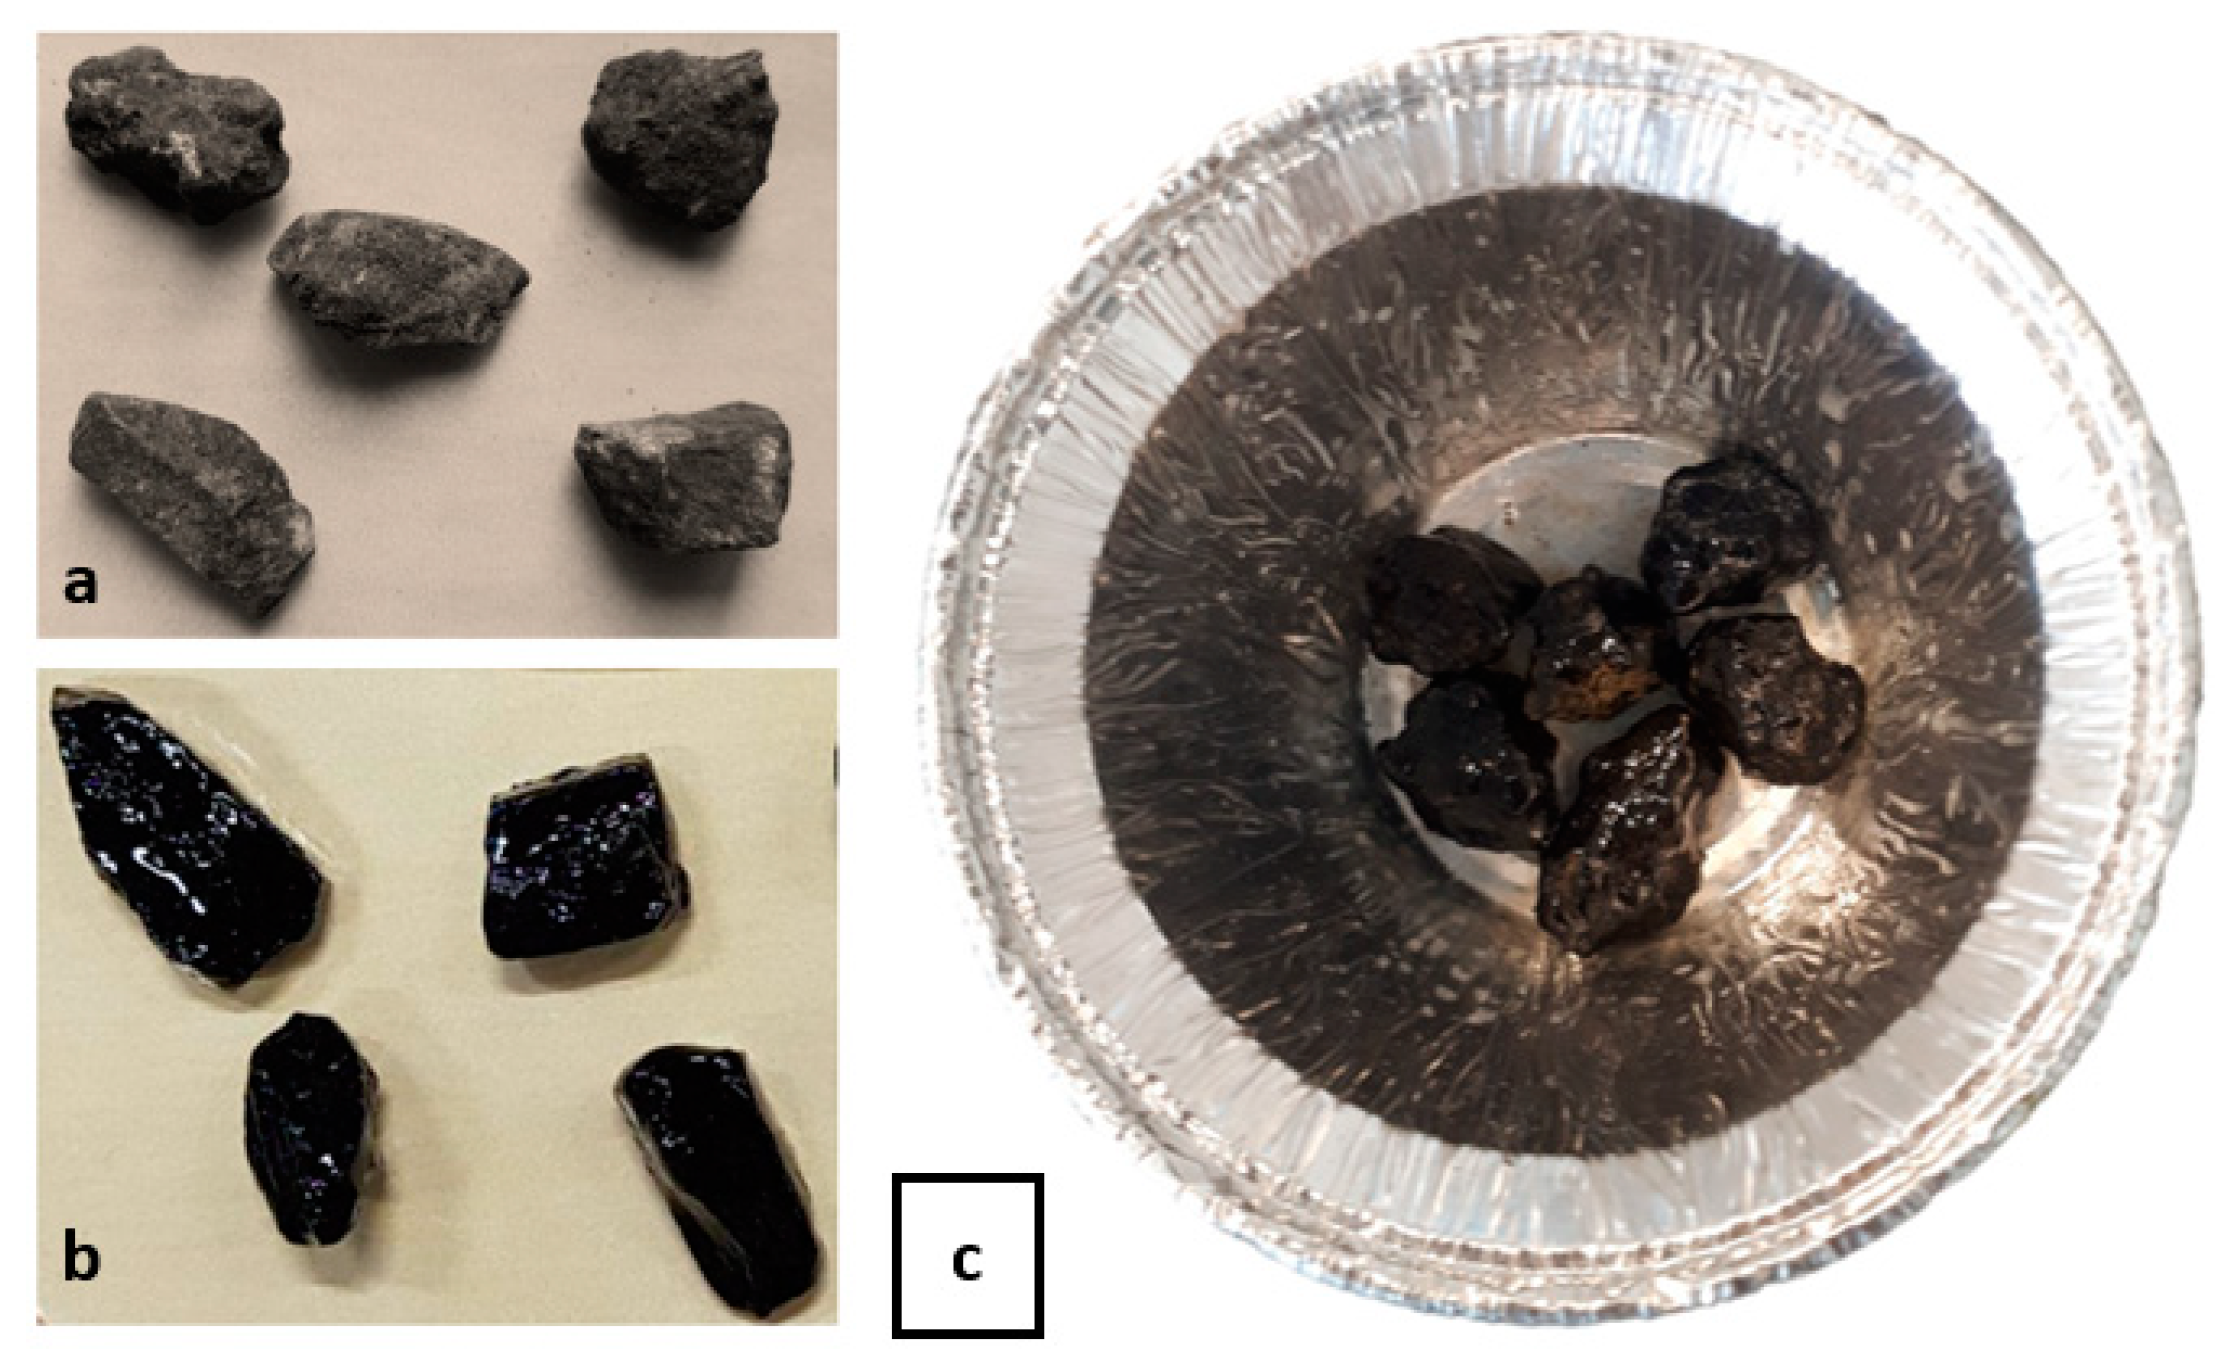
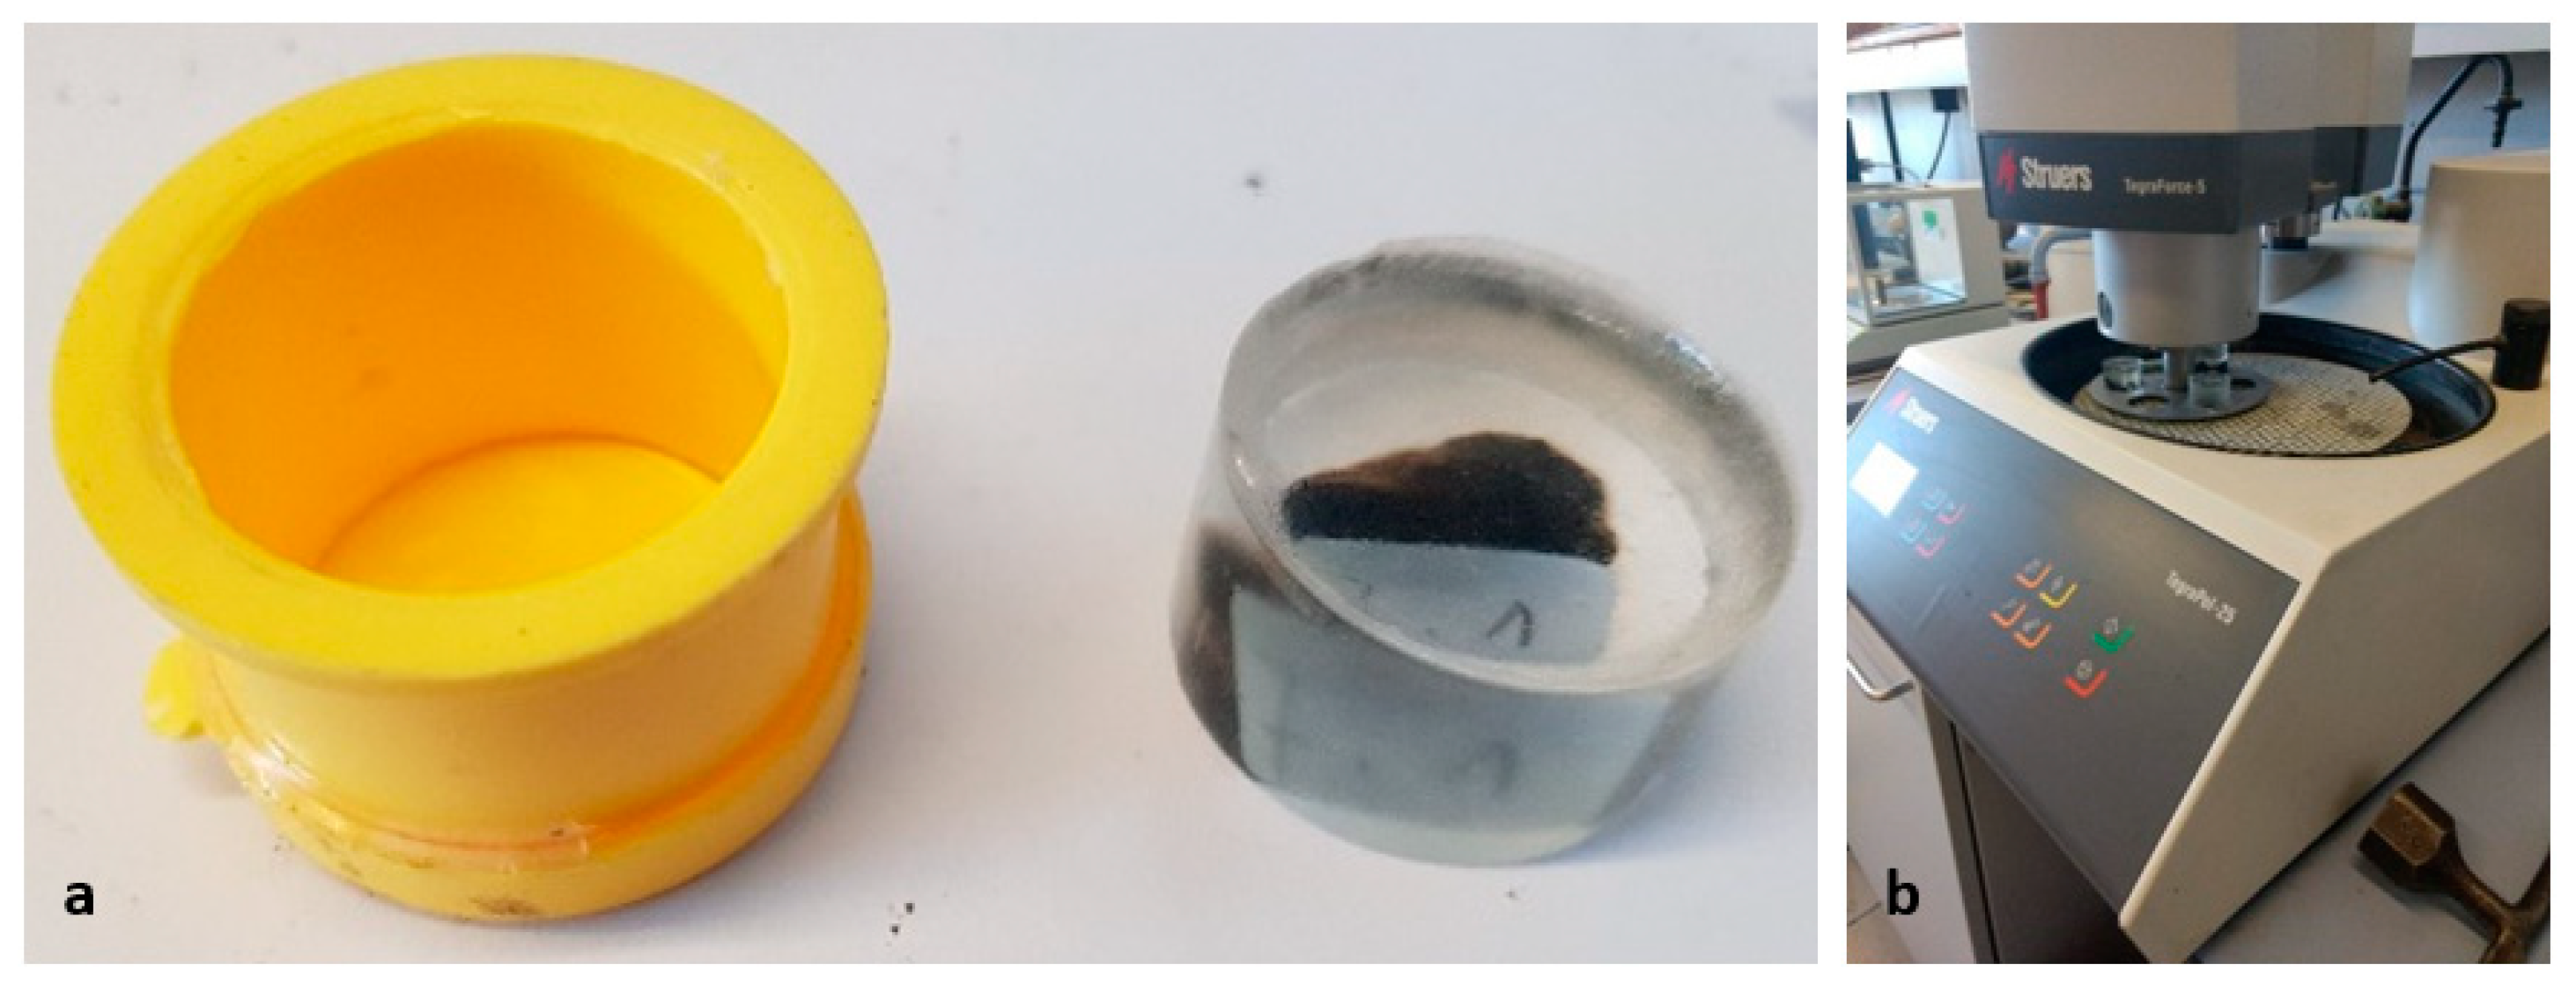
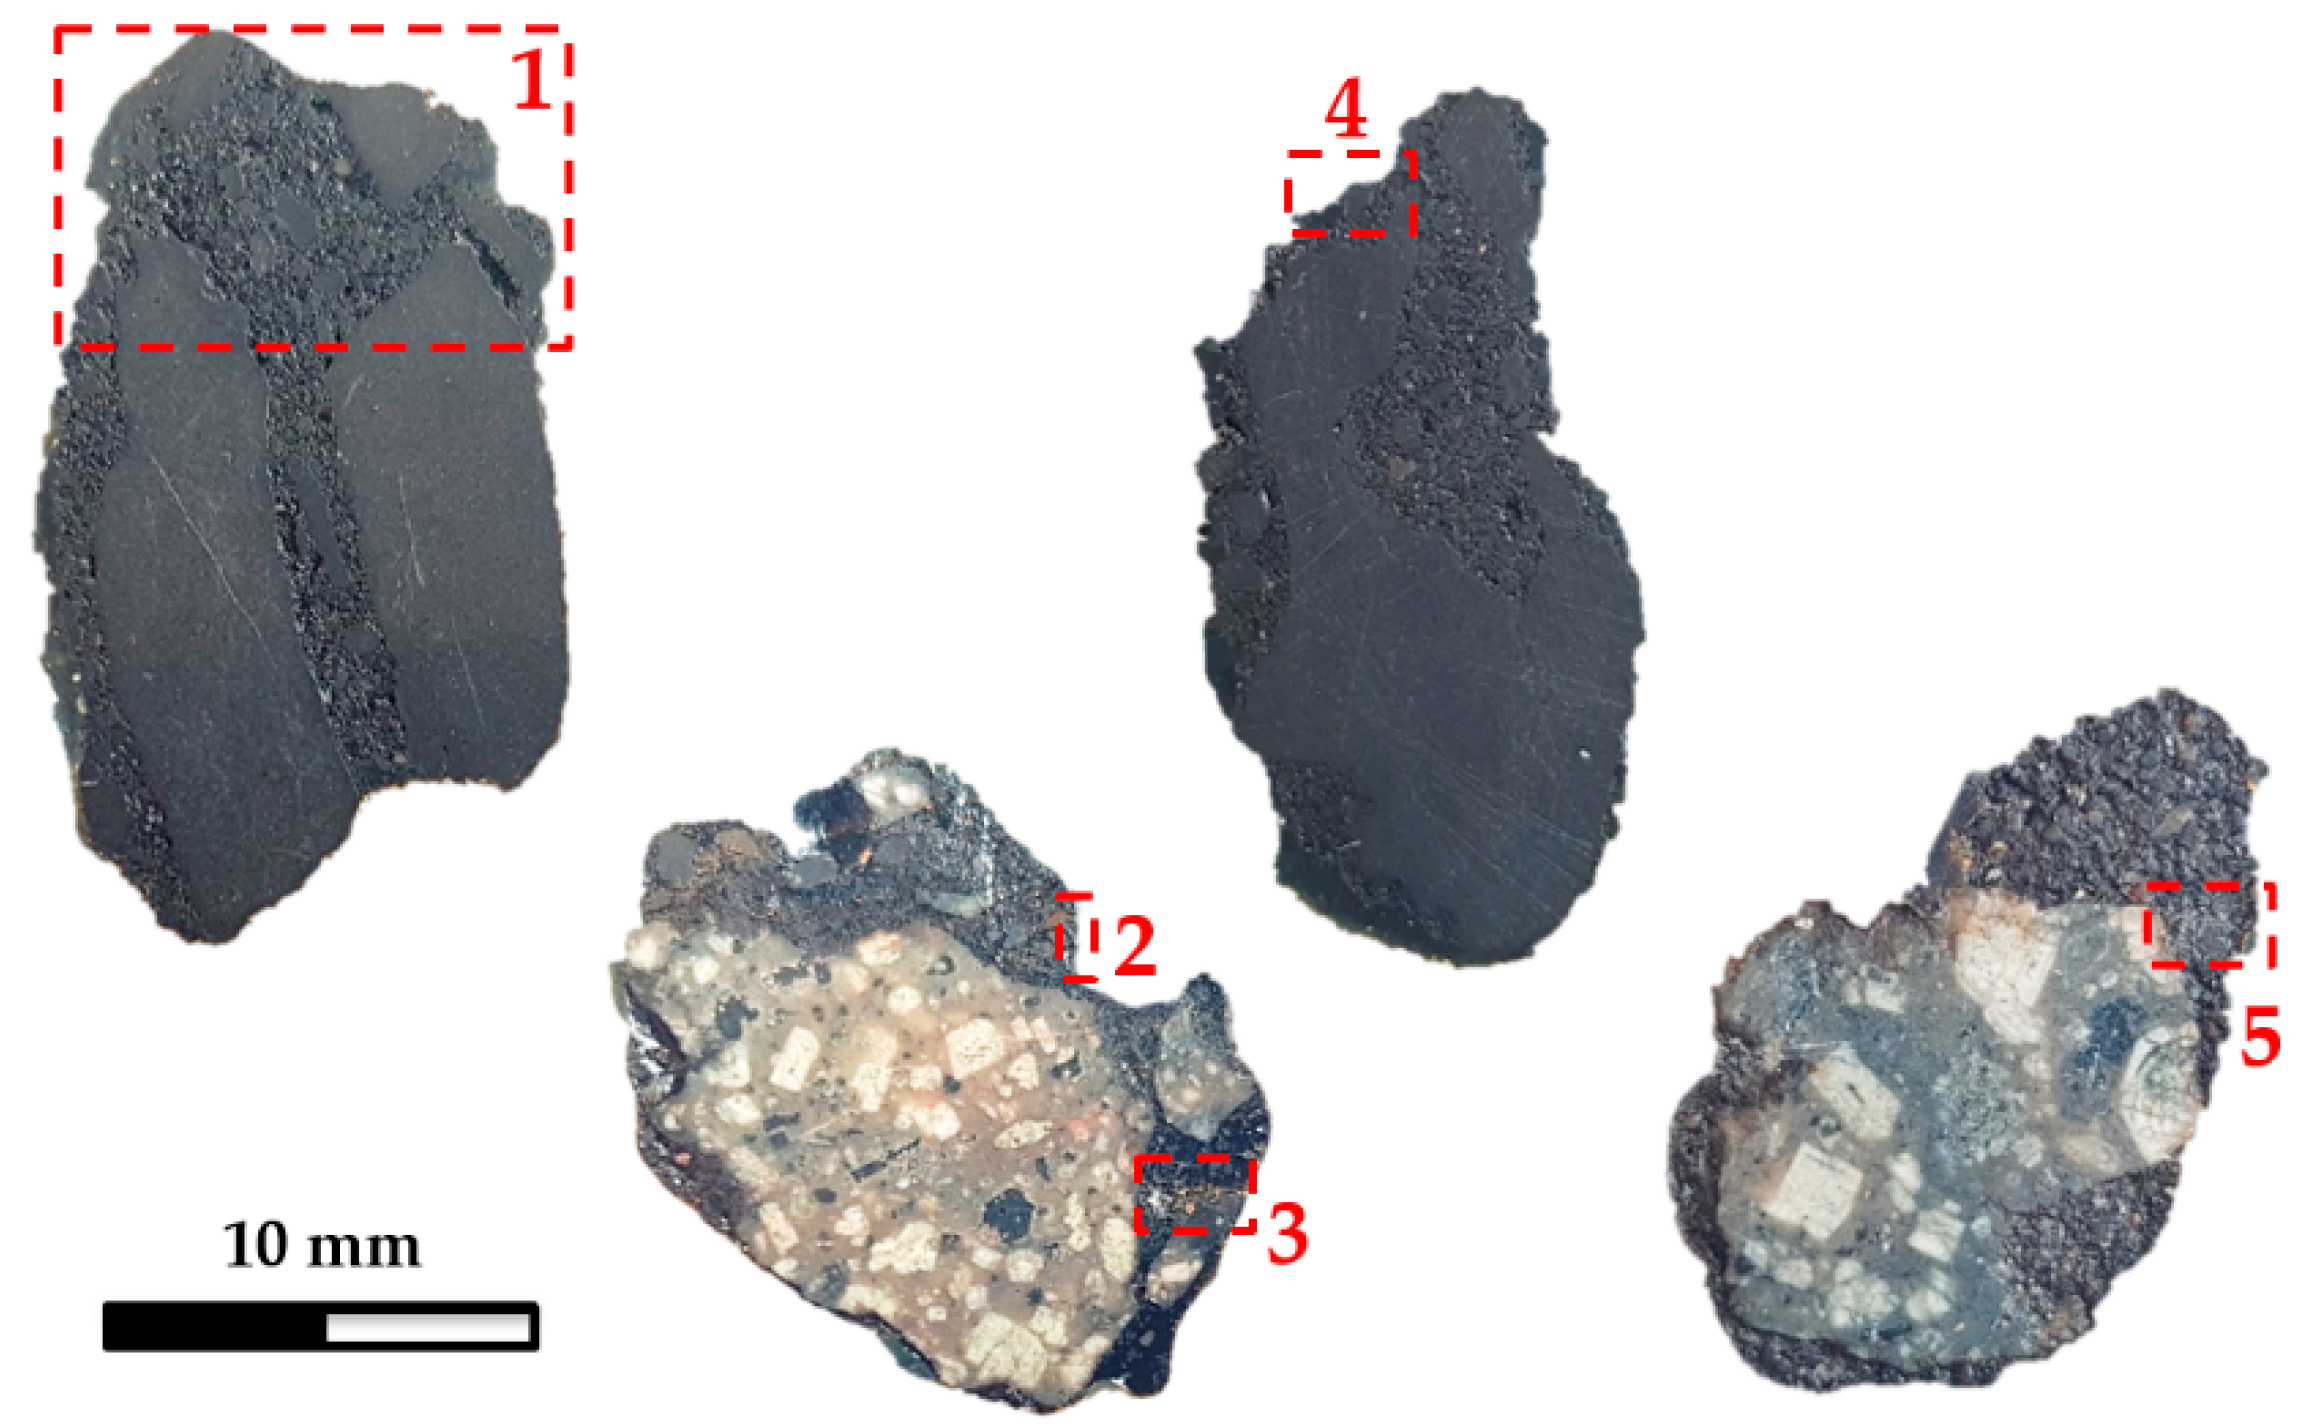
2.1. Sample Preparation

Four types of RA granulate samples were studied in this study. Among the samples, one is an untreated RA granulate (sample name: GRA) and three are treated RA granulates (sample names: GRAB, MRAB, and GRAR). A summary of the samples and their treatment is presented in Table 1. The RA used in this study consists of granite and limestone aggregates (inspected visually), and the bitumen after extraction and recovery has a penetration of 24 ⅟10 mm. The treated RA granulates were fabricated following three different procedures. First, sample GRAB was prepared by mixing the RA granulates with neat bitumen. Second, sample MRAB is an RA granulate that was derived from an actual asphalt concrete mixture (type AC14, see Table 2). Third, the GRAR sample was sprayed with rejuvenator. The preparation of the treated samples is more elaborately described in the following paragraphs.
The GRAB samples were fabricated following the procedure described in § 5.2 of EN 12697-11:2012 [31]. In this standard, a method is described to create a uniform bituminous coating on mineral aggregates. An adequate amount of RA granulates (600 g) was preheated at 110 °C. In order to avoid excessive ageing of the RA binder, the preheating time was limited to two hours. The preheated granulates were then manually mixed together with 3% of 35/50 penetration grade neat bitumen (by RA granulates mass). The mixing conditions were a maximum of 2 min at 150 °C. Afterwards, the covered stones were spread and separated on silicone paper (Figure 2b). Visually traced agglomerations were rejected.
The MRAB samples were obtained from an actually mixed AC14 mix with 55.7% of RA in the mixture. The composition of the mixture was designed in such way that the only source of coarser aggregates (larger than 8 mm) was the RA granulates. The mix composition is presented in Table 2. The production of the mixture was done according to EN 12697-35:2016 [32]. In contrast to the GRAB samples, the mixing took place for 5 min at a temperature of 180 °C instead of maximum 2 min at 150 °C. After mixing, only the larger stones (>8 mm) were selected for MRAB in order to assure only covered GRA was sampled.
Finally, the GRAR samples were prepared by spraying a crude tall oil-based rejuvenator on the samples. Six (6) RA granulates were sprayed with 2% rejuvenator on the RA mass (Figure 2c). Both RA and rejuvenator were at room temperature. In order to accelerate the diffusion of rejuvenator [33], the sprayed stones were placed for 45 min in an oven at 110 °C. This temperature is according to the heating limits of RA proposed in § 6.3 of EN 12697-35:2016 [32]. The amount of rejuvenator added can be considered as rather high when compared to other studies [34]. The purpose here is to make sure there is a traceable amount of rejuvenator.
A necessary step for the utilization of the FTIR microscope is the existence of a flat and even sample surface. In order to fulfil this requirement, the RA granulates were embedded in epoxy resin. For the preparation of the stone-resin samples, the following steps were followed: First, the samples were embedded in a plastic mold with resin (Figure 3a). The height of the stone-resin sample is 25 mm and the diameter 30 mm. The samples were then cured at room temperature for one day. Afterwards, the cured samples were demolded and polished with a mechanical grinding/polishing machine (Struers TegraForce 5) (Figure 3b). The polishing was done in two steps. During the first step, a 220 grit size sandpaper removed the larger part. During this step, the plateau is rinsed by cool water, which keeps the temperature low during the polishing. The second step uses a high friction paper together with a diamond paste (9 μm), providing an even final surface.

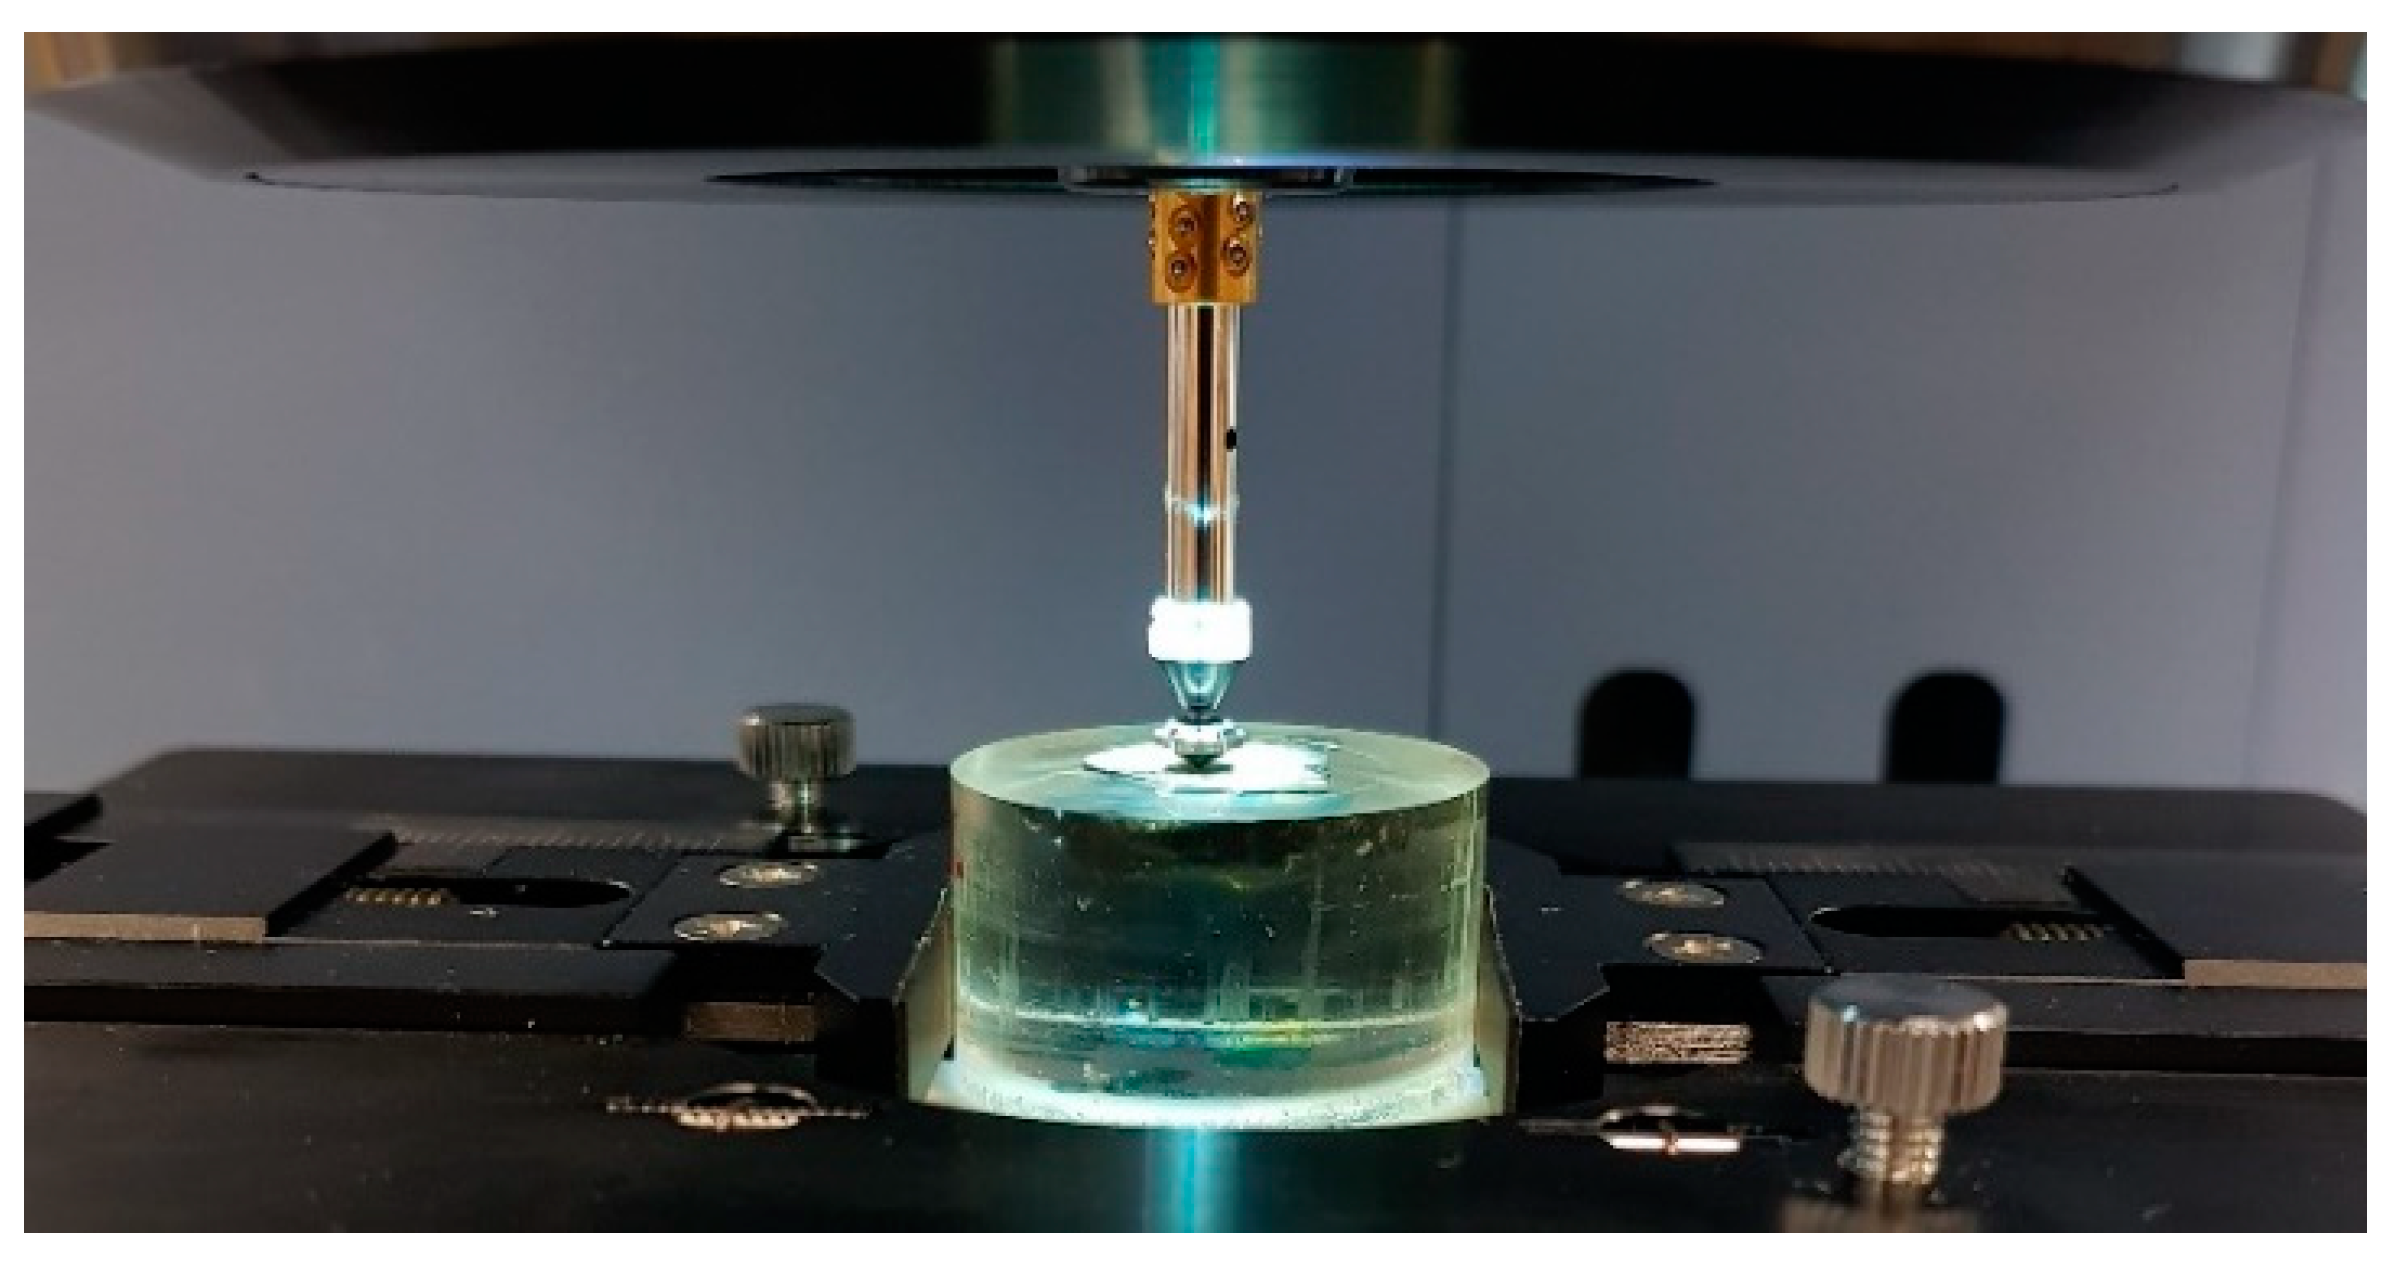
2.2. FTIR Instrumentation
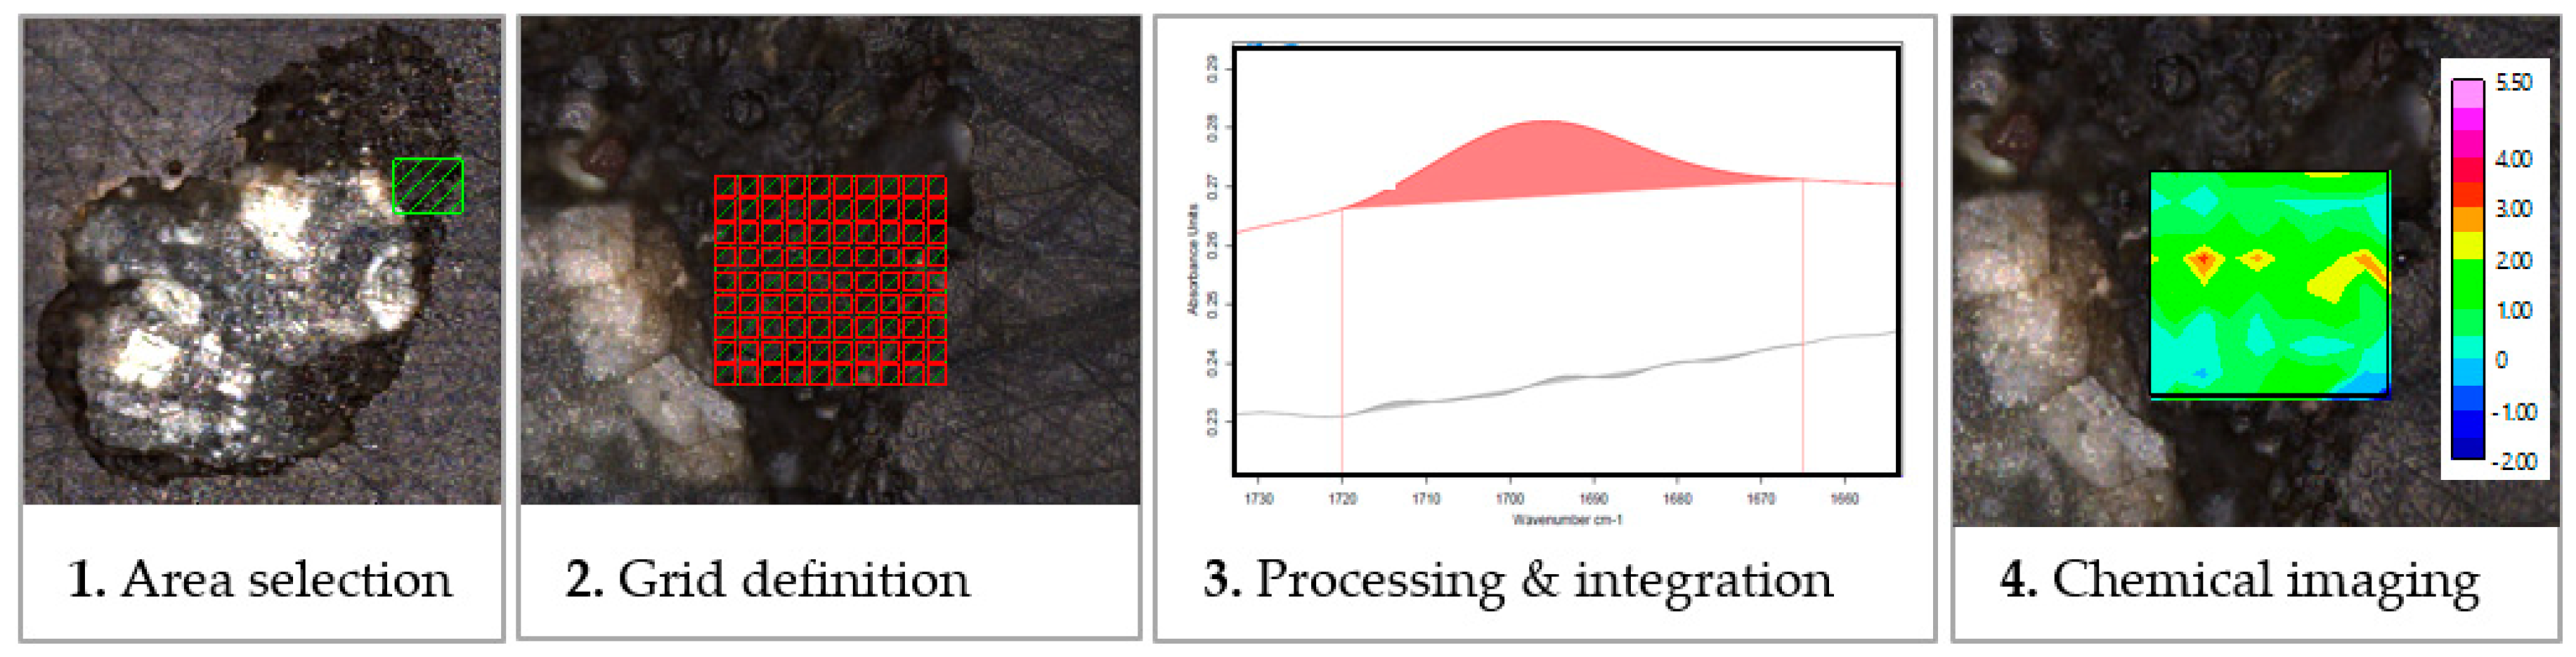
In this study, an FTIR Microscope (Lumos by Bruker, Billerica, MA, USA) was used. The infrared analyses were performed using a germanium ATR crystal with a high refractive index (nGe = 4), which permits the analysis of dark samples. The instrument is able to generate a chemical map by integrating the infrared spectra over a specified area. The integration methods used for this study are presented in Section 2.3. The stone-resin samples were placed on a mounting holder called the Micro-Vice Holder (Figure 4). Each spectrum was compiled from 32 scans with a resolution of 4.0 cm−1 in a range of 4000–600 cm−1. To avoid damaging the crystal, the applied contact pressure was limited to “low pressure”.

2.3. Methodology

For the investigation of the RA granulates’ coating, a procedure was set (Figure 5). First, the area to be measured is selected. Second, the grid of the points to be measured is defined. Third, the measured spectra are preprocessed. Fourth, the integrated typical bands are visualized. The intensity visualization of the bands on the microscopic image is defined as chemical imaging. The processing of the spectra and evaluation of the derived data was done using the Bruker OPUS™ software (v. 7.5). Each sample was analyzed following the proposed steps.
Figure 6 shows the polished surface of the samples and the areas selected to be analyzed (Areas 1 to 5). This figure shows only the exposed surface of the granulate without the resin. For illustrative purposes, the resin was removed graphically in Figure 6 to provide a clear view of the samples and their bituminous coating. The areas were selected with the purpose of observing potential traces of partially or non-blended aged bitumen and to track the presence of other components such as resin or fine particles. The focus was mainly on the interface of mortar and resin (Areas 2 and 4), and also on areas starting from the resin towards the stone, creating a profile (Areas 3 and 5). Area 1 is a single case where the analysis was performed in a significantly larger area. On average, the spatial resolution applied for each point of the analysis was 30 × 30 µm2.
The solidity of the studied samples does not allow probe penetration into the sample, which has a direct effect on the intensity of the absorbance signal. The software provides the solution of atmospheric compensation, which allows the correction of the signal. This step uses “physical models to estimate the amount of atmospheric gases in the single-channel spectra and therefore compensates disturbing H2O and/or CO2” [35]. The compensated areas are from 3600 to 4000 cm−1 for H2O compensation and from 2300 to 2400 cm−1 for CO2 compensation [35]. This step only affects the aforementioned bands, and it is suitable for the current research since those areas are free of absorption bands related to the RA samples (see Table 3).
The spectra were normalized using the min-max normalization method [35]. This method was applied by selecting the C–H stretching band (2990–2820 cm−1) as the band to be maximized. The result is that the absorbance of the most intense peak (at 2920 cm−1) is scaled to 2. A normalization step is required in order to avoid intensity problems caused by varying contact between the sample and the crystal. The C–H stretching band is the most appropriate since it is not affected by bitumen ageing [16] and it is present for both bituminous and resin zones.
For the visualization of the chemical images, specific bands were selected to be integrated. The integration method was used to quantitatively measure the area under the spectrum graph, which represents the intensity of a certain functional group, using wavelength limits as a baseline. The characteristic bands used in this study for each component are presented in Table 3. The tracing of the carbonyl group was the main focus since the presence of carbonyls indicates ageing of bitumen [17]. The carbonate group was used as a marker of the mastic/mortar area and the carboxylic acids group was used for the rejuvenator. Finally, the resin can be distinguished by the ring vibration of the epoxides bond. Figure 7 demonstrates the integration method of the characteristic infrared bands, integrated in spectra derived from different materials by means of FTIR-ATR spectroscopy. The chemical images can then be formed on the sample microscopic image, providing the opportunity to trace spatial intensity of the integrated functional groups.

3. Results and Discussion

Five surface areas of RA granulates were analyzed using FTIR microscopy in ATR mode. Using the infrared spectra derived, chemical images were formed by integrating the typical bands for each area separately. In Section 3.1 the spatial distribution of typical bands is presented, and in Section 3.2, the numerical distribution of carbonyl levels is exhibited only for the bituminous area.

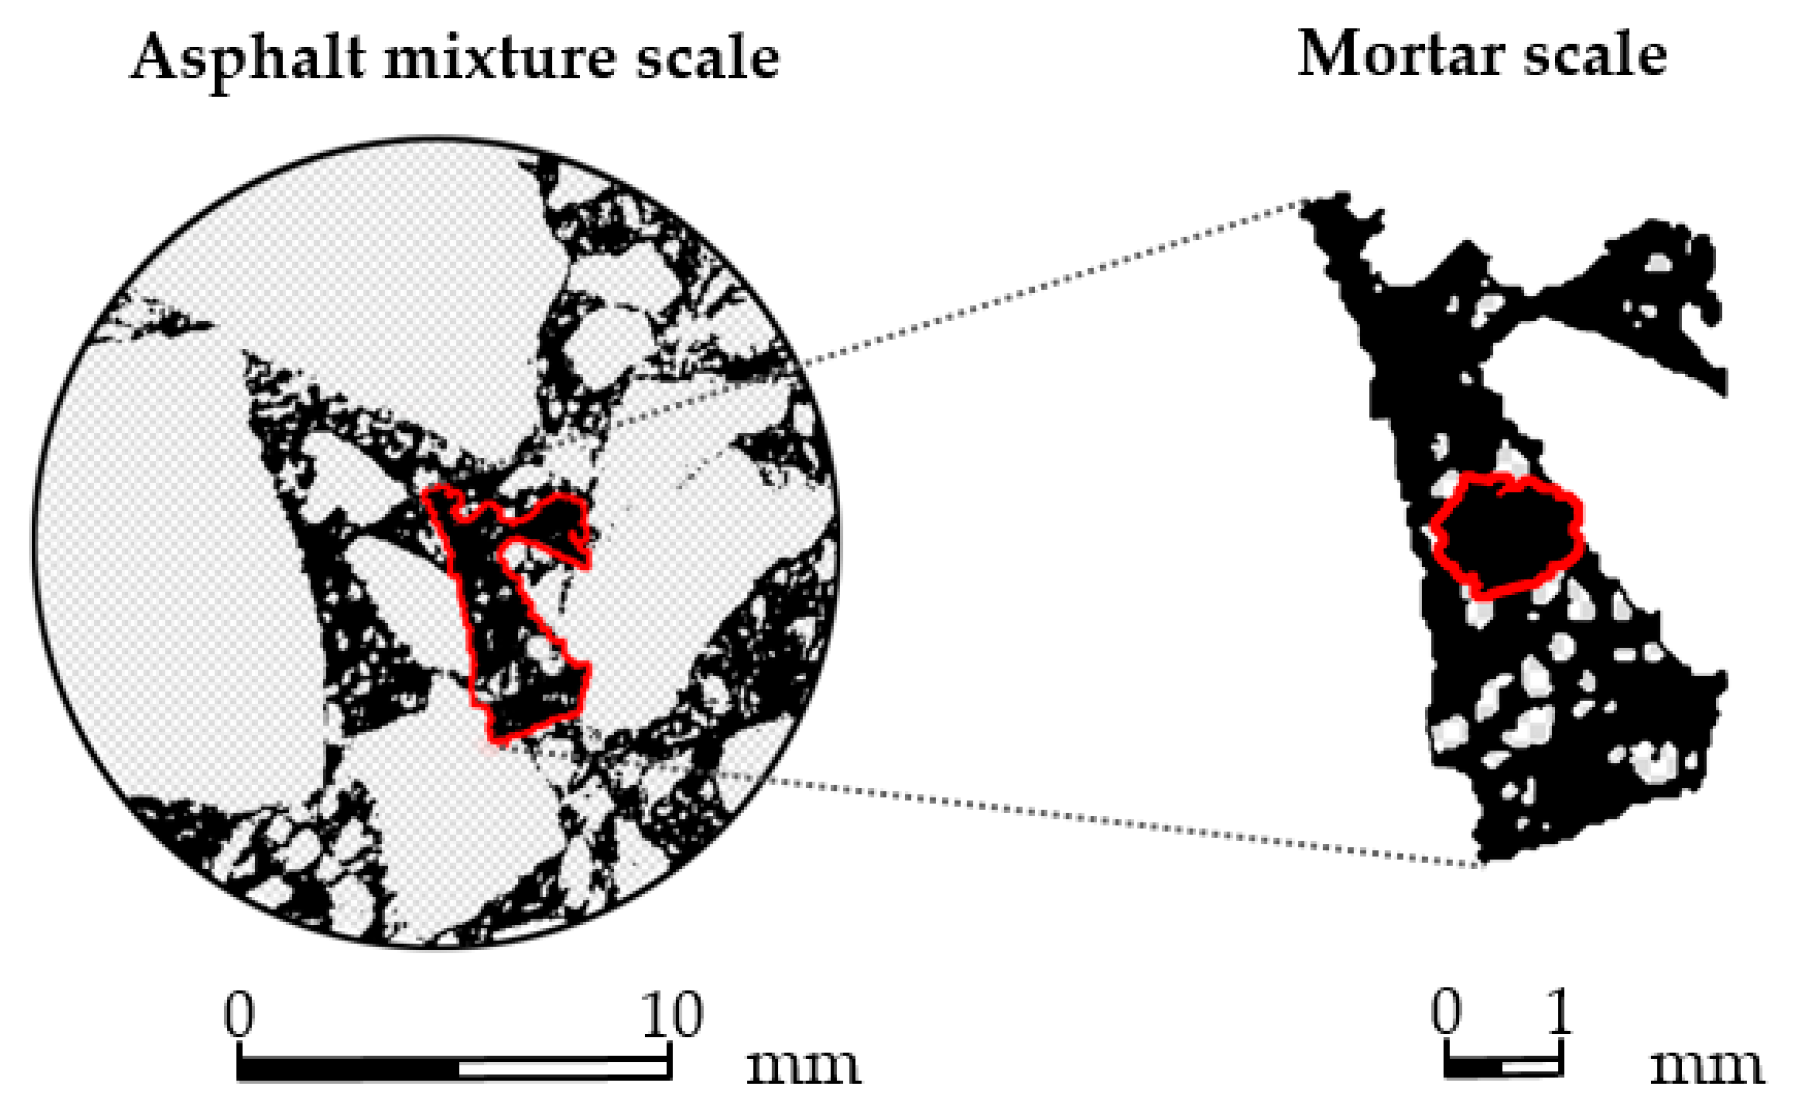
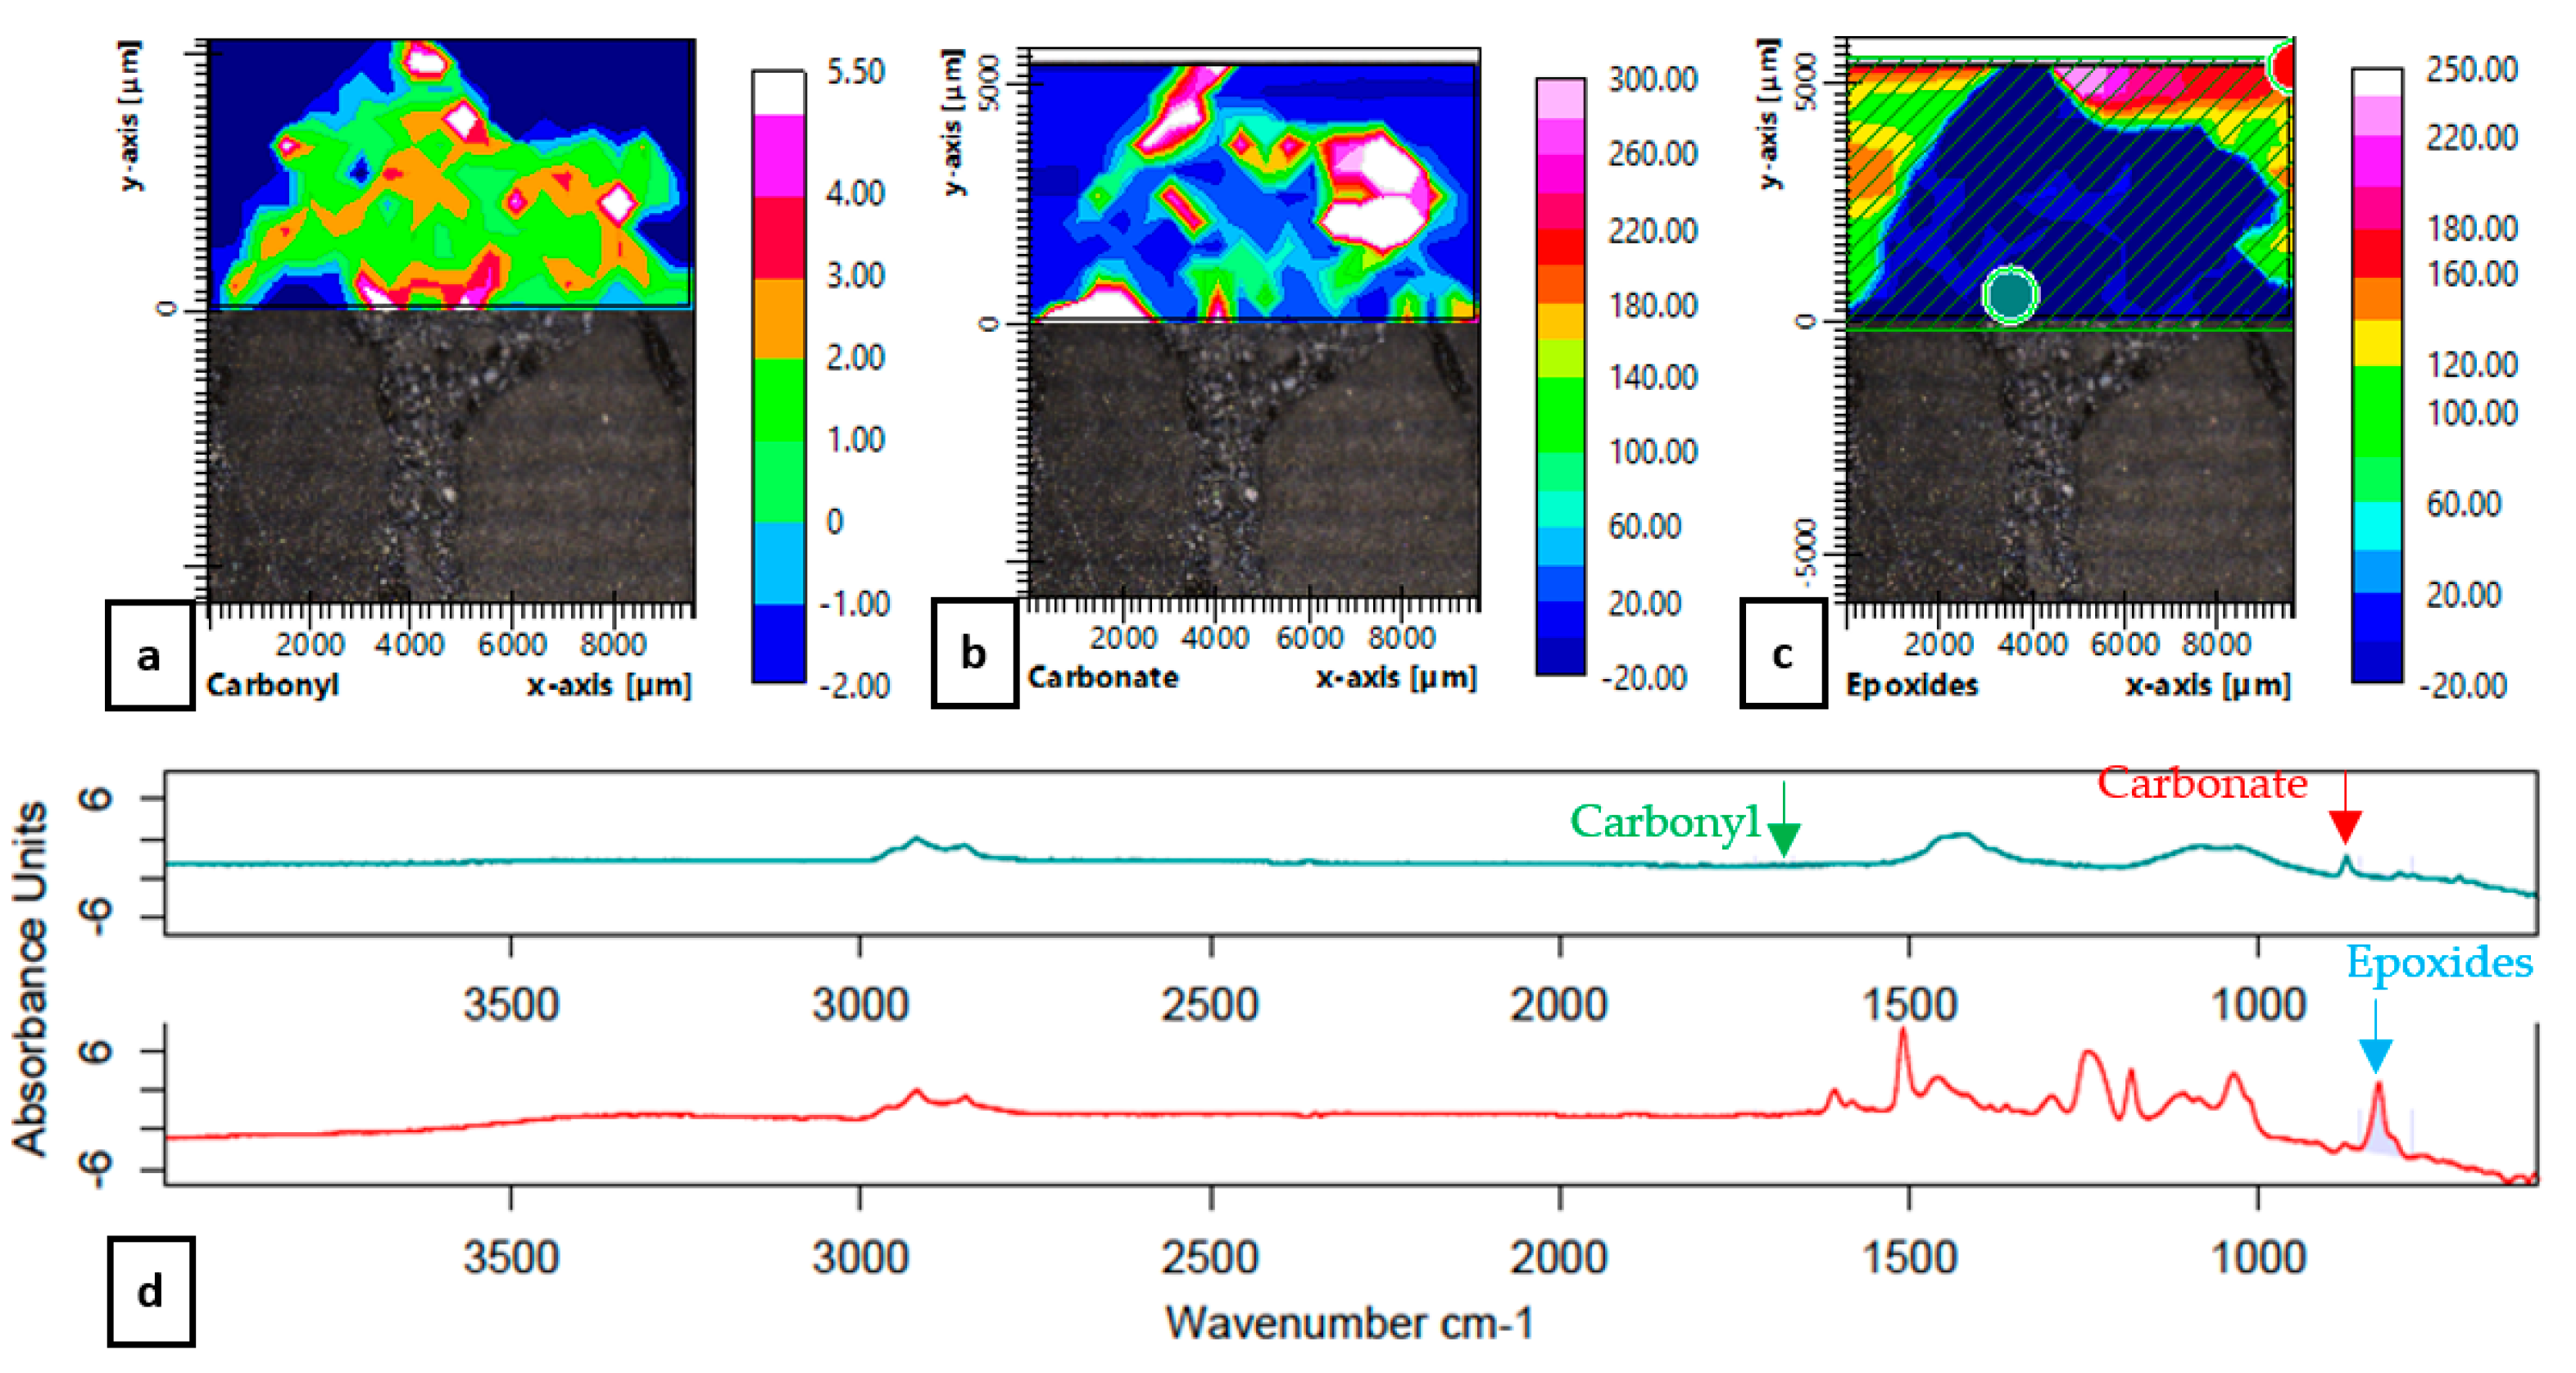
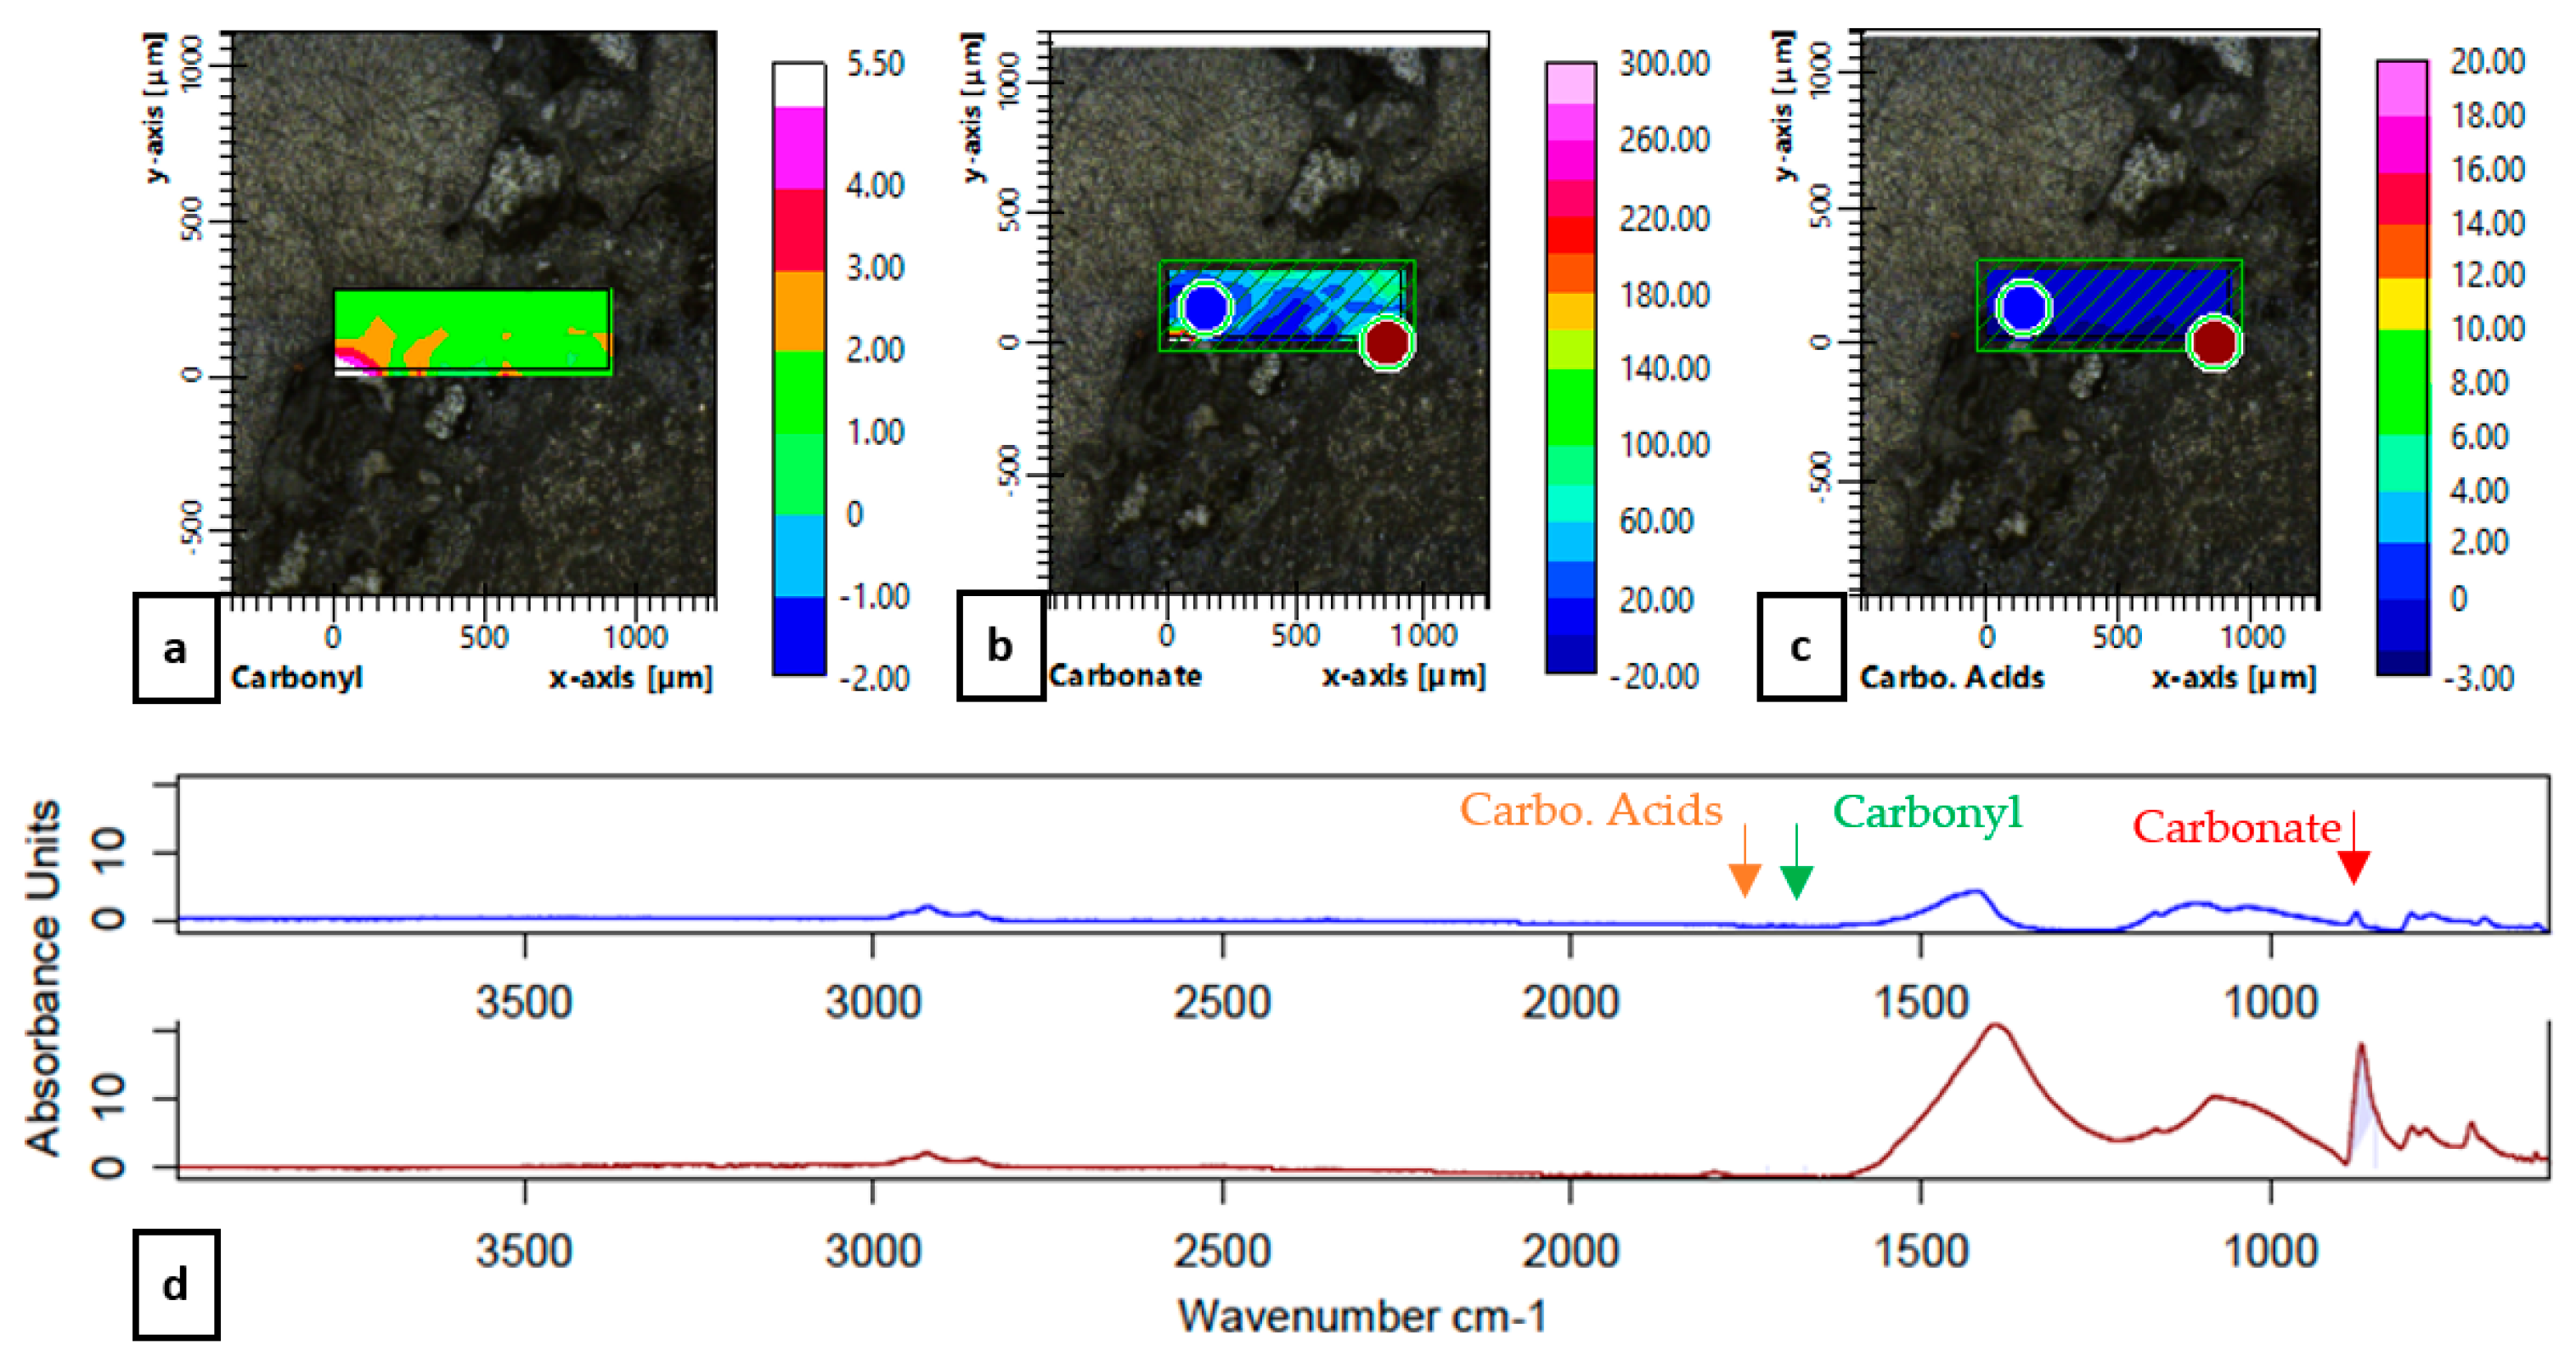
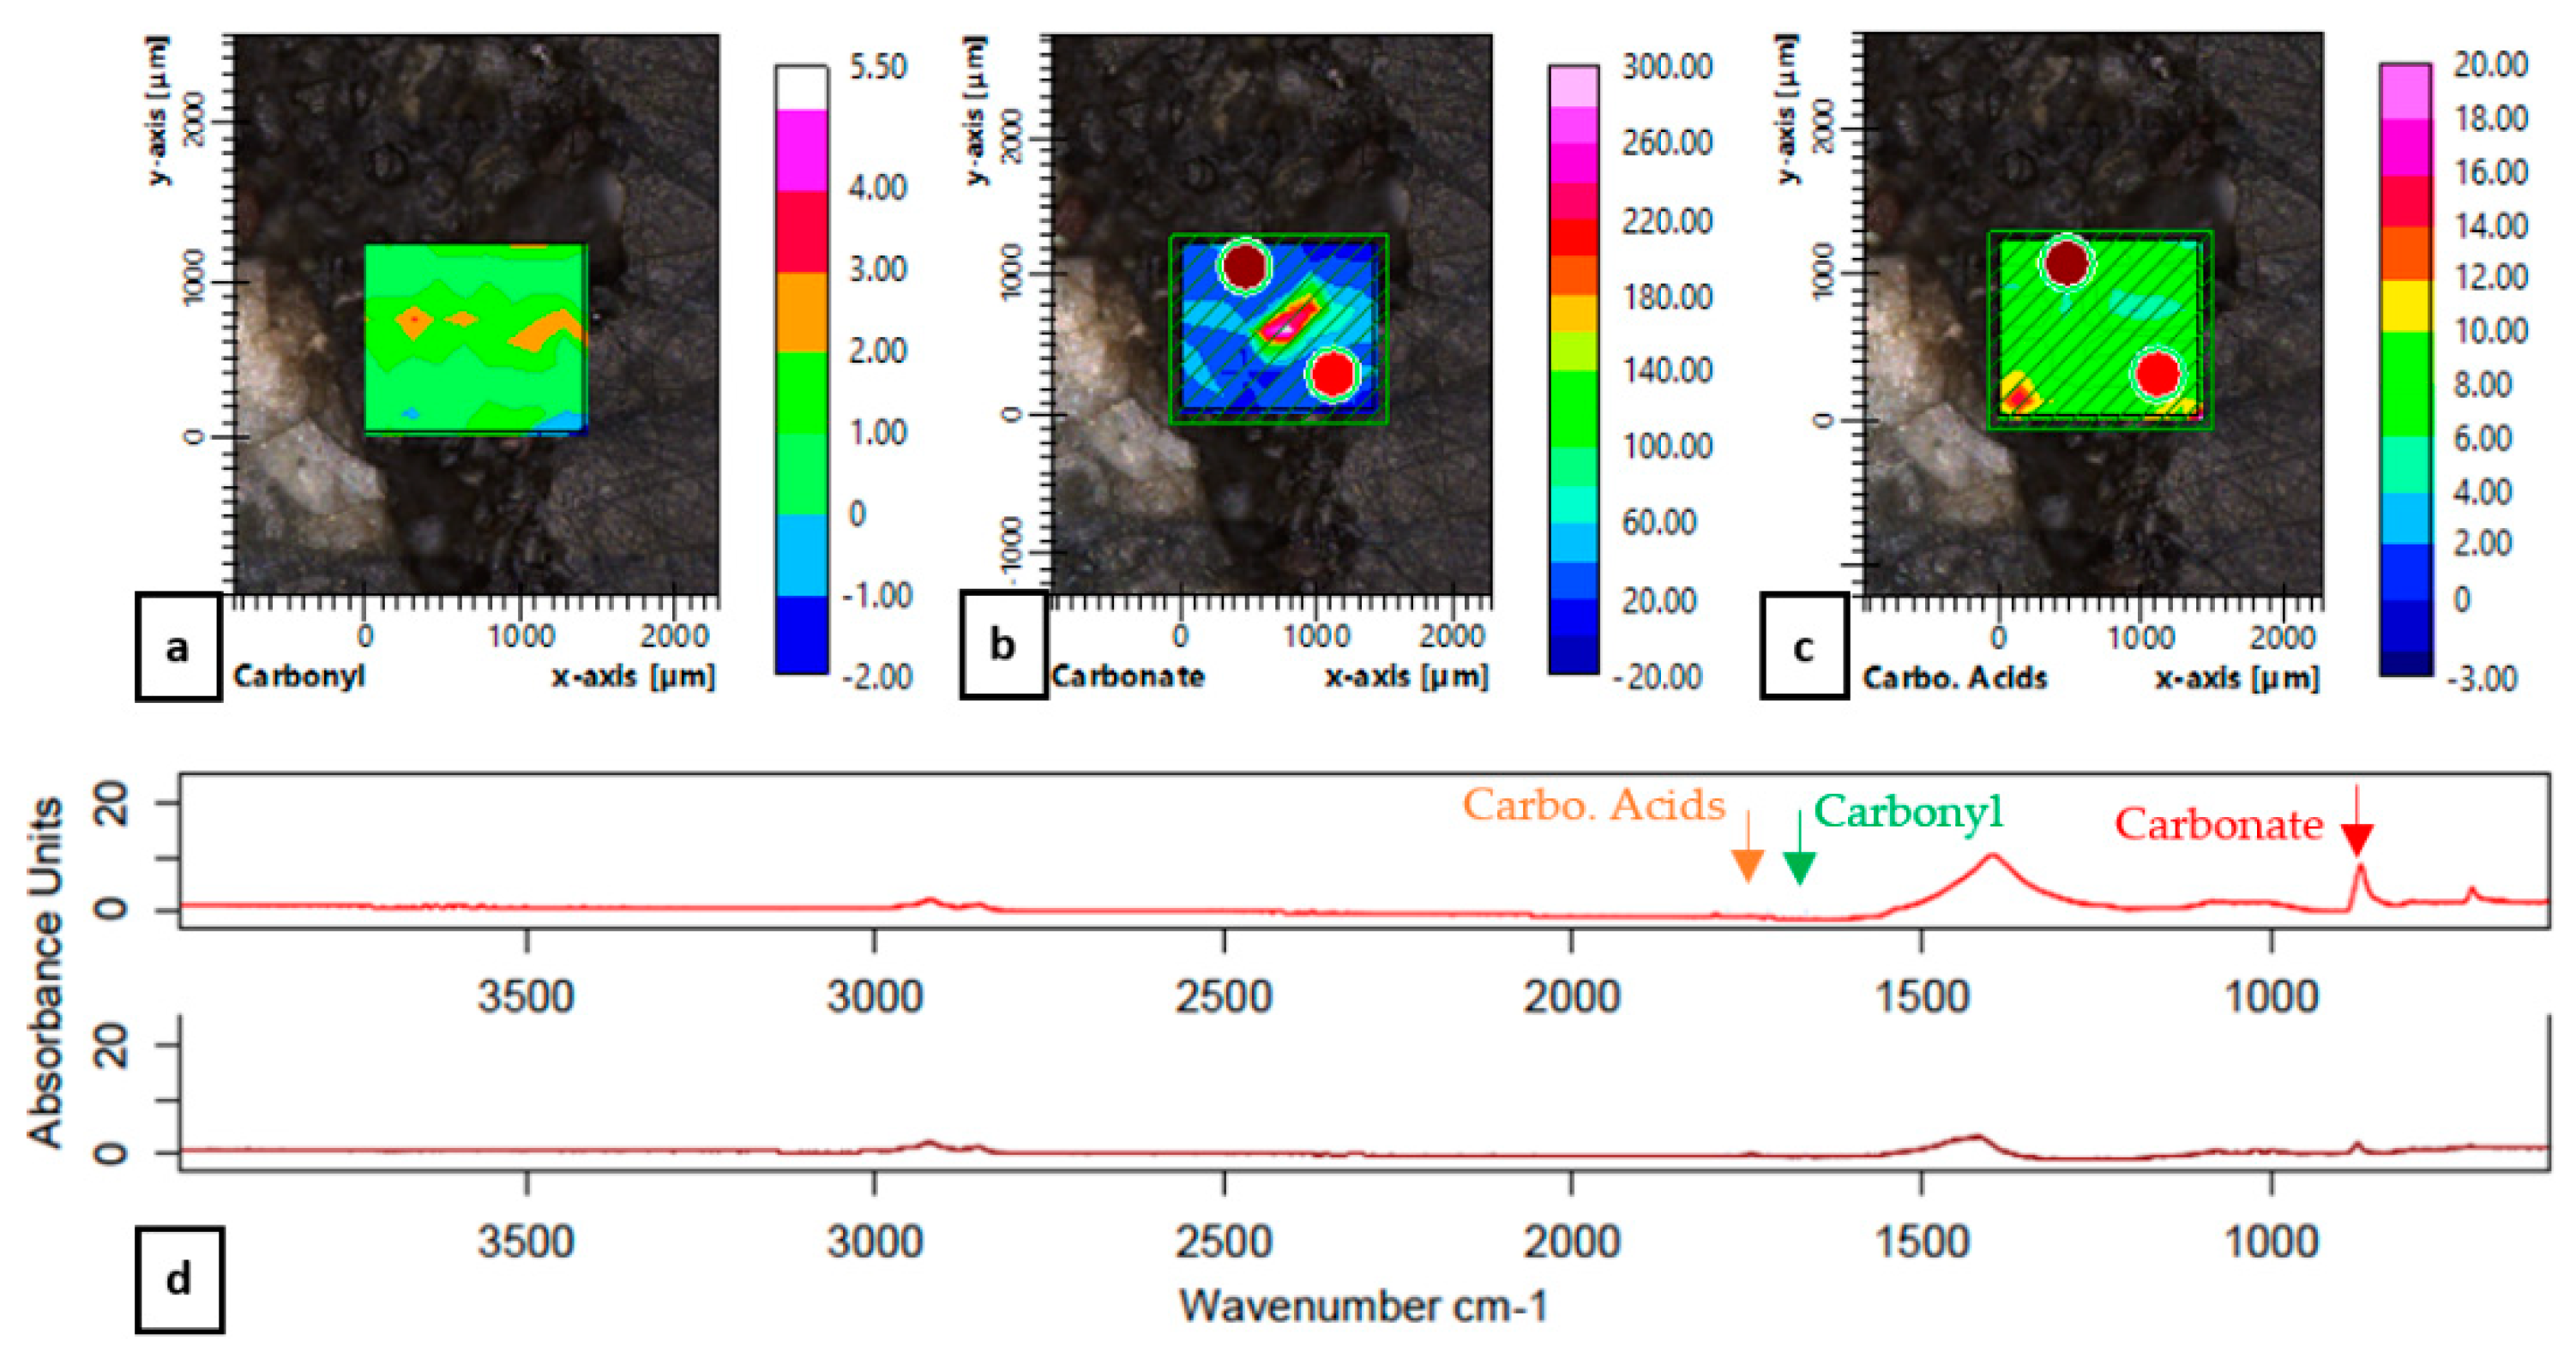
3.1. Chemical Imaging

The selected areas (Areas 1 to 5) cover three basic situations: (i) original ageing state of RA bitumen, (ii) interaction between neat bitumen and RA, and (iii) rejuvenation of RA. In order to have comparable chemical imaging, the color plot scaling is the same between chemical maps of the same band, except for the carbonate group, since larger variations in absorbance are noticed here compared to other areas.
Figure 8 shows the results of the chemical imaging analysis of the GRA sample. The spatial resolution of the area studied is 9800 × 5400 μm2. In Figure 8a, the integration of carbonyls is demonstrated, while Figure 8b,c show the carbonate and the epoxides, respectively. Here, it is noticeable that the resin area is distinguishable by the chemical imaging of the epoxide (level above 60). The level of carbonyl varies here between 0 and 5.5. In Figure 8b, larger aggregate particles (white areas) and also mortar areas can be seen from the integration of the carbonate.
The chemical imaging analysis of Area 2 of the GRAB sample is presented in Figure 9. The spatial resolution of Area 2 is 390 × 2450 μm2. Figure 9a shows that the carbonyl level is lower compared to sample GRA (Figure 8a) and that the main part of Area 2 is resin free, except from a minor area at the upper side (Figure 9c). According to Figure 7a, the absence of carbonyls is an indication of unaged bituminous areas. Based on that observation and by detecting the carbonyl level of Area 2, the presence of a blend between aged and neat bitumen can be assumed in this area.
The third area is illustrated in Figure 10. A profile area of the bituminous coating of sample GRAB is presented here with the aim to track the mobilization in full depth towards the stone. The spatial resolution of Area 3 is 2800 × 610 μm2. Similar levels of carbonyls can be observed between Areas 1 and 3 (Figure 8a and Figure 10a). On the other hand, the levels in this area (Figure 10a) differ from the levels in Area 2 (Figure 9a). A possible hypothesis is that a lower mixing temperature and less mixing time can lead to ineffective mixing between the neat bitumen and the RA mortar. Findings in literature support this hypothesis [36]. Another observation that strengthens this hypothesis is the presence of lower levels of carbonyls and the absence of high carbonate groups in Area 2 compared to area 3 (Figure 9a, Figure 10a, Figure 9b, and Figure 10b, correspondingly) which is an indication of a low degree of blending. The chemical imaging of alkyl levels of Area 3 is demonstrated in Figure 10c, which shows that Area 3 is a bituminous zone.
The findings of the last two samples, MRAB and GRAR, are presented in Figure 11 and Figure 12, respectively. The spatial resolution of the studied areas are 1000 × 340 μm2 and 1580 × 1360 μm2, accordingly. Concerning the carbonyl level of Area 4, a stable concentration in an order of magnitude of 2 (Figure 11a) can be observed. Since the fabrication conditions of that sample are different compared to GRAB sample, i.e., mixed at a higher temperature for a longer period of time, one can assume a higher degree of blending, as well as a more homogenized dispersion of the carbonyls within the analyzed area. Figure 12 provides information regarding the chemical imaging of the GRAR sample where a rejuvenation agent was sprayed on the RA sample. The carbonyl levels of Area 5 range from 0 to 3 (Figure 12a), which are lower compared to the concentration of carbonyl of the GRA reference sample (Figure 8a). The presence of rejuvenator can be verified by the chemical imaging in Figure 12c, where the carboxylic acids show values between 6 and 16, and also the absence of the same band in non-rejuvenated samples such as the MRAB sample (Figure 11c), where the absorption is below 0.

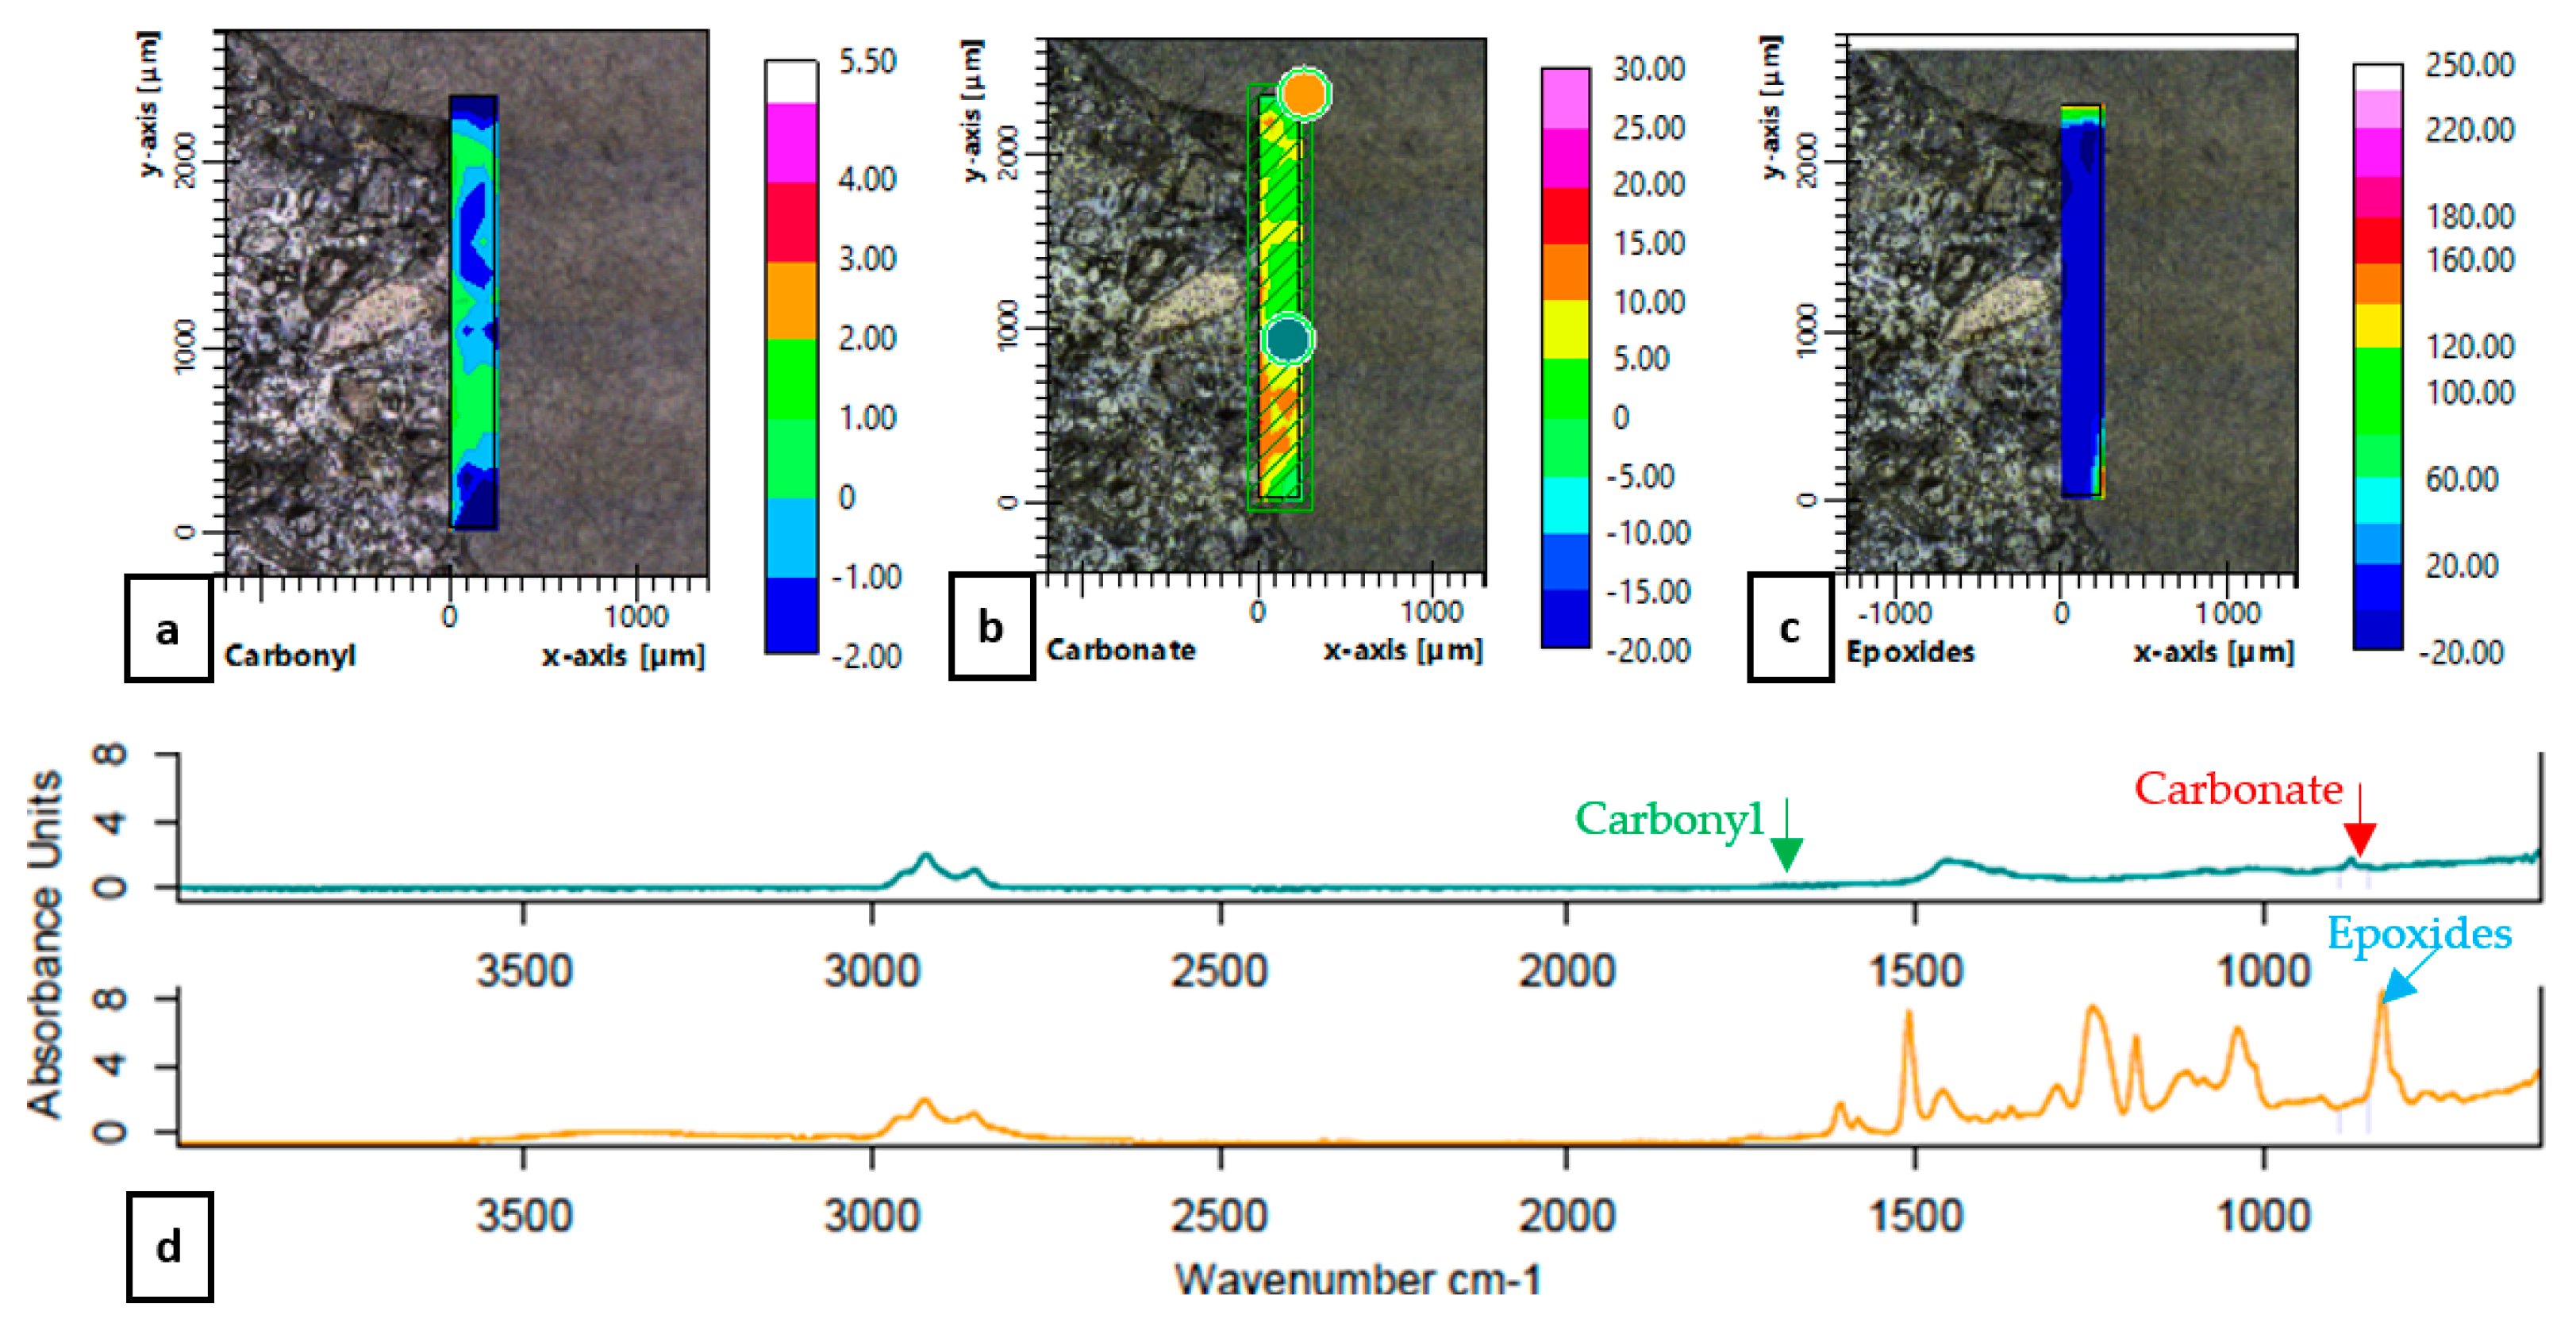
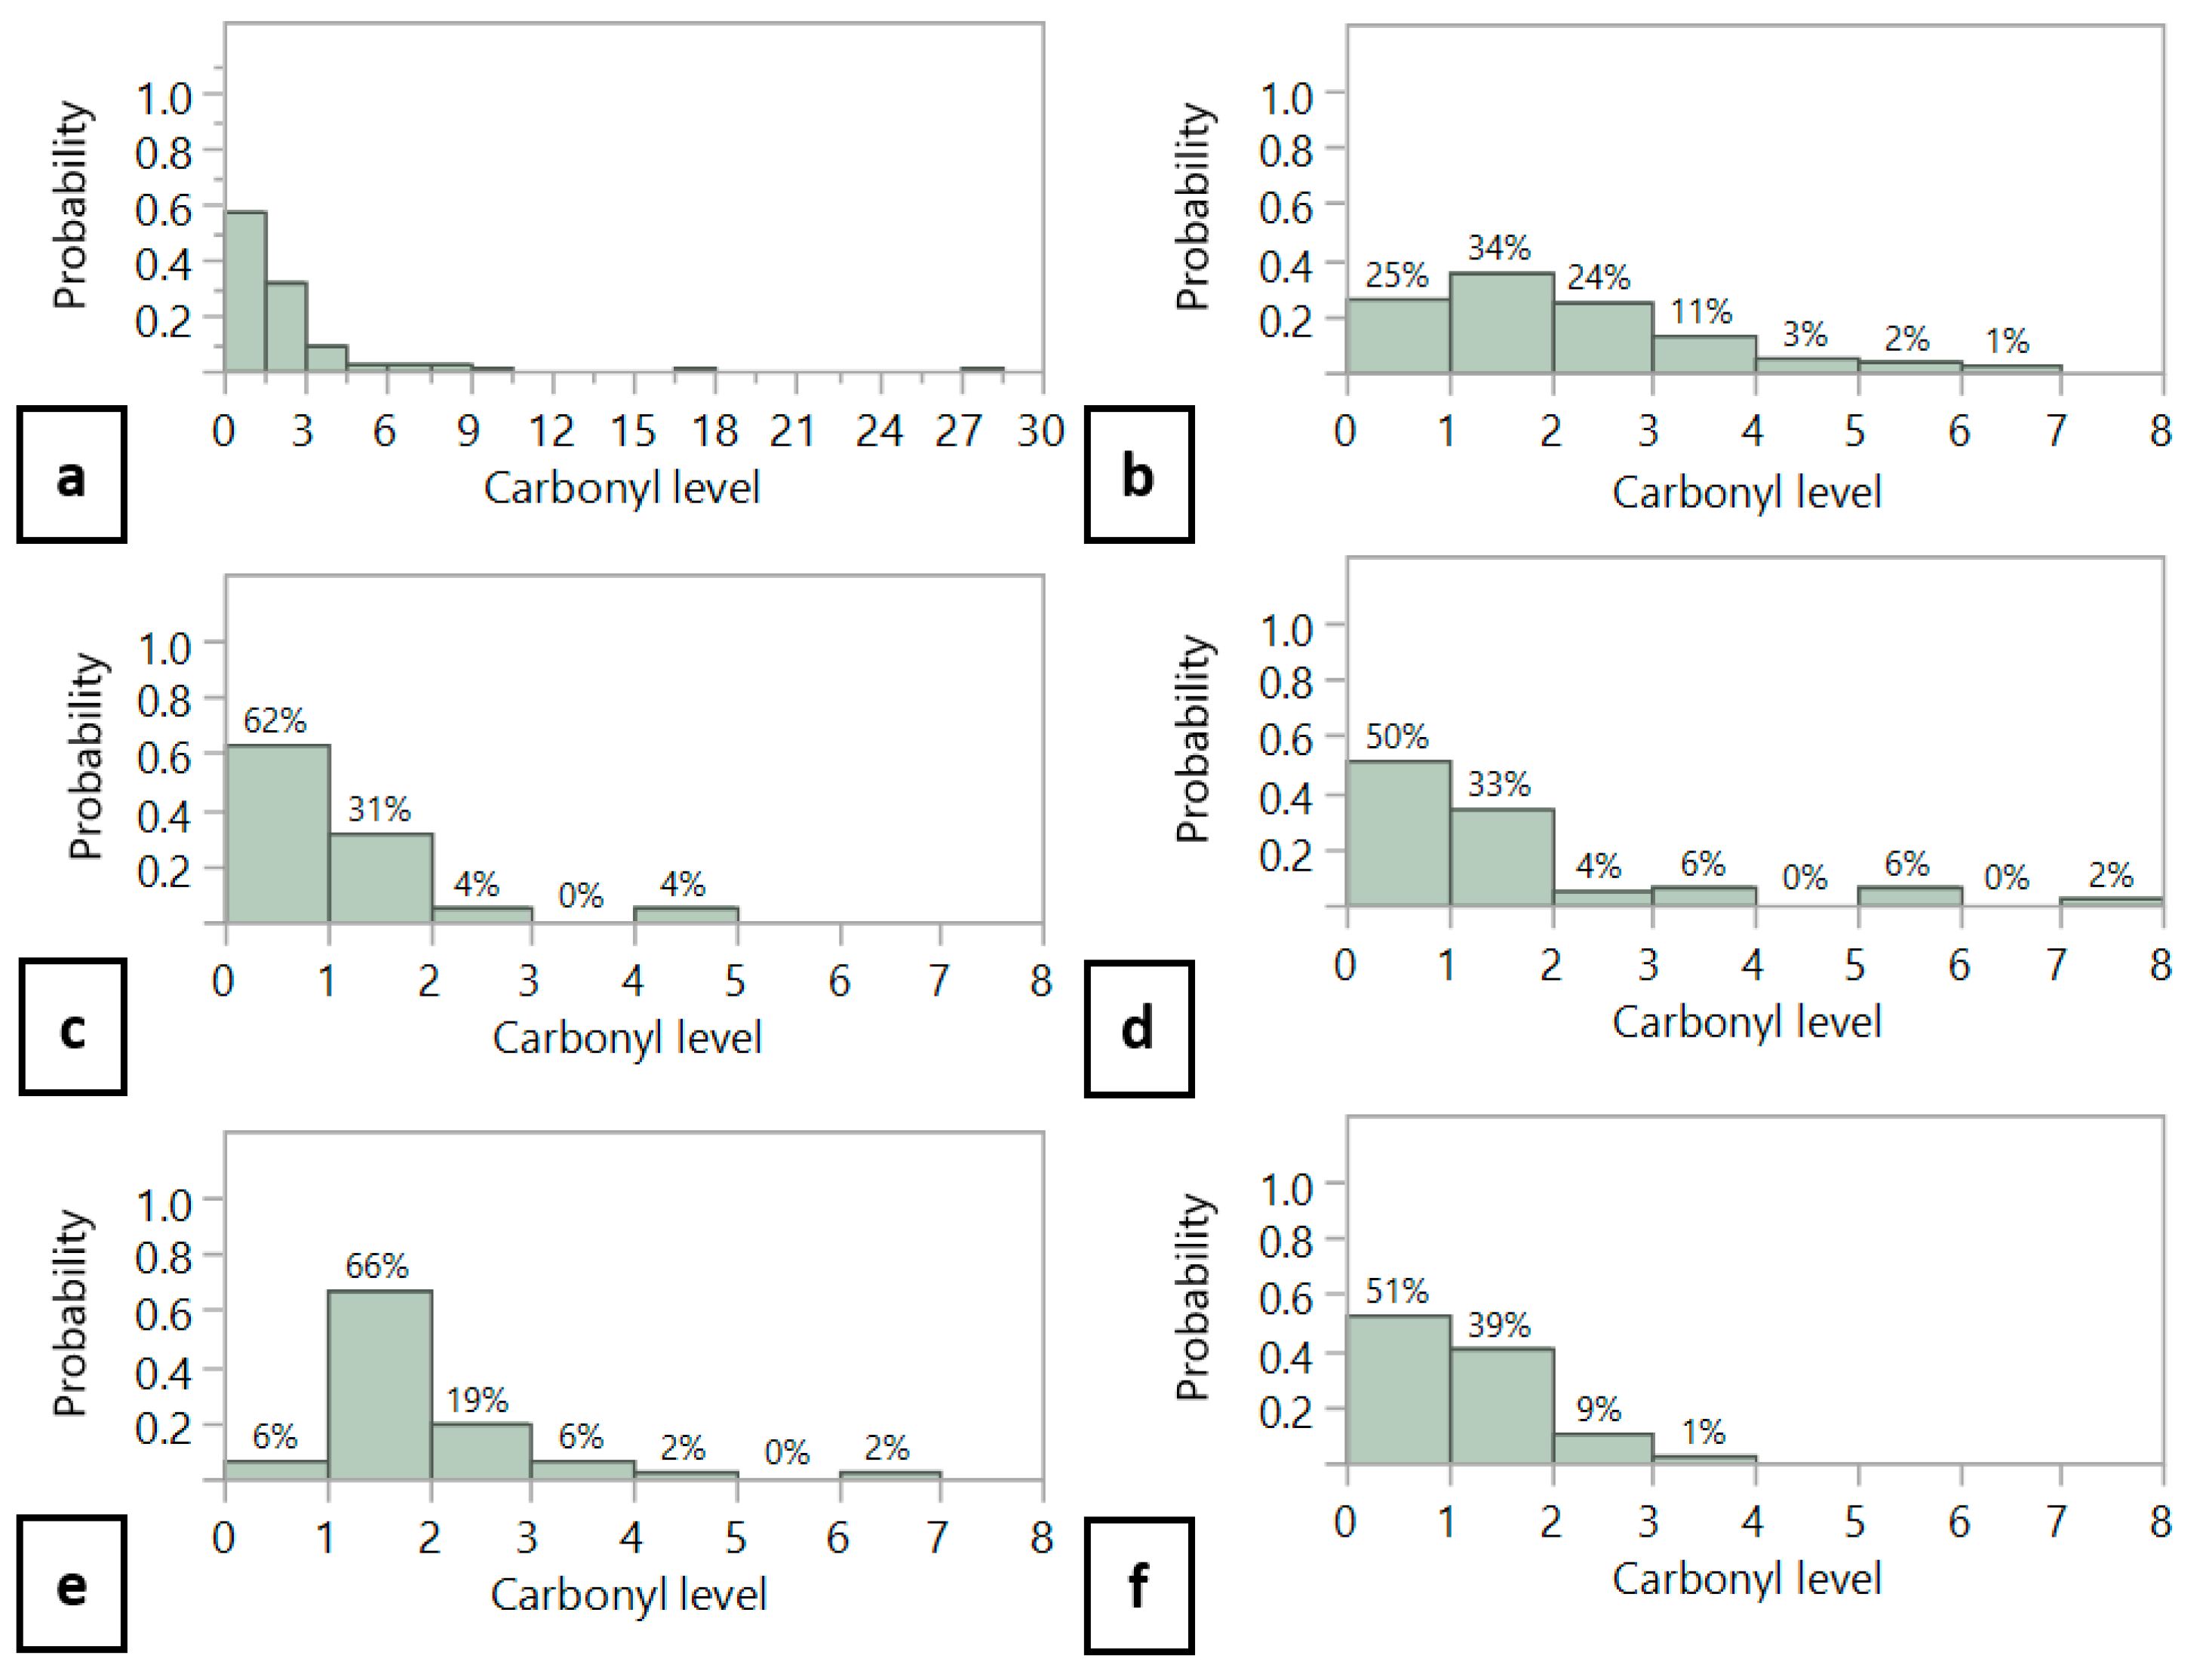
3.2. Carbonyl Distribution as Indicator of Mobilization

The carbonyl level can be used as an indicator for ageing of the bituminous zones and therefore also as an indication of blending. The quantified carbonyl is not always a band that belongs in a bituminous zone. For that reason, by focusing on the carbonyl levels deduced only from bituminous areas, it is possible to better understand the extent of the ageing or the rejuvenation effect on those areas. Based on the integration of typical bands, a bituminous coating can be defined as the area where the following conditions are simultaneously met:
  • Epoxides lower than 0; values higher than 0 indicate a resin area.
  • Alkyl group higher than 0; indication of bituminous area.
  • Carbonyl higher than 0.
Based on those requirements, the distribution of the carbonyl for all the areas is plotted in Figure 13a and the percentiles are presented in Table 4. Because of the large difference between the maximum level of carbonyl (27.94) and the level at the 97.5 percentile (7.16), values above the 97.5% limit can be considered as extreme measurements. Based on that observation, the carbonyl level, which can be considered as valid within a bituminous zone, for this research is between 0 and 7.16.
In Figure 13b–f, the carbonyl distributions of the individual studied zones are shown. Considering the GRA sample as the reference sample (Figure 13b), a shift can be observed towards lower carbonyl levels for the other 4 areas, which is an indication of blending. When comparing Areas 2 and 3 of the same GRAB sample (see Figure 13c,d), the probability of a carbonyl level between 0 and 1 is higher for Area 2 (66% vs. 50%), but on the other hand, some dispersed higher carbonyl levels (between 3 and 8) are present in Area 3 but not in Area 2. Those results are in line with the chemical imaging and indicate the presence of an outer zone with low carbonyl, which can possibly be interpreted as an area of a lower degree of blending consisting mostly of neat bitumen. On the other hand, Area 3 shows similar probability, for carbonyl levels higher than 1, compared to Area 1 of the GRA sample but higher probability for the lowest carbonyl levels between 0 and 1 (Figure 13b,d, respectively). Here, we can assume that an area of partial blending is present, as well as an inactive RA bituminous zone. Therefore, the assumption of full blending is not valid for these samples.
The MRAB sample exhibits a high probability of carbonyl levels between 1 and 2. This is an indication of a higher degree of blending, since lower and higher carbonyl levels are limited. The GRAR sample shows similar probabilities as Area 3 of the GRAB sample.

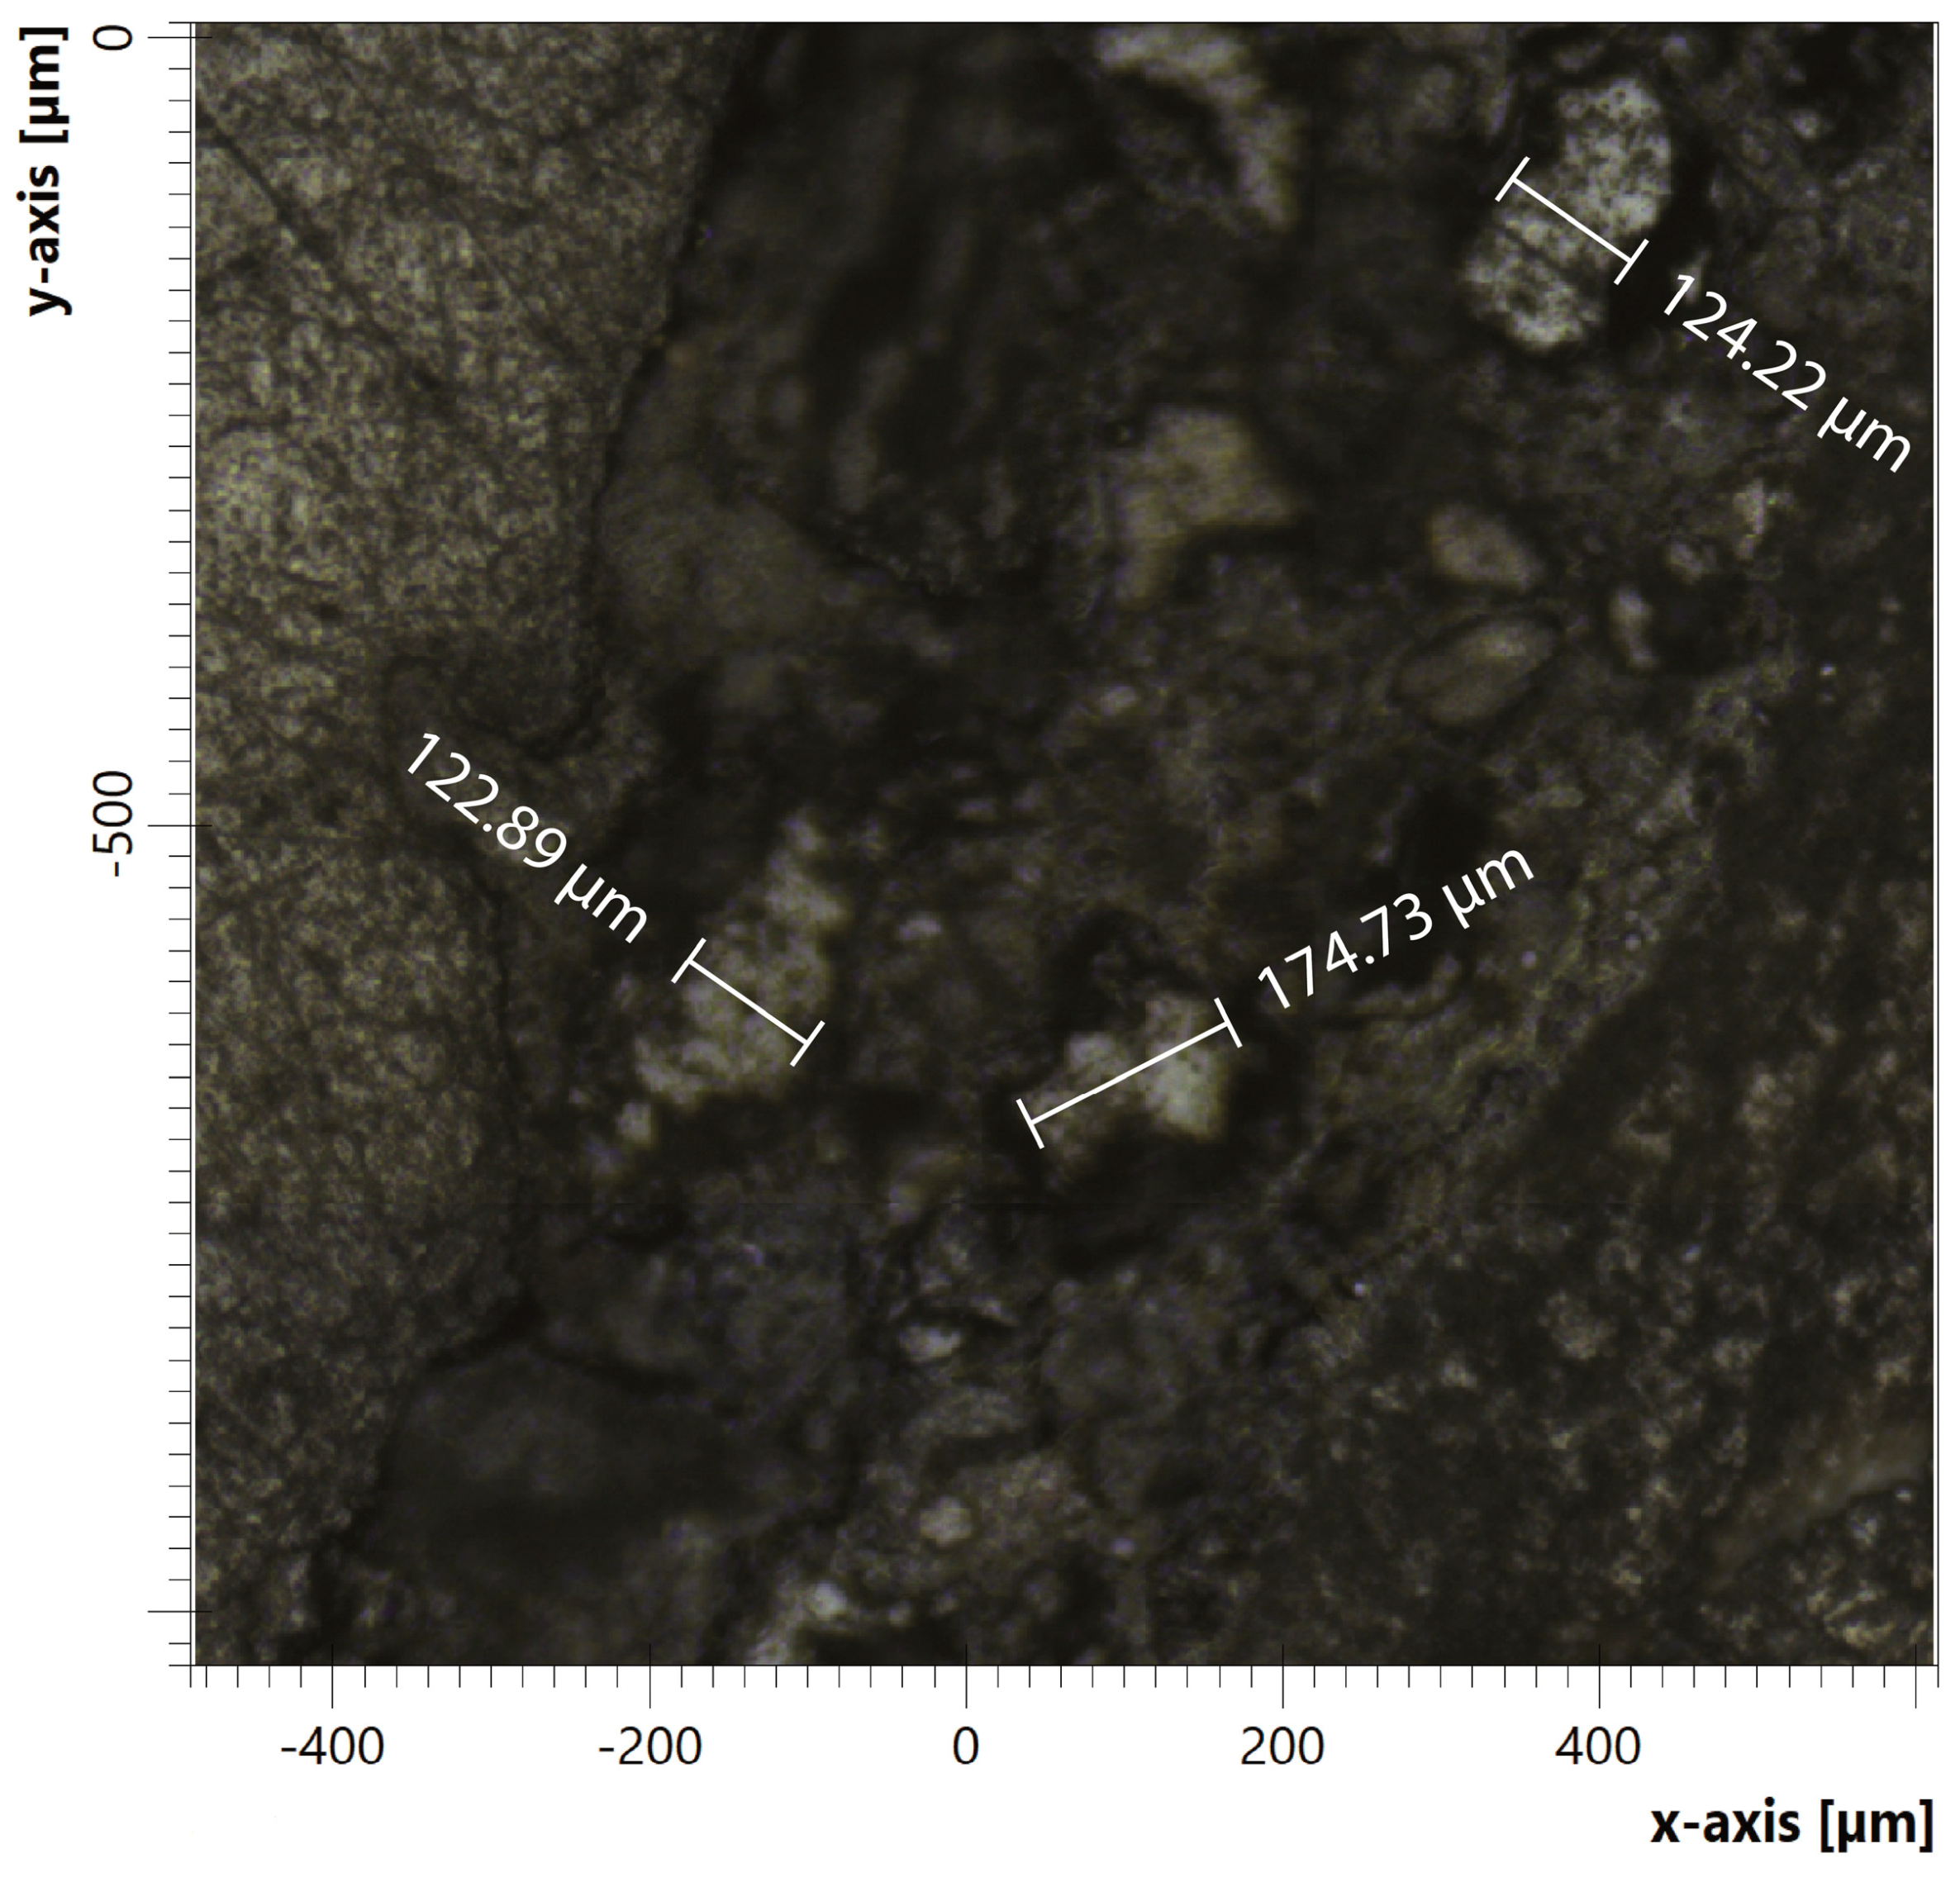
3.3. Bituminous Mortar Coating of the RA Granulates

Previous studies have discussed the mobilization of pure bitumen or mastic (bitumen and filler). Figure 14 shows part of the coating of sample MRAB. This particular sample was obtained from an actual mixture, and, as demonstrated before, for this sample, a higher degree of blending has been achieved. Therefore, it can be considered as the most appropriate representation of the result of an actual mixing procedure and thus a realistic bituminous coating of RA granulates. As can be seen in Figure 14, the surrounding coating also consists of visible fine particles larger than 63 μm (filler threshold) and smaller than 500 μm. This bituminous zone should be considered as the bituminous mortar area. Moreover, this statement is in line with the definition given for asphalt mortar in [16]. For that reason, the mobilization of mortar should be considered as a more realistic phenomenon when adding RA in bituminous mixtures rather than the mobilization of bitumen or mastic.

4. Conclusions

In this study, the application of FTIR microscopy in ATR mode on RA granulates was evaluated. A specific methodology for the preparation and the analysis of coated granulates was proposed. The samples engineered for this research were suitable for microscopic analysis, and by utilizing characteristic infrared bands, it was possible to trace zones of different composition and intensity.
The conclusions of this research are as follows:
  • It is possible to trace carbonyls as an ageing indicator on actual RA granulates.
  • The blending between RA mortar and neat bitumen can be characterized as only partial.
  • Shorter mixing times and lower temperatures (2 min and 150 °C) can lead to large inactive RA mortar areas and a lower degree of blending.
  • Higher temperature and longer mixing (5 min and 180 °C) may provide a higher degree of blending.
  • Rejuvenation of bituminous coating can be traced based on the proposed method.
  • The ageing index (carbonyls) for the rejuvenated area is lower than the sample areas covered with neat bitumen.
It should be noted that the described method requires an adequate amount of time for the collection of the spectra. Since this study is at a demonstrative stage, the number of samples was rather limited. Based on these results, the application of this technique is promising for future research to quantitatively evaluate the impact of different fabrication methods (mixing time and temperature) in the degree of blending, as well as its application on different and actual asphalt mixture samples.

Author Contributions

Conceptualization, A.M. and W.V.d.b.; Data Curation, A.M. and G.T.; Investigation, A.M., G.T. and G.J.; Methodology, A.M. and G.T.; Resources, W.V.d.b.; Supervision, W.V.d.b. and J.B.; Visualization, A.M. and G.J.; Writing—Original Draft, A.M.; Writing—Review and Editing, W.V.d.b., C.V. and S.T.

Funding

This research received no external funding.

Acknowledgments

The authors would like to acknowledge Patricia Dath and Pieter Ballieu from Holcim, Belgium, for their technical support and for preparation of the samples used in this study.

Conflicts of Interest

The authors declare no conflict of interest.

References

  1. NBN EN 13108-8:2016 Bituminous Mixtures—Material Specifications—Part 8: Reclaimed Asphalt; Bureau voor Normalisatie: Brussels, Belgium, 2016.
  2. Anthonissen, J. Bituminous Pavements in Flanders: Quantifying the Effect of RAP on the Environmental Impact. Ph.D. Thesis, University of Antwerp, Antwerpen, Belgium, May 2017. [Google Scholar]
  3. Margaritis, A.; Van den bergh, W. Evaluation of Flemish bituminous mixtures’ performance containing RAP: Statistical analysis and modelling. In Proceedings of the 13th ISAP Conference, Fortaleza, Ceará, Brazil, 19–21 June 2018. [Google Scholar]
  4. Van den bergh, W.; Kara, P.; Anthonissen, J.; Margaritis, A.; Jacobs, G.; Couscheir, K. Recommendations and strategies for using reclaimed asphalt pavement in the Flemish Region based on a first life cycle assessment research. IOP Conf. Ser. Mater. Sci. Eng. 2017, 236, 012088. [Google Scholar] [CrossRef] [Green Version]
  5. McDaniel, R.S.; Anderson, R.M. Recommended Use of Reclaimed Asphalt Pavement in the Superpave Mix Design Method: Technician’s Manual; National Research Council (US), Transportation Research Board: Washington, DC, USA, 2001. [Google Scholar]
  6. Mogawer, W.; Bennert, T.; Daniel, J.S.; Bonaquist, R.; Austerman, A.; Booshehrian, A. Performance characteristics of plant produced high RAP mixtures. Road Mater. Pavement Des. 2012, 13, 183–208. [Google Scholar] [CrossRef]
  7. Cavalli, M.C.; Partl, M.N.; Poulikakos, L.D. Measuring the binder film residues on black rock in mixtures with high amounts of reclaimed asphalt. J. Clean. Prod. 2017, 149, 665–672. [Google Scholar] [CrossRef]
  8. Margaritis, A.; Jacobs, G.; Hasheminejad, N.; Blom, J.; Van den bergh, W. Influence of mixing procedures on the performance of asphalt mixtures with high reclaimed asphalt content. In Proceedings of the 7th International Conference on Bituminous Mixtures and Pavements, Thessaloniki, Greece, 12–14 June 2019. [Google Scholar]
  9. Kriz, P.; Grant, D.L.; Veloza, B.A.; Gale, M.J.; Blahey, A.G.; Brownie, J.H.; Shirts, R.D.; Maccarrone, S. Blending and diffusion of reclaimed asphalt pavement and virgin asphalt binders. Road Mater. Pavement Des. 2014, 15, 78–112. [Google Scholar] [CrossRef]
  10. Rad, F.Y.; Sefidmazgi, N.R.; Bahia, H. Application of diffusion mechanism: Degree of blending between fresh and recycled asphalt pavement binder in dynamic shear rheometer. Transp. Res. Rec. 2014, 2444, 71–77. [Google Scholar] [CrossRef]
  11. Bennert, T.; Dongré, R. Backcalculation method to determine effective asphalt binder properties of recycled asphalt pavement mixtures. Transp. Res. Rec. 2010, 2179, 75–84. [Google Scholar] [CrossRef]
  12. Bowers, B.F.; Huang, B.; Shu, X.; Miller, B.C. Investigation of reclaimed asphalt pavement blending efficiency through GPC and FTIR. Constr. Build. Mater. 2014, 50, 517–523. [Google Scholar] [CrossRef]
  13. Xu, J.; Hao, P.; Zhang, D.; Yuan, G. Investigation of reclaimed asphalt pavement blending efficiency based on micro-mechanical properties of layered asphalt binders. Constr. Build. Mater. 2018, 163, 390–401. [Google Scholar] [CrossRef]
  14. Huang, B.; Li, G.; Vukosavljevic, D.; Shu, X.; Egan, B.K. Laboratory investigation of mixing hot-mix asphalt with reclaimed asphalt pavement. Transp. Res. Rec. 2005, 1929, 37–45. [Google Scholar] [CrossRef]
  15. AbuHassan, Y.; Alin, M.; Iqbal, T.; Nazzal, M.; Abbas, A.R. Effect of extraction solvents on rheological properties of recovered asphalt binders. J. Transp. Eng. Part B Pavements 2019, 145, 04018064. [Google Scholar] [CrossRef]
  16. Van den bergh, W. The Effect of Ageing on the Fatigue and Healing Properties of Bituminous Mortars. Ph.D. Thesis, Delft University of Technology, Delft, The Netherlands, December 2011. [Google Scholar]
  17. Marsac, P.; Piérard, N.; Porot, L.; Van den bergh, W.; Grenfell, J.; Mouillet, V.; Pouget, S.; Besamusca, J.; Farcas, F.; Gabet, T.; et al. Potential and limits of FTIR methods for reclaimed asphalt characterisation. Mater. Struct. 2014, 47, 1273–1286. [Google Scholar] [CrossRef]
  18. Hofko, B.; Alavi, M.Z.; Grothe, H.; Jones, D.; Harvey, J. Repeatability and sensitivity of FTIR ATR spectral analysis methods for bituminous binders. Mater. Struct. 2017, 50, 187. [Google Scholar] [CrossRef] [Green Version]
  19. Karlsson, R.; Isacsson, U. Application of FTIR-ATR to characterization of bitumen rejuvenator diffusion. J. Mater. Civ. Eng. 2003, 15, 157–165. [Google Scholar] [CrossRef]
  20. Mikhailenko, P.; Bertron, A.; Ringot, E. Methods for analyzing the chemical mechanisms of bitumen aging and rejuvenation with FTIR spectrometry. In Proceedings of the 8th RILEM International Symposium on Testing and Characterization of Sustainable and Innovative Bituminous Materials, Ancona, Italy, 7–9 October 2015; pp. 203–214. [Google Scholar]
  21. Lamontagne, J.; Durrieu, F.; Planche, J.P.; Mouillet, V.; Kister, J. Direct and continuous methodological approach to study the ageing of fossil organic material by infrared microspectrometry imaging: Application to polymer modified bitumen. Anal. Chim. Acta 2001, 444, 241–250. [Google Scholar] [CrossRef]
  22. Nivitha, M.R.; Prasad, E.; Krishnan, J.M. Ageing in modified bitumen using FTIR spectroscopy. Int. J. Pavement Eng. 2016, 17, 565–577. [Google Scholar] [CrossRef]
  23. Lopes, M.; Mouillet, V.; Bernucci, L.; Gabet, T. The potential of attenuated total reflection imaging in the mid-infrared for the study of recycled asphalt mixtures. Constr. Build. Mater. 2016, 124, 1120–1131. [Google Scholar] [CrossRef]
  24. Vassaux, S.; Gaudefroy, V.; Boulangé, L.; Soro, L.J.; Pévère, A.; Michelet, A.; Barragan-Montero, V.; Mouillet, V. Study of remobilization phenomena at reclaimed asphalt binder/virgin binder interphases for recycled asphalt mixtures using novel microscopic methodologies. Constr. Build. Mater. 2018, 165, 846–858. [Google Scholar] [CrossRef]
  25. Rinaldini, E.; Schuetz, P.; Partl, M.N.; Tebaldi, G.; Poulikakos, L.D. Investigating the blending of reclaimed asphalt with virgin materials using rheology, electron microscopy and computer tomography. Compos. Part B Eng. 2014, 67, 579–587. [Google Scholar] [CrossRef]
  26. Jiang, Y.; Gu, X.; Zhou, Z.; Ni, F.; Dong, Q. Laboratory observation and evaluation of asphalt blends of reclaimed asphalt pavement binder with virgin binder using SEM/EDS. Transp. Res. Rec. 2018, 2672, 69–78. [Google Scholar] [CrossRef]
  27. Nahar, S.N.; Mohajeri, M.; Schmets, A.J.M.; Scarpas, A.; van de Ven, M.F.C.; Schitter, G. First observation of blending-zone morphology at interface of reclaimed asphalt binder and virgin bitumen. Transp. Res. Rec. 2013, 2370, 1–9. [Google Scholar] [CrossRef]
  28. Mohajeri, M.; Molenaar, A.A.A.; Van de Ven, M.F.C. Experimental study into the fundamental understanding of blending between reclaimed asphalt binder and virgin bitumen using nanoindentation and nano-computed tomography. Road Mater. Pavement Des. 2014, 15, 372–384. [Google Scholar] [CrossRef]
  29. Lu, X.; Talon, Y.; Redelius, P. Aging of bituminous binders–laboratory tests and field data. In Proceedings of the 4th Eurasphalt Eurobitume Congress, Copenhagen, Denmark, 21–23 May 2008; pp. 1–12. [Google Scholar]
  30. Erkens, S.; Porot, L.; Gläser, R.; Glover, C.J. Aging of bitumen and asphalt concrete: Comparing state of the practice and ongoing developments in the United States and Europe. In Proceedings of the Transportation Research Board 95th Annual Meeting, Washington, DC, USA, 10–14 January 2016. [Google Scholar]
  31. NBN EN 12697-11:2012 Bituminous Mixtures-Test Methods-Part 11: Determination of the Affinity between Aggregate and Bitumen; Bureau voor Normalisatie: Brussels, Belgium, 2012.
  32. NBN EN 12697-35:2016 Bituminous Mixtures-Test Methods-Part 35: Laboratory Mixing; Bureau voor Normalisatie: Brussels, Belgium, 2016.
  33. Cong, P.; Hao, H.; Zhang, Y.; Luo, W.; Yao, D. Investigation of diffusion of rejuvenator in aged asphalt. Int. J. Pavement Res. Technol. 2016, 9, 280–288. [Google Scholar] [CrossRef] [Green Version]
  34. Baghaee Moghaddam, T.; Baaj, H. The use of rejuvenating agents in production of recycled hot mix asphalt: A systematic review. Constr. Build. Mater. 2016, 114, 805–816. [Google Scholar] [CrossRef]
  35. Bruker Optik GmbH. OPUS/IR Reference Manual, version 7; Bruker Optik GmbH: Billerica, MA, USA, 2014; pp. 347–350. [Google Scholar]
  36. Bressi, S.; Cavalli, M.C.; Partl, M.N.; Tebaldi, G.; Dumont, A.G.; Poulikakos, L.D. Particle clustering phenomena in hot asphalt mixtures with high content of reclaimed asphalt pavements. Constr. Build. Mater. 2015, 100, 207–217. [Google Scholar] [CrossRef]
Figure 1. Asphalt mixture bonded by asphalt mortar.
Coatings 09 00240 g001
Figure 2. Original, untreated Reclaimed Asphalt (RA) granulates (a); RA granulates mixed with neat bitumen (b); RA granulates sprayed with rejuvenator (c).
Coatings 09 00240 g002
Figure 3. Plastic mold for preparation of the stone-resin samples (a) and the polishing machine (b).
Coatings 09 00240 g003
Figure 4. Stone-resin sample mounted in the holder during spectra collection.
Coatings 09 00240 g004
Figure 5. Procedure for determination of the chemical imaging.
Coatings 09 00240 g005
Figure 6. Samples and selected areas for analysis: Area 1 in GRA sample, Areas 2 and 3 in GRAB sample, Area 4 in MRAB sample, and Area 5 in GRAR sample.
Coatings 09 00240 g006
Figure 7. Carbonyl of RA bitumen (red) and neat bitumen (light grey) (a); carboxylic acids of rejuvenated bitumen (blue) and non-rejuvenated bitumen (red) (b); epoxides of resin (dark grey) and of bitumen (blue) (c); carbonate of bitumen with limestone filler (magenta) and bitumen without filler (light grey) (d).
Coatings 09 00240 g007
Figure 8. Chemical imaging of the GRA sample (Area 1): carbonyl group (a); carbonate group (b); epoxides (c); spectral visualization of the selected points marked by colored dots in Figure 8c (d).
Coatings 09 00240 g008
Figure 9. Chemical imaging of the GRAB sample (Area 2): carbonyl group (a); carbonate group (b); epoxides (c); spectral visualization of the selected points marked by colored dots in Figure 9b (d).
Coatings 09 00240 g009
Figure 10. Chemical imaging of the GRAB sample (Area 3): carbonyl group (a); carbonate group (b); alkyl group (c); spectral visualization of the selected points marked by colored dots in Figure 10b (d).
Coatings 09 00240 g010
Figure 11. Chemical imaging of the MRAB sample (Area 4): carbonyl group (a); carbonate group (b); carboxylic acids (c); spectral visualization of the selected points marked by colored dots in Figure 11b,c (d).
Coatings 09 00240 g011
Figure 12. Chemical imaging of the GRAR sample (Area 5): carbonyl group (a); carbonate group (b); carboxylic acids (c); spectral visualization of the selected points marked by colored dots in Figure 12b,c (d).
Coatings 09 00240 g012
Figure 13. Probability of carbonyl levels in the bituminous zone: among all samples (a); GRA (b); GRAB Area 2 (c); GRAB Area 3 (d); MRAB (e); GRAR (f).
Coatings 09 00240 g013
Figure 14. Bituminous mortar as coating of a RA granulate.
Coatings 09 00240 g014
Table 1. Samples and treatment description.
Sample NameRA GranulateNeat BitumenRejuvenatorTreatment Description
GRAUntreated RA granulates (fraction 10/12 mm)
GRABRA granulates covered with neat bitumen (fraction 10/12 mm)
MRABRA granulates, covered with neat bitumen, obtained from mixed AC-14 with GRA
GRARRejuvenated RA granulates
Table 2. Composition of the AC14 mixture.
ComponentPercentage
RA aggregates 0/1455.7%
Limestone 4/818.4%
Limestone 2/6.36.4%
Limestone 0/218.5%
Limestone filler1.0%
RA bitumen3.0%
Neat bitumen (168 ⅟10 mm)1.3%
Table 3. Distinctive bands of the individual components.
Bond & Functional GroupPeak Point (cm−1)Baseline Limits (cm−1)Presence in Material
C–H stretch (alkyl bonds)2920, 28482990–2820Bitumen & Resin
C=O stretch area (carboxylic acids)17411760–1720Rejuvenator
C=O stretch area (carbonyl)17001720–1665Aged bitumen
C–O vibration (carbonate)875890–850Limestone
C–O–C (ring vibration of epoxides)829858–785Resin
Table 4. Carbonyl levels at different percentiles of the distribution.
PercentagePercentilesCarbonyl Level
100.0%maximum27.94
97.5%97.5 percentile7.16
75.0%third quartile2.00
50.0%second quartile (median)1.34
25.0%first quartile0.67
2.5%2.5 percentile0.09
0.0%minimum0.01

