Article

Detailed Characterization of the Effect of Application of Commercially Available Surface Treatment Agents on Textile Wetting Behavior

1
Faculty of Science, Technology and Communication, University of Luxembourg, 4365 Luxembourg, Luxembourg
2
HYDAC FluidCareCenter® GmbH, 66280 Sulzbach, Germany
*
Author to whom correspondence should be addressed.
Coatings 2019, 9(4), 219; https://doi.org/10.3390/coatings9040219
Submission received: 22 February 2019 / Revised: 20 March 2019 / Accepted: 23 March 2019 / Published: 28 March 2019

Abstract

:
The change in the wetting behavior of a standard commercially available textile material in response to surface treatment has been thoroughly characterized with conventional laboratory measurement techniques. The characterization was carried out by taking a series of contact angle measurements that allowed for the determination of the corresponding shift in substrate surface energy as a result of the applied treatment. The collected surface energy values were expressed in terms of the spreading parameter S, which was used to describe phase behavior at the substrate/droplet interface. However, these results showed that the use of a coarse parameter S, or even the work of adhesion ( W a ) and the work of cohesion ( W c ) parameters alone did not adequately account for the observed wetting behavior. A proper description of droplet formation on substrate surface was provided only when the interfacial interaction was examined at a more detailed level by involving the individual dispersive ( σ l d , σ s d ) and polar ( σ l p , σ s p ) surface energy components of both the solid and the wetting liquid. The methodology for characterization of interactions between a textile substrate coated with various surface active agents and several functional fluids have been developed. Several practical examples of how this methodology can be applied to describe the substrate surface treatment and the resulting wetting behavior are described herein.

1. Introduction

Technical textiles have a wide range of applications in many areas in which they are called upon to exhibit a wide variety of properties [1]. These may include but are not limited to the mechanical resistance, chemical resilience, water-, air-, vapor permeability and others. The ever growing range of application brings with it new challenges that often includes antibacterial, antinfungal or in certain applications, such unusual characteristics as well controlled electrostatic behavior [2,3]. The textile wetting behavior describes their ability to enable or prevent the extent of wetting or coverage of their surface by the fluid of interest. Many of these behavioral properties can be effectively, albeit somewhat surprisingly, characterized by measuring the textile wetting behavior. Interestingly enough, the wetting behavior itself can be effectively and relatively easily fine tuned over a broad range of values. Once a proper and well defined relationship between the wetting characteristics and desirable property of interest has been established, that property itself can be adjusted to a required value by following the imparted changes in the wetting behavior. For example, hydrophobicity can be enhanced beyond the natural value or alternatively reduced as required.
Because these textiles can often find their way to a wide variety of applications representing a broad range of operating conditions, it is of interest to extend their range of applicability as much as possible [4]. Moreover, should such an extension be prone to being readily realizable though a relatively facile and effective surface treatment method, it would make the chosen textile much more attractive owing to its extended applicability.
Before any surface treatment can be selected, it must be subjected to an exacting evaluation of its properties to ascertain that it can withstand the rigors of the operating environment and the native of the application. These requirements may include but not be limited to toxicity, biodegradability, chemical compatibility with the surrounding environment, as well as, and if required, thermal and temporal stability [5]. It was not our intent in the present investigation to focus on any specific application, but to establish a proven methodology for the evaluation of the changes in the textile wetting behavior resulting from utilization of a selected surface active agent.
Because this was our first foray into surface treatment, we have decided to limit our initial investigations to a standard, commercially available glass fibre industrial material for simplicity. The main purpose was to achieve sufficient experiments with different coatings and coating processes in order to fully characterize the resulting changes in textile functional behavior. Our intent was to develop further understanding of the available analytical methods and the results obtained therefrom to property gauge the effectiveness to the treatment as applicable to the current investigations. Prior to pursuing the broader experimental program, it was necessary to confirm that the results obtained from these preliminary evaluations were sufficiently self explanatory and self consistent to allow their general utilization across the entire matrix of the investigated coatings. The main aim was to develop a methodology suitable for further discriminating characterization of surface treatments employed for applications to tune performance characteristics to allow the use of a select substrate or a relatively small number of substrates to cover as wide a range of applications as possible. Therein, we report several examples to describe how the surface of a simple substrate can be effectively modified to achieve a wide range of wetting behavior thereby broadening the range of applications for which the substrate could be deployed.

2. Materials and Methods

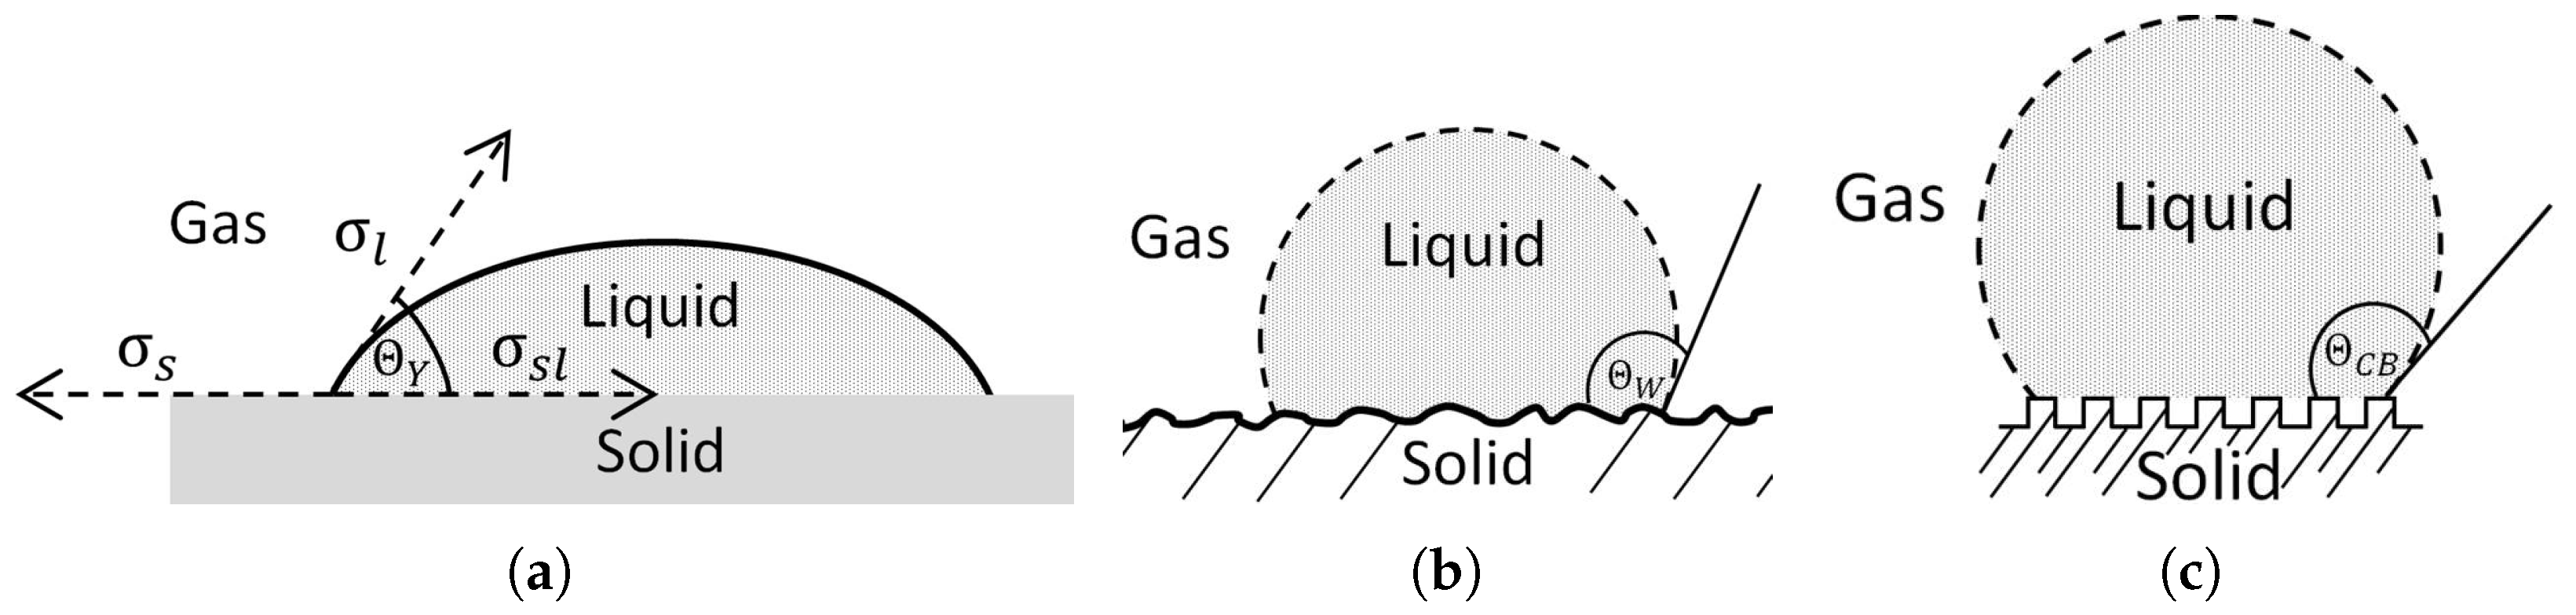
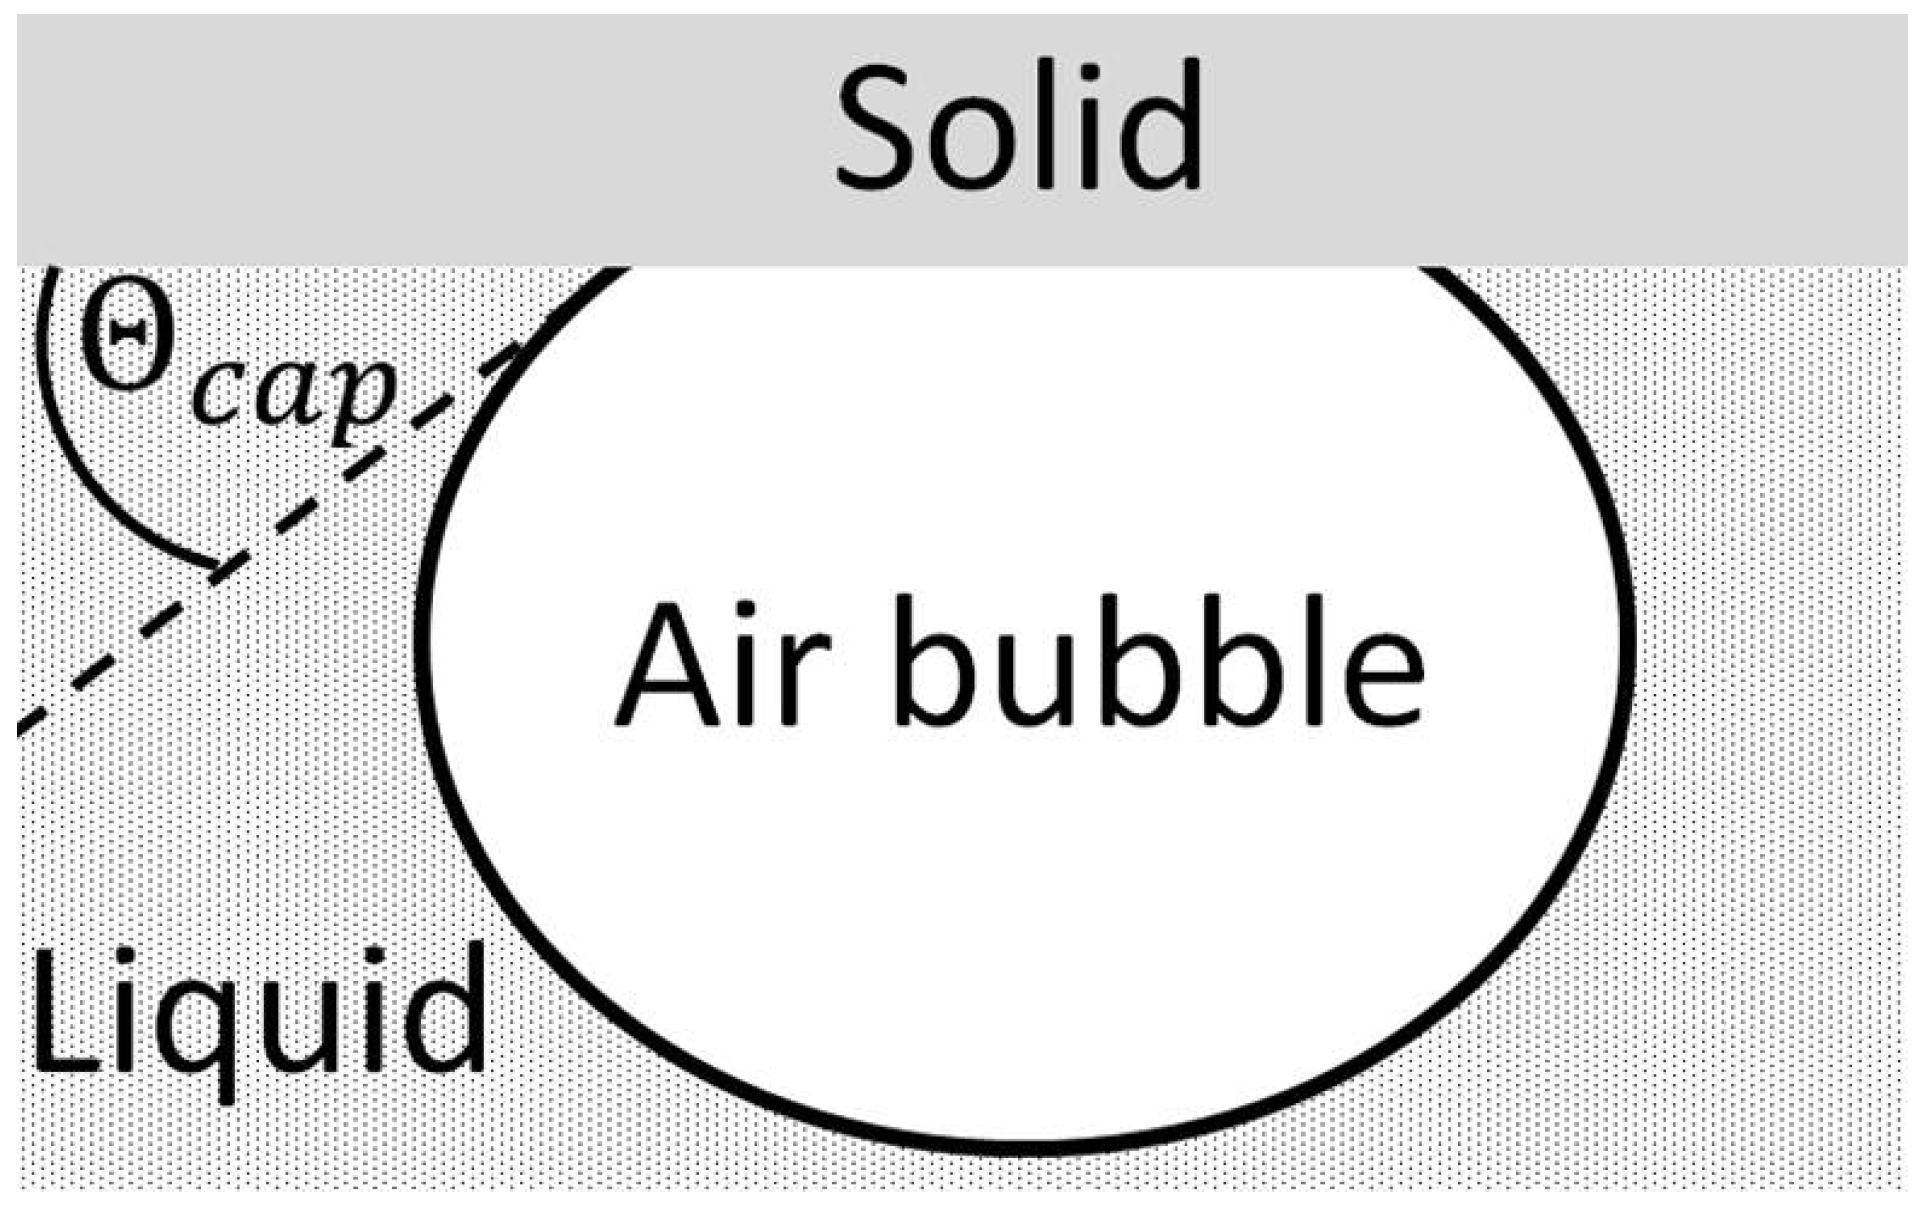
The wetting of a solid surface by a liquid, when both are surrounded by gas, can take generally different forms and depends on the relative energies of the two substances in contact. Lugscheider and Bobzin [6] described the possible wetting states from complete spreading of a liquid over the solid surface through the shape of a flat lens to an almost spherical droplet in the case of complete non wetting behavior [
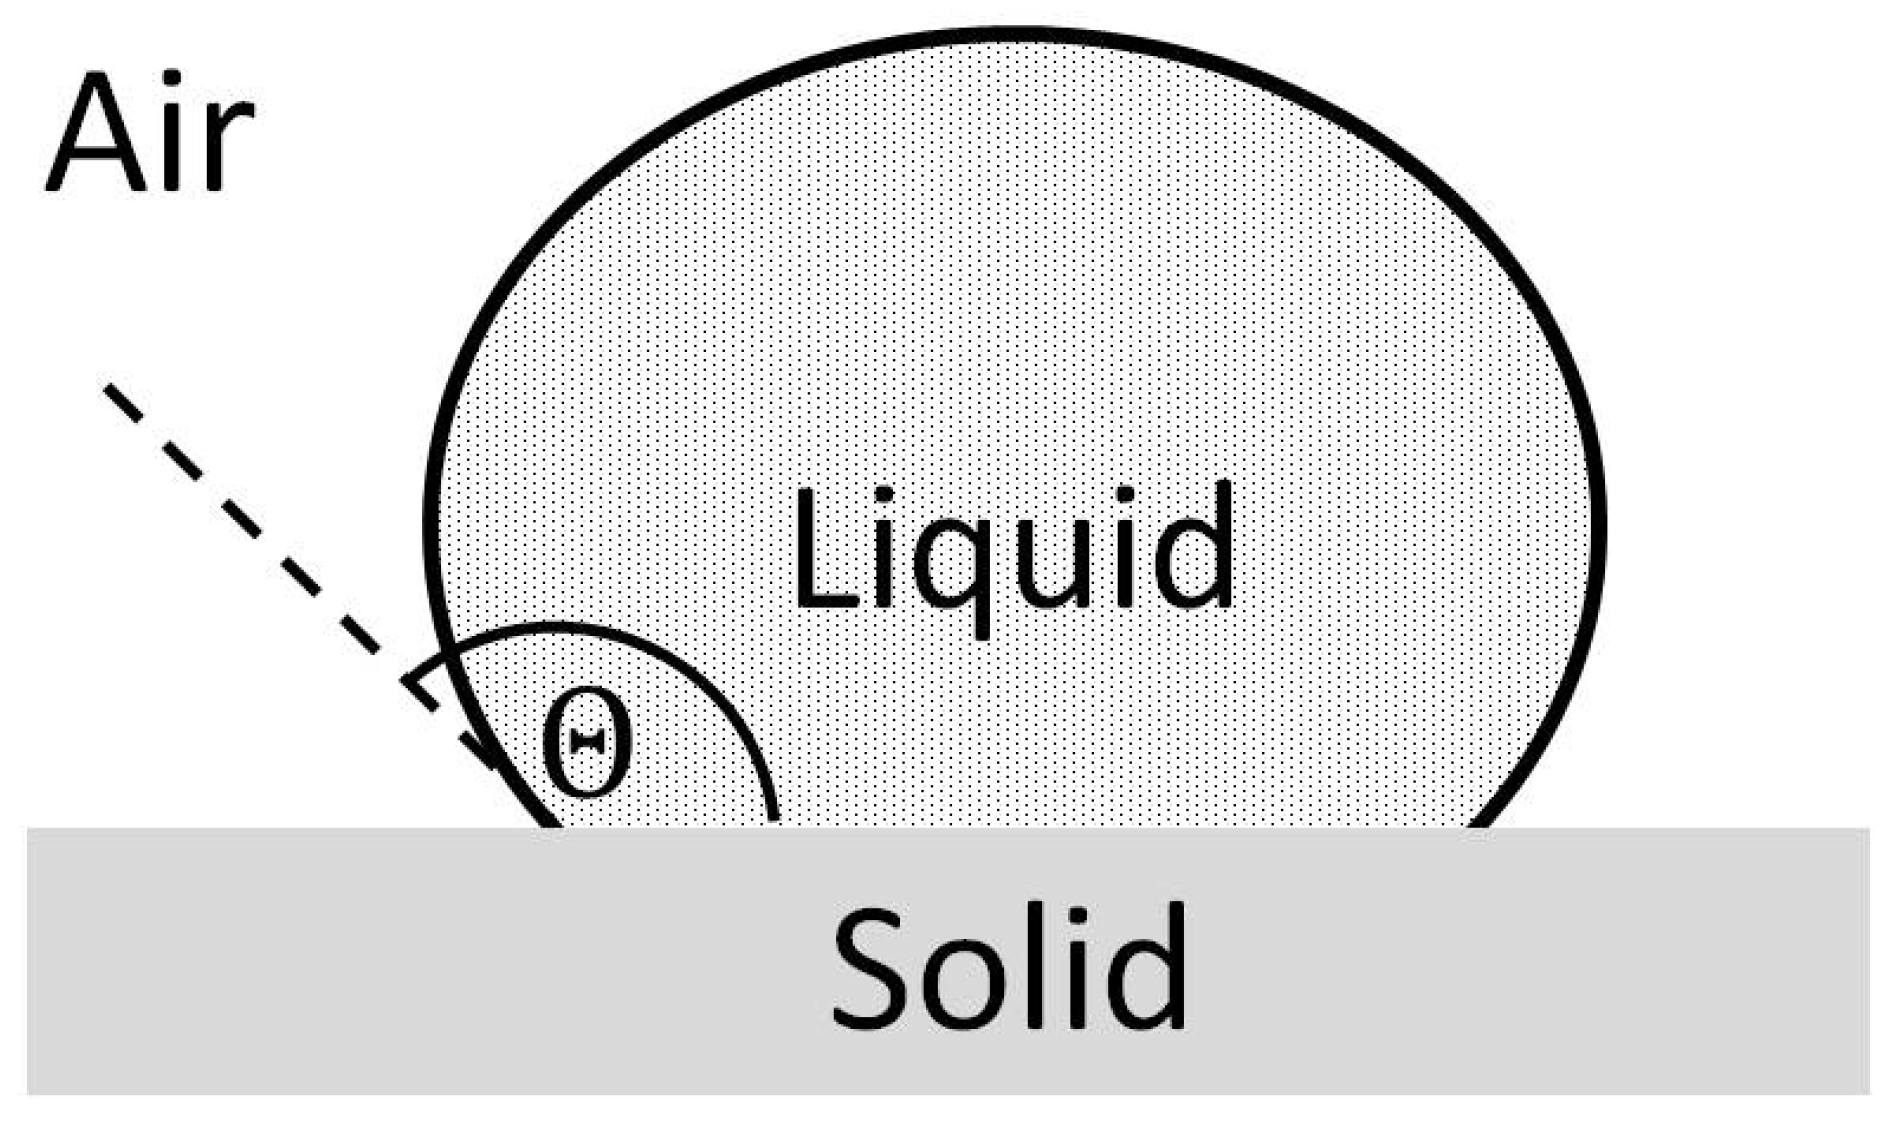
6]. The first mathematical relation of the wetting behavior and the equilibrium of forces at the three-phase contact line (Figure 1a) was made in 1805 by Young [7]
cos θ Y = σ s σ s l σ l .
Here, cos θ Y represents the contact angle; σ s and σ l the surface tensions of the solid and liquid; σ s l the interfacial tension between the two. However, this relationship is only valid for smooth surfaces. This is because the contact angle can be strongly influenced by surface structure and surface chemical properties. In order to consider the influence of surface structure and compare different materials with different surfaces, suitable models were developed by Cassie-Baxter and Wenzel [8,9,10,11,12]. For example, the ‘Wenzel state’ (Figure 1b) describes the case of a liquid wetting the entire surface included with all its rough structures.
In the Wenzel model, the topographic property of the surface is accounted for the ‘r’ factor [14]:
cos θ W = r · cos θ Y .
This describes the ratio between the actual contact surface and the projected contact area between the droplet and the substrate ( r 1 ). For a perfectly smooth surface, the ratio is r = 1 because cos θ W = cos θ Y . In contrast, when the liquid does not completely cover all surface features and air pockets form among them, the effective contact between the two phases is reduced to a minimum. This state is referred to as the Cassie–Baxter Model (Figure 1c) and is often found on hydrophobic surfaces. The contact angle is then defined by [13,14]:
cos θ C B = 1 + ϕ S ( 1 + cos θ Y ) ,
where ϕ S represents the ratio between the actual contact area and the projected contact area, respectively ( ϕ S 1 ). Because the present work was carried out on textile samples of the same substrate, the surface roughness of all the samples was assumed to be the same. This assumption was further justified by the fact that the liquid droplet in the contact angle measurements was dimensioned to cover an appreciable area of the substrate surface and was born out by the experimental results [vide infra].
Fowkes wrote in his theoretical consideration of “Attractive Forces at Interfaces” that the total surface free energy (SFE) of a solid surface is the sum of the contributions from the various intermolecular forces at the surface. According to the Fowkes equation [15], the surface tension of the respective phase can be divided into dispersive and polar components as follows:
σ = σ p + σ d .
Polar interactions at an interface between two liquids or a liquid and a solid result from dipole–dipole interaction, hydrogen bonding, Lewis acid/base interaction, or charge-transfer interaction. Dispersive interactions are due to the van der Waals forces [16]. After Fowkes [15] considered the dispersive and polar components, Owens and Wendt [17] extended the Young equation for contacting solid and liquid phases as follows [18]:
σ s l = σ s + σ l 2 ( σ s d σ l d + σ s p σ l p ) .
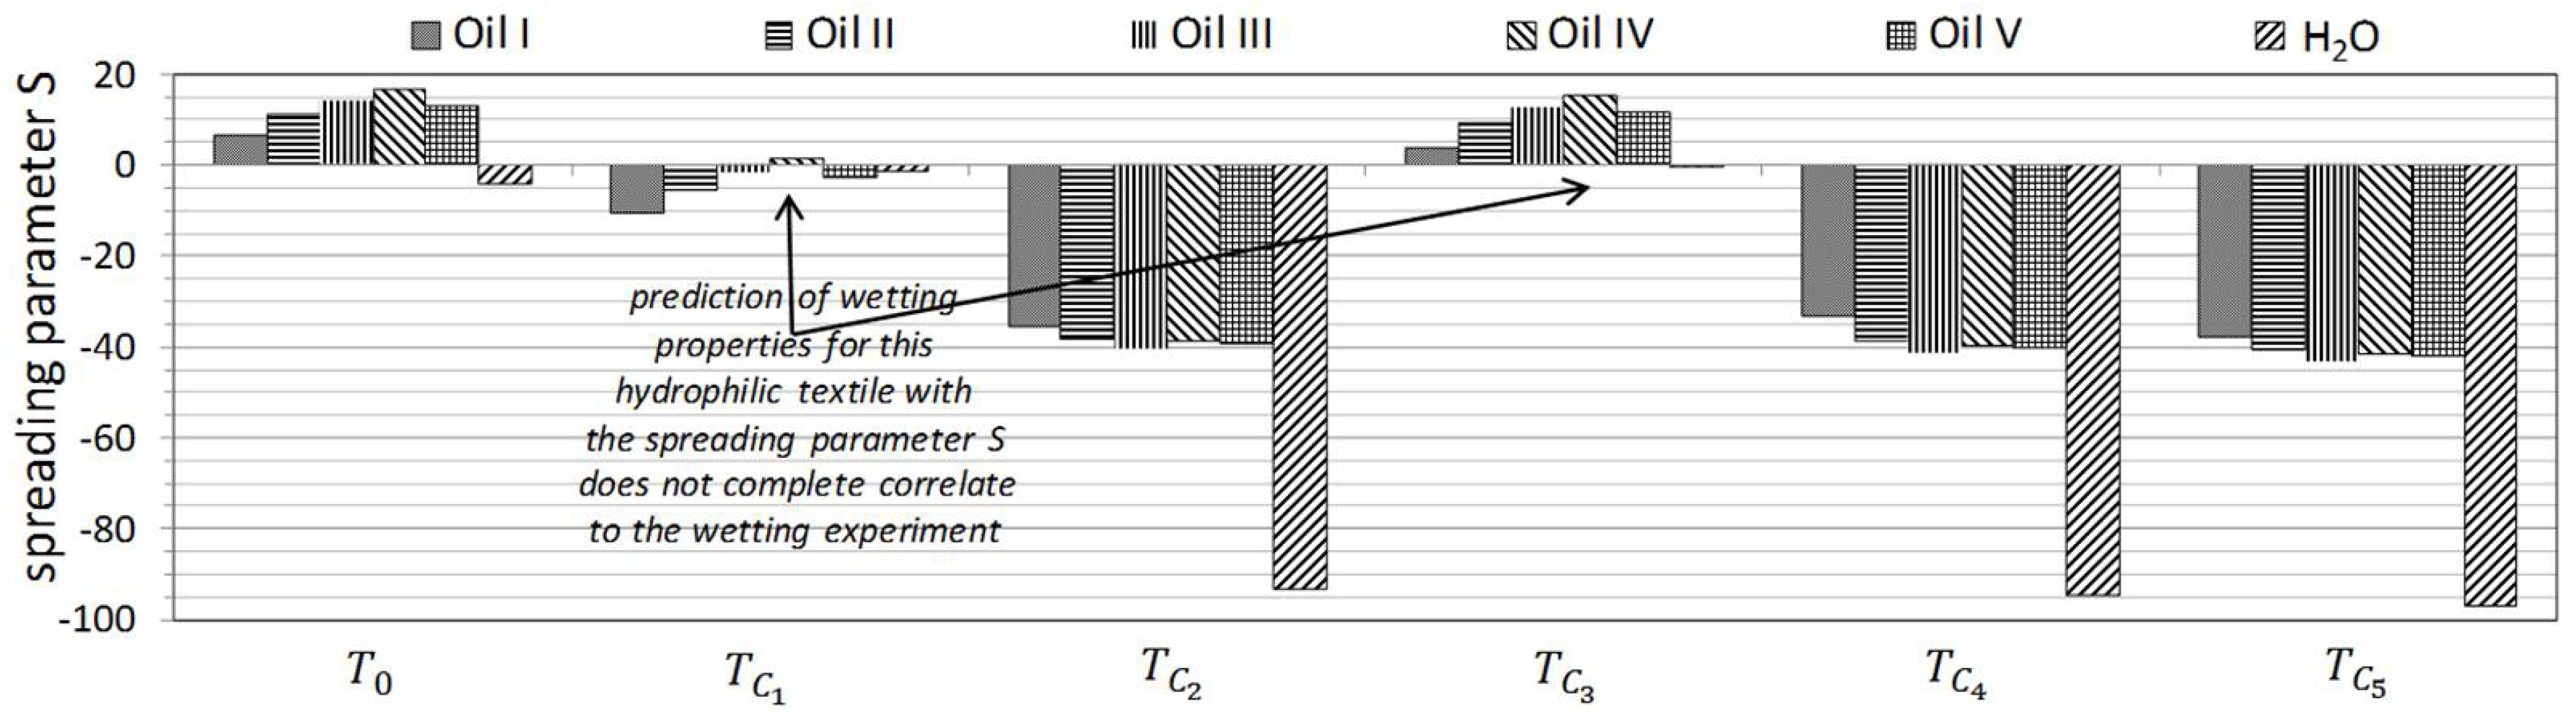
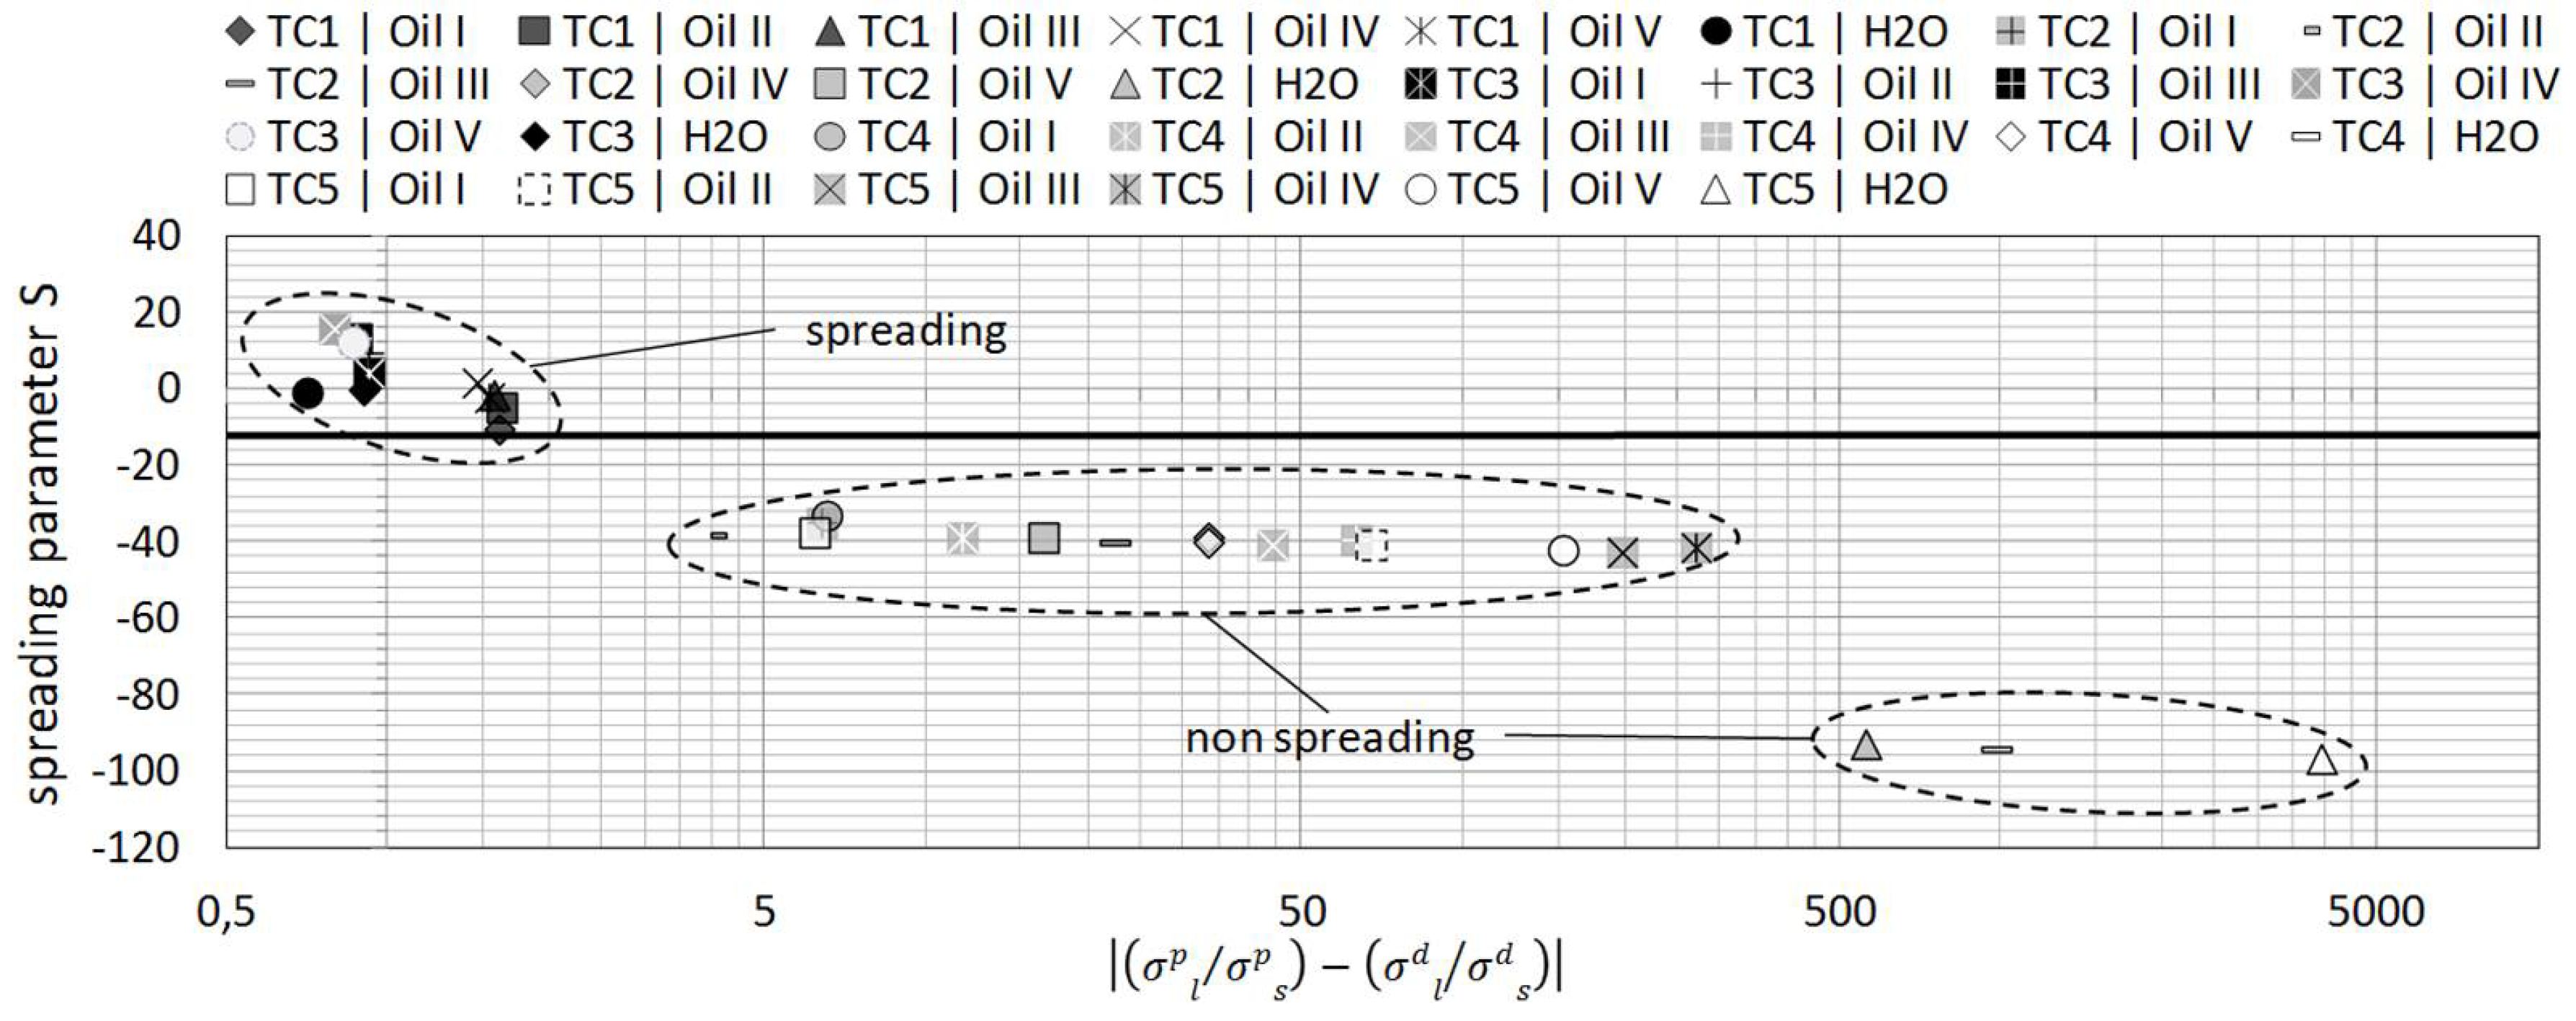
In order to be able to assess the wetting properties of liquids on textiles, the spreading tendency must be evaluated with a suitable parameter. For a mathematical prediction of the wetting behavior, the spreading parameter S can be used [6,19]. 
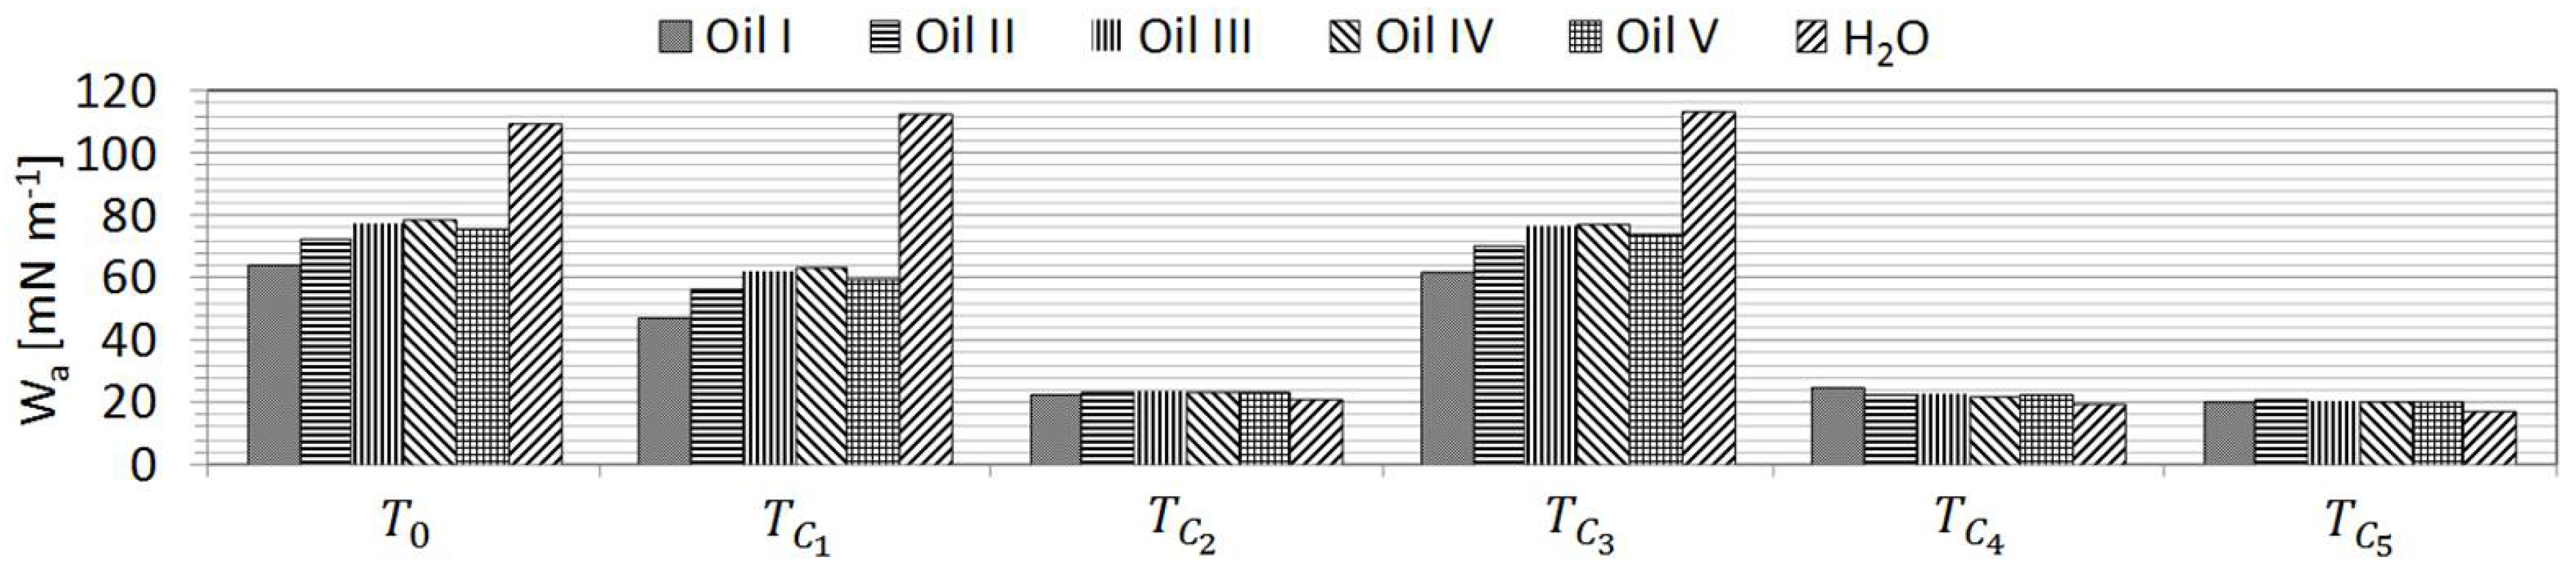
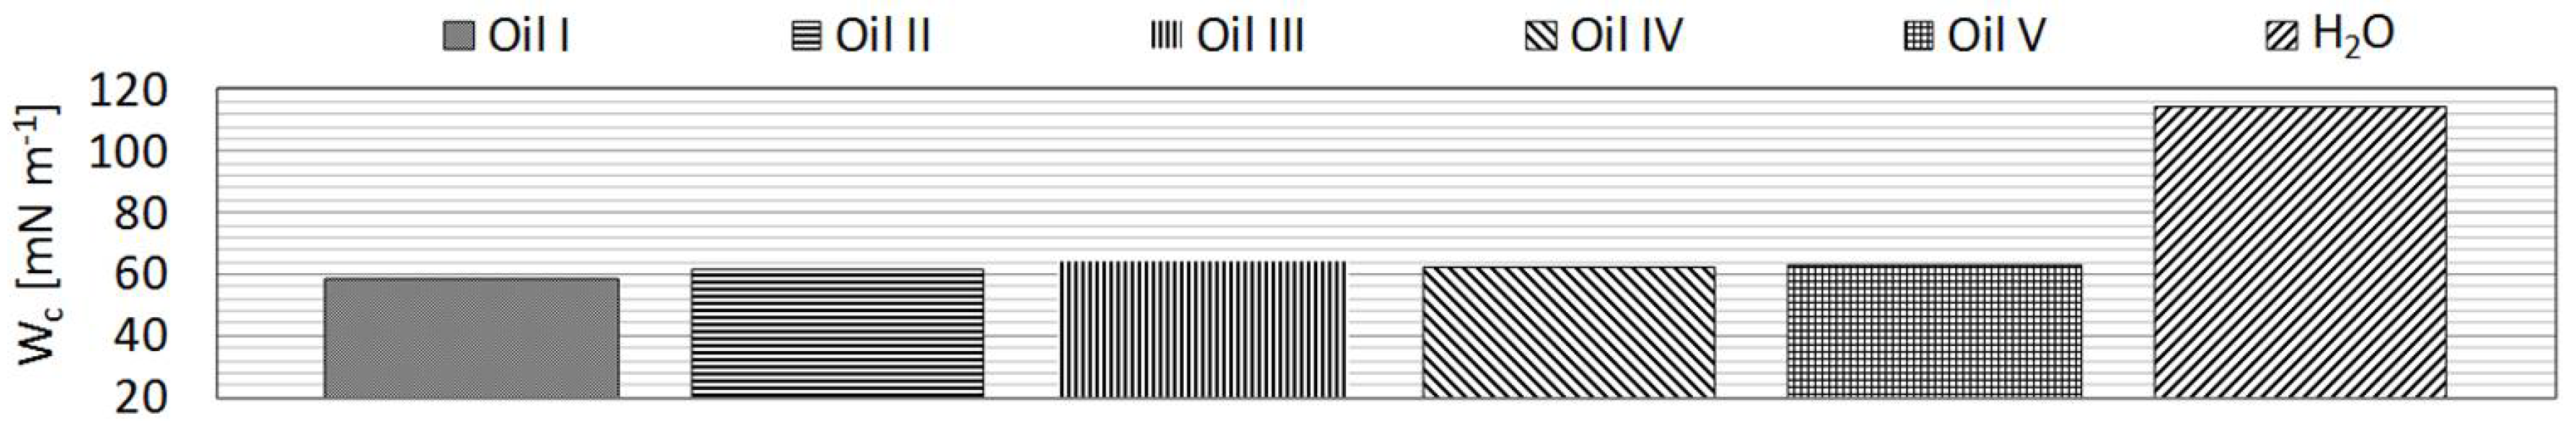
S is the difference between the work of adhesion and the work of cohesion, respectively, where [15]:
W a = σ s + σ l σ s l ,
W c = 2 σ l ,
S = W a W c = σ s + σ l σ s l ( 2 σ l ) .
When S > 0 , the liquid spreads on the surface and when S < 0 the wetting is incomplete [6,15]. The effect of various surface treatments determined by comparing the wetting behavior of a treated sample against the reference material. Samples of the same textile type were used in all experiments. The textile employed in the work consisted of a standard glass fiber non woven material with a well defined microfiber content. The surface treatment was carried out with five commercially available surface agents listed in Table 1.
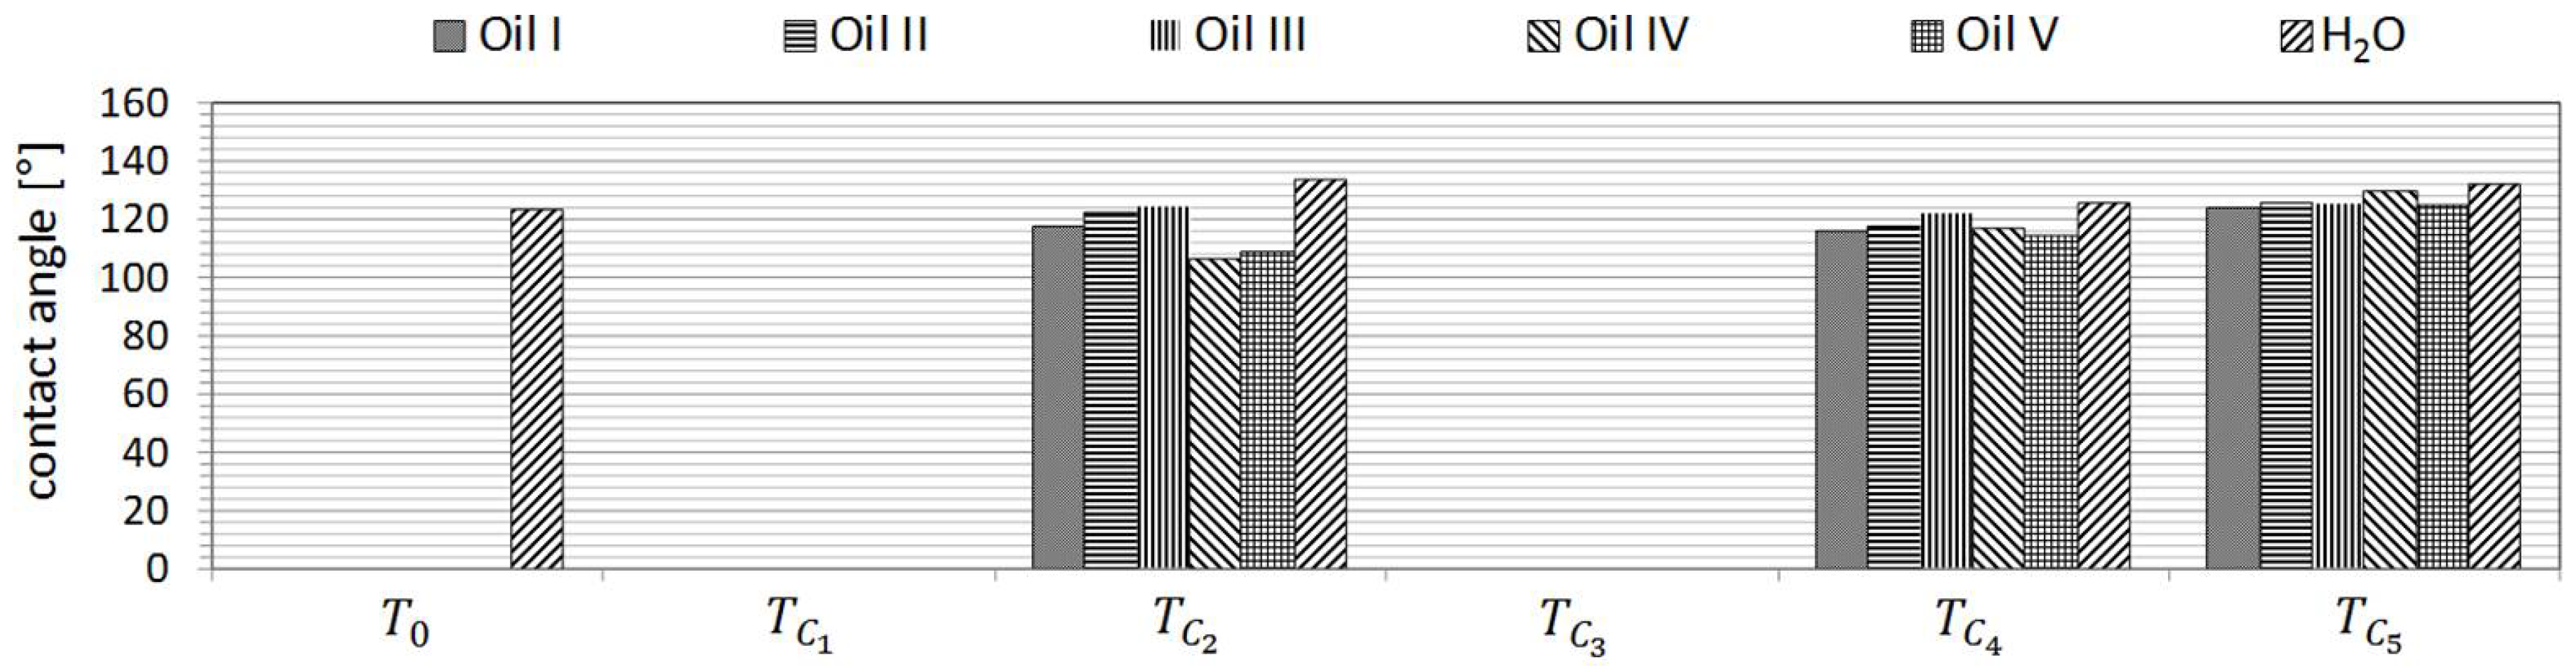
The wetting behavior of five commercially available industrial oils (Table 2) on the treated samples was investigated to determine their response post treatment. Additionally, water (tap water) served as a representative of the highly polar liquids.
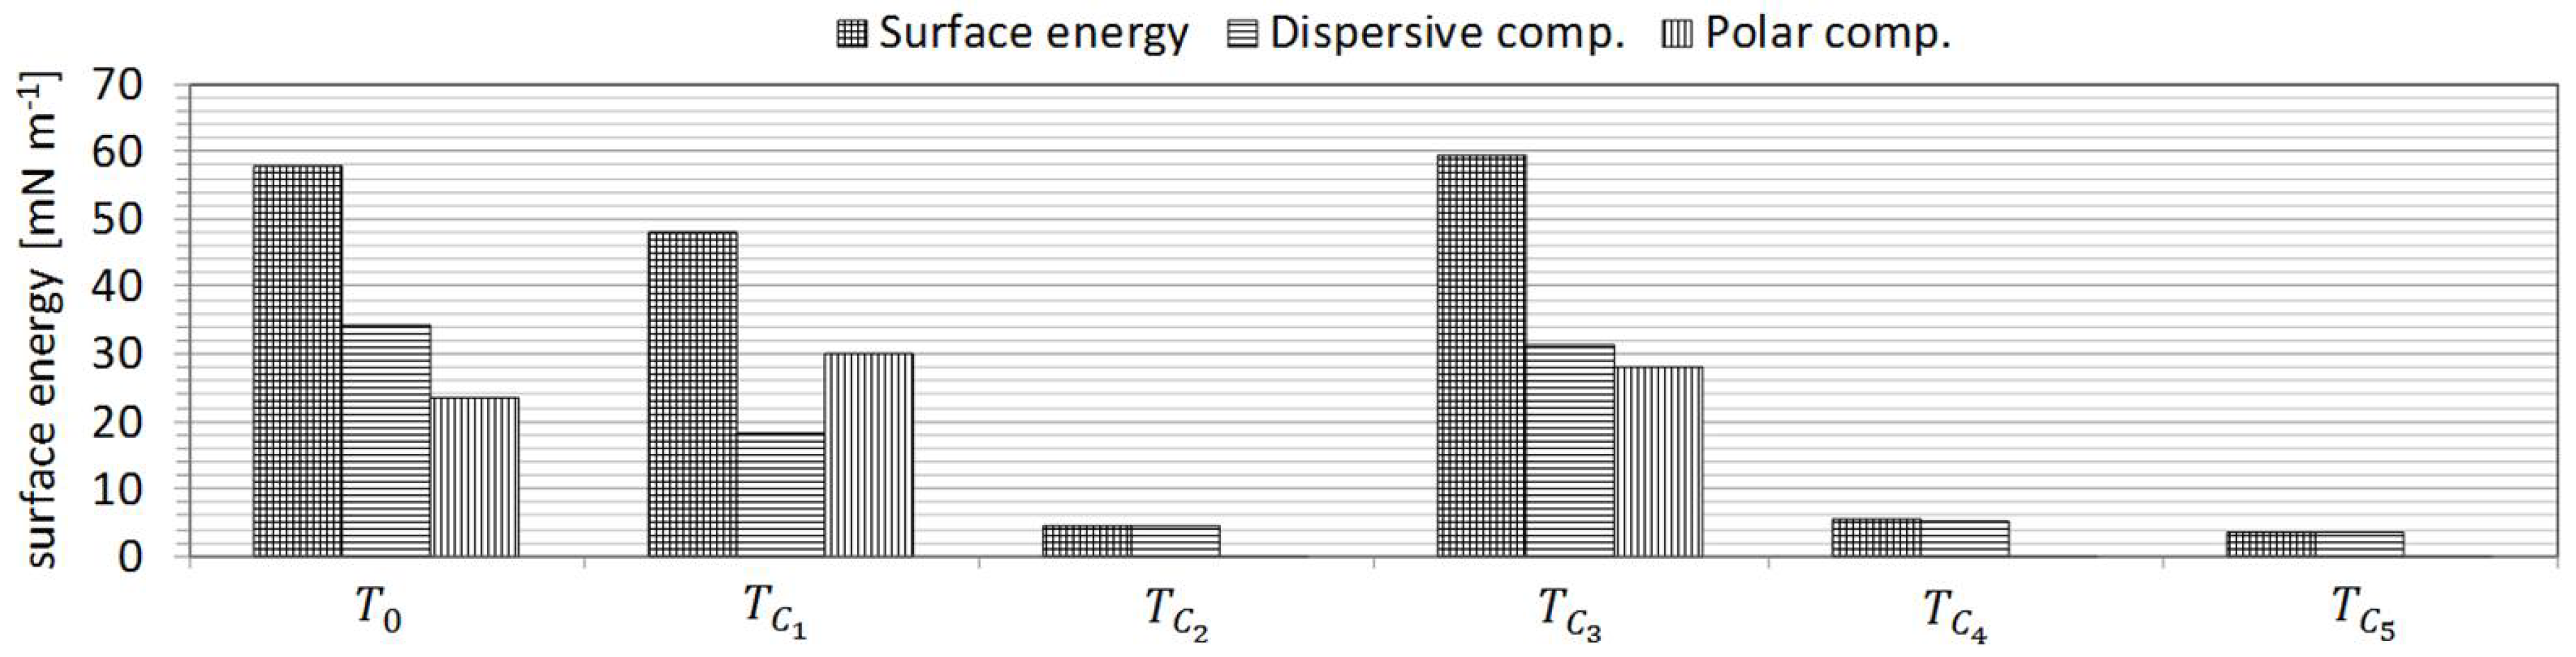
The surface energies of all samples were derived from contact angle measurements. The measurements were carried out a Krüss GmbH model DSA 30 (Hamburg, Germany) contact angle measurement device. The contact angle measurements were carried out with the aid of measuring liquids selected on the basis of their polarity as well as their respective polar and dispersive surface energy components (Table 3). The range extended from complete non-polar (diiodo-methane) to highly polar (dist. water).
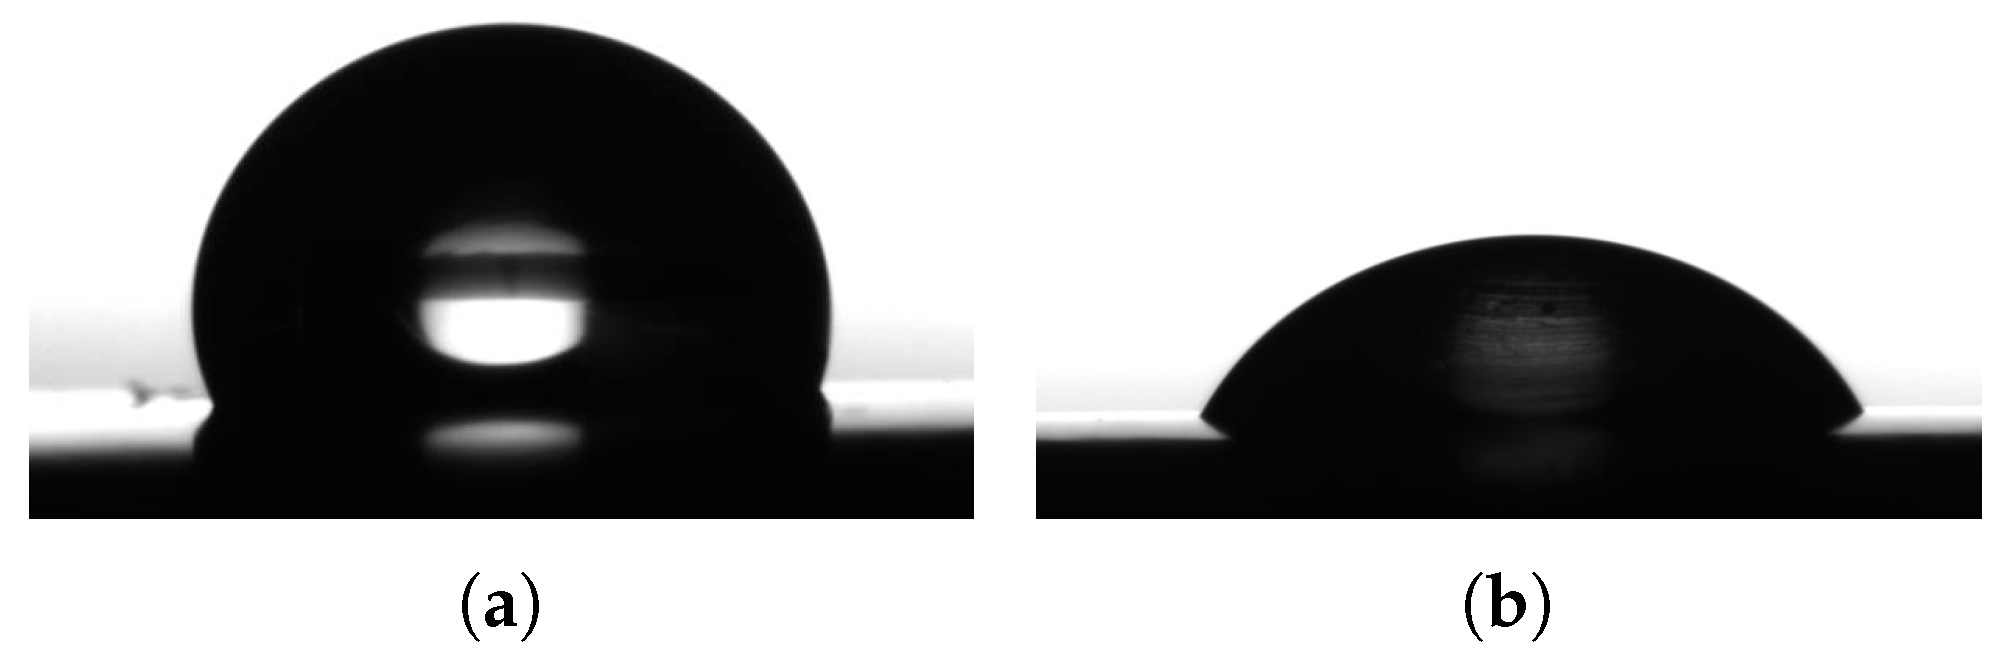
The dispersive and polar surface energy components of the test fluids were determined from the contact angle measurements on the non polar surface (as shown in Figure 2a,b) and calculating from the combination of Young [7] and Owens/Wendt [17] equations. The total fluid surface tension was measured on a model KSV Sigma 702 tensiometer (Gothenburg, Sweden). The results showed good agreement with literature values and are listed in Table 3.
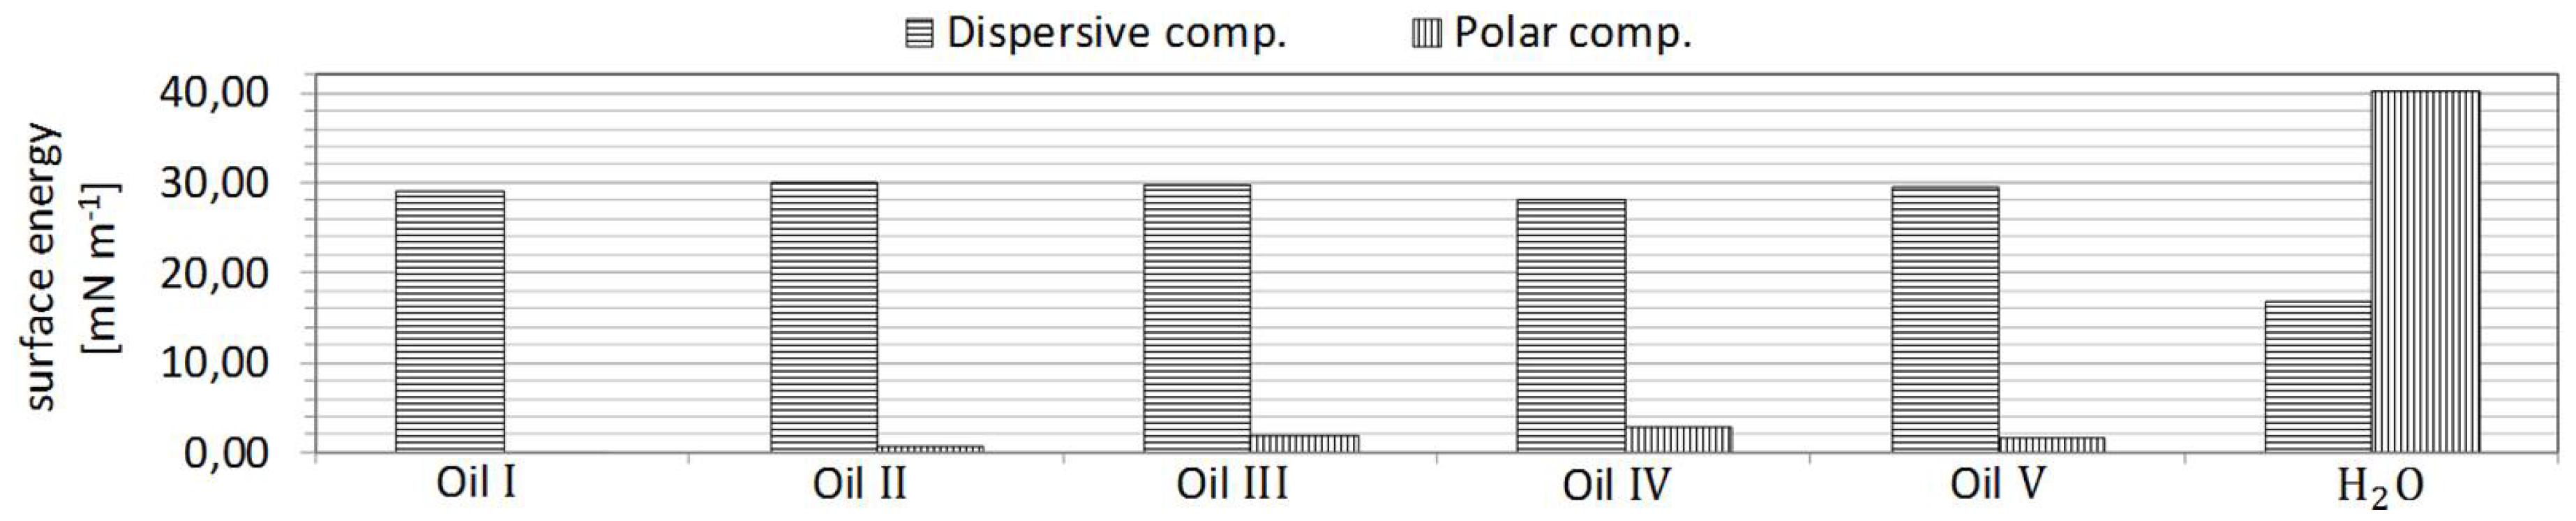
The same procedure was then employed for characterisation of surface tension properties of the functional fluids (Figure 3). The density and kinematic viscosity of these fluids were also measured. These results are also displayed in Table 4.
The characterisation of the select substrates was carried out by measuring the standard textile properties before and after coating. The results are listed in Table 5.

3. Results

3.1. Experimental

The surface free energy (SFE) measurements of coated and uncoated textile substrates were carried out in two steps. The first step involved the contact angle measurements of test fluids on the substrate by the “sessile drop” method. However in cases where fast absorption of the test fluid into the textile sample took place, such as for highly hydrophilic surfaces, the sessile drop method was not applicable.
In these cases, the SFE was determined from the captive bubble measurements [21]. For measuring the SFE with the captive bubble method, diiodomethane and distilled water were used. The examples of these two procedures are displayed in Figure 4 and Figure 5, respectively. The values of the contact angle θ were then into a rearranged Owens, Wendt, Rabel and Kaelble (OWRK) equation [17,19,22]:
( 1 + c o s θ ) σ l 2 σ l d = σ s p σ l p σ l d + σ s d .
The calculated SFE values with polar and dispersive components are listed in Table 6 and depicted graphically in Figure 6. The sessile drop method was then applied to determine the wetting behavior of the coated and uncoated substrates by the functional fluids. The observed wetting behavior was then compared against the calculated spreading parameter S. The results are shown in Table 7 and Table 8, respectively.

3.2. Discussion

Comparison of the results tabulated in Table 7 and Table 8 reveals poor correlation in several cases. Specifically, for S > 0 , a well formed droplet with a well defined contact angle should form on the substrate surface. In particular, the control sample, represented by the uncoated substrate ( T 0 ), is well behaved and exhibits wetting behavior in accordance with the calculated values. In all cases, the calculated value of the spreading parameter S corresponds to the observed wetting behavior. Specifically, for all S > 0 , spreading of the liquid over the substrate surface was observed. Conversely, when S < 0 , a well shaped droplet on the substrate surface was formed. Moreover, a similarly well behaved trend was noted to occur for all the hydrophobically coated samples. Here, in all cases, S < 0 and in all cases a well formed droplet was found to settle on the substrate surface (Figure 7 and Figure 8).
In contrast, the hydrophilically coated substrate exhibited a highly irregular, erratic behavior. For example, the fluid droplets were observed to spread even for S < 0 . This irregular behavior could in part be accounted for by the indirect way in which the spreading parameter is calculated. The effect of this erroneous calculation of the S parameter is best exemplified by the two hydrophilically coated substrates T C 1 and T C 3 . In both cases, the magnitudes of the work of adhesion ( W a ; Figure 9) and the work of cohesion ( W c ; Figure 10) lie relatively close together.
Consequently, even the smallest deviations in contact angle measurement from which the W a , W c and in turn the S parameter is derived can translate into errors large enough to give an incorrect sign for the latter. In general, it can be said that, on textile surfaces such as these employed in this investigations, other effects such as surface roughness and sample to sample inhomogeneity contribute to the measurement in an irregular fashion, thereby affecting the outcome of the experiment and the magnitude of the calculated values. This is particularly striking in the case of the hydrophilic coatings because they change the surface energy of the substrate to the point where W a comes close to W c , thereby increasing the chances for errors in calculation. This is not the case with hydrophobic coatings where the differences between the W a and W c values are relatively large thereby reducing the errors inherent in the experiment as well as in the calculated results (compare values listed in Table 6). The overall behavior is best considered by looking at the individual contribution of the dispersive and polar components of both the substrate and the fluid instead of the gross “macro” factors such as S that tend to disguise the underlying tendencies. In this regard, whereas the W c is concerned only with the fluid behavior, the W a takes into account the interaction between the substrate and the fluid by including the interfacial tension. More importantly, the latter parameter examines the relationship between the substrate and fluid dispersive and polar surface tension components through the joint term:
2 ( σ s d σ l d + σ s p σ l p ) .
This becomes particularly apparent by comparing the dispersive and polar components of both the fluid and the substrate listed in Table 4 and Table 6, respectively. The relationship between the dispersive and polar components can then be further exploited to rearrange the relative substrate/fluid behavior as shown in Figure 11. Examination of Figure 11 shows that when the absolute difference between the ratios of dispersive and polar components (liquid/solid) is large, a non spreading (droplet forming) behavior will be observed. In contrast, when this difference is relatively small, < 2 as determined in the course of this investigation, a spreading behavior (no droplet formation) will occur.

4. Conclusions

In the course of this investigation, we have developed a methodology for characterization of interactions between a textile substrate coated with various surface active agents and several functional fluids to determine the overall wetting behavior. The development of the methodology described herein has provided us with an improved predictability of surface treatment required for a standard industrial textile to provide it with performance characteristics required for given applications. In contrast, relying on the predictions based on the spreading parameter S only would result in a considerable degree of uncertainly inherent in the formula employed for its calculation. The errors resulting from the use of the spreading parameter alone can be most effectively appreciated by examining the irregularities depicted in Table 8 (vide supra). Thus, whenever a sufficient uncertainty in the measurements of one of the parameters employed in the calculation of S occurs, the overall value of S proves itself to be an unreliable predictor of wetting behavior. In such cases, neither hydrophilicity nor hydrophobicity are sufficiently pronounced. The results of the current investigation have shown that the most reliable form of interpretation must rely on the examination of the individual dispersive and polar constituents of the both liquid and solid surface energy components.

Author Contributions

J.S. has conceived, designed and carried out the experimental work within the framework of his doctoral thesis research program. S.L. and J.K.D. have analyzed and assisted with the interpretation of the data. The paper was written and redacted through a joint collaborative effort by all three authors. The materials, reagents and the experimental apparatus were provided by the HYDAC FluidCareCenter ® GmbH as part of the overall materials science characterization project.

Funding

This research received no external funding. All funding for the experimental work as well as for the APC coverage was provided by the HYDAC International ® GmbH as part of the overall materials science characterization project.

Acknowledgments

The authors would like to thank the HYDAC FluidCareCenter ® GmbH, Timo Lang, Edwin Koch, Daniel Mueller, Christian Adam, Andrei Wenzel and Martin Noll for their help with material preparation, assistance in experimental work and many fruitful discussions.

Conflicts of Interest

The authors declare no conflict of interest.

References

  1. Sarıışık, M. Technical textiles. Int. J. Clothing Sci. Technol. 2016, 28. [Google Scholar] [CrossRef]
  2. Kundu, C.K.; Wang, X.; Liu, L.; Song, L.; Hu, Y. Few layer deposition and sol-gel finishing of organic-inorganic compounds for improved flame retardant and hydrophilic properties of polyamide 66 textiles: A hybrid approach. Progress Org. Coat. 2019, 129, 318–326. [Google Scholar] [CrossRef]
  3. Giessmann, A. Coating Substrates and Textiles; Springer: Berlin/Heidelberg, Germany, 2012. [Google Scholar] [CrossRef]
  4. Artus, G.R.; Zimmermann, J.; Reifler, F.A.; Brewer, S.A.; Seeger, S. A superoleophobic textile repellent towards impacting drops of alkanes. Appl. Surf. Sci. 2012, 258, 3835–3840. [Google Scholar] [CrossRef] [Green Version]
  5. Ivanova, N.A.; Philipchenko, A.B. Superhydrophobic chitosan-based coatings for textile processing. Appl. Surf. Sci. 2012, 263, 783–787. [Google Scholar] [CrossRef]
  6. Lugscheider, E.; Bobzin, K. Wettability of PVD compound materials by lubricants. Surf. Coat. Technol. 2003, 165, 51–57. [Google Scholar] [CrossRef]
  7. Young, T. An Essay on the Cohesion of Fluids. Philos. Trans. R. Soc. Lond. 1805, 95, 65–87. [Google Scholar] [CrossRef]
  8. Bormashenko, E. Young, Boruvka–Neumann, Wenzel and Cassie–Baxter equations as the transversality conditions for the variational problem of wetting. Colloids Surf. A Physicochem. Eng. Asp. 2009, 345, 163–165. [Google Scholar] [CrossRef]
  9. David, R.; Neumann, A.W. Energy barriers between the Cassie and Wenzel states on random, superhydrophobic surfaces. Colloids Surf. A Physicochem. Eng. Asp. 2013, 425, 51–58. [Google Scholar] [CrossRef]
  10. Jardim, P.; Horowitz, F.; Felde, N.; Schröder, S.; Coriand, L.; Duparré, A. Determination of the Wenzel roughness parameter by the Power Spectral Density of functional Alumina surfaces. Thin Solid Films 2016, 606, 57–62. [Google Scholar] [CrossRef]
  11. Sun, C.; Zhao, X.W.; Han, Y.H.; Gu, Z.Z. Control of water droplet motion by alteration of roughness gradient on silicon wafer by laser surface treatment. Thin Solid Films 2008, 516, 4059–4063. [Google Scholar] [CrossRef]
  12. Gu, H.; Wang, C.; Gong, S.; Mei, Y.; Li, H.; Ma, W. Investigation on contact angle measurement methods and wettability transition of porous surfaces. Surf. Coat. Technol. 2016, 292, 72–77. [Google Scholar] [CrossRef]
  13. Quéré, D.; Reyssat, M. Non-adhesive lotus and other hydrophobic materials. Philos. Trans. Ser. A Math. Phys. Eng. Sci. 2008, 366, 1539–1556. [Google Scholar] [CrossRef] [PubMed] [Green Version]
  14. Bahners, T.; Mölter-Siemens, W.; Haep, S.; Gutmann, J.S. Control of oil-wetting on technical textiles by means of photo-chemical surface modification and its relevance to the performance of compressed air filters. Appl. Surf. Sci. 2014, 313, 93–101. [Google Scholar] [CrossRef]
  15. Fowkes, F.M. Attractive Forces at Interfaces. Ind. Eng. Chem. 1964, 56, 40–52. [Google Scholar] [CrossRef]
  16. Van Oss, C.; Ju, L.; Chaudhury, M.; Good, R. Estimation of the polar parameters of the surface tension of liquids by contact angle measurements on gels. J. Colloid Interface Sci. 1989, 128, 313–319. [Google Scholar] [CrossRef]
  17. Owens, D.K.; Wendt, R.C. Estimation of the surface free energy of polymers. J. Appl. Polym. Sci. 1969, 13, 1741–1747. [Google Scholar] [CrossRef]
  18. Cherif, C. Textile Werkstoffe für den Leichtbau: Techniken-Verfahren-Materialien-Eigenschaften; Advances in Chemistry; Springer: Berlin/Heidelberg, Germany, 2011. [Google Scholar]
  19. Kaelble, D.H. Dispersion-Polar Surface Tension Properties of Organic Solids. J. Adhes. 1970, 2, 66–81. [Google Scholar] [CrossRef]
  20. Etzler, F.M. Characterization of surface free energies and surface chemistry of solids. In Contact Angle, Wettability and Adhesion; Mittal, K.L., Ed.; VSP, Brill: Utrecht, The Netherlands, 2003; Volume 3, pp. 219–264. [Google Scholar]
  21. KRÜSS GmbH. Upside Down: Surface Energy Measurement of Textiles by Captive Bubble Method. Available online: https://www.kruss-scientific.com/fileadmin/user_upload/website/literature/kruss-ar251-en.pdf (accessed on 21 February 2019).
  22. Rabel, W. Flüssigkeitsgrenzflächen in Theorie und Anwendungstechnik. Phys. J. 1977, 33, 151–161. [Google Scholar] [CrossRef]
Figure 1. (a) three-phase contact line by Young [7]; (b) ‘Wenzel state’ [13]; (c) ‘Cassie–Baxter state’ [13].
Coatings 09 00219 g001
Figure 2. (a) contact angle measurement from glycerol drop on non-polar surface; (b) oil drop on non-polar surface.
Coatings 09 00219 g002
Figure 3. Measured components of surface tension of functional fluids.
Coatings 09 00219 g003
Figure 4. Drop formation and contact angle θ of the “sessile drop” method.
Coatings 09 00219 g004
Figure 5. Application of the air bubble in a liquid environment. Formation of the inverted contact angle using the “captive bubble” method; here, cos θ = 180 cos θ c a p .
Coatings 09 00219 g005
Figure 6. Calculated surface energies of textiles and their components.
Coatings 09 00219 g006
Figure 7. Measured contact angle θ between textiles and functional fluids.
Coatings 09 00219 g007
Figure 8. Spreading parameter S between textiles and functional fluids.
Coatings 09 00219 g008
Figure 9. Calculated work of adhesion W a between the treated textiles and the functional fluids.
Coatings 09 00219 g009
Figure 10. Calculated work of cohesion W c of the used functional fluids.
Coatings 09 00219 g010
Figure 11.S” depending on the absolute difference of the ratios of the dispersive and polar components. Considering the individual amount of the superimposed components of the surface energy, a good prediction of wetting behavior of a functional fluid on the respective treated textile can be made.
Coatings 09 00219 g011
Table 1. Commercial textile surface agents and their expected effects.
Surface AgentExpected EffectChemical CompositionMethod of Application
C 1 hydrophilicSodium phosphate basespraying
C 2 hydrophobic/oleophobicFluorocarbon basespraying
C 3 hydrophilicSodium phosphate basespraying
C 4 hydrophobic/oleophobicFluorocarbon basespraying
C 5 hydrophobic/oleophobicFluorocarbon basespraying
Table 2. Functional fluids classification.
Functional FluidApplicationAPI-GroupDescription
Oil IHydraulic oilIIMineral oil
Oil IILubricating oilIIMineral oil
Oil IIILubricating oilIIMineral oil
Oil IVLubricating oilVPolyglycol
Oil VLubricating oilVPolyglycol
Water--Supply quality
Table 3. Comparison of calculated surface energy components from testing fluids with values known from literature [20].
Testing Fluids θ on Unpol. Surf. [ ° ] Surf. Energy σ l [mN m 1 ] Disp. Comp. σ l d exp. [mN m 1 ] Disp. Comp. σ l d lit. [mN m 1 ] Pol. Comp. σ l p exp. [mN m 1 ] Pol. Comp. σ l p lit. [mN m 1 ]
d- H 2 O 113.172.7923.8621.848.9351
Diiod- methane74.751.1951.0650.80.130
Ethylene glycol90.484827.632920.3719
Glycerol101.1264.0132.543431.4630
Table 4. Physical properties of the functional fluids.
Functional Fluid θ on Unpol. Surf. [ ° ] Surface Energy σ l [mN m 1 ] Pol. Comp. σ l p [mN m 1 ] Disp. Comp. σ l d [mN m 1 ] ρ (20 ° C ) [g cm 3 ] ν (40 ° C ) [mm 2 s 1 ] ν (100 ° C ) [mm 2 s 1 ]
Oil I47.729.090.0229.070.823014.923.47
Oil II52.6530.780.7630.010.801044.786.90
Oil III57.0631.992.0529.930.8710323.4724.91
Oil IV56.9331.012.8128.190.9606336.7
Oil V56.3731.341.6329.700.9546468.6
H 2 O 110.4857.1340.1916.930.98600.6470.294
Table 5. Textile properties of the reference material and the equipped materials.
TextilesMean Flow Poresize [μm]Min. Poresize [μm]Max. Poresize [μm]Surface Weight [g m 2 ]Air Permeability [l m 2 s 1 ]
T 0 14.623.9934.0468299
T C 1 13.962.4029.8676.62258
T C 2 12.592.6830.0472.86244
T C 3 13.652.7029.5170.84264
T C 4 13.571.8030.7585.87192
T C 5 13.282.7130.1872.75256
Table 6. Measured contact angles and calculated surface energies and their components by the OWRK equation [17]. (*) measured by ’sessile drop method’ | (**) measured by ’captive bubble method’.
Textile θ d- H 2 O [ ° ] θ Diiod Methane [ ° ] θ Ethylene Glycole [ ° ] θ Glycerol [ ° ] SFE σ s [mN m 1 ] Pol. Comp. σ s d [mN m 1 ] Disp. Comp. σ l p [mN m 1 ]
T 0 45.55 **49.97 **spread *123.5657.723.4134.29
T C 1 51.87 **78.91 **spread *spread *47.7929.8818.06
T C 2 136.05114.58127.09129.975.330.135.20
T C 3 40.68 **55.06 **spread *spread *59.4828.0731.41
T C 4 131.62111.08125.08130.264.140.044.1
T C 5 138.77118.44129.17129.793.510.013.5
Table 7. ‘sessile drop’ contact angles ( θ ) between textiles and functional fluids.
Textile θ with Oil I [ ° ] θ with Oil II [ ° ] θ with Oil III [ ° ] θ with Oil IV [ ° ] θ with Oil V [ ° ] θ with H 2 O [ ° ]
T 0 spreadspreadspreadspreadspread122.54
T C 1 spreadspreadspreadspreadspreadspread
T C 2 117.53121.83124.410105.90108.35133.60
T C 3 spreadspreadspreadspreadspreadspread
T C 4 115.58117.50121.31108.52114.36125.51
T C 5 123.99125.36124.69129.18124.14131.95
Table 8. Calculated spreading parameter S.
TextileS with Oil IS with Oil IIS with Oil IIIS with Oil IVS with Oil VS with H 2 O
T 0 6.3611.0613.9816.4012.86−4.39
T C 1 −10.78−5.44−1.801.45−0.48−1.46
T C 2 −35.67−38.30−40.45−39.03−39.55−93.5
T C 3 3.789.1112.5415.2811.32−0.69
T C 4 −33.49−39.02−41.25−39.85−40.23−94.83
T C 5 −37.98−40.89−43.22−41.82−42.24−97.37

