Article

Spectrophotometric Characterization of Thin Copper and Gold Films Prepared by Electron Beam Evaporation: Thickness Dependence of the Drude Damping Parameter

1
Fraunhofer Institute of Applied Optics and Precision Engineering IOF, 07745 Jena, Albert-Einstein Str. 7, Germany
2
Abbe School of Photonics, Friedrich-Schiller-University Jena, Albert-Einstein-Str. 6, 07745 Jena, Germany
*
Author to whom correspondence should be addressed.
Coatings 2019, 9(3), 181; https://doi.org/10.3390/coatings9030181
Submission received: 19 February 2019 / Revised: 4 March 2019 / Accepted: 5 March 2019 / Published: 9 March 2019

Abstract

:
Copper and gold films with thicknesses between approximately 10 and 60 nm have been prepared by electron beam evaporation and characterized by spectrophotometry from the near infrared up to the near ultraviolet spectral regions. From near normal incidence transmission and reflection spectra, dispersion of optical constants have been determined by means of spectra fits utilizing a merger of the Drude model and the beta-distributed oscillator model. All spectra could be fitted in the full spectral region with a total of seven dispersion parameters. The obtained Drude damping parameters shows a clear trend to increase with decreasing film thickness. This behavior is discussed in the context of additional non-optical characterization results and turned out to be consistent with a simple mean-free path theory.

1. Introduction

In thin film characterization and design practice, numerous dispersion models exist that may be used for reliable modelling of the optical constants of dielectric films, regardless of whether they are transparent or absorbing. Examples of suitable models are provided by the oscillator model [1,2], Tauc-Lorentz [3] and Cody Lorentz [4] models, Gaussian-like broadened oscillators [5,6], or the β_do model [7]. On the other hand, there is still uncertainty among optical coating practitioners concerning a realistic treatment of the optical constants of metal films, and in particular of ultrathin metal films. This is irritating, as thin metal films are widely used in optical transmission filters [8] and architectural glass coatings [9], just to give two examples.
In fact, it was already shown in 1984 in a famous round robin experiment [10] that the determination of thickness and optical constants of two (ultra-)thin rhodium films (thicknesses around 15 and 30 nm) turned out to be much more challenging than the analysis of sufficiently thick dielectric (in this case Sc2O3) coatings. Differing results have been obtained by means of different optical characterization techniques applied by the participating research groups. Since 1984 much work was done, nevertheless the uncertainty among practitioners in managing ultrathin metal film properties cannot be eliminated.
In May 2018 at the SPIE conference “Advances in Optical Coatings VI” (SPIE conference 10691), some of speakers’ time slots turned out to be unexpectedly vacated because of speakers missing due to airline strikes. These time slots were filled ad hoc with a standby discussion on current problems in the theoretical description of ultrathin metal film optical properties. Here, the authors of the present study developed their point of view that it would be useful to adopt the mean free path theory successfully applied in solid state physics [11,12] and cluster physics [13] to the modelling of thin metal film optical constants. It is the purpose of this paper to re-examine this idea and to demonstrate experimental examples on the use of this treatment.
The general idea is rather simple. One may start from the classical Drude function [2] in order to model the dielectric response of the free carrier fraction in metals. The bound electron response may be modeled in terms of some derivative of the multioscillator model [1,2,3,4,5,6,7]. For smooth closed films, such a treatment leads to satisfactory spectra fits corresponding to thickness-independent optical constants, as long as the film thickness is large enough (as a rule of thumb, the films should be thicker than approximately 50 nm).
However, when the film thickness d becomes smaller than approximately twice the mean free path of the conduction electrons in the bulk, the picture may change. Then, collisions of conduction electrons with the film surface lead to a decrease in the mean free path, which may result in an increase in the damping parameter ΓD of the Drude function. In smooth closed thin films, this effect is expressed in terms of the parameter v F τ b d [11,12]. Here, v F is the Fermi velocity, and τ b the average time between two collisions suffered by a free charge carrier in the bulk.
Note that an analogous approach is in use in small metal cluster optics [13]. Here the parameter is A v F τ b R with R—cluster radius, and A is a constant in the range of one.
In the following, we will demonstrate the validity of such an approach to the optical properties of thin copper and gold films.

2. Theory

2.1. Dispersion Model

In order to account for both the free and bound electrons fractions in a metal film, we make use of the following writing of the metal’s dielectric function ε (n-refractive index; k–extinction coefficient):
ε = 1 + χ free + χ bound = ( n + i k ) 2
where χ free is the susceptibility characterizing the free electron fraction (corresponding to intraband transitions), and χ bound describes the contribution of interband transitions, i.e., the response of the bound electrons.
For the free electrons, we will use the classical Drude function [2]:
χ free = ( ν p 2 ν 2 + 2 i ν   Γ D )
Here ν is the wavenumber (e.g., the reciprocal value of the vacuum wavelength), and νp the free electrons plasma frequency in wavenumber units:
ν p = ω p 2 π c = E p 2 π c
where (c is velocity of light in the vacuum, Ep is bulk plasmon energy, and ωp is bulk plasma (angular) frequency) ΓD is the Drude damping parameter, again in wavenumber units. For the bulk material we have:
Γ D , b   = 1 4 π c τ b
Particularly, for the “perfect” bulk crystal, Equation (4) reads as:
Γ D , b 0 = 1 4 π c τ b 0
Theoretical values on the bulk collision time τ b 0 in the perfect crystal and the Fermi velocity v F are given in Table 1 together with selected other parameters known for bulk copper and gold from the literature.
Different sets of copper and gold Drude parameters (Table 2) are obtained or used in studies published in the last decades. The reported data scatter strongly, but are of the same order of magnitude as the values presented in Table 1.
It is worth noting that in reference [20], Mie resonances in nanosized gold clusters with different diameters have been studied, and the increase in the Drude damping parameter with decreasing cluster diameter could be directly observed. In the smallest clusters with diameters of 5 nm, ΓD reached values up to approximately 650 cm−1.
According to Equation (1), a realistic description of the metal’s optical properties must also contain the response of the bound electrons. In this study, in order to quantify χ bound , we make use of the beta-distributed oscillator (β_do) dispersion model [7]. In the β_do model, the susceptibility χ bound is given by:
χ bound ( ν ) = J π s = 1 N w s ( 1 ν s ν i Γ + 1 ν s + ν + i Γ ) s = 1 N w s ;     w s = ( s N + 1 ) α 1 ( N + 1 s N + 1 ) β 1 ;     s = 1 , 2 , 3 , , N ν s = ν a + ν b ν a N + 1 s
In fact, Equation (6) describes inhomogeneous broadening of an absorption feature with a shape described in terms of the beta-function, with exponents defined by α and β. N is the number of equidistant Lorentzian oscillators (with homogeneous linewidth Γ) considered in numerical modelling, while νa and νb mark onset and cutoff wavenumbers of the inhomogeneously broadened absorption feature. J is an intensity factor proportional to the oscillator strength. The mentioned parameters form the set of β_do dispersion model parameters. The optical constants of the films, as well as the Drude and β_do dispersion parameters, may then be obtained from fitting experimental transmission and reflection spectra of the real films in terms of Equations (1), (2), and (6). The optical constants in this study have been determined in this way.

2.2. Film Thickness Estimation

In order to determine the metal film thickness, three different approaches have found an application:
  • Thicknesses have been determined from fitting experimental transmission and reflection spectra in terms of Equations (1), (2), and (6), taking the film thickness as a further fitting parameter.
  • Thicknesses have been determined from X-ray reflection (XRR) analysis.
  • Thicknesses have been estimated from measured transmission and reflection spectra without assuming a specific dispersion law, but on the basis of a sum-rule-based theoretical approach using potential absorptance [22,23].
In point iii, thickness determination was achieved by first calculating the experimental value Ωexp defined by
Ω exp 357 nm 2000 nm { 1 T exp ( λ ) [ 1 R exp ( λ ) ] } d λ λ 2 357 nm 2000 nm d λ λ 2  
for each sample from the measured near normal incidence transmission (T) and reflection (R) spectra. That value was compared to a theoretical value calculated based on tabulated optical constants [24] as a function of film thickness d:
Ω calc ( d ) 357 nm 2000 nm { 1 T calc ( λ , d ) [ 1 R calc ( λ , d ) ] } d λ λ 2 357 nm 2000 nm d λ λ 2  
Then, d was estimated from setting:
Ω calc ( d ) =   Ω exp
As it will be seen later in Section 4, the film thicknesses obtained by these three methods are in good agreement, except metal films with a thickness of more than 50 nm.

2.3. Mean Free Path Effects

As has already been shown in earlier work [11,12], in ultrathin metal or semiconductor films, a drop in static electric conductivity occurs in ultrathin metal films when the film thickness becomes smaller than a value of approximately 2 v F τ b (for gold and copper, according to Table 1, this thickness corresponds to approximately 75 nm). The point is that in ultrathin films, collisions between charge carriers and the film surface may dominate over bulk collision effects, and this may lead to a significant reduction in the average collision time. According to the classical Drude theory, this will be accompanied by a decrease in the static electric conductivity, and an increase in the Drude damping parameter according to Equation (4).
As is shown in an earlier study [11], the simplest model treatment of this reduction in the mean free path of the charge carriers results in a thickness-dependent average collision time given by:
τ ( d ) = τ b [ 1 + 2 ( 1 p spec ) l free d ]
Here, pspec is the relative amount of charge carriers that is specularly reflected at the film surface, and lfree the mean free path in the bulk material. Note that in this approach, only charge carriers reflected diffusely from the surface contribute to the mentioned thickness dependence. When setting l free = v F τ b [11,12] and making use of Equation (4), we obtain a manageable expression for the thickness-dependent Drude damping parameters in thin films according to:
Γ D ( d ) = Γ D , b [ 1 + 2 ( 1 p spec ) v F τ b d ]
This expression will be in the basis of our discussion of thickness-dependent Drude parameters in the ultrathin copper and gold films.

3. Experimental

3.1. Layer Deposition

The metal layers have been prepared in a Bühler Syrus pro 1110 coating machine (Alzenau, Germany) by e-beam evaporation using a tungsten liner. The Au-material was Au 5N+ from SAXONIA Technical Materials (Hanau, Germany) and the Cu material 5N grade supplied from Umicore Company (Balzers, Liechtenstein). Fused silica Q1 as well as silicon wafers have been used as substrates. No substrate preconditioning by plasma etching has been applied, and no adhesion layers have been deposited. The evaporation geometry was optimized with respect to the specific demands of metal coating, so the distance from evaporation surface to the substrate was only 32 cm, while the substrates were held at fixed positions without any rotation of the substrate holder. The pressure was 4.7 × 10⁻⁷ mbar prior to deposition start. The substrate temperature during evaporation was about 30 °C. The evaporation rate of 0.5 nm/s and the thicknesses have been controlled by quartz crystal monitoring.

3.2. Layer Characterization

3.2.1. Spectrophotometry

T- and R- spectra in the range of 350–2000 nm of all samples have been measured at near normal incidence in a Perkin Elmer Lambda 950 scanning spectrophotometer (Rodgau, Germany) equipped with absolute T- and R measurement attachments. From these spectra, film thickness d as well as optical constants n and k have been deduced from spectra fits in terms of Equations (1), (2), and (6), using a Matlab environment. In all spectra fits, the parameter N in Equation (6) was set to N = 1000. Generally, spectra from samples deposited onto both types of substrates (silicon and fused silica) have been included into the fitting procedure. In more detail, the fitting procedure is described in a previous study [7].

3.2.2. X-ray Reflection XRR

All samples were characterized with grazing incidence X-ray reflectivity (XRR) using a Bruker (Karlsruhe, Germany) D5005 diffractometer operated with Cu-Kα radiation (λ = 0.154 nm) in symmetrical θ–2θ geometry. The film thickness, material density, and surface roughness were extracted from simulation of the reflective curves by the commercial program “Leptos” (version 7.8).

3.2.3. Scanning Electron Microscopy SEM

The layer surfaces were investigated using a Carl Zeiss Sigma scanning electron microscope (SEM, Jena, Germany). The applied acceleration voltage was 5 kV and an InLens-Detector was used to detect the secondary electrons. To get a good overview, images were made in different magnifications. The presented results were made with a magnification of 80.00 K×.

4. Results

Concerning non-optical properties of the metal layers, we start with a short survey of the XRR and SEM results. For all copper layers on fused silica, an identical rms surface roughness of 1.0 nm has been found by XRR. The density values were scattered in the region (8.6 ± 0.2) g·cm−3 without a clear thickness dependence. Concerning the gold layers, the rms surface roughness data were scattered in the region (1.1 ± 0.2) nm, while the density was about (19.1 ± 0.1) g·cm−3. All films have approximately the same surface roughness around 1 nm rms, while the average density turned out to be marginally smaller than typical bulk densities (96.5% for Cu, and 98.9% for gold—compare with Table 1).
In qualitative agreement with the rather thickness-independent surface roughness, all SEM pictures of copper films on fused silica show practically identical granular surface morphologies with grain sizes in the region of 20 nm (Figure 1a–c). The corresponding pictures of gold surfaces (Figure 1d–f) show different behavior. Again, granular areas are observed, but the dominating features are given by large material slabs with diameters up to several 100 nm that appear rather smooth. Furthermore, these material slabs show a trend of growing in size with increasing layer thickness. It may be expected that the large gold slabs result in optical properties of gold films that are much closer to the “perfect“ bulk references, as would be expected in the case of copper films.
Concerning the optical properties, let us first mention that all spectra could be well fitted by means of the chosen dispersion approach in Equations (1), (2), and (6), assuming α = β, such that a total of only seven independent dispersion parameters (two Drude parameters and five β_do parameters) were necessary to model the optical constants. The film thicknesses of the films on fused silica and silicon appear as additional parameters for the spectra fits. Figure 2 demonstrates the achieved fit quality for a gold (Figure 2a) a copper (Figure 2b) sample. The chosen dispersion approach obviously results in excellent spectra fits.
Figure 3 shows the obtained optical constants for all samples. From the figures, we recognize the typical dispersion of metal optical constants in the spectral region from the near infrared to the visible. The comparison with literature data from an earlier study [24] (green circles) confirms the physical relevance of the obtained data. Generally, thinner layers tend to have slightly larger refractive indices in the near infrared, and slightly smaller extinction coefficients. The corresponding dispersion parameters are collected in the Table 3 and Table 4.
In order to identify relevant thickness-dependent trends in the parameters given in Table 3 and Table 4, for each dispersion parameter f, a relative dynamic range δ f has been calculated as the difference between its maximum and minimum values in the corresponding column of the table, divided by the average of all data in the column. Hence, δ f is given by:
[ f max f min f ] | column δ f
The spectra fit for the thickest copper layer was numerically instable, most probably because of the strong damping within the layer, indicated by the weak transmission signal. As a result we recognize the large mismatch between the thickness values obtained by the different methods. In Table 4, a set of dispersion parameters is included as obtained from a fit attempt when the difference νba was kept close to what is known from the bulk material. Table 5 shows average values and standard deviations of the fitting parameters obtained from different fit attempts of the spectra of the problematic thickest copper film. Fortunately, the obtained damping parameters that are in the focus of our study scatter with a relative standard deviation of no more than 12%. Thus, regardless of the principal numerical instability of the spectra fits, the data range for the damping parameters reported in Table 5 does not violate the thickness-dependent trends, which follow from Table 4. Moreover, all dispersion data presented in Table 4 for this copper sample fall into the ranges presented in Table 5. Therefore, we assume that the data of the thickest film, as included in Table 4, are consistent with the spectra and are physically meaningful, regardless of the numerical problems with that fit.
A comparison of the δ f values from Table 3 and Table 4 shows that in both metals, strongest relative changes from sample to sample (highest δ f ) are observed for the Drude damping parameter ΓD, followed by the homogeneous linewidth of the β_do oscillators Γ, which also essentially represents a damping parameter. Moreover, for both of these parameters, a clear trend is observed in the sense that a decrease in thickness is accompanied by an increase in the damping parameter, in agreement to the predictions of the mean free path theory. Therefore, the further discussion will mainly focus on the Drude damping parameter and its thickness dependence. Note further that in the case of gold, plasma frequencies obtained from our fits appear to be somewhat higher than the theoretical value from a previous study [15], but corresponding data reported in other studies [25] also tend to exceed that value (see also Table 2 in this regard). In that connection, it is worth noting the large scatter in reported effective mass values of conduction electrons in gold [25]. For copper, the νp - data obtained from our study are well below the theoretical value, in agreement with the lower density of the films.

5. Discussion

In Figure 4, the obtained model parameters λa/b = 1/νa/b are visualized in relation to characteristic features in the gold and copper bulk reflection spectra (Figure 4a) and in the imaginary part of the dielectric function (Figure 4b) [24]. Obviously, the parameters λa mark the onset wavelength of strong interband absorption structures in the spectra, while λba gives some effective width (in wavelength units) of the modeled interband absorption structure. Note that the νa values as obtained from our fits (Table 3 and Table 4) are consistent with the theoretical νa0 data (Table 1) in the sense that ν a 0 ν a Γ is fulfilled.
Based on Equation (11) the thickness dependence of the obtained damping parameters is fitted by the simple law:
Γ D ( d ) = Γ D , b [ 1 + δ d ]
Here Γ D , b and δ are fitting parameters and the obtained values are given in Table 6. Figure 5 shows the obtained thickness dependence of Drude damping parameters together with the fit in terms of (Equation (13)). Note that our Γ D data are principally consistent with the experimental data given in Table 2, but show a clear dependence on the film thickness.
When now combining Equations (4), (5), (11), and (13), the following data may be calculated from the fit of Γ D ( d ) :
τ b = τ b 0 Γ D , b 0 Γ D , b ;     ( 1 p spec ) = δ 2 v F τ b
The results are presented in Table 6. Also included are relaxation times τJ-C obtained in previous studies [19,26].
Our experimental data are, thus, consistent with Equation (11) when assuming that in the Cu films, a larger amount of electrons (55%) is diffusely scattered at the film surface than in the case of gold films (38%). This result is at least in a qualitative agreement with the SEM characterization result (Figure 1), where the Cu films show a rather granular surface morphology, while in the gold films, large slabs have been found that appear rather smooth in the SEM image. Also, in the gold films, obtained damping parameters and plasma frequencies are generally closer to the theoretical values of the perfect crystal (Table 1) than in the case of copper films.
In a more refined treatment, the parameter pspec could also be treated as a function of the thickness, in order to account for the larger slabs in thicker gold films, as obtained from the SEM images, but in our study the number of available experimental points is by far too small for justifying such a model extension.
Obviously, the extrapolation of our data to large thicknesses does not result in damping parameters that converge to the “perfect” values summarized in Table 1. Therefore, we have to recognize that in our films, there are at least two effects that make the Drude damping parameter different from the “perfect” values presented in Table 1:
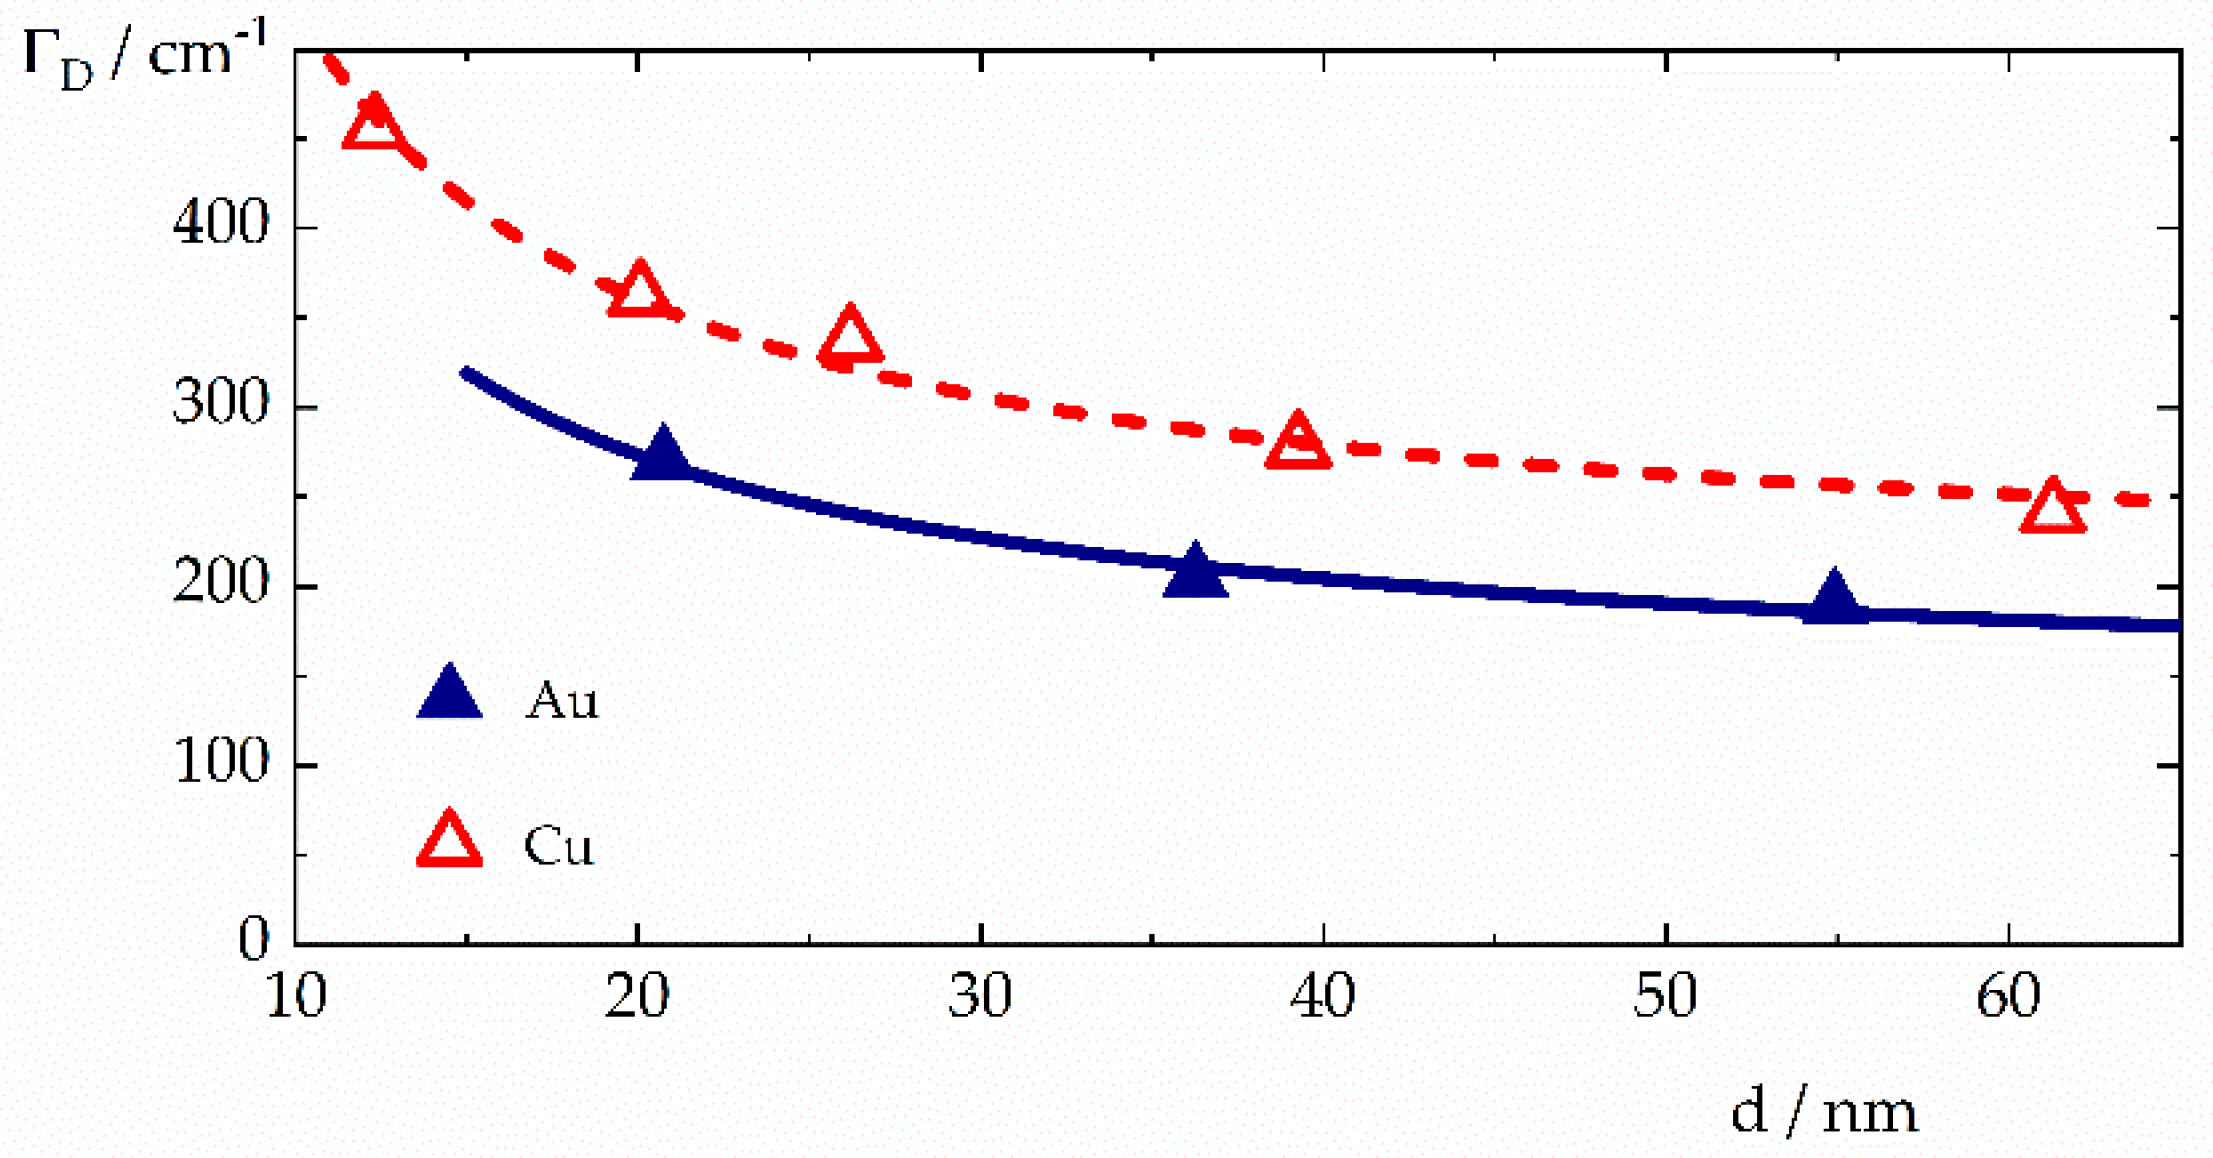
  • A thickness dependence that may obviously be described by means of the free path theory (Equation (11))
  • A complicated microstructure of the film materials that results in τ b < τ b 0 . This is also clearly evident from the data τ J C from a previous study [26]
The complicated film microstructure as it may be guessed from the SEM images raises the question of how far simulations of charge transport in three-dimensional (3D) random microstructures (compare with Stenzel et al. [27]) may provide a theoretical access to the bulk collision times τ b <   τ b 0 we expect from our treatment. Although such a simulation is beyond the scope of the present study, it makes sense to compare our results, at least qualitatively, to what is obtained from such simulations. Indeed, the classical (Drude) expression for the static electric conductivity of a continuous medium may be written as:
σ 0 = N 0 e 2 τ b 0 m *
Here N0 is the free electron concentration in the perfect crystal, e the elementary charge, and m* the optical mass (compare with Ehrenreich and Philipp [15]). On the other hand, from the numerical analysis of random 3D microstructures, it turns out that their electric conductivity is determined by three crucial factors characterizing the geometry of the random network, namely:
  • The filling factor p ≤ 1;
  • The constrictivity cr ≤ 1;
  • The tortuosity tr ≥ 1.
Then, according to an earlier study [27], the effective conductivity of the 3D microstructure can be expressed in equations of the type:
σ e f f σ 0 p 1.0 c r 0.36 t r 5.17
with exponents that originate from a fit and vary from source to source. From σ 0 = N 0 e 2 τ b 0 m * we then have:
σ e f f σ 0 p c r 0.36 t r 5.17 = N 0 e 2 τ b 0 m * p c r 0.36 t r 5.17 = N e f f e 2 τ e f f m *
When assuming identical optical masses at both sides of the above equation, the latter allows the empirical introduction of effective carrier concentrations Neff and collision times τeff according to:
N e f f N 0 p N 0 ;     τ e f f c r 0.36 t r 5.17 τ b 0 τ b 0     because   t r 1   and   c r 1
When finally associating τeff with the bulk relaxation time in the non-perfect film τb, we have
  τ e f f τ b τ b 0 Γ D , b = 1 4 π c τ b Γ D , b 0
Therefore, the bulk Drude damping parameter in a real film shall exceed that in the perfect crystal, in agreement with our findings.

6. Summary and Outlook

We have demonstrated that the optical spectra of rather thin metal films may be reliably fitted in terms of a dispersion approach that combines the classical Drude function with the β_do model. The number of fitting parameters is given by seven dispersion model parameters plus the film thickness (es). This has allowed fitting of the metal film spectra in the wavelength range from 350 to 2000 nm. Nevertheless, inclusion of additional measurement data (e.g., ellipsometry and photometry at different angles) is known to be useful for characterization of thin metal films [28], but was not available for this study.
The fits result in a clear thickness dependence of the Drude damping parameters, which is consistent with the predictions of the mean free path theory.
In addition to the obtained thickness dependence of the Drude damping parameters, our results indicate a larger bulk value of the damping parameter than in the perfect crystal. This is consistent with earlier reports and clearly a result of the complicated microstructure of real evaporated metal films. In that connection, recent reports on the simulation of charge transport in random microstructures indicates that such simulations might give access to a numerical modeling of the complex of electrical and optical properties of real metal films of different thickness.
When returning to the application questions raised in the introduction of this paper, we conclude that a systematic increase in the Drude damping parameters with decreasing film thickness is clearly observed in our coatings and may be modeled by means of the mean free path theory, at least in the thickness range between 10 and 50 nm. However, as is evident from Figure 3, the thickness effect on the optical constants is nevertheless smaller than the range of bulk metal optical constants reported in a previous study [24], at least in the near infrared. As such, the limited reproducibility of the optical properties of copper and gold samples and the limited relevance of applied characterization methods and underlying dispersion models seems to be another important source of uncertainty in defining suitable optical constants of thin metal films in optical coating practice. In our opinion, the application of robust Kramers-Kronig consistent dispersion models with a minimum number of free parameters is important for reliable modeling of the optical constants of thin metal films. Combined with the mean free path approach, this could be an important step for modeling thickness-dependent optical constants of ultrathin metal films in optical coating practice.

Author Contributions

Conceptualization, O.S.; Data Curation, S.W.; Formal Analysis, O.S. and S.W.; Investigation, S.S., D.G. and S.-J.W.; Methodology, O.S. and S.W.; Project Administration, O.S.; Software, S.W.; Visualization, O.S., S.W., S.S., D.G. and S.-J.W.; Writing—Original Draft Preparation, O.S.; Writing—Review and Editing, S.W.

Funding

The study was partially funded by Fraunhofer internal projects.

Acknowledgments

The authors would like to thanks the attendees of the SPIE conference “Advances in Optical Coatings VI” (SPIE conf. 10691) for the ad hoc discussion on current problems in the theoretical description of ultrathin metal films optical properties, which was motivating for the present study.

Conflicts of Interest

The authors declare no conflict of interests.

References

  1. Born, M.; Wolf, E. Principles of Optics; Pergamon Press: Oxford, UK, 1968. [Google Scholar]
  2. Stenzel, O. The Physics of Thin Film Optical Spectra: An Introduction, 2nd ed.; Springer: Berlin, Germany, 2016; pp. 25–39. [Google Scholar]
  3. Jellison, G.E. Spectroscopic ellipsometry data analysis: Measured versus calculated quantities. Thin Solid Films 1998, 313, 33–39. [Google Scholar] [CrossRef]
  4. Ferlauto, A.S.; Ferreira, G.M.; Pearce, J.M.; Wronski, C.R.; Collins, R.W.; Deng, X.; Ganguly, G. Analytical model for the optical functions of amorphous semiconductors from the near-infrared to ultraviolet: Applications in thin film photovoltaics. J. Appl. Phys. 2002, 92, 2424–2436. [Google Scholar] [CrossRef]
  5. Brendel, R.; Bormann, D. An infrared dielectric function model for amorphous solids. J. Appl. Phys. 1992, 71, 1–6. [Google Scholar] [CrossRef]
  6. Orosco, J.; Coimbra, C.F.M. On a causal dispersion model for the optical properties of metals. Appl. Opt. 2018, 57, 5333–5347. [Google Scholar] [CrossRef]
  7. Wilbrandt, S.; Stenzel, O. Empirical extension to the multioscillator model: The beta-distributed oscillator model. Appl. Opt. 2017, 56, 9892–9899. [Google Scholar] [CrossRef]
  8. Macleod, H.A. Thin-Film Optical Filters, 4th ed.; CRC Press: Boca Raton, FL, USA, 2010. [Google Scholar]
  9. Gläser, H.J. Dünnfilmtechnologie auf Flachglas; Verlag Karl Hofmann: Schorndorf, Germany, 1999; pp. 164–248. [Google Scholar]
  10. Arndt, D.P.; Azzam, R.M.A.; Bennett, J.M.; Borgogno, J.P.; Carniglia, C.K.; Case, W.E.; Dobrowolski, J.A.; Gibson, U.J.; Hart, T.T.; Ho, F.C.; et al. Multiple determination of the optical constants of thin-film coating materials. Appl. Opt. 1984, 23, 3571–3596. [Google Scholar] [CrossRef] [PubMed] [Green Version]
  11. Anderson, J.C. Conduction in thin semiconductor films. Adv. Phys. 1970, 19, 311–338. [Google Scholar] [CrossRef]
  12. Weißmantel, C.; Hamann, C. Grundlagen der Festkörperphysik; Springer: Berlin, Germany, 1979; pp. 413–416. [Google Scholar]
  13. Kreibig, U. Optics of Nanosized metals. In Handbook of Optical Properties II: Optics of Small Particles, Interfaces, and Surfaces; Hummel, R.E., Wißmann, P., Eds.; CRC Press Inc.: Boca Raton, FL, USA, 1997; pp. 145–190. [Google Scholar]
  14. Gall, D. Electron mean free path in elemental metals. J. Appl. Phys. 2016, 119, 085101. [Google Scholar] [CrossRef] [Green Version]
  15. Cooper, B.R.; Ehrenreich, H.; Philipp, H.R. Optical properties of noble metals II. Phys. Rev. 1965, 138, A494–A507. [Google Scholar] [CrossRef]
  16. Ehrenreich, H.; Philipp, H.R. Optical properties of Ag and Cu. Phys. Rev. 1962, 128, 1622–1629. [Google Scholar] [CrossRef]
  17. Ordal, M.A.; Bell, R.J.; Alexander, R.W.; Long, L.L.; Querry, M.R. Optical properties of fourteen metals in the infrared and far infrared: Al, Co, Cu, Au, Fe, Pb, Mo, Ni, Pd, Pt, Ag, Ti, V., and W. Appl. Opt. 1985, 24, 4493–4499. [Google Scholar] [CrossRef] [PubMed]
  18. Zeman, E.J.; Schatz, G.C. An accurate electromagnetic theory study of surface enhancement factors for silver, gold, copper, lithium, sodium, aluminum, gallium, indium, zinc, and cadmium. J. Phys. Chem. 1987, 91, 634–643. [Google Scholar] [CrossRef]
  19. Grady, N.K.; Halas, N.J.; Nordlander, P. Influence of dielectric function properties on the optical response of plasmon resonant metallic nanoparticles. Chem. Phys. Lett. 2004, 399, 167–171. [Google Scholar] [CrossRef] [Green Version]
  20. Berciaud, S.; Cognet, L.; Tamarat, P.; Lounis, B. Observation of intrinsic size effects in the optical response of individual gold nanoparticles. Nano Lett. 2005, 5, 515–518. [Google Scholar] [CrossRef] [PubMed]
  21. Blaber, M.G.; Arnold, M.D.; Ford, M.J. Search for the ideal plasmonic nanoshell: The effects of surface scattering and alternatives to gold and silver. J. Phys. Chem. C 2009, 113, 3041–3045. [Google Scholar] [CrossRef]
  22. Stenzel, O.; Macleod, A. Metal-dielectric composite optical coatings: Underlying physics, main models, characterization, design and application aspects. Adv. Opt. Technol. 2012, 1, 463–481. [Google Scholar] [CrossRef]
  23. Stenzel, O. Optical Coatings: Material Aspects in Theory and Practice; Springer: Berlin, Germany, 2014; pp. 307–311. [Google Scholar]
  24. Palik, E.D. (Ed.) Handbook of Optical Constants of Solids; Academic Press: Orlando, FL, USA, 1998. [Google Scholar]
  25. Olmon, R.L.; Slovick, B.; Slovick, T.W.; Shelton, S.D.; Oh, S.-H.; Boreman, G.D.; Raschke, M.B. Optical dielectric function of gold. Phys. Rev. B 2012, 86, 235147. [Google Scholar] [CrossRef] [Green Version]
  26. Johnson, P.B.; Christy, R.W. Optical constants of the noble metals. Phys. Rev. B 1972, 6, 4370–4379. [Google Scholar] [CrossRef]
  27. Stenzel, O.; Pecho, O.; Holzer, L.; Neumann, M.; Schmidt, V. Predicting effective conductivities based on geometric microstructure characteristics. AIChE J. 2016, 62, 1834–1843. [Google Scholar] [CrossRef]
  28. Amotchkina, T.V.; Janicki, V.; Sancho-Parramon, J.; Tikhonravov, A.V.; Trubetskov, M.K.; Zorc, H. General approach to reliable characterization of thin metal films. Appl. Opt. 2011, 50, 1453–1464. [Google Scholar] [CrossRef] [PubMed]
Figure 1. Selected SEM images of the metal films surface morphology. The mentioned thicknesses correspond to those obtained from the spectra fits.
Coatings 09 00181 g001aCoatings 09 00181 g001b
Figure 2. (a): experimental spectra (triangles) and fit (lines) of a gold film on Q1 (navy) and Si (black). On Q1, a thickness of 36.9 nm was found, on Si, the thickness was 41.1 nm; (b): experimental spectra (triangles) and fit (lines) of a copper film on Q1 (navy) and Si (black). On Q1, a thickness of 39.3 nm was found, on Si, the thickness was 42.9 nm.
Coatings 09 00181 g002
Figure 3. Optical constants of the gold (a) and copper (b) films. Curves that appear darker in color correspond to thicker films. Green circles represent literature data [24].
Coatings 09 00181 g003
Figure 4. (a): Bulk reflectance of copper and gold. The corresponding λa values are indicated by vertical lines; (b): Imaginary parts of the dielectric function of gold and copper. The corresponding λa/b values are indicated by vertical lines.
Coatings 09 00181 g004
Figure 5. Thickness dependence of the Drude damping parameter Γ D . Symbols represent data from Table 3 and Table 4, while lines represent the fit in terms of Equation (13).
Coatings 09 00181 g005
Table 1. Theoretical data ( E a 0 : photon energy corresponding to the onset of absorption features caused by interband transitions in the optical spectra of the perfect crystal, ν a 0 is the corresponding onset wavenumber).
Metal τ b 0 / fs [14] v F τ b 0 / nm [14]ρ/g cm−3 E p / eV E a 0 / eV [15] Γ D , b 0 / cm 1
(Equation (5))
ν p / cm 1
(Equation (3))
νa0/cm−1
Cu3639.98.929.3 [16]2.097475,00416,856
Au27.337.719.328.83 [15]2.359771,21418,953
Table 2. Survey of literature data on gold and copper Drude parameters. Numerical values have been adopted to the writing of the Drude function given in Equation (2).
MetalReference ν p / cm 1 Γ D / cm 1
Cu[17]
[18]
59600
70660
36
385
Au[17]
[18]
[19]
[20]
[21]
72800
71710
72200
72590
69000
112
285
279
282
74
Table 3. Thickness and dispersion parameters of the gold films. Thickness data correspond to the samples on fused silica (Q1).
dQ1/nmνa/cm–1νb/cm–1J/cm–1Γ/cm−1α = βνp/cm–1ΓD/cm−1
FitXRREquation (9)
20.719.020.020,74083,340399,37020100.8571,530270
36.334.834.020,73086,610439,75017600.8774,000200
54.953.653.220,73087,740445,17017200.8774,260190
δ f 0.00040.050.110.160.020.040.36
Table 4. Thickness and dispersion parameters of the copper films. Thickness data correspond to the samples on fused silica (Q1).
dQ1/nmνa/cm–1νb/cm–1J/cm–1Γ/cm−1α = βνp/cm−1ΓD/cm−1
FitXRREquation (9)
12.310.311.817,77081,870312,61010200.9164,400460
20.117.018.417,85086,900326,5108200.8868,310360
26.221.723.917,84086,790325,9307700.8869,090340
39.334.335.317,84086,350310,0507200.8769,270280
61.350.052.717,82085,820274,4907100.8766,450240
δ f 0.0050.060.170.380.050.070.64
Table 5. Average values and standard deviations of the parameters of the thickest copper layer, as obtained from different fitting attempts.
dQ1/nmνa/cm–1νb/cm–1J/cm–1
59 ± 717,800 ± 4087,000 ± 15,000330,000 ± 130,000
Γ/cm–1α = βνp/cm−1ΓD/cm−1
680 ± 400.89 ± 0.0369,000 ± 7,000250 ± 30
Table 6. Parameters in the mean free path theory (Equation (11)).
Metal τ b 0 / fs Γ D , b 0 / cm 1 Γ D , b / cm 1 τ b / fs τ J C / fs [26] v F τ b 0 / nm v F τ b / nm δ/nm(1 − pspec)pspec
Cu3674197.413.56.939.915.016.50.550.45
Au27.397135.519.59.337.726.920.30.380.62

