1. Introduction
Zinc oxide (ZnO) is a semiconductor material characterized by a broadband gap (approx. 3.2–3.3 eV), a high transmission in the visible spectral range, a native n-type conductivity as well as by its excellent photoluminescence (PL) properties, which can be modified by the incorporation of impurities in its structure [
1,
2]. The PL emission of ZnO films presents essentially two peaks, in the UV and in the visible spectrum, at approximately 380 nm and in the 450–730 nm range, respectively. It is well-known that the degree of crystallinity of the films has a strong influence on the UV emission efficiency [
3,
4]. On the other hand, inherent defects in the material, such as zinc (Zn) or oxygen (O) interstitials or vacancies controlled by the method and growth conditions, determine the presence of PL emissions in the visible range [
2].
A subject that currently interests numerous researchers is the improvement of the optical and electrical behaviour of ZnO films with the incorporation of metals in its structure (Al, Ga, In, Ti, etc.), demanded from the point of view of new potential applications: transparent conductive contacts (TCOs), laser diodes including UV light emitting diodes, thin film transistors, mobile phones, microwave dielectrics, etc. [
5,
6,
7,
8]. Actually, n-type doping controlled by the incorporation of certain elements in the ZnO network is a recurrent method for tailoring both the bandwidth energy and electrical conductivity by increasing the concentration of carriers while keeping a high transparency in the visible range [
9]. Most of previous work on doped ZnO films is related to doping with group III elements (Al, Ga and In), while most recently, new studies have been conducted on quadrivalent dopants like titanium, which can provide two free electrons per atom to improve the conductivity of the ZnO host and to modify the photoresponse.
Furthermore, ZnO ceramic materials with a high Ti content have also been searched because of their applications in paint pigments, gas sensors, catalytic sorbents for removal of contaminants from hot coal gases (H
2S, As, etc.), photocatalytic splitting of water and degradation of organic compounds, as well as in anodes of Li-ion batteries, microwave devices and low-temperature co-fired ceramics [
10,
11].
For these reasons, the study of ZnO films with Ti atoms incorporated and the understanding of the Ti incorporation into the ZnO structure, either as dopant or in the form of a mixed oxide, are still under debate and constitute a very interesting challenge. To obtain Ti-incorporated ZnO (TZO) thin films, sputtering techniques have been reported in the literature [
12,
13,
14]. However, in most of the reports concerning sputtering techniques, RF magnetron sputtering and ZnO targets [
13] or ZnO:Ti targets [
14] were used. In the present project, we propose the deposition of ZnO:Ti thin films in a wide range of Ti atomic concentrations by the means of the reactive DC magnetron co-sputtering technique and by using two separate targets of pure Ti and Zn and no intentional heating. We already used this approach in a previous work [
12] for ultrathin films, and due to the excellent results, in terms of the range of %Ti that was incorporated in the films, we have applied the same methodology here. In our work [
12], our group explored the structural phase and composition of TZO ultrathin films (<40 nm) using X-ray absorption spectroscopy (XANES) and Rutherford Backscattering Spectroscopy (RBS). TZO films with an increasing Ti content show a gradual transition from the typical tetrahedral coordination for titanium atoms at lower contents (<3 at.%) to the octahedral coordination for higher contents (up to 22 at.%) with a hexagonal ZnTiO
3-like structure.
In order to further investigate the effect of Ti addition on the properties of sputtered ZnO films, we present, in this work, the structural and optical characterization of thicker TZO films (approx. 200 nm) and their evolution with the titanium content. The crystalline structure determined by low angle X-ray diffraction, observing how the highly oriented deposits grown with a preferential (002) direction of the original w-ZnO structure, is affected by the incorporation of titanium. The composition of the films has been obtained from RBS, while the oxidation state of incorporated Ti atoms to the ZnO structure has been examined by X-ray photoelectron spectroscopy (XPS). The surface morphology of the samples has been observed by scanning electron microscopy (SEM). In addition, the variation in the optical properties (transmittance and optical band gap) with the Ti content has been measured by ultraviolet-visible (UV-Vis) spectrophotometry, observing an improvement in the transparency at low wavelengths when titanium is substitutionally incorporated in the ZnO lattice. The presence of defects (excitons) has been also analysed by photoluminescence (PL) measurements.
2. Materials and Methods
TZO films have been deposited on both (100)-oriented silicon samples (resistivity > 6000 Ω·cm) and Corning glass slides, by reactive magnetron co-sputtering in an argon atmosphere with 20% oxygen and a total constant gas flow of 30 sccm. Two independent cathodes (Ti and Zn) fed with different DC power were used to control the Ti/Zn relative content in the films. All the samples were prepared after the complete poisoning of both cathodes. No intentional heating was applied during deposition, though the measured substrate temperature was approx. 90 °C.
Table 1 shows the power applied in the Zn and Ti cathode sources (
PZn and
PTi, respectively). The deposition time was adjusted to obtain in all samples a thickness of 200 nm except in the sample deposited at the lowest
PZn power (Zn/Ti-10/100) due to the low sputtering rate of Ti (approx. 4 times lower than Zn). The thickness of the layers was determined by profilometry (Veeco, model Dektak 150, Plainview, NY, USA).
The chemical composition of the films was obtained by RBS with the 5 MV HVEE Tandetron accelerator at the Autonomous University of Madrid. These experiments were performed using He
+ ions of 3.035 MeV, corresponding to the resonance of oxygen atoms and thus improving the oxygen atoms sensitivity. The chemical composition values have been extracted using the RBX software [
15].
The crystalline structure of the TZO films with different Ti contents was identified by X-ray diffraction with the Bragg–Brentano configuration (Siemens D 5000, Berlin, Germany, with Cu anode, Kα radiation = 1.54178 Å). A low incidence angle (0.7°) was used to obtain the preferred orientation of the crystals.
An XPS analysis were carried out in an ultrahigh vacuum system (residual pressure approx. 8 × 10⁻⁸ Pa) equipped with a hemispheric analyser (SPECS Phoibos 100 MCD-5, Berlin, Germany). The pass energy was 9 eV, giving a constant resolution of 0.9 eV. A twin anode (Al–Mg) X-ray source was operated at a constant power of 300 W, using the Mg Kα (1253.6 eV) radiation. The Au 4f7/2, Ag 3d5/2 and Cu 2p3/2 lines at 84.0, 368.3 and 932.7 eV, respectively, of the reference samples were chosen for the calibration of the binding energy (BE). The possible charging effects produced during XPS measurements were corrected using as reference the BE of the C 1s peak (285 eV) due to the adventitious C.
The optical characteristics (transmittance) and energy gap, Eg, have been obtained from optical spectrophotometry in the wavelength range from 300 to 2000 nm using a SolidSpec-3700 spectrophotometer (Shimadzu Corp., Kyoto, Japan). In order to assess the effect of Ti addition in the ZnO matrix, PL measurements were also carried out using a Labram system, model HR800 UV, provided with a He–Cd laser (325 nm) and a diffraction grating of 150 lines/mm with 40× lenses.
SEM images of the surface morphology of ZnO films with different Ti contents were obtained with a Philips XL30 SFEG system (Amsterdam, The Netherlands).
3. Results and Discussion
3.1. Film Composition and RBS Analysis
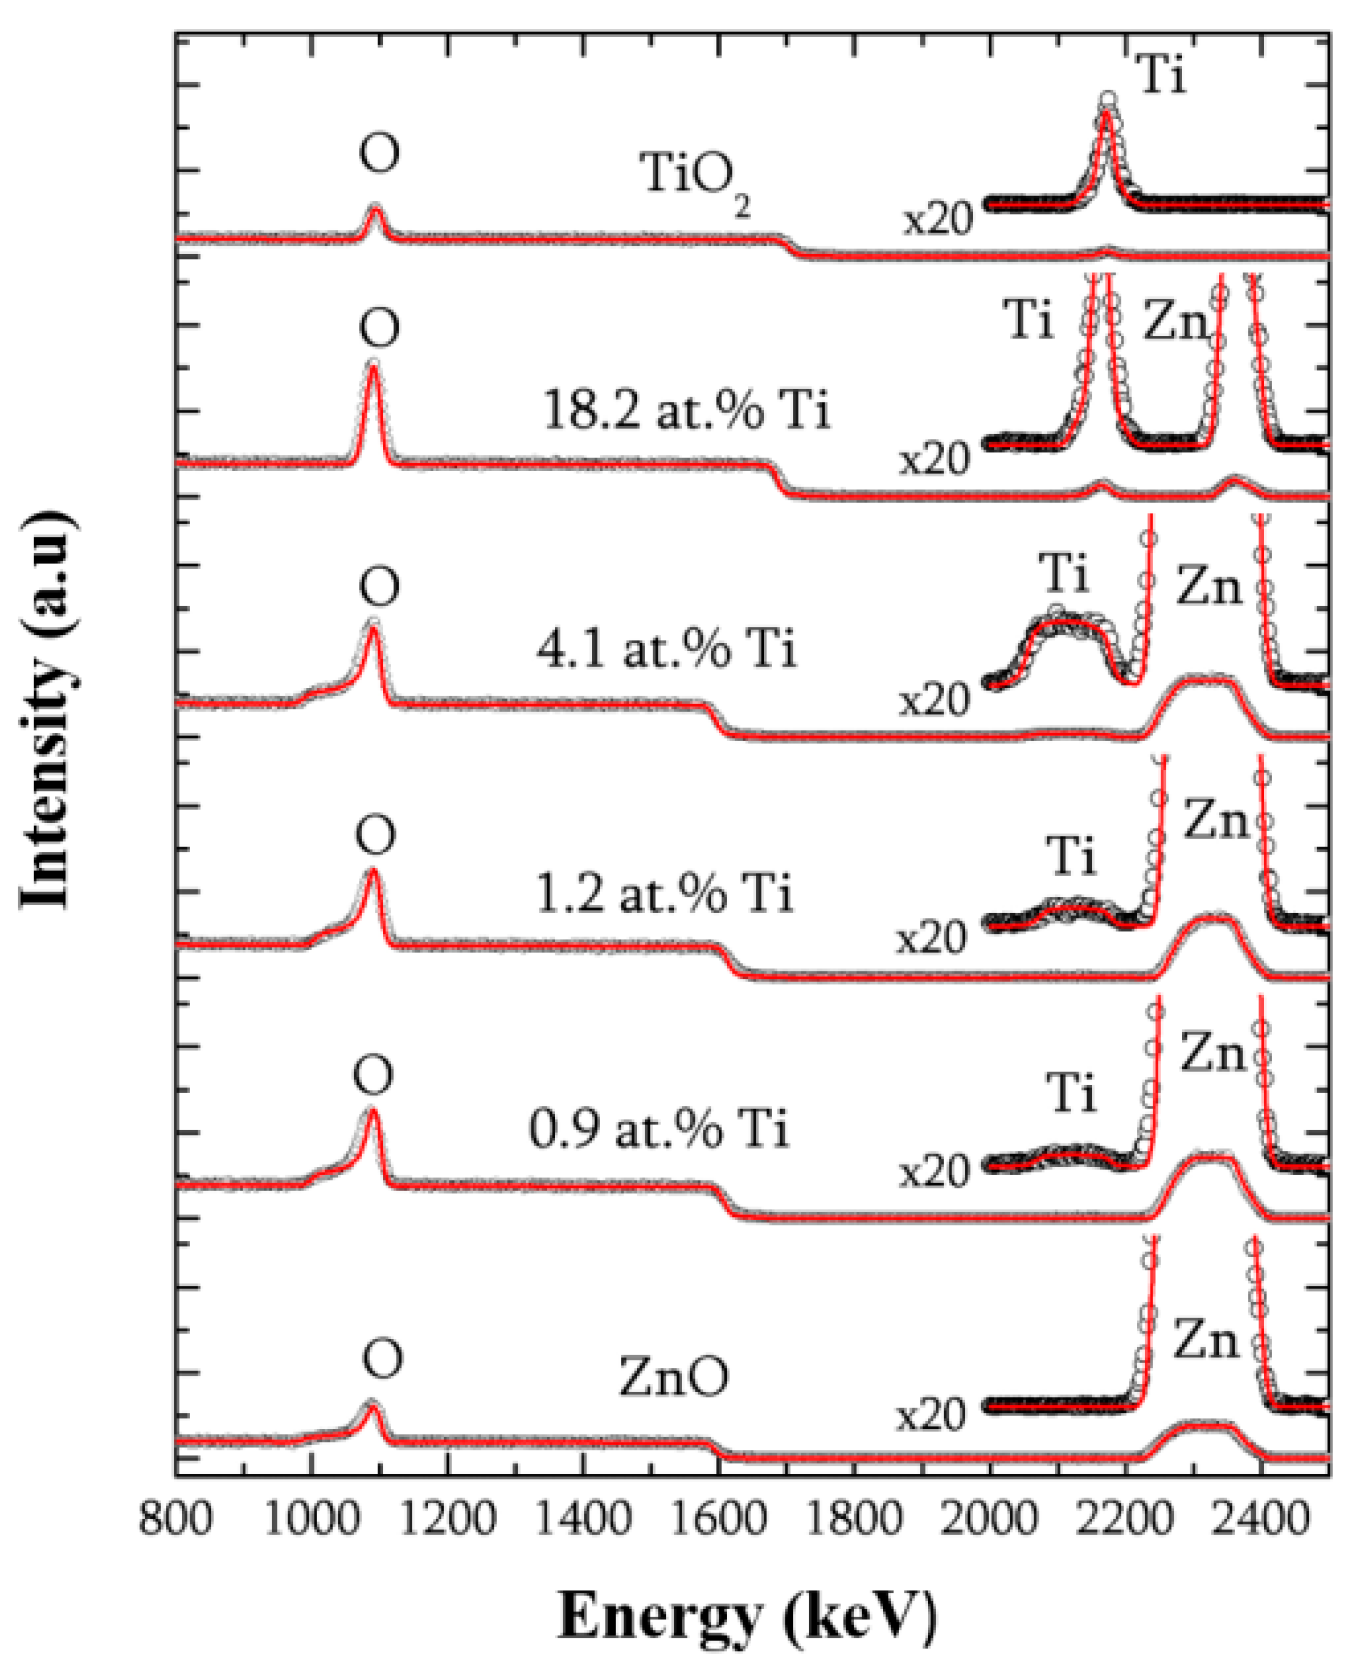
Figure 1 shows both the experimental and the fitted RBS spectra of the series of TZO samples, including pure ZnO and TiO
2 reference films. A zoom (×20) of the energy zone between 2000 and 2500 keV is also attached to the spectra to better observe the metal signal. An excellent fitting of the experimental spectra was obtained by assuming a single layer of Zn–Ti–O on the silicon substrate. The results indicate a good quality of the substrate-film interface (within an estimated resolution about 5 nm), thus confirming that the composition of the layer is very homogeneous throughout the whole thickness.
The density of the films (
Table 1) was calculated from the RBS curves using the film thicknesses obtained by profilometry. It decreases as the Ti incorporation increases from the reference value for ZnO (5.6 g/cm
3) to the density of the pure TiO
2 sample (3.8 g/cm
3). This is a consequence of the lower atomic mass of Ti (22 amu) as compared to Zn (30 amu), as far as the titanium is incorporated substitutionally in the ZnO structure, as discussed below.
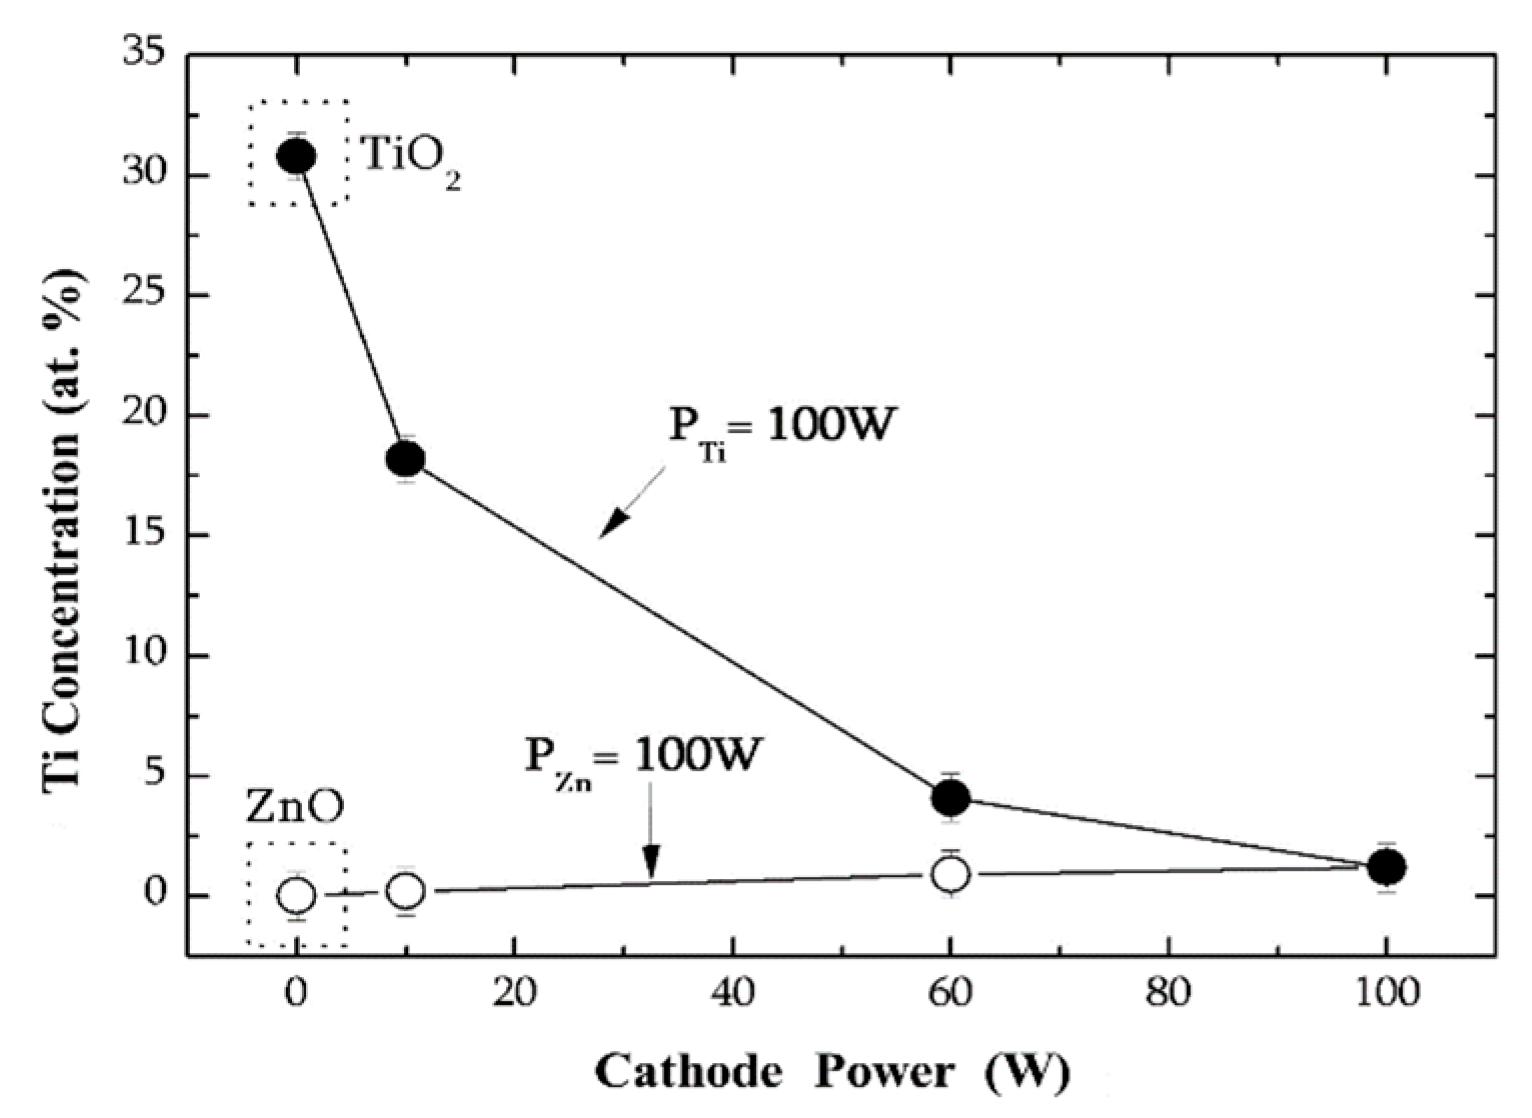
Figure 2 gives the variation of the composition of the TZO films as a function of the power applied to one of the cathodes (either Zn or Ti), keeping constant the other at 100 W. According to the data in
Table 1, in the samples deposited with a fixed power in the Ti cathode,
PTi = 100 W, the Ti content decreases abruptly from 30.8 at.% (pure TiO
2) to 1.2 at.% as the power in the Zn source is increased. Conversely, in the samples deposited with a constant power of the Zn cathode,
PZn = 100 W, the Ti content takes lower values from 0 (pure ZnO sample) to 1.2 at.%. Apart from the other factors, this effect is a consequence of the larger sputtering yield of Zn as compared with that of Ti. Thus, the use of two independent sputtering sources allows a wide range of compositions in the TZO films to be obtained.
3.2. Crystalline Structure
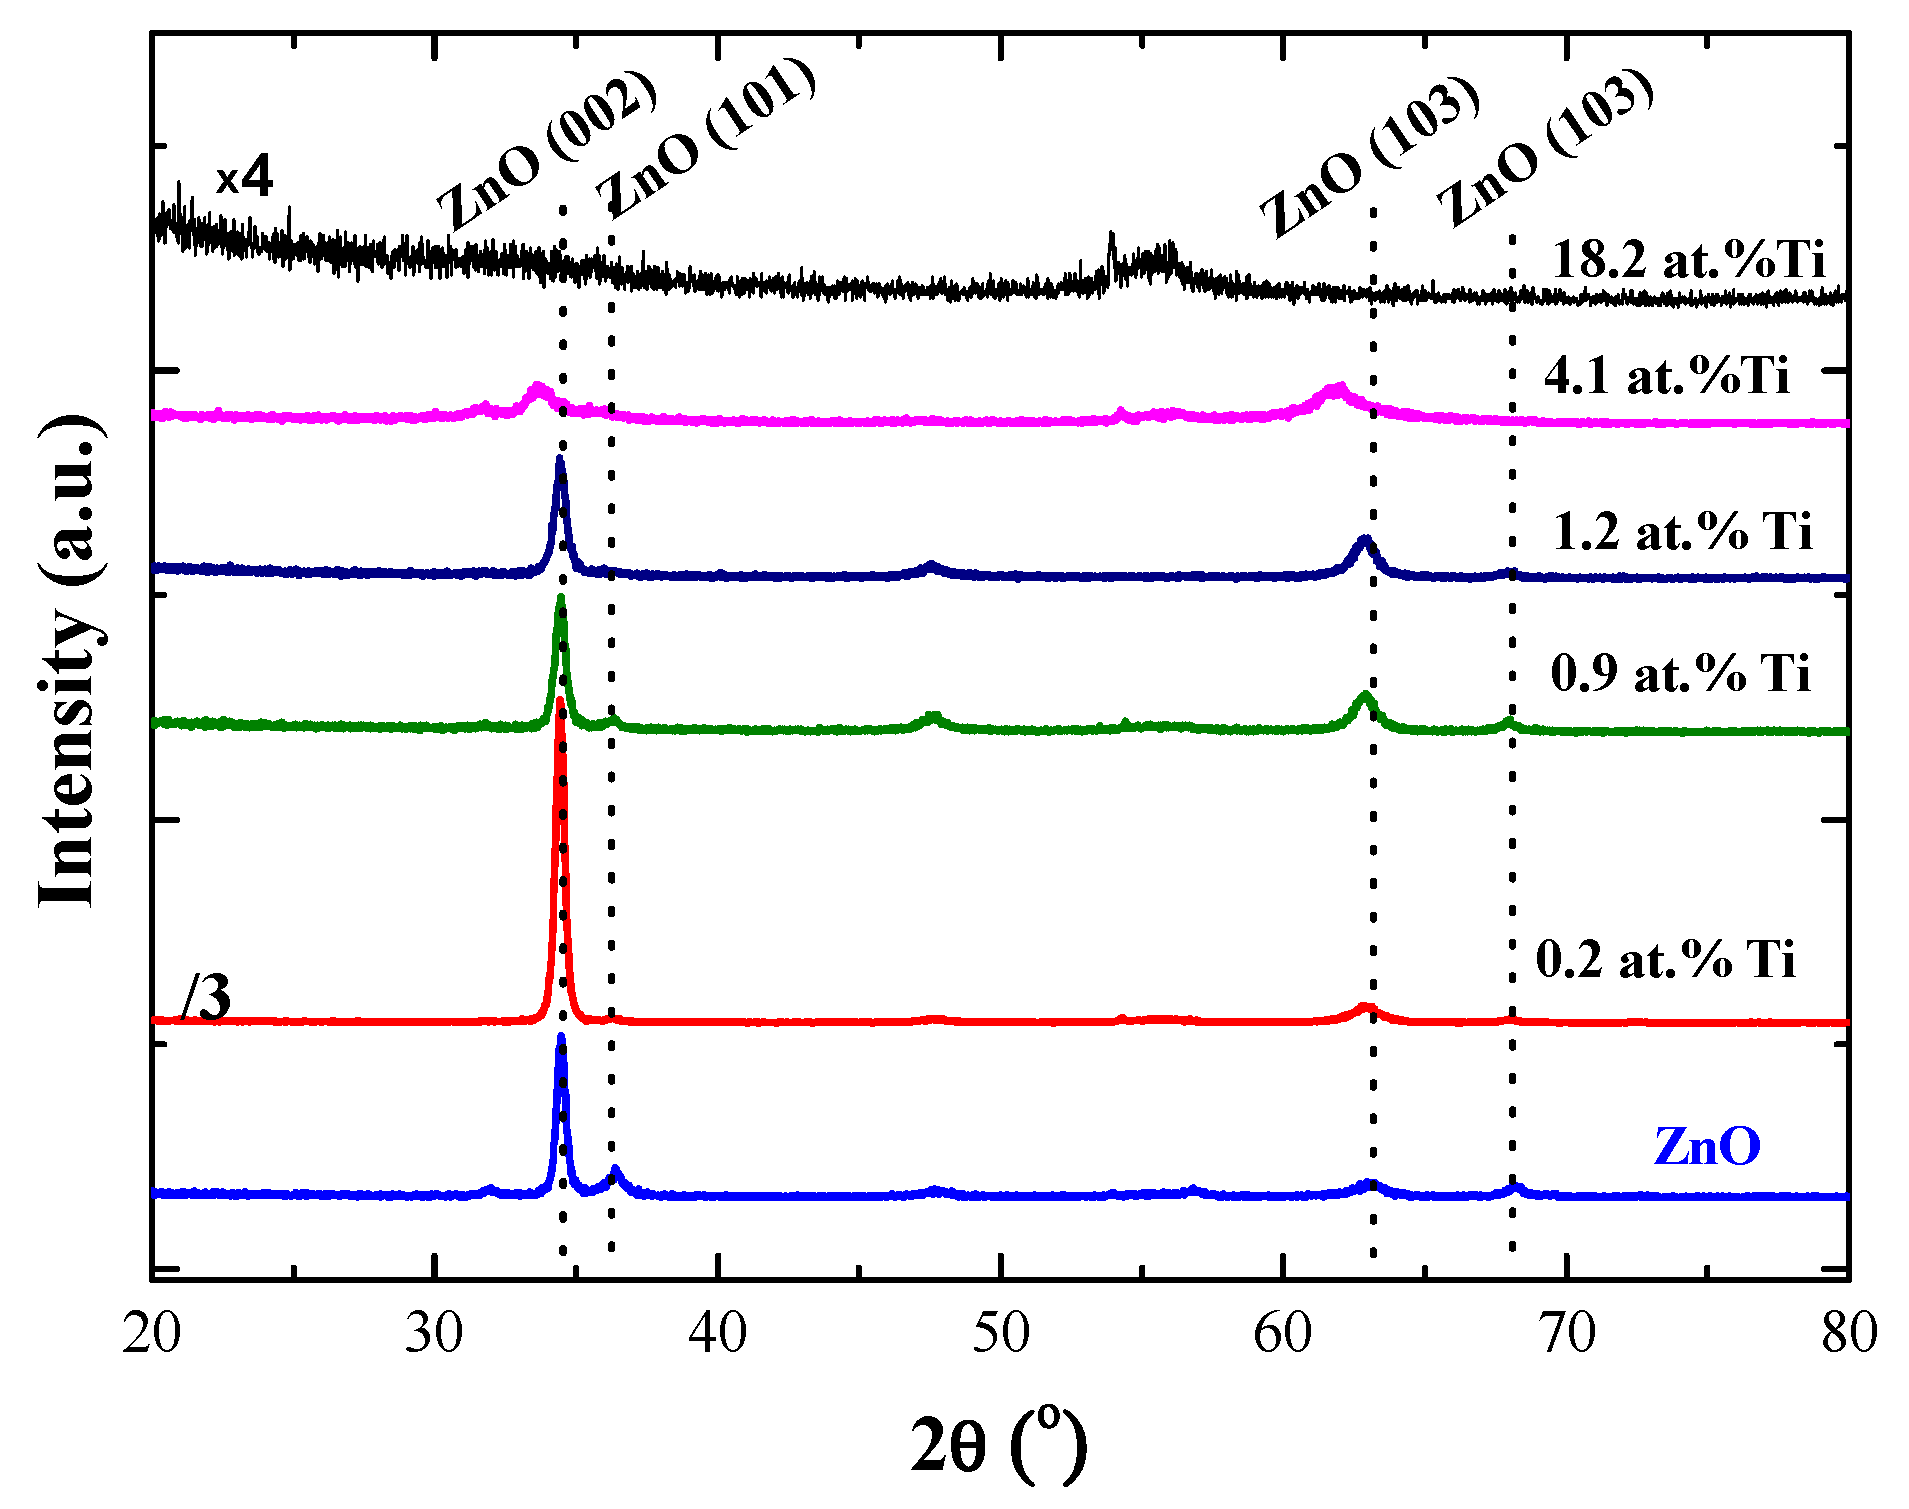
Figure 3 shows the X-ray spectra obtained for the samples disclosed in
Table 1. As can be observed, a pure ZnO sample grown as a reference presents the typical polycrystalline hexagonal wurtzite structure with a (002) preferential orientation. The samples deposited with the lowest power applied to the Ti cathode (10 W), resulting in a Ti concentration of 0.2 at.%, show a peak centred in the position corresponding to the plane (002) of the ZnO but with much higher intensity than that obtained for the reference ZnO sample (note that the intensity of the spectrum is divided by a factor of 3). In addition, no TiO
2 peaks were detected. These results indicate that the Ti atoms are incorporated as a dopant (electron donor) in the wurtzite structure, substituting the zinc atoms in the ZnO lattice and significantly improving the crystallinity of the doped ZnO sample. This interpretation is consistent with the smaller radius of Ti
4+ (0.068 nm) as compared to the Zn
2+ radius (0.074 nm) [
7,
16].
However, when the titanium concentration increases above 1.2 at.%, the intensity of the (002) peak decreases and widens, suggesting a progressive amorphization of the sample [
16]. This is more apparent in the TZO samples with 4.1 at.% Ti, where the ZnO peaks suffer a shift towards lower diffraction angles. This fact has been explained by the compressive stress generated in the direction parallel to the surface, which induces an increase in the interplanar spacing, eventually leading to the peak displacement at lower angles, as detected in
Figure 3 [
16,
17]. However, the presence of some zinc titanate crystallites cannot be discarded [
18].
The loss of crystallinity when the amount of Ti atoms increases above a certain level has also been interpreted as a result of the intense flux of sputtered Ti atoms on the sample surface during the film growth [
17]. Thus, the film with the highest Ti concentration (18.2 at.%) is completely amorphous, not showing any crystalline planes associated with ZnO. However, these amorphous samples could keep a certain atomic bonding structure with an octahedral coordination typical of titanate phases (ilmenite), as we previously reported in Caretti et al. [
12] for ultrathin TZO samples (<40 nm) with a high Ti content (>18 at.%).
3.3. XPS Analysis
XPS measurements were performed on selected TZO films to obtain a qualitative analysis of the chemical oxidation state of the elements in the compound.
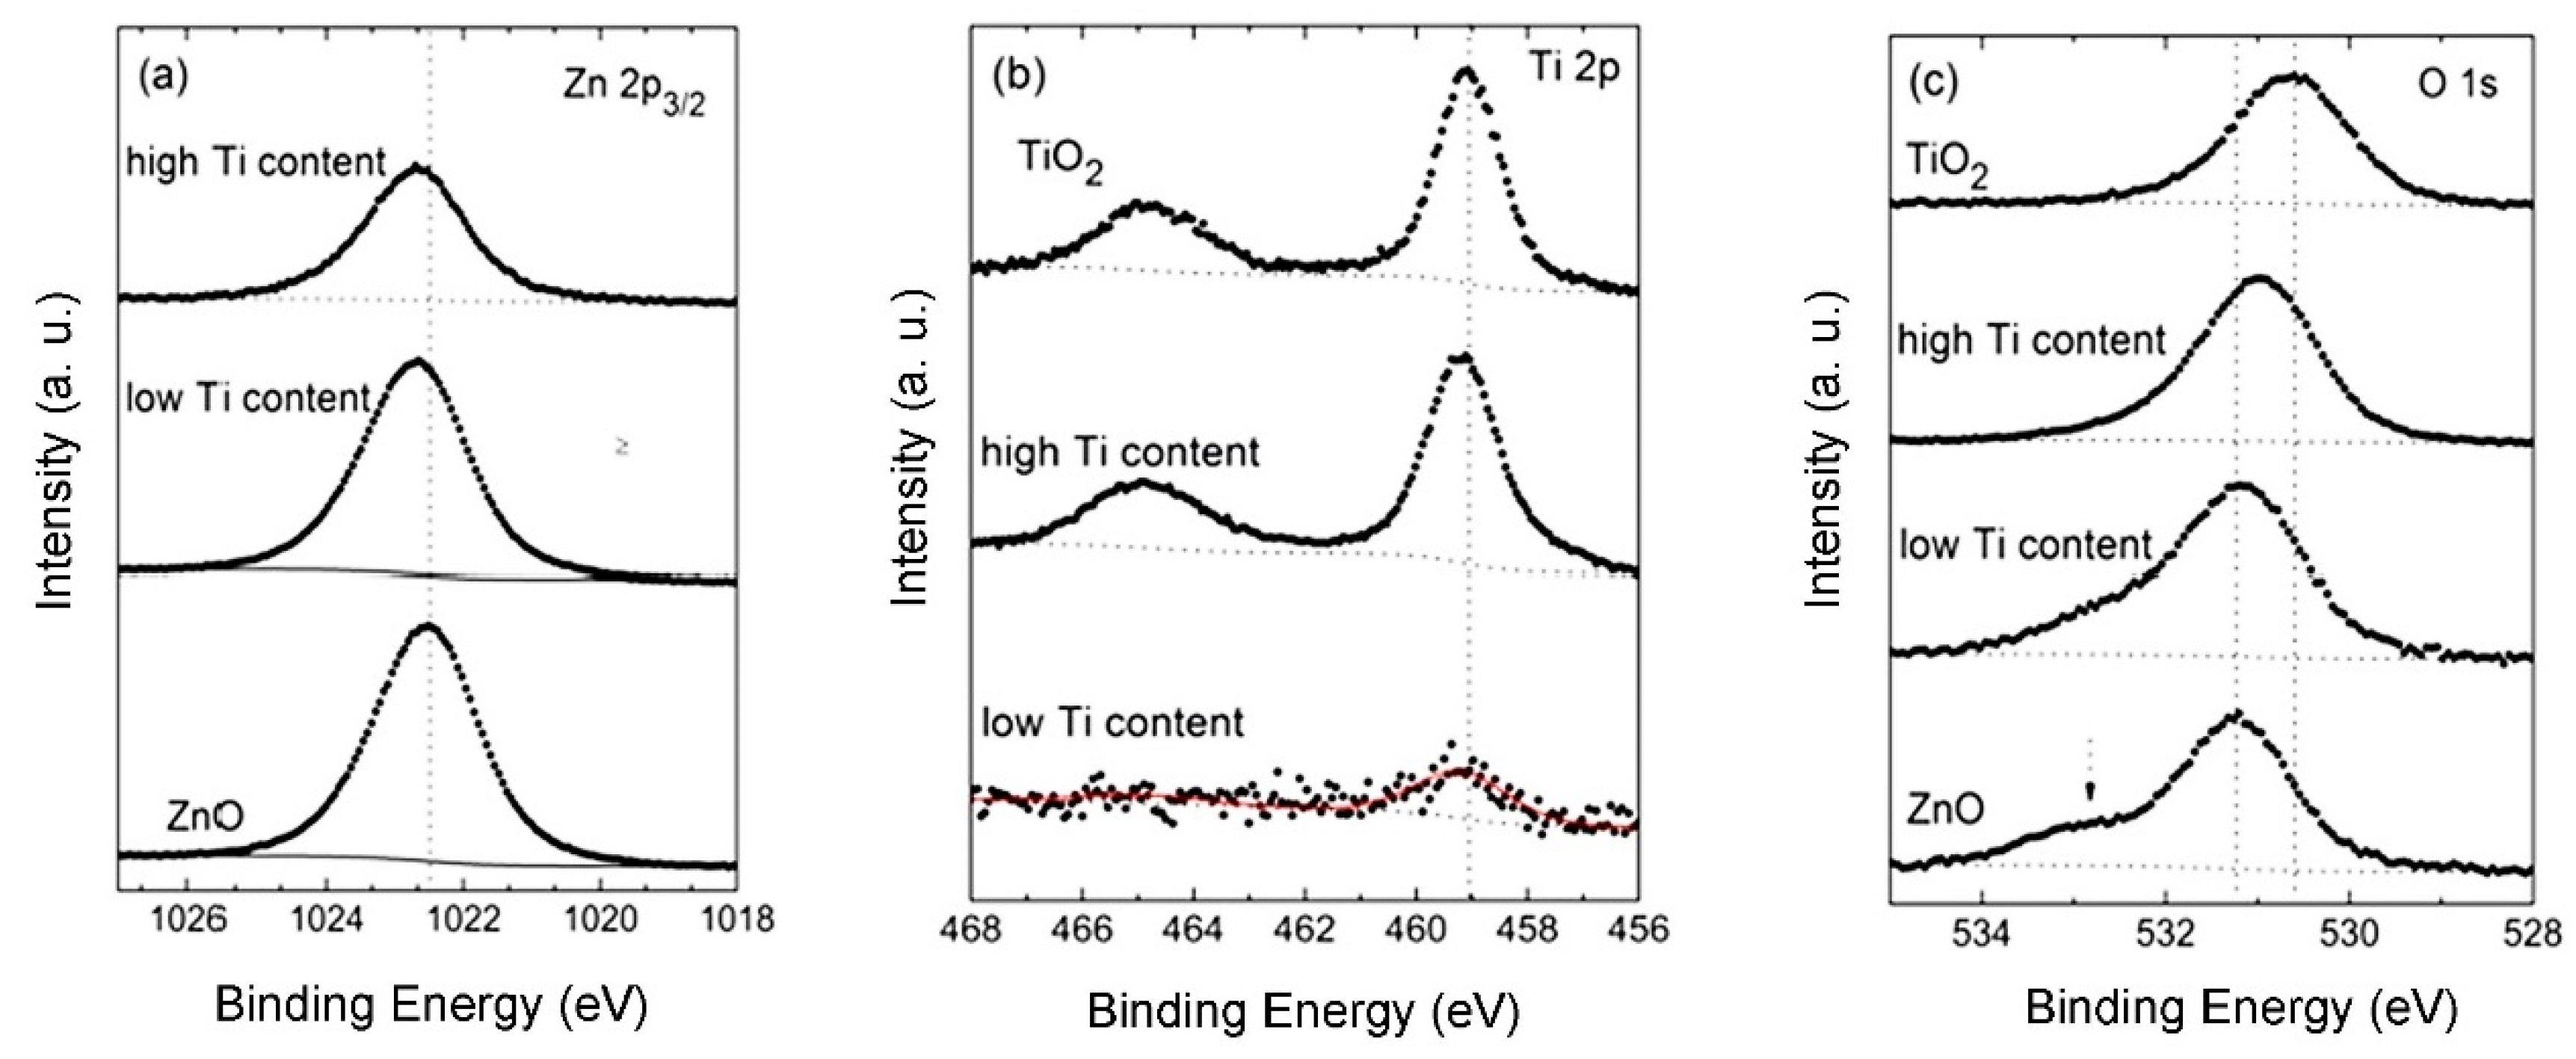
Figure 4 depicts detailed windows for the Zn 2
p3/2, O 1
s and Ti 2
p levels of the analysed samples: pure ZnO and TiO
2 reference films, along with samples with low (0.9 at.%) and high Ti contents (≥18 at.%). As can be observed in
Figure 4a, the Zn 2
p3/2 spectrum of the ZnO films displays a peak at 1022.5 eV (vertical dotted line) characteristic for ZnO bonds, which slightly shifts (approx. 0.2 eV) to the high BE side once Ti is detected in the network, implying that the nature of the link between Zn and O atoms has been slightly modified.
Similarly,
Figure 4b shows the Ti 2
p doublet for the TiO
2 reference film (upper part) with a main peak at 459.1 eV and a spin-orbit splitting of approx. 5.7 eV that can be attributed to Ti–O bonds [
19]. Those peaks shift approx. 0.2 eV to the high BE side with decreasing Ti contents in the films. In addition, the signals of Ti for the TZO samples are detected with a very low intensity for both levels, 2
p3/2 and 2
p1/2, characteristic of the doublet TiO
2.
As for the O 1
s peak of the ZnO reference film,
Figure 4c displays a main peak at 531.2 eV that can be attributed to Zn–O bonds and a shoulder at approx. 1.6 eV above the main peak that has been attributed to oxygen-defect sites related to oxygen vacancies in the matrix [
18]. It is worth noting that the shoulder disappears and that the main peak shifts to 530.6 eV with increasing Ti contents. The gradual shift of the Ti 2
p doublet to the high BE side and the fact that the O 1
s BE is somewhere between those of TiO
2 and ZnO indicates that Ti–O bonds are more ionic than in pure TiO
2, pointing to the formation of Ti–O–Zn mixed oxides instead of the formation of single oxide phases as reported before for the Ti–O–Si system [
20,
21].
3.4. SEM Observations
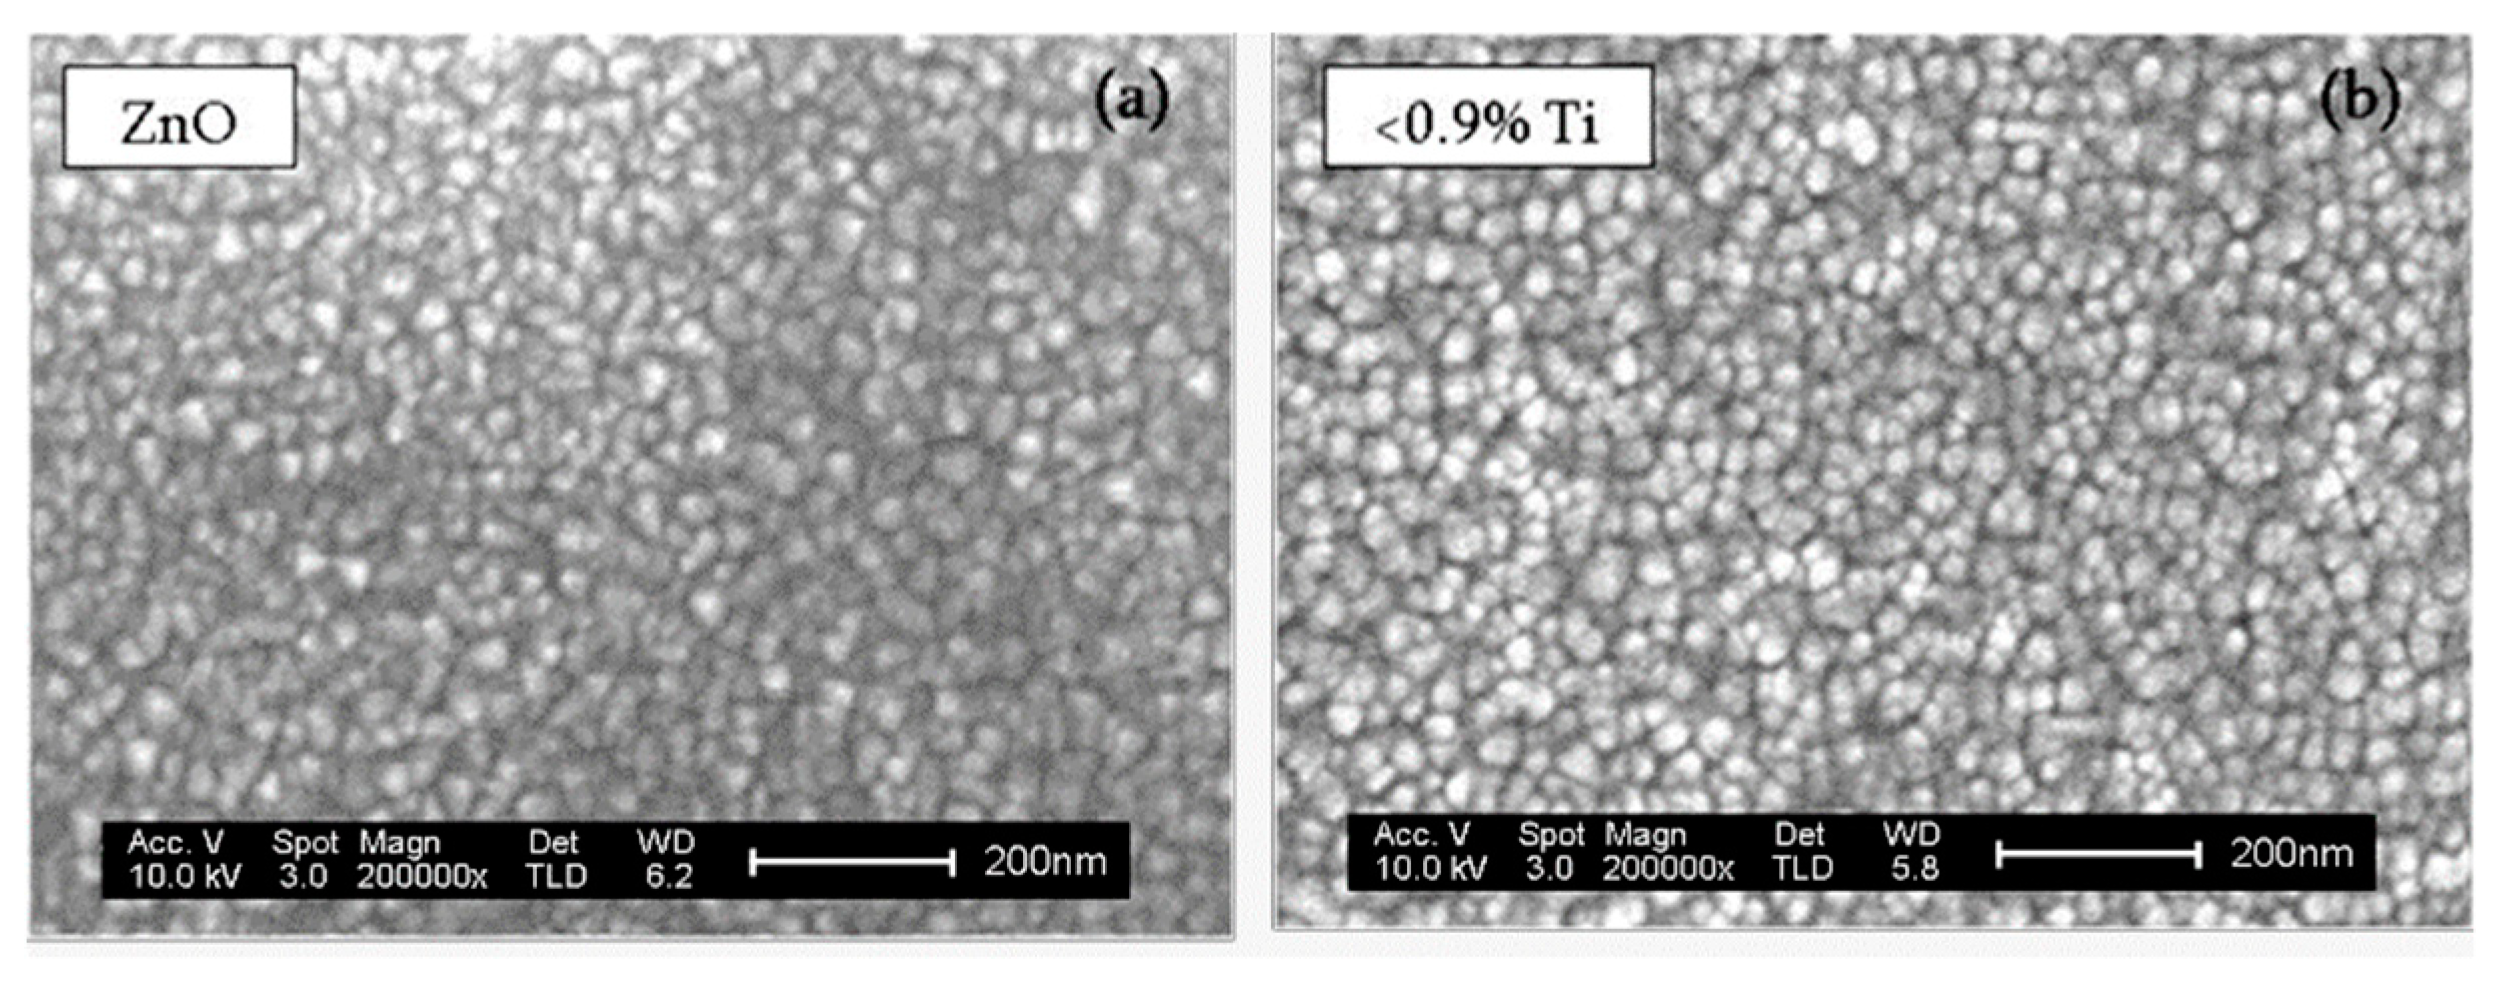
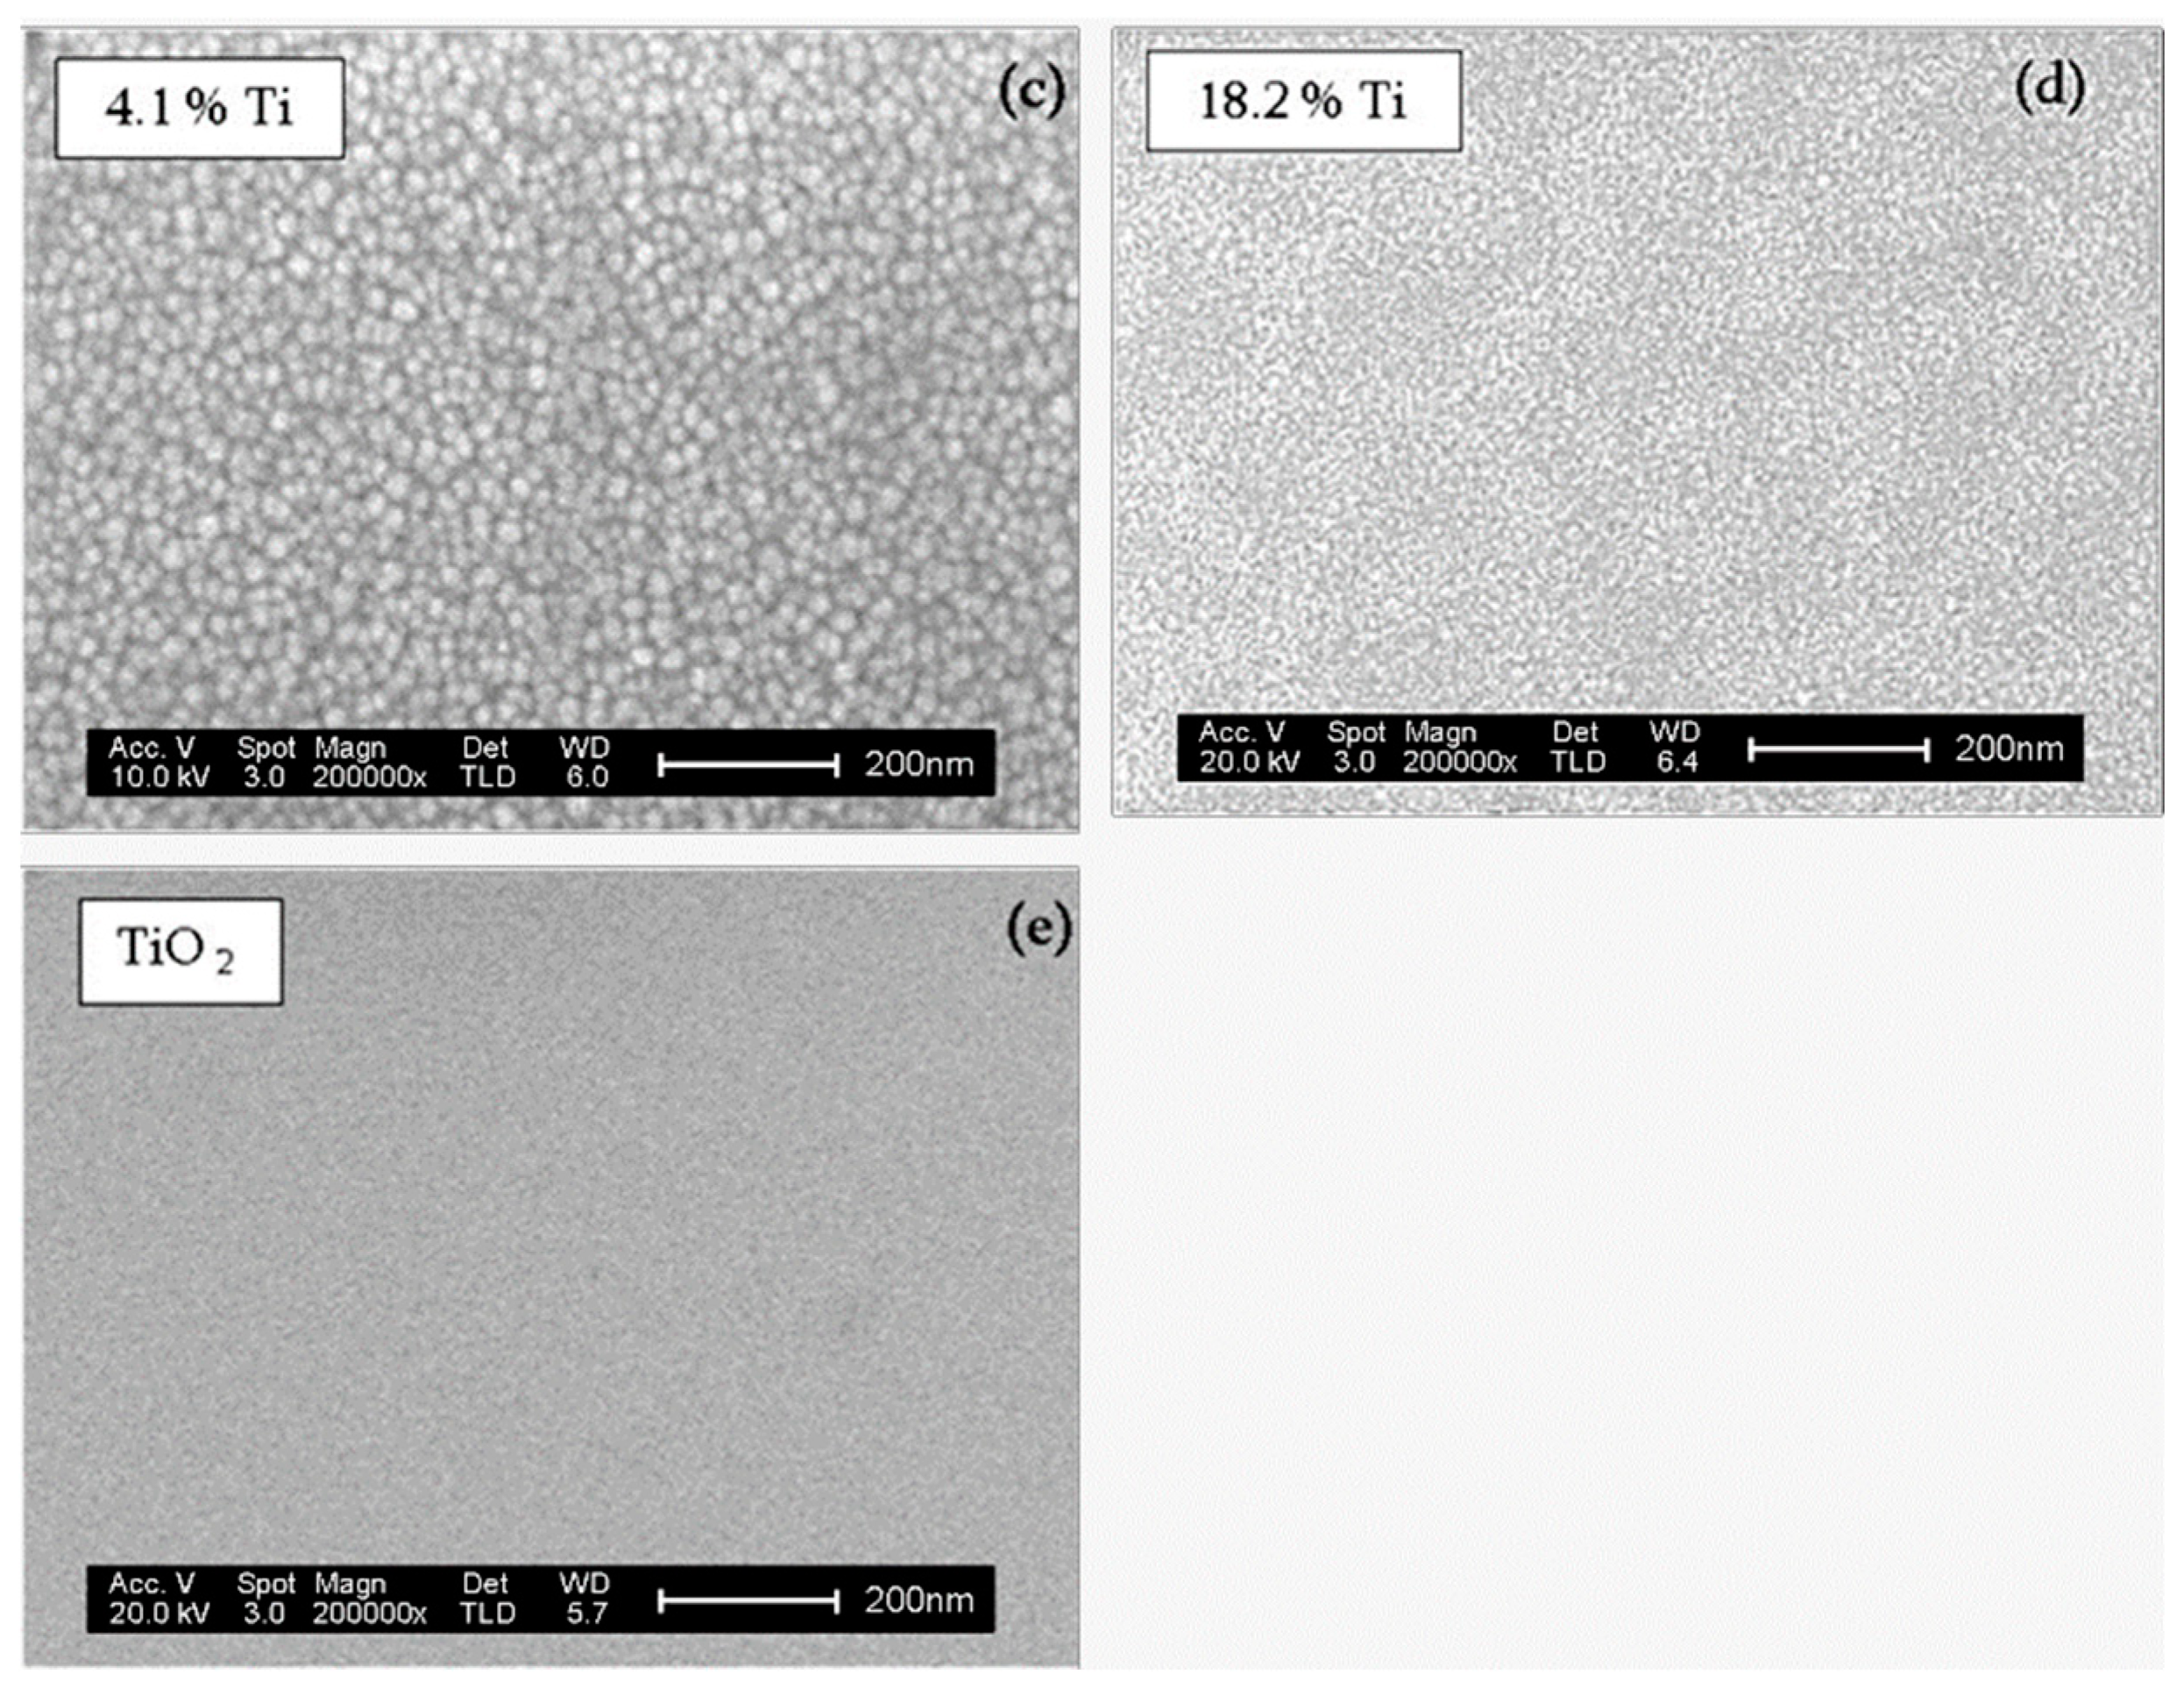
Figure 5a shows the SEM image of the surface of as-deposited pure ZnO films, made of inhomogeneous polycrystalline grains, according to the XRD results (
Figure 3). The incorporation of a small amount of Ti (0.2 at.%) in the ZnO structure (
Figure 5b) does not produce significant differences in the morphology of the sample with respect to the initial ZnO films, though the distribution of grains is more homogeneous all over the surface. This confirms that the low doping of ZnO induces the film growth with more aligned and ordered crystalline structures than that of pure ZnO films. As the concentration of Ti in the sample increases (4.1 at.%), seen in
Figure 5c, the grain size decreases and, most notably, in the case of films with 18.2 at.% of Ti (
Figure 5d), where the grain boundaries are barely appreciated. The surface morphology in these high Ti coatings is close to that of those observed in as-deposited TiO
2 films (
Figure 5e) that are fully amorphous [
22,
23], which is in agreement to the findings of Mullerova et al. [
18].
Summarizing these observations, along with the structure and composition data obtained by RBS, XRD, XPS and SEM, including previous XANES results [
12], one can classify the sputtered TZO coatings in three compositional groups with different properties:
Films with a low Ti content (<0.9 at.%), exhibit a highly crystalline wurtzite-like structure, where the Ti4+ ions are incorporated into the ZnO structure by substituting the Zn atoms, thus forming crystalline Ti-doped ZnO films.
TZO films with a medium Ti content (up to 4.1 at.%) show a wurtzite structure which becomes amorphous with increasing Ti content.
TZO films with a high Ti content (18.2 at.%) display a fully amorphous structure with a predominance of the Ti–O–Zn oxides (probably ilmenite type) and a minor content of wurtzite.
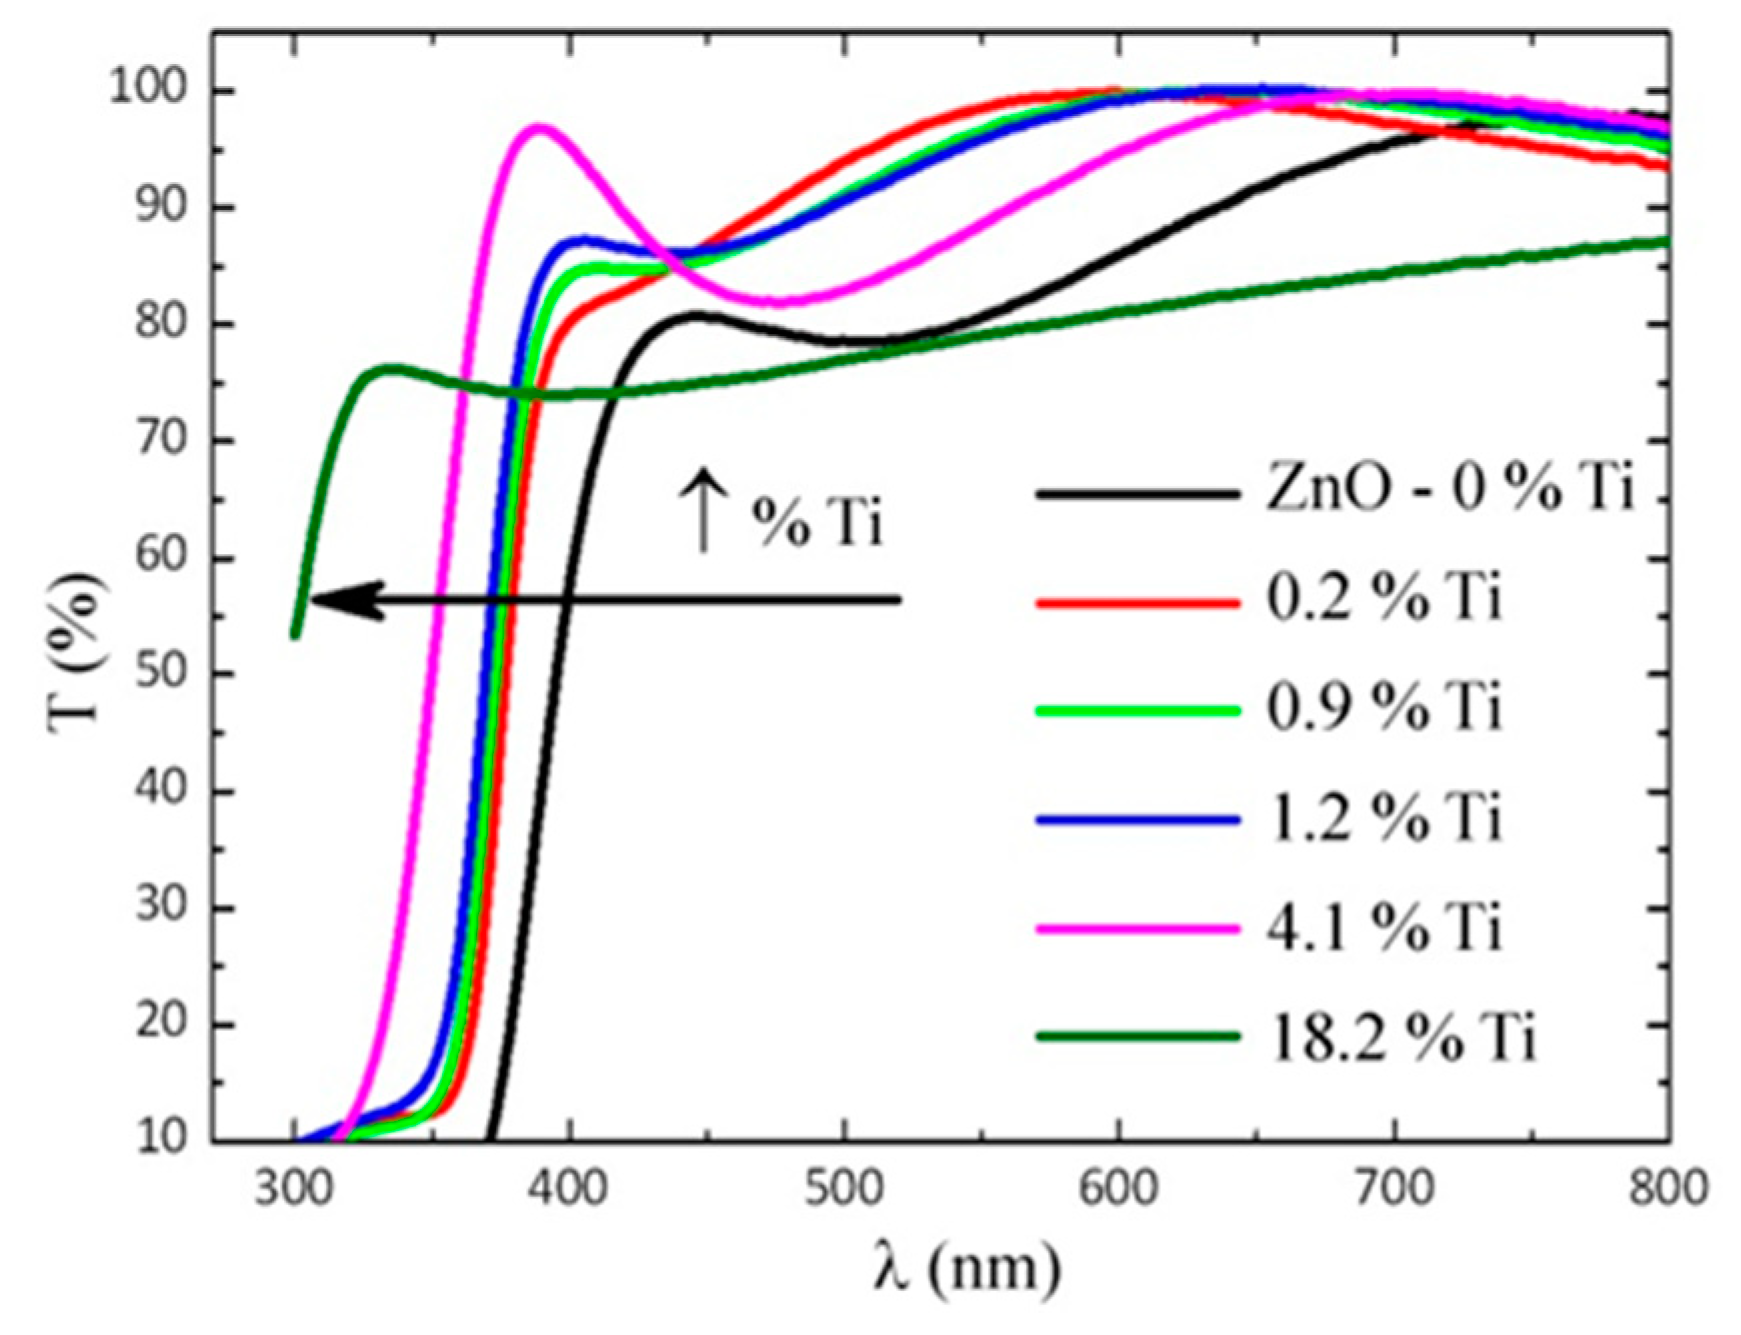
3.5. Optical Properties
Figure 6 shows the transmittance spectra obtained for the TZO samples with different Ti contents. We also included the spectrum of a stoichiometric ZnO film. As can be observed, the samples present a high transparency (approx. 80%) in the wavelength range 400–800 nm, except for the layers with a high Ti concentration (18.2 at.%), which the transmittance of is significantly lower. As stated above, this sample shows an amorphous structure, made of a mixture of Ti–O–Zn oxides of a very small column size. According to some authors, the presence of Ti–O aggregates in these films might reduce the transmission of light in the visible range as a consequence of the light scattering losses associated to a high density of grain boundaries [
16]. Diffuse transmittance experiments would be needed to confirm this hypothesis. However, such experiments are beyond the scope of this work. In any case, the absorption edge of samples with a Ti content of ≤4.1% is shifted to lower wavelengths for increasing Ti concentrations, as seen in the
Figure 6.
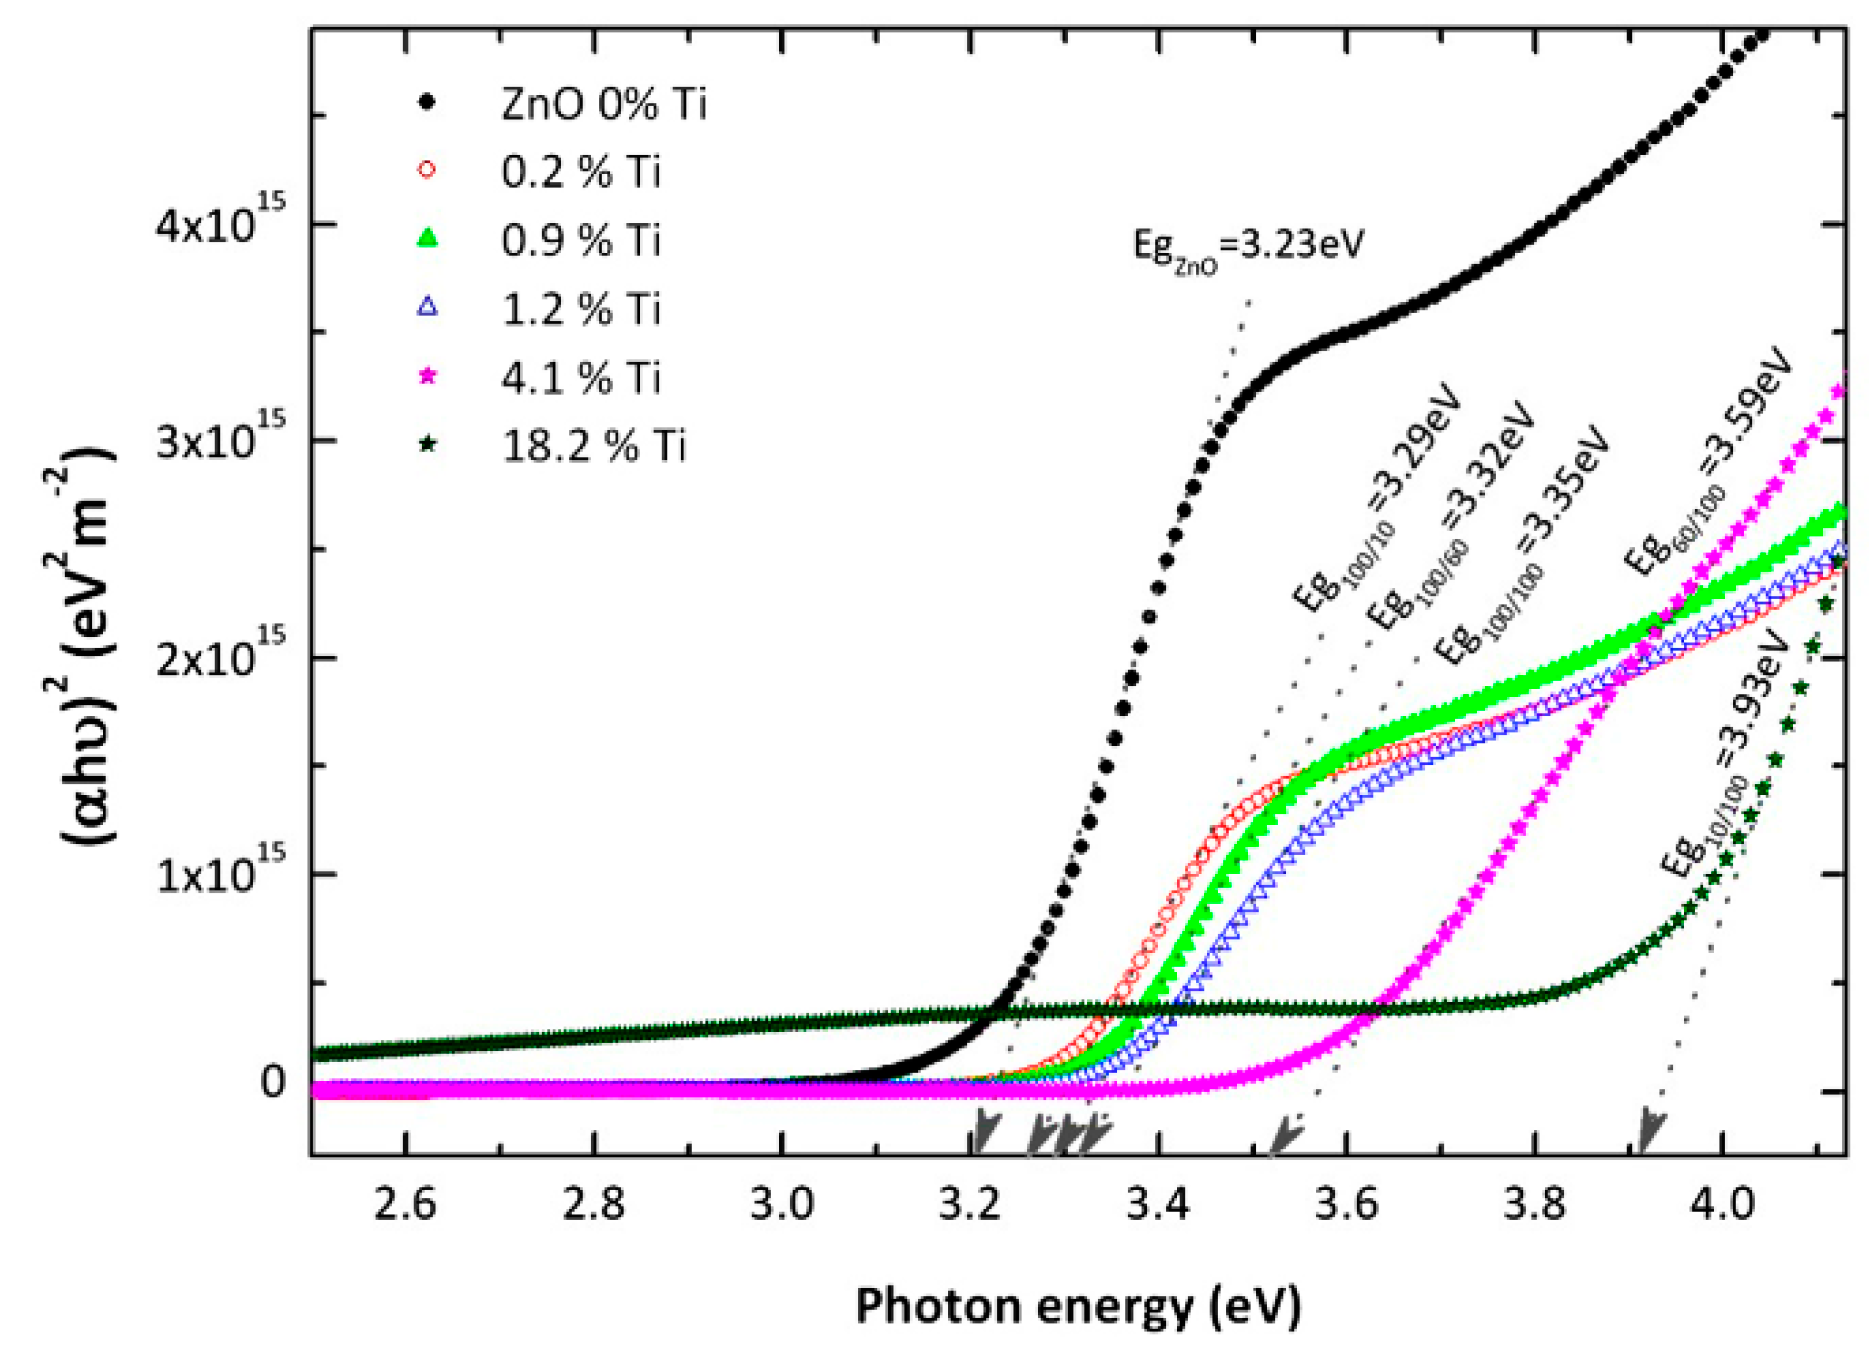
From the above results, the optical behaviour has been analysed in more detail in terms of the calculated absorption coefficient, α, of the samples. An adequate fitting of the (α
hν)
n values with
n = ½ or 2 allows one to identify the type of electronic transitions across the bandgap (either indirect or direct, respectively) in the light absorption process.
Figure 7 depicts the (α
hν)
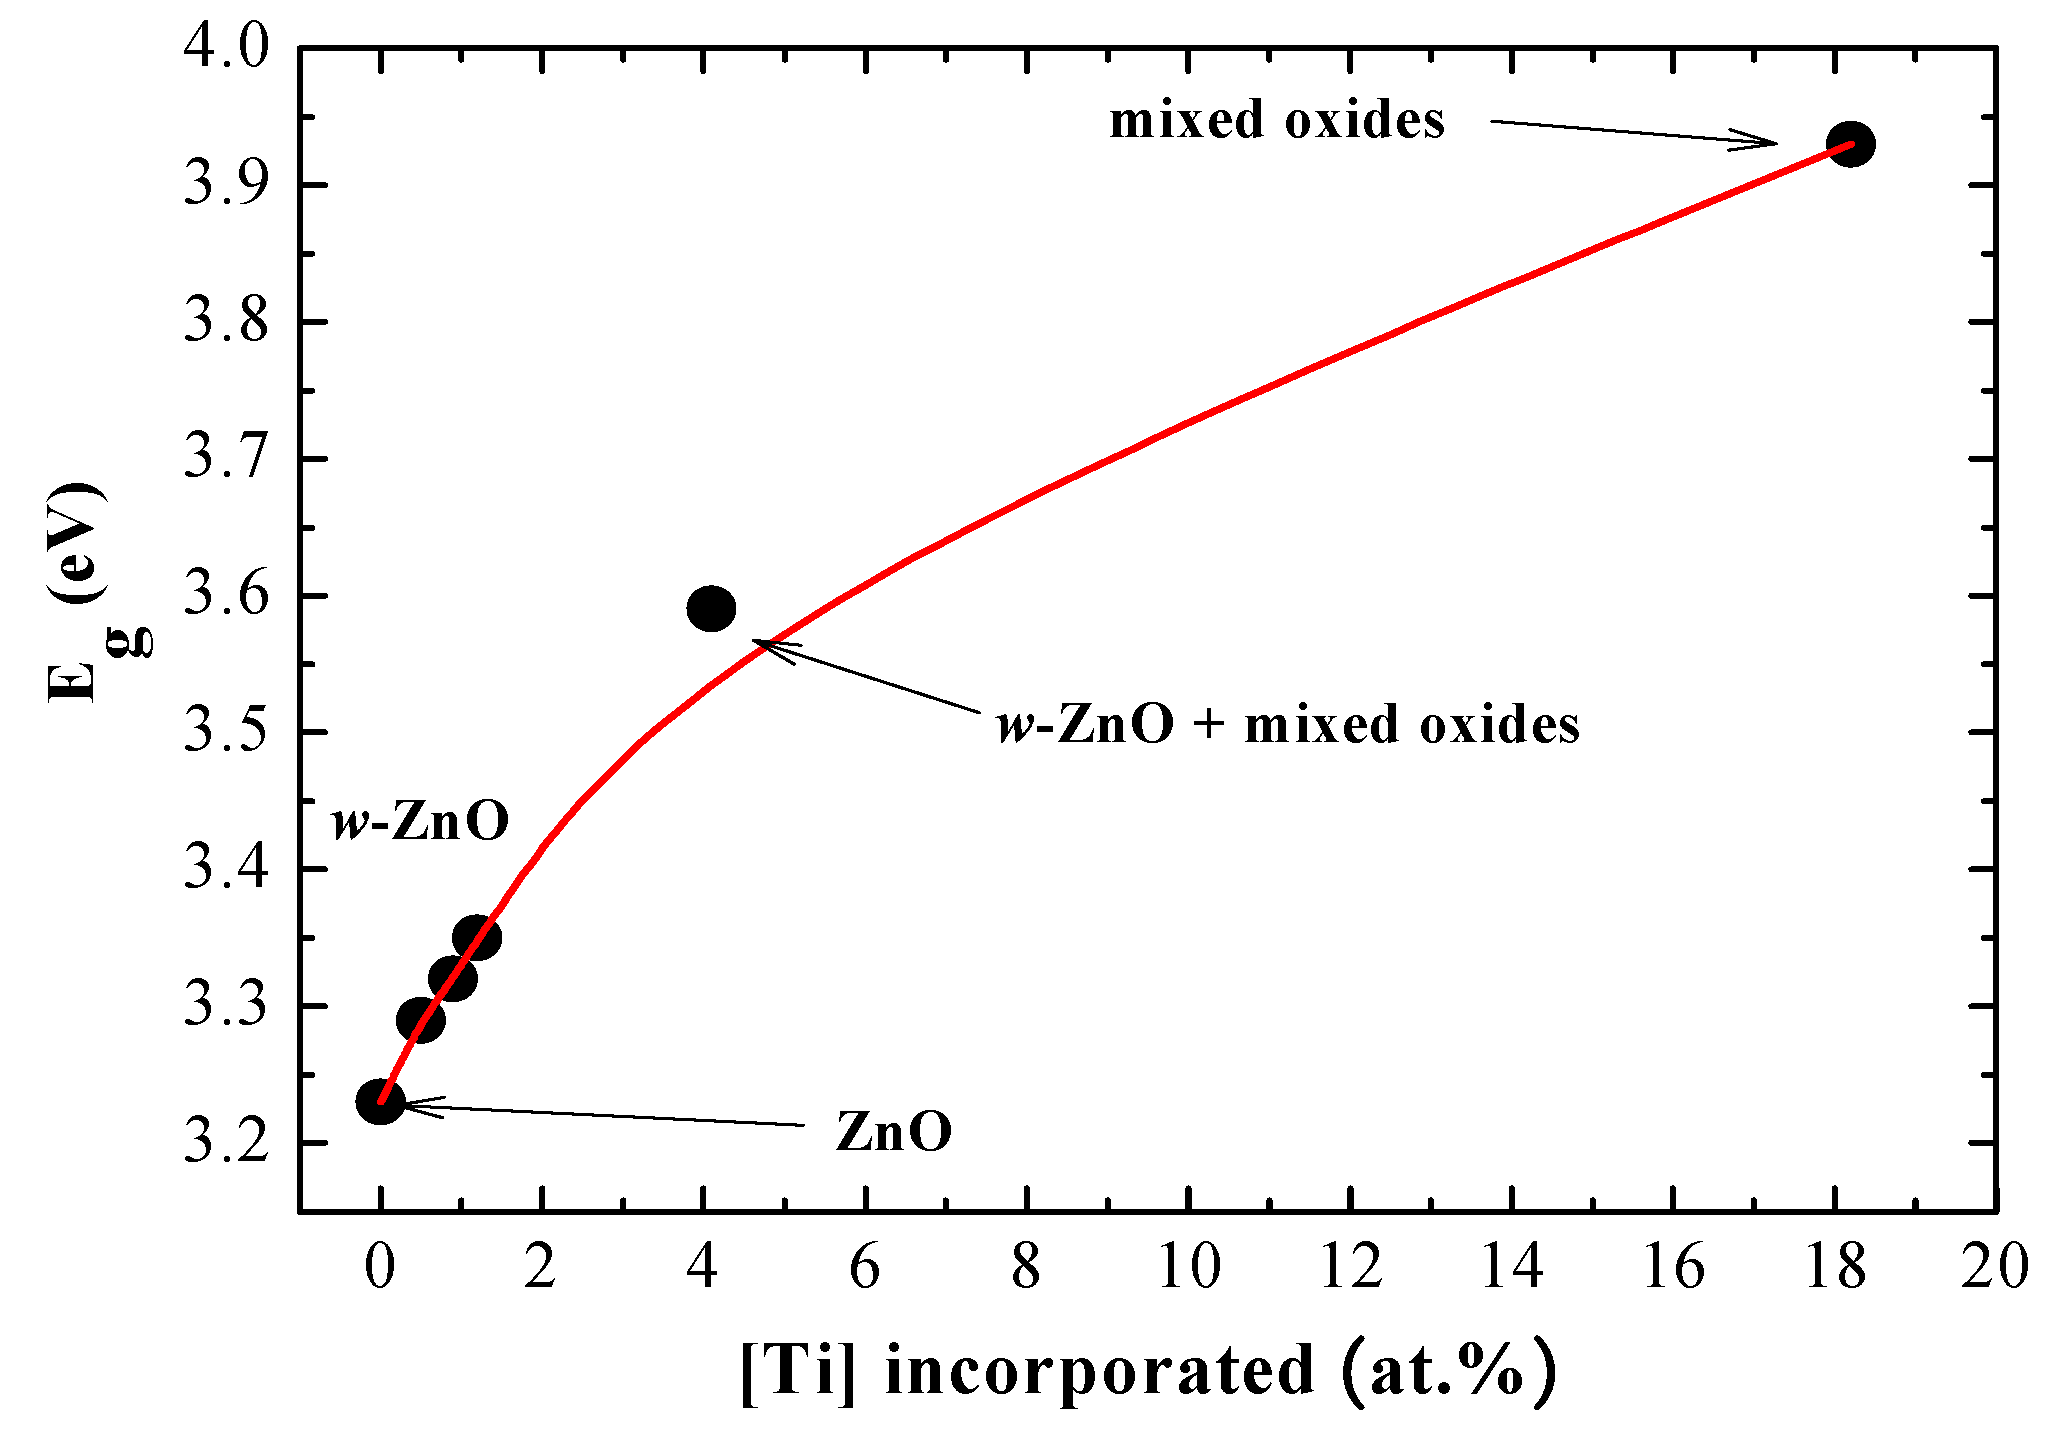
2 values (Tauc plot) corresponding to the best fit of the above alternatives, i.e., direct transitions of the TZO films. From these curves, it is possible to obtain the energy gap by extrapolation of the asymptote in the high-energy range to the energy axis. The evolution of the
Eg with the titanium concentration in the TZO films is displayed in
Figure 8.
As it can be appreciated, the gap energy increases monotonously from 3.2 eV for pure ZnO to 3.3 eV for low Ti-doped films with the wurtzite structure. This increase can be interpreted in terms of the Moss–Burstein model, which states that a virtual shift of the band gap for highly doped degenerate semiconductors [
24,
25]. In this case, the large electronic population in the conduction band leads to a displacement of the Fermi level above the bottom of the conduction band so that the excited electrons need a larger energy to jump to the Fermi level (i.e., the highest occupied levels).
As stated above, for a larger Ti content in the films, the wurtzite-like structure progressively becomes more amorphous and the gap rises up to 3.6 eV when the Ti content is 4.1 at.%. Finally, in a highly doped film (Ti concentration is 18.2 at.%) the bandwidth increases to 3.9 eV. In this case, this value cannot be justified by the doping effect, but instead, it could have arisen by the presence of a different amorphous TZO compound.
3.6. Photoluminescence (PL)
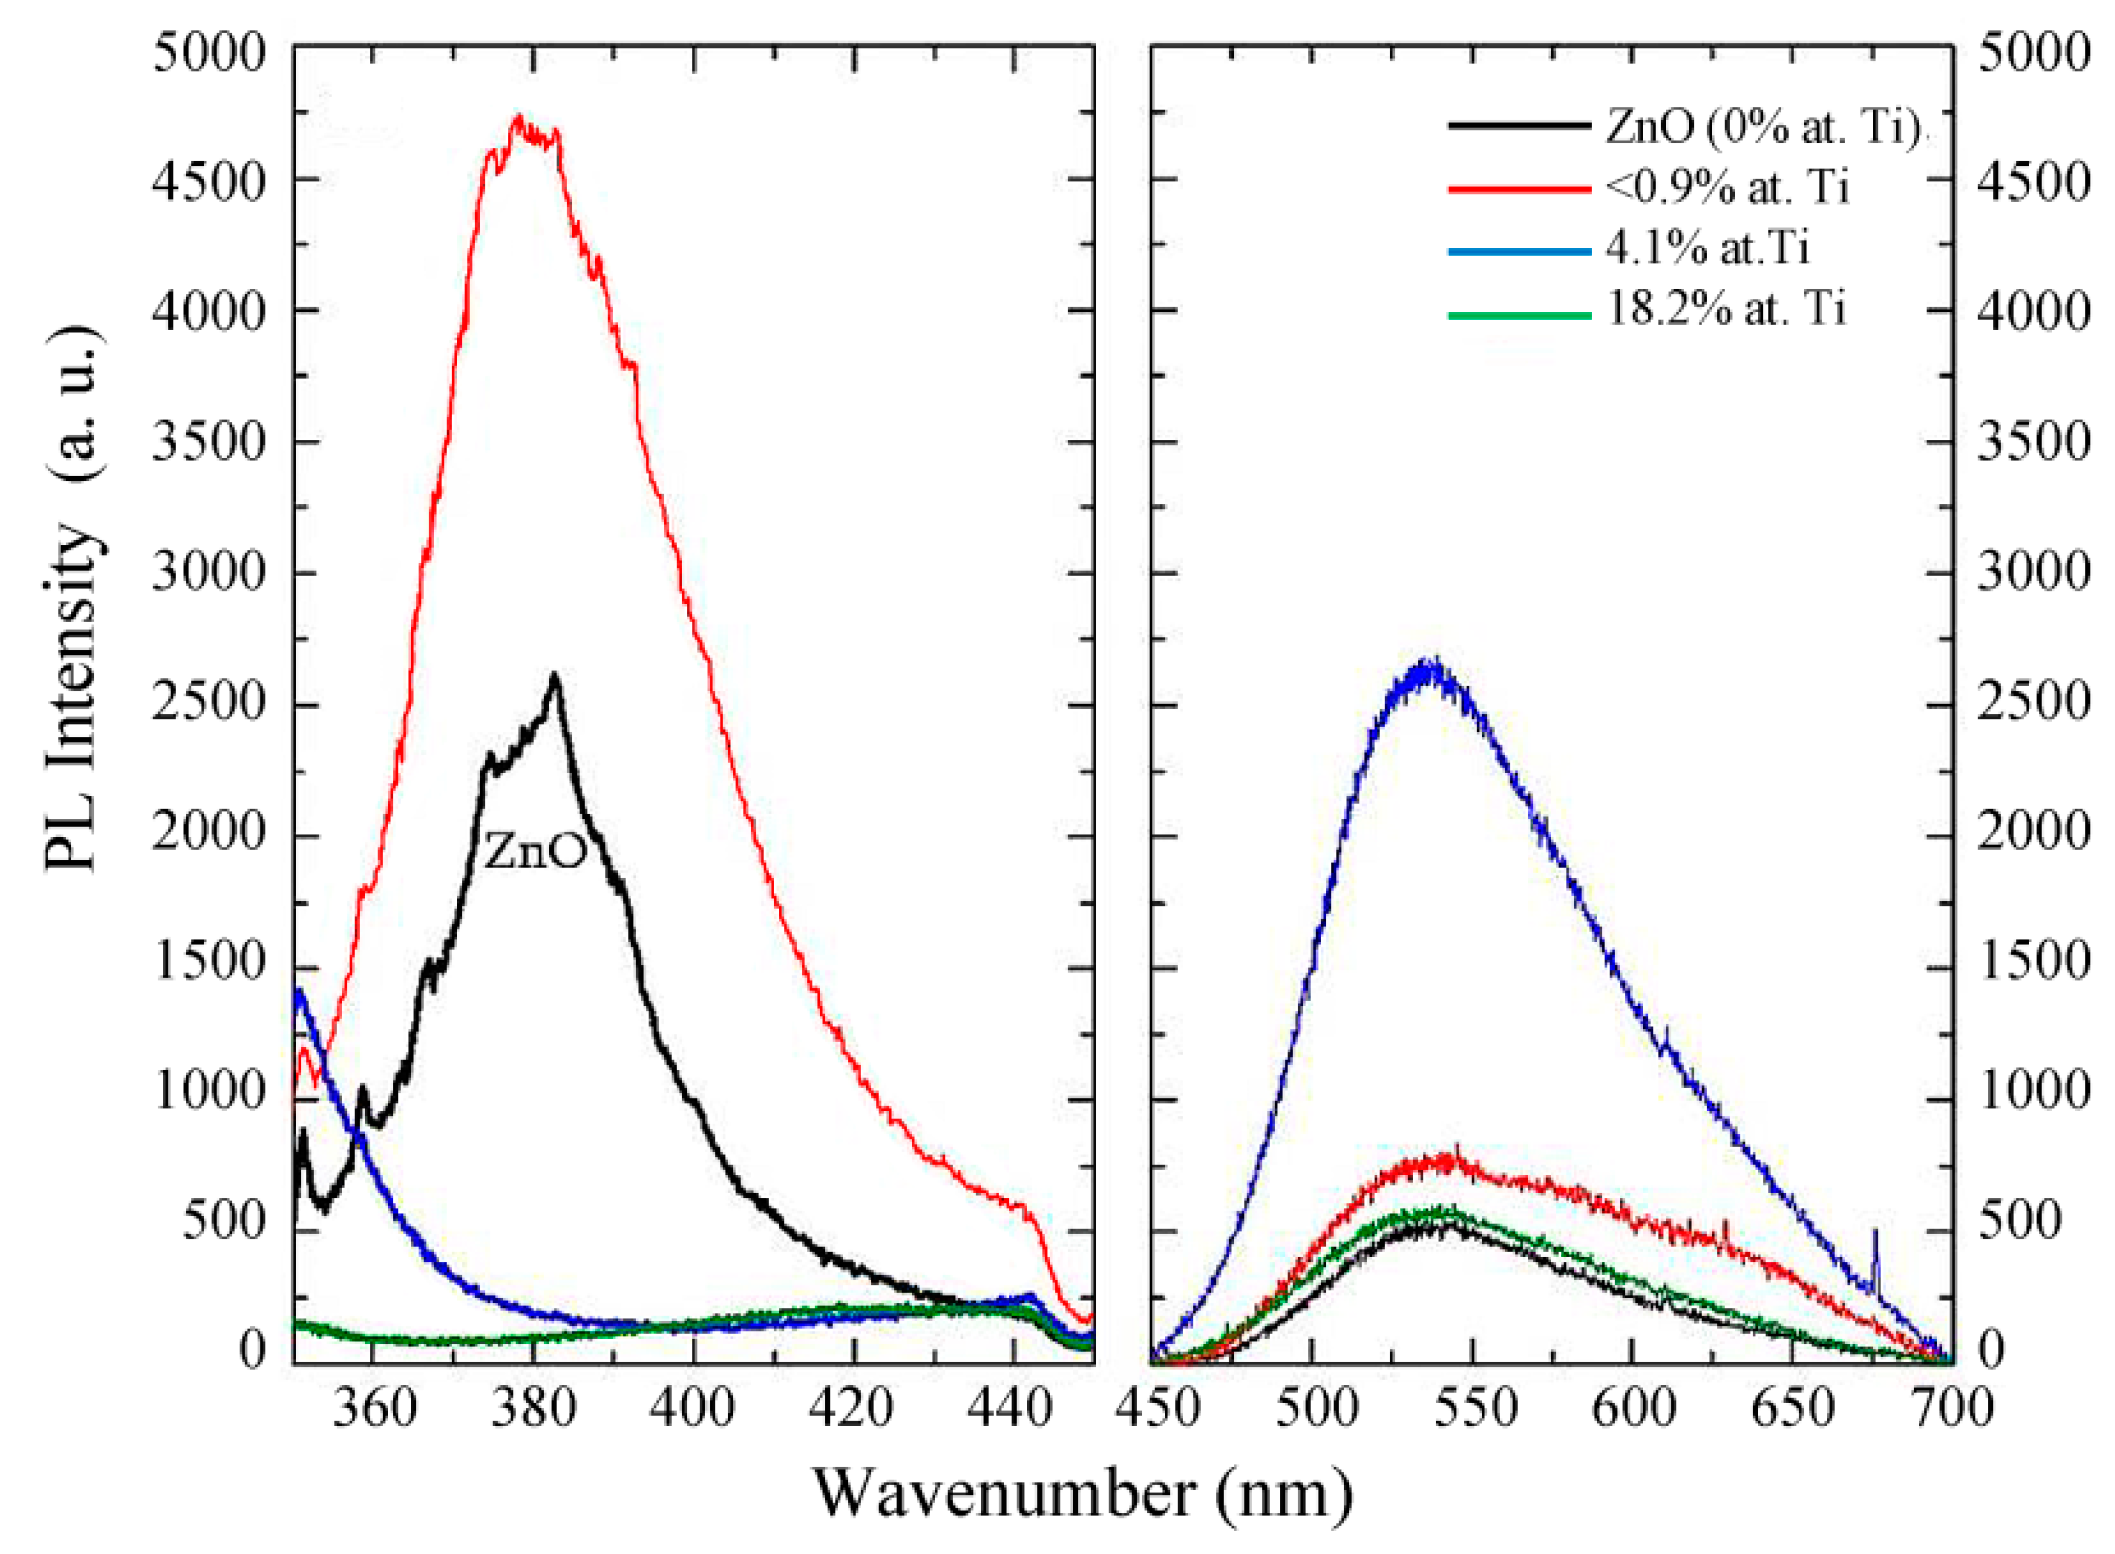
Figure 9 illustrates the PL spectra of selected TZO samples. A reference spectrum of stoichiometric ZnO is included as well. The pure ZnO films exhibit a PL peak in the UV region (380 nm) attributed to the near band edge excitation of defects, as well as a wide green band (approx. 550 nm) of lower intensity due to shallow defects [
7,
26]. The incorporation of Ti (0.2 at.%) in the ZnO films raises both PL signals, increasing the intensity of the blue band in a factor of 2 and thereby indicating a significant increase in PL efficiency in the UV range, which corroborates the improvement of the crystallinity of low-doped ZnO films as detected by XRD. This behaviour is explained by the increase of exciton defects caused by the substitution of the Zn
2+ by Ti
4+ ions in ZnO lattice [
7,
27].
For higher Ti concentrations in the film structure (4.1 at.% and 18.2 at.%), the PL spectra show, in both cases, a tail at wavelengths above 360 nm, suggesting the presence of the corresponding emission peaks, likely of low intensity, deeper in the blue range (out of the detection limit of the spectrophotometer). As aforementioned, these samples correspond either to a mixture of crystalline ZnO and other amorphous compounds (for Ti = 4.1 at.%) or to the amorphous titanate phase (for Ti = 18.2 at.%). Indeed, the optical energy band gaps for these materials are 3.6 and 3.9 eV, respectively (
Figure 8), which may give rise to near edge excitonic transitions in that region.
Generally, the green band of the PL spectra of TZO films is attributed to single ionized oxygen vacancies [
2,
24,
27], in agreement to our XPS results (see above). The large emission intensity observed for the sample with 4.1 at.% Ti corroborates the existence of w-ZnO aggregates within the titanate phase, which is supposed to bear a large defect concentration. On the other hand, the decrease of the emission in this optical range for the sample with a much higher Ti content (18.2 at.%) can be associated to the amorphous nature of pure titanate films, which present a broad low emission band in the 500–600 nm range, as observed in
Figure 9. This phenomenon has been related to the presence of delocalized electronic levels (Ti–O
5 clusters) in the optical bandgap [
28]. As it is well-known, amorphous semiconductors have a large population of electronic states close to the band edges (mobility gap) which obviously may smooth the PL spectra of the green band. Nevertheless, the green luminescence processes in ZnO materials are still a matter of intense debate [
1].
4. Conclusions
The above results demonstrate a close relationship between the crystalline structure of sputtered TZO coatings and their optical response, determined by the atomic Ti concentration in the films. Specifically, films with a low Ti content (≤0.9 at.%) exhibit a highly crystalline wurtzite-like structure, with the Ti4+ ions substitutionally incorporated into the ZnO structure, forming Ti-doped ZnO films. Their energy gap (3.3 eV) is slightly higher than in reference ZnO films (3.2 eV). Higher Ti contents still keep the wurtzite structure, which becomes progressively amorphous with increasing Ti content, widening the energy gap. At Ti concentration of 18.2 at.%, the material displays a fully amorphous structure of Ti–O–Zn mixed oxides and the gap further increases to 3.9 eV. On the other hand, the PL characteristics of pure ZnO films show the typical blue band (which the position of correlates with optical gap), as well as the green band, associated to the near edge excitation of defects, likely ionized oxygen vacancies. Ti addition below 0.9 at.% in the films raises the UV band emission, thereby indicating a significant improvement of PL efficiency. For larger Ti contents (4.1 at.%), there is a shift of the blue band to the deep UV range, whereas the green band increases likely due to a larger defect concentration in the band gap. Finally, the amorphous nature of the films for Ti at 18.2 at.% preserves a similar PL emission (blue and green band), both with much lower intensity. Hence, we prove that there is a very narrow window of titanium content to be incorporated into the structure of ZnO films to improve its crystalline structure as well as its luminescence and other optical properties.
Author Contributions
Conceptualization, R.E.-G. and O.S.; Methodology, R.E.-G and O.S.; Formal Analysis, R.E.-G. and O.S. and M.Y.; Investigation, M.Y., N.B. and O.M.; Writing—Original Draft Preparation, J.M.A. and O.S.; Writing—Review and Editing, O.S., C.P., R.E.-G. and J.M.A.
Funding
We acknowledge financial support from the Comunidad Autónoma de Madrid under project DIMMAT ref: CAM S2013/MIT-2775 and from the Spanish government under the project MAT2015-68892-R.
Acknowledgments
We acknowledge Javier Ortiz for his technical support.
Conflicts of Interest
The authors declare no conflict of interest.
References
- Rodnyi, P.A.; Khodyuk, I.V. Optical and luminescence properties of zinc oxide. Opt. Spectrosc. 2011, 111, 776–785. [Google Scholar] [CrossRef]
- Özgür, Ü.; Alivov Ya, I.; Liu, C.; Teke, A.; Reshchikov, M.A.; Doğan, S.; Avrutin, V.; Cho, S.-J.; Morkoç, H. A comprehensive review of ZnO materials and devices. Appl. Phys. Lett. 2005, 98, 041301. [Google Scholar] [CrossRef]
- Bang, K.H.; Hwang, D.K.; Myoung, J.M. Effects of ZnO buffer layer thickness on properties of ZnO thin films deposited by RF magnetron sputtering. Appl. Surf. Sci. 2003, 207, 359–364. [Google Scholar] [CrossRef]
- Ohara, S.; Mousavanda, T.; Umetsua, M.; Takamia, S.; Adschiri, T.; Kuroki, Y.; Takata, M. Hydrothermal synthesis of fine zinc oxide particles under supercritical conditions. Solid State Ion. 2004, 172, 261–264. [Google Scholar] [CrossRef]
- Anders, A.; Lim, S.H.N.; Yu, K.M.; Andersson, J.; Rosén, J.; McFarland, M.; Brown, J. High quality ZnO:Al transparent conducting oxide films synthesized by pulsed filtered cathodic arc deposition. Thin Solid Films 2010, 518, 3313–3319. [Google Scholar] [CrossRef]
- Cornelius, S.; Vinnichenko, M.; Shevchenko, N.; Rogozin, A.; Kolitsch, A.; Möllerless, W. Achieving high free electron mobility in ZnO:Al thin films grown by reactive pulsed magnetron sputtering. Appl. Phys. Lett. 2009, 94, 042103. [Google Scholar] [CrossRef]
- Chen, H.; Guo, W.; Ding, J.; Ma, S. Ti-incorporated ZnO films synthesized via magnetron sputtering and its optical properties. Superlattices Microstruct. 2012, 51, 544–551. [Google Scholar] [CrossRef]
- Jain, P.K.; Salim, M.; Kaur, D. Effect of phase transformation on optical and dielectric properties of pulsed laser deposited ZnTiO3 thin films. Superlattices Microstruct. 2016, 92, 308–315. [Google Scholar] [CrossRef]
- Irimpan, L.; Krishnan, B.; Nampoori, V.P.N.; Radhakrishnan, P. Luminescence tuning and enhanced nonlinear optical propertiesof nanocomposites of ZnO–TiO2. J. Colloid Interface Sci. 2008, 324, 99–104. [Google Scholar] [CrossRef]
- Jose, M.; Elakiya, M.; Dhas, S.A.M.B. Structural and optical properties of nanosized ZnO/ZnTiO3 composite materials synthesized by a facile hydrothermaltechnique. J. Mater. Sci. Mater. Electron. 2017, 28, 13649–13658. [Google Scholar] [CrossRef]
- Lee, Y.C.; Huang, Y.L.; Lee, W.H.; Shieu, F.S. Formation and transformation of ZnTiO3 prepared by sputtering process. Thin Solid Films 2010, 518, 7366–7371. [Google Scholar] [CrossRef]
- Caretti, I.; Yuste, M.; Torres, R.; Sánchez, O.; Jiménez, I.; Galindo, R.E. Coordination chemistry of titanium and zinc in Ti(1−x)Zn2xO2 (0 ≤ x ≤ 1) ultrathin films grown by DC reactive magnetron sputtering. RSC Adv. 2012, 2, 2696–2699. [Google Scholar] [CrossRef]
- Yu, W.; Han, D.; Li, H.; Dong, J.; Zhou, X.; Yi, Z.; Luo, Z.; Zhanga, S.; Zhang, X.; Wang, Y. Titanium doped zinc oxide thin film transistors fabricated by cosputtering technique. Appl. Surf. Sci. 2018, 459, 345–348. [Google Scholar] [CrossRef]
- Kumar, M.; Singh, J.P.; Chae, K.H.; Kim, J.H.; Lee, H.H. Structure, optical and electronic structure studies of Ti:ZnO thin films. J. Alloy. Compd. 2018, 759, 8–13. [Google Scholar] [CrossRef]
- Kòtai, E. Computer methods for analysis and simulation of RBS and ERDA spectra. Nucl. Instrum. Methods Phys. Res. B 1994, 85, 588–596. [Google Scholar] [CrossRef]
- Zhao, Z.W.; Zhou, Q.; Zhang, X.; Wu, X. A study on Ti-doped ZnO transparent conducting thin films fabricated by pulsed laser deposition. Appl. Surf. Sci. 2014, 305, 481–486. [Google Scholar] [CrossRef]
- Lu, J.J.; Lu, Y.M.; Tasi, S.I.; Hsiung, T.L.; Wang, H.P.; Jang, L.Y. Conductivity enhancement and semiconductor–metal transitionin Ti-doped ZnO films. Opt. Mater. 2017, 29, 1548–1552. [Google Scholar] [CrossRef]
- Mullerová, J.; Sutta, P.; Medlín, R.; Netrvalová, M.; Novák, P. Optical properties of zinc titanate perovskite prepared by reactive RF sputtering. J. Electr. Eng. 2017, 68, 10–16. [Google Scholar] [CrossRef]
- Benito, N.; Palacio, C. Mixed Ti-O-Si oxide films formation by oxidation of titanium-silicon interfaces. Appl. Surf. Sci. 2014, 301, 436–441. [Google Scholar] [CrossRef]
- Benito, N.; Recio-Sánchez, G.; Escobar-Galindo, R.; Palacio, C. Formation of antireflection Zn/ZnO core-shell nano-pyramidal arrays by O2+ ion bombardment of Zn surfaces. Nanoscale 2017, 9, 14201–14207. [Google Scholar] [CrossRef]
- Barr, T.L. Recent advances in X-ray photoelectron spectroscopy studies of oxides. J. Vac. Sci. Technol. A Vac. Surf. Films 1991, 9, 1793–1805. [Google Scholar] [CrossRef]
- Zhong, I.Z.Y.; Zhang, T. Microstructure and optoelectronic properties of titanium-doped ZnO thin films prepared by magnetron sputtering. Mater. Lett. 2013, 96, 237–239. [Google Scholar] [CrossRef]
- Sánchez, O.; Vergara, L.; Climent-Font, A.; de Melo, O.; Sanz, R.; Hernández-Vélez, M. Continuous and Nanostructured TiO2 Film Grown by DC sputtering magnetron. J. Nanosci. Nanotechnol. 2012, 12, 9148–9155. [Google Scholar] [CrossRef]
- Liu, J.; Ma, S.Y.; Huang, X.L.; Ma, L.G.; Li, F.M.; Yang, F.C.; Zhao, Q.; Zhang, X.L. Effects of Ti-doped concentration on the microstructures and optical properties of ZnO thin films. Superlattices Microstruct. 2012, 52, 765–773. [Google Scholar] [CrossRef]
- Ma, L.; Ai, X.; Huang, X.; Ma, S. Effects of the substrate and oxygen partial pressure on the microstructures and optical properties of Ti-doped ZnO thin films. Superlattices Microstruct. 2011, 50, 703–712. [Google Scholar] [CrossRef]
- Cho, S.; Ma, J.; Kim, Y.; Sun, Y.; Wong, G.K.L.; Ketterson, J.B. Photoluminescence and ultraviolet lasing of polycrystalline ZnO thin films prepared by the oxidation of the metallic Zn. Appl. Phys. Lett. 1999, 75, 2761–2763. [Google Scholar] [CrossRef]
- Song, C.F.; Hong, T.Q.; Yuan, F.; Li, X.Y. Enhanced green emission in ZnO/zinc titanate composite materials. Mater. Sci. Eng. B 2010, 175, 243–247. [Google Scholar] [CrossRef]
- Chaves, A.C.; Lima, S.J.; Araújo, R.C.; Maurera, M.A.; Longo, E.; Pizanid, P.S.; Simoes, L.G.P.; Soledade, L.E.B.; Souza, A.G.; dos Santos, I.M.G. Photoluminescence in disordered Zn2TiO4. J. Solid State Chem. 2006, 179, 985–992. [Google Scholar] [CrossRef]
© 2019 by the authors. Licensee MDPI, Basel, Switzerland. This article is an open access article distributed under the terms and conditions of the Creative Commons Attribution (CC BY) license (http://creativecommons.org/licenses/by/4.0/).


 ,
, 


