Uptake of Pb(II) Ions from Simulated Aqueous Solution via Nanochitosan

 , and
, and 
Abstract
1. Introduction
2. Experimental Section
2.1. Materials
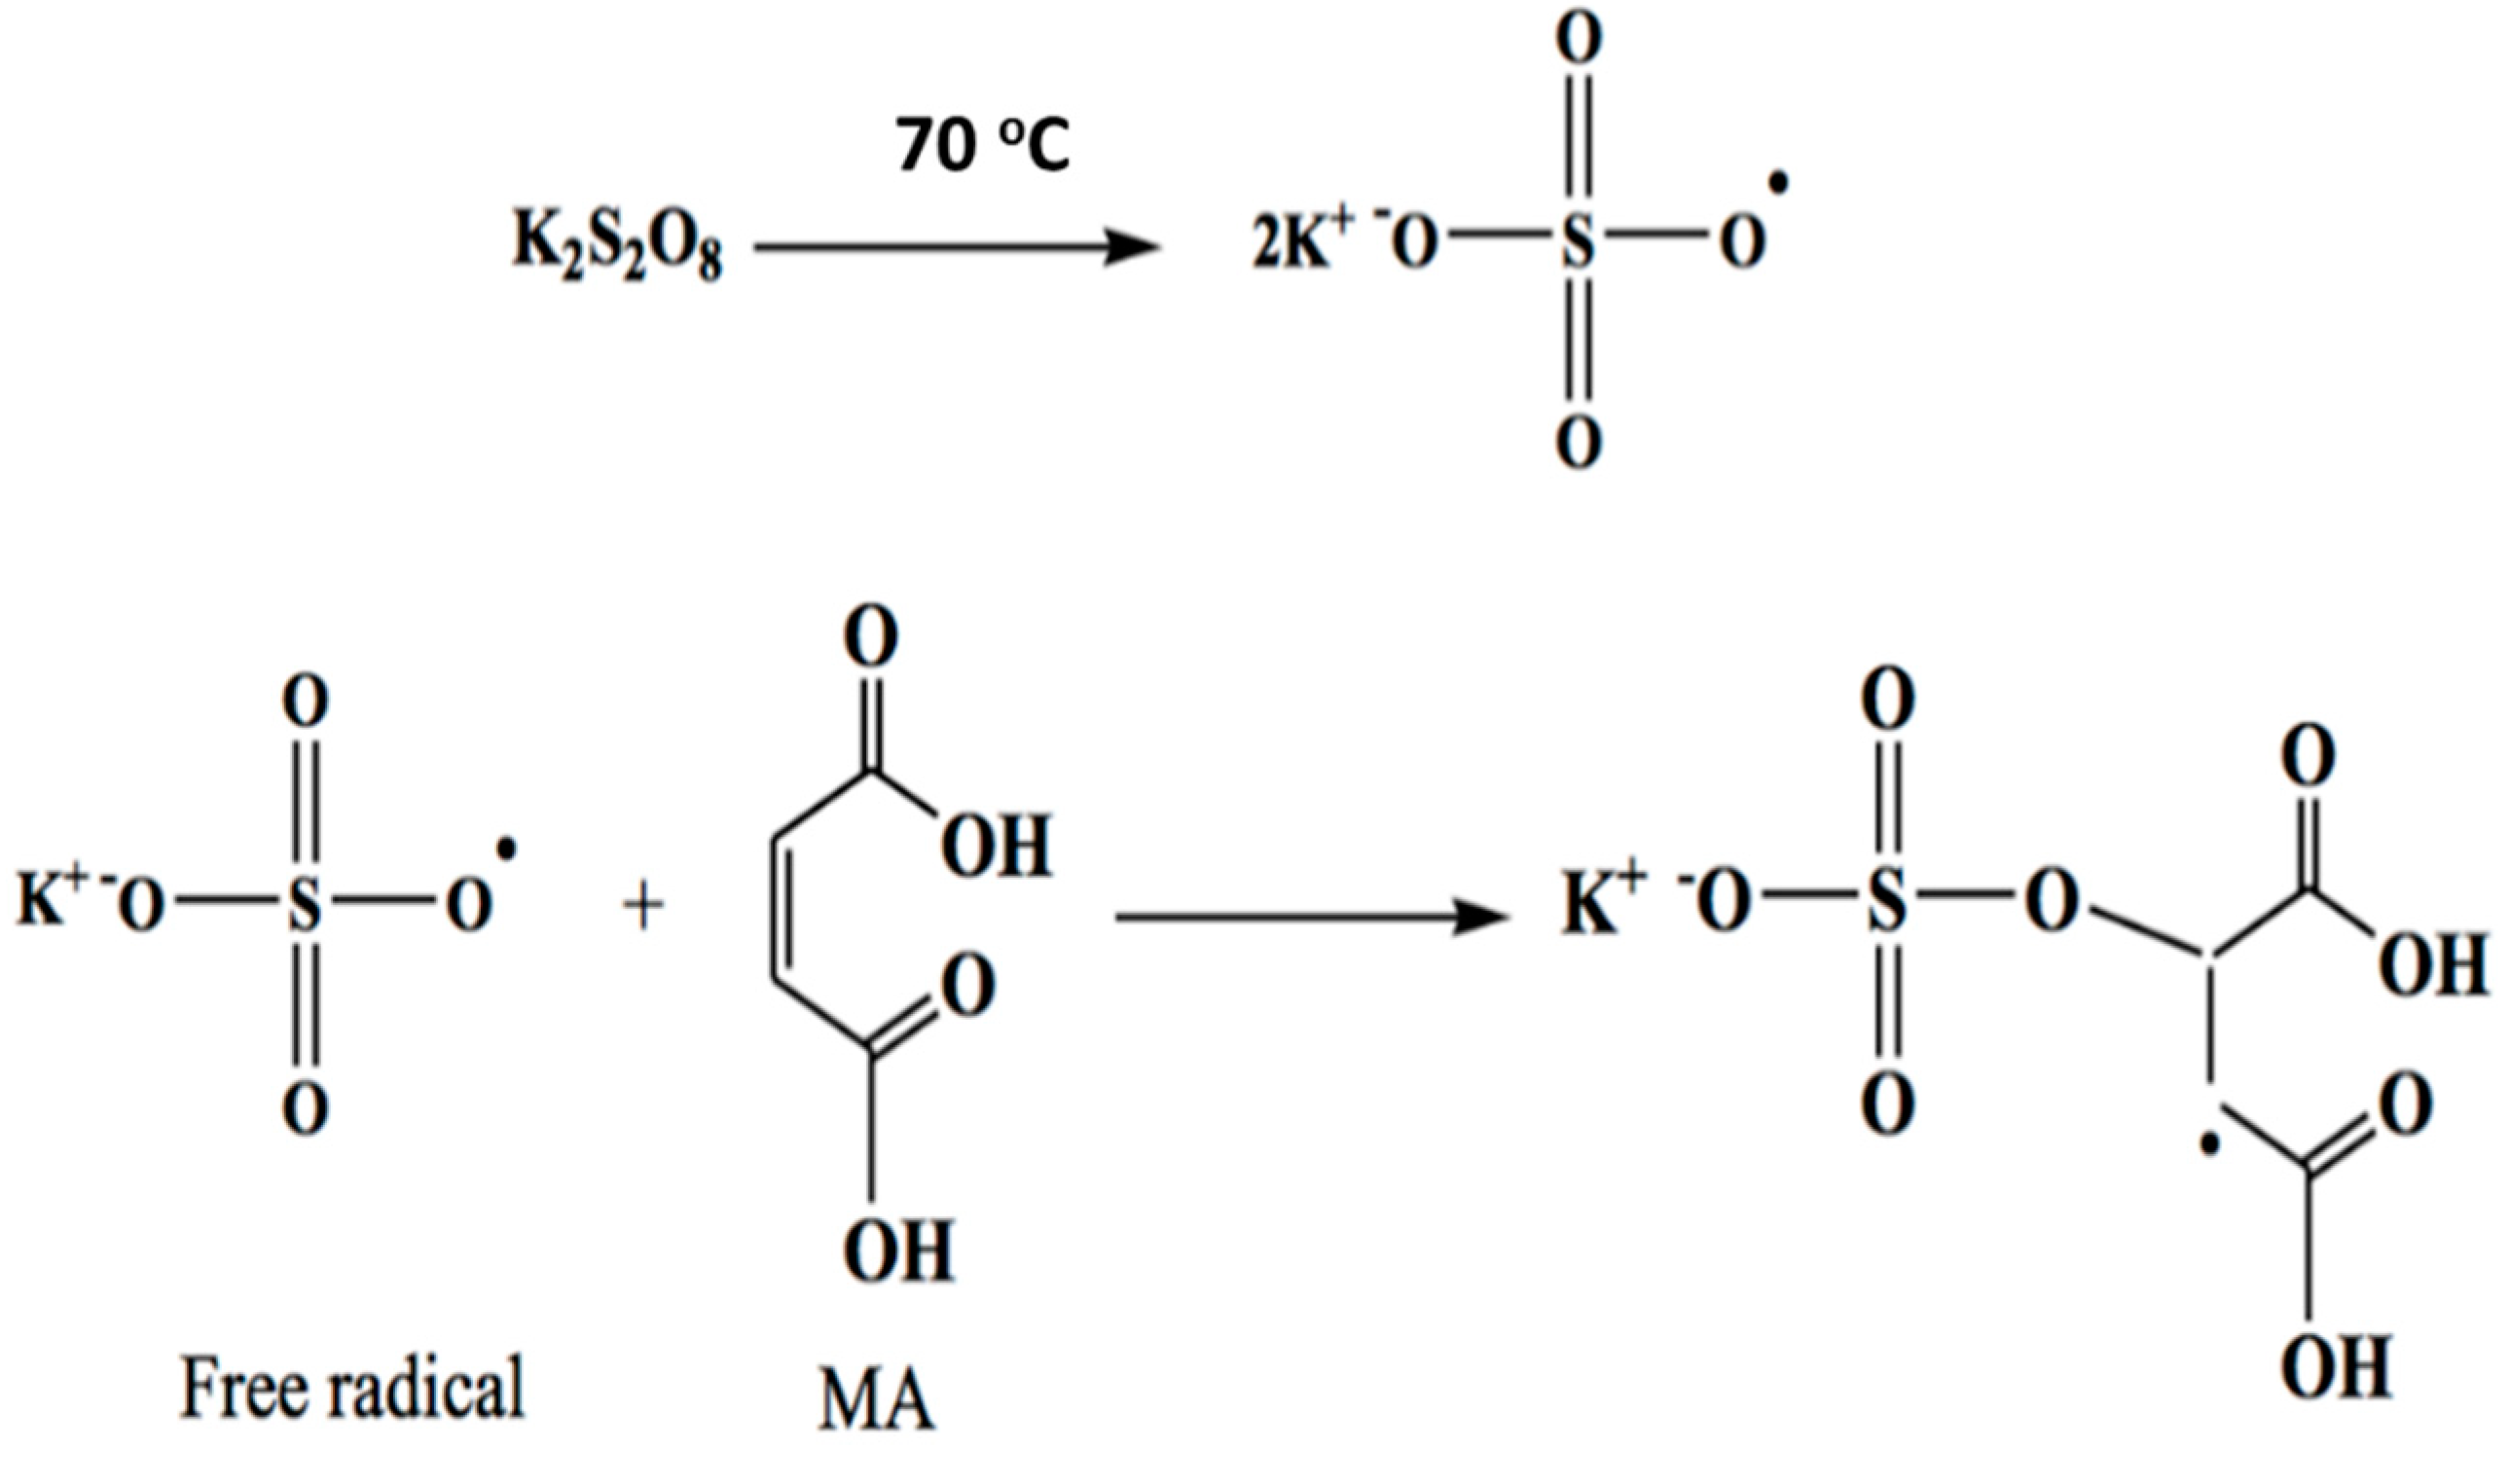
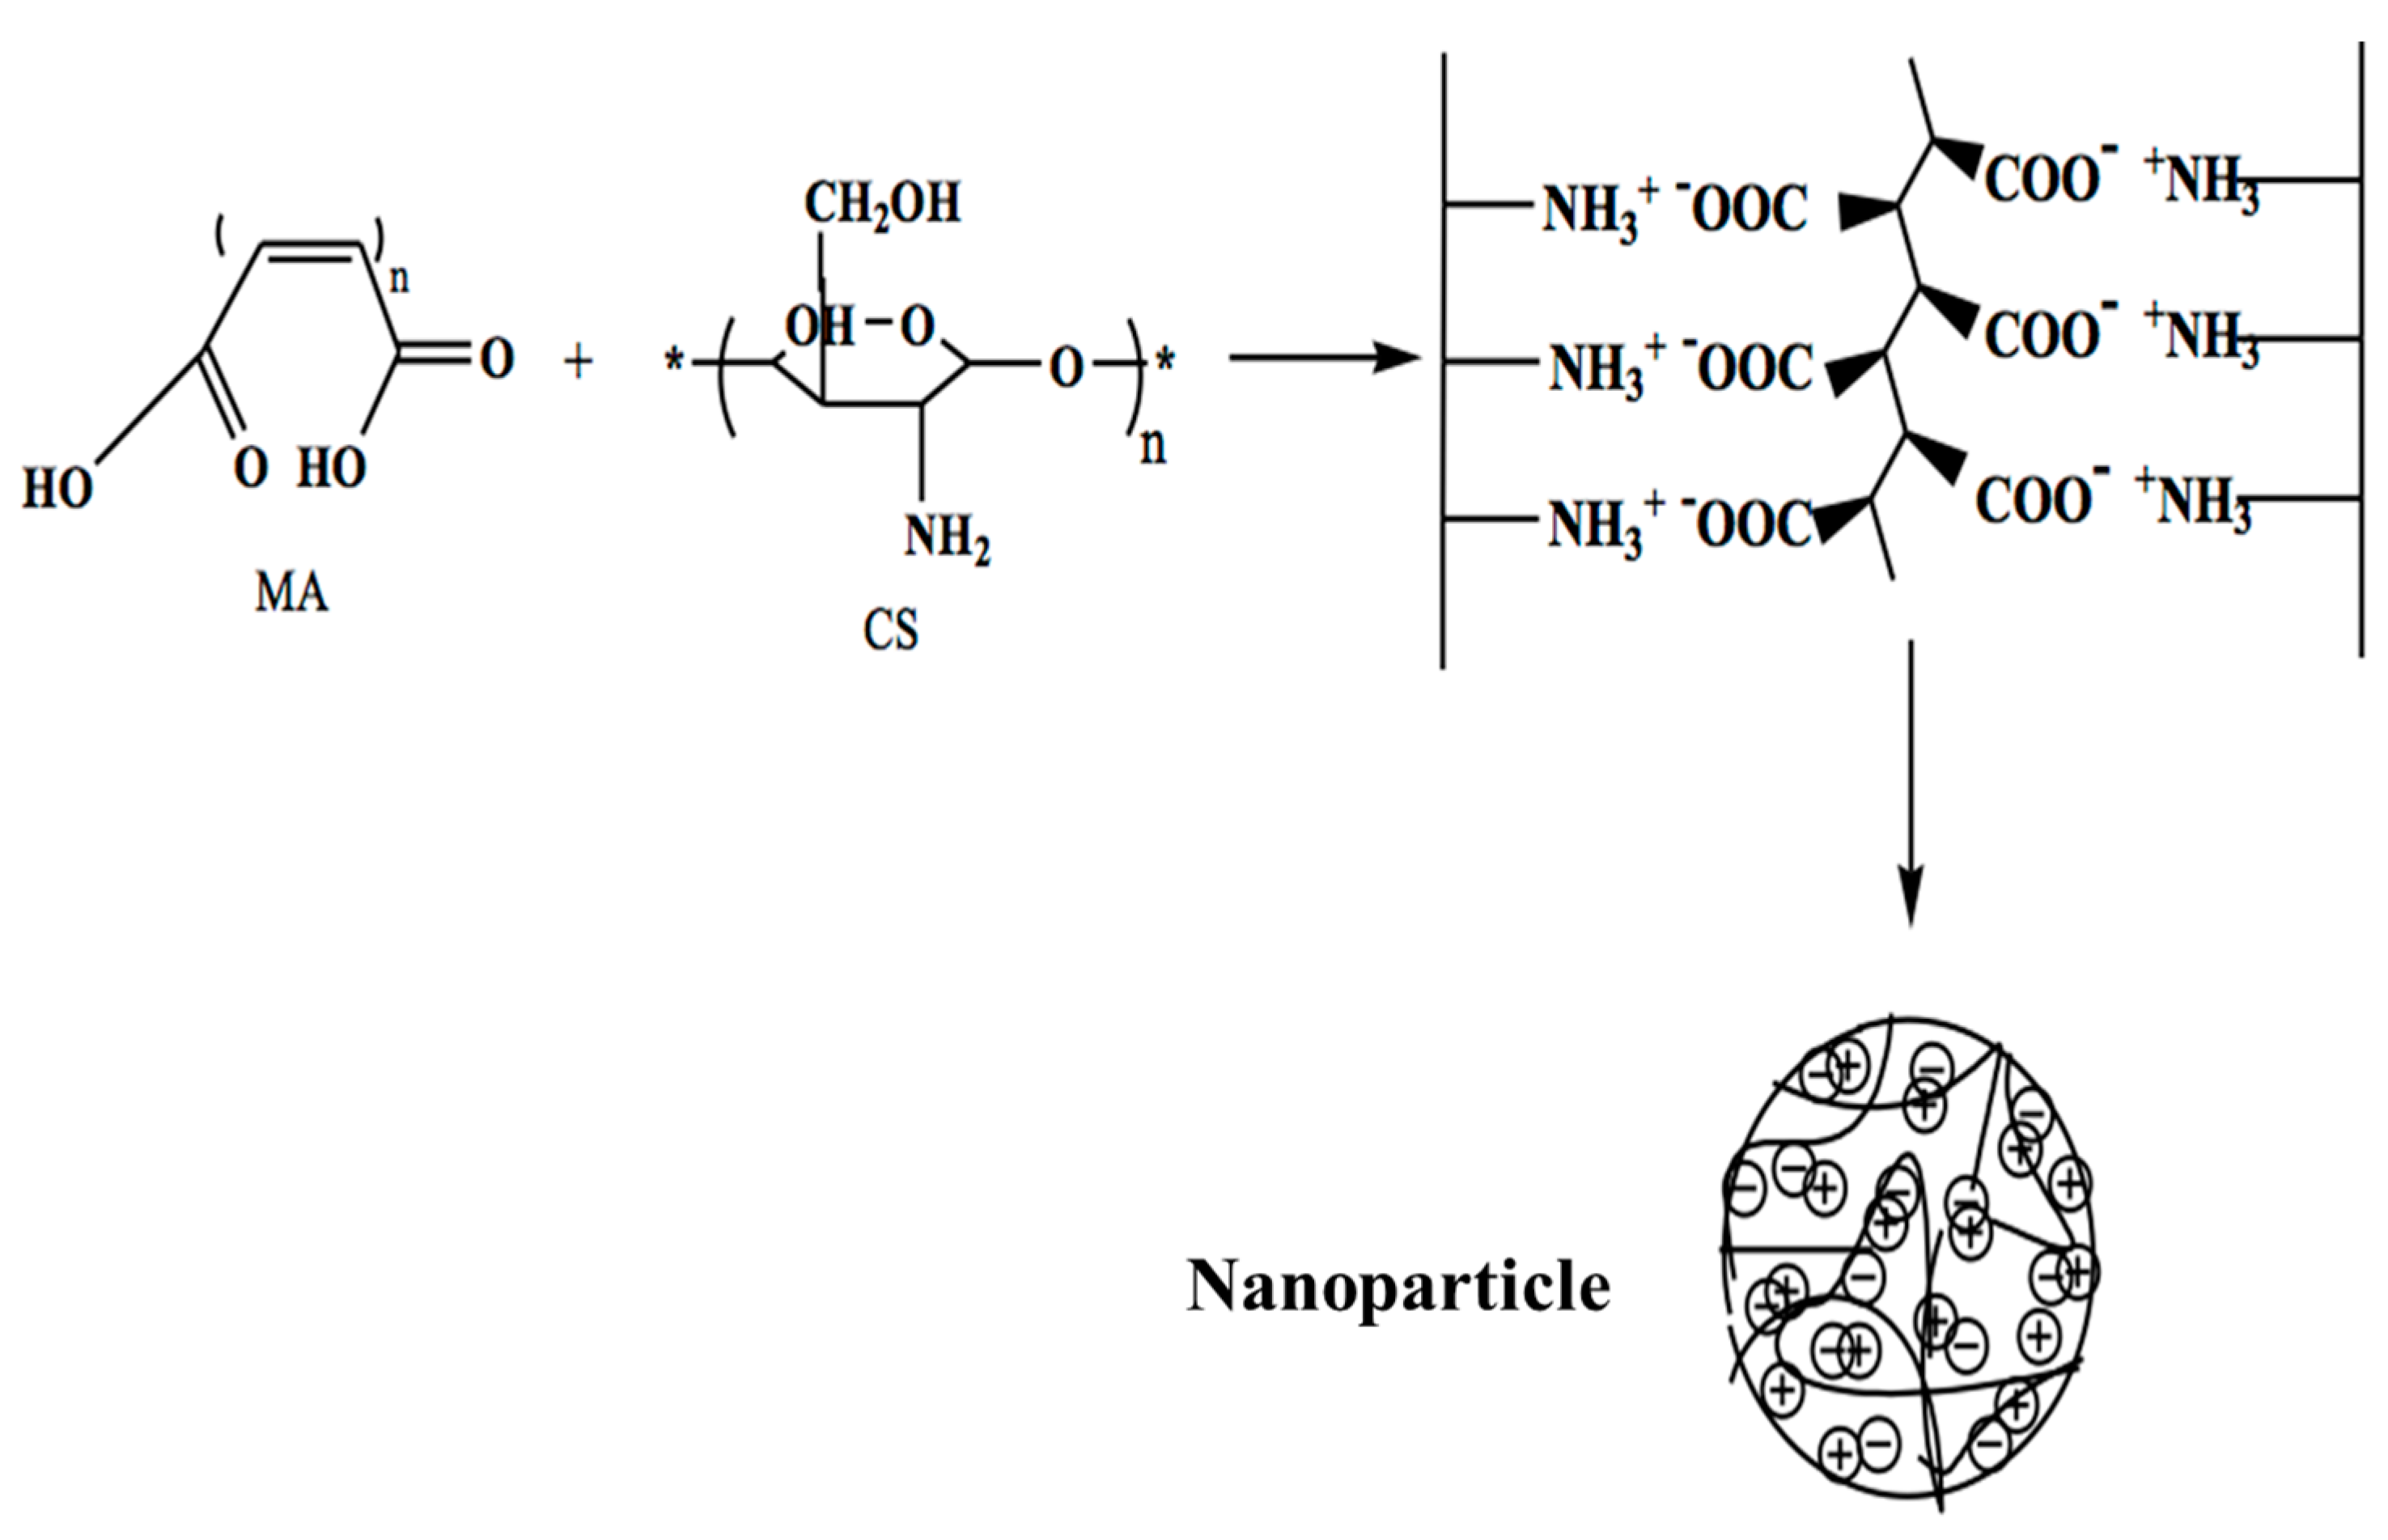
2.2. Preparation of NC
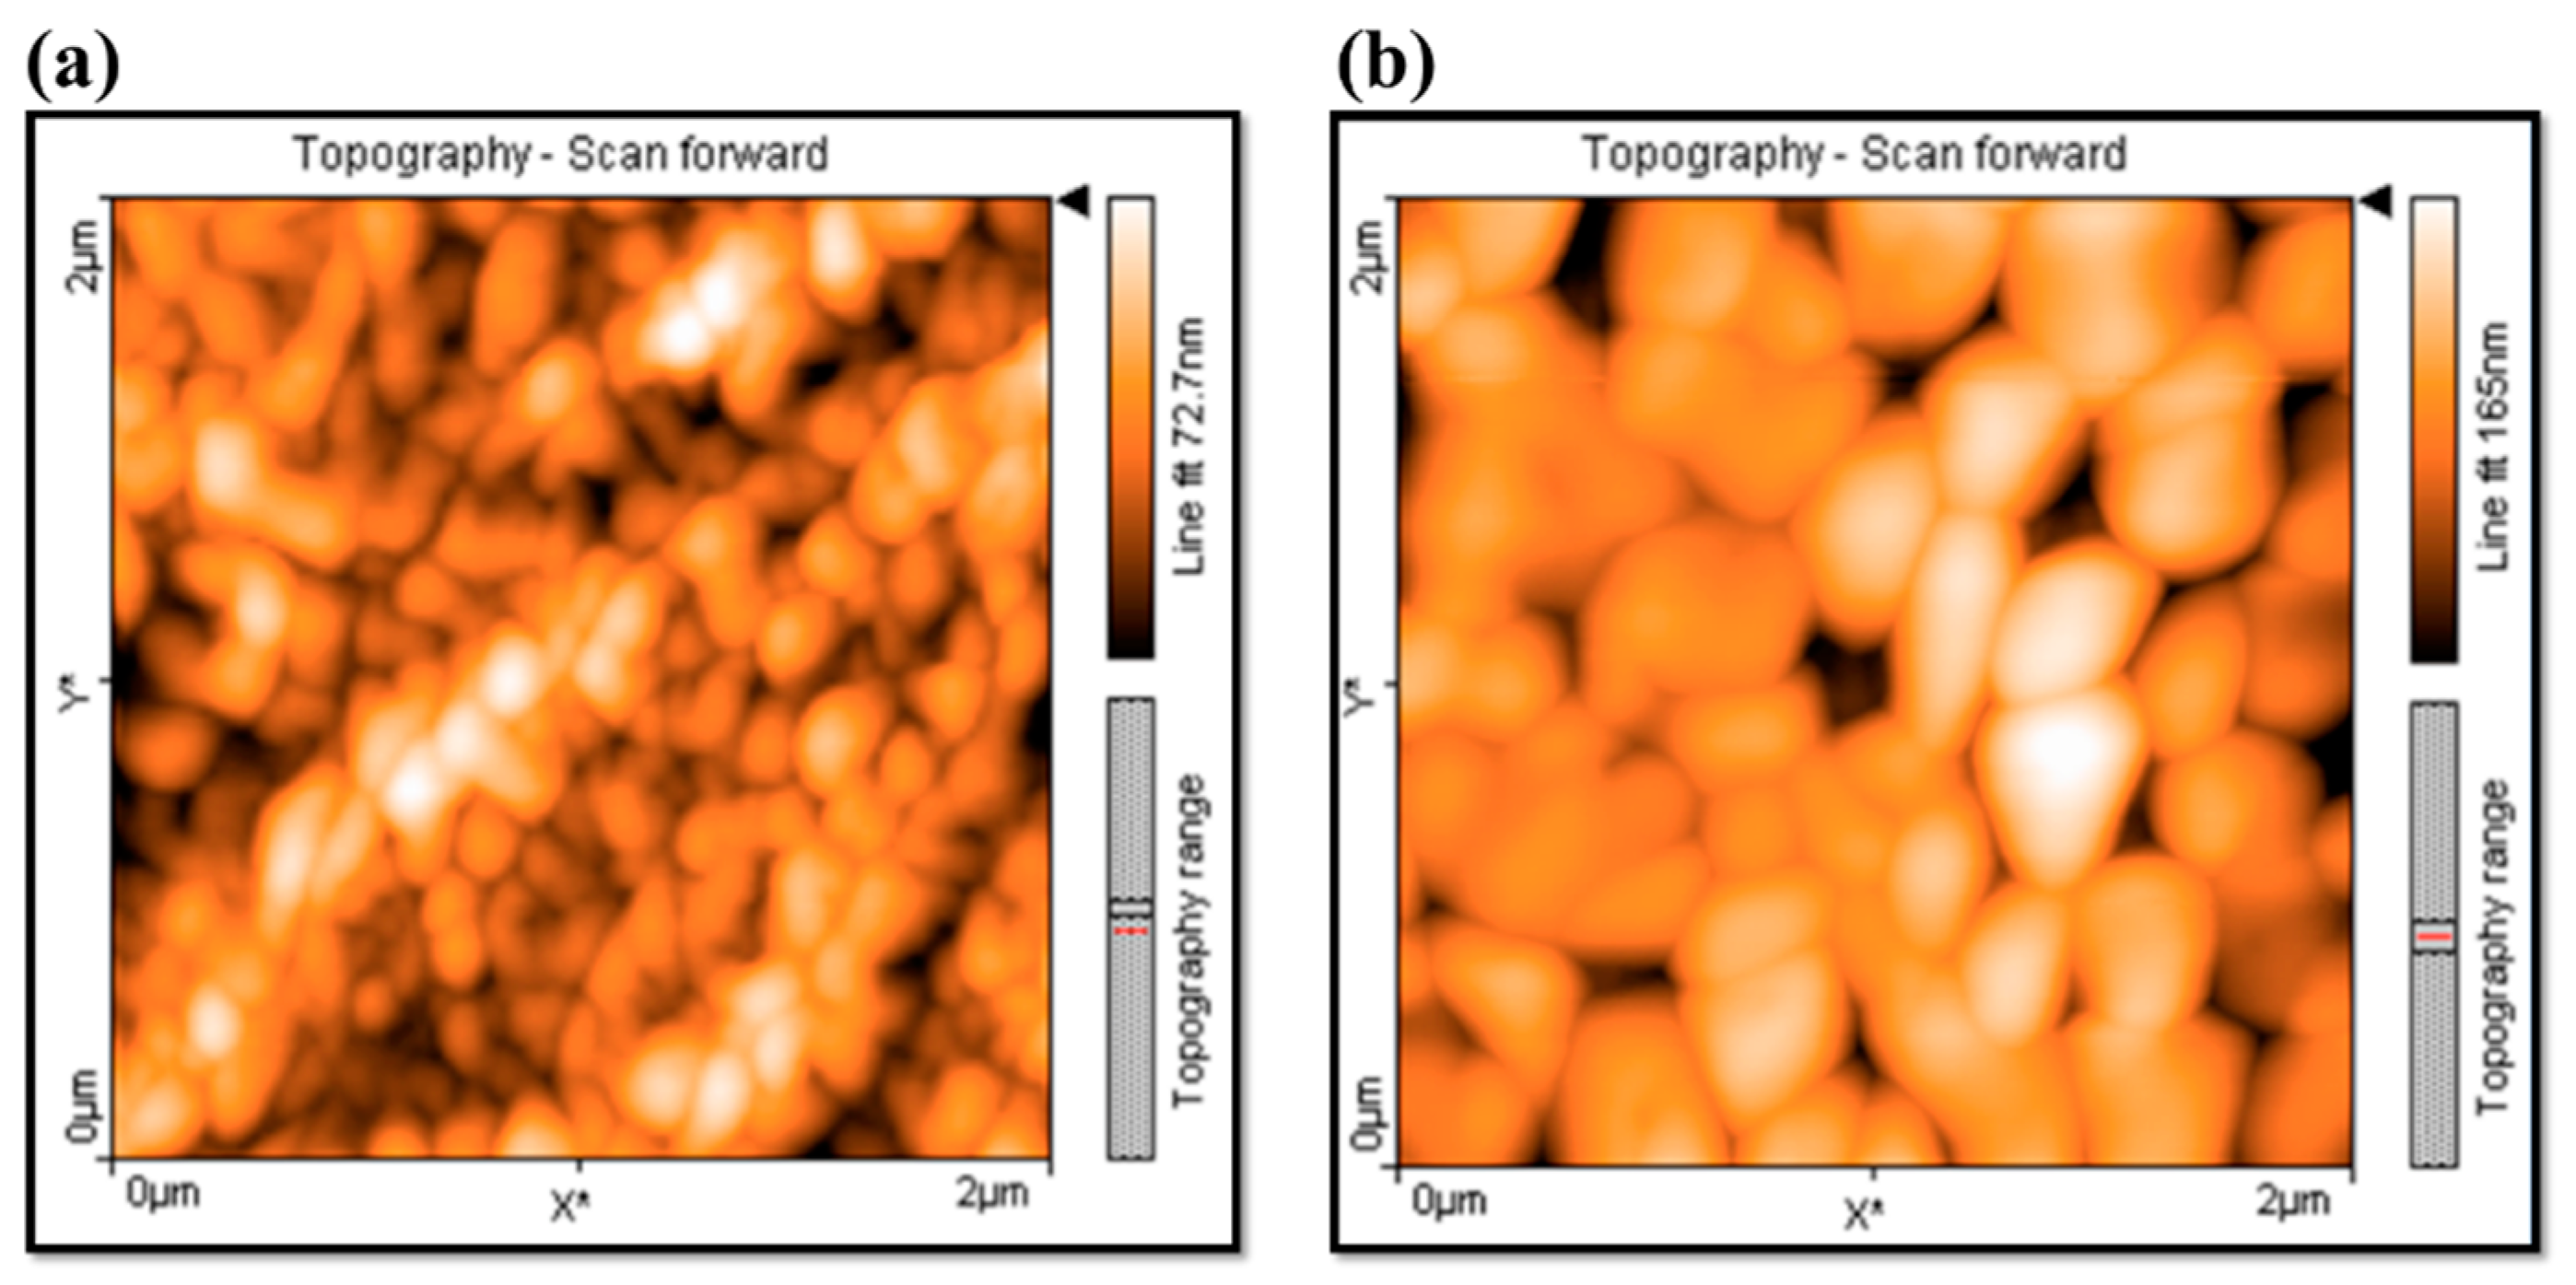
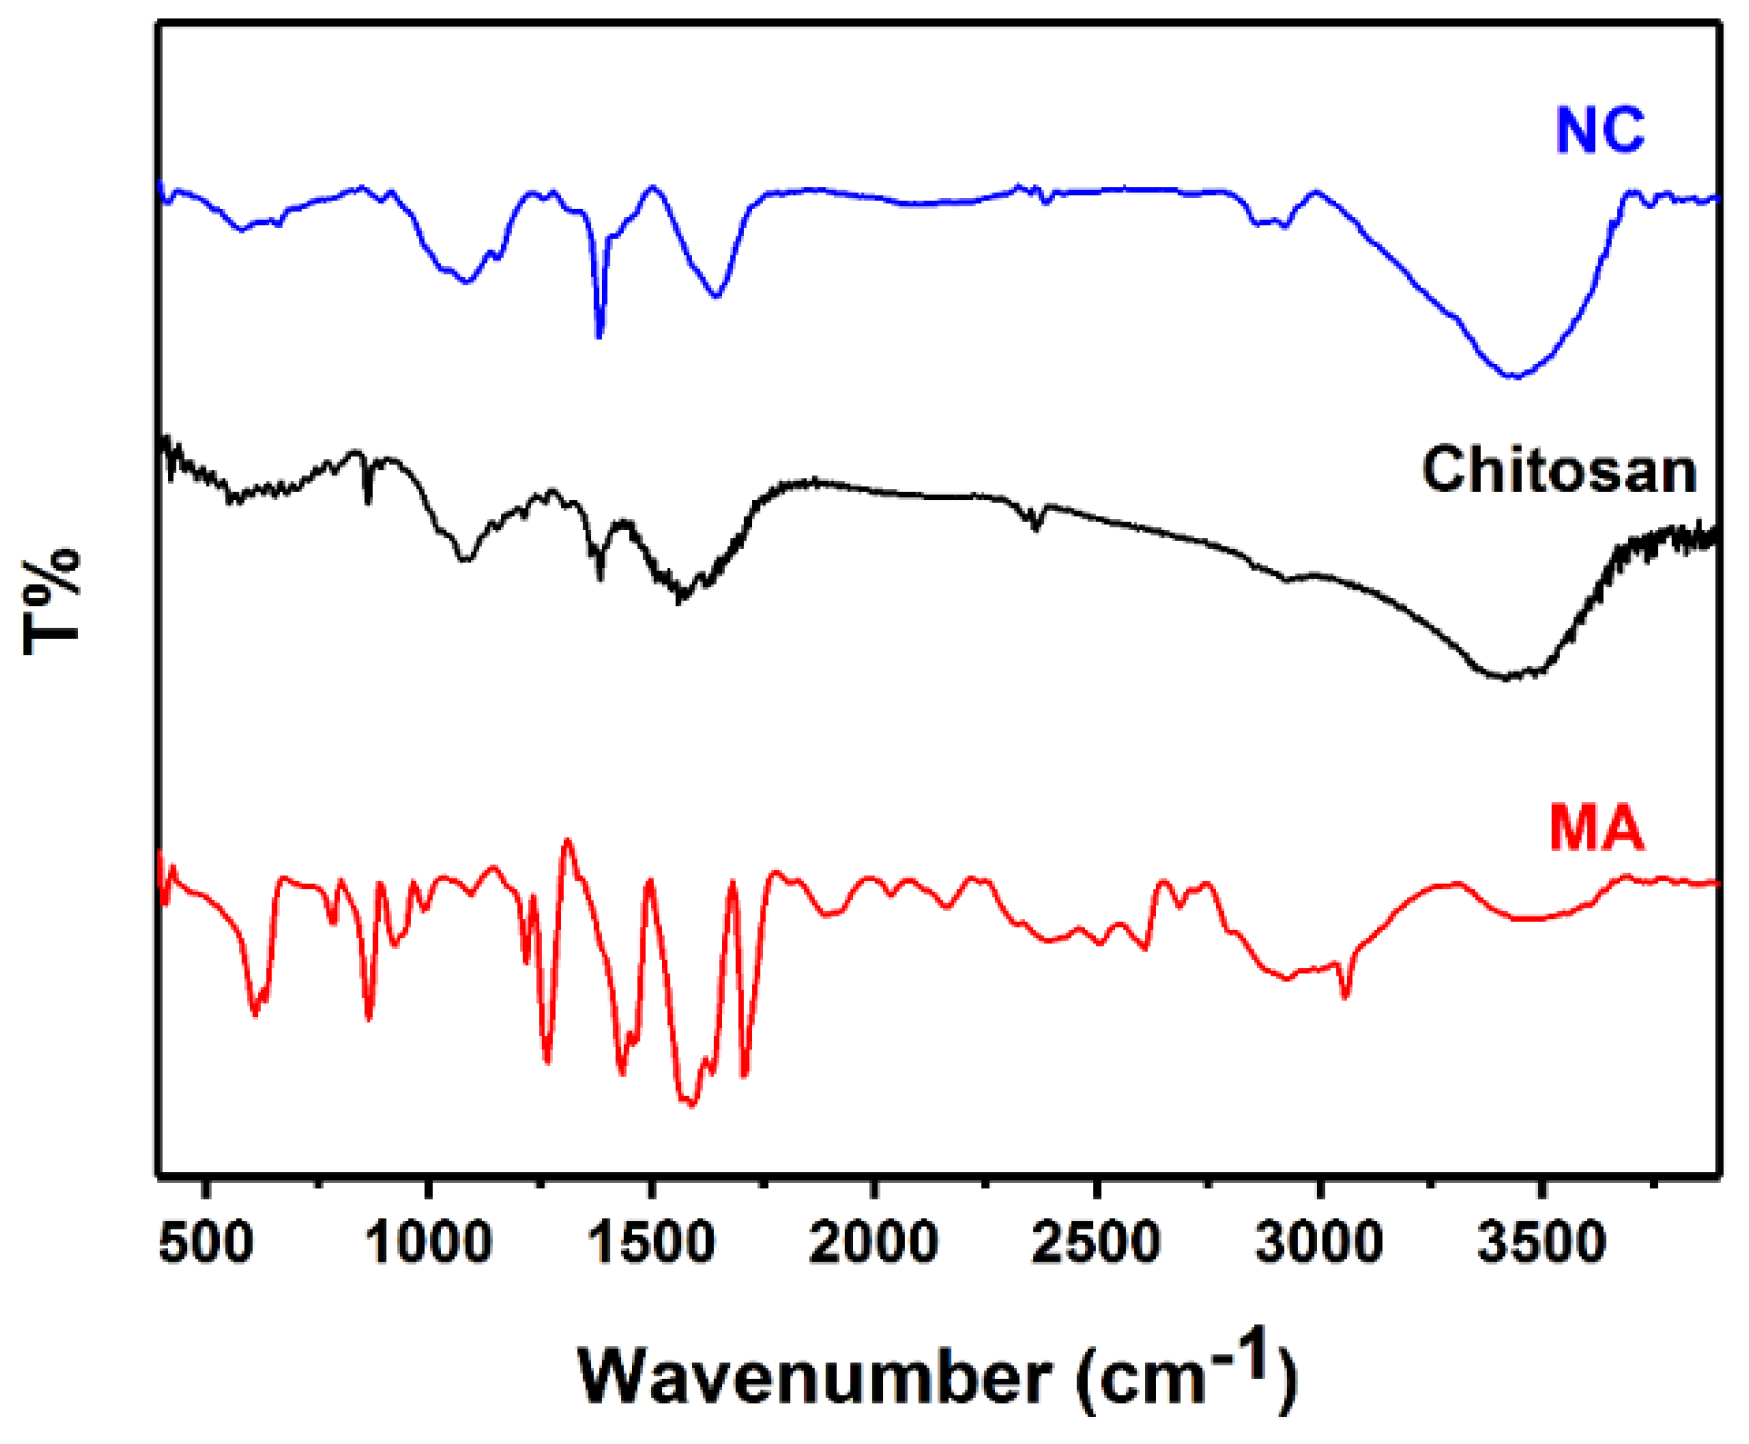
2.3. Characterizations of Chitosan and NC
2.4. Batch Experiment
3. Results and Discussion
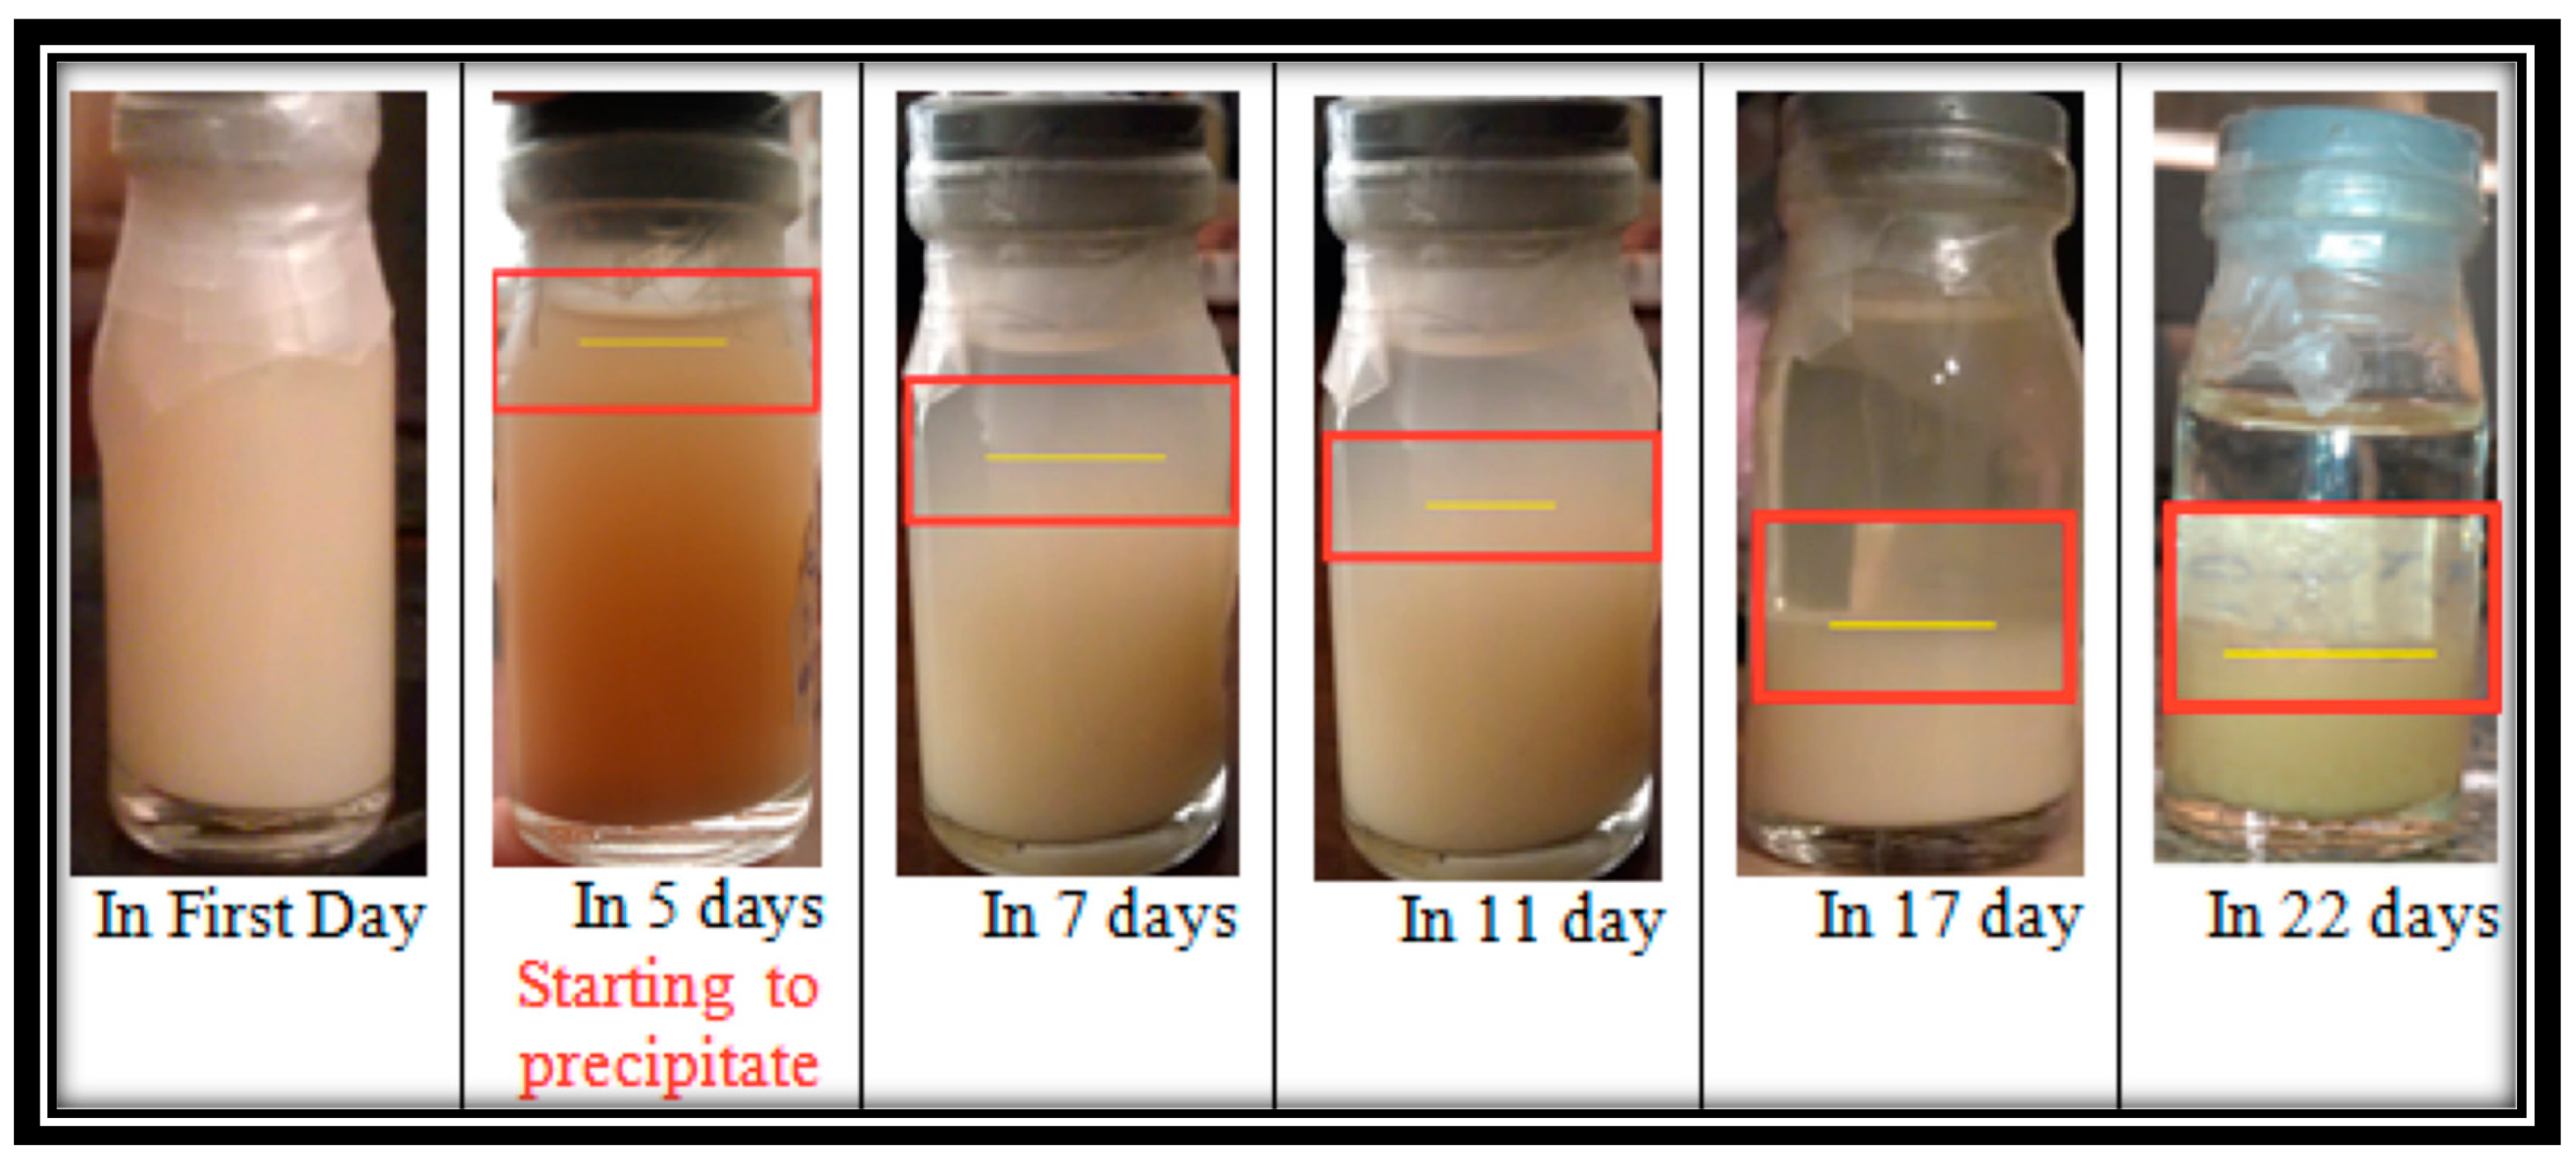
3.1. Synthesis of Nanochitosan
3.2. Effect of Chitosan and NC in Adsorption of Pb(II) Ions from Aqueous Solution
3.2.1. Effect of pH
3.2.2. Effect of Contact Time
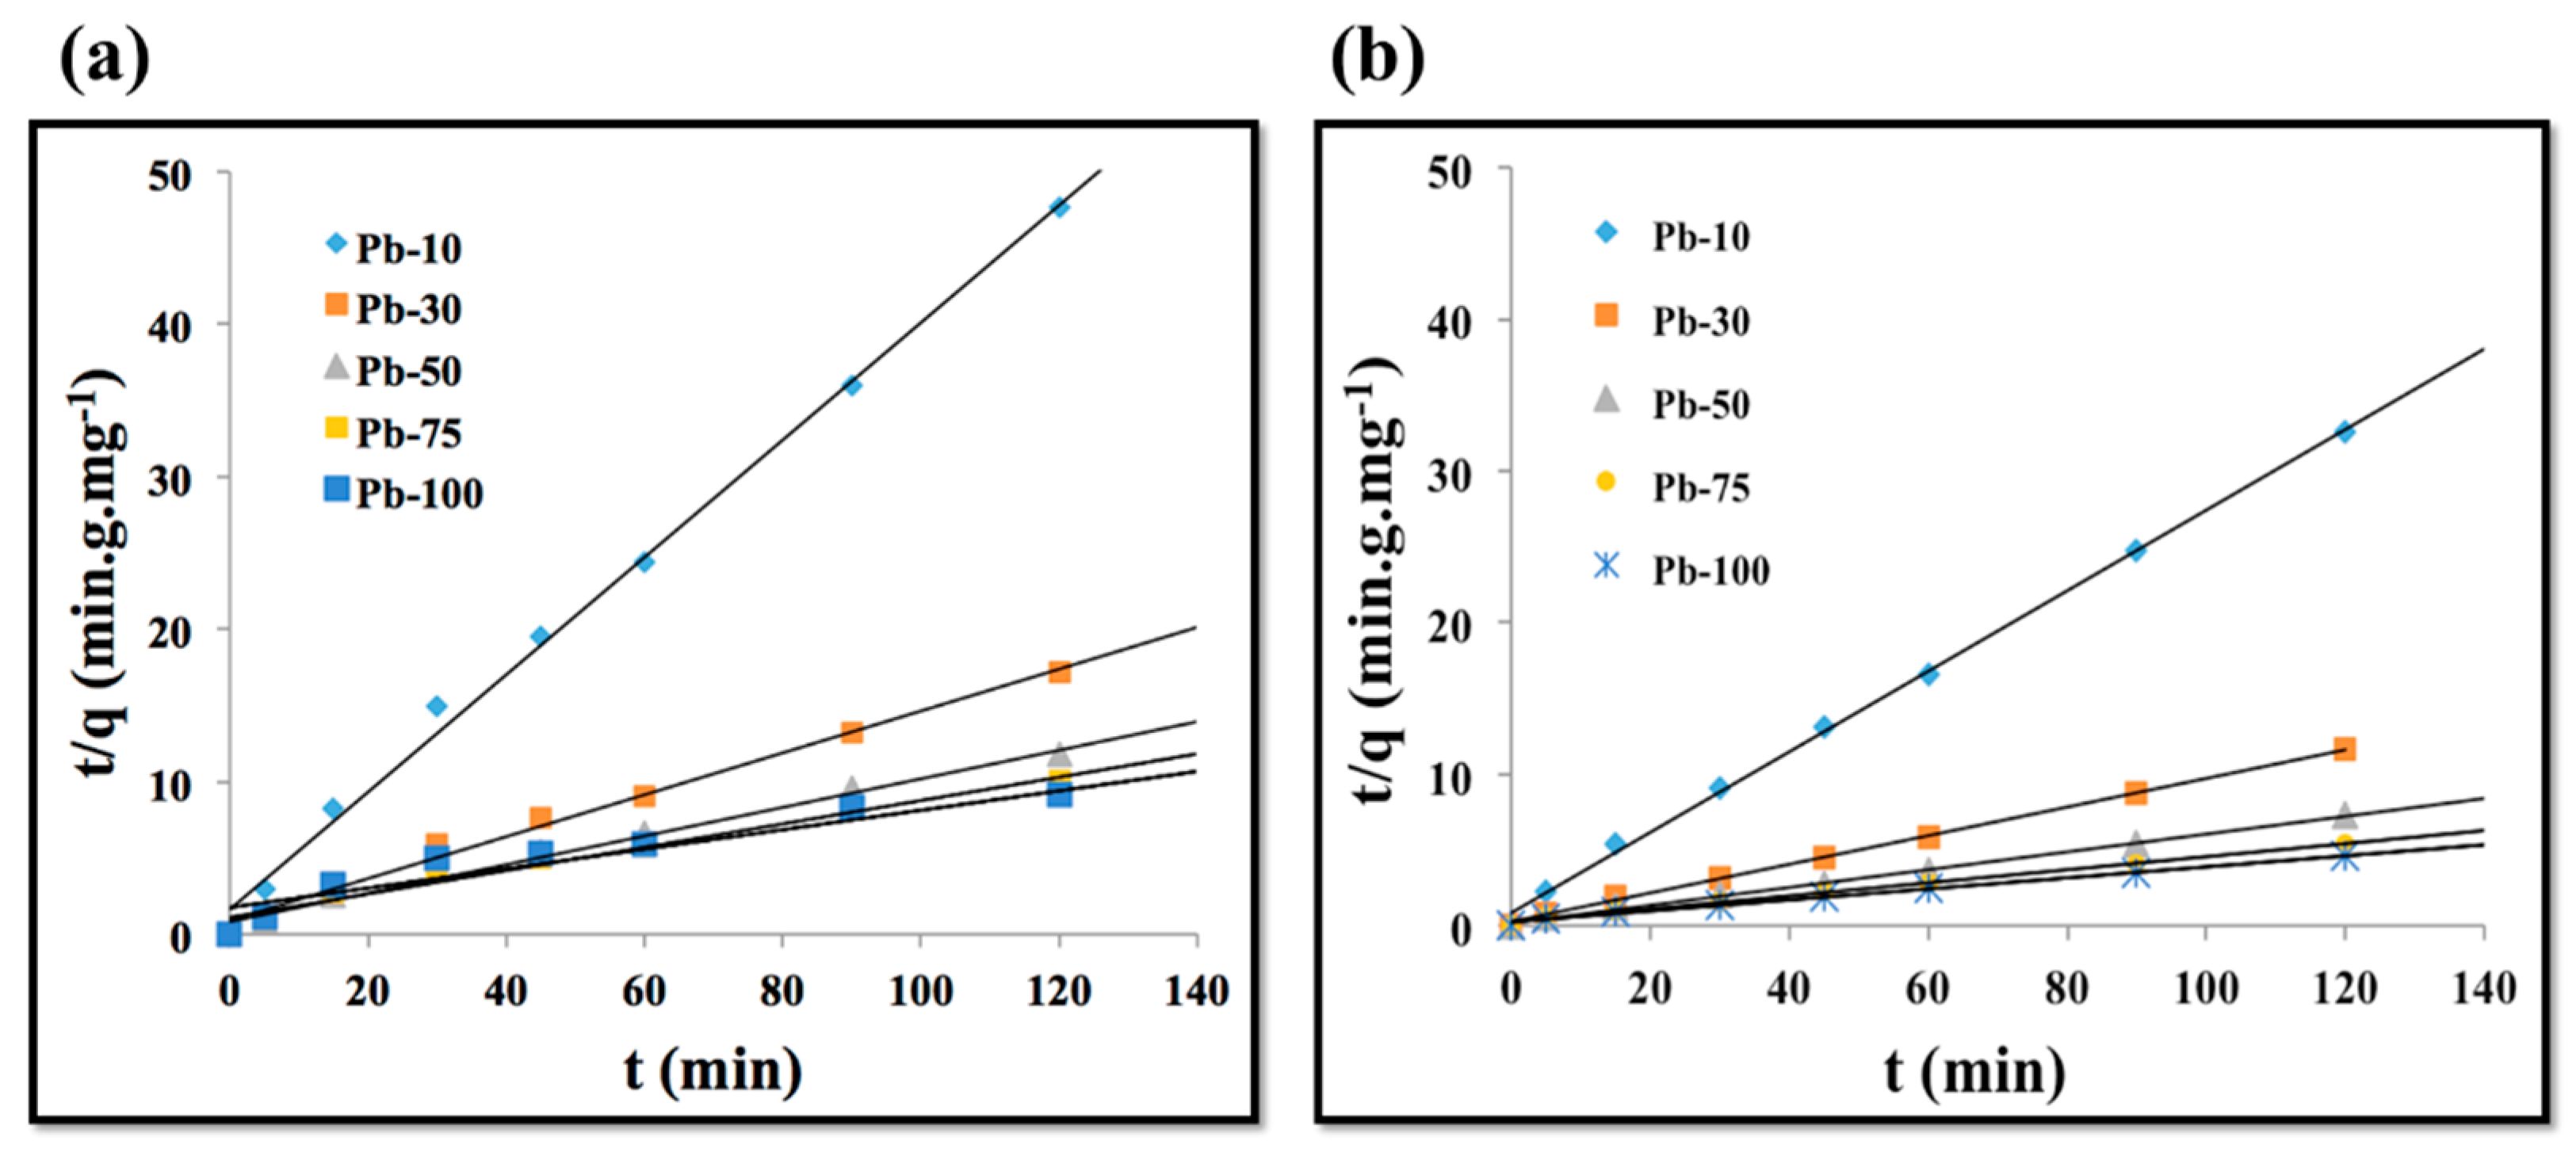
3.2.3. Kinetics of Adsorption
3.2.4. Adsorption Isotherms
3.3. Comparison between NC Adsorption Capacity and Other Adsorbents
4. Conclusions
Author Contributions
Funding
Acknowledgments
Conflicts of Interest
References
- Shahzad, A.; Miran, W.; Rasool, K.; Nawaz, M.; Jang, J.; Lim, S.-R.; Lee, D.S. Heavy metals removal by EDTA-functionalized chitosan graphene oxide nanocomposites. RSC Adv. 2017, 7, 9764–9771. [Google Scholar] [CrossRef]
- Shahraki, S.; Delarami, H.S. Magnetic chitosan-(d-glucosimine methyl) benzaldehyde Schiff base for Pb+2 ion removal. Experimental and theoretical methods. Carbohydr. Polym. 2018, 200, 211–220. [Google Scholar] [CrossRef] [PubMed]
- Lu, Z.; Tan, R.; Chu, W.; Tang, S.; Xu, W.; Song, W. Synthesis of SrHPO4/Fe3O4 magnetic nanocomposite and its application on Pb2+ removal from aqueous solutions. Microchem. J. 2018, 142, 152–158. [Google Scholar] [CrossRef]
- Yu, Z.; Dang, Q.; Liu, C.; Cha, D.; Zhang, H.; Zhu, W.; Zhang, Q.; Fan, B. Preparation and characterization of poly(maleic acid)-grafted cross-linked chitosan microspheres for Cd(II) adsorption. Carbohyd. Polym. 2017, 172, 28–39. [Google Scholar] [CrossRef]
- Rojas, R. Copper, lead and cadmium removal by Ca Al layered double hydroxides. Appl. Clay Sci. 2014, 87, 254–259. [Google Scholar] [CrossRef]
- Dąbrowski, A.; Hubicki, Z.; Podkościelny, P.; Robens, E. Selective removal of the heavy metal ions from waters and industrial wastewaters by ion-exchange method. Chemosphere 2004, 56, 91–106. [Google Scholar] [CrossRef]
- Khulbe, K.; Matsuura, T. Removal of heavy metals and pollutants by membrane adsorption techniques. Appl. Water Sci. 2018, 8, 19. [Google Scholar] [CrossRef]
- Vilela, P.B.; Dalalibera, A.; Duminelli, E.C.; Becegato, V.A.; Paulino, A.T. Adsorption and removal of chromium(VI) contained in aqueous solutions using a chitosan-based hydrogel. Environ. Sci. Pollut. Res. 2018, 26, 28481–28489. [Google Scholar] [CrossRef]
- Lin, Y.; Ma, J.; Liu, W.; Li, Z.; He, K. Correction to: Efficient removal of dyes from dyeing wastewater by powder activated charcoal/titanate nanotube nanocomposites: Adsorption and photoregeneration. Environ. Sci. Pollut. Res. Int. 2019, 26, 10274–10275. [Google Scholar] [CrossRef]
- Zou, C.; Jiang, W.; Liang, J.; Sun, X.; Guan, Y. Removal of Pb(II) from aqueous solutions by adsorption on magnetic bentonite. Environ. Sci. Pollut. Res. 2019, 26, 1315–1322. [Google Scholar] [CrossRef]
- Liu, Y.; Luan, J.; Zhang, C.; Ke, X.; Zhang, H. The adsorption behavior of multiple contaminants like heavy metal ions and p-nitrophenol on organic-modified montmorillonite. Environ. Sci. Pollut. Res. 2019, 26, 10387–10397. [Google Scholar] [CrossRef] [PubMed]
- Rinaudo, M. Chitin and chitosan: Properties and applications. Prog. Polym. Sci. 2006, 31, 603–632. [Google Scholar] [CrossRef]
- Gutha, Y.; Munagapati, V.S. Removal of Pb(II) ions by using magnetic chitosan-4-((pyridin-2-ylimino) methyl) benzaldehyde Schiff’s base. Int. J. Biol. Macromol. 2016, 93, 408–417. [Google Scholar] [CrossRef] [PubMed]
- Liu, B.; Chen, X.; Zheng, H.; Wang, Y.; Sun, Y.; Zhao, C.; Zhang, S. Rapid and efficient removal of heavy metal and cationic dye by carboxylate-rich magnetic chitosan flocculants: Role of ionic groups. Carbohydr. Polym. 2018, 181, 327–336. [Google Scholar] [CrossRef] [PubMed]
- Chiou, M.-S.; Ho, P.-Y.; Li, H.-Y. Adsorption of anionic dyes in acid solutions using chemically cross-linked chitosan beads. Dye. Pigment. 2004, 60, 69–84. [Google Scholar] [CrossRef]
- Sutirman, Z.A.; Sanagi, M.M.; Karim, J.A.; Naim, A.A.; Ibrahim, W.A.W. New crosslinked-chitosan graft poly(N-vinyl-2-pyrrolidone) for the removal of Cu(II) ions from aqueous solutions. Int. J. Biol. Macromol. 2018, 107, 891–897. [Google Scholar] [CrossRef] [PubMed]
- Doshi, B.; Ayati, A.; Tanhaei, B.; Repo, E.; Sillanpää, M. Partially carboxymethylated and partially cross-linked surface of chitosan versus the adsorptive removal of dyes and divalent metal ions. Carbohydr. Polym. 2018, 197, 586–597. [Google Scholar] [CrossRef]
- Lu, F.; Astruc, D. Nanomaterials for removal of toxic elements from water. Coord. Chem. Rev. 2018, 356, 147–164. [Google Scholar] [CrossRef]
- Ngah, W.W.; Teong, L.; Hanafiah, M.A.K.M. Adsorption of dyes and heavy metal ions by chitosan composites: A review. Carbohyd. Polym. 2011, 83, 1446–1456. [Google Scholar] [CrossRef]
- Kyzas, G.Z.; Siafaka, P.I.; Lambropoulou, D.A.; Lazaridis, N.K.; Bikiaris, D.N. Poly(itaconic acid)-grafted chitosan adsorbents with different cross-linking for Pb(II) and Cd(II) uptake. Langmuir 2014, 30, 120–131. [Google Scholar] [CrossRef]
- Hosseini, S.M.; Younesi, H.; Bahramifar, N.; Mehraban, Z. A novel facile synthesis of the amine-functionalized magnetic core coated carboxylated nanochitosan shells as an amphoteric nanobiosupport. Carbohydr. Polym. 2019, 221, 174–185. [Google Scholar] [CrossRef]
- Divya, K.; Jisha, M.S. Chitosan nanoparticles preparation and applications. Environ. Chem. Lett. 2018, 16, 101–112. [Google Scholar] [CrossRef]
- Zolfaghari, G.; Esmaili-Sari, A.; Anbia, M.; Younesi, H.; Amirmahmoodi, S.; Ghafari-Nazari, A. Taguchi optimization approach for Pb(II) and Hg(II) removal from aqueous solutions using modified mesoporous carbon. J. Hazard. Mater. 2011, 192, 1046–1055. [Google Scholar] [CrossRef] [PubMed]
- Zareie, C.; Najafpour, G. Preparation of nanochitosan as an effective sorbent for the removal of copper ions from aqueous solutions. Int. J. Eng. Trans. B Appl. 2013, 26, 829–836. [Google Scholar] [CrossRef]
- Fan, W.; Yan, W.; Xu, Z.; Ni, H. Formation mechanism of monodisperse, low molecular weight chitosan nanoparticles by ionic gelation technique. Colloids Surf. B Biointerfaces 2012, 90, 21–27. [Google Scholar] [CrossRef] [PubMed]
- de Moura, M.R.; Aouada, F.A.; Mattoso, L.H. Preparation of chitosan nanoparticles using methacrylic acid. J. Colloid Interface Sci. 2008, 321, 477–483. [Google Scholar] [CrossRef]
- Amini, M.; Younesi, H.; Bahramifar, N.; Lorestani, A.A.Z.; Ghorbani, F.; Daneshi, A.; Sharifzadeh, M. Application of response surface methodology for optimization of lead biosorption in an aqueous solution by Aspergillus niger. J. Hazard. Mater. 2008, 154, 694–702. [Google Scholar] [CrossRef]
- Heidari, A.; Younesi, H.; Mehraban, Z. Removal of Ni(II), Cd(II), and Pb(II) from a ternary aqueous solution by amino functionalized mesoporous and nano mesoporous silica. Chem. Eng. J. 2009, 153, 70–79. [Google Scholar] [CrossRef]
- Yin, J.; Deng, C.; Yu, Z.; Wang, X.; Xu, G. Effective removal of lead ions from aqueous solution using nano illite/smectite clay: Isotherm, kinetic, and thermodynamic modeling of adsorption. Water 2018, 10, 210. [Google Scholar] [CrossRef]
- Haider, S.; Park, S.-Y. Preparation of the electrospun chitosan nanofibers and their applications to the adsorption of Cu(II) and Pb(II) ions from an aqueous solution. J. Membr. Sci. 2009, 328, 90–96. [Google Scholar] [CrossRef]
- Zhang, C.; Li, X.; Pang, J. Synthesis and adsorption properties of magnetic resin microbeads with amine and mercaptan as chelating groups. J. Appl. Polym. Sci. 2001, 82, 1587–1592. [Google Scholar] [CrossRef]
- Lagergren, S.; Sevensk, B. Zur theorie dur sogeunanten adsorption geloster stoffe. Vantens Kapsa Kedhandle 1898, 24, 134–178. [Google Scholar]
- Li, G.; Cai, W.; Zhao, R.; Hao, L. Electrosorptive removal of salt ions from water by membrane capacitive deionization (MCDI): Characterization, adsorption equilibrium, and kinetics. Environ. Sci. Pollut. Res. 2019, 1–10. [Google Scholar] [CrossRef] [PubMed]
- Javadian, H.; Ahmadi, M.; Ghiasvand, M.; Kahrizi, S.; Katal, R. Removal of Cr(VI) by modified brown algae Sargassum bevanom from aqueous solution and industrial wastewater. J. Taiwan Inst. Chem. Eng. 2013, 44, 977–989. [Google Scholar] [CrossRef]
- Katal, R.; Hasani, E.; Farnam, M.; Baei, M.S.; Ghayyem, M.A. Charcoal ash as an adsorbent for Ni(II) adsorption and its application for wastewater treatment. J. Chem. Eng. Data 2012, 57, 374–383. [Google Scholar] [CrossRef]
- Azizian, S. Kinetic models of sorption: A theoretical analysis. J. Colloid Interface Sci. 2004, 276, 47–52. [Google Scholar] [CrossRef]
- Chen, A.-H.; Liu, S.-C.; Chen, C.-Y.; Chen, C.-Y. Comparative adsorption of Cu(II), Zn(II), and Pb(II) ions in aqueous solution on the crosslinked chitosan with epichlorohydrin. J. Hazard. Mater. 2008, 154, 184–191. [Google Scholar] [CrossRef]
- Debbaudt, A.; Ferreira, M.; Gschaider, M. Theoretical and experimental study of M2+ adsorption on biopolymers. III. Comparative kinetic pattern of Pb, Hg and Cd. Carbohydr. Polym. 2004, 56, 321–332. [Google Scholar] [CrossRef]
- Genç, Ö.; Soysal, L.; Bayramoğlu, G.; Arıca, M.; Bektaş, S. Procion Green H-4G immobilized poly (hydroxyethylmethacrylate/chitosan) composite membranes for heavy metal removal. J. Hazard. Mater. 2003, 97, 111–125. [Google Scholar] [CrossRef]
- Sun, S.; Wang, L.; Wang, A. Adsorption properties of crosslinked carboxymethyl-chitosan resin with Pb(II) as template ions. J. Hazard. Mater. 2006, 136, 930–937. [Google Scholar] [CrossRef]
- Moradi, O.; Aghaie, M.; Zare, K.; Monajjemi, M.; Aghaie, H. The study of adsorption characteristics Cu2+ and Pb2+ ions onto PHEMA and P (MMA-HEMA) surfaces from aqueous single solution. J. Hazard. Mater. 2009, 170, 673–679. [Google Scholar] [CrossRef] [PubMed]
- Banerjee, M.; Basu, R.K.; Das, S.K. Cu(II) removal using green adsorbents: Kinetic modeling and plant scale-up design. Environ. Sci. Pollut. Res. 2018, 6, 11542–11557. [Google Scholar] [CrossRef] [PubMed]
- Katal, R.; Baei, M.S.; Rahmati, H.T.; Esfandian, H. Kinetic, isotherm and thermodynamic study of nitrate adsorption from aqueous solution using modified rice husk. J. Ind. Eng. Chem. 2012, 18, 295–302. [Google Scholar] [CrossRef]


| Sorbent | Initial Pb(II) Conc. (mg/L) | qe, exp (mg/g) | Pseudo-First-Order Model | Pseudo-Second-Order Model | ||||
|---|---|---|---|---|---|---|---|---|
| k1 (min−1) | qe1 (mg/g) | R2 | k2 (g·mg−1·min−1) | qe2 (mg/g) | R2 | |||
| Chitosan | 10 | 2.50 | 0.0576 | 1.894 | 0.908 | 0.0905 | 2.60 | 0.997 |
| 30 | 6.83 | 0.0484 | 5.483 | 0.932 | 0.0207 | 7.30 | 0.994 | |
| 50 | 10.15 | 0.0253 | 6.792 | 0.930 | 0.0992 | 10.87 | 0.994 | |
| 75 | 11.88 | 0.0258 | 9.528 | 0.957 | 0.0521 | 13.16 | 0.986 | |
| 100 | 12.60 | 0.0207 | 13.122 | 0.938 | 0.0226 | 15.87 | 0.975 | |
| NCs | 10 | 3.62 | 0.0759 | 2.761 | 0.949 | 0.0833 | 3.77 | 0.998 |
| 30 | 10.26 | 0.0806 | 8.414 | 0.984 | 0.0322 | 10.64 | 0.998 | |
| 50 | 16.45 | 0.0956 | 15.78 | 0.969 | 0.0192 | 17.24 | 0.998 | |
| 75 | 22.12 | 0.0553 | 19.498 | 0.984 | 0.0752 | 23.26 | 0.997 | |
| 100 | 25.82 | 0.0598 | 21.281 | 0.971 | 0.0525 | 27.78 | 0.996 | |
| Adsorbent | Langmuir Isotherm | Freundlich Isotherm | ||||
|---|---|---|---|---|---|---|
| qm (mg/g) | KL (L/mg) | R2 | n | KF (mg/g) | R2 | |
| NCs | 32.26 | 0.1188 | 0.997 | 1.790 | 4.140 | 0.975 |
| Chitosan | 16.39 | 0.055 | 0.991 | 1.78 | 1.422 | 0.905 |
| Adsorbent | Pb(II) qe | Ref. |
|---|---|---|
| Chitosan | 13.1 mg/g | [37] |
| Chitosan-pectin pellets | 11.9 mg/g | [38] |
| Chitosan crosslinked with ECH | 34.13 mg/g | [37] |
| Procion Green H-4G immobilized pHEMA + chitosan | 68.81 mg/g | [39] |
| Crosslinked carboxymethyl-chitosan resin | 0.15 mmol/g | [40] |
| Copolymer 2-hydroxyethyl methacrylate with monomer methyl methacrylate | 31.5 mg/g | [41] |
| NC | 32.26 mg/g | This study |
© 2019 by the authors. Licensee MDPI, Basel, Switzerland. This article is an open access article distributed under the terms and conditions of the Creative Commons Attribution (CC BY) license (http://creativecommons.org/licenses/by/4.0/).
Share and Cite
Zareie, C.; Kholghi Eshkalak, S.; Najafpour Darzi, G.; Sharifzadeh Baei, M.; Younesi, H.; Ramakrishna, S. Uptake of Pb(II) Ions from Simulated Aqueous Solution via Nanochitosan. Coatings 2019, 9, 862. https://doi.org/10.3390/coatings9120862
Zareie C, Kholghi Eshkalak S, Najafpour Darzi G, Sharifzadeh Baei M, Younesi H, Ramakrishna S. Uptake of Pb(II) Ions from Simulated Aqueous Solution via Nanochitosan. Coatings. 2019; 9(12):862. https://doi.org/10.3390/coatings9120862
Chicago/Turabian StyleZareie, Camellia, Saeideh Kholghi Eshkalak, Ghasem Najafpour Darzi, Mazyar Sharifzadeh Baei, Habibollah Younesi, and Seeram Ramakrishna. 2019. "Uptake of Pb(II) Ions from Simulated Aqueous Solution via Nanochitosan" Coatings 9, no. 12: 862. https://doi.org/10.3390/coatings9120862
APA StyleZareie, C., Kholghi Eshkalak, S., Najafpour Darzi, G., Sharifzadeh Baei, M., Younesi, H., & Ramakrishna, S. (2019). Uptake of Pb(II) Ions from Simulated Aqueous Solution via Nanochitosan. Coatings, 9(12), 862. https://doi.org/10.3390/coatings9120862