Ce3+/Eu2+ Doped Al2O3 Coatings Formed by Plasma Electrolytic Oxidation of Aluminum: Photoluminescence Enhancement by Ce3+→Eu2+ Energy Transfer


Abstract
1. Introduction
2. Materials and Methods
3. Results and Discussion
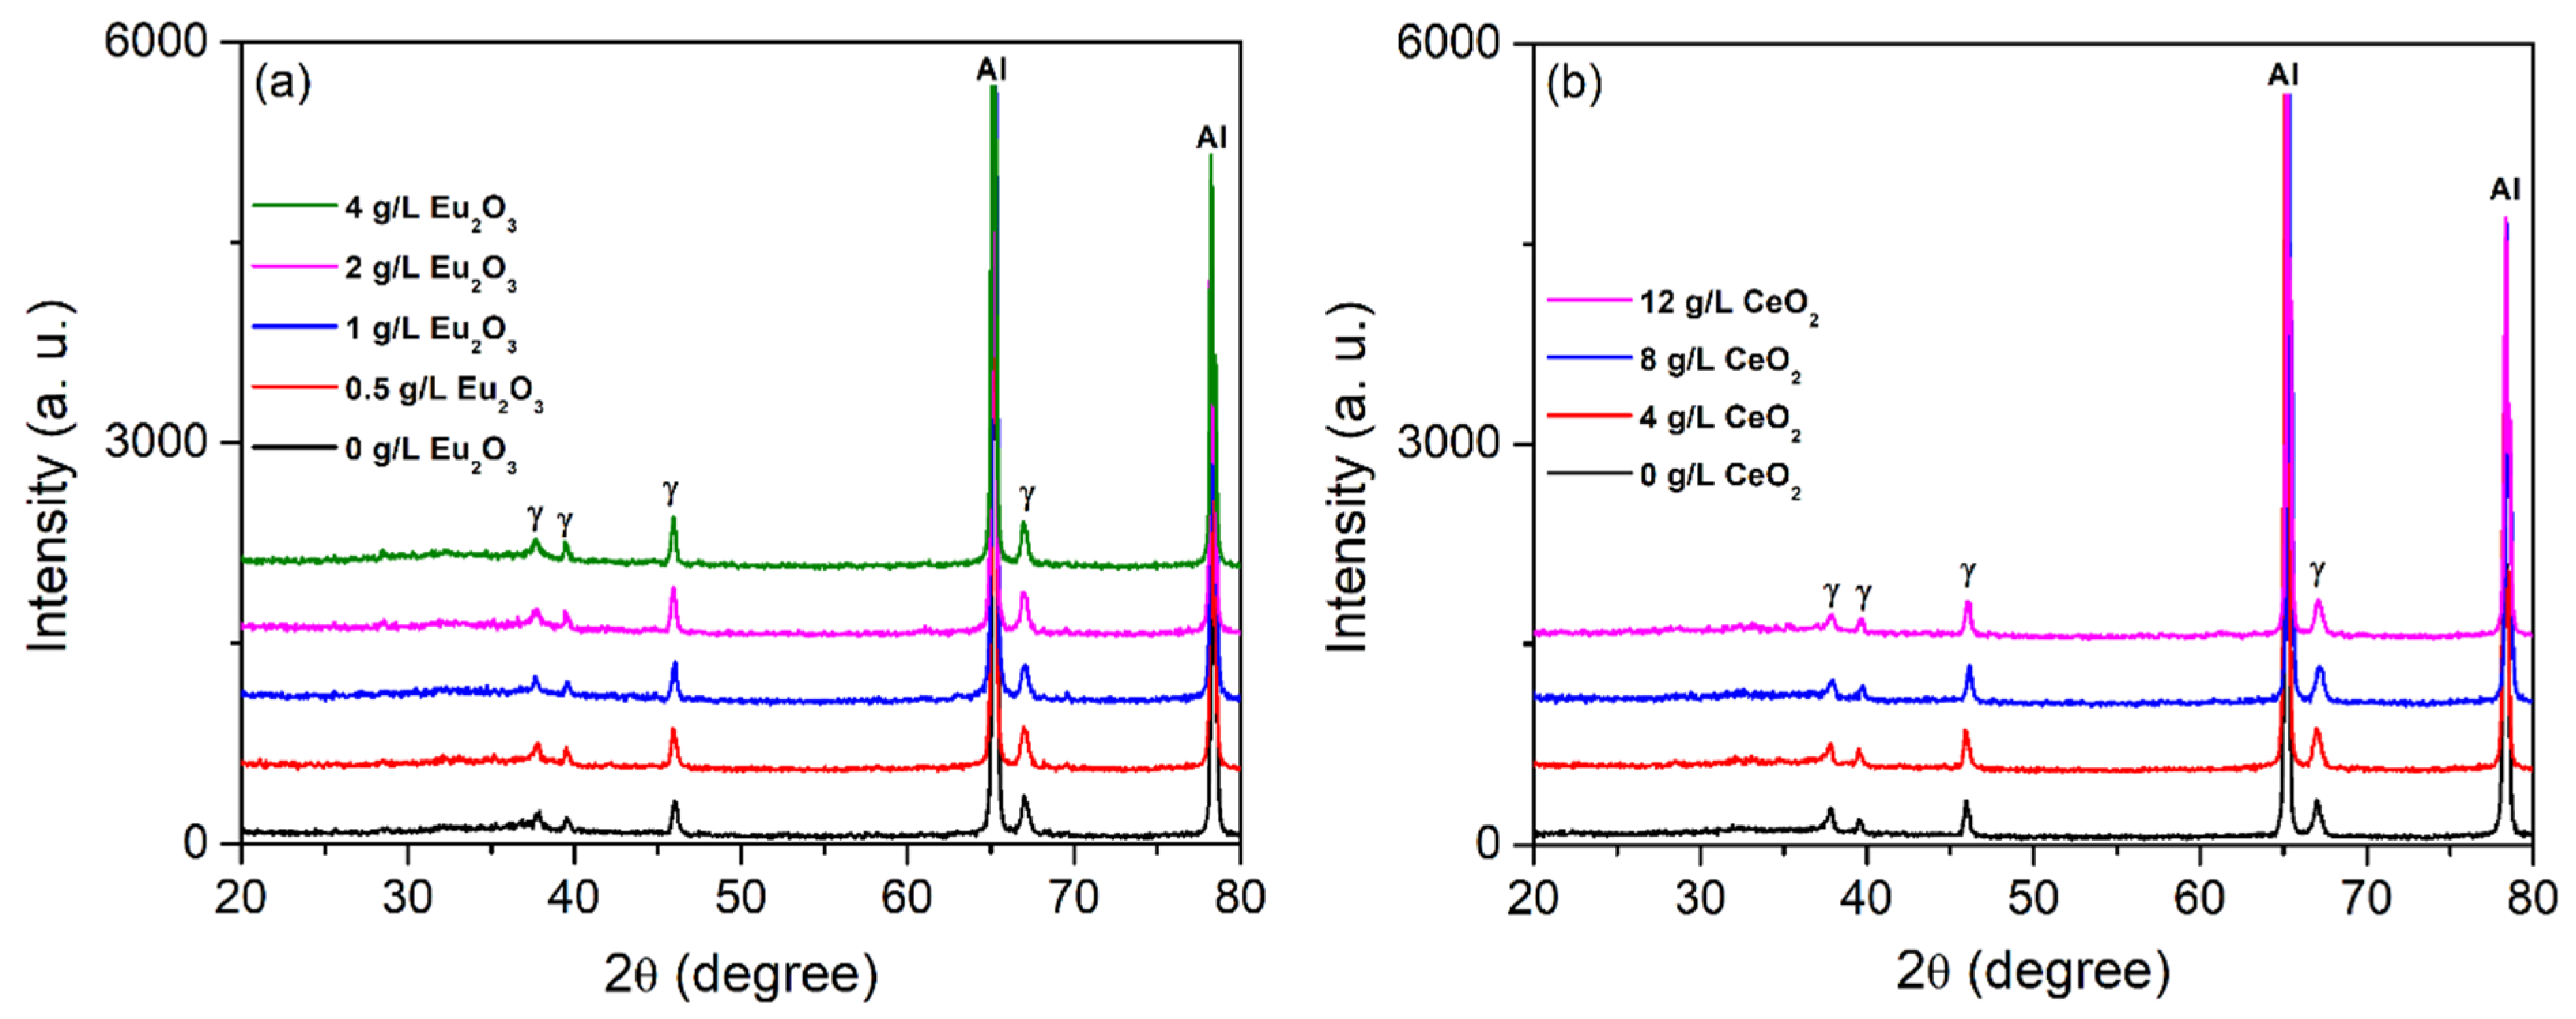
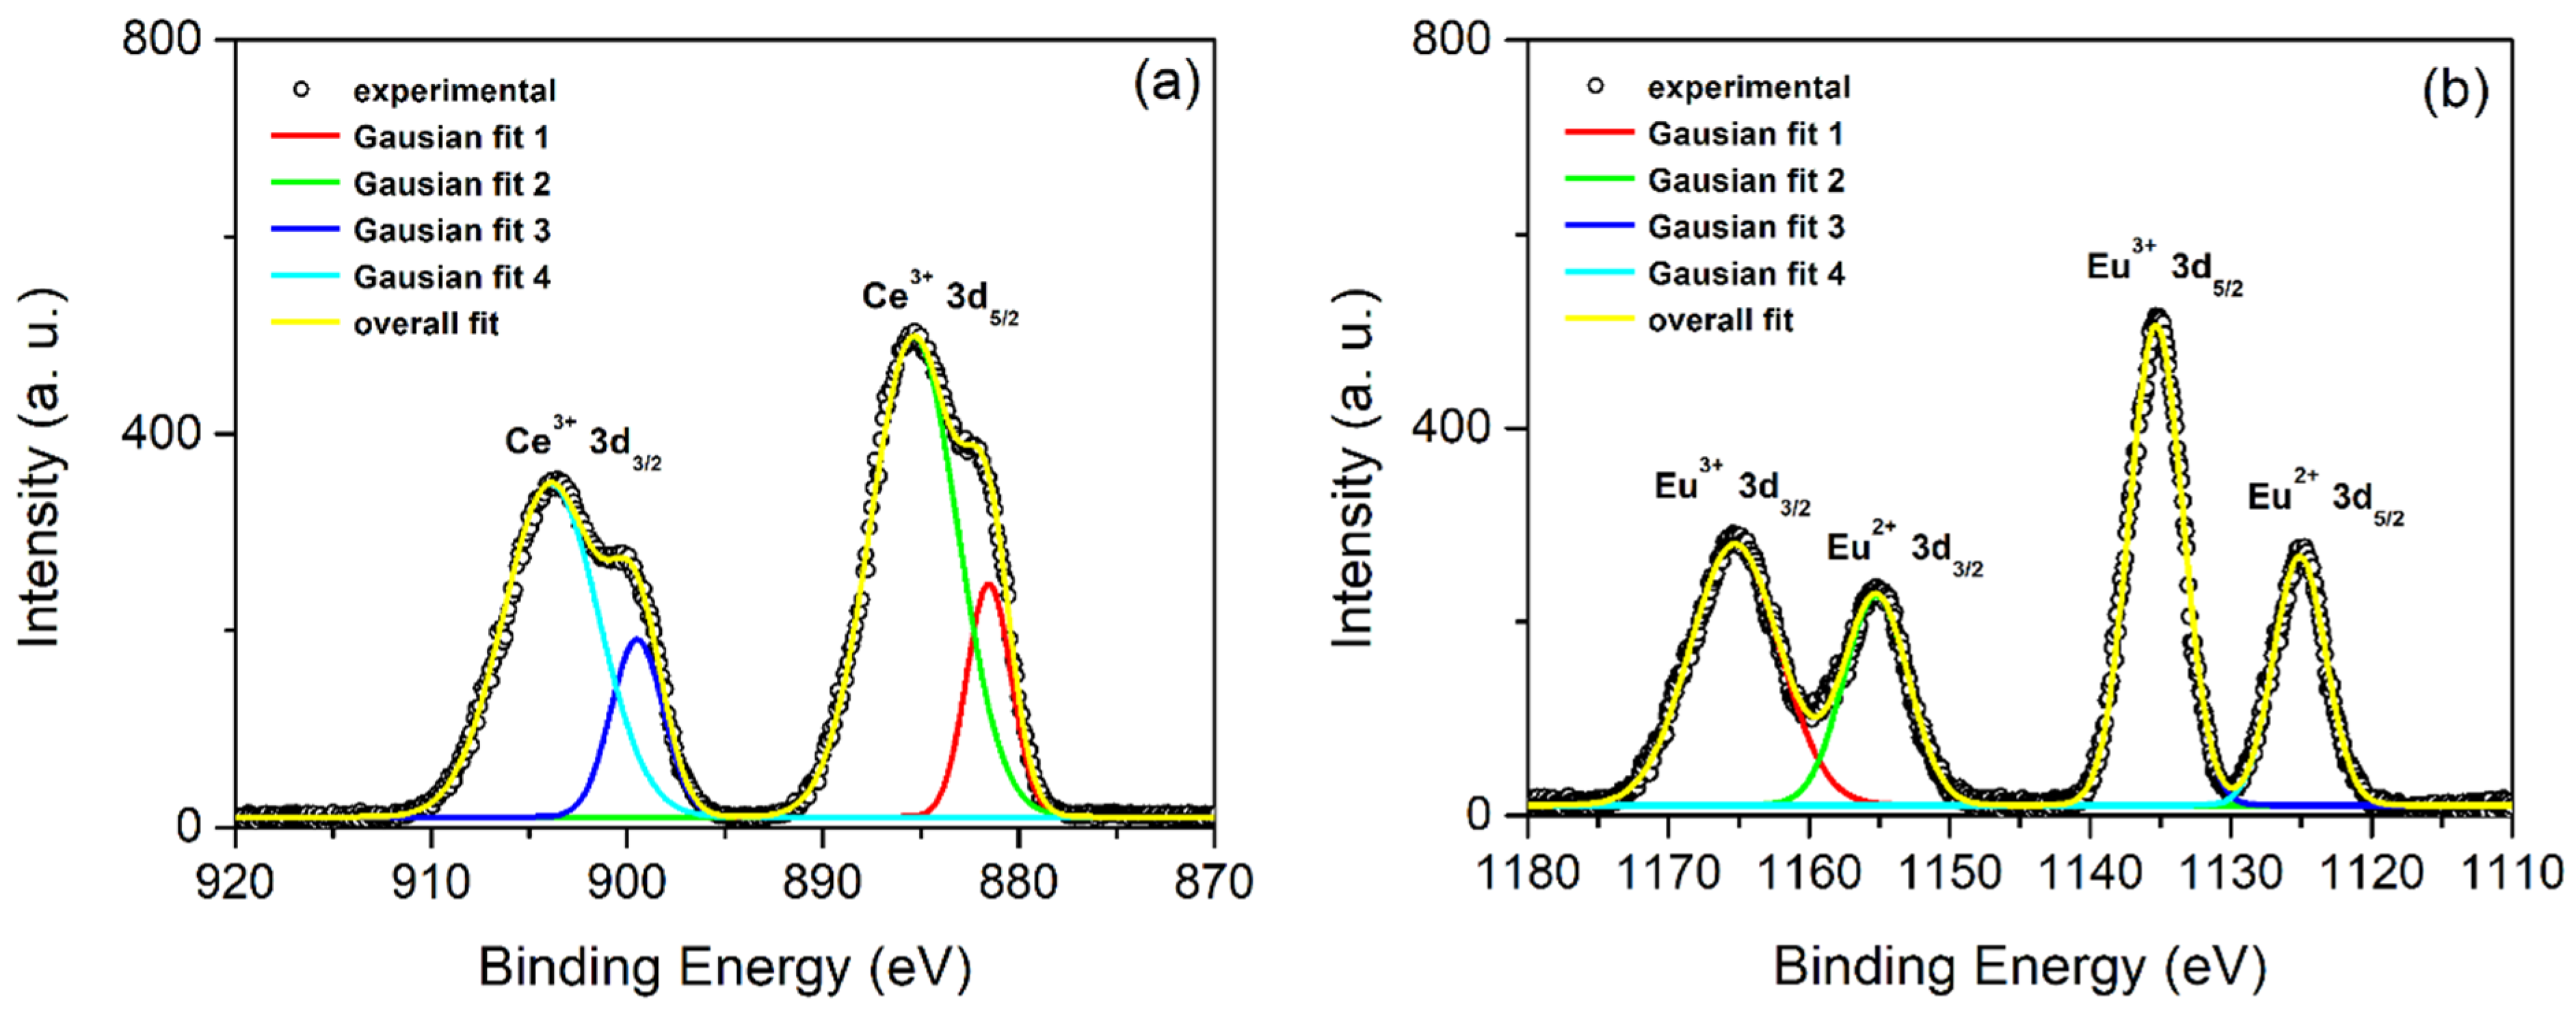
3.1. PEO Coatings’ Morphology, Phase and Chemical Composition
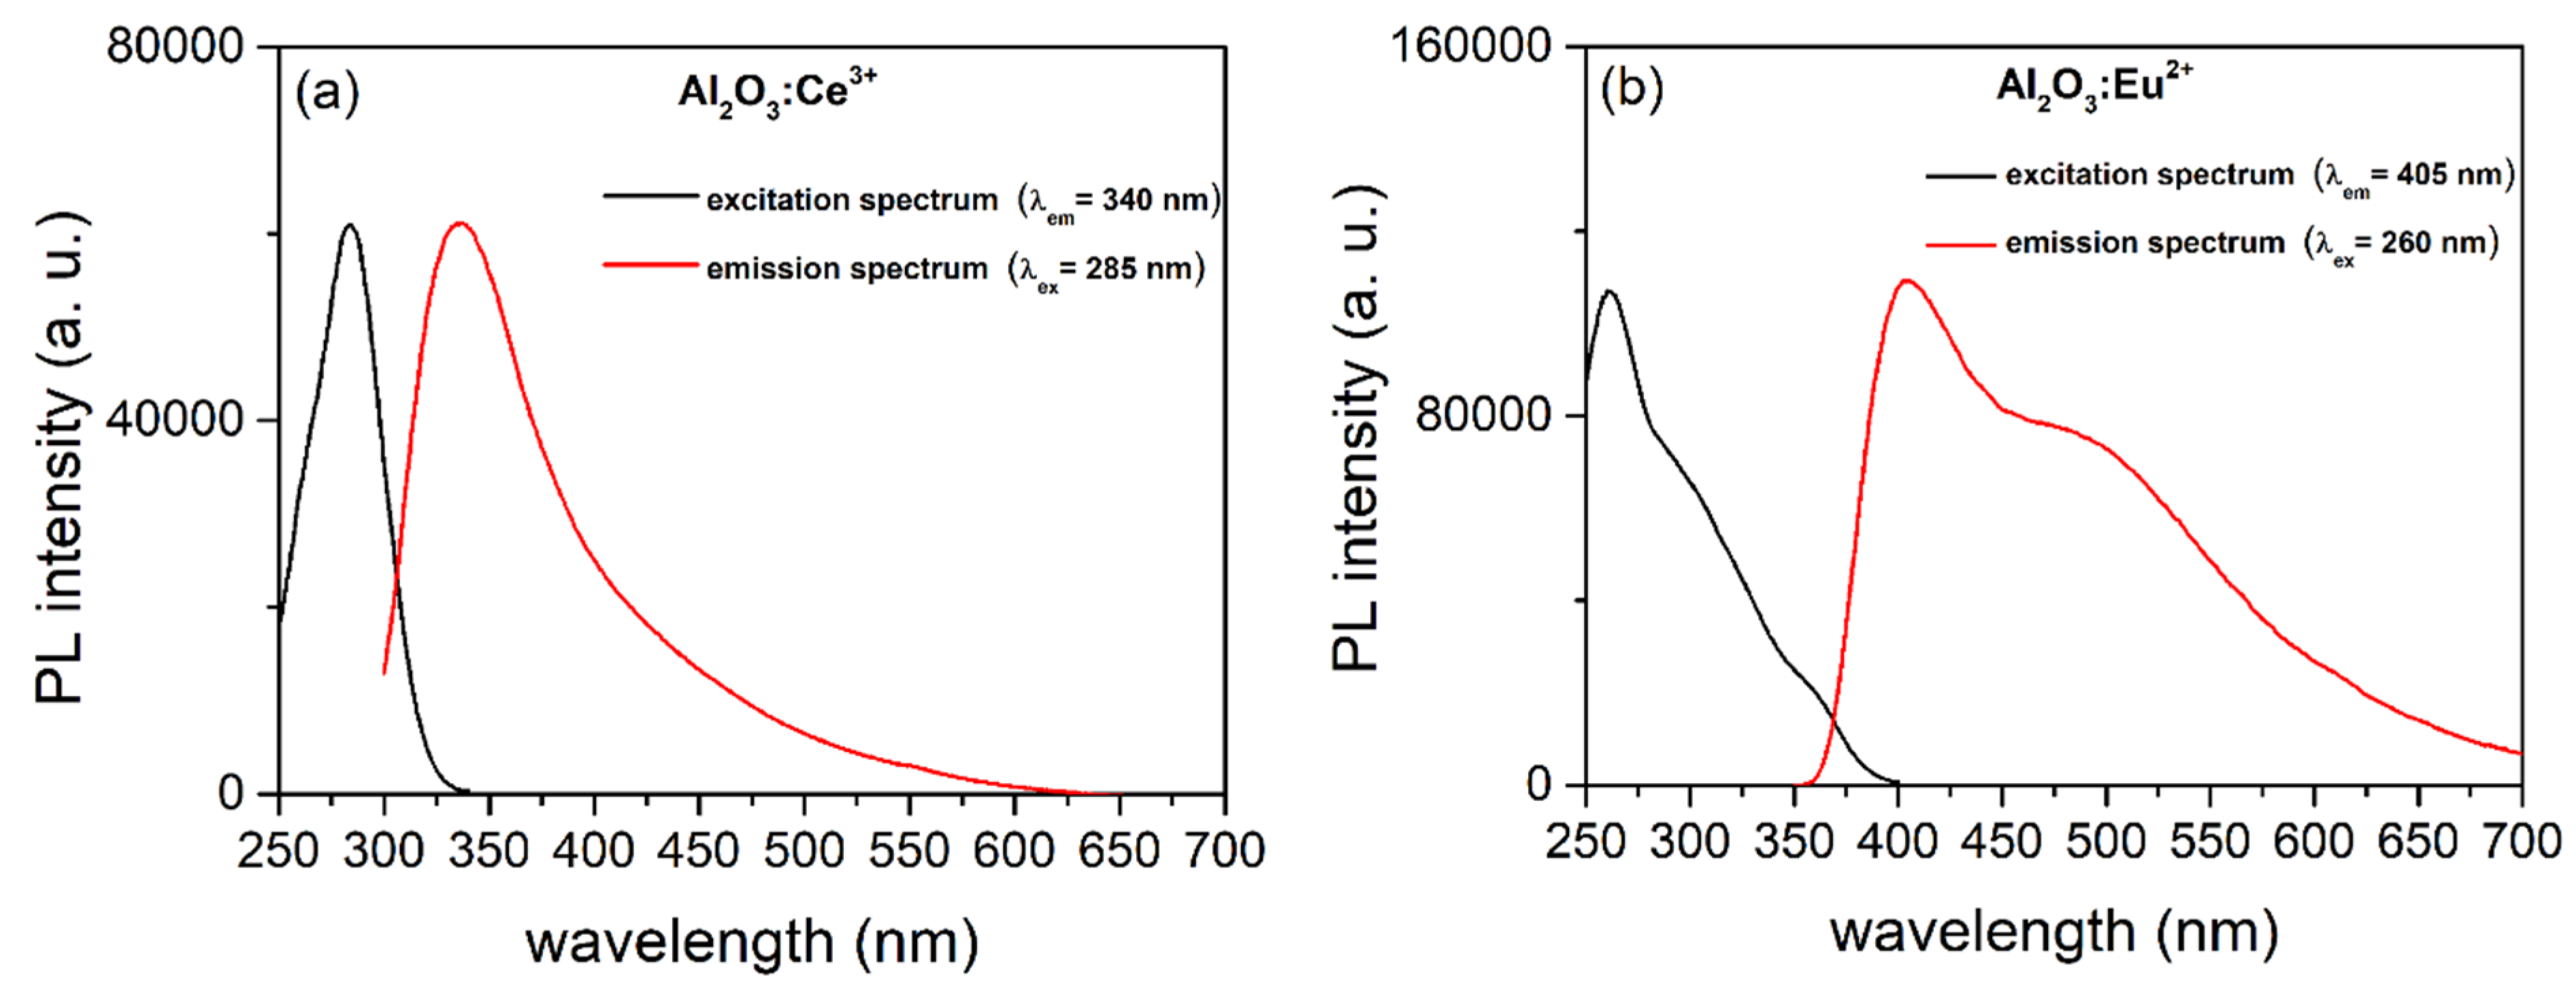
3.2. PL of Al2O3:Ce3+ and Al2O3:Eu2+ Coatings
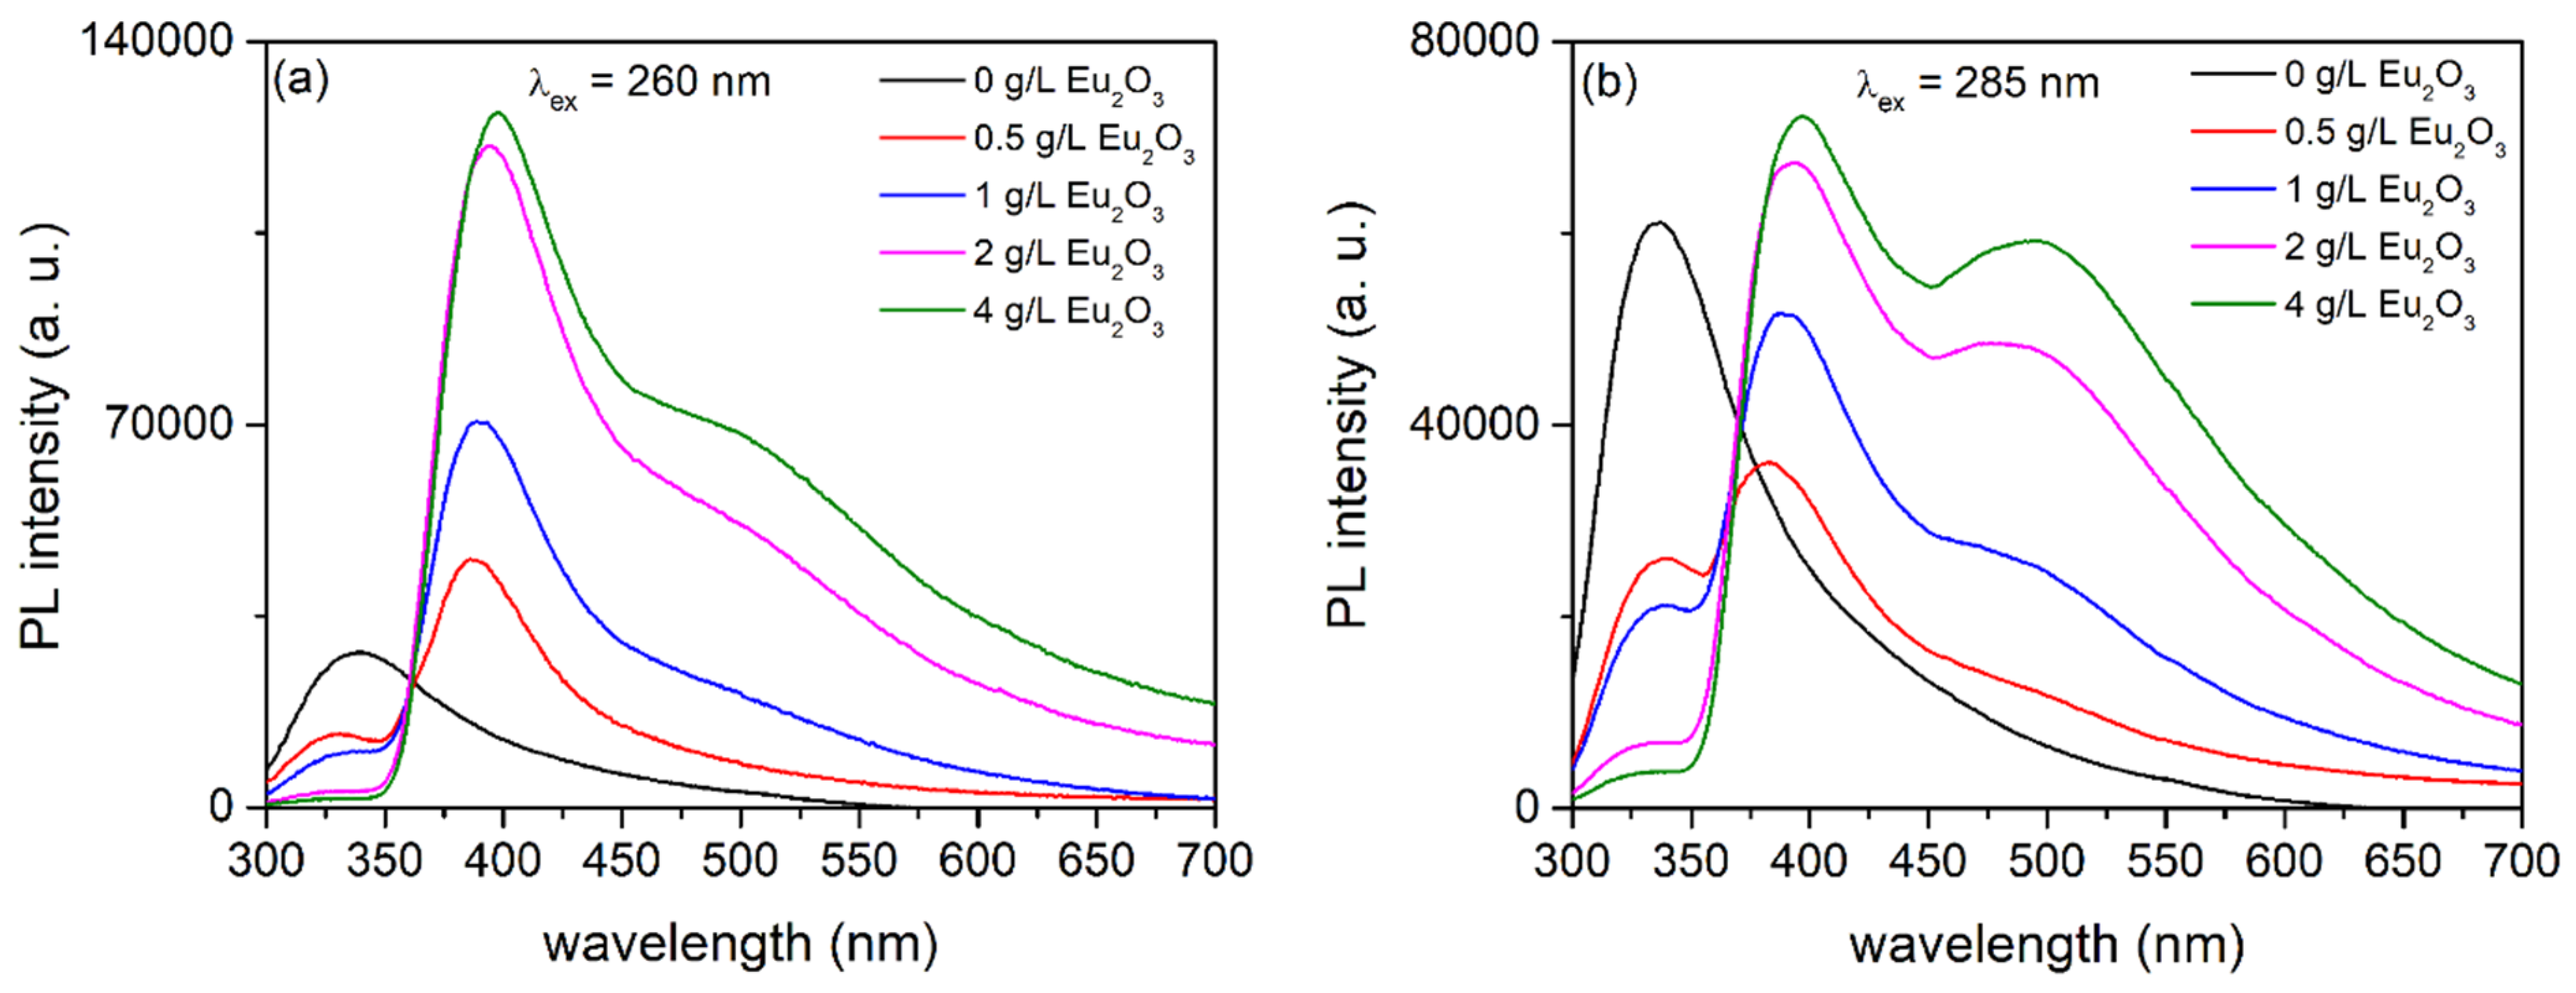
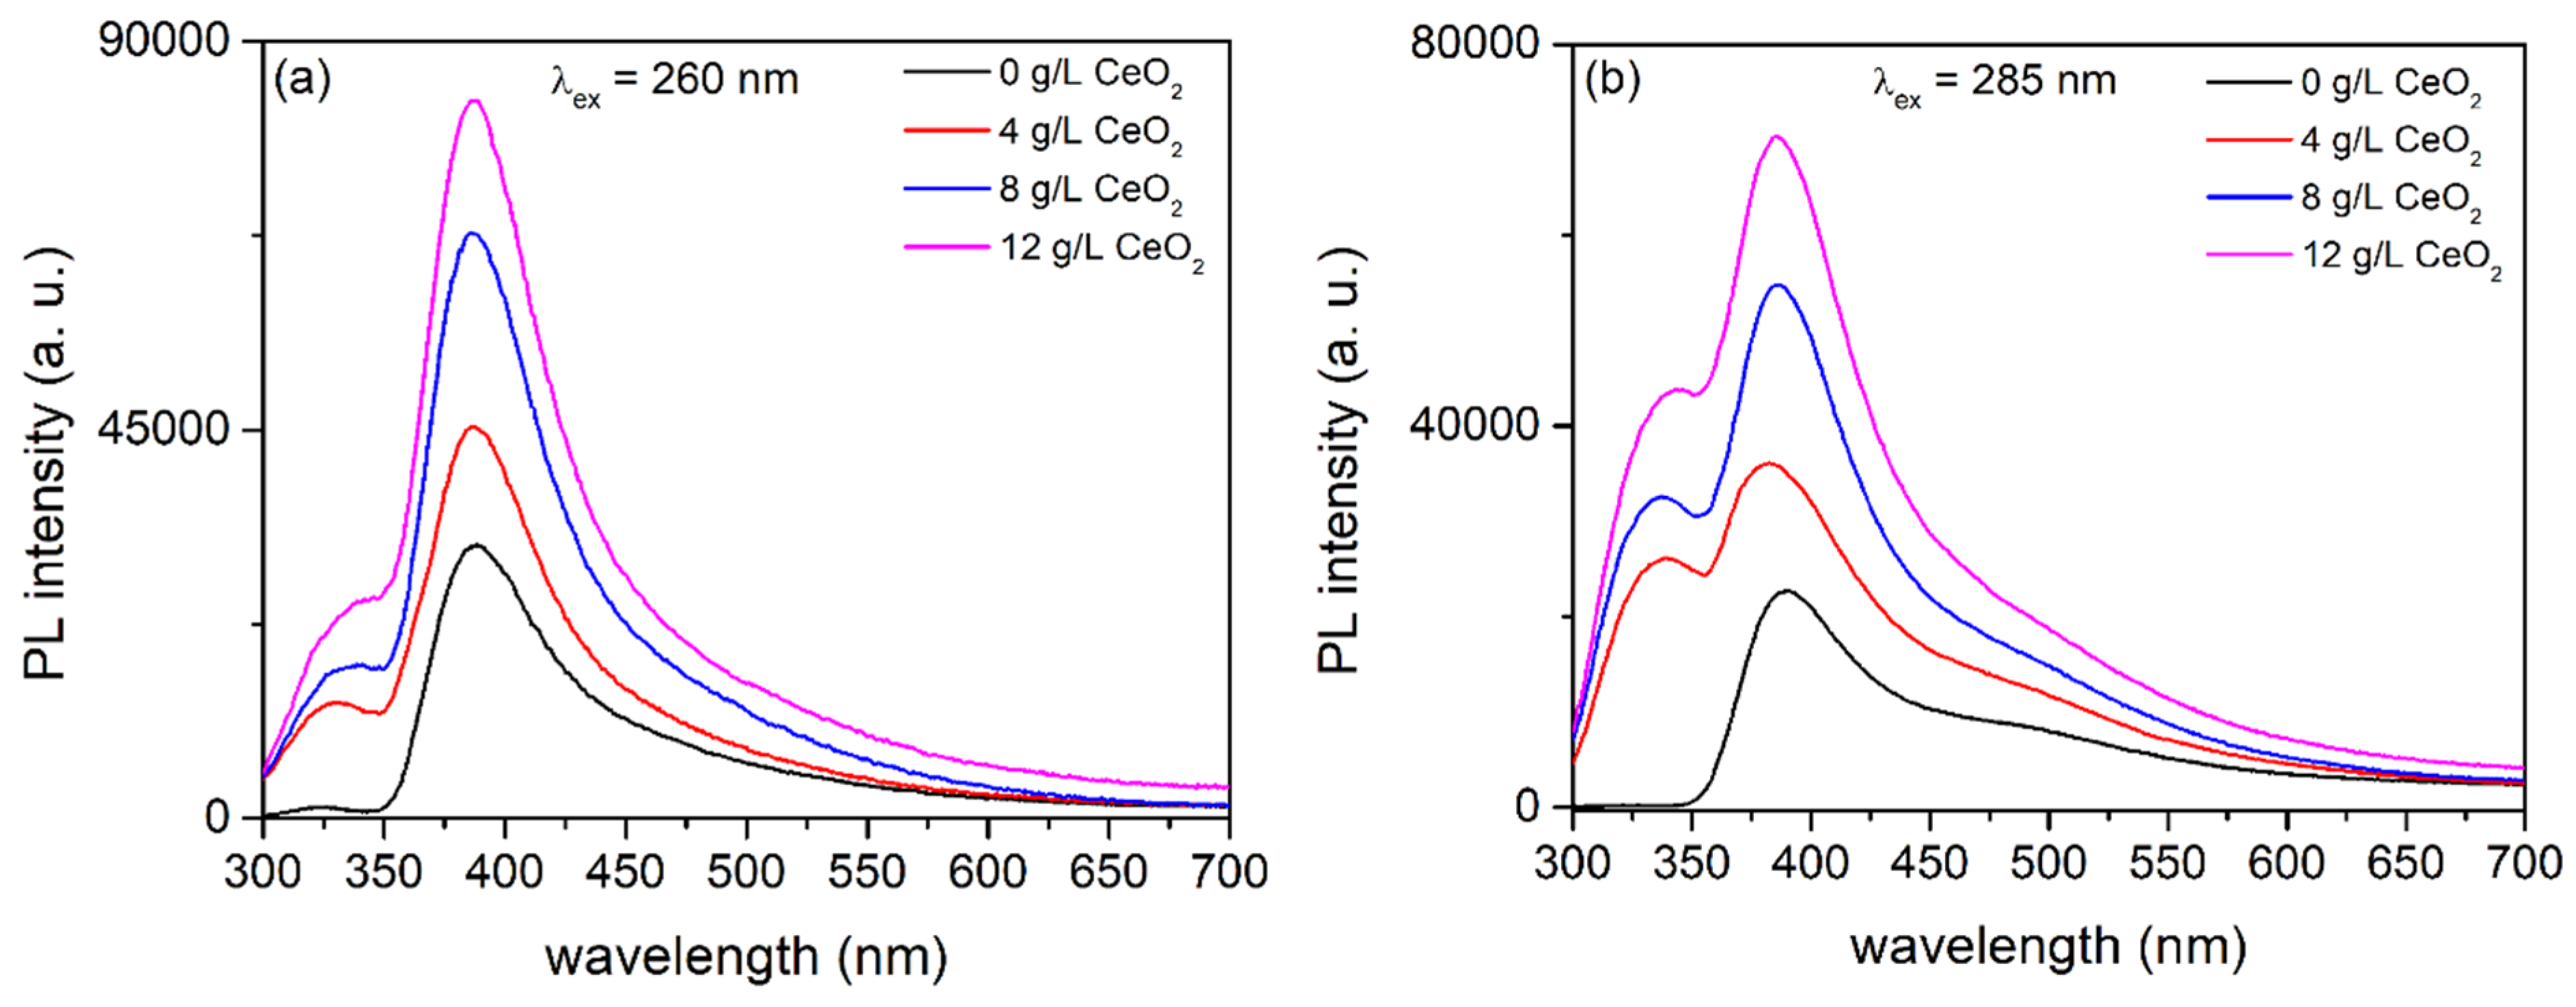
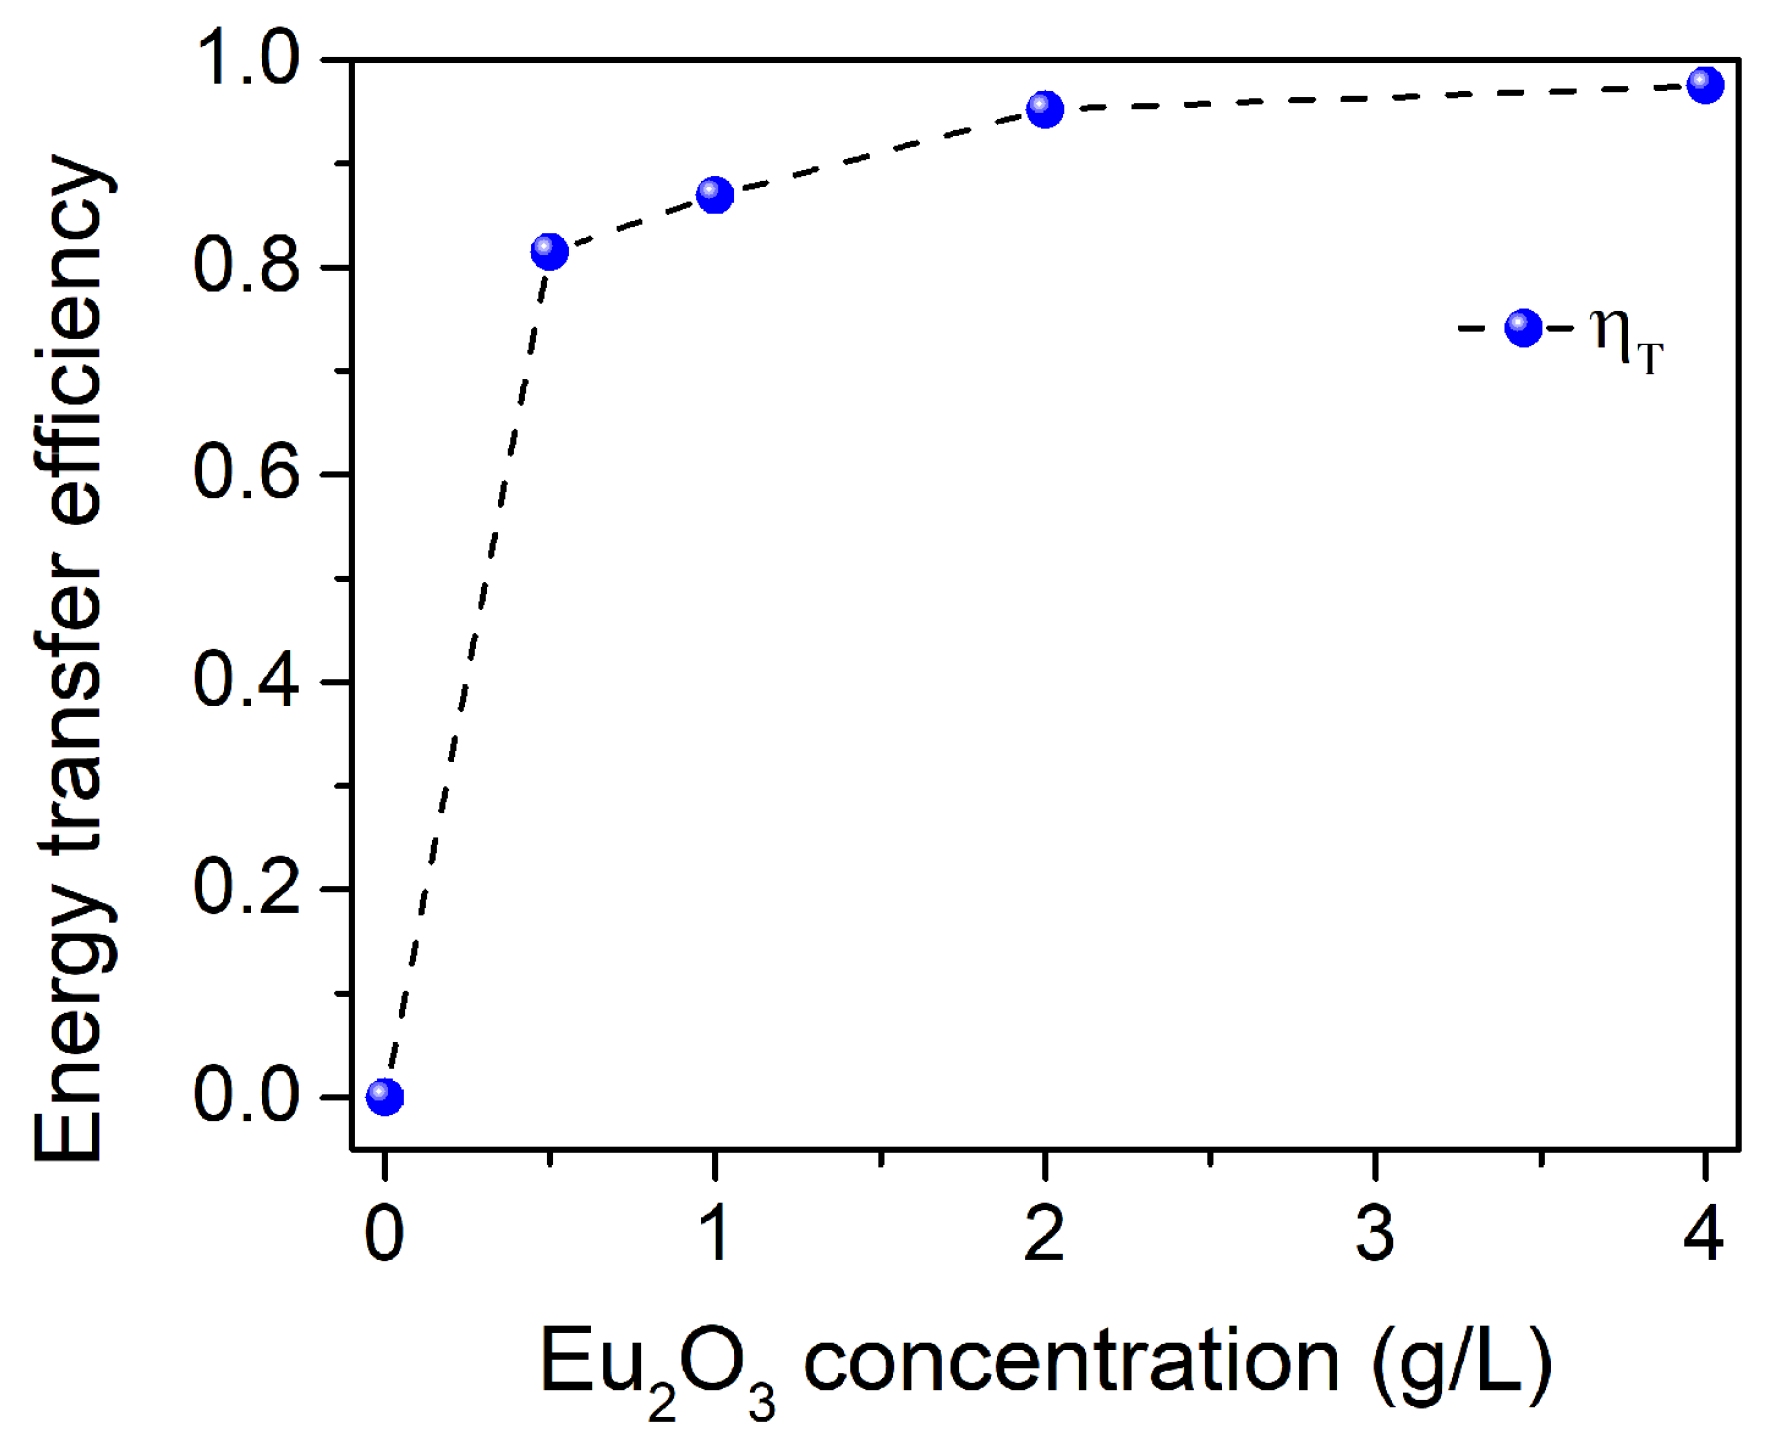
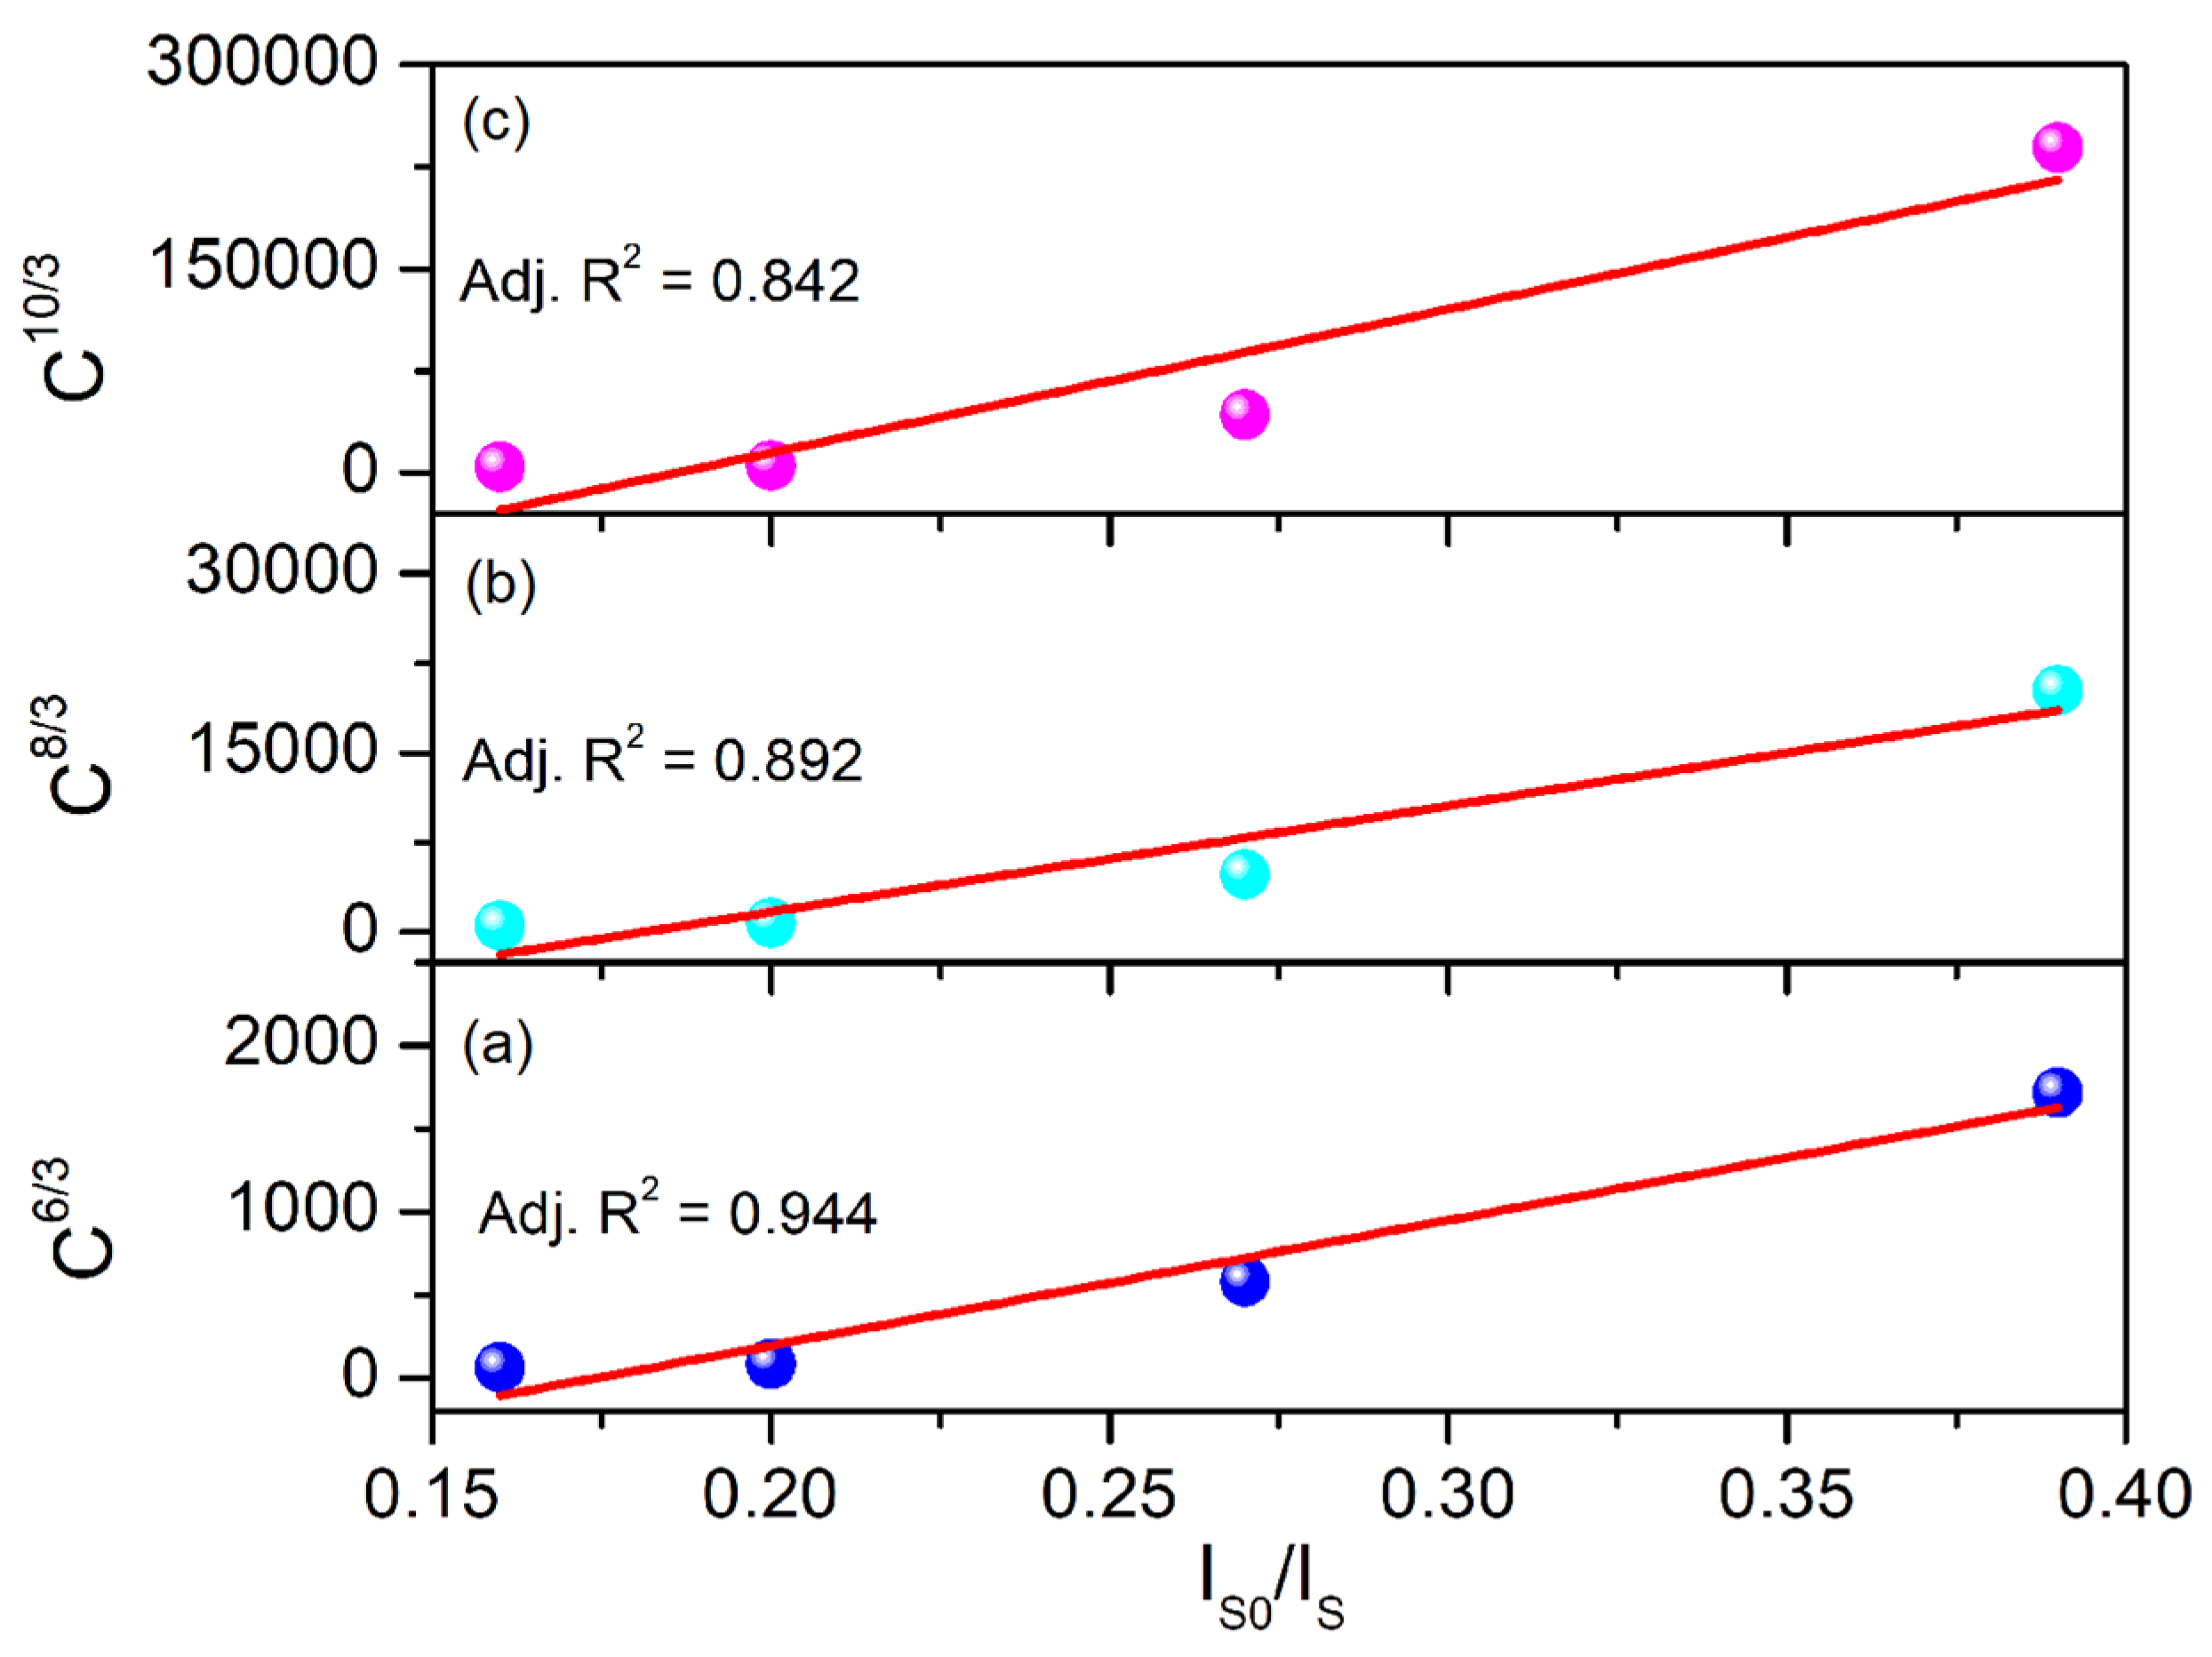
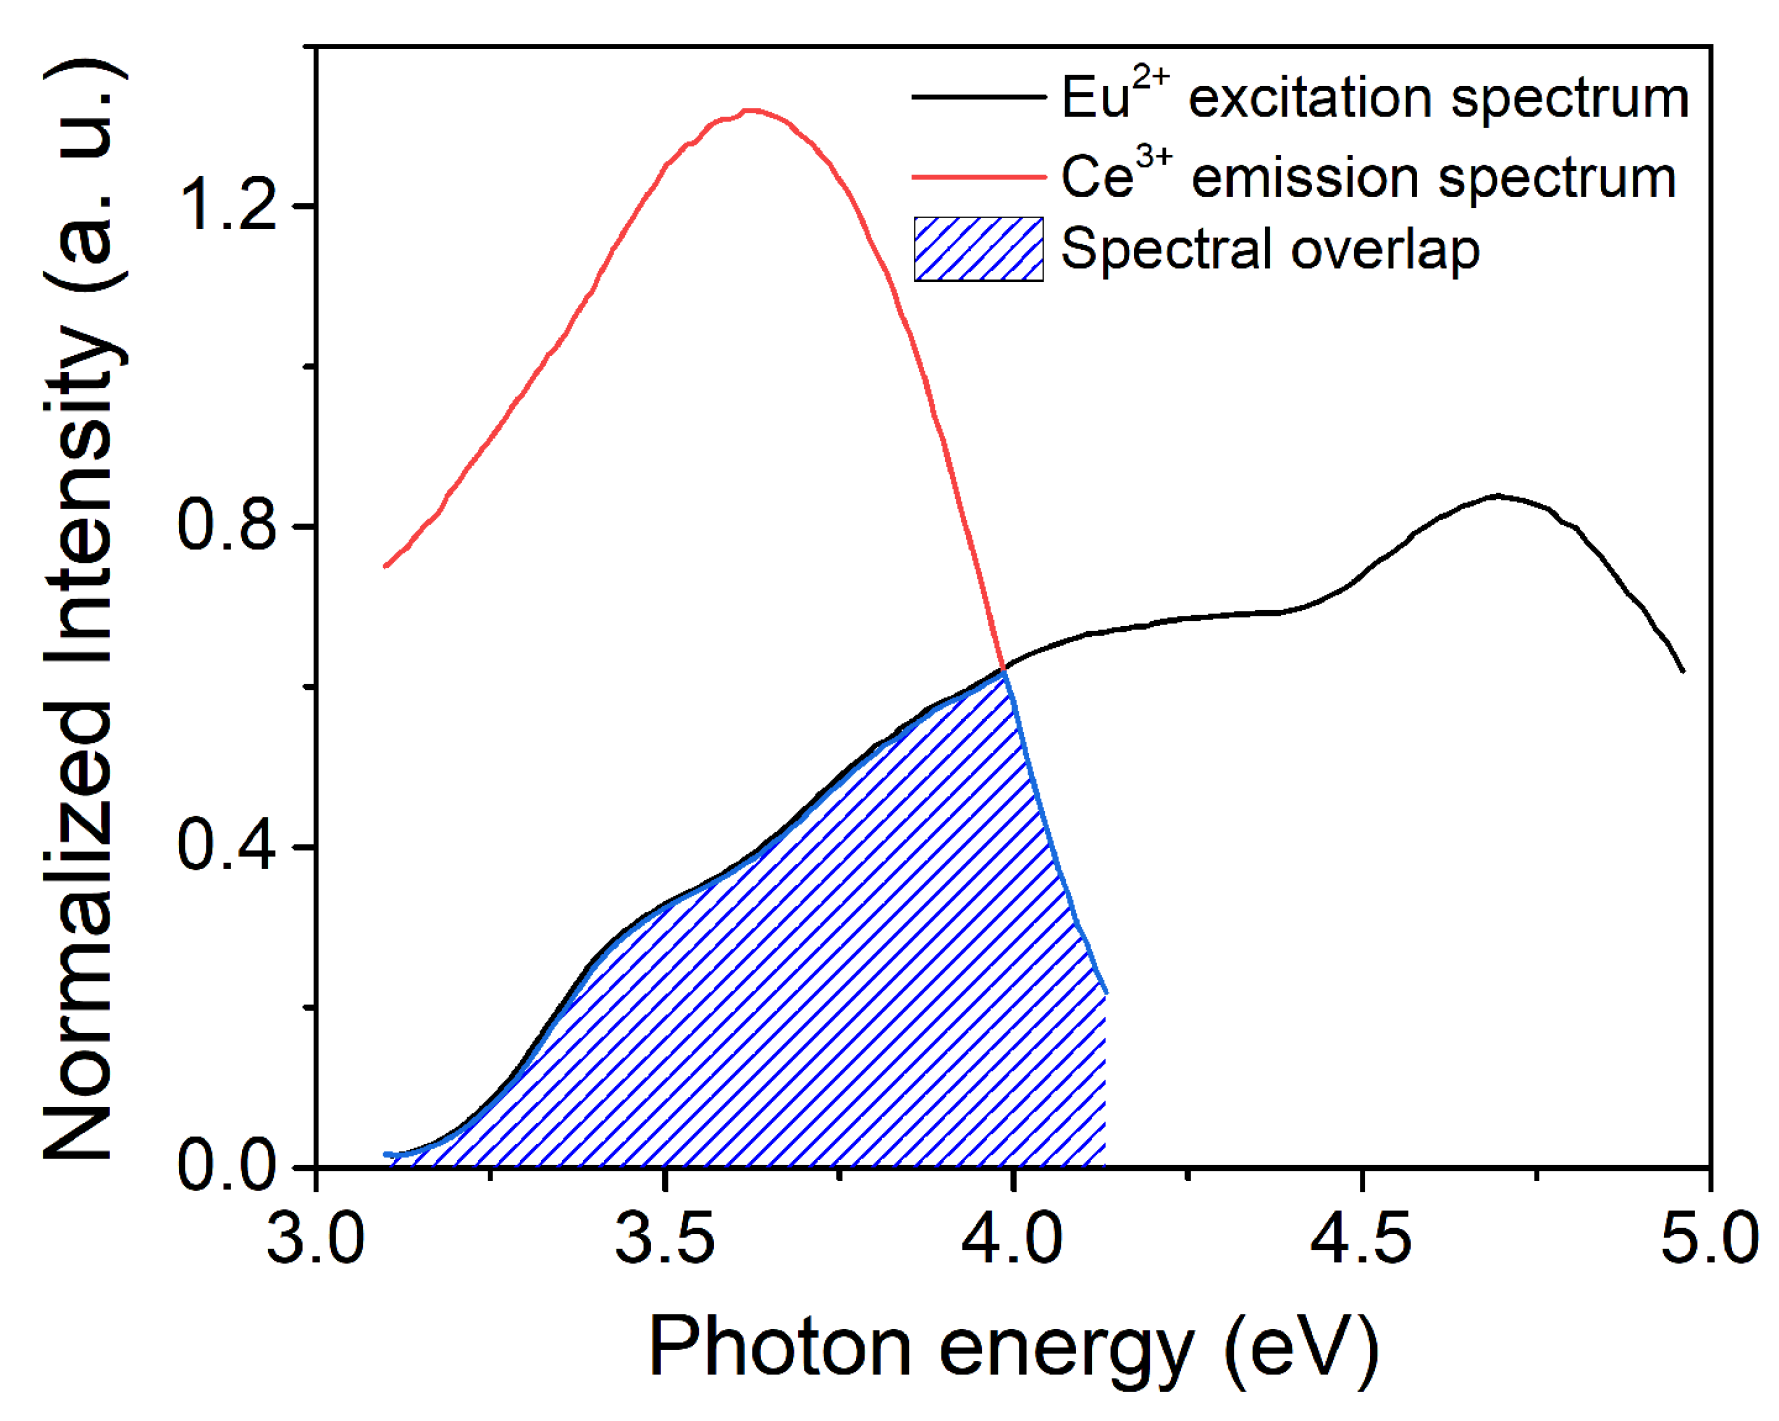
3.3. PL of Al2O3:Ce3+/Eu2+ Coatings
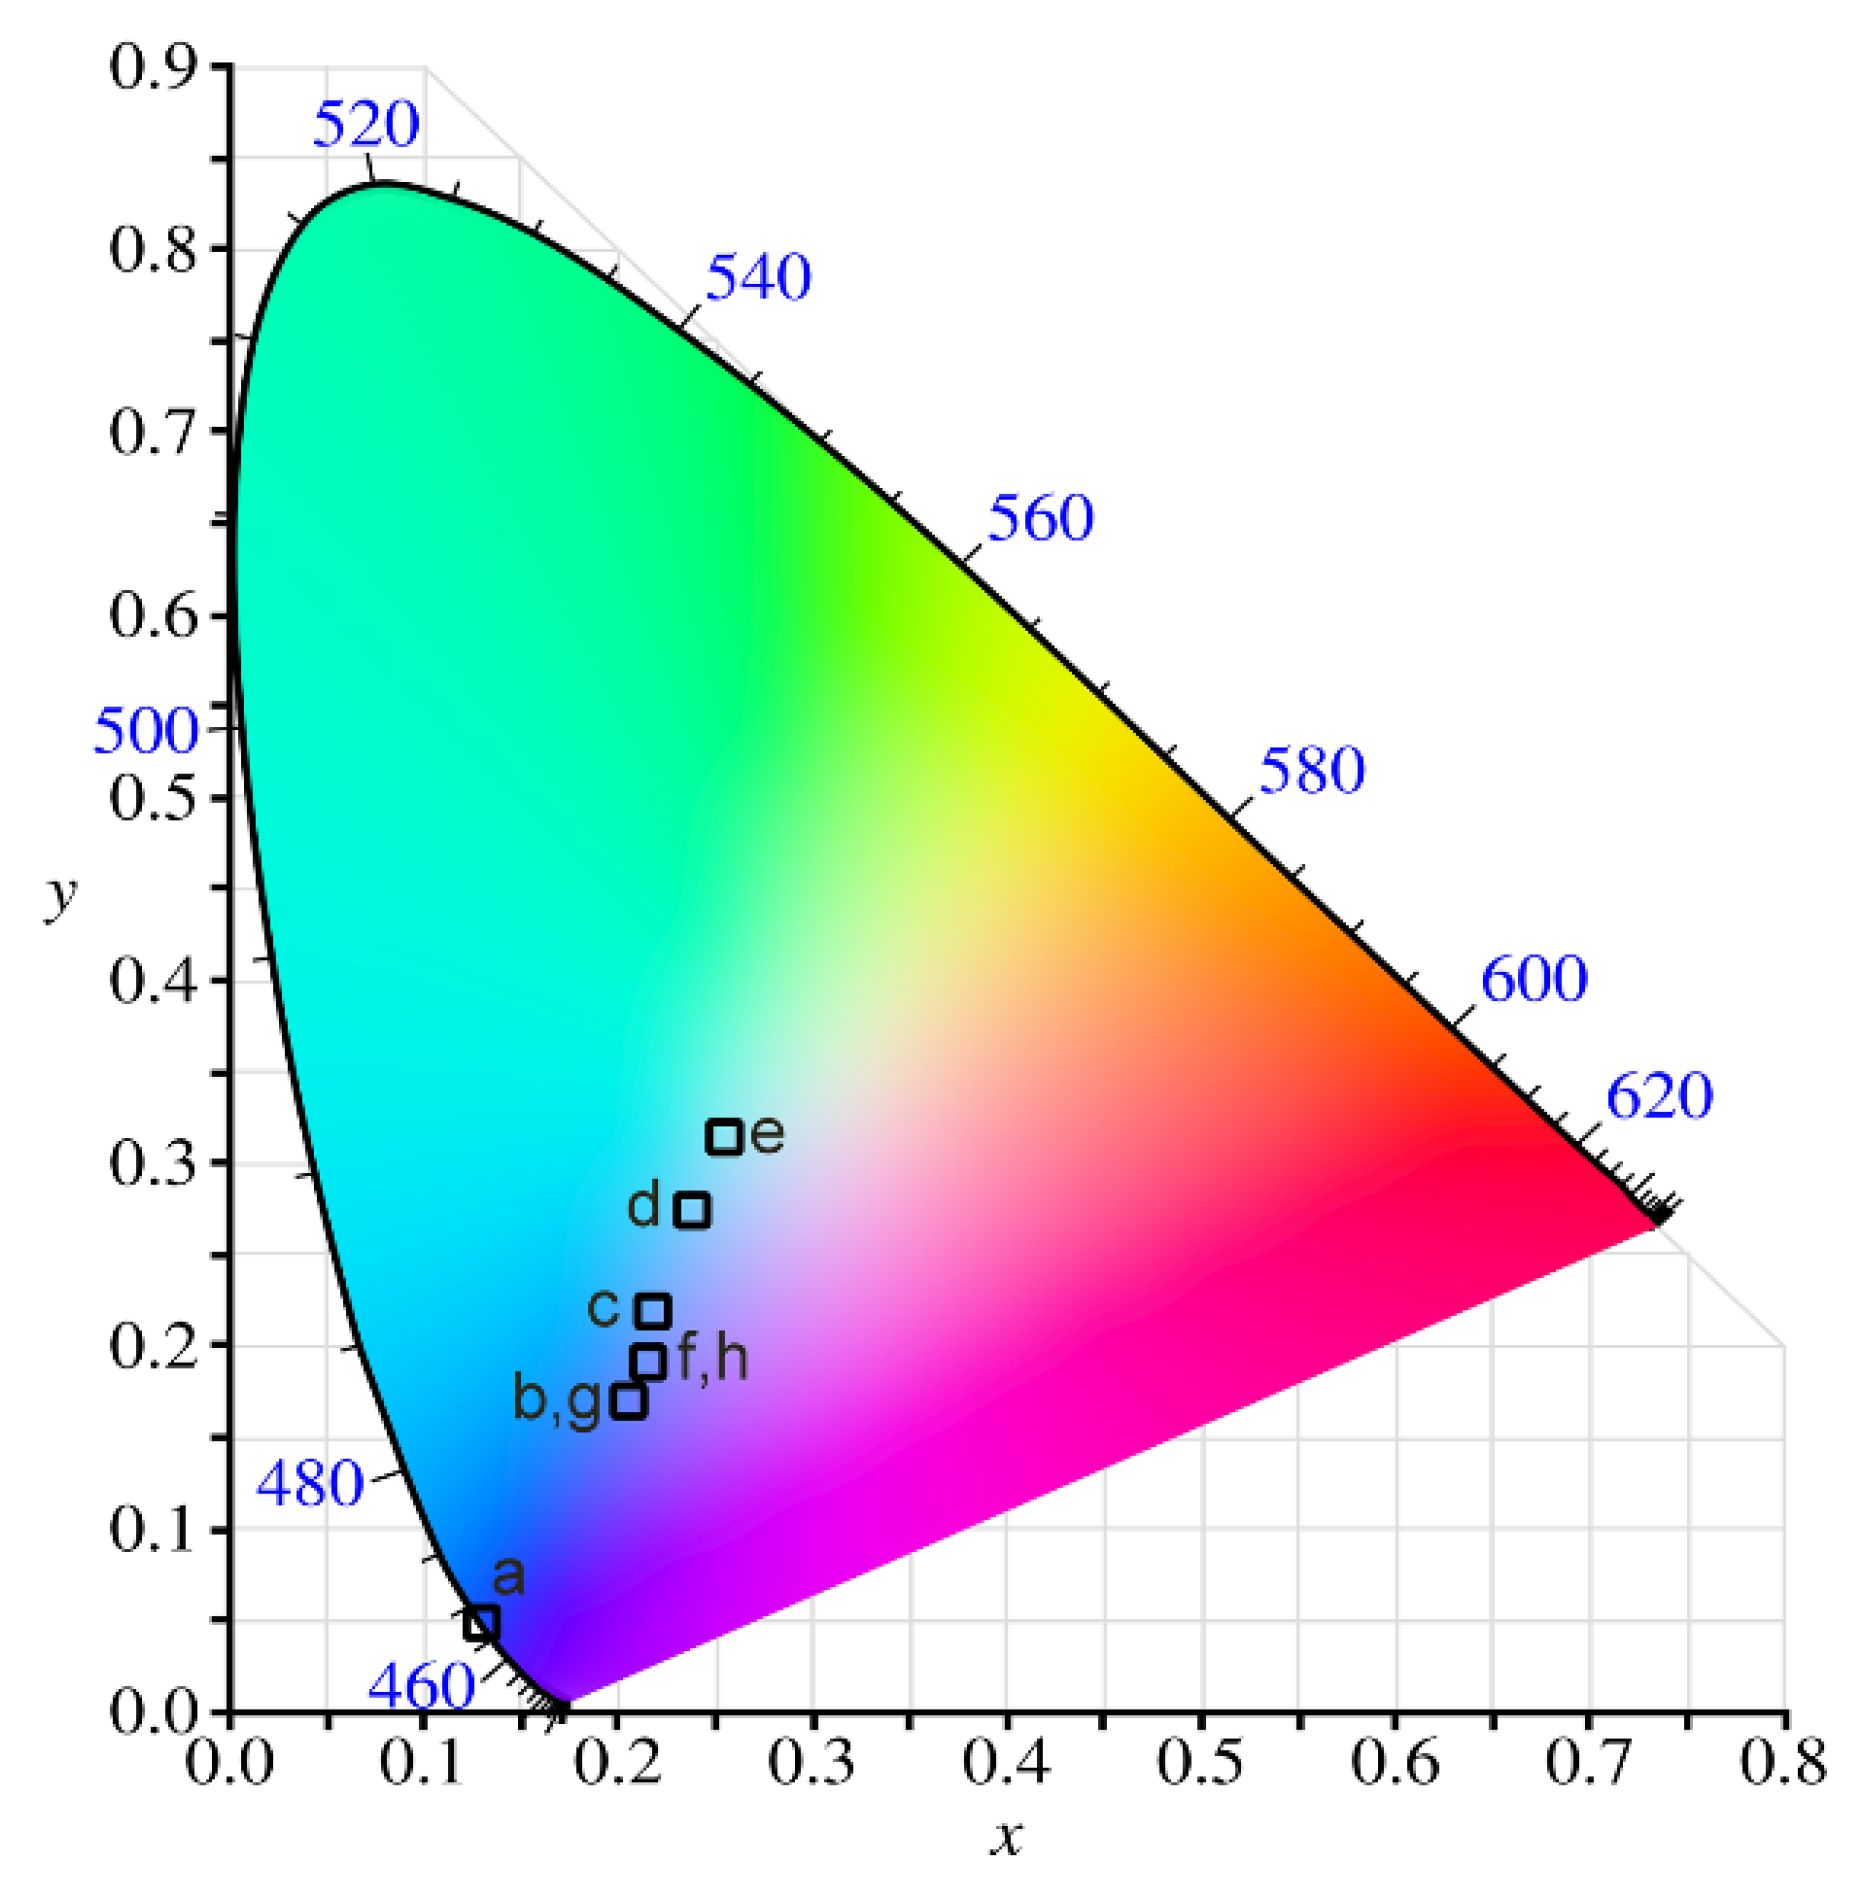
3.4. CIE Chromaticity Analysis
4. Conclusions
Author Contributions
Funding
Conflicts of Interest
References
- Li, G.G.; Tian, Y.; Zhao, Y.; Lin, J. Recent progress in luminescence tuning of Ce3+ and Eu2+-activated phosphors for pc- WLEDs. Chem. Soc. Rev. 2015, 44, 8688–8713. [Google Scholar] [CrossRef] [PubMed]
- Yan, S. On the origin of temperature dependence of the emission maxima of Eu2+ and Ce3+- activated phosphors. Opt. Mater. 2018, 79, 172–185. [Google Scholar] [CrossRef]
- Li, K.; Shang, M.; Lian, H.; Lin, J. Recent development in phosphors with different emitting colors via energy transfer. J. Mater. Chem. C 2016, 4, 5507–5530. [Google Scholar] [CrossRef]
- Martín-Cano, D.; Martín-Moreno, L.; García-Vidal, F.J.; Moreno, E. Resonance Energy Transfer and Superradiance Mediated by Plasmonic Nanowaveguides. Nano Lett. 2010, 10, 3129–3134. [Google Scholar] [CrossRef]
- Caligiuri, V.; Palei, M.; Imran, M.; Manna, L.; Krahne, R. Planar Double-Epsilon-Near-Zero Cavities for Spontaneous Emission and Purcell Effect Enhancement. ACS Photonics 2018, 5, 2287–2294. [Google Scholar] [CrossRef]
- Zhao, J.; Sun, X.; Wang, Z. Ce3+/Eu2+ doped SrSc2O4 phosphors: Synthesis, luminescence and energy transfer from Ce3+ to Eu2+. Chem. Phys. Lett. 2018, 691, 68–72. [Google Scholar] [CrossRef]
- Hu, Z.; Cheng, Z.; Dong, P.; Zhang, H.; Zhang, Y. Enhanced photoluminescence property of single-component CaAlSiN3:Ce3+, Eu2+ multicolor phosphor through Ce3+-Eu2+ energy transfer. J. Alloys Compd. 2017, 727, 633–641. [Google Scholar] [CrossRef]
- Yan, J.; Liu, C.; Zhou, W.; Huang, Y.; Tao, Y.; Liang, H. VUV-UV–vis photoluminescence of Ce3+ and Ce3+-Eu2+ energy transfer in Ba2MgSi2O7. J. Lumin. 2017, 185, 251–257. [Google Scholar] [CrossRef]
- Li, C.; Zheng, H.; Wei, H.; Qiu, S.; Xu, L.; Wang, X.; Jiao, H. A color tunable and white light emitting Ca2Si5N8:Ce3+, Eu2+ phosphor via efficient energy transfer for near-UV white LEDs. Dalton Trans. 2018, 47, 6860–6867. [Google Scholar] [CrossRef]
- Stojadinović, S.; Vasilić, R. Eu2+ photoluminescence in Al2O3 coatings obtained by plasma electrolytic oxidation. J. Lumin. 2018, 199, 240–244. [Google Scholar] [CrossRef]
- Stojadinović, S.; Vasilić, R. Photoluminescence of Ce3+ and Ce3+/Tb3+ ions in Al2O3 host formed by plasma electrolytic oxidation. J. Lumin. 2018, 203, 576–581. [Google Scholar] [CrossRef]
- Kim, D.-J. Lattice Parameters, Ionic Conductivities, and Solubility Limits in Fluorite-Structure MO2 Oxide [M = Hf4+, Zr4+, Ce4+, Th4+, U4+] Solid Solutions. J. Am. Ceram. Soc. 1989, 72, 1415–1421. [Google Scholar] [CrossRef]
- Xie, H.; Lu, J.; Guan, Y.; Huang, Y.; Wei, D.; Seo, H.J. Abnormal Reduction, Eu3+ → Eu2+, and Defect Centers in Eu3+ -Doped Pollucite, CsAlSi2O6, Prepared in an Oxidizing Atmosphere. Inorg. Chem. 2014, 53, 827–834. [Google Scholar] [CrossRef] [PubMed]
- Stojadinović, S.; Vasilić, R.; Perić, M. Investigation of plasma electrolytic oxidation on valve metals by means of molecular spectroscopy–a review. RSC Adv. 2014, 4, 25759–25789. [Google Scholar] [CrossRef]
- Snizhko, L.O.; Yerokhin, A.L.; Pilkington, A.; Gurevina, N.L.; Misnyankin, D.O.; Leyland, A.; Matthews, A. Anodic processes in plasma electrolytic oxidation of aluminium in alkaline solutions. Electrochim. Acta 2004, 49, 2085–2095. [Google Scholar] [CrossRef]
- Yerokhin, A.L.; Nie, X.; Leyland, A.; Matthews, A.; Dowey, S.J. Plasma electrolysis for surface engineering. Surf. Coat. Technol. 1999, 122, 73–93. [Google Scholar] [CrossRef]
- McPherson, R. Formation of metastable phases in flame and plasma-prepared alumina. J. Mater. Sci. 1973, 8, 851–858. [Google Scholar] [CrossRef]
- Yagoub, M.Y.A.; Swart, H.C.; Noto, L.L.; Bergman, P.; Coetsee, E. Surface characterization and photoluminescence properties of Ce3+,Eu co-doped SrF2 nanophosphor. Materials 2015, 8, 2361–2375. [Google Scholar] [CrossRef]
- Rogers, J.J.; MacKenzie, K.J.D.; Rees, G.; Hanna, J.V. New phosphors based on the reduction of Eu(III) to Eu(II) in ion-exchanged aluminosilicate and gallium silicate inorganic polymers. Ceram. Int. 2018, 44, 1110–1119. [Google Scholar] [CrossRef]
- Wang, F.; Wang, W.; Zhang, L.; Zheng, J.; Jin, Y.; Zhang, J. Luminescence properties and its red shift of blue emitting phosphor Na3YSi3O9:Ce3+ for UV LED. RSC Adv. 2017, 7, 27422–27430. [Google Scholar] [CrossRef]
- Yang, Y.; Wei, H.; Zhang, L.; Kisslinger, K.; Melcher, C.L.; Wu, Y. Blue emission of Eu2+-doped translucent alumina. J. Lumin. 2015, 168, 297–303. [Google Scholar] [CrossRef]
- Chen, H.; Li, C.; Hua, Y.; Yu, L.; Jiang, Q.; Deng, D.; Zhao, S.; Ma, H.; Xu, S. Influence of energy transfer from Ce3+ to Eu2+ on luminescence properties of Ba3Si6O9N4:Ce3+,Eu2+ phosphors. Ceram. Int. 2014, 40, 1979–1983. [Google Scholar] [CrossRef]
- Ćirić, A.; Stojadinović, S.; Sekulić, M.; Dramićanin, M.D. JOES: An application software for Judd-Ofelt analysis from Eu3+ emission spectra. J. Lumin. 2019, 205, 351–356. [Google Scholar] [CrossRef]


| Concentration of Particles in Supporting Electrolyte | Atomic (%) | |||
|---|---|---|---|---|
| O | Al | Ce | Eu | |
| 4 g/L CeO2 | 65.25 | 34.62 | 0.13 | - |
| 4 g/L Eu2O2 | 65.19 | 34.55 | - | 0.26 |
| 4 g/L CeO2 + 0.5 g/L Eu2O3 | 64.89 | 34.95 | 0.10 | 0.06 |
| 4 g/L CeO2 + 1 g/L Eu2O3 | 64.73 | 35.06 | 0.11 | 0.09 |
| 4 g/L CeO2 + 2 g/L Eu2O3 | 64.39 | 35.35 | 0.11 | 0.16 |
| 4 g/L CeO2 + 4 g/L Eu2O3 | 64.79 | 34.82 | 0.12 | 0.27 |
| 0 g/L CeO2 + 0.5 g/L Eu2O3 | 64.95 | 34.98 | - | 0.07 |
| 4 g/L CeO2 + 0.5 g/L Eu2O3 | 64.90 | 34.94 | 0.10 | 0.06 |
| 8 g/L CeO2 + 0.5 g/L Eu2O3 | 64.99 | 34.73 | 0.21 | 0.07 |
| 12 g/L CeO2 + 0.5 g/L Eu2O3 | 64.97 | 34.65 | 0.32 | 0.06 |
| Label | Concentration of Particles | λex (nm) | x | y | Color Purity | λdominant (nm) | |
|---|---|---|---|---|---|---|---|
| CeO2 | Eu2O3 | ||||||
| a | 4 | 0 | 260 | 0.10644 | 0.08603 | 1 | 467 |
| b | 4 | 0.5 | 260 | 0.20944 | 0.18067 | 0.606957 | 471 |
| c | 4 | 1 | 260 | 0.21295 | 0.21447 | 0.501821 | 477 |
| d | 4 | 2 | 260 | 0.24027 | 0.25217 | 0.374879 | 483 |
| e | 4 | 4 | 260 | 0.25693 | 0.27666 | 0.285429 | 488 |
| f | 0 | 0.5 | 260 | 0.21503 | 0.19208 | 0.550572 | 472 |
| g | 8 | 0.5 | 260 | 0.2022 | 0.17773 | 0.606957 | 471 |
| h | 12 | 0.5 | 260 | 0.21743 | 0.19386 | 0.550572 | 472 |
© 2019 by the authors. Licensee MDPI, Basel, Switzerland. This article is an open access article distributed under the terms and conditions of the Creative Commons Attribution (CC BY) license (http://creativecommons.org/licenses/by/4.0/).
Share and Cite
Stojadinović, S.; Ćirić, A. Ce3+/Eu2+ Doped Al2O3 Coatings Formed by Plasma Electrolytic Oxidation of Aluminum: Photoluminescence Enhancement by Ce3+→Eu2+ Energy Transfer. Coatings 2019, 9, 819. https://doi.org/10.3390/coatings9120819
Stojadinović S, Ćirić A. Ce3+/Eu2+ Doped Al2O3 Coatings Formed by Plasma Electrolytic Oxidation of Aluminum: Photoluminescence Enhancement by Ce3+→Eu2+ Energy Transfer. Coatings. 2019; 9(12):819. https://doi.org/10.3390/coatings9120819
Chicago/Turabian StyleStojadinović, Stevan, and Aleksandar Ćirić. 2019. "Ce3+/Eu2+ Doped Al2O3 Coatings Formed by Plasma Electrolytic Oxidation of Aluminum: Photoluminescence Enhancement by Ce3+→Eu2+ Energy Transfer" Coatings 9, no. 12: 819. https://doi.org/10.3390/coatings9120819
APA StyleStojadinović, S., & Ćirić, A. (2019). Ce3+/Eu2+ Doped Al2O3 Coatings Formed by Plasma Electrolytic Oxidation of Aluminum: Photoluminescence Enhancement by Ce3+→Eu2+ Energy Transfer. Coatings, 9(12), 819. https://doi.org/10.3390/coatings9120819