Synthesis and Characterization of Ni–W/Cr2O3 Nanocomposite Coatings Using Electrochemical Deposition Technique

 ,
,
Abstract
:1. Introduction
2. Experiment
2.1. Preparation of Ni–W/Cr2O3 Nanocomposite Coatings
2.2. Surface Morphology and Phase Determination
3. Results
3.1. Ni–W Alloy Coatings
3.1.1. W Content
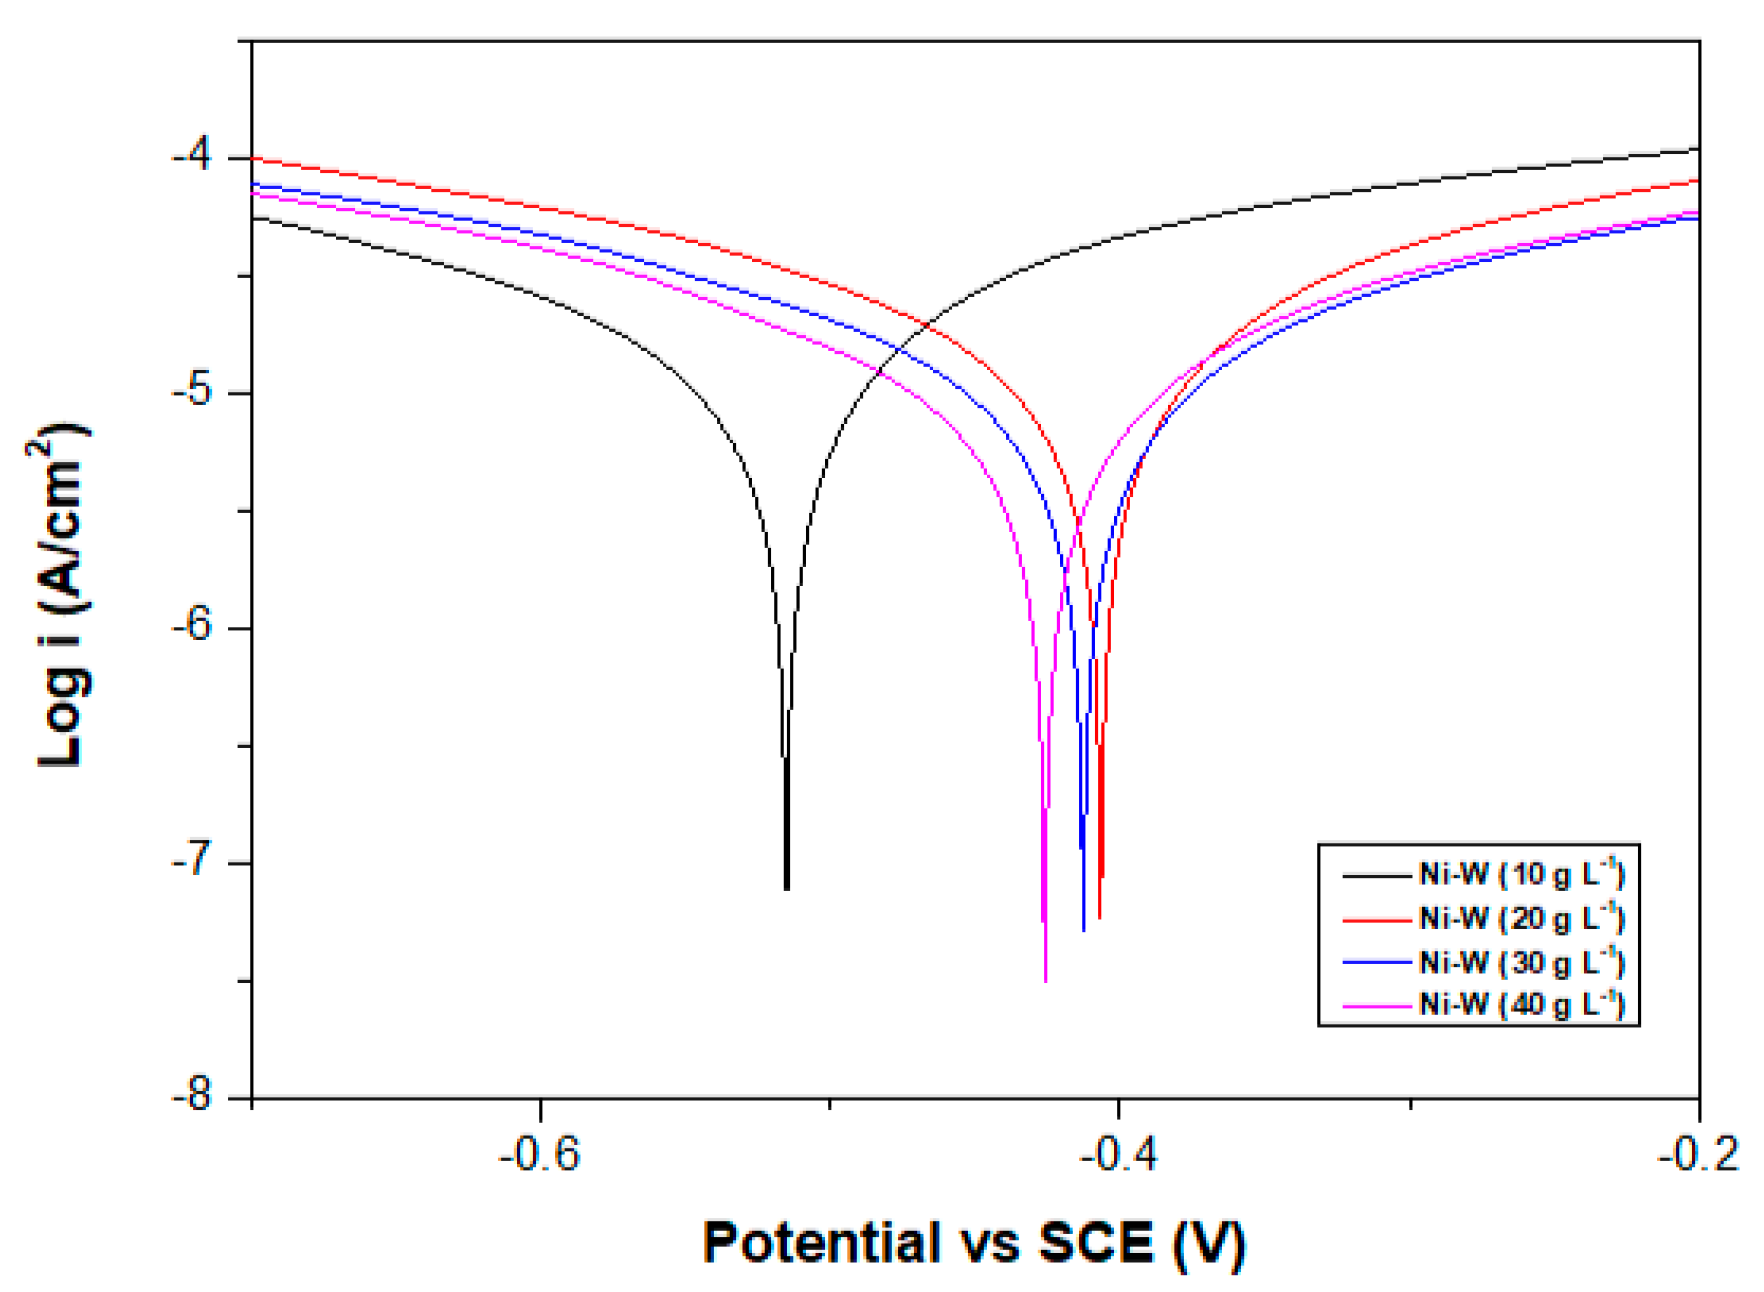
3.1.2. Corrosion Resistance
3.2. Ni–W–Cr2O3
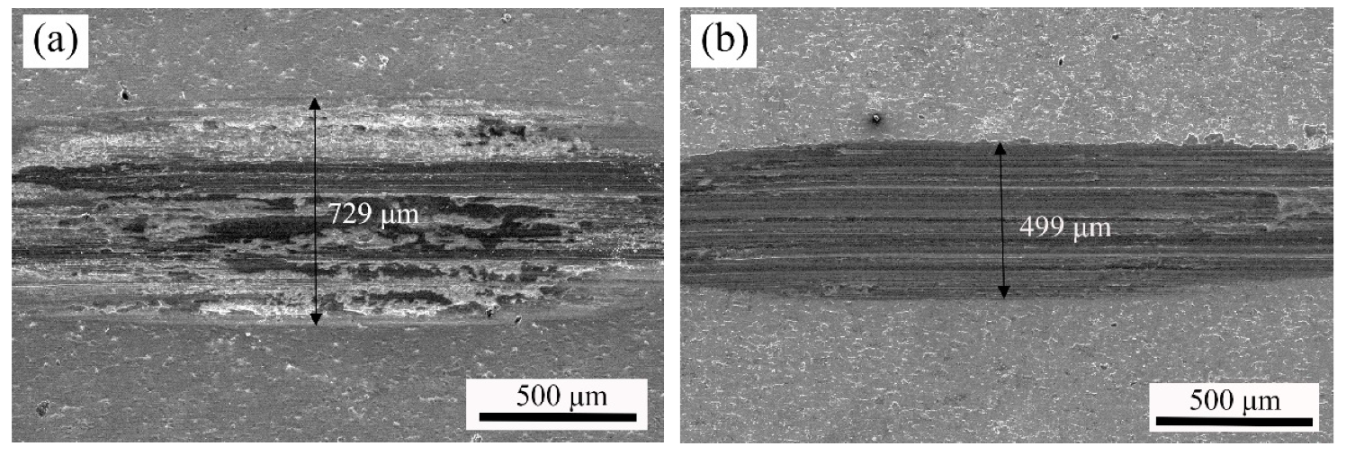
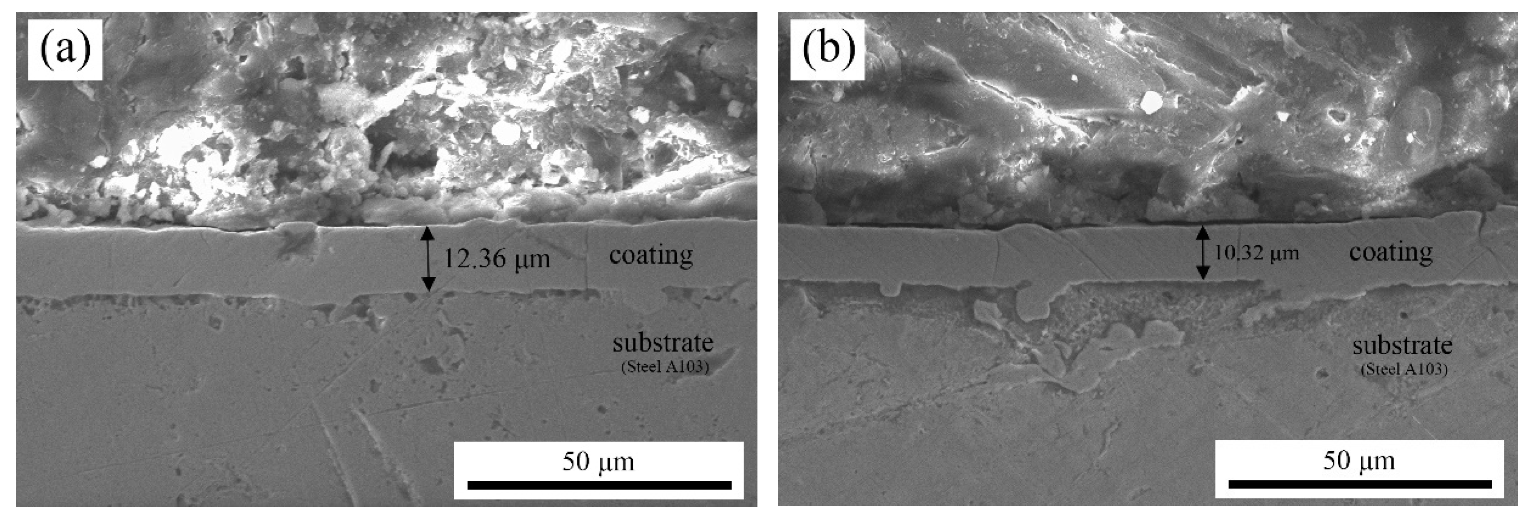
3.2.1. SEM
3.2.2. Effects of Cr2O3 Nanoparticles on Ni–W/Cr2O3 Nanocomposites
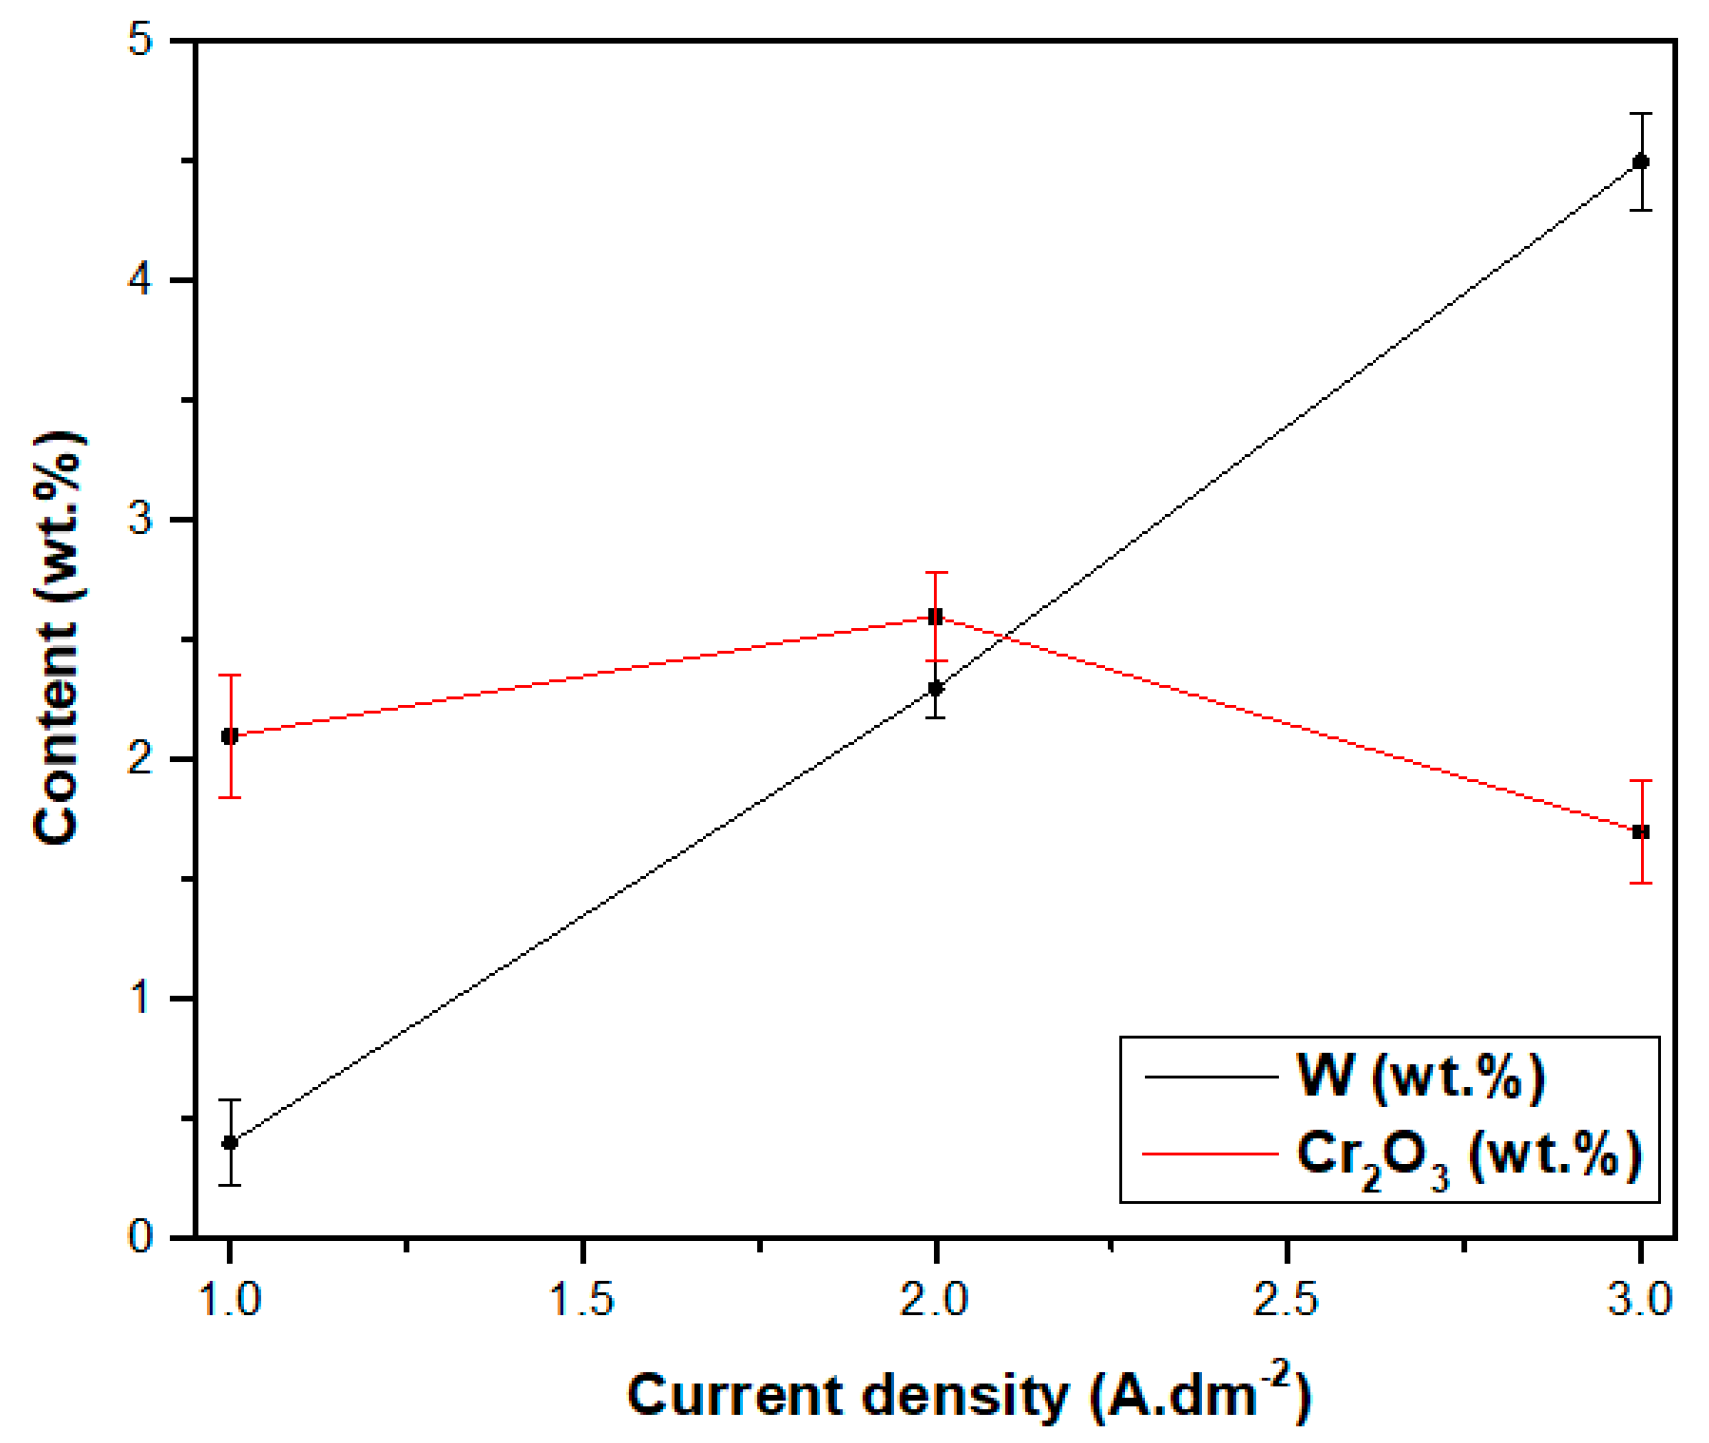
3.2.3. Effect of Current Density on Morphologies of Ni–W/Cr2O3 Nanocomposites
3.2.4. Effect of Current Density on Properties of Ni–W/Cr2O3 Nanocomposites
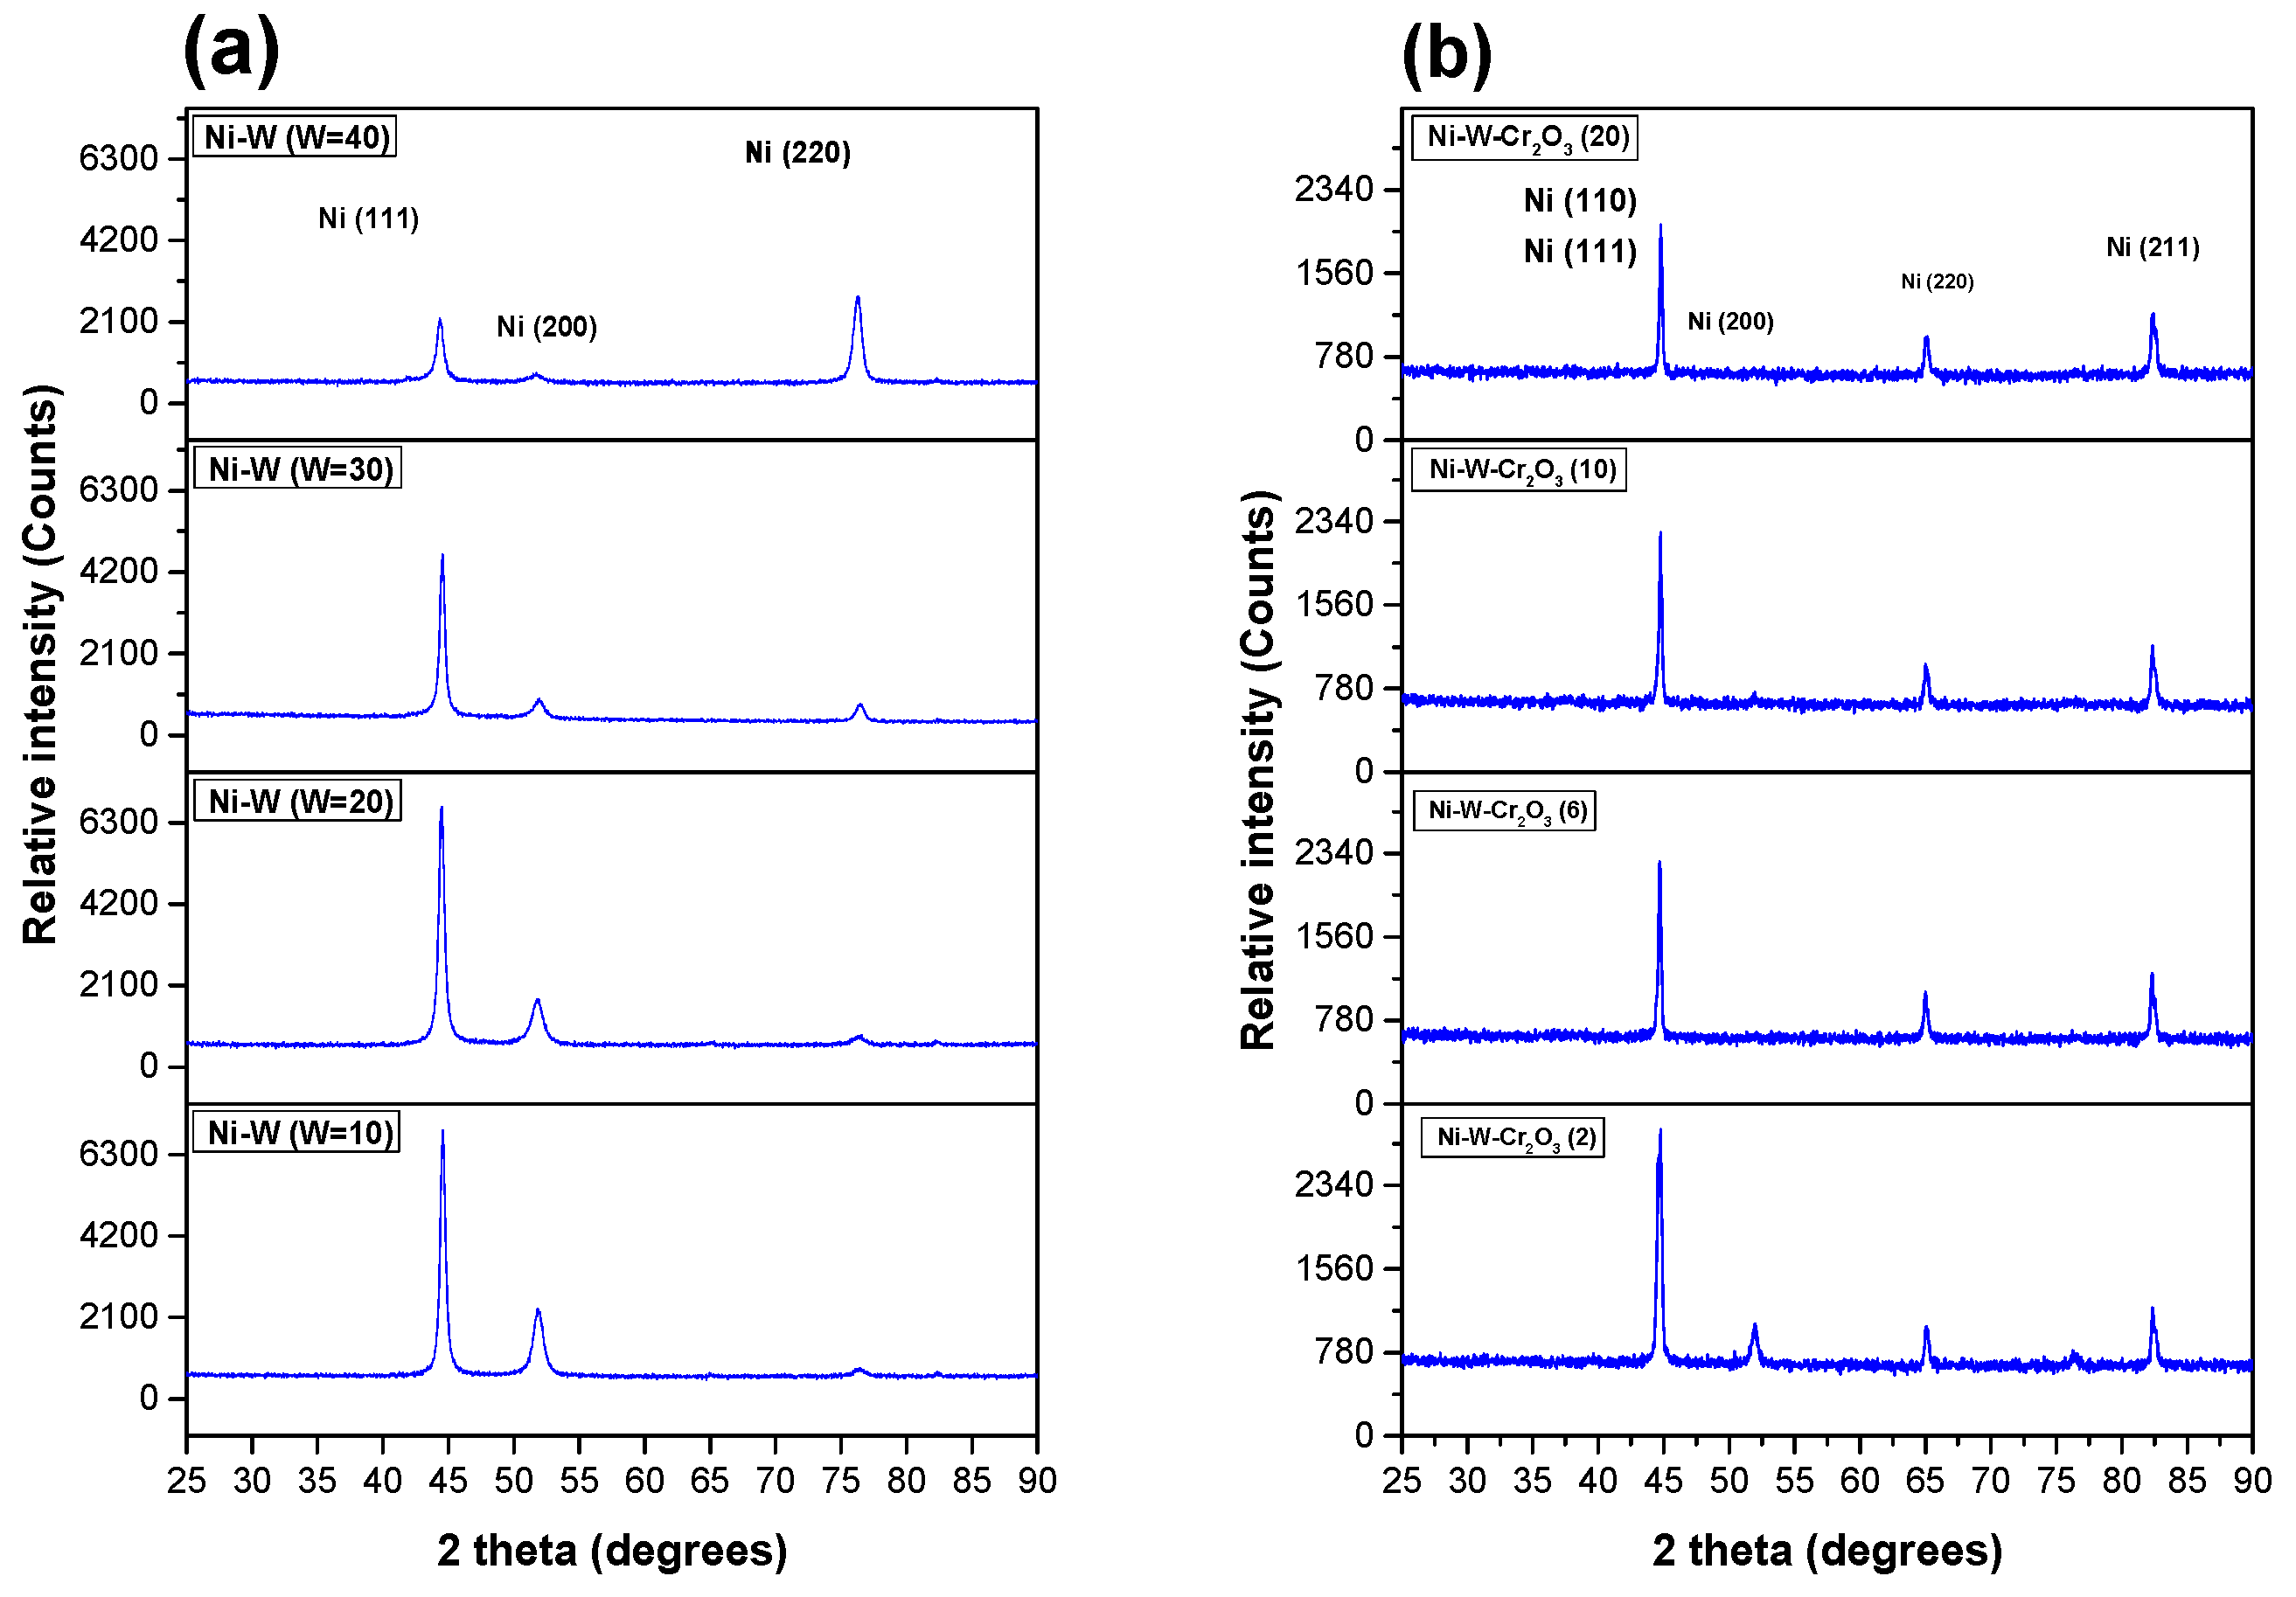
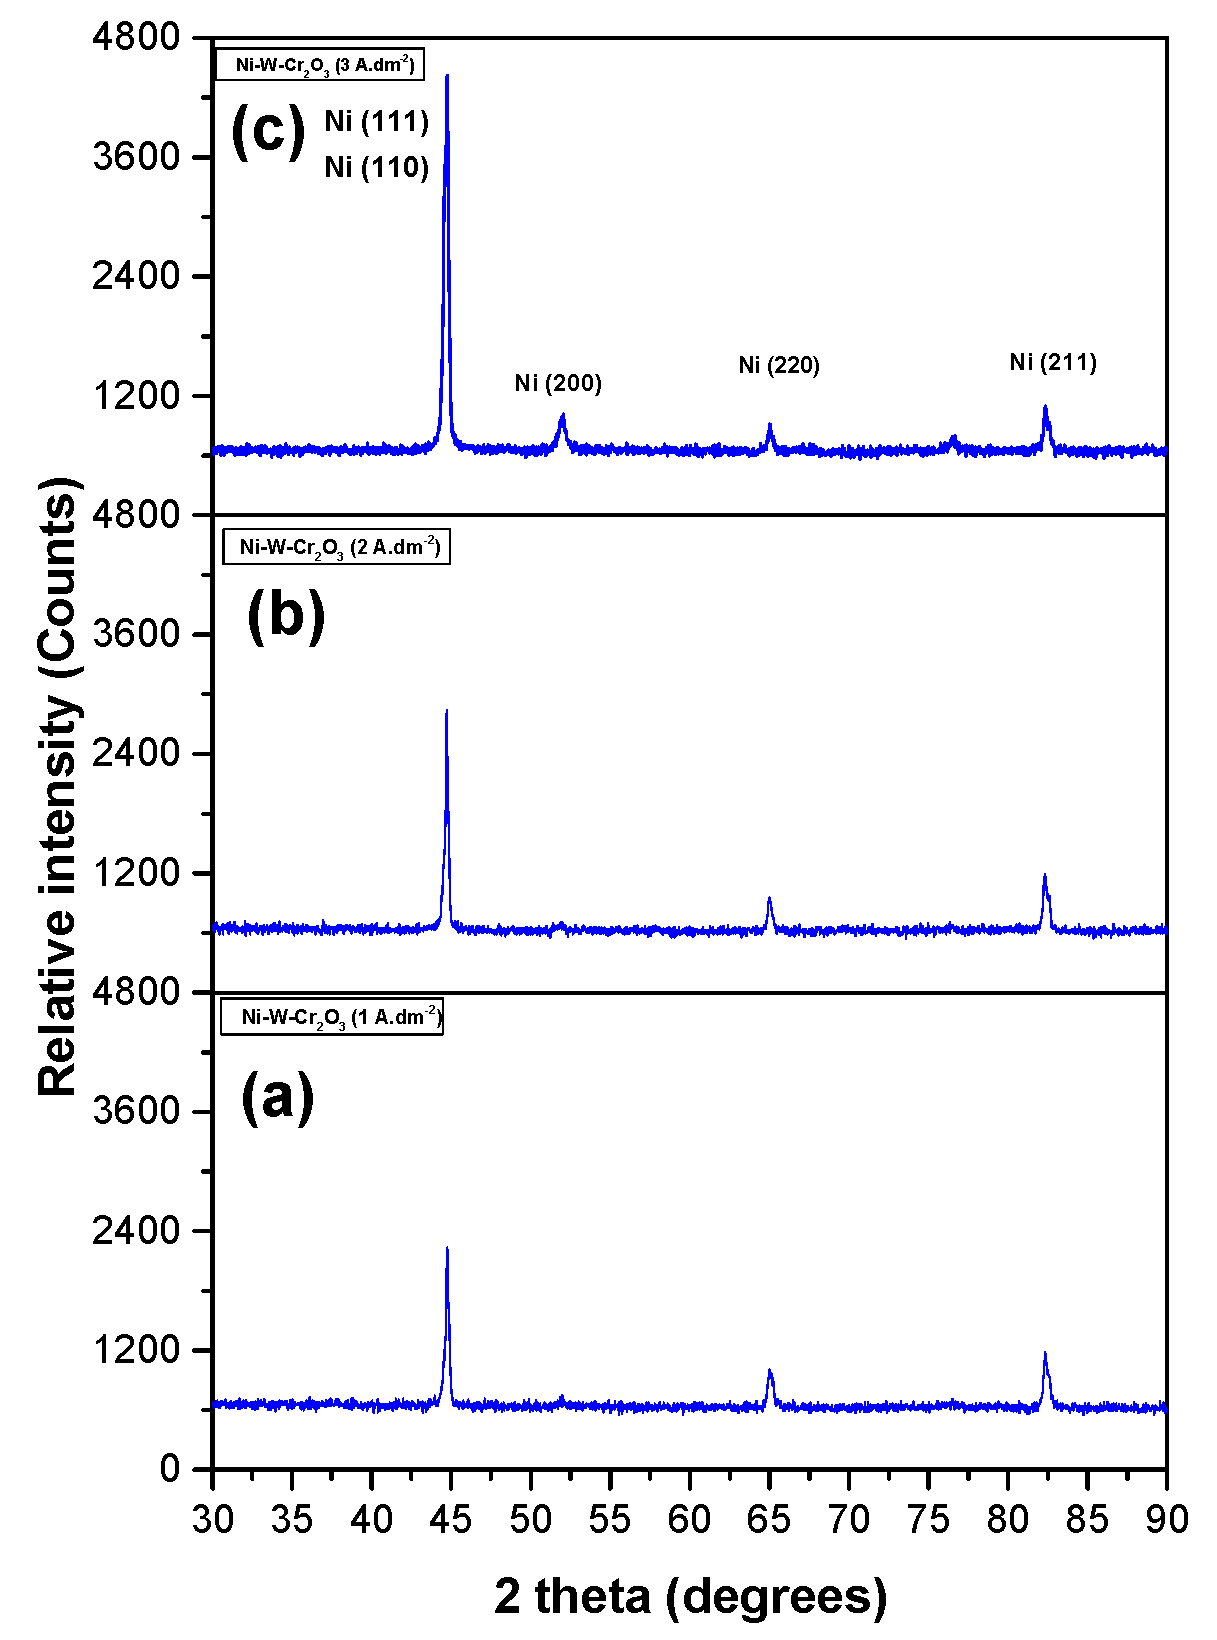
3.2.5. XRD Spectrum of Coatings
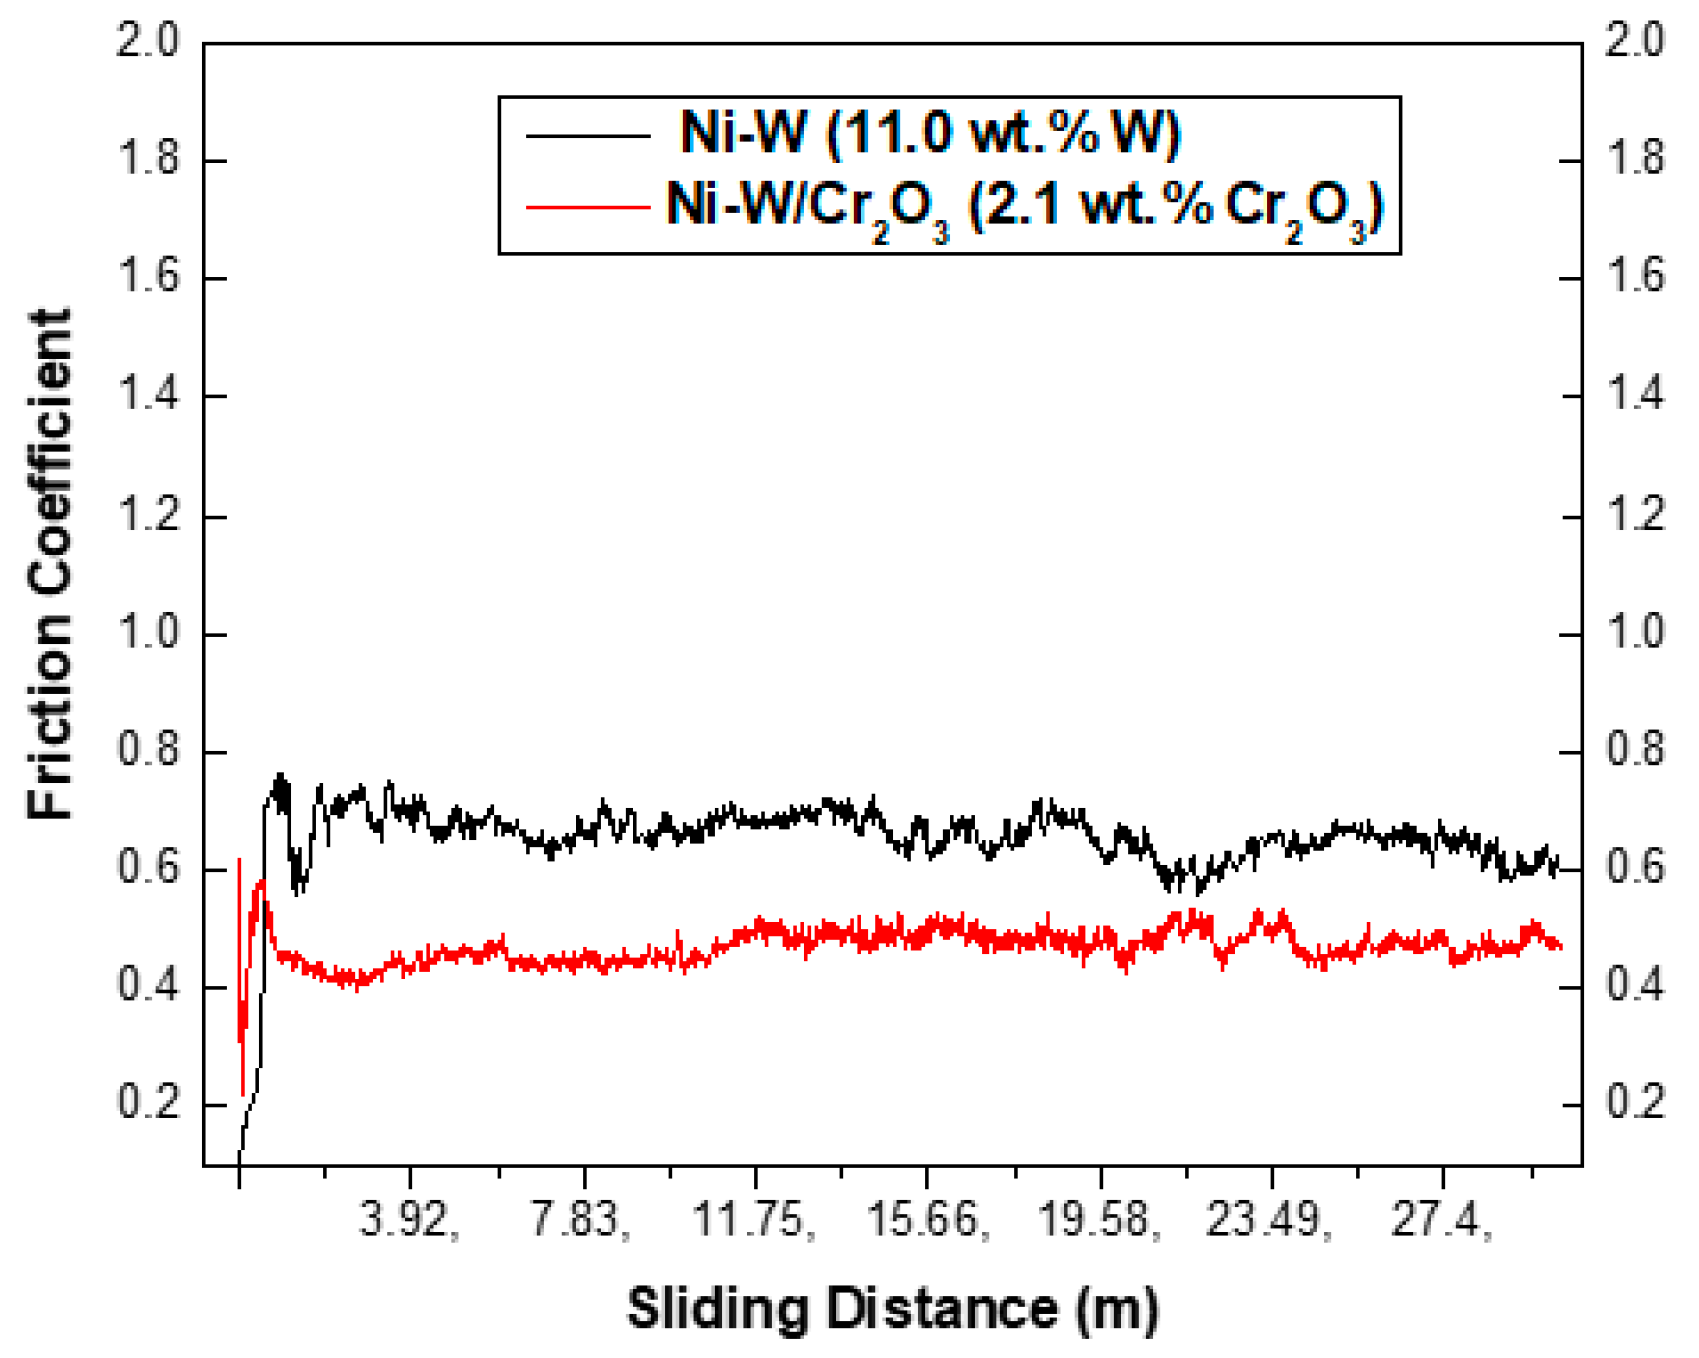
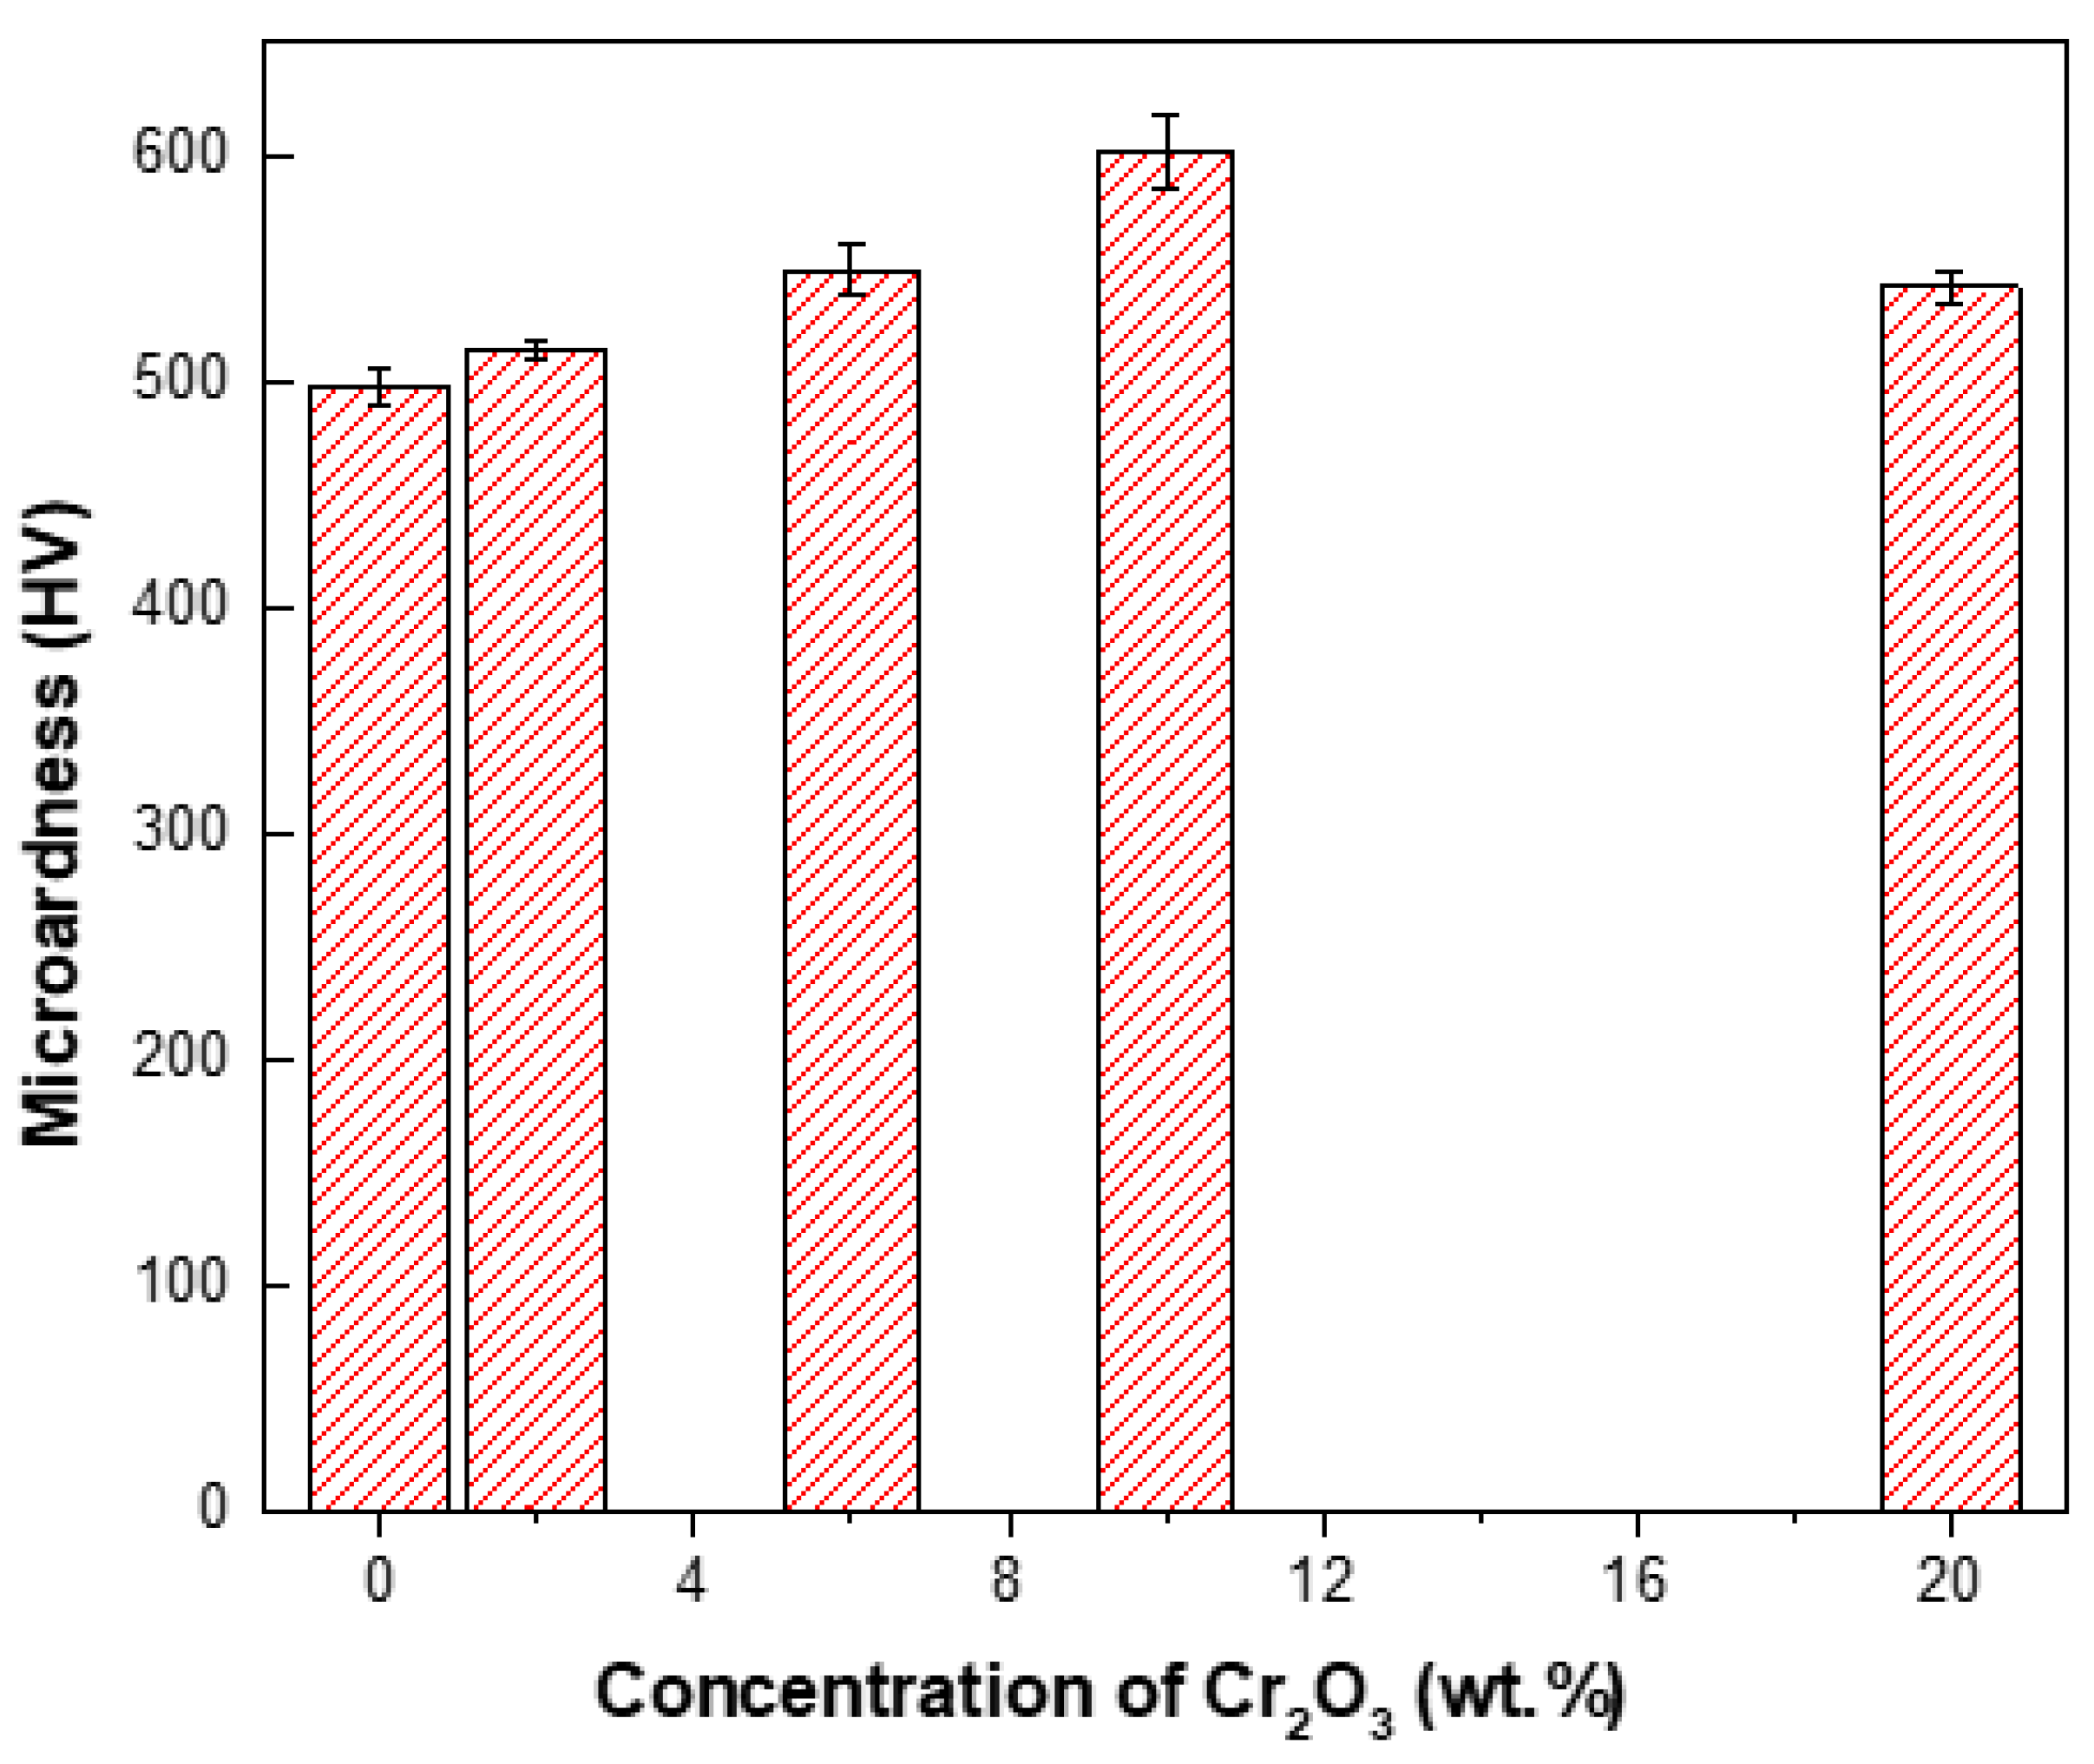
3.2.6. Microhardness and Wear Behavior
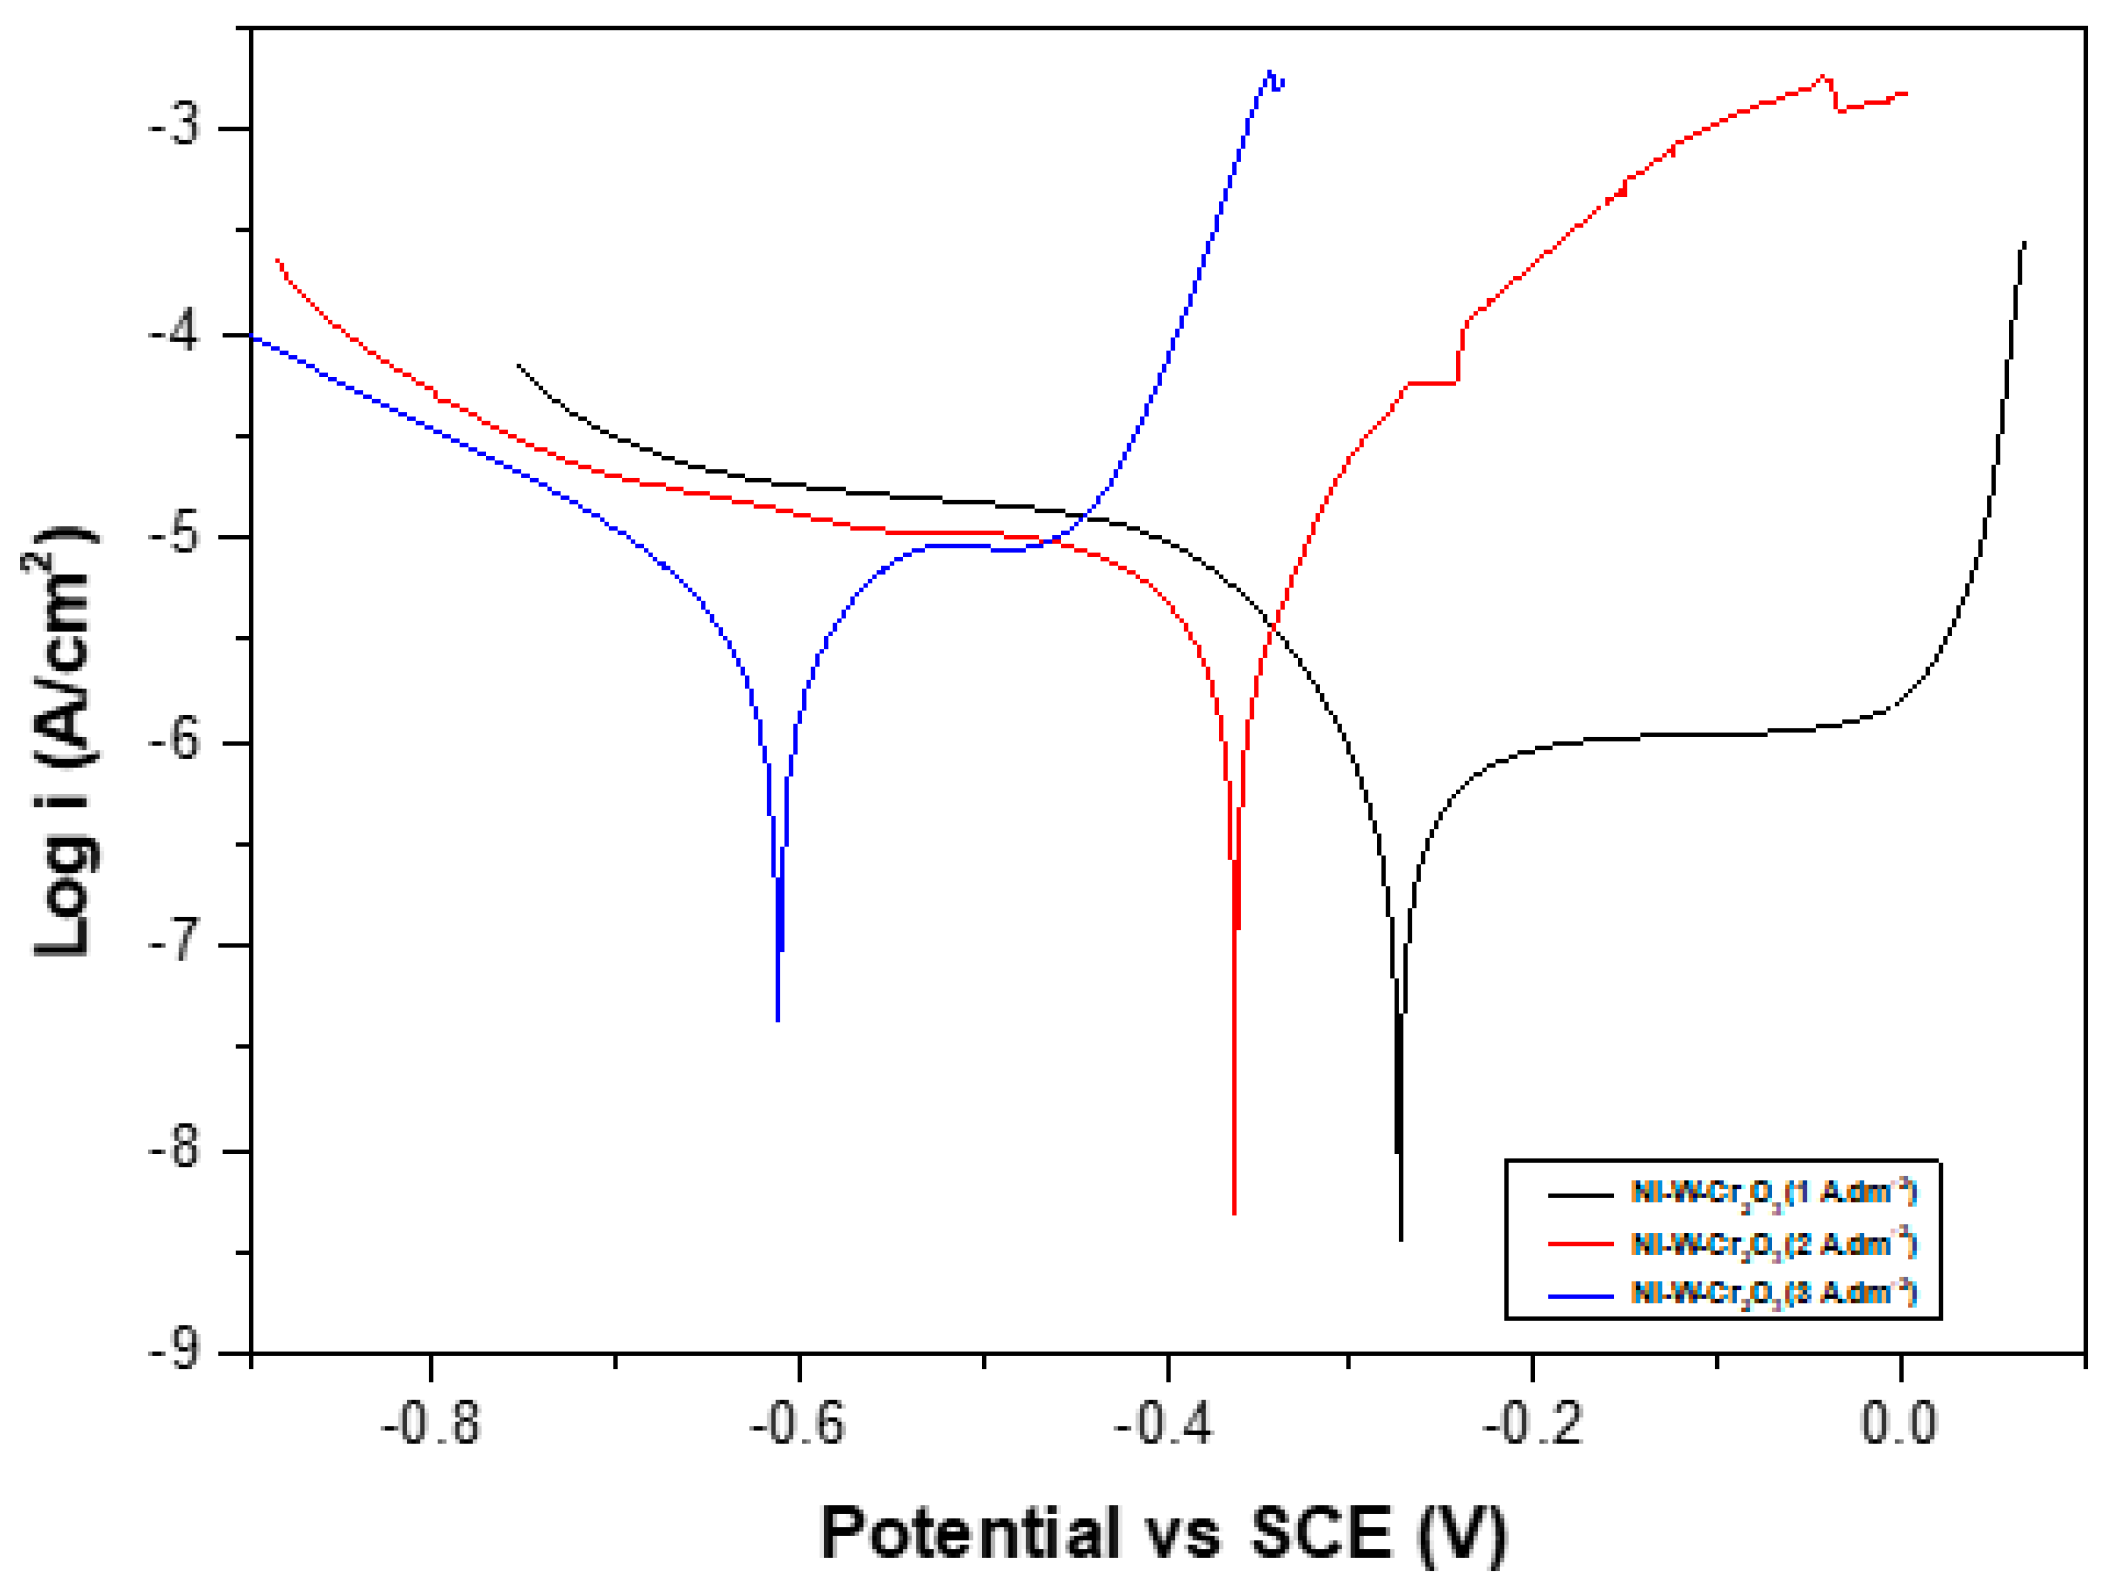
3.2.7. Corrosion Resistance
4. Conclusions
- (i)
- Corrosion resistance of Ni–W binary alloys increased significantly with increase in W content in the coating for the range of W concentration used in this experiment (10 g·L−1 to 40 g·L−1).
- (ii)
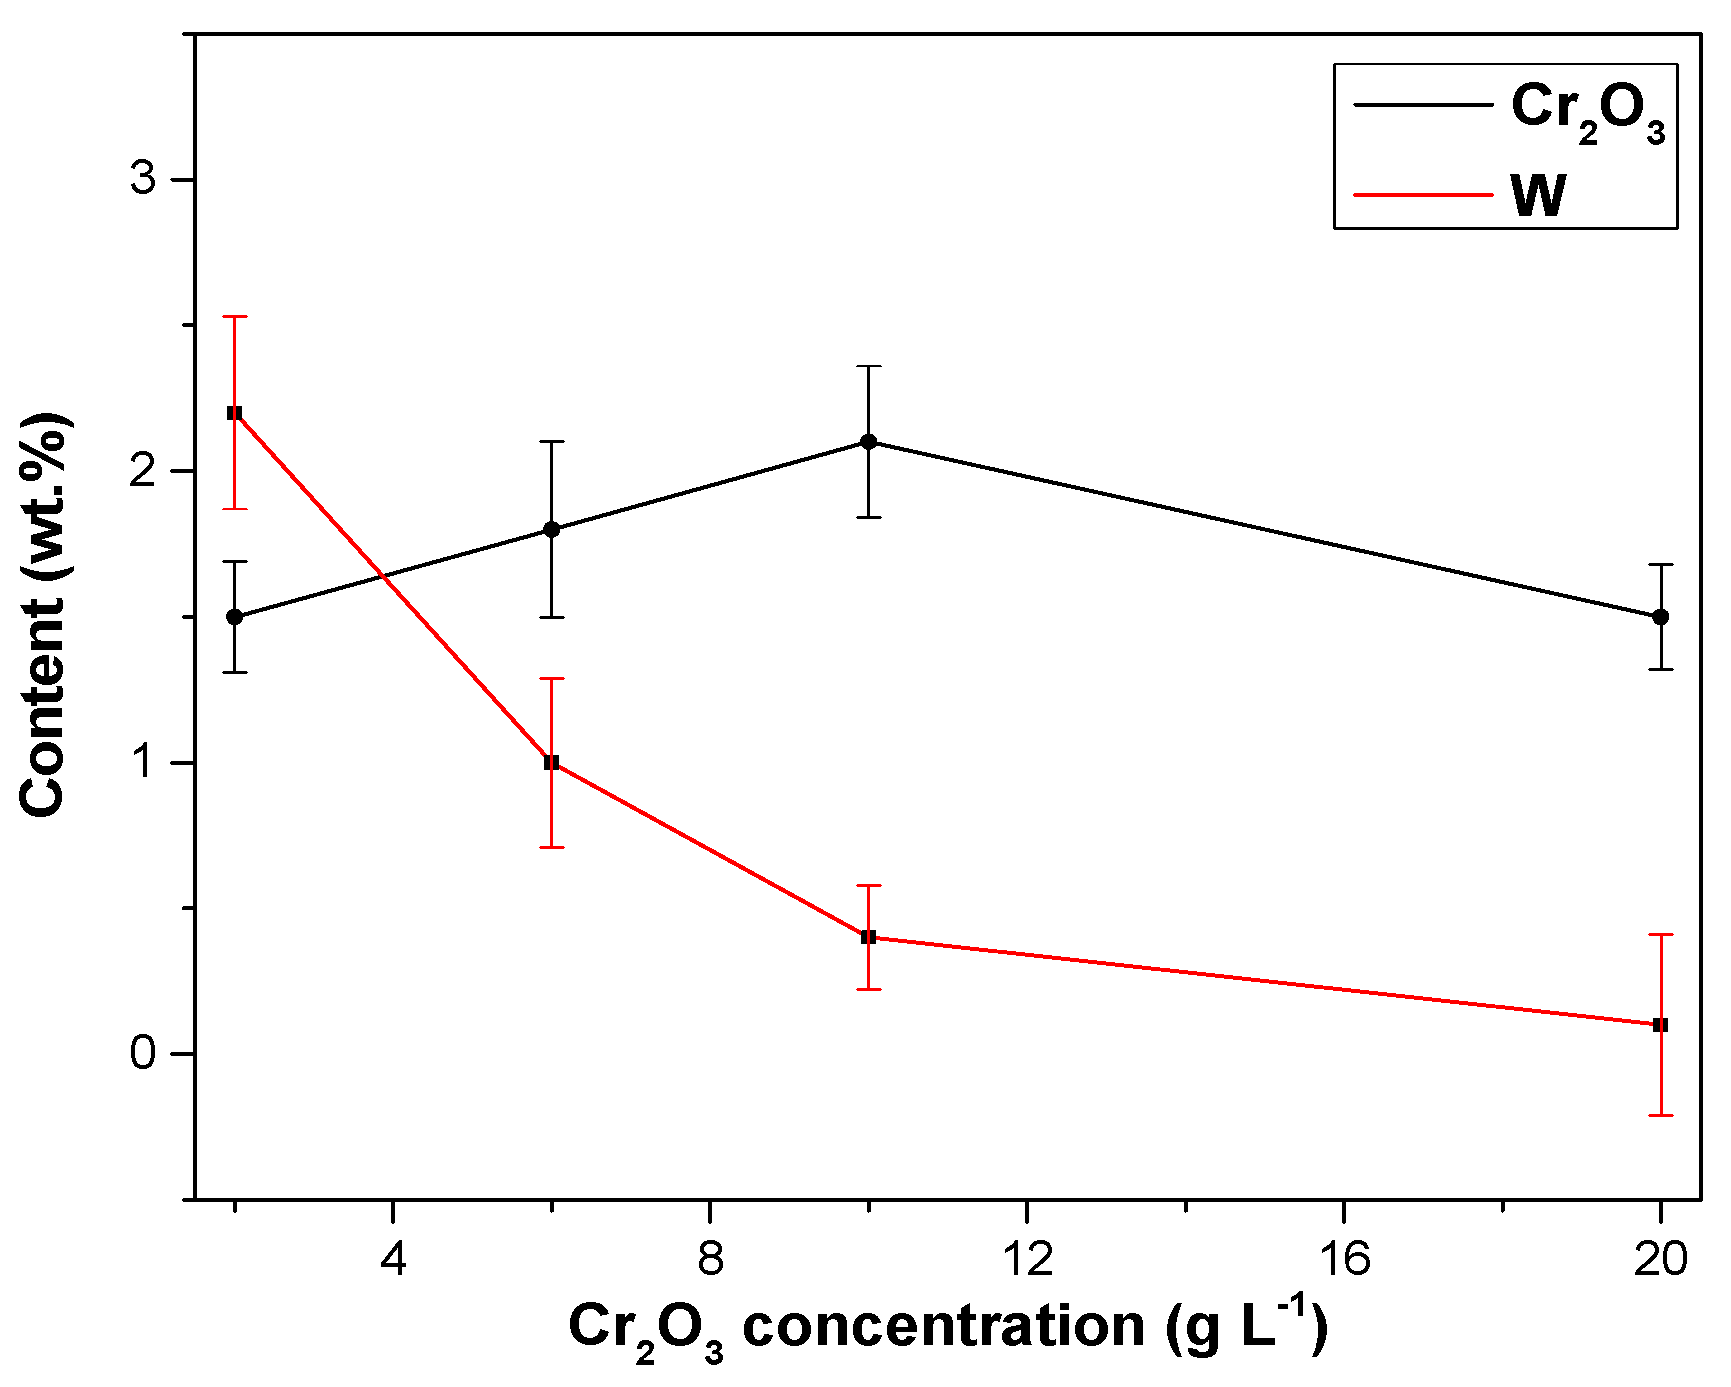
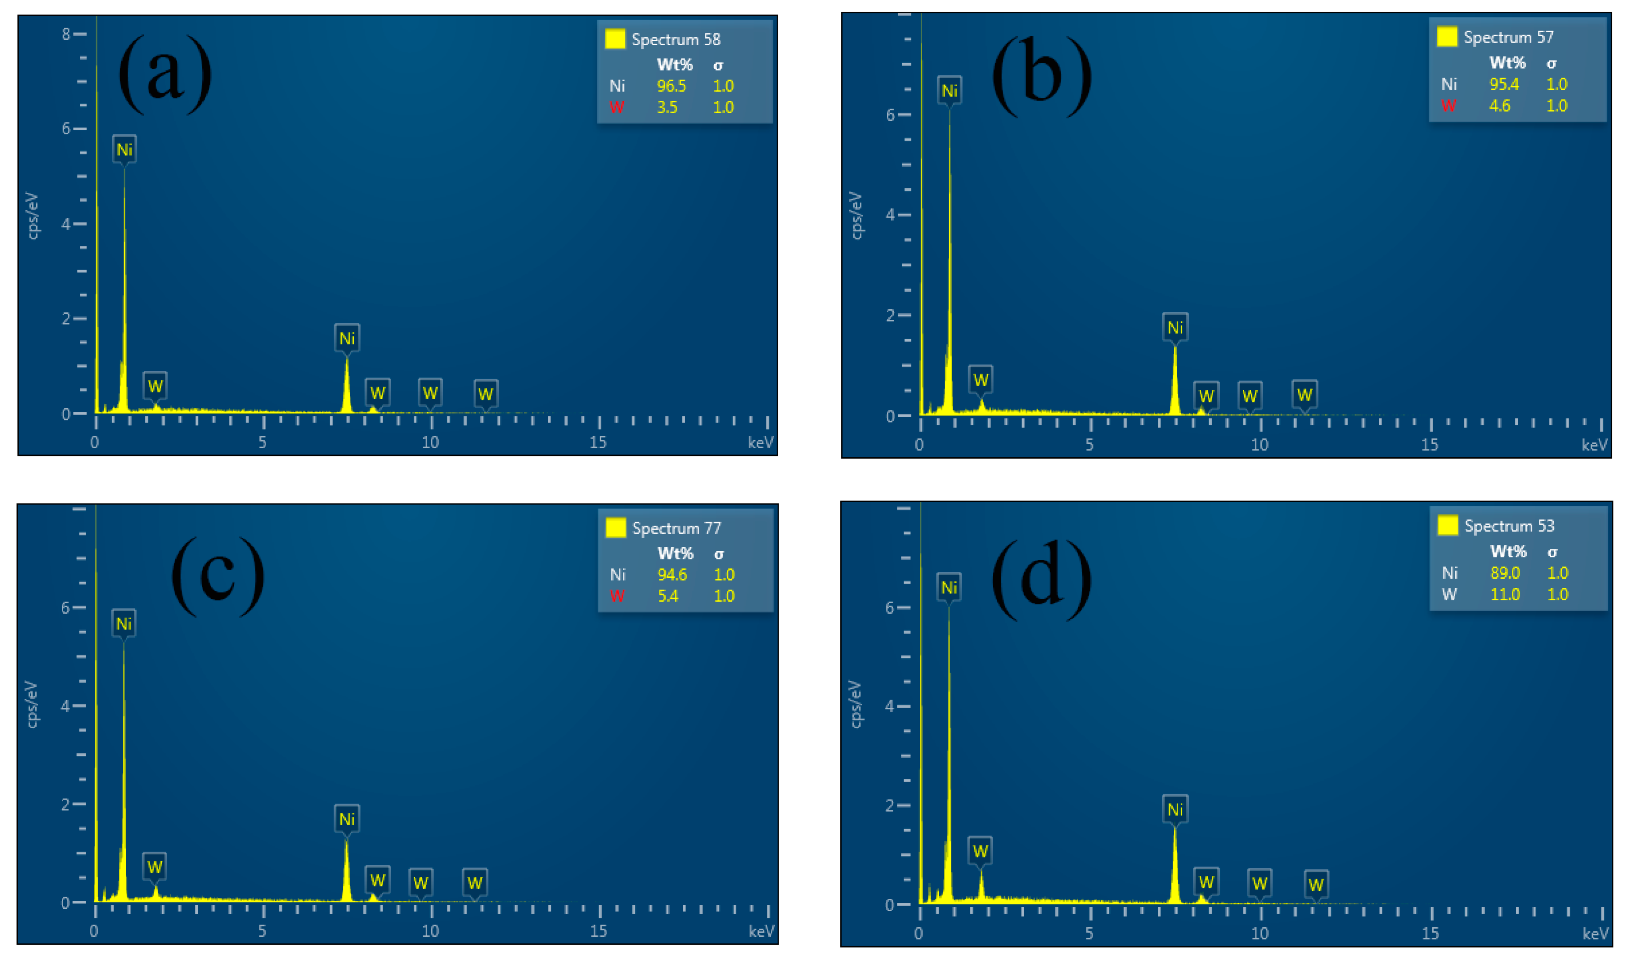
- The nanoparticle content in the Ni–W/Cr2O3 nanocomposite coatings increased with increase in Cr2O3 nanoparticle concentration in the electrolyte.
- (iii)
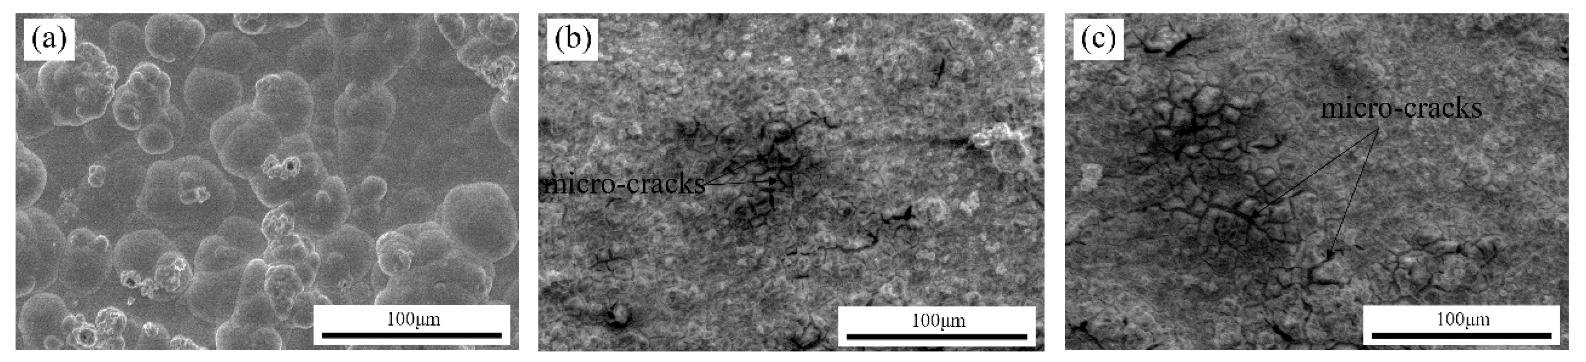
- SEM images showed that the surface morphology of Ni–W/Cr2O3 nanocomposite coatings was nodular at 2 g·L−1, had elliptical clusters comprising of small globules at 6 g·L−1 and 10 g·L−1, and a more amorphous tendency characterized by cavities at 20 g·L−1. Ni–W/Cr2O3 composites deposited at 2 A·dm−2 and 3 A·dm−2 are characterized by a dense net of micro-cracks.
- (iv)
- Ni–W/Cr2O3 nanocomposite coatings electrodeposited with 40 g·L−1 W and 10 g·L−1 Cr2O3 in electrolyte exhibited the best microhardness. It should be noted that these coatings represent only those electrodeposited at 1 A·dm−2.
- (v)
- Ni–W/Cr2O3 nanocomposites exhibits superior wear resistance properties compared to Ni–W binary alloy coatings with coatings deposited with 10 g·L−1 Cr2O3 concentration exhibiting the best wear resistance.
- (vi)
- Ni–W/Cr2O3 nanocomposite coatings electrodeposited with 40 g·L−1 W and 10 g·L−1 Cr2O3 in electrolyte at 1 A·dm−2 exhibited the best corrosion resistance.
Author Contributions
Funding
Acknowledgments
Conflicts of Interest
References
- Hansson, C.J.M. The impact of corrosion on society. Metall. Mater. Trans. A 2011, 42, 2952–2962. [Google Scholar] [CrossRef]
- Ibrahim, I.A.; Mohamed, F.A.; Lavernia, E.J. Particulate reinforced metal matrix composites—A review. J. Mater. 1991, 26, 1137–1156. [Google Scholar] [CrossRef]
- Bhushan, B.; Gupta, B.K. Handbook of Tribology: Materials, Coatings, and Surface Treatments; Stanford Libraries: Stanford, CA, USA, 1991. [Google Scholar]
- Aghajanian, M.K.; Rocazella, M.A.; Burke, J.T.; Keck, S.D. The fabrication of metal matrix composites by a pressureless infiltration technique. J. Mater. 1991, 26, 447–454. [Google Scholar] [CrossRef]
- Robertson, A.; Erb, U.; Palumbo, G. Practical applications for electrodeposited nanocrystalline materials. Nanostruct. Mater. 1999, 12, 1035–1040. [Google Scholar] [CrossRef]
- Landolt, D. Electrochemical and materials science aspects of alloy deposition. Electrochim. Acta 1994, 39, 1075–1090. [Google Scholar] [CrossRef]
- Gurrappa, I.; Binder, L. Materials, Electrodeposition of nanostructured coatings and their characterization—A review. Sci. Technol. Adv. Mater. 2008, 9, 043001. [Google Scholar] [CrossRef]
- Low, C.T.; Wills, R.G.; Walsh, F.C. Electrodeposition of composite coatings containing nanoparticles in a metal deposit. Surf. Coat. Technol. 2006, 201, 371–383. [Google Scholar] [CrossRef]
- Sriraman, K.R.; Raman, S.G.; Seshadri, S.K. Corrosion behaviour of electrodeposited nanocrystalline Ni–W and Ni–Fe–W alloys. Mater. Sci. Eng. A 2007, 460, 39–45. [Google Scholar] [CrossRef]
- Genç, A.; Öveçoğlu, M.L.; Baydoğan, M.; Turan, S. Fabrication and characterization of Ni–W solid solution alloys via mechanical alloying and pressureless sintering. Mater. Des. 2012, 42, 495–504. [Google Scholar] [CrossRef]
- Galikova, Z.; Chovancova, M.; Danielik, V. Danielik, Properties of Ni-W alloy coatings on steel substrate. Chem. Pap. 2006, 60, 353–359. [Google Scholar] [CrossRef]
- Popov, K.; Grgur, B.; Djokić, S.S. Fundamental Aspects of Electrometallurgy; Springer Science & Business Media: Berlin, Germany, 2007. [Google Scholar]
- Alimadadi, H.; Ahmadi, M.; Aliofkhazraei, M.; Younesi, S.R. Corrosion properties of electrodeposited nanocrystalline and amorphous patterned Ni–W alloy. Mater. Des. 2009, 30, 1356–1361. [Google Scholar] [CrossRef]
- De Lima-Neto, P.; Correia, A.N.; Santana, R.A.; Colares, R.P.; Barros, E.B.; Casciano, P.N.; Vaz, G.L. Morphological, structural, microhardness and electrochemical characterisations of electrodeposited Cr and Ni–W coatings. Electrochim. Acta 2010, 55, 2078–2086. [Google Scholar] [CrossRef]
- Landolt, D. Finishing, Fundamental aspects of alloy plating. Plat. Surf. Finish. 2001, 88, 70. [Google Scholar]
- Donten, M.; Cesiulis, H.; Stojek, Z. Electrodeposition and properties of Ni W, Fe W and Fe Ni W amorphous alloys. A comparative study. Electrochim. Acta 2000, 45, 3389–3396. [Google Scholar] [CrossRef]
- Yamasaki, T.; Schloβmacher, P.; Ehrlich, K.; Ogino, Y. Formation of amorphous electrodeposited Ni-W alloys and their nanocrystallization. Nanostruct. Mater. 1998, 10, 375–388. [Google Scholar] [CrossRef]
- Wasekar, N.P.; Latha, S.M.; Ramakrishna, M.; Rao, D.S.; Sundararajan, G. Pulsed electrodeposition and mechanical properties of Ni-W/SiC nano-composite coatings. Mater. Des. 2016, 112, 140–150. [Google Scholar] [CrossRef]
- Beltowska-Lehman, E.; Indyka, P.; Bigos, A.; Szczerba, M.J.; Kot, M. Ni–W/ZrO2 nanocomposites obtained by ultrasonic DC electrodeposition. Mater. Des. 2015, 80, 1–11. [Google Scholar] [CrossRef]
- Rasooli, A.; Safavi, M.S.; Hokmabad, M.K. Cr2O3 nanoparticles: A promising candidate to improve the mechanical properties and corrosion resistance of Ni-Co alloy coatings. Ceram. Int. 2018, 44, 6466–6473. [Google Scholar] [CrossRef]
- Zhang, Y.; Leng, X.; Wang, X.; Ou, P.; Zhang, W.; Zhou, Q. Electrodeposition and Characterization of Ni–W–Cr 2 O 3 Nanocomposite Coating. Metallogr. Microstruct. Anal. 2017, 6, 519–526. [Google Scholar] [CrossRef]
- Weil, R.; Cook, H.C. Electron-Microscopic Observations of the Structure of Electroplated Nickel. J. Electrochem. Soc. 1962, 109, 295–301. [Google Scholar] [CrossRef]
- Yari, S.; Dehghanian, C. Deposition and characterization of nanocrystalline and amorphous Ni–W coatings with embedded alumina nanoparticles. Ceram. Int. 2013, 39, 7759–7766. [Google Scholar] [CrossRef]
- Stern, M.; Geary, A.L. Electrochemical polarization I. A theoretical analysis of the shape of polarization curves. J. Electrochem. Soc. 1957, 104, 56–63. [Google Scholar] [CrossRef]
- Brenner, A. Electrodeposition of alloys. J. Electrochem. Soc. 1964, 111, 34C–35C. [Google Scholar] [CrossRef]
- Gileadi, E.; Eliaz, N. The mechanism of induced codeposition of Ni-W alloys. ECS Trans. 2007, 2, 337–349. [Google Scholar]
- Younes, O.; Gileadi, E. Letters, Electroplating of high tungsten content Ni/W alloys. Electrochem. Solid-State Lett. 2000, 3, 543–545. [Google Scholar] [CrossRef]
- Miracle, D.B.; Donaldson, S.L.; Henry, S.D.; Moosbrugger, C.; Anton, G.J.; Sanders, B.R.; Hrivnak, N.; Terman, C.; Kinson, J.; Muldoon, K.; et al. ASM Handbook; ASM International Materials Park: Geauga, OH, USA, 2003. [Google Scholar]
- Tury, B.; Lakatos-Varsányi, M.; Roy, S. Ni–Co alloys plated by pulse currents. Surf. Coat. Technol. 2006, 200, 6713–6717. [Google Scholar] [CrossRef]
- Allahyarzadeh, M.H.; Aliofkhazraei, M.; Rouhaghdam, A.S.; Torabinejad, V. Electrodeposition of Ni–W–Al2O3 nanocomposite coating with functionally graded microstructure. J. Alloys Compd. 2016, 666, 217–226. [Google Scholar] [CrossRef]
- Eliaz, N.; Sridhar, T.M.; Gileadi, E. Gileadi, Synthesis and characterization of nickel tungsten alloys by electrodeposition. Electrochim. Acta 2005, 50, 2893–2904. [Google Scholar] [CrossRef]
- Yao, Y.; Yao, S.; Zhang, L.; Wang, H. Electrodeposition and mechanical and corrosion resistance properties of Ni–W/SiC nanocomposite coatings. Mater. Lett. 2007, 61, 67–70. [Google Scholar] [CrossRef]
- Celis, J.P.; Roos, J.R. Roos, Kinetics of the deposition of alumina particles from copper sulfate plating baths. J. Electrochem. Soc. 1977, 124, 1508–1511. [Google Scholar] [CrossRef]
- Bakhit, B.; Akbari, A. Technology, Effect of particle size and co-deposition technique on hardness and corrosion properties of Ni–Co/SiC composite coatings. Surf. Coat. Technol. 2012, 206, 4964–4975. [Google Scholar] [CrossRef]
- Gu·ielmi, N. Kinetics of the deposition of inert particles from electrolytic baths. J. Electrochem. Soc. 1972, 119, 1009–1012. [Google Scholar] [CrossRef]
- Hovestad, A.; Janssen, L.J. Electroplating of metal matrix composites by codeposition of suspended particles, in Modern aspects of electrochemistry. In Modern Aspects of Electrochemistry; Springer: Berlin, Germany, 2005; pp. 475–532. [Google Scholar]
- Kuo, S.L.; Chen, Y.C.; Ger, M.D.; Hwu, W.H. Nano-particles dispersion effect on Ni/Al2O3 composite coatings. Mater. Chem. Phys. 2004, 86, 5–10. [Google Scholar] [CrossRef]
- Gomes, A.; Pereira, I.; Fernandez, B.; Pereiro, R. Electrodeposition of metal matrix nanocomposites: Improvement of the chemical characterization techniques, in Advances in nanocomposites-synthesis, characterization and industrial applications. In Advances in Nanocomposites-Synthesis, Characterization and Industrial Applications; IntechOpen: London, UK, 2011. [Google Scholar]
- Wang, Z.; Chen, T.K.; Lloyd, D.J. Lloyd, Stress distribution in particulate-reinforced metal-matrix composites subjected to external load. Metall. Trans. A 1993, 24, 197–207. [Google Scholar] [CrossRef]
- Benea, L. Electrodeposition and tribocorrosion behaviour of ZrO 2–Ni composite coatings. J. Appl. Electrochem. 2009, 39, 1671. [Google Scholar] [CrossRef]
- Li, B.; Zhang, W.; Zhang, W.; Huan, Y. Preparation of Ni-W/SiC nanocomposite coatings by electrochemical deposition. J. Alloys Compd. 2017, 702, 38–50. [Google Scholar] [CrossRef]
- Napłoszek-Bilnik, I.; Budniok, A.; Łosiewicz, B.; Pająk, L.; Łągiewka, E. Electrodeposition of composite Ni-based coatings with the addition of Ti or/and Al particles. Thin Solid Film. 2005, 474, 146–153. [Google Scholar] [CrossRef]
- Ma, M.; Donepudi, V.S.; Sandi, G.; Sun, Y.K.; Prakash, J. Electrodeposition of nano-structured nickel–21% tungsten alloy and evaluation of oxygen reduction reaction in a 1% sodium hydroxide solution. Electrochim. Acta 2004, 49, 4411–4416. [Google Scholar] [CrossRef]
- Wang, Y.; Zhou, Q.; Li, K.; Zhong, Q.; Bui, Q.B. Preparation of Ni–W–SiO2 nanocomposite coating and evaluation of its hardness and corrosion resistance. Ceram. Int. 2015, 41, 79–84. [Google Scholar] [CrossRef]
- Cullity, B.D. Elements of X-Ray Diffraction; Addison-Wesley Publishing Company: Boston, MA, USA, 1967. [Google Scholar]
- Shi, L.; Sun, C.; Gao, P.; Zhou, F.; Liu, W. Mechanical properties and wear and corrosion resistance of electrodeposited Ni–Co/SiC nanocomposite coating. Appl. Surf. Sci. 2006, 252, 3591–3599. [Google Scholar] [CrossRef]
- Beltowska-Lehman, E.; Indyka, P.; Bigos, A.; Szczerba, M.J.; Kot, M. Effect of hydrodynamic conditions of electrodeposition process on microstructure and functional properties of Ni-W/ZrO2 nanocomposites. J. Electroanal. Chem. 2016, 775, 27–36. [Google Scholar] [CrossRef]
- Zhang, Z.; Chen, D.L. Contribution of Orowan strengthening effect in particulate-reinforced metal matrix nanocomposites. Mater. Sci. Eng. A 2008, 483, 148–152. [Google Scholar] [CrossRef]
- Hou, K.H.; Chen, Y.C. Preparation and wear resistance of pulse electrodeposited Ni–W/Al2O3 composite coatings. Appl. Surf. Sci. 2011, 257, 6340–6346. [Google Scholar] [CrossRef]
- Amadeh, A.; Moradi, H. Wear behavior of carbon steel electrodeposited by nanocrystalline Ni–W coating. Int. J. Iron Steel Soc. Iran 2009, 6, 14–19. [Google Scholar]
- Hou, K.H.; Ger, M.D.; Wang, L.M.; Ke, S.T. The wear behaviour of electro-codeposited Ni–SiC composites. Wear 2002, 253, 994–1003. [Google Scholar] [CrossRef]
- Yao, Y.W. Preparation, mechanical property and wear resistance of Ni–W/Al2O3 composite coatings. Surf. Eng. 2008, 24, 226–229. [Google Scholar] [CrossRef]
- Chen, X.H.; Chen, C.S.; Xiao, H.N.; Cheng, F.Q.; Zhang, G.; Yi, G.J. Corrosion behavior of carbon nanotubes–Ni composite coating. Surf. Coat. Technol. 2005, 191, 351–356. [Google Scholar] [CrossRef]


| Process | Fluid Type | Chemical Composition | Concentration (g·L−1) |
|---|---|---|---|
| Degreasing | Electro-hydrostatic fluid | NaOH | 25 |
| Na2CO3 | 21.7 | ||
| NaPO4 | 50 | ||
| NaCl | 2.4 | ||
| Pickling | Activating fluid 1 | HCl | 25 |
| NaCl | 140.1 | ||
| Activating fluid 2 | NaC6H5O7·2H2O | 141.2 | |
| H3C6H5O7·H2O | 94.2 | ||
| NiCl·H2O | 3 |
| Bath Component | Concentration (g·L−1) | Function |
|---|---|---|
| Nickel sulphate (NiSO4·7H2O) | 250 | Ni source |
| Nickel chloride (NiCl2·6H2O) | 50 | Ni source |
| Sodium tungstate (Na2WO4·2H2O) | 10, 20, 30, 40 | W source |
| Trisodium citrate dihydrate (Na3C6H5O7·2H2O) | 90 | Complexer for Ni and W |
| Boric acid (HBO3) | 40 | Buffer |
| Potassium bromide (KBr) | 15 | Conductivity increase |
| Sodium saccharin (COC6H4SO2NNa·2H2O) | 1 | Stress reliever |
| Sodium dodecyl sulphate (SDS) | 0.5 | Surfactant |
| Cr2O3 (20 nm) | 0, 2, 6, 10, 20 | Nanoparticles |
| Deposition Parameters | ||||||
|---|---|---|---|---|---|---|
| Plating Temperature (°C) | Current Density (A·dm−2) | Stirring Rate (rpm) | pH | Electrodeposition Time (min) | Current Type | Anode Material |
| 45 | 1, 2, 3 | 350 | 5.5 ± 0.2 | 60 | DC | Pure Ni (99%) |
| Coatings | βa (mV) | βc (mV) | Ecorr (mV) | icorr (µA·cm−2) | Corrosion Rate (mm/a) | Rp (kΩ·cm−2) |
|---|---|---|---|---|---|---|
| Ni-3.5W | 414.38 | 780.15 | −515 | 39.639 | 0.479 | 2.964 |
| Ni-4.6W | 409.04 | 659.58 | −406 | 37.392 | 0.452 | 2.931 |
| Ni-5.4W | 482.54 | 649.65 | −412 | 29.648 | 0.358 | 4.055 |
| Ni-11.0W | 395.48 | 545.57 | −426 | 22.461 | 0.271 | 4.432 |
| Coatings | W Concentration (g·L−1) | W Content (wt.%) | Grain Size (nm) |
|---|---|---|---|
| Ni–W | 10 | 3.5 | 163.5 |
| Ni–W | 20 | 4.6 | 149.9 |
| Ni–W | 30 | 5.4 | 164.5 |
| Ni–W | 40 | 11.0 | 111.5 |
| Coatings | Concentration (g·L−1) | βa (mV) | βc (mV) | Ecorr (Volts) | icorr (µA·cm−2) | Corrosion Rate (mm/a) | Rp (kΩ·cm−2) |
|---|---|---|---|---|---|---|---|
| Ni-11W | 0 | 395.48 | 545.57 | −0.42606 | 22.461 | 0.27186 | 4.432 |
| Ni-11W-Cr2O3 | 2 | 99.98 | 173.41 | −0.44098 | 5.585 | 0.06760 | 4.929 |
| Ni-11W-Cr2O3 | 6 | 4734.70 | 170.88 | −0.26004 | 2.615 | 0.03165 | 27.382 |
| Ni-11W-Cr2O3 | 10 | 171.66 | 82.08 | −0.27321 | 0.553 | 0.00670 | 43.540 |
| Ni-11W-Cr2O3 | 20 | 1084.40 | 240.69 | −0.58341 | 5.832 | 0.07058 | 14.665 |
| Coatings | Current Density (A·dm−2) | βa (mV) | βc (mV) | Ecorr (Volts) | icorr (µA·cm−2) | Corrosion Rate (mm/a) | Rp (kΩ·cm−2) |
|---|---|---|---|---|---|---|---|
| Ni-yyW-xxCr2O3 | 1 | 171.66 | 82.089 | −0.27321 | 0.5538 | 0.006702 | 43.54 |
| Ni-yyW-xxCr2O3 | 2 | 100.78 | 514.98 | −0.36289 | 6.1465 | 0.074394 | 5.9543 |
| Ni-yyW-xxCr2O3 | 3 | 3444.2 | 450.06 | −0.61182 | 18.656 | 0.2258 | 9.2645 |
© 2019 by the authors. Licensee MDPI, Basel, Switzerland. This article is an open access article distributed under the terms and conditions of the Creative Commons Attribution (CC BY) license (http://creativecommons.org/licenses/by/4.0/).
Share and Cite
Mbugua Nyambura, S.; Kang, M.; Zhu, J.; Liu, Y.; Zhang, Y.; Ndiithi, N.J. Synthesis and Characterization of Ni–W/Cr2O3 Nanocomposite Coatings Using Electrochemical Deposition Technique. Coatings 2019, 9, 815. https://doi.org/10.3390/coatings9120815
Mbugua Nyambura S, Kang M, Zhu J, Liu Y, Zhang Y, Ndiithi NJ. Synthesis and Characterization of Ni–W/Cr2O3 Nanocomposite Coatings Using Electrochemical Deposition Technique. Coatings. 2019; 9(12):815. https://doi.org/10.3390/coatings9120815
Chicago/Turabian StyleMbugua Nyambura, Samuel, Min Kang, Jiping Zhu, Yuntong Liu, Yin Zhang, and Ndumia Joseph Ndiithi. 2019. "Synthesis and Characterization of Ni–W/Cr2O3 Nanocomposite Coatings Using Electrochemical Deposition Technique" Coatings 9, no. 12: 815. https://doi.org/10.3390/coatings9120815
APA StyleMbugua Nyambura, S., Kang, M., Zhu, J., Liu, Y., Zhang, Y., & Ndiithi, N. J. (2019). Synthesis and Characterization of Ni–W/Cr2O3 Nanocomposite Coatings Using Electrochemical Deposition Technique. Coatings, 9(12), 815. https://doi.org/10.3390/coatings9120815