Article

Electrodeposition of a Ni–P–TiO2/Ti3C2Tx Coating with In Situ Grown Nanoparticles TiO2 on Ti3C2Tx Sheets

1
State Key Laboratory of Multiphase Complex Systems, Institute of Process Engineering, Chinese Academy of Sciences, Beijing 100190, China
2
School of Chemical Engineering, University of Chinese Academy of Sciences, Beijing 100049, China
3
China Academy of Safety Science and Technology, Beijing 100012, China
*
Authors to whom correspondence should be addressed.
Coatings 2019, 9(11), 750; https://doi.org/10.3390/coatings9110750
Submission received: 14 October 2019 / Revised: 31 October 2019 / Accepted: 7 November 2019 / Published: 12 November 2019
(This article belongs to the Section Corrosion, Wear and Erosion)

Abstract

:
Protective coatings have received considerable attention for the surface treatment of devices. Herein, in situ grown nanoparticles, TiO2 on Ti3C2Tx sheets (TiO2/Ti3C2Tx), are prepared by a simple hydrothermal oxidation method possessing the layer structure, which is applied to prepare protective coatings. The Ni–P–TiO2/Ti3C2Tx coating is prepared by electroplating technology, revealing more excellent properties than those of the Ni–P coating. Compared with the Ni–P coating, even though the Ni–P–TiO2/Ti3C2Tx coating holds the rough surface, the wettability is changed from hydrophilic to hydrophobic, owing to the gathering existence of TiO2/Ti3C2Tx on the surface and coarse surface texture. In addition, the participation of TiO2/Ti3C2Tx in the Ni–P coating can improve the capacity of corrosion prevention and decrease the corrosion rate. According to the results of hardness and wear tests, microhardness of the Ni–P–TiO2/Ti3C2Tx coating is approximately 1350 kg mm−2 and the coefficient of friction (COF) of Ni–P–TiO2/Ti3C2Tx coatings is about 0.40, which is much lower than that of Ni–P coatings. Thus, the Ni–P–TiO2/Ti3C2Tx coating can be a promising material to protect the surface of equipment.

1. Introduction

It is well known that the surface is the most essential part of several engineering components, easily suffering from corrosion, abrasion, and fatigue [1,2]. Researchers have made great efforts to improve these surface properties, such as hardness, wear performance, and corrosion resistance [3,4]. Similarly, various technologies have been employed to prepare the protective coating, including electroplating, plasma thermal spray, and chemical vapor deposition [5]. Due to low cost and easy operation, electroplating is the most outstanding among these technologies [6,7,8,9].
According to previous papers, the Ni–P composite coating possesses excellent properties, so it is widely used to deal with problems in the engineering process [10,11]. However, when encountering some tricky conditions, the Ni–P composite coating is hardly able to overcome these difficulties [12]. Thus, the modification of Ni–P composite coatings is proven to be an efficient method to expand application fields, so introducing particles into these coatings can improve their properties, such as TiO2 particles, MoS2 particles, and Al2O3 particles [13,14,15,16]. Generally, the property of the composite coating is closely related to these incorporating particles [17].
Usually, two-dimensional (2D) structural materials hold a low friction coefficient, so they can show promising prospects in solid lubrication. As a typical layered structural material, Ti3C2Tx particles have been applied to lubricating oil, owing to wear resistance, thermal stability, and electrochemical corrosion [18]. Due to the weak Van der Waal’s bonding between layers, there is potential for Ti3C2Tx particles to slide, so it holds a low friction coefficient of 0.1 in lubricating oil. Thus, these incorporating Ti3C2Tx particles can provide a low friction coefficient for the Ni–P coating [19]. As previous papers have shown, TiO2 particles introduced into coatings can increase the hardness, wear resistance, and corrosion resistance. Baghery et al. prepared the Ni–TiO2 coating, which exhibited excellent properties of hardness and wear resistance [2]. Similarly, Uttam and Duchaniya synthesized the Ni–P–TiO2 coating on mild steel, showing excellent corrosion resistance [20]. Therefore, it is a perfect idea for introducing TiO2 particles into the Ni–P coating.
TiO2/Ti3C2Tx particles with heterogeneous interfaces have been widely used in photocatalytic activity and electrochemistry. In previous works, Xu et al. prepare in situ grown nanocrystal TiO2 on 2D Ti3C2 nanosheets for artificial photosynthesis of chemical fuels [21]. Peng et al. found that hybrids of two-dimensional Ti3C2 and TiO2 exposing {001} facets enhanced photocatalytic activity [22]. However, it is little reported that TiO2/Ti3C2Tx particles are used in the area of surface treatment. In this work, in situ grown nanocrystal TiO2 on Ti3C2Tx particles were prepared by hydrothermal reaction and incorporated into Ni–P coatings to prepare the Ni–P–TiO2/Ti3C2Tx coating. These particles can combine excellent properties with TiO2 and Ti3C2Tx, so it is beneficial to improve the wear resistance and corrosion resistance of the Ni–P coating.

2. Experiment Procedure

2.1. Preparation of TiO2/Ti3C2Tx Powders

Ti3AlC2 powders (10 g) were transferred to a Teflon beaker, and 40 mL 40% hydrofluoric acid were dropwise added into them under stirring at 40 °C for 18 h. Then, these obtained products were washed with deionized water until a pH of 5 and dried in a vacuum drying oven at a temperature of 80 °C for 24 h [18].
Those as-prepared products (2.4 g) were added to a beaker, containing 360 mL 1M hydrochloric acid and 7.2 g sodium fluoroborate under agitation for 30 min. The obtained solution was shifted into hydrothermal reactors at 160 °C for 12 h. After washing with deionized water several times, these products were shifted to a vacuum drying oven at 80 °C for 24 h.

2.2. Preparation of Composite Coatings

TiO2/Ti3C2Tx powders (4 g·L−1) were dispersed uniformly into nickel sulfate plating baths, including nickel sulfate, nickel chloride, boric acid, citric acid, and SDS under stirring. The bath compositions and experimental conditions are shown in Table 1. A pure nickel plate (70 mm × 60 mm) and manganese steel (20 mm × 30 mm) were taken as the anode and cathode, respectively. The composition of the manganese steel is shown in Figure 1, mainly containing elements of Fe, Mn, Cr, Si, S, and P. After the process of electroplating, the composite coating was washed by ultrasound for 10 min, dried in an oven at 100 °C for 1 h, and then annealed in a tube furnace at 400 °C for 60 min under argon atmosphere.

2.3. Material Characterization

Field-emission scanning electron microscopy (FE-SEM, JEOL JSM-6700F, JEOL, Tokyo, Japan) and a transmission electron microscopy (TEM, JEOL JEM-2010F, JEOL, Tokyo, Japan) equipped with an accelerating voltage of 200 kV were employed to observe the morphology and structure of these samples. X-ray diffractometer (XRD, Philips, X’Pert Pro, Almelo, the Netherlands) with Cu-Kα radiation and X-ray fluorescence spectrometer (XRF; AXIOS-MAX, PANalytical B.V., Almelo, the Netherlands) were used to measure the chemical composition of samples. A laser-scanning Raman microscope (Nanophoton Corporation, Raman-11, Osaka, Japan) was applied to detect the structure of samples with a confocal laser spectrometer, using the 532 nm excitation of the argon laser at room temperature. X-ray photoelectron spectroscopy (XPS, Themo Fisher Scientific, ESCALAB 250Xi, Waltham, MA, USA) with a monochromatic Al Kα radiation was used to record the surface analysis of TiO2/Ti3C2Tx powders. The Fourier transform infrared (FTIR, Excalibur 3100, Varian Medical Systems, Palo Alto, CA, USA) spectroscopy measurement was conducted in a KBr pellet at room temperature. A digital micro-hardness tester (MC010, Yanrui, Shanghai, China) was applied to determine the microhardness of composite coatings at a load of 300 g for 15 s, and the result was achieved from the average of five data on the sample surface. A surface roughness tester (TR211, Shidai Ruida, Beijing, China) was used to detect the Ra of composite coatings, which was obtained from the mean result of five data sets. An electrochemical station (UN-O-16076, Zahner, Kronach, Germany) was used to test the electrochemical measurement in a three-electrode system. Water contact angle measurements using 2 uL water droplets were determined by a measurement apparatus (K100, Kruss, Hamburg, Germany) at 25 °C with DropSnake to shape the drop and measure the contact angle. Wear tests were carried out by a circumrotating ball-on-disk tribometer (HT-1000, Lanzhou, China) with silicon nitride as the grinding material.

3. Results and Discussions

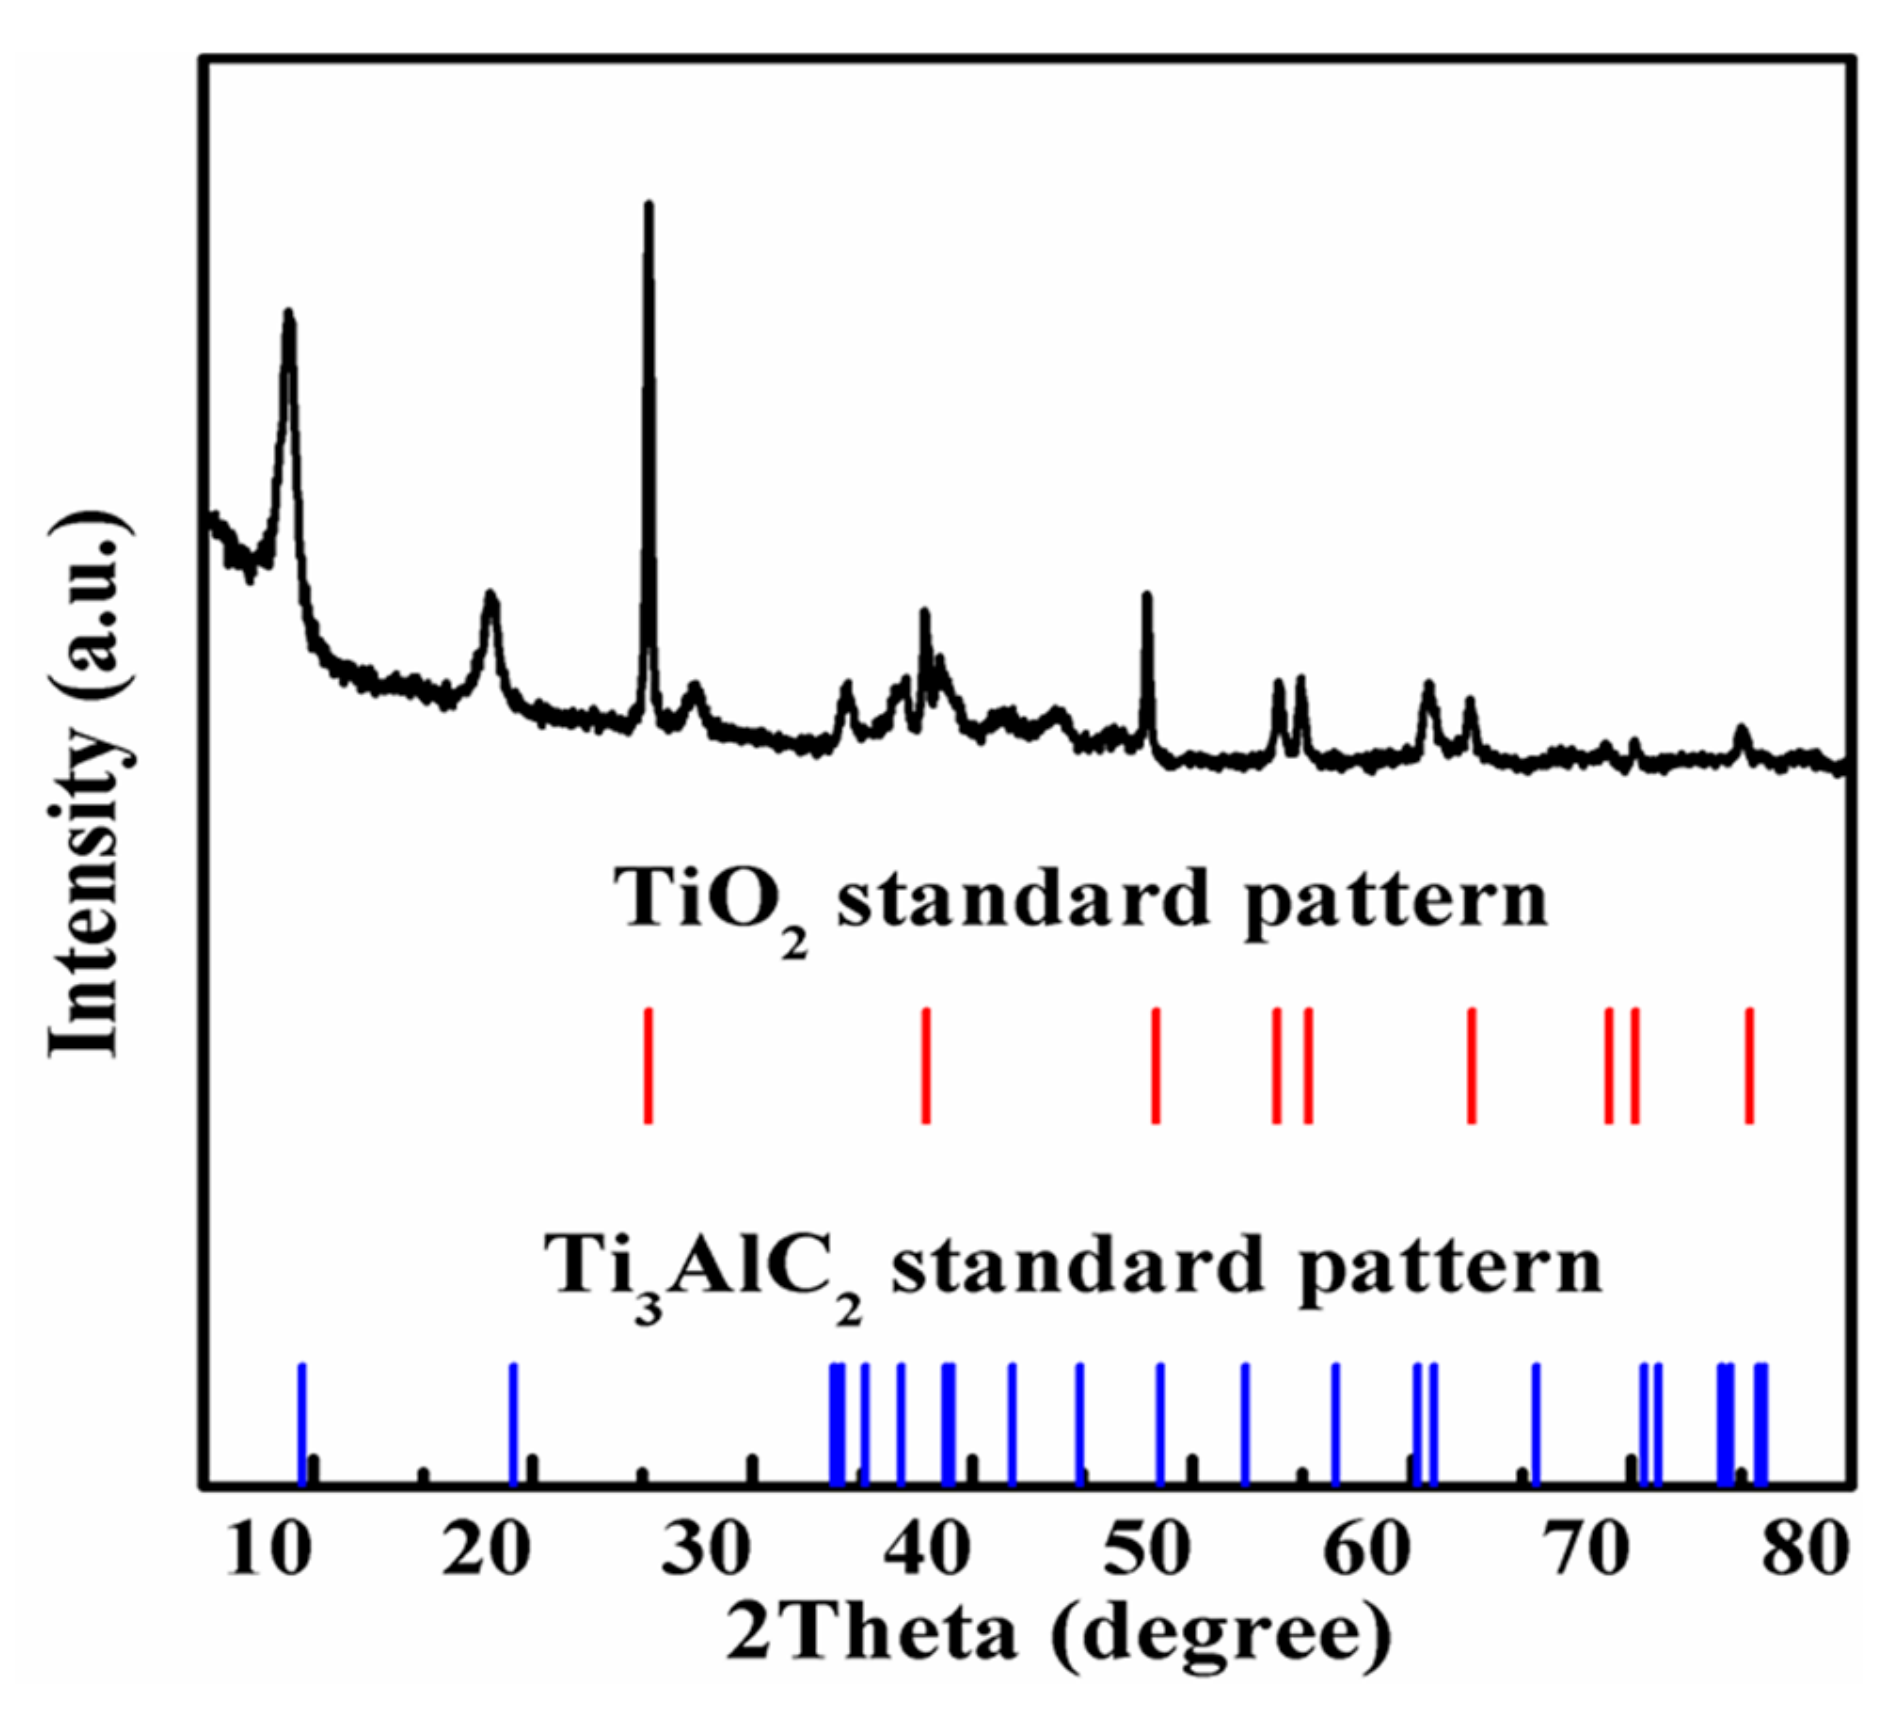
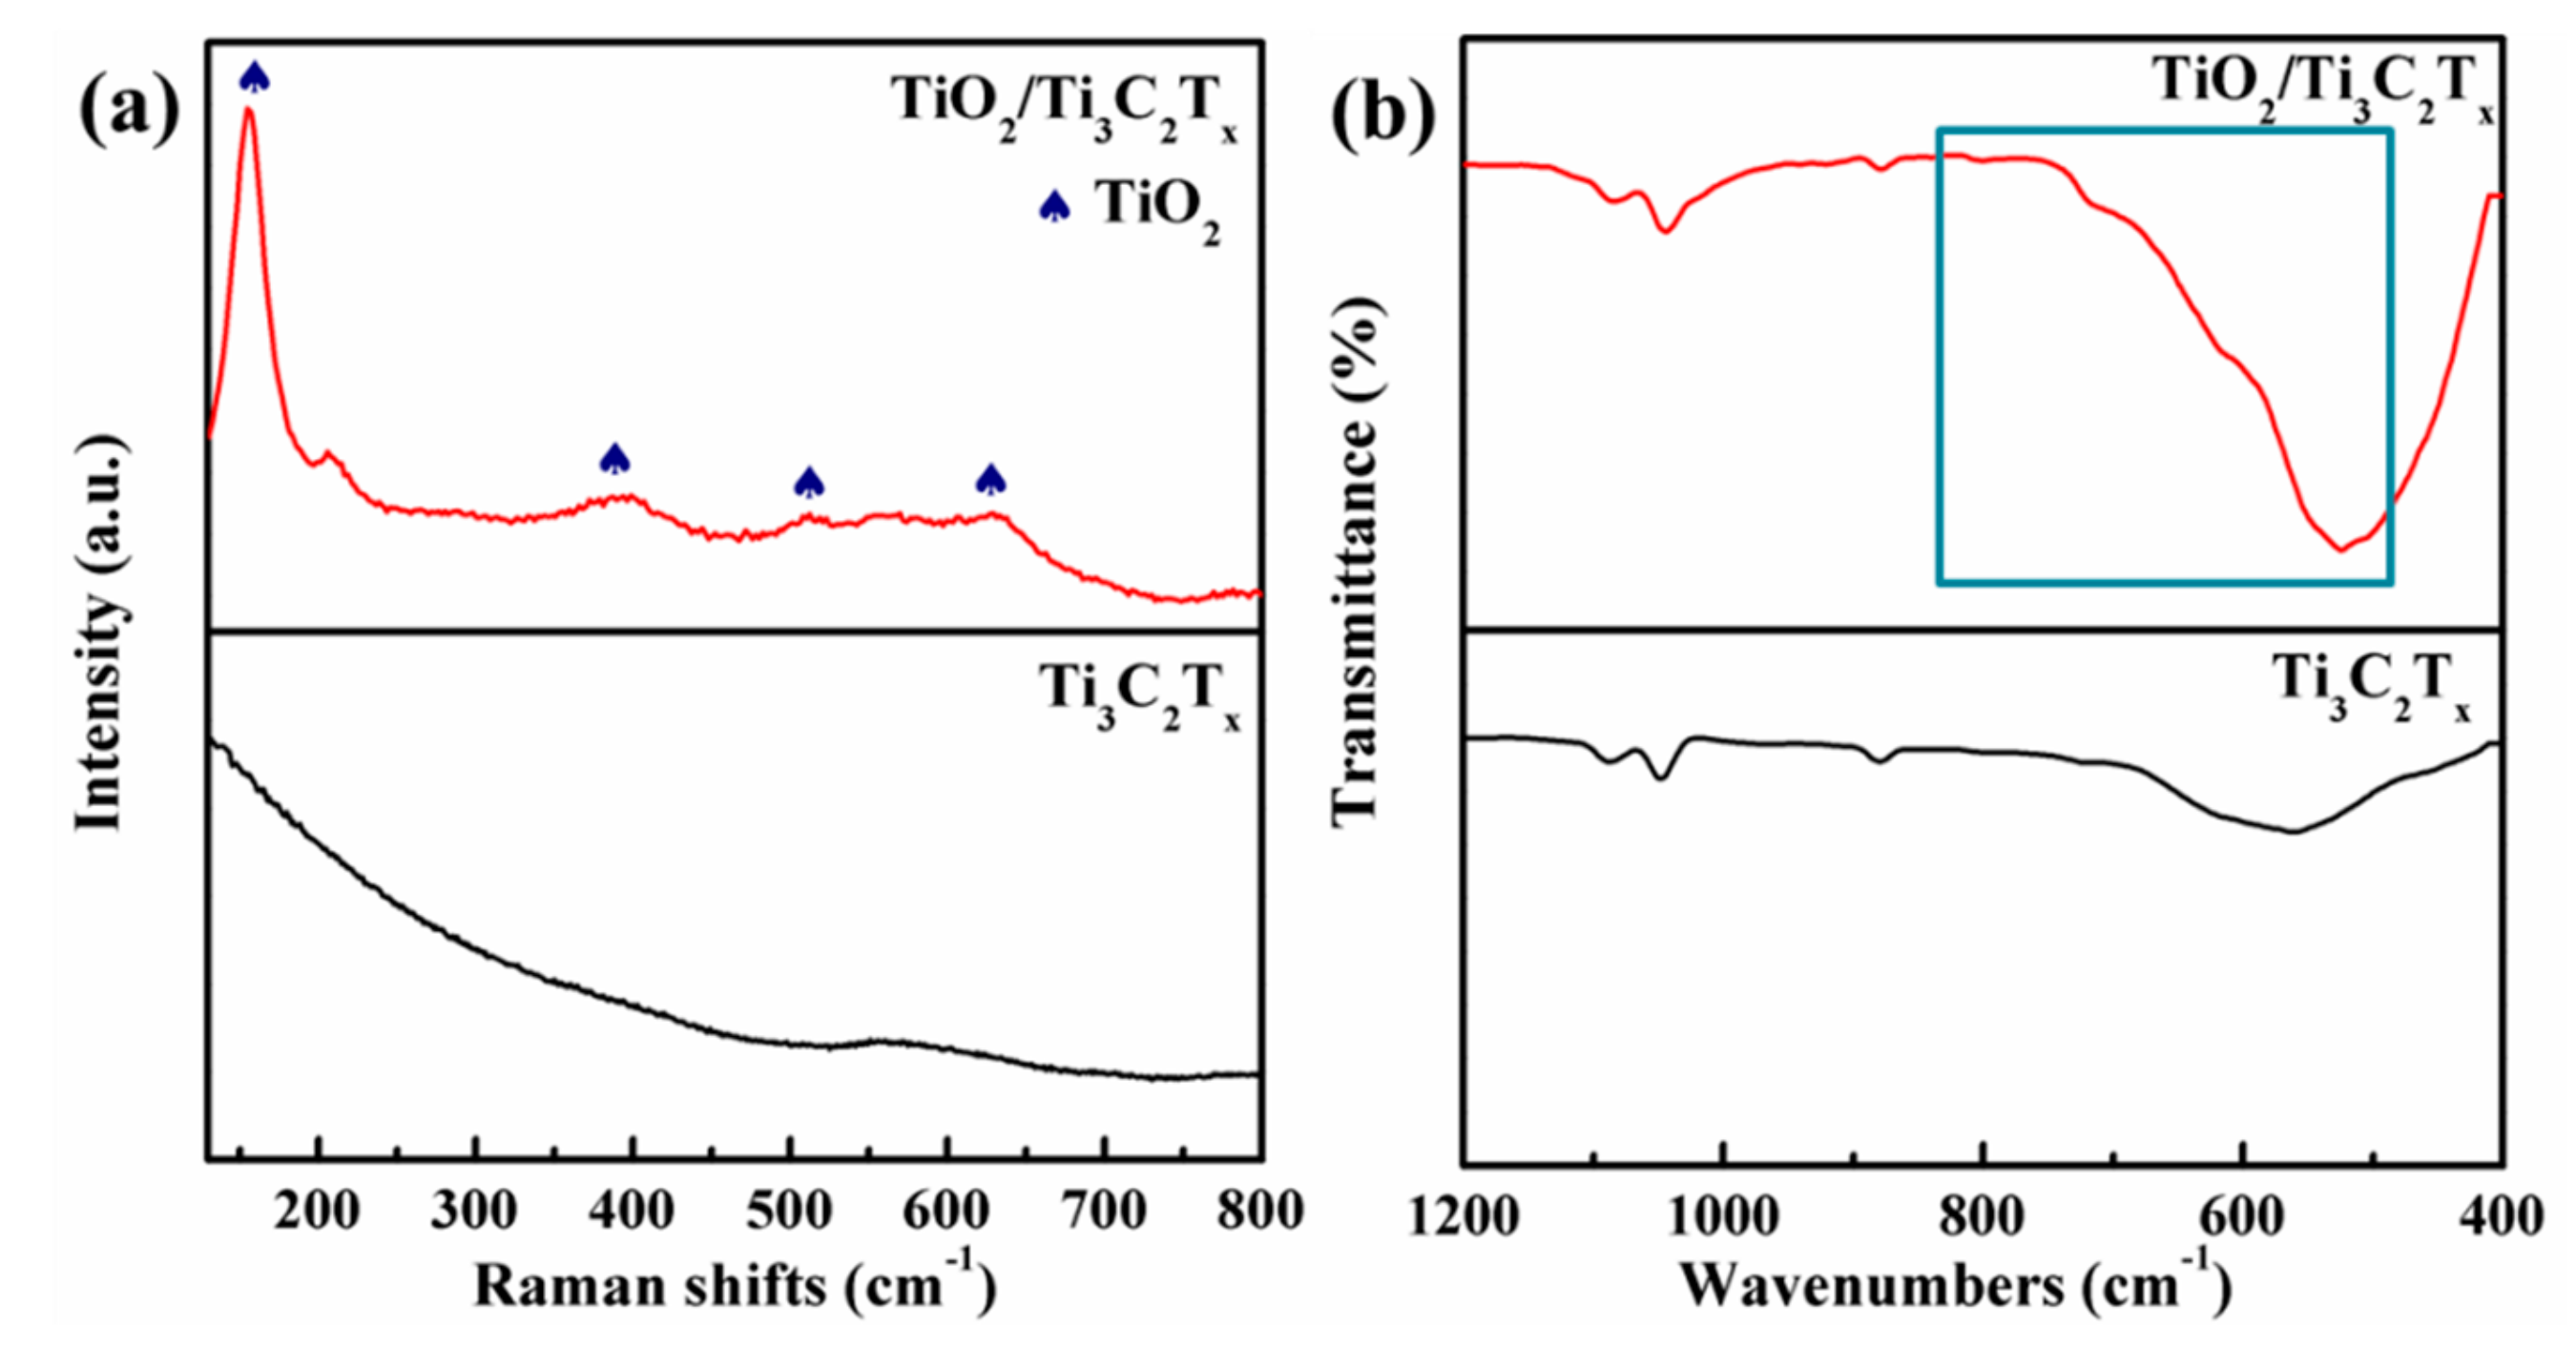
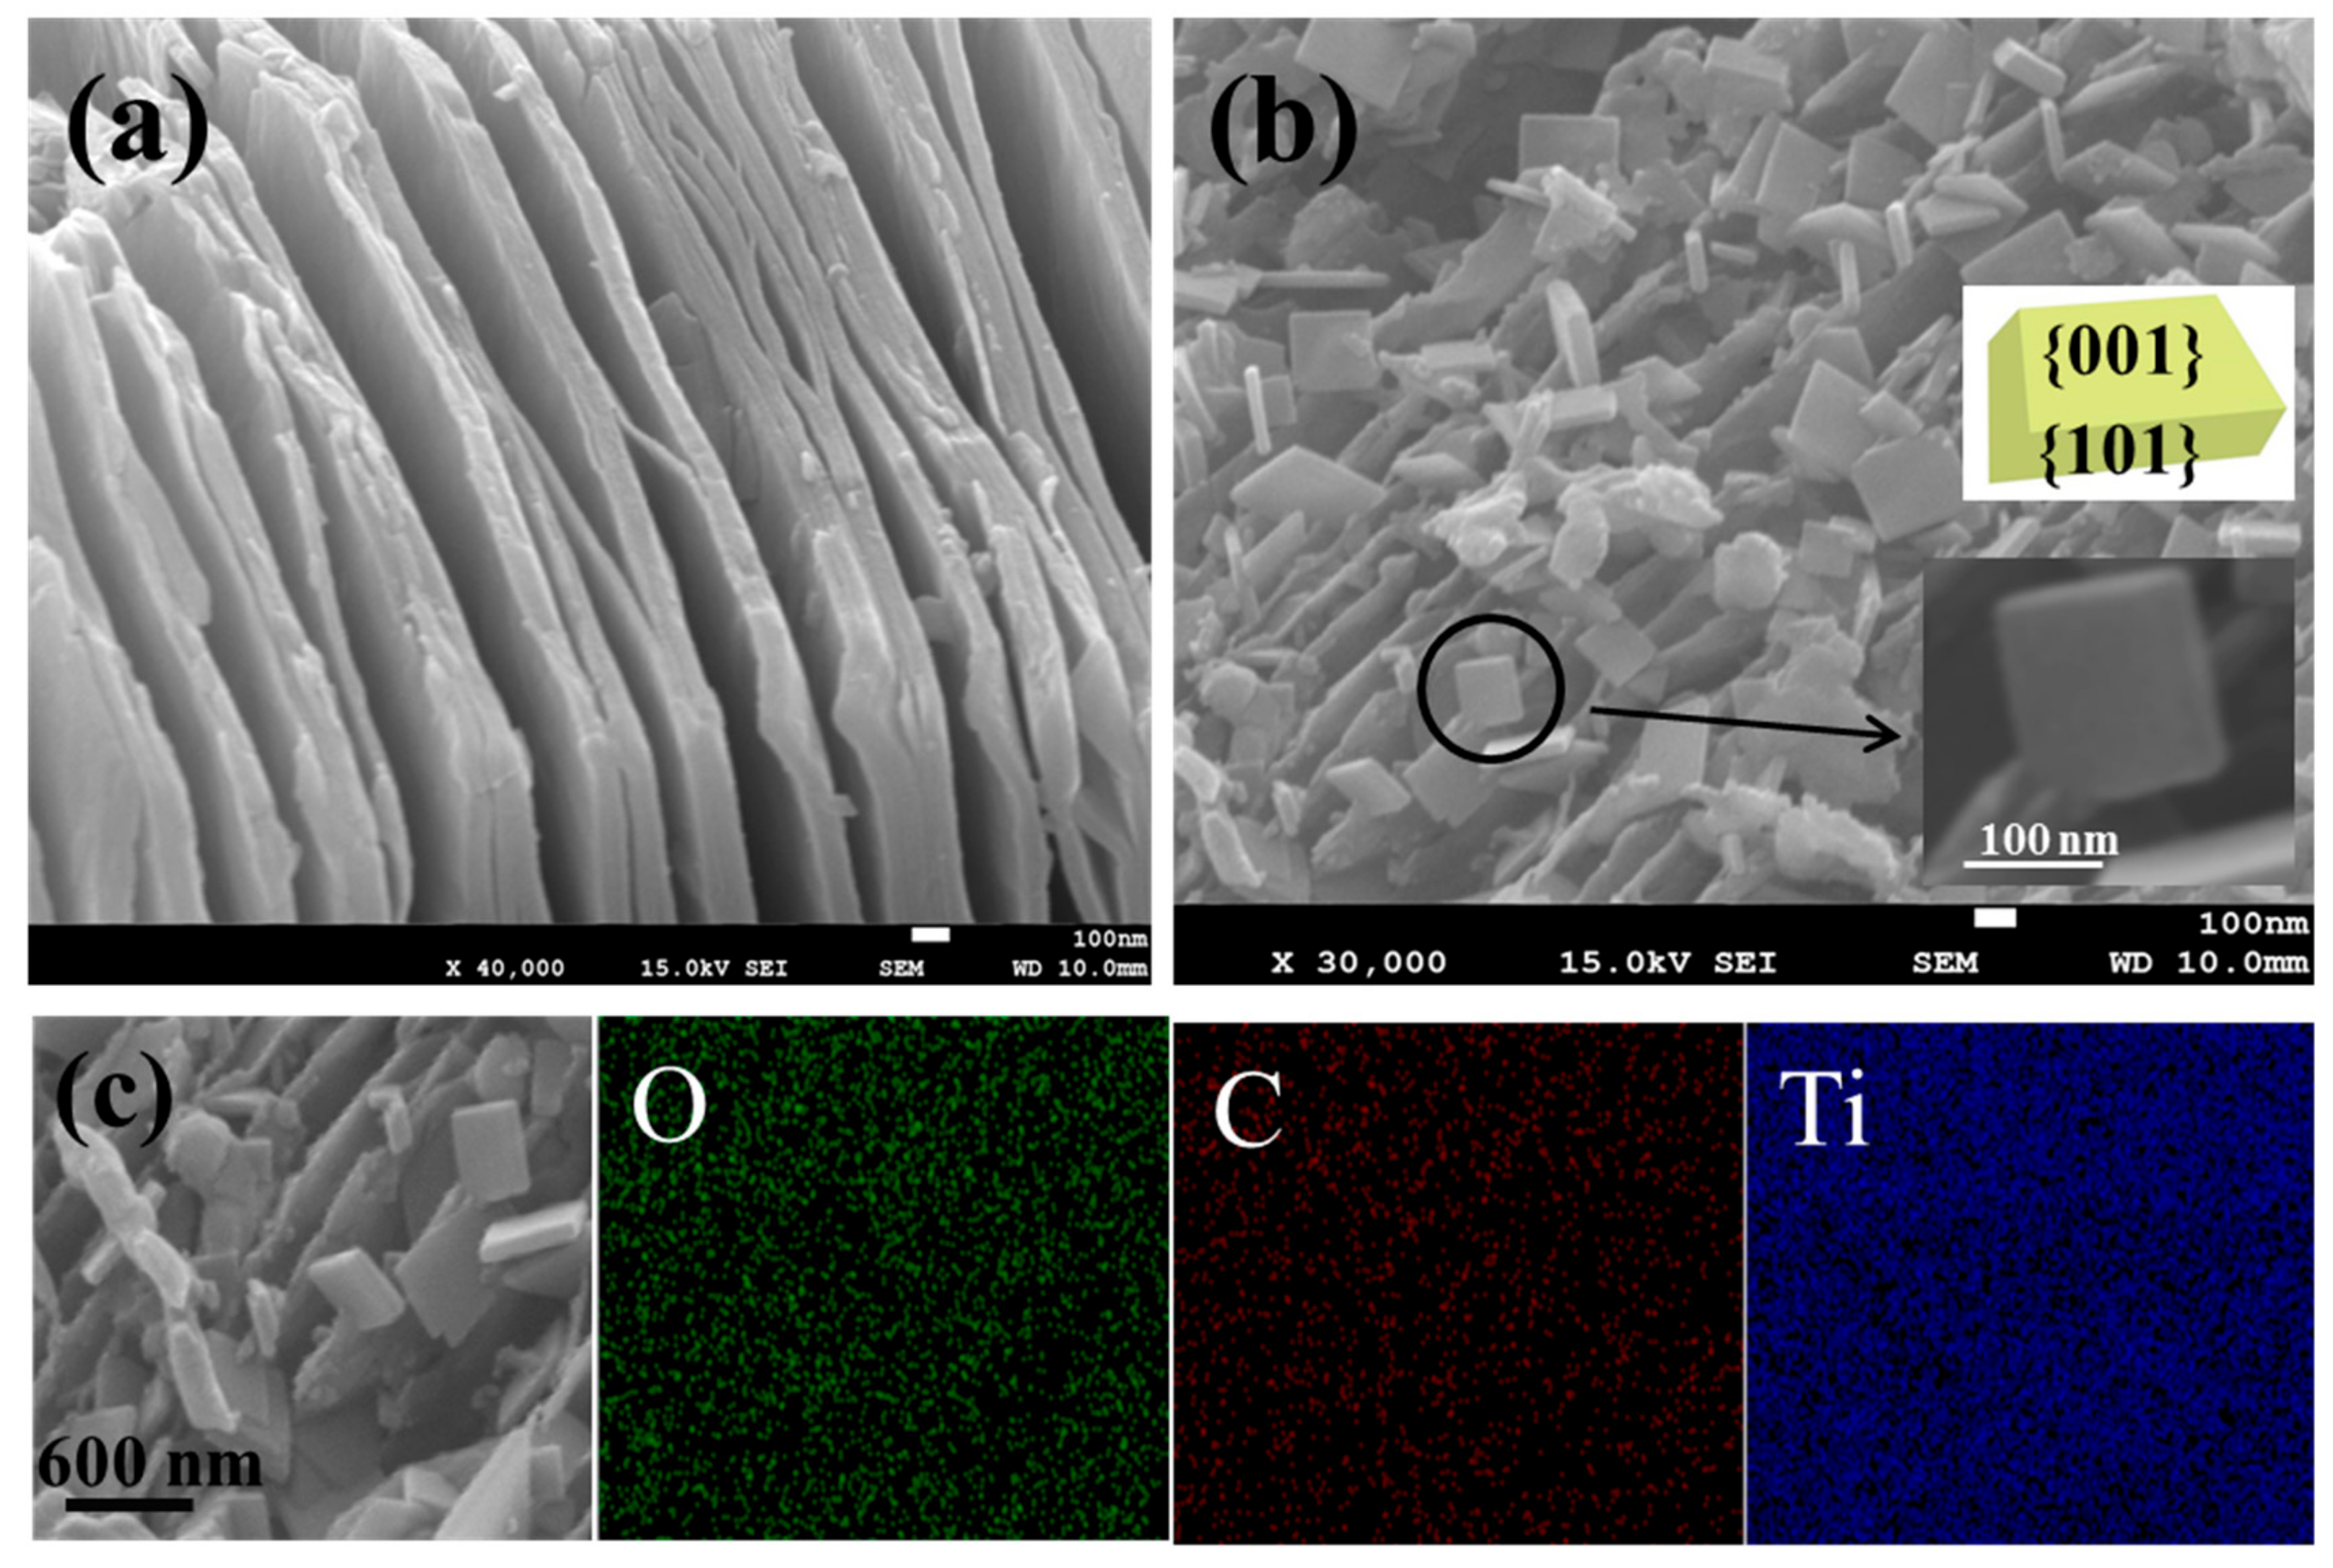
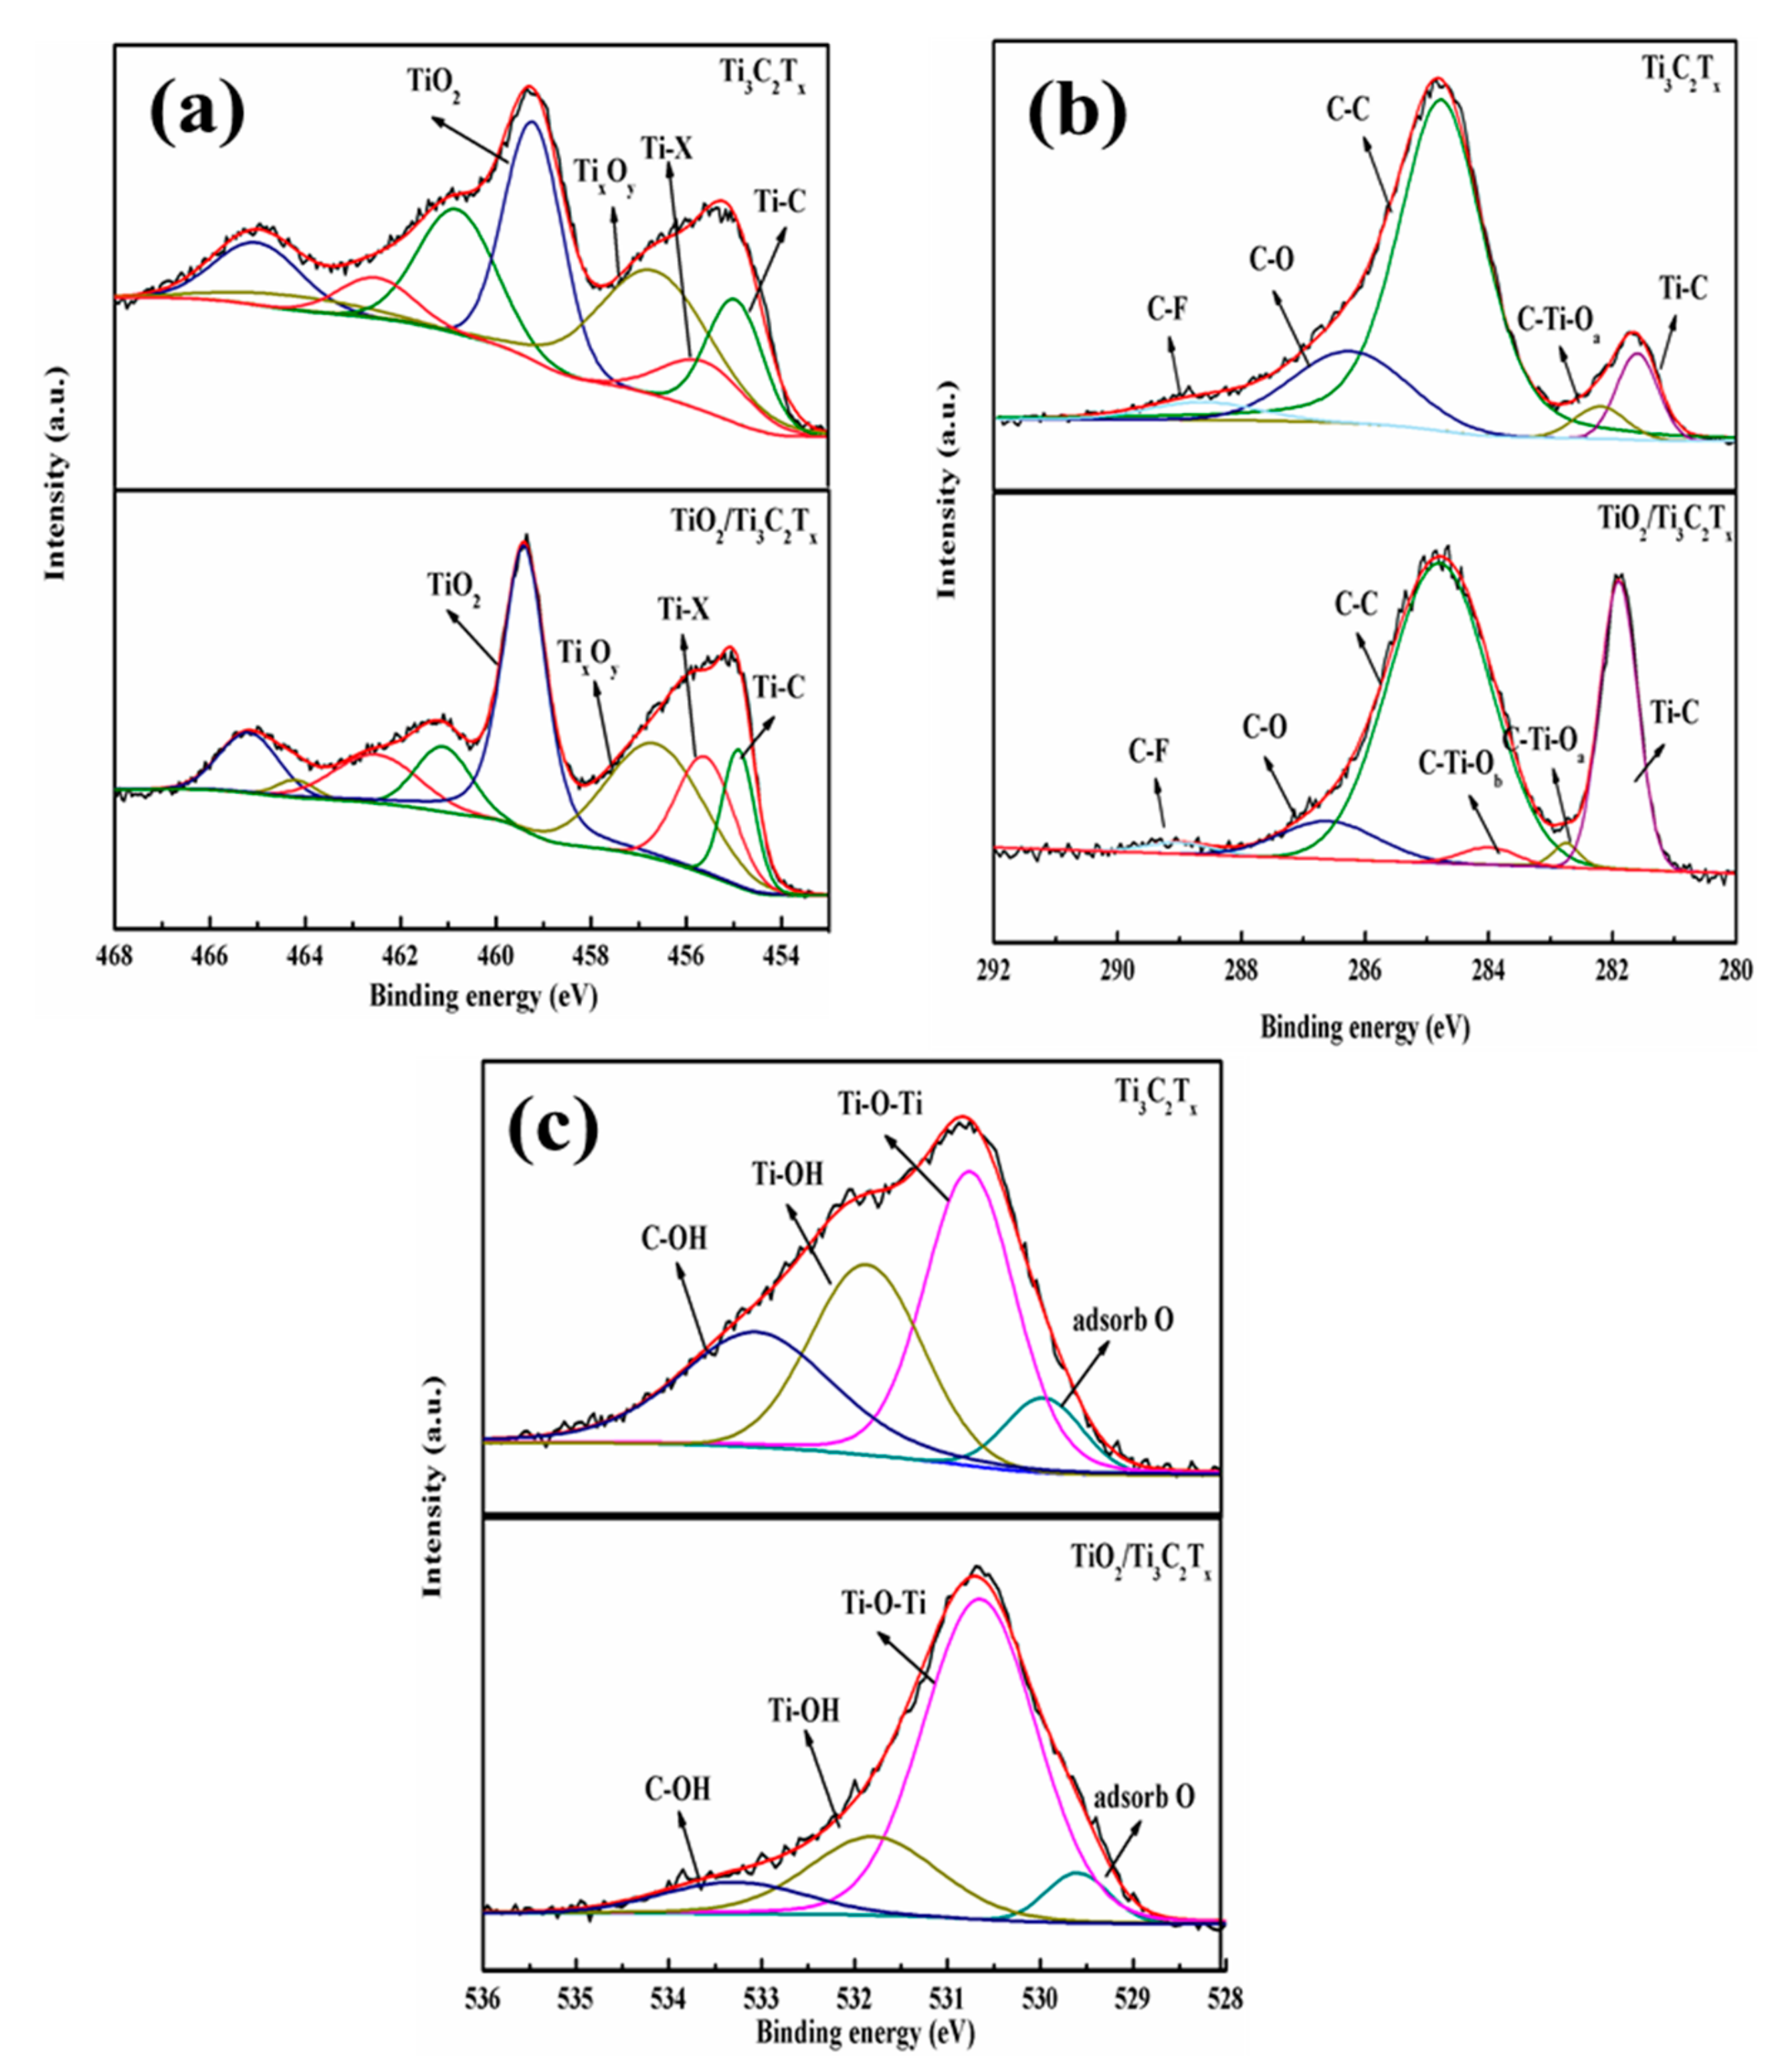
3.1. Characterization of Powders

Figure 2 shows the XRD pattern of TiO2/Ti3C2Tx powders with TiO2 and Ti3AlC2 standard patterns. Due to no information of Ti3C2Tx in ICSD, a Ti3AlC2 standard pattern with the space group P63/mmc was used to fit the XRD pattern of TiO2/Ti3C2Tx powders [23]. These characteristic peaks located at 9.58° and 19.17° were assigned to (002) and (004), which shifted lower to 8.95° and 17.91°, indicating the existence of Ti3C2Tx. In addition, the shift of planes can show the increase of the c-lattice parameter and basal spacing. After hydrothermal oxidation, peaks belonging to anatase TiO2 phase were much stronger than those of Ti3C2Tx powders, demonstrating that Ti3C2Tx was partly oxidized and the anatase TiO2 was present on the Ti3C2Tx [22].
Raman spectra and FTIR spectra of TiO2/Ti3C2Tx and Ti3C2Tx powders are shown in Figure 3. In Figure 3a, the strongest peak located at 150 cm−1 is attributed to the symmetry vibration Eg of anatase TiO2. Similarly, peaks of 413, 520, and 634 cm−1 are assigned to the vibration mode of B1g, A1g, and Eg of anatase TiO2, separately [24,25]. According to the characteristic anatase Raman peak of pure TiO2, a slight increase in the Eg1 peak is detected [26]. The peaks are in a tetragonum in Figure 3, showing the existence of TiO2. These peaks of anatase TiO2 mainly appear among 800~500 cm−1, so peaks of TiO2/Ti3C2Tx are stronger than those of Ti3C2Tx. In addition, the peak located at ~570 cm−1 can be assigned to the deformation vibration of the Ti–O bond. [25] Thus, these results of Raman and FTIR spectra indicate the formation of anatase TiO2.
SEM images of Ti3C2Tx powders and TiO2/Ti3C2Tx powders with EDS elemental mapping are clearly seen in Figure 4. In Figure 4a, the layered structure of Ti3C2Tx powders is obviously shown after the etching effect of HF solution. In Figure 4b, after the hydrothermal oxidation, even though anatase TiO2 particles exist on the Ti3C2Tx powders, the layered structure of Ti3C2Tx powders still remain, deriving from the titanium atoms on Ti3C2Tx, acting as nucleating sites for the growth of anatase TiO2 [27]. The HRSEM image of the circle area displays the anatase TiO2 with a thickness of ~30 nm and length of ~200 nm, and it can be observed that the interfacial angle between the {001} and {101} facets of anatase TiO2 is about 68.3° [28]. As for the previous paper, the percentage of the {001} facets can be calculated as about 69.8% from the schematic diagram of an anatase TiO2 [29]. The elemental mapping results from Figure 4c show that main elements of oxygen, titanium, and carbon are present on the TiO2/Ti3C2Tx powders, so it corresponds to results of the XRD pattern (Figure 2).
In Figure 5, HRTEM images show the crystal relationship of TiO2 and Ti3C2Tx. Figure 5a reveals the morphology of TiO2 with a tetragonal shape, and Figure 5b shows the growth of TiO2 derived from Ti3C2Tx. In Figure 5c, the interface between TiO2 and Ti3C2Tx can be clearly demonstrated by the yellow line. From Figure 5d, the result of FFT demonstrates the existence of anatase TiO2 with crystal planes of (01-1) and (100), while it is clearly seen that the FFT result shows the presence of hexagonal Ti3C2Tx with crystal planes of (006) and (103) in Figure 5e. Figure 5f shows that the seamless connection of TiO2 and Ti3C2Tx is due to the small discordance between {103} of Ti3C2Tx and {11-1} of TiO2 [22]. These results show that TiO2 crystals are present on the crack of Ti3C2Tx sheets, indicating that the nucleation of TiO2 may exist at the defective positions of Ti3C2Tx. In addition, TiO2 at the defect sites of Ti3C2Tx may come from hydrated Ti3+ ions, which are from the titanium of Ti3C2Tx [30,31].
From Figure 6, XPS spectra of Ti2p, C1s and O1s for Ti3C2Tx, and TiO2/Ti3C2Tx are clearly observed. In Figure 6a, the Ti2p spectra are traced to Ti2p3/2 and Ti2p1/2 with four pairs and each pair separation of 5.7 eV. These peaks of Ti2p3/2 focused on 454.9, 455.8, 456.6, and 459.4 eV are attributed to Ti–C, Ti–X, TixOy, and TiO2, respectively. In addition, the intensity of TiO2 becomes strong and sharp after the hydrothermal oxidation attributed to TiO2 (Ti ions in the valence of Ti4+), while other peaks decrease, suggesting the formation of TiO2 from Ti3C2Tx. As shown in Figure 6b, the C1s is fitted with five peaks, which are located at 281.6, 282.8, 284.8, 286.2, and 288.6 eV, assigned to Ti–C, C–Ti–Oa coming from the adsorbed –OH, C–C, C–O, and C–F, respectively. Due to the appearance of heterojunctions in MXene layers, the intensity of the peak is located at 281.6 eV. The hydrothermal oxidation reduces the appearance of C–Ti–Ob, derived from the interface of TiO2 and Ti3C2Tx powders [32]. As for the O1s spectra in Figure 6c, four peaks of 529.4, 530.4, 531.8, and 533.3 eV are taken for adsorbed O, Ti–O–Ti, Ti–OH, and C–OH, separately [33]. Thus, this further verifies the presence of TiO2 transformed from Ti3C2Tx.

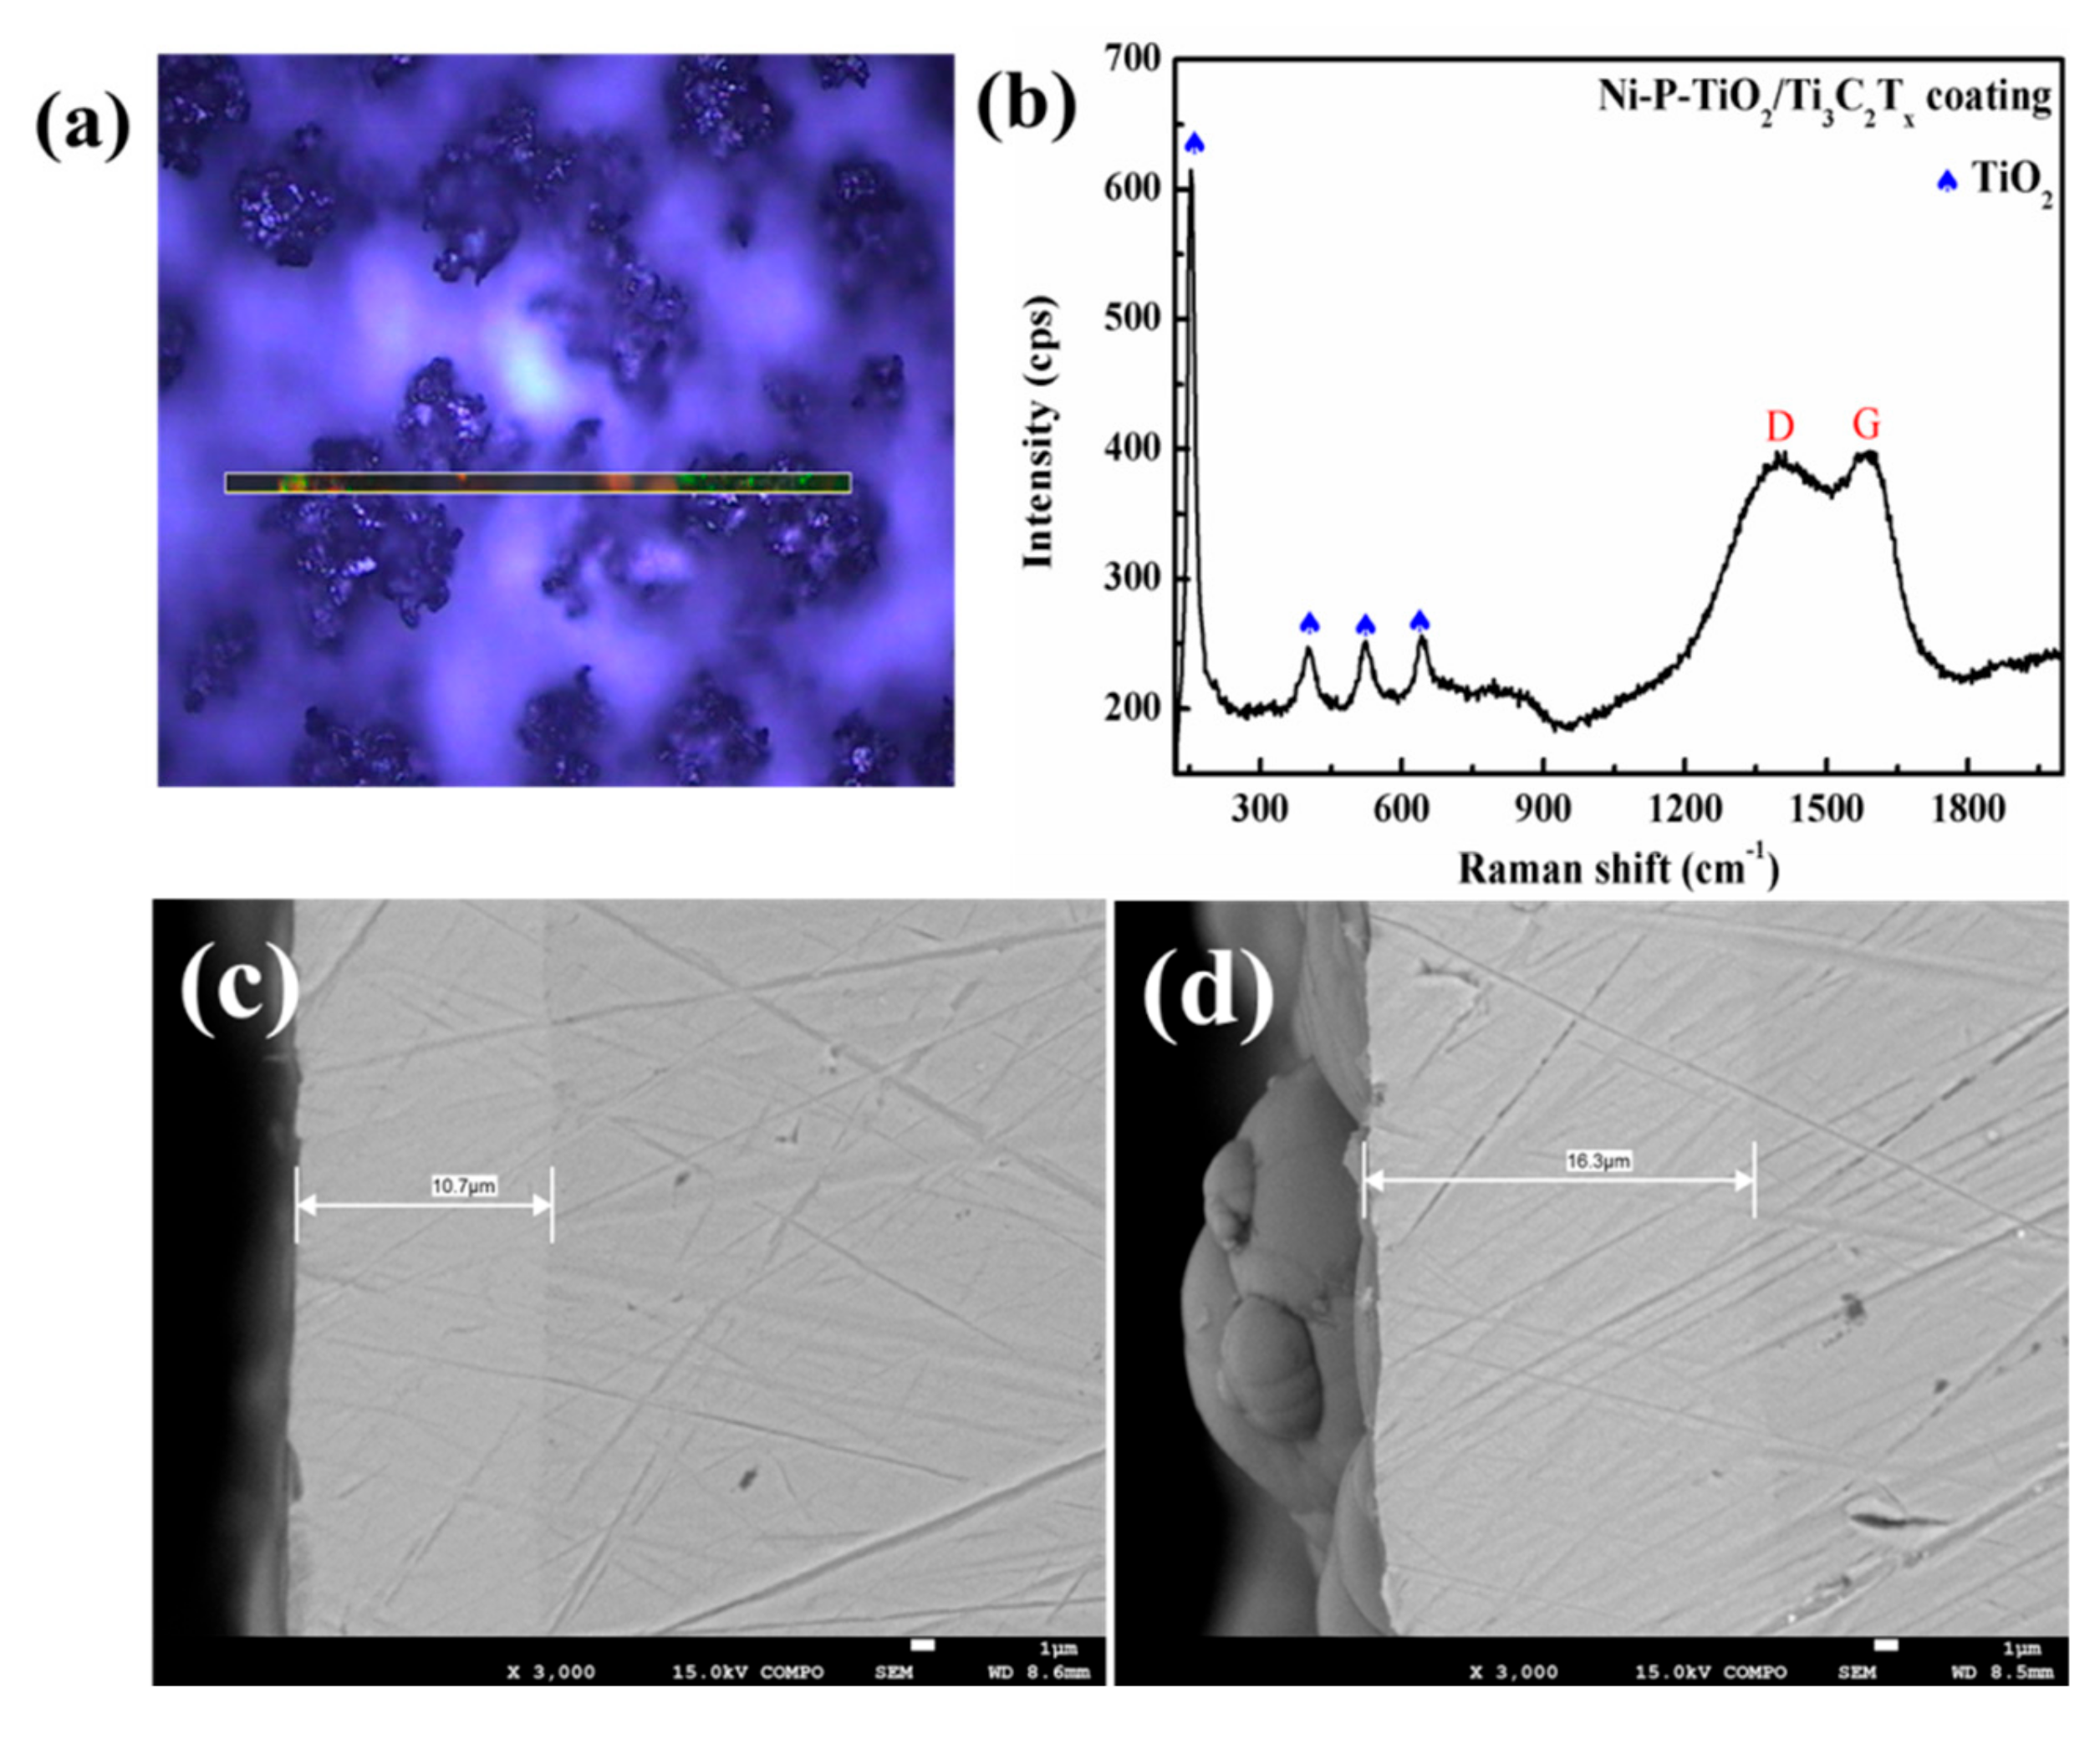
3.2. Characterization of Composite Coatings

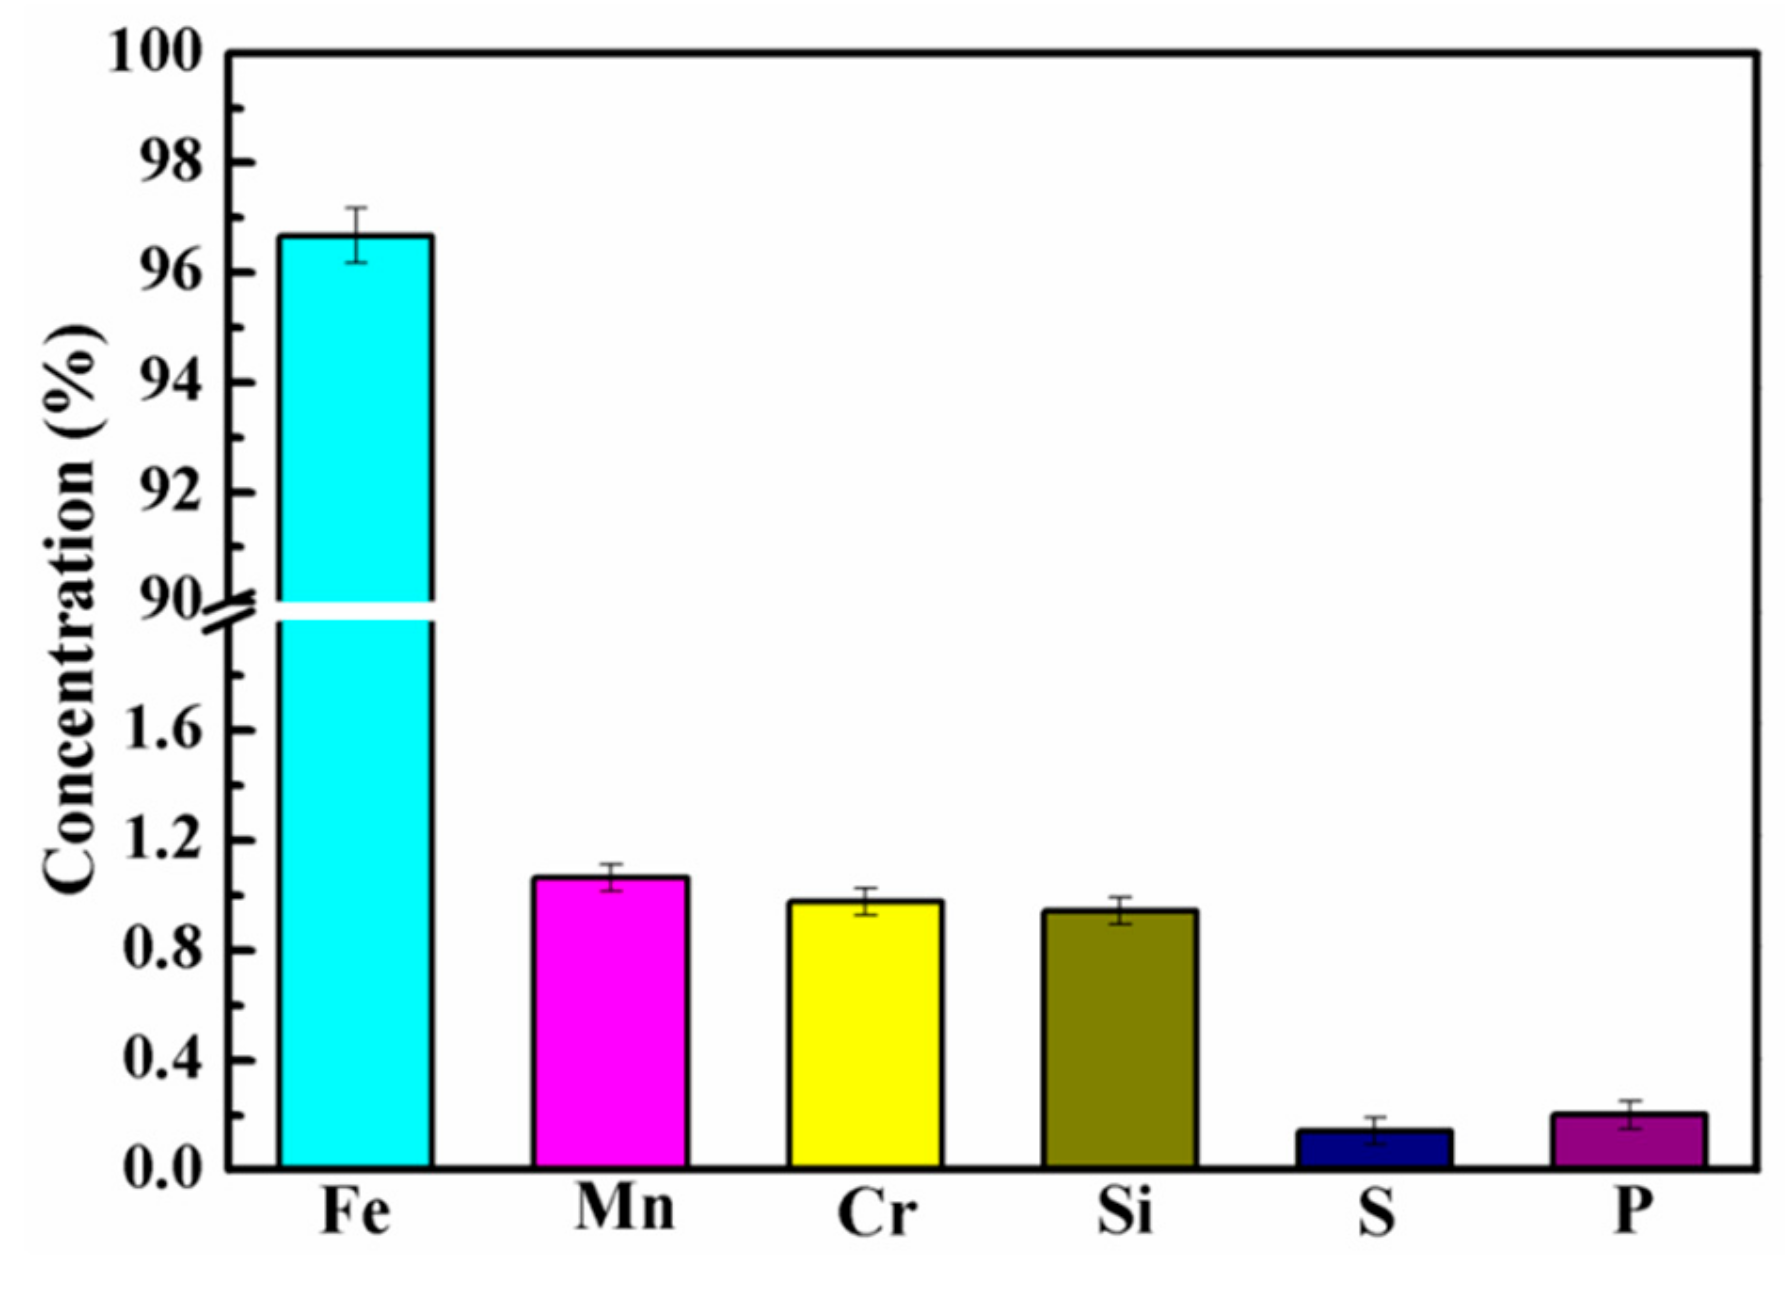
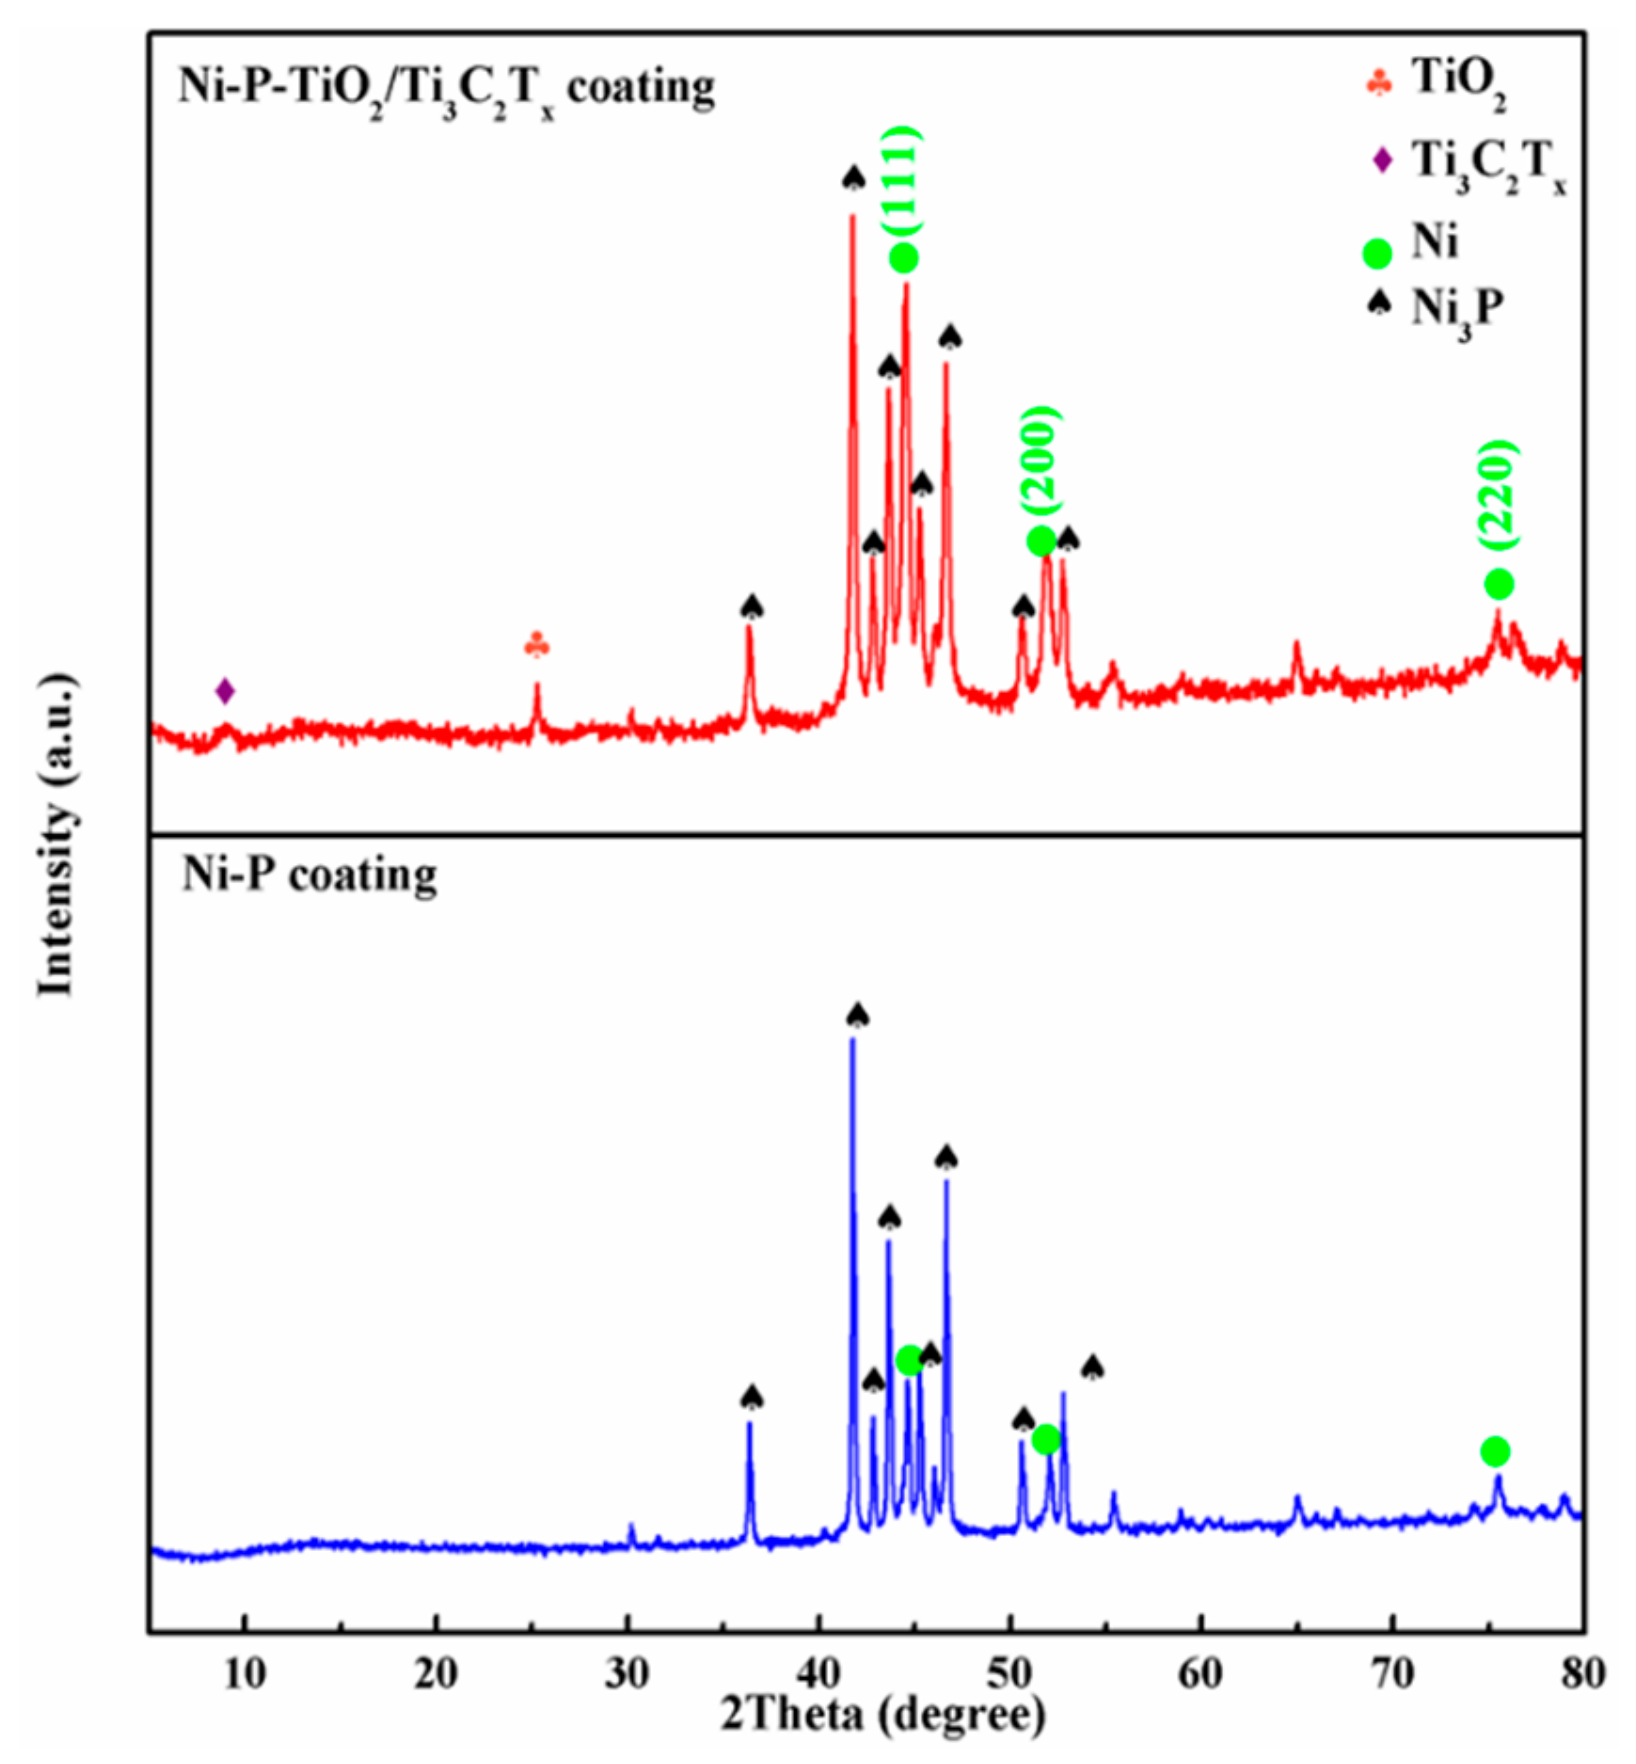
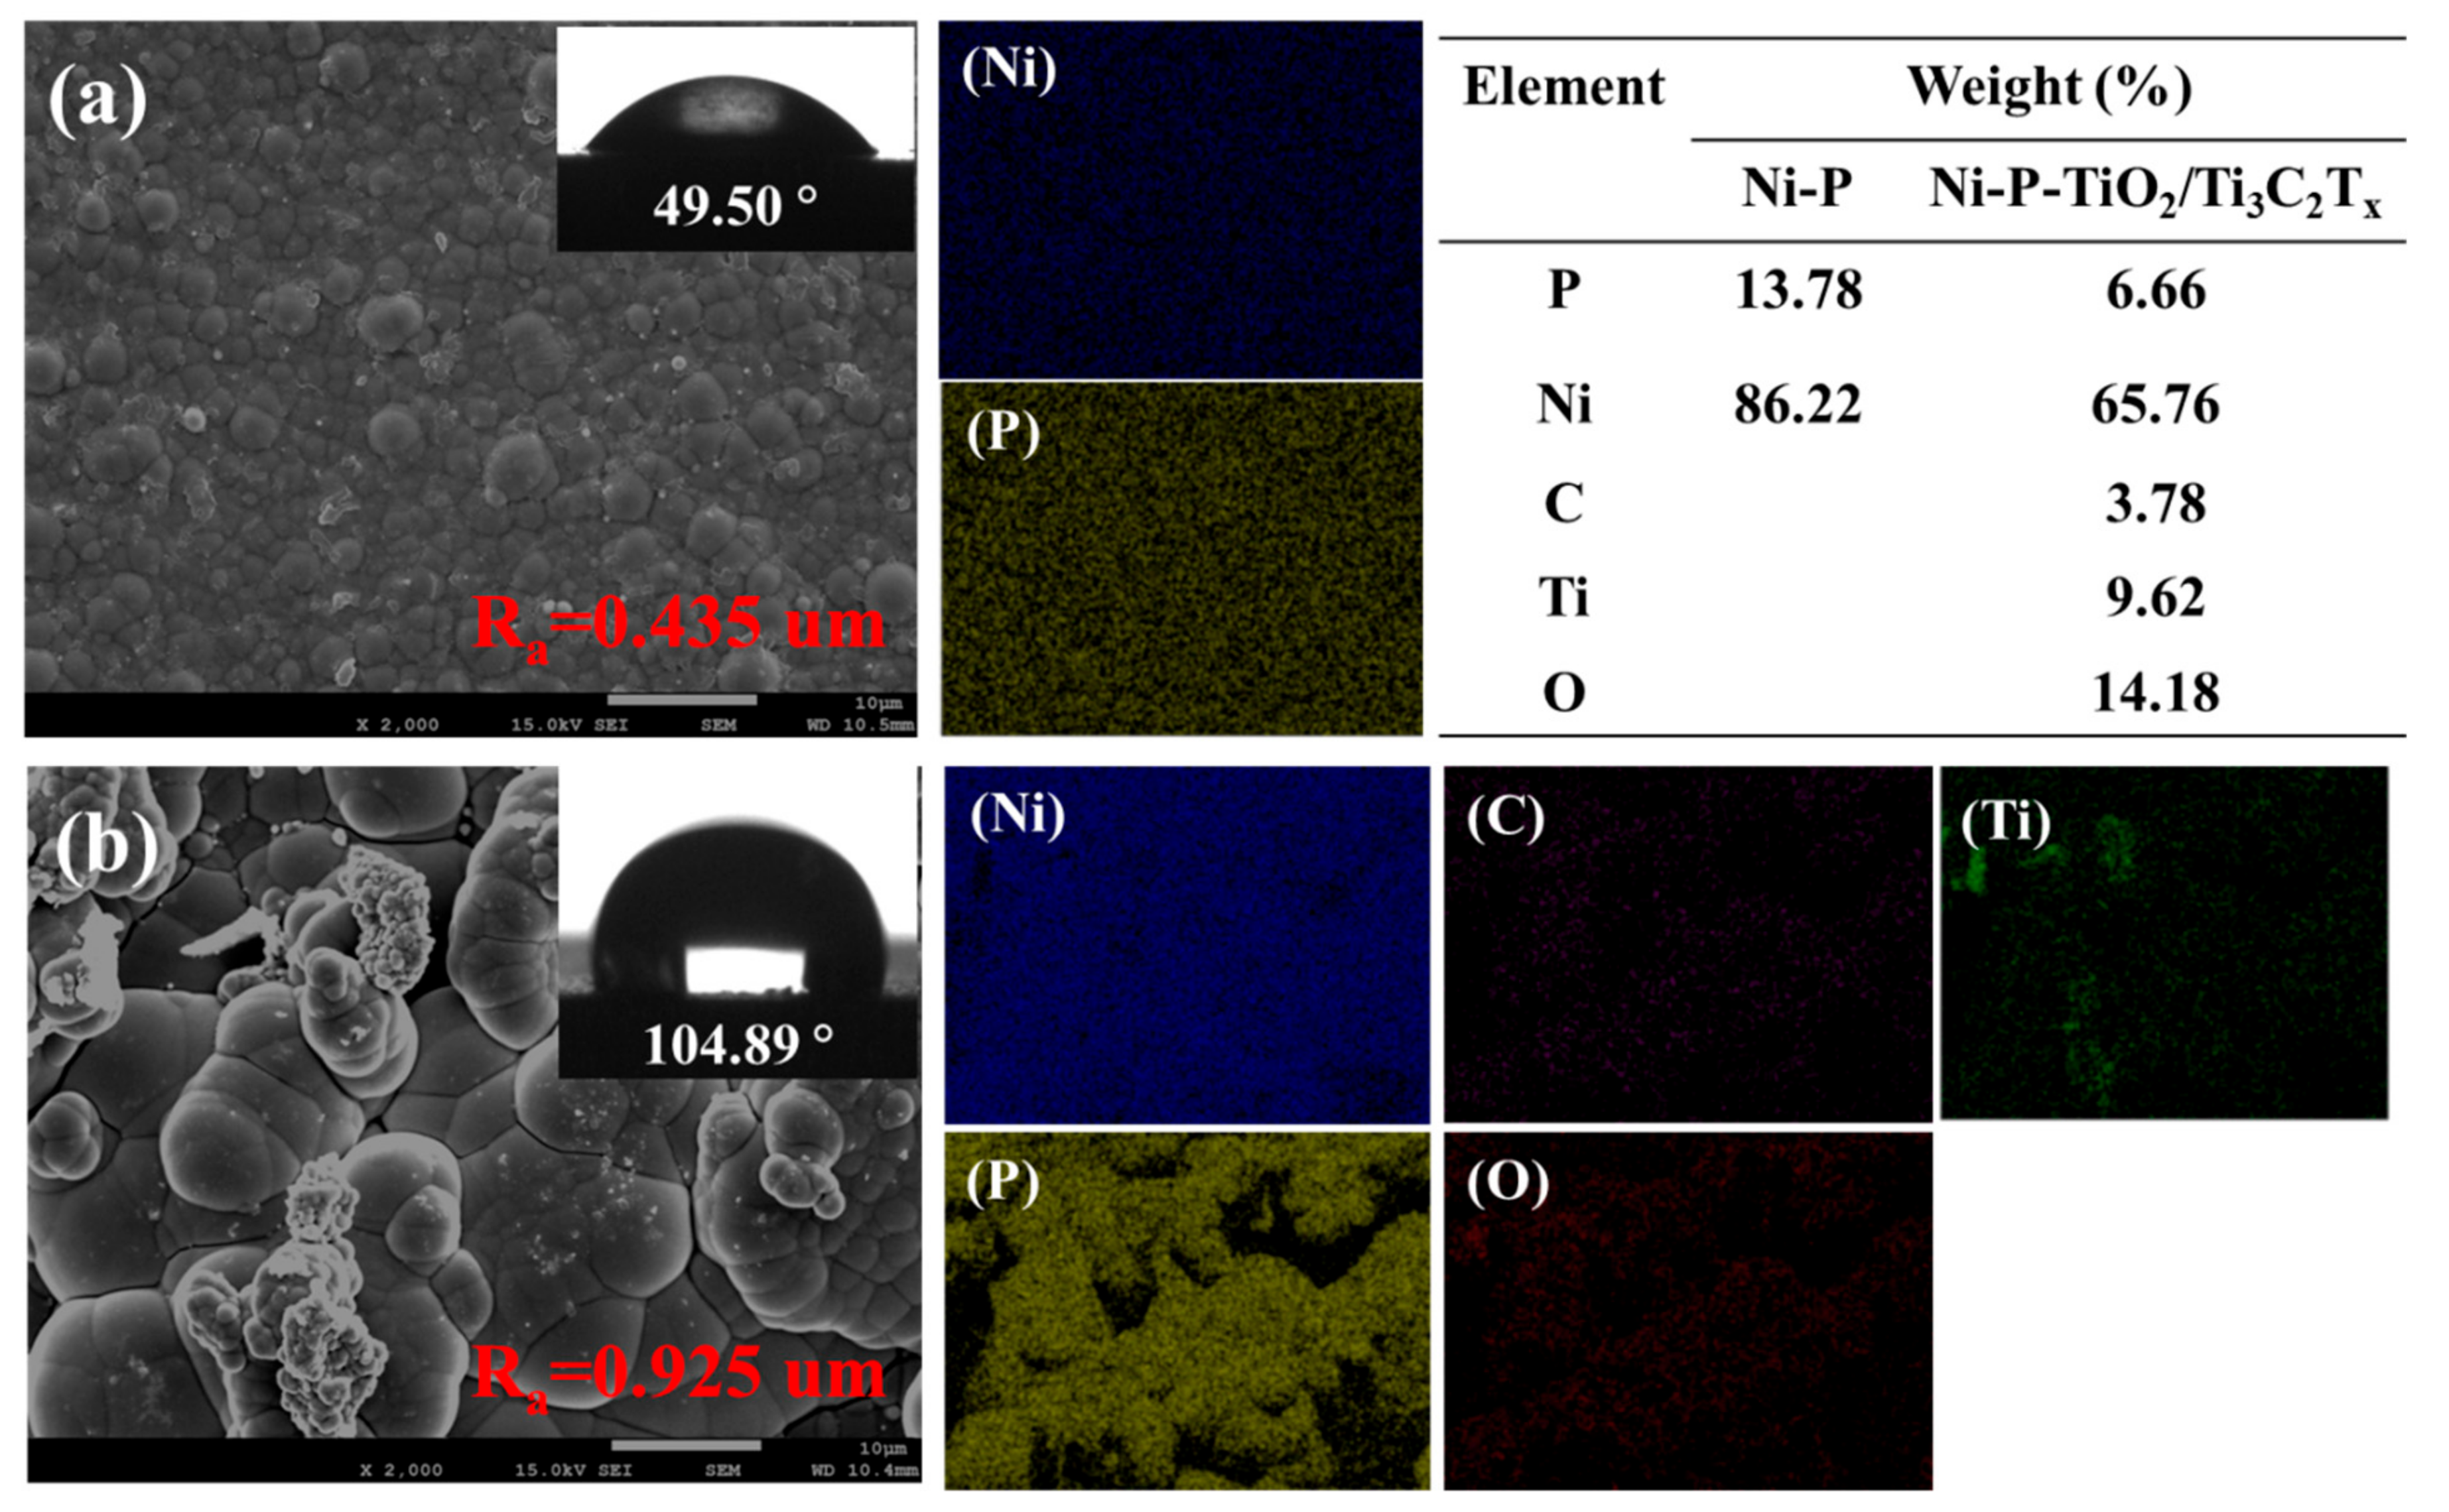
3.2.1. Compositions of Composite Coatings

XRD patterns of the Ni-P coating and the Ni–P–TiO2/Ti3C2Tx coating are shown in Figure 7. It is clear to see that TiO2 and Ti3C2Tx particles are introduced to the Ni–P–TiO2/Ti3C2Tx coating with these characteristic peaks of 8.95° and 25.292°, respectively. After the calcination, main phases of Ni and Ni3P are present in both coatings, but the peak intensity of the Ni phase increases with respect to the Ni3P phase due to the participation of TiO2/Ti3C2Tx particles. In addition, TiO2/Ti3C2Tx particles can reduce the oriented growth of Ni, which can be determined by the following equation:
T = I ( hkl ) / I 0 ( hkl ) i = 1 n I ( hkl ) / I 0 ( hkl ) × 100 %
where I(hkl) and I0(hkl) represent the diffraction intensity of the sample and the standard powder, respectively. In addition, n is the number of crystal planes, and T is the indices of crystal direction. As shown in Table 2, the indices of crystal direction for Ni phases in Ni–P–TiO2/Ti3C2Tx coatings demonstrating the T of (111) are relative high, so the oriented growth plane of Ni is (111). Thus, the addition of TiO2/Ti3C2Tx particles has a great effect on the composition of matrix coatings.
In Figure 8, a Raman spectrum of the Ni–P–TiO2/Ti3C2Tx coating is shown with the image of the diffraction area. From Figure 8a, the addition of TiO2/Ti3C2Tx makes the surface of the Ni–P–TiO2/Ti3C2Tx coating rough, so the TiO2/Ti3C2Tx particles tend to gather together on the surface. In Figure 8b, peaks of 150, 413, 520, and 634 cm−1 are derived from TiO2, which corresponds to the result of Figure 3a [24]. In addition, peaks located at 1380 and 1590 cm−1 are assigned to D-band and G-band of Ti3C2Tx particles. Thus, it further verifies that the Ni–P–TiO2/Ti3C2Tx coating is successfully prepared containing TiO2/Ti3C2Tx particles. In Figure 8c,d, cross-section SEM images show the thickness of Ni–P coatings and Ni–P–TiO2/Ti3C2Tx coatings. According to the contrast of backscattered electron imaging, the boundary between the coating and manganese steel is clear to see, so the thickness of Ni–P and Ni–P–TiO2/Ti3C2Tx coatings is about 10.7 and 16.3 um, respectively.
As shown in Figure 9, the mechanism of TiO2/Ti3C2Tx particles introduced into Ni–P deposits contains five steps. Cations and surfactants are absorbed into the TiO2/Ti3C2Tx particle to form the clouding in the bulk layer. The clouding of charged TiO2/Ti3C2Tx particles transfers to the cathode through a convection layer and diffusion layer, depending on electrophoresis in large part. The electrical double layer is close to the Ni–P composite coating, which is adsorbed and traps TiO2/Ti3C2Tx particles [6,7,8]. The formation of the Ni–P coating is an induced codeposition, so reduction of nickel can lead to the reduction of phosphorus, which is beneficial for the embedding and burial of TiO2/Ti3C2Tx particles into the Ni–P coating. Therefore, it is concluded that physical dispersion and electrophoretic migration participate in the formation of the Ni–P–TiO2/Ti3C2Tx coating [9]. After the calcination, Ni and Ni3P phases can be found, which is in accordance with these results of the XRD pattern (Figure 7) and Raman spectrum (Figure 8).

3.2.2. Wettability of Composite Coatings

Figure 10 shows SEM images of surface morphology for composite coatings and images of water drops. It is evident that the surface of Ni–P–TiO2/Ti3C2Tx coatings is much rougher than that of Ni–P coatings, owing to the participation of TiO2/Ti3C2Tx gathering on the surface. In addition, the contact angle of Ni–P–TiO2/Ti3C2Tx coatings is larger than that of Ni–P coatings, indicating that the addition of TiO2/Ti3C2Tx can lead to a change of wettability from hydrophilic to hydrophobic. It is well known that surface texture and surface energy can determine the surface wettability, which is important for the corrosion resistance of composite coatings [9]. Therefore, the gathering of TiO2/Ti3C2Tx on the surface and the surface roughness of the composite coating are synergistic actions for the change of wettability. The result of Ra is shown in the SEM image, so it is clear to see that the incorporation of TiO2/Ti3C2Tx can change the surface roughness of the Ni–P composite coating.
According to the EDS results, Ni and Ni3P phases are uniformly distributed in the Ni–P coating, while these phases are aggregated partially. In addition, TiO2/Ti3C2Tx particles are present on the surface of Ni–P–TiO2/Ti3C2Tx coatings. Compared with nickel content, the incorporation of TiO2/Ti3C2Tx can decrease the relative content of phosphorus for Ni–P–TiO2/Ti3C2Tx coatings, which is likely to grow more active sites for nickel due to the existence of TiO2/Ti3C2Tx [19].

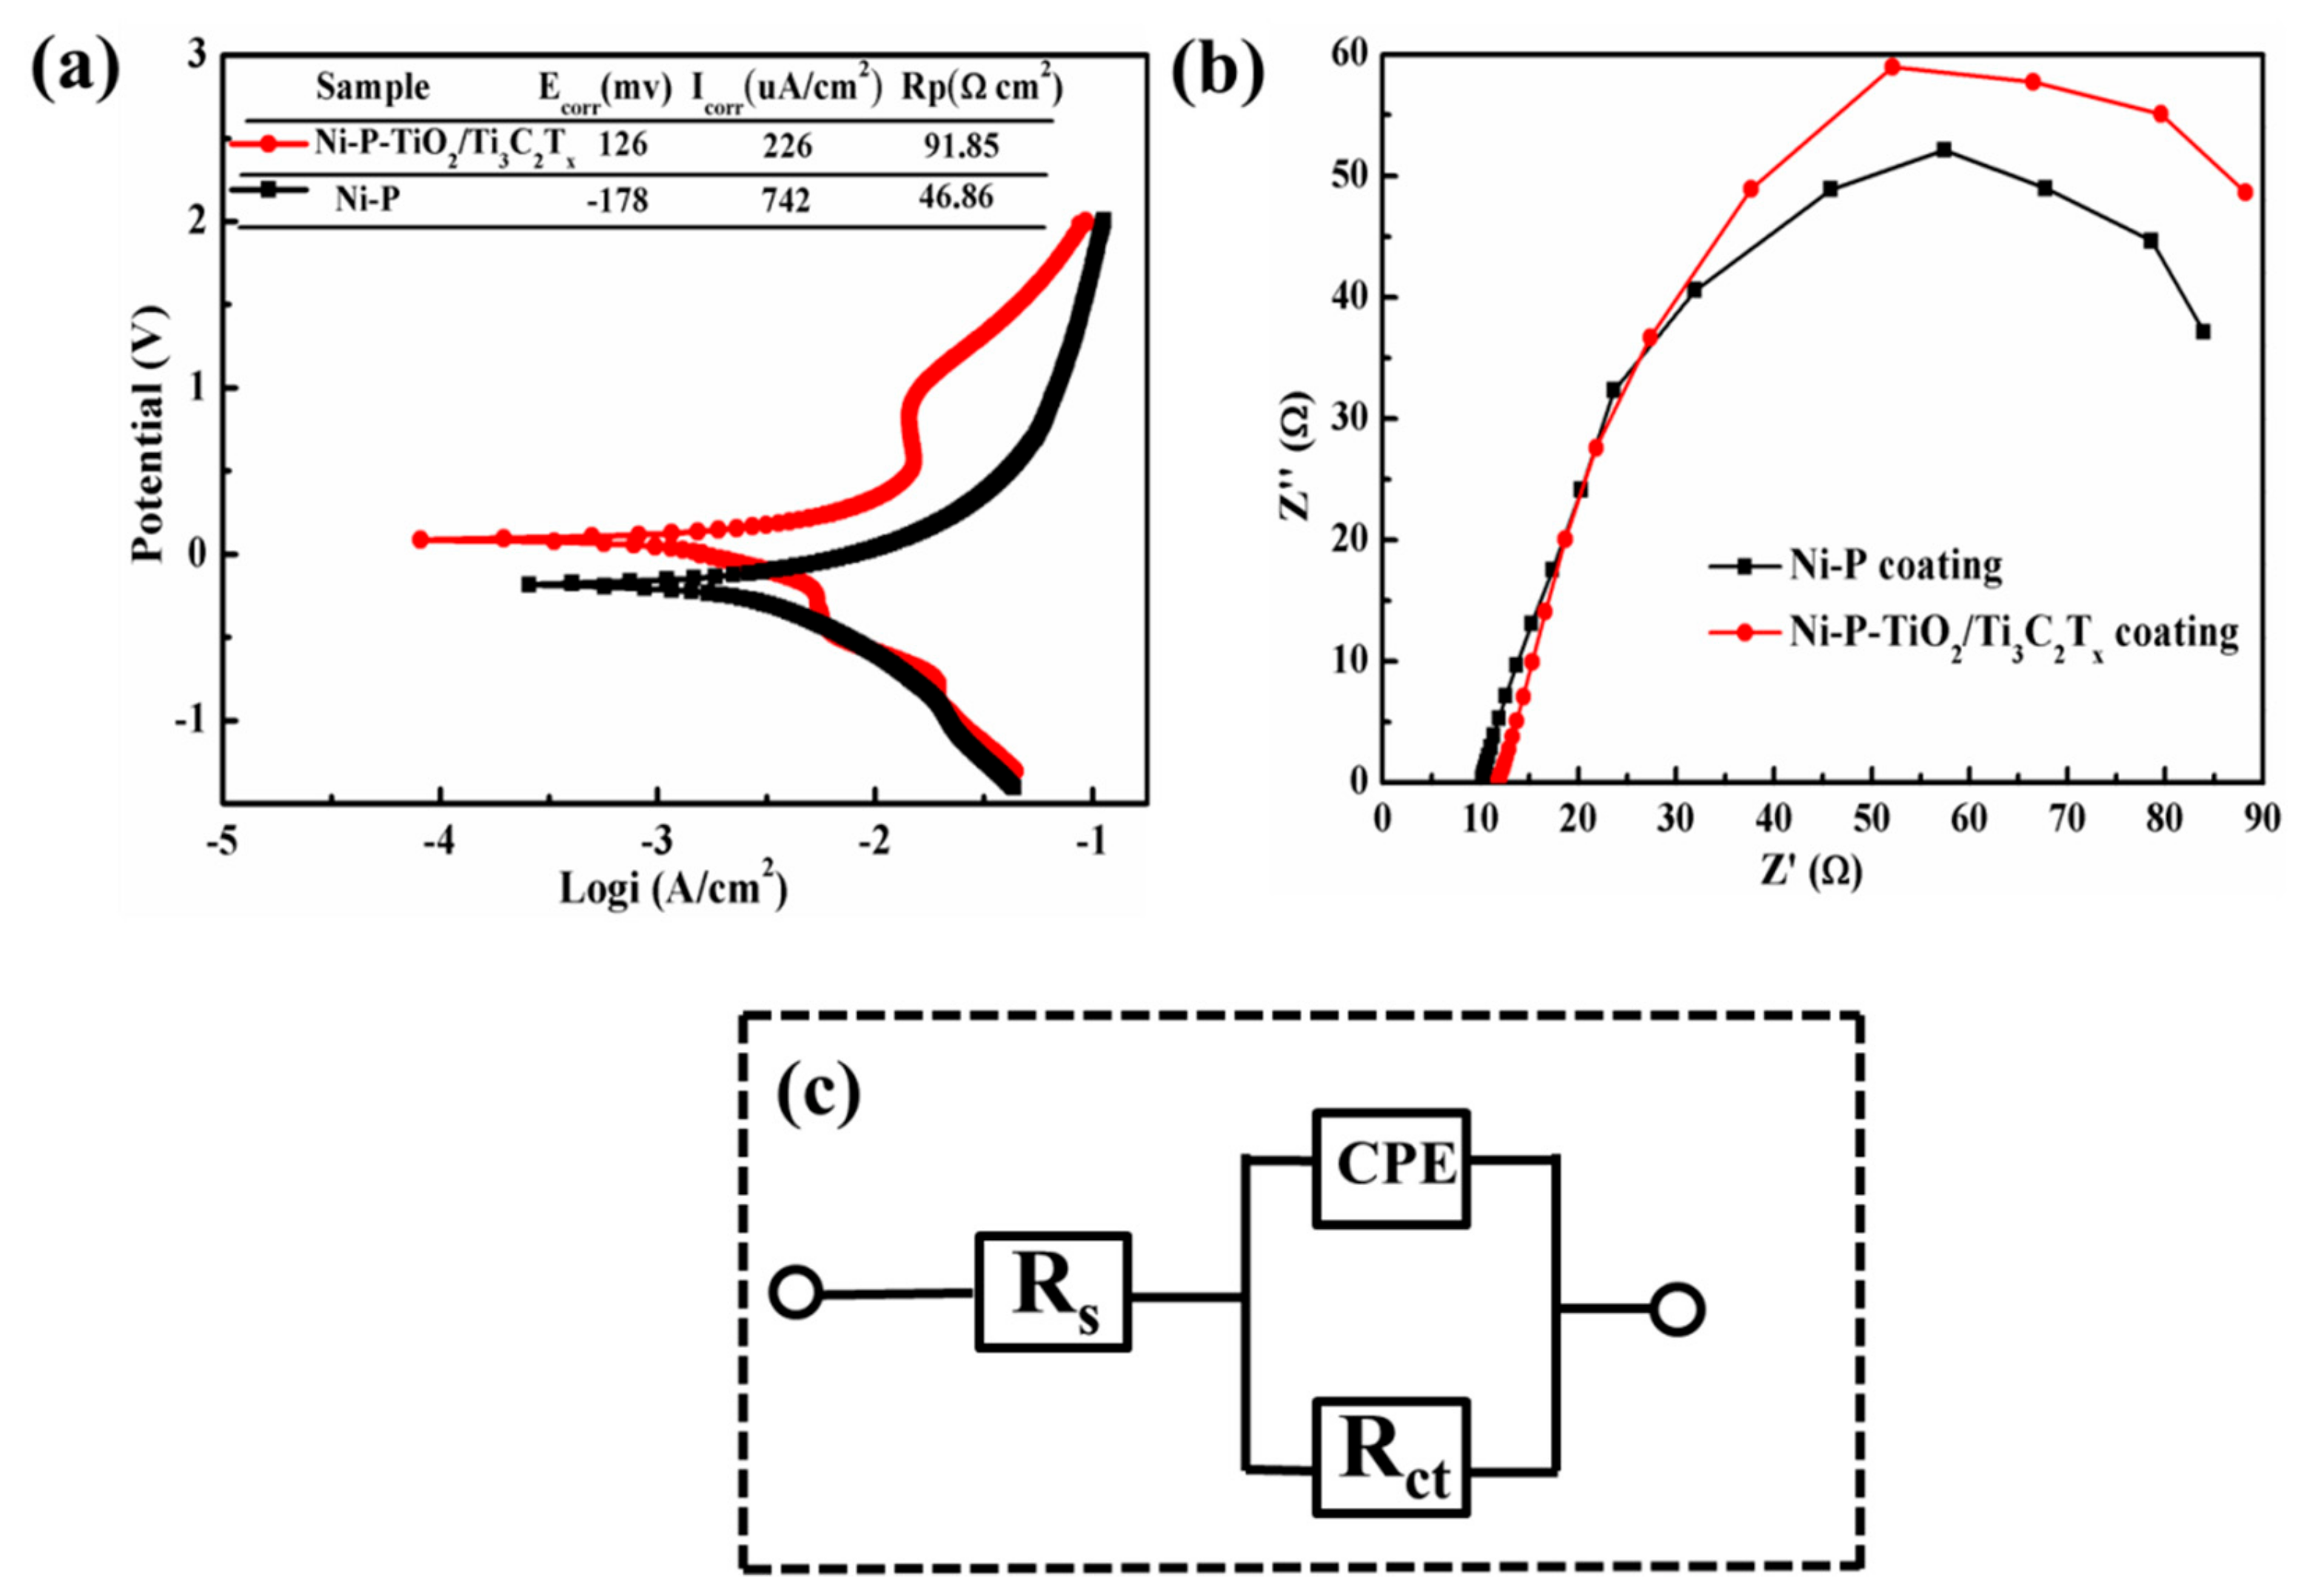
3.2.3. Corrosion Behavior of Composite Coatings

It is shown in Figure 11 that the electrochemical measurement is conducted at room temperature. In Figure 11a, Tafel polarization curves are processed by the Tafel extrapolation method, which can obtain the data of corrosion potential (Ecorr), corrosion current (icorr), and polarization resistance (Rp). It is obvious that the corrosion current decreases and the corrosion potential transforms to positive potential of the Ni–P coating with the addition of TiO2/Ti3C2Tx. In addition, the polarization resistance (Rp) of the Ni–P–TiO2/Ti3C2Tx coating is higher than that of the Ni–P coating, confirming the improvement of corrosion protection for the Ni–P–TiO2/Ti3C2Tx coating. As previous papers indicated, TiO2/Ti3C2Tx can hinder the initiation and defect corrosion by regulating and controlling the microstructure of the composite coating [2]. Furthermore, TiO2/Ti3C2Tx in the Ni–P coating can form corrosion microcells, which serve as the cathode, so it promotes the anode polarization [34,35,36]. In addition, the passive layer can be seen in the polarization curve of Ni–P–TiO2/Ti3C2Tx coatings, which is good for the corrosion prevention, owing to the gathering of the TiO2/Ti3C2Tx on the surface and microstructure of the surface.
Nyquist impedance diagrams of Ni–P and Ni–P–TiO2/Ti3C2Tx coatings are shown in Figure 11b with the fitting equivalent circle model in Figure 11c, with the average error of 3.5%, which is investigated in the frequency range of 10−1 to 105. From the result of Figure 11b, it is evident that the electrochemical corrosion is mainly controlled by the diffusion process. In Figure 11c, the equivalent circuit shows the corrosion processes at the electrolyte/coatings interface. Rs stands for the solution resistance, while Rct–CPE represents the charge transfer reaction, which is inversely proportional to the corrosion rate. In addition, CPE is a constant phase for a more accurate fit instead of a pure double layer capacitor. Rct stands for the charge transfer resistance, so it is a measure of electron transfer across the surface. Due to the formation of nickel oxyspecies and the attack of Cl, a charge transfer resistor (Rct) is employed to stimulate these reactions [37,38]. In Table 3, these fitting resistances of the equivalent-circuit elements contain Rs and Rct. The value of Rct is inversely proportional to corrosion rate. High Rct of the Ni–P–TiO2/Ti3C2Tx coating indicates a large corrosion resistance. From these results, it is evident that the addition of TiO2/Ti3C2Tx can improve wear resistance of the Ni–P coating and decrease the corrosion rate, so it can be concluded that the participation of TiO2/Ti3C2Tx can enhance the property of corrosion prevention.

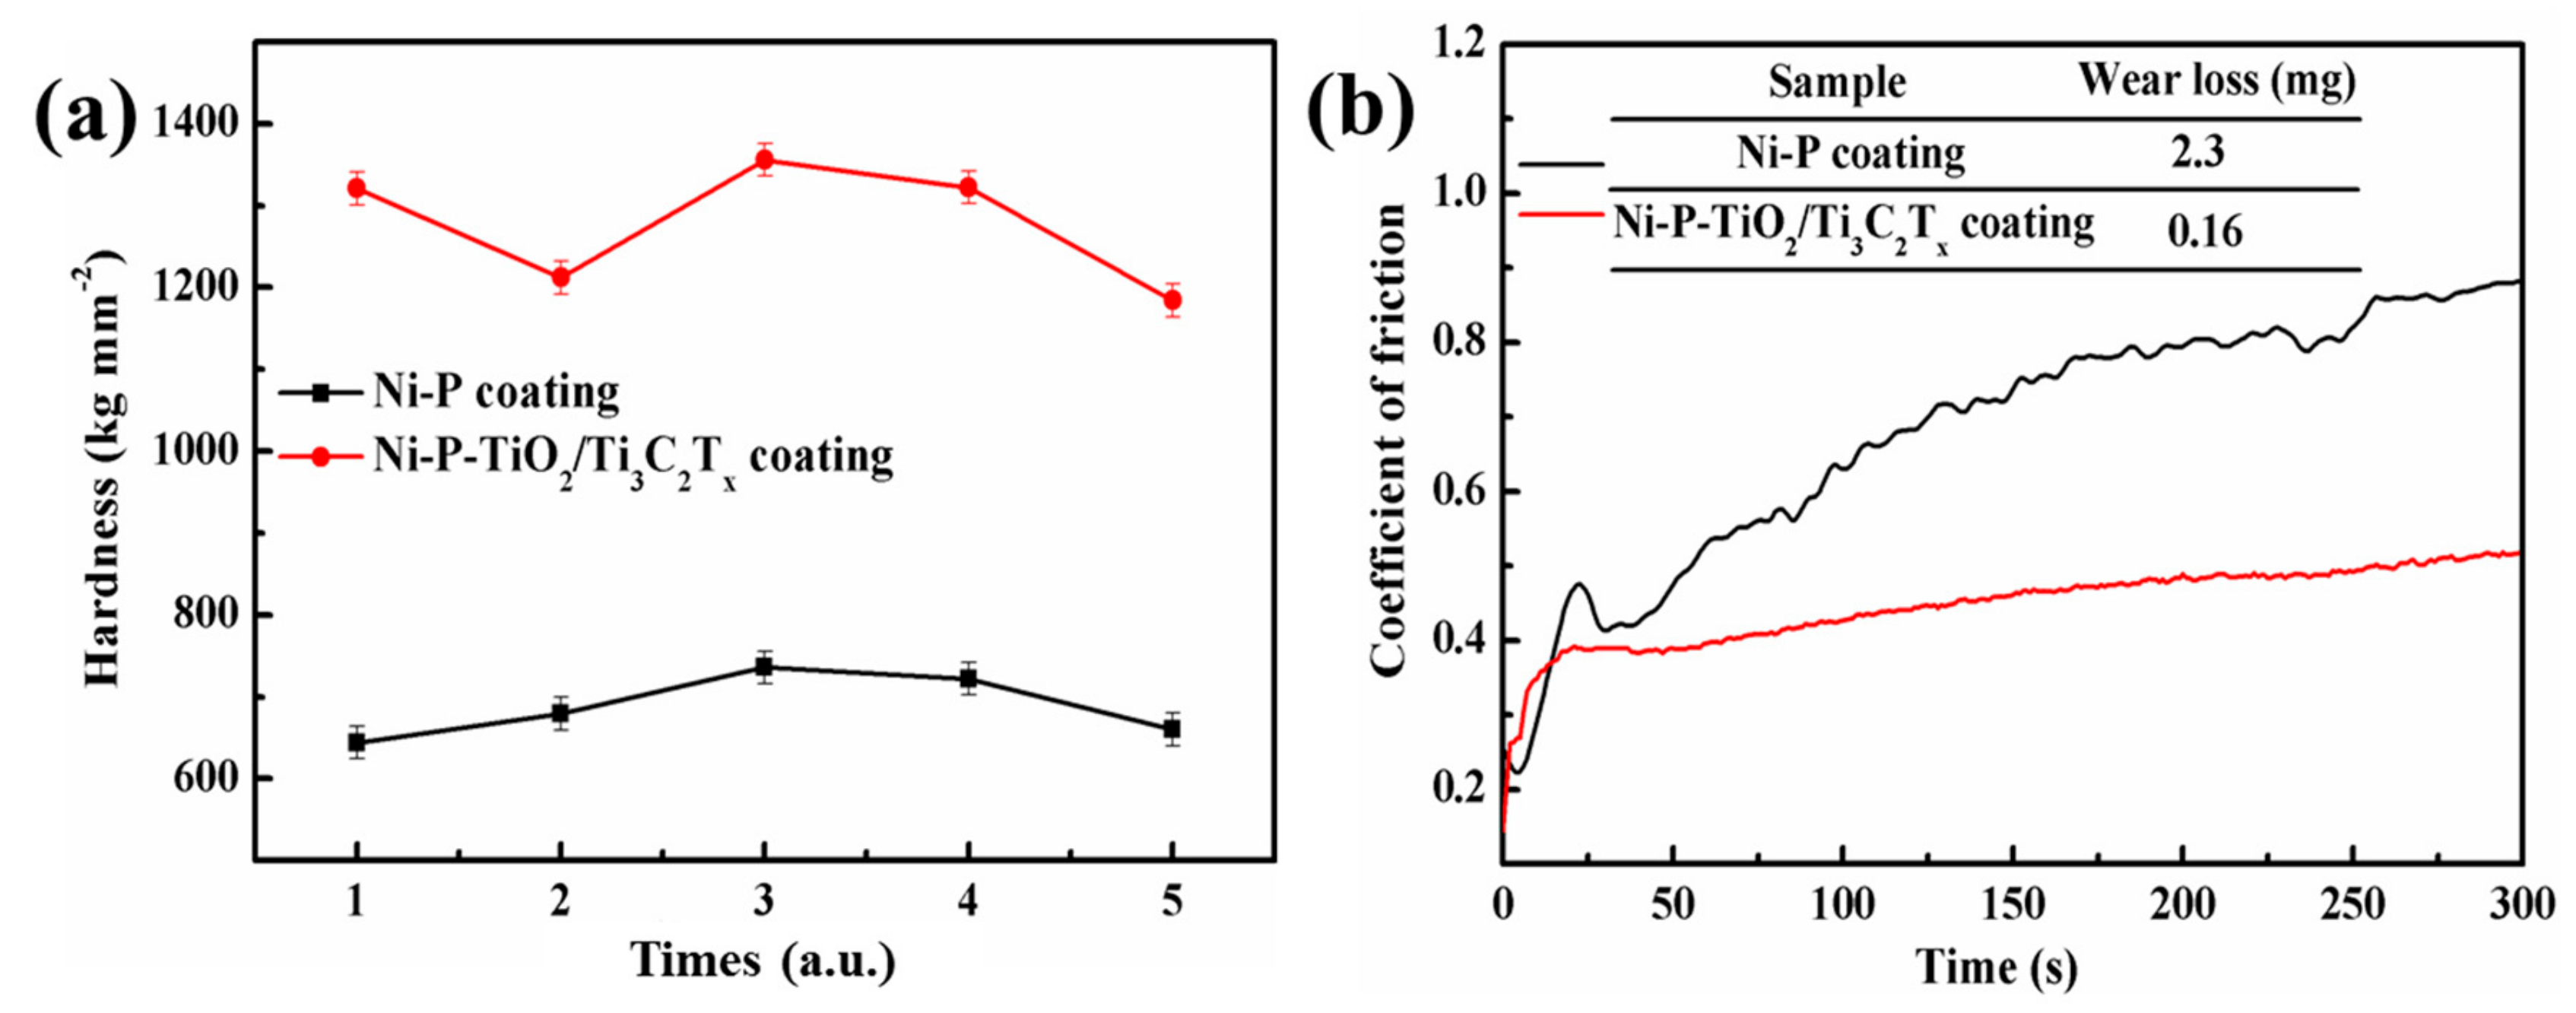
3.2.4. Wear Behavior of Composite Coatings

From Figure 12, hardness and wear tests were conducted at room temperature. In Figure 12a, the fluctuation of the microhardness belonging to the Ni–P–TiO2/Ti3C2Tx coating is much larger than that of the Ni–P coating, highlighting the uneven surface of the Ni–P–TiO2/Ti3C2Tx composite coating with a high Ra for the gathering of TiO2/Ti3C2Tx particles on the surface of Ni–P composite coatings. In addition, the microhardness of the Ni–P coating is about 680 kg·mm−2, while that of the Ni–P–TiO2/Ti3C2Tx coating is approximately 1350 kg·mm−2, which is due to the dispersion strengthening and increasing grain boundaries hindering dislocation mobility [39,40]. Thus, the addition of TiO2/Ti3C2Tx can enhance the action of dispersion strengthening and augment grain boundaries of these composite coatings, which is beneficial for the improvement of microhardness for the composite coating.
In Figure 12b, results of the wear test are carried out under the condition of dry-grinding, accompanied with a load of 2 N, duration time of 300 s, and circle radius of 1 cm. These composite coatings and the smooth silicon nitride are taken as the stationary disk and the grinding material, respectively. The average coefficient of friction for the Ni–P coating is 0.70 after wear tests, while the average coefficient of friction for the Ni–P–TiO2/Ti3C2Tx coating is down to 0.40 with the participation of TiO2/Ti3C2Tx. In addition, the table inserted in Figure 12b illustrates the wear loss after sliding tests, showing that the wear loss of Ni–P coatings and Ni–P–TiO2/Ti3C2Tx coatings is about 2.3 mg and 0.16 mg, respectively. As previous papers have shown, high microhardness and a low coefficient of friction can simultaneously decrease the wear loss of the Ni–P–TiO2/Ti3C2Tx coating [41]. Therefore, the addition of TiO2/Ti3C2Tx to the Ni–P coating can improve the tribological property of this coating.

4. Conclusions

In this work, in situ grown nanoparticles TiO2 on Ti3C2Tx sheets were prepared by a simple hydrothermal method. Taking the excellent property of TiO2 and Ti3C2Tx into consideration, TiO2/Ti3C2Tx was incorporated into the Ni–P composite coatings, which were prepared by an electroplating technique, which is little reported in this area. The following conclusions could be obtained from this study:
  • The in situ grown nanocrystals TiO2 on Ti3C2Tx sheets can still maintain a layered structure. The Ni–P–TiO2/Ti3C2Tx coating is successfully prepared by an electroplating technique;
  • The participation of TiO2/Ti3C2Tx can change the wettability of Ni–P composite coatings from hydrophilic to hydrophobic;
  • The Ni–P–TiO2/Ti3C2Tx coating shows better properties of corrosion prevention than Ni–P coatings.
  • Microhardness of the Ni–P–TiO2/Ti3C2Tx coating is approximately 1350 kg mm−2, and the coefficient of friction of Ni–P–TiO2/Ti3C2Tx coatings is about 0.40, which is lower than that of the Ni–P coating.

Author Contributions

Conceptualization, Y.D., D.M., and S.Y.; Formal analysis, Y.D.; Funding acquisition, D.M. and S.Y.; Investigation, Y.D., X.Z., B.Y., and L.W.; Methodology, Y.D., X.Z., and L.W.; Supervision, D.M., Y.D., and S.Y.; Validation, Y.D. and D.M.; Writing—original draft, Y.D.; Writing—review and editing, Y.D. and S.Y.

Funding

We are thankful for the “Strategic Priority Research Program” of the Chinese Academy of Sciences (grant number XDA09040102) and National Key R and D Program of China (grant number 2016YFC0801500) for supporting this work.

Conflicts of Interest

The authors declare no conflict of interest.

References

  1. Subramanian, C.; Cavallaro, G.; Winkelman, G. Wear maps for titanium nitride coatings deposited on copper and brass with electroless nickel interlayers. Wear 2000, 241, 228–233. [Google Scholar] [CrossRef]
  2. Baghery, P.; Farzam, M.; Mousavi, A.B.; Hosseini, M. Ni-TiO2 nanocomposite coating with high resistance to corrosion and wear. Surf. Coat. Technol. 2010, 204, 3804–3810. [Google Scholar] [CrossRef]
  3. Zhou, Y.; Zhang, H.; Qian, B. Friction and wear properties of the co-deposited Ni-SiC nanocomposite coating. J. Appl. Surf. Sci. 2007, 253, 8335–8339. [Google Scholar] [CrossRef]
  4. Hou, K.H.; Ger, M.D.; Wang, L.M.; Ke, S.T. The wear behaviour of electro-codeposited Ni-SiC composites. Wear 2002, 253, 994–1003. [Google Scholar] [CrossRef]
  5. Matthews, A. Advanced Surface Coatings: A Handbook of Surface Engineering; Rickerby, D., Ed.; Springer: Heidelberg/Berlin, Germany, 1991; Volume 1. [Google Scholar]
  6. Walsh, F.C.; Ponce de León, C. A review of the electrodeposition of metal matrix composite coatings by inclusion of particles in a metal layer: An established and diversifying coatings technology. T.I. Met. Finish. 2014, 92, 83–98. [Google Scholar] [CrossRef]
  7. Wang, S.C.; Zhou, N.; Walsh, F.C. Diverse electrodeposits from modified acid sulphate (watts nickel) baths. T.I. Met. Finish. 2016, 94, 274–282. [Google Scholar] [CrossRef]
  8. Zhao, G.C.; Xue, Y.; Huang, Y.; Ye, Y.; Walsh, F.C.; Chen, J.; Wang, S. One-Step electrodeposition of a self-cleaning and corrosion resistant Ni/WS2 super hydrophobic surface. RSC Adv. 2016, 6, 59104–59112. [Google Scholar] [CrossRef]
  9. He, Y.; Sun, W.T.; Wang, S.C.; Chiu, Y.L.; Reed, P.A.S.; Walsh, F.C. An electrodeposited Ni-P-WS2 coating with combined super-hydrophobicity and self-lubricating properties. Electrochim. Acta 2017, 245, 872–882. [Google Scholar] [CrossRef]
  10. Cheong, W.J.; Luan, B.L.; Shoesmeith, D.W. The effect of stabilizers on the bath stability of electroless Ni deposition and the deposit. Appl. Surf. Sci. 2004, 22, 282–300. [Google Scholar] [CrossRef]
  11. Zhang, J.Y.; Xiong, D.S. Study on preparation and tribology behaviors of Ni-P electroless deposited nanocrystalline coating. Adv. Mater. Res. 2013, 706, 279–283. [Google Scholar] [CrossRef]
  12. Ebn Touhami, M.; Cherkaoui, M.; Chassaing, E. Modelisation of Ni-P electroless deposition in ammonical solutions. Electrochim. Acta 2003, 48, 3651–3658. [Google Scholar] [CrossRef]
  13. Antropov, L.I.; Lebedinskii, Y.N. Composite Electrochemical Coatings and Materials; Tekhnika: Kiev, Ukraine, 1986. (In Russian) [Google Scholar]
  14. Wörle, M.; Krumeich, F.; Bieri, F.; Muhr, H.J.; Nesper, R. Flexible V7O16 layers as common structural element of vanadium oxide nanotubes and a new crystalline vanadate. Z. Anorg. Allg. Chem. 2002, 62, 2778–2784. [Google Scholar] [CrossRef]
  15. Volkov, S.V.; Koval’chuk, E.P.; Ohenko, V.M.; Reshetnyak, O.V. Nanochemistry, Nanosystems, and Nanomaterials: A Monograph; Naukova Dumka: Kiev, Ukraine, 2008. (In Ukrainia) [Google Scholar]
  16. Gadhari, P.; Sahoo, P. Effect of annealing temperature and alumina particles on mechanical and tribological properties of Ni-P-Al2O3 composite coatings. Silicon 2017, 9, 761–774. [Google Scholar]
  17. Hou, K.-H.; Hwu, W.-H.; Ke, S.-T.; Ger, M.D. Ni-P-SiC composite produced by pulse and direct current plating. Mater. Chem. Phys. 2006, 100, 54–59. [Google Scholar]
  18. Naguib, M.; Kurtoglu, M.; Presser, V.; Lu, J.; Niu, J.J.; Heon, M.; Hultman, L.; Gogotsi, Y.; Barsoum, M.W. Two-Dimensional nanocrystals produced by exfoliation of Ti3AlC2. Adv. Mater. 2011, 23, 4248–4253. [Google Scholar] [CrossRef] [PubMed]
  19. Du, Y.C.; Wang, D.D.; Si, P.C.; Wei, L.Q.; Wang, Y.L.; Yu, B.; Zhang, X.M.; Ye, S.F. Electrodeposition of a Ni-P-Ti3C2Tx/MoS2 coating incorporating MoS2 intercalated Ti3C2Tx particles. Surf. Coat. Technol. 2018, 354, 119–125. [Google Scholar] [CrossRef]
  20. Uttam, V.; Duchaniya, R.K. Potentiodynamic studies of Ni-P-TiO2 nano-composited coating on the mild steel deposited by electroless plating method. AIP Conf. Proc. 2016, 1725, 020053. [Google Scholar]
  21. Xu, Y.J.; Wang, S.; Yang, J.; Han, B.; Nie, R.; Wang, J.X.; Wang, J.G.; Jing, H.W. In-Situ grown nanocrystal TiO2 on 2D Ti3C2 nanosheets for artificial photosynthesis of chemical fuels. Nano Energy 2018, 51, 442–450. [Google Scholar] [CrossRef]
  22. Peng, C.; Yang, X.F.; Li, Y.H.; Yu, H.; Wang, H.J.; Peng, F. Hybrids of two-dimensional Ti3C2 and TiO2 exposing {001} facets toward enhanced photocatalytic activity. ACS Appl. Mater. Interfaces 2016, 8, 6051–6060. [Google Scholar] [CrossRef] [PubMed]
  23. Zheng, M.; Guo, R.S.; Liu, Z.C.; Wang, B.Y.; Meng, L.C.; Li, F.Y.; Li, T.T.; Luo, Y.N. MoS2 intercalated p-Ti3C2 anode materials with sandwich-like three dimensional conductive networks for lithium-ion batteries. J. Alloys Compd. 2018, 735, 1262–1270. [Google Scholar] [CrossRef]
  24. Naguib, M.; Presser, V.; Tallman, D.; Lu, J.; Hultman, L.; Gogotsi, Y.; Barsoum, M.W. On the topotactic transformation of Ti2AlC into a Ti-C-O-F cubic phase by heating in molten lithium fluoride in air. J. Am. Ceram. Soc. 2011, 94, 4556–4561. [Google Scholar] [CrossRef]
  25. Naguib, M.; Mashtalir, O.; Carle, J.; Presser, V.; Lu, J.; Hultman, L.; Gogotsi, Y.; Barsoum, M.W. Two-dimensional transition metal carbides. ACS Nano 2012, 6, 1322–1331. [Google Scholar] [CrossRef] [PubMed]
  26. Bricchi, B.R.; Ghidelli, M.; Mascaretti, L.; Zapelli, A.; Russo, V.; Casari, C.S.; Terraneo, G.; Alessandri, I.; Ducati, C.; Bassi, A.L. Integration of plasmonic Au nanoparticles in TiO2 hierarchical structures in a single-step pulsed laser co-deposition. Mat. Des. 2018, 156, 311–319. [Google Scholar]
  27. Xue, M.Q.; Wang, Z.Q.; Yuan, F.; Zhang, X.H.; Wei, W.; Tang, H.; Li, C.S. Preparation of TiO2/Ti3C2Tx hybrid nanocomposites and their tribological properties as base oil lubricant additives. RSC Adv. 2017, 7, 4312–4319. [Google Scholar] [CrossRef]
  28. Yang, H.G.; Sun, C.H.; Qiao, S.Z.; Zou, J.; Liu, G.; Smith, S.C.; Cheng, H.M.; Lu, G.Q. Anatase TiO2 single crystals with a large percentage of reactive facets. Nature 2008, 453, 638–641. [Google Scholar] [CrossRef] [PubMed]
  29. Zhang, J.; Xi, J.; Ji, Z. Mo+N codoped TiO2 sheets with dominant {001} facets for enhancing visible-light photocatalytic activity. J. Mater. Chem. 2012, 22, 17700–17708. [Google Scholar] [CrossRef]
  30. Yang, X.; Zhuang, J.; Li, X.; Chen, D.; Ouyang, G.; Mao, Z.; Han, Y.; He, Z.; Liang, C.; Wu, M.; et al. Hierarchically nanostructured rutile arrays: Acid vapor oxidation growth and tunable morphologies. ACS Nano 2009, 3, 1212–1218. [Google Scholar] [CrossRef] [PubMed]
  31. Lai, Z.; Peng, F.; Wang, Y.; Wang, H.; Yu, H.; Liu, P.; Zhao, H. Low temperature solvothermal synthesis of anatase TiO2 single crystals with wholly {100} and {001} faceted surfaces. J. Mater. Chem. 2012, 22, 23906–23912. [Google Scholar] [CrossRef]
  32. Rakhi, R.B.; Ahmed, B.; Hedhili, M.N.; Anjum, D.H.; Alshareef, H.N. Effect of postetch annealing gas composition on the structural and electrochemical properties of Ti3C2Tx MXene electrodes for super capacitor applications. Chem. Mater. 2015, 27, 5314–5323. [Google Scholar] [CrossRef]
  33. Li, B.; Zhao, Z.; Gao, F.; Wang, X.; Qiu, J. Mesoporous microspheres composed of carbon-coated TiO2 nanocrystals with exposed {001} facets for improved visible light photocatalytic activity. Appl. Catal. B 2014, 147, 958–964. [Google Scholar] [CrossRef]
  34. Abdel Aal, A. Hard and corrosion resistant nanocomposite coating for Al alloy. J. Mater. Sci. Eng. A 2008, 474, 181–187. [Google Scholar] [CrossRef]
  35. Chen, X.H.; Chen, C.S.; Xiao, H.N.; Cheng, F.Q.; Zhang, G.; Yi, G.J. Corrosion behavior of carbon nanotubes-Ni composite coating. Surf. Coat. Technol. 2005, 191, 351–356. [Google Scholar] [CrossRef]
  36. Abdel-Gabar, A.M.; Abd-El-Nabey, B.A.; Sidahmed, I.M.; El-Zayady, A.M.; Saadawy, M. Inhibitive action of some plant extracts on the corrosion of steel in acidic media. J. Corros. Sci. 2006, 48, 2765–2779. [Google Scholar] [CrossRef]
  37. Wang, L.; Zhang, J.; Gao, Y.; Xue, Q.; Hu, L.; Xu, T. Grain size effect in corrosion behavior of electrodeposited nanocrystalline Ni coatings in alkaline solution. J. Scripta Mater. 2006, 55, 657–660. [Google Scholar] [CrossRef]
  38. Bai, A.; Chuan, P.Y.; Hu, C.C. The corrosion behavior of Ni-P deposits with high phosphorous contents in brine media. J. Mater. Chem. Phys. 2003, 82, 93–100. [Google Scholar] [CrossRef]
  39. Czagány, M.; Baumli, P.; Kaptay, G. The influence of the phosphorous content and heat treatment on the nano-micro-structure, thickness and micro-hardness of electroless Ni-P coatings on steel. Appl. Surf. Sci. 2017, 423, 160–169. [Google Scholar] [CrossRef]
  40. Matteo, G.; Marco, S.; Christian, C.; Raphael, G. Determination of the elasticmoduli and residual stresses of freestanding Au-TiW bilayer thin films by nanoindentation. Mat. Des. 2016, 106, 436–445. [Google Scholar]
  41. He, Y.; Wang, S.C.; Walsh, F.C.; Chiu, Y.L.; Reed, P.A.S. Self-Lubricating Ni-P-MoS2 composite coatings. Surf. Coat. Technol. 2016, 307, 926–934. [Google Scholar] [CrossRef] [Green Version]
Figure 1. X-ray fluorescence (XRF) results of the composition for the manganese steel.
Coatings 09 00750 g001
Figure 2. X-ray diffraction (XRD) pattern of TiO2/Ti3C2Tx powders with TiO2 and Ti3AlC2 standard patterns.
Coatings 09 00750 g002
Figure 3. (a) Raman spectra and (b) Fourier transform infrared (FTIR) spectra of TiO2/Ti3C2Tx and Ti3C2Tx powders.
Coatings 09 00750 g003
Figure 4. Scanning electron microscopy (SEM) images of (a) Ti3C2Tx powders, (b) TiO2/Ti3C2Tx powders with insets of HRSEM image in the area of the black circle and schematic diagram of an anatase TiO2 crystal, and (c) TiO2/Ti3C2Tx powders with EDS images.
Coatings 09 00750 g004
Figure 5. (a,b) TEM image of TiO2/Ti3C2Tx; (c,f) HRTEM images of the yellow gridlines in (b); (d,e) HRTEM images of the yellow gridlines in (c) with the insets of FFT.
Coatings 09 00750 g005
Figure 6. (a) Ti2p, (b) C1s, and (c) O1s XPS spectra of Ti3C2Tx and TiO2/Ti3C2Tx powders.
Coatings 09 00750 g006
Figure 7. XRD patterns of the Ni–P coating and the Ni–P–TiO2/Ti3C2Tx coating.
Coatings 09 00750 g007
Figure 8. (a) Image of Raman diffraction area and (b) Raman spectrum of Ni–P–TiO2/Ti3C2Tx coatings; (c) and (d) cross-section SEM images of Ni–P coatings and Ni–P–TiO2/Ti3C2Tx coatings.
Coatings 09 00750 g008
Figure 9. Mechanisms of TiO2/Ti3C2Tx particles’ codeposition into the Ni–P deposit.
Coatings 09 00750 g009
Figure 10. SEM images of (a) Ni–P coatings and (b) Ni–P–TiO2/Ti3C2Tx coatings with the EDS results (insets with images of water drops, the contact angles, and the result of Ra).
Coatings 09 00750 g010
Figure 11. (a) The polarization curves (inset with the table of the corrosion potential (Ecorr), corrosion current (icorr), and corrosion resistance (Rp); (b) nyquist impedance diagrams of Ni–P and Ni–P–TiO2/Ti3C2Tx coatings; (c) equivalent circuits used for numerical fitting of impedance plots for 3.5% NaCl solution.
Coatings 09 00750 g011
Figure 12. (a) Microhardness and (b) coefficient of friction (inset with the table of wear loss) of Ni–P coatings and Ni–P–TiO2/Ti3C2Tx coatings.
Coatings 09 00750 g012
Table 1. Bath compositions and experimental conditions.
CompositionsExperimental Conditions
Nickel sulfate250 g L−1
Nickel chloride40 g L−1
Boric acid40 g L−1
Citric acid45 g L−1
Sodium hypophosphite30 g L−1
TiO2/Ti3C2Tx powders4 g L−1
SDS1 g L−1
pH3–4
Current condition density2 A dm−2
Time1 h
Temperature50 °C
Magnetic stirring speed600 rpm
Table 2. Crystal planes and indices of crystal direction in the Ni–P–TiO2/Ti3C2Tx coating.
Crystal PlanesIndices of Crystal Direction (%)
(111)47.17
(200)32.39
(220)20.44
Table 3. The fitting resistances of the equivalent-circuit elements.
SampleRs (Ω·cm2)Rct (Ω cm2)
Ni–P coating10.0175.89
Ni–P–TiO2/Ti3C2Tx coating13.0887.69

