Advanced Analysis of Corroded Solar Reflectors

 ,
,  ,
,  and
and
Abstract
1. Introduction
2. Materials and Methods
2.1. Reflectance Definitions
- Solar-weighted hemispherical reflectance, ρs,h([λa, λb],θi,h), which is calculated by weighting the hemispherical reflectance spectrum, ρλ,h, with the solar direct irradiance, Gb, on the earth surface for each λi, according to Equation (1) [28].
- Monochromatic near-specular reflectance, ρλ,φ(λ,θi,φ), which is the ratio of incident and emitted energy flux of a surface in the specular direction [14]. It is measured with a reflectometer.
- Monochromatic hemispherical reflectance, ρλ,h(λ,θi,h), which is the value of the spectral hemispherical reflectance at the same λ of the ρλ,φ measured. It is used to calculate the specularity of the reflectors, that is, the ratio between ρλ,φ and ρλ,h.
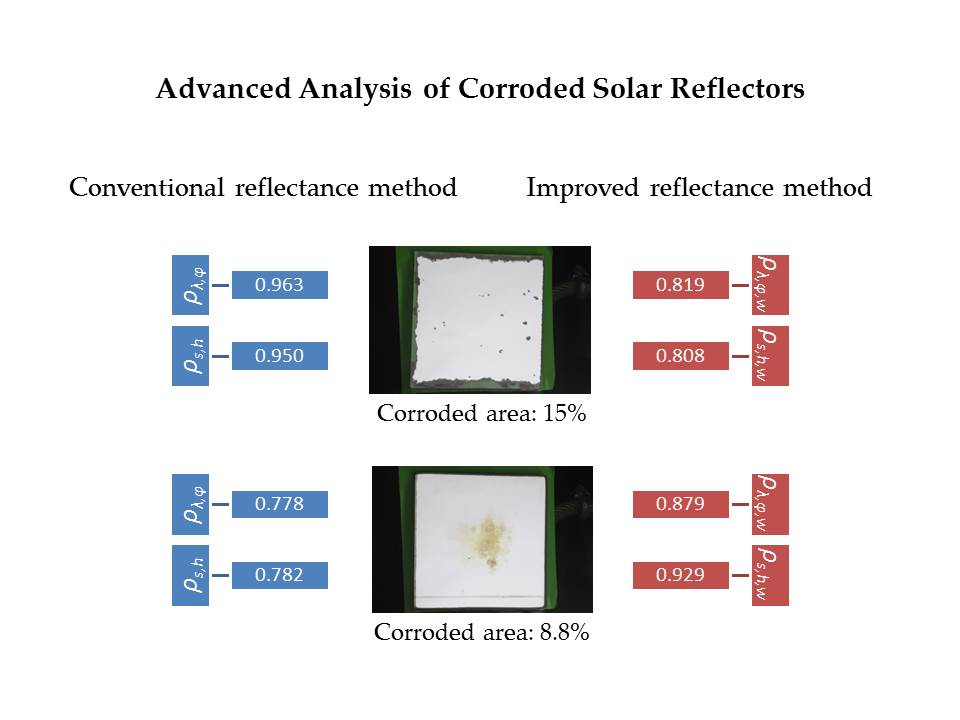
2.2. Materials
2.3. Durability Tests
2.4. Analysis Techniques
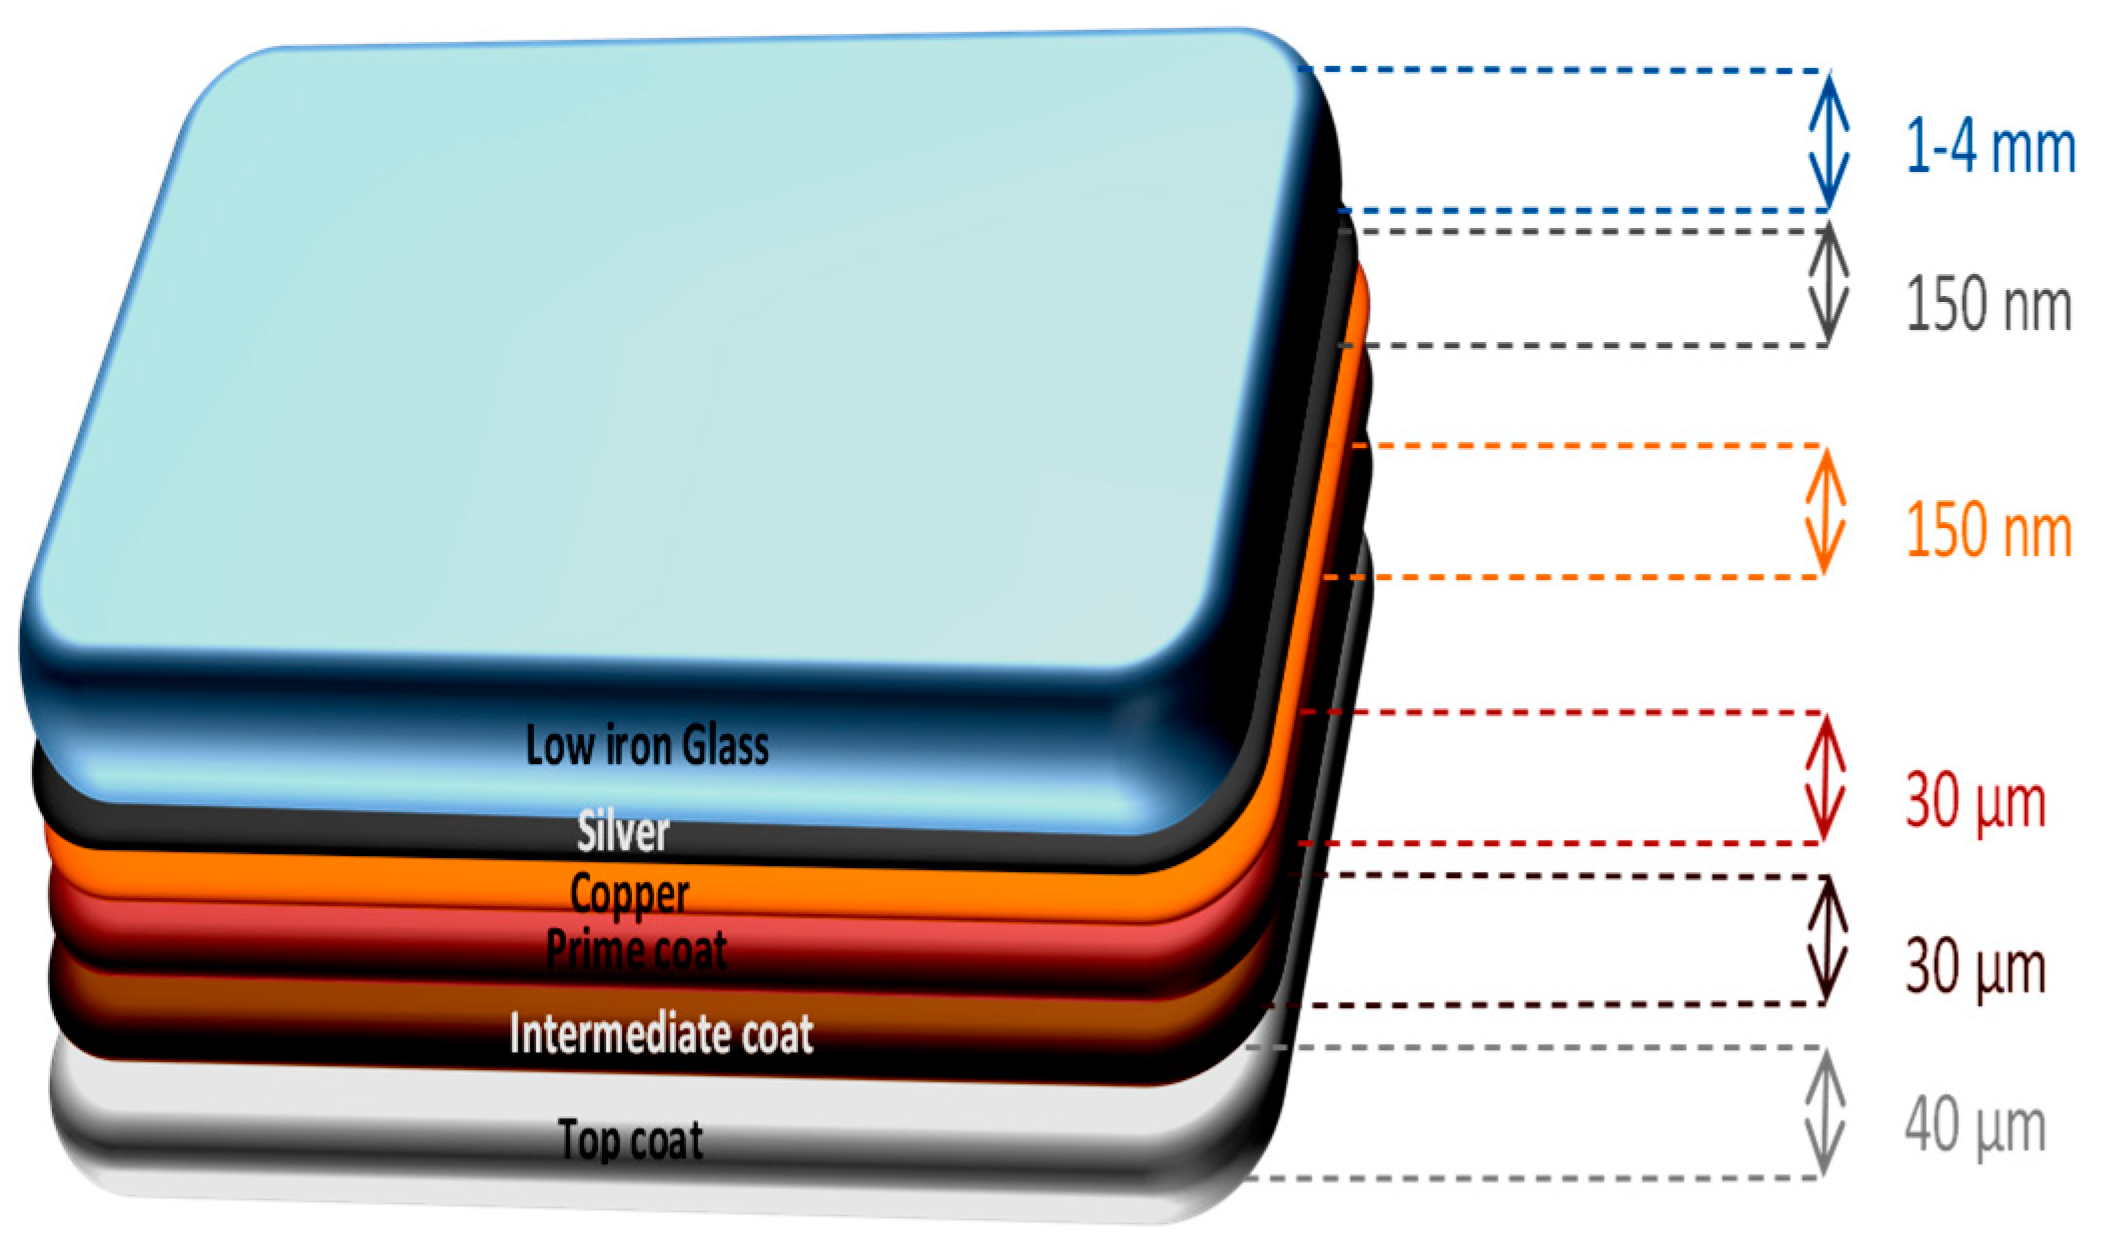
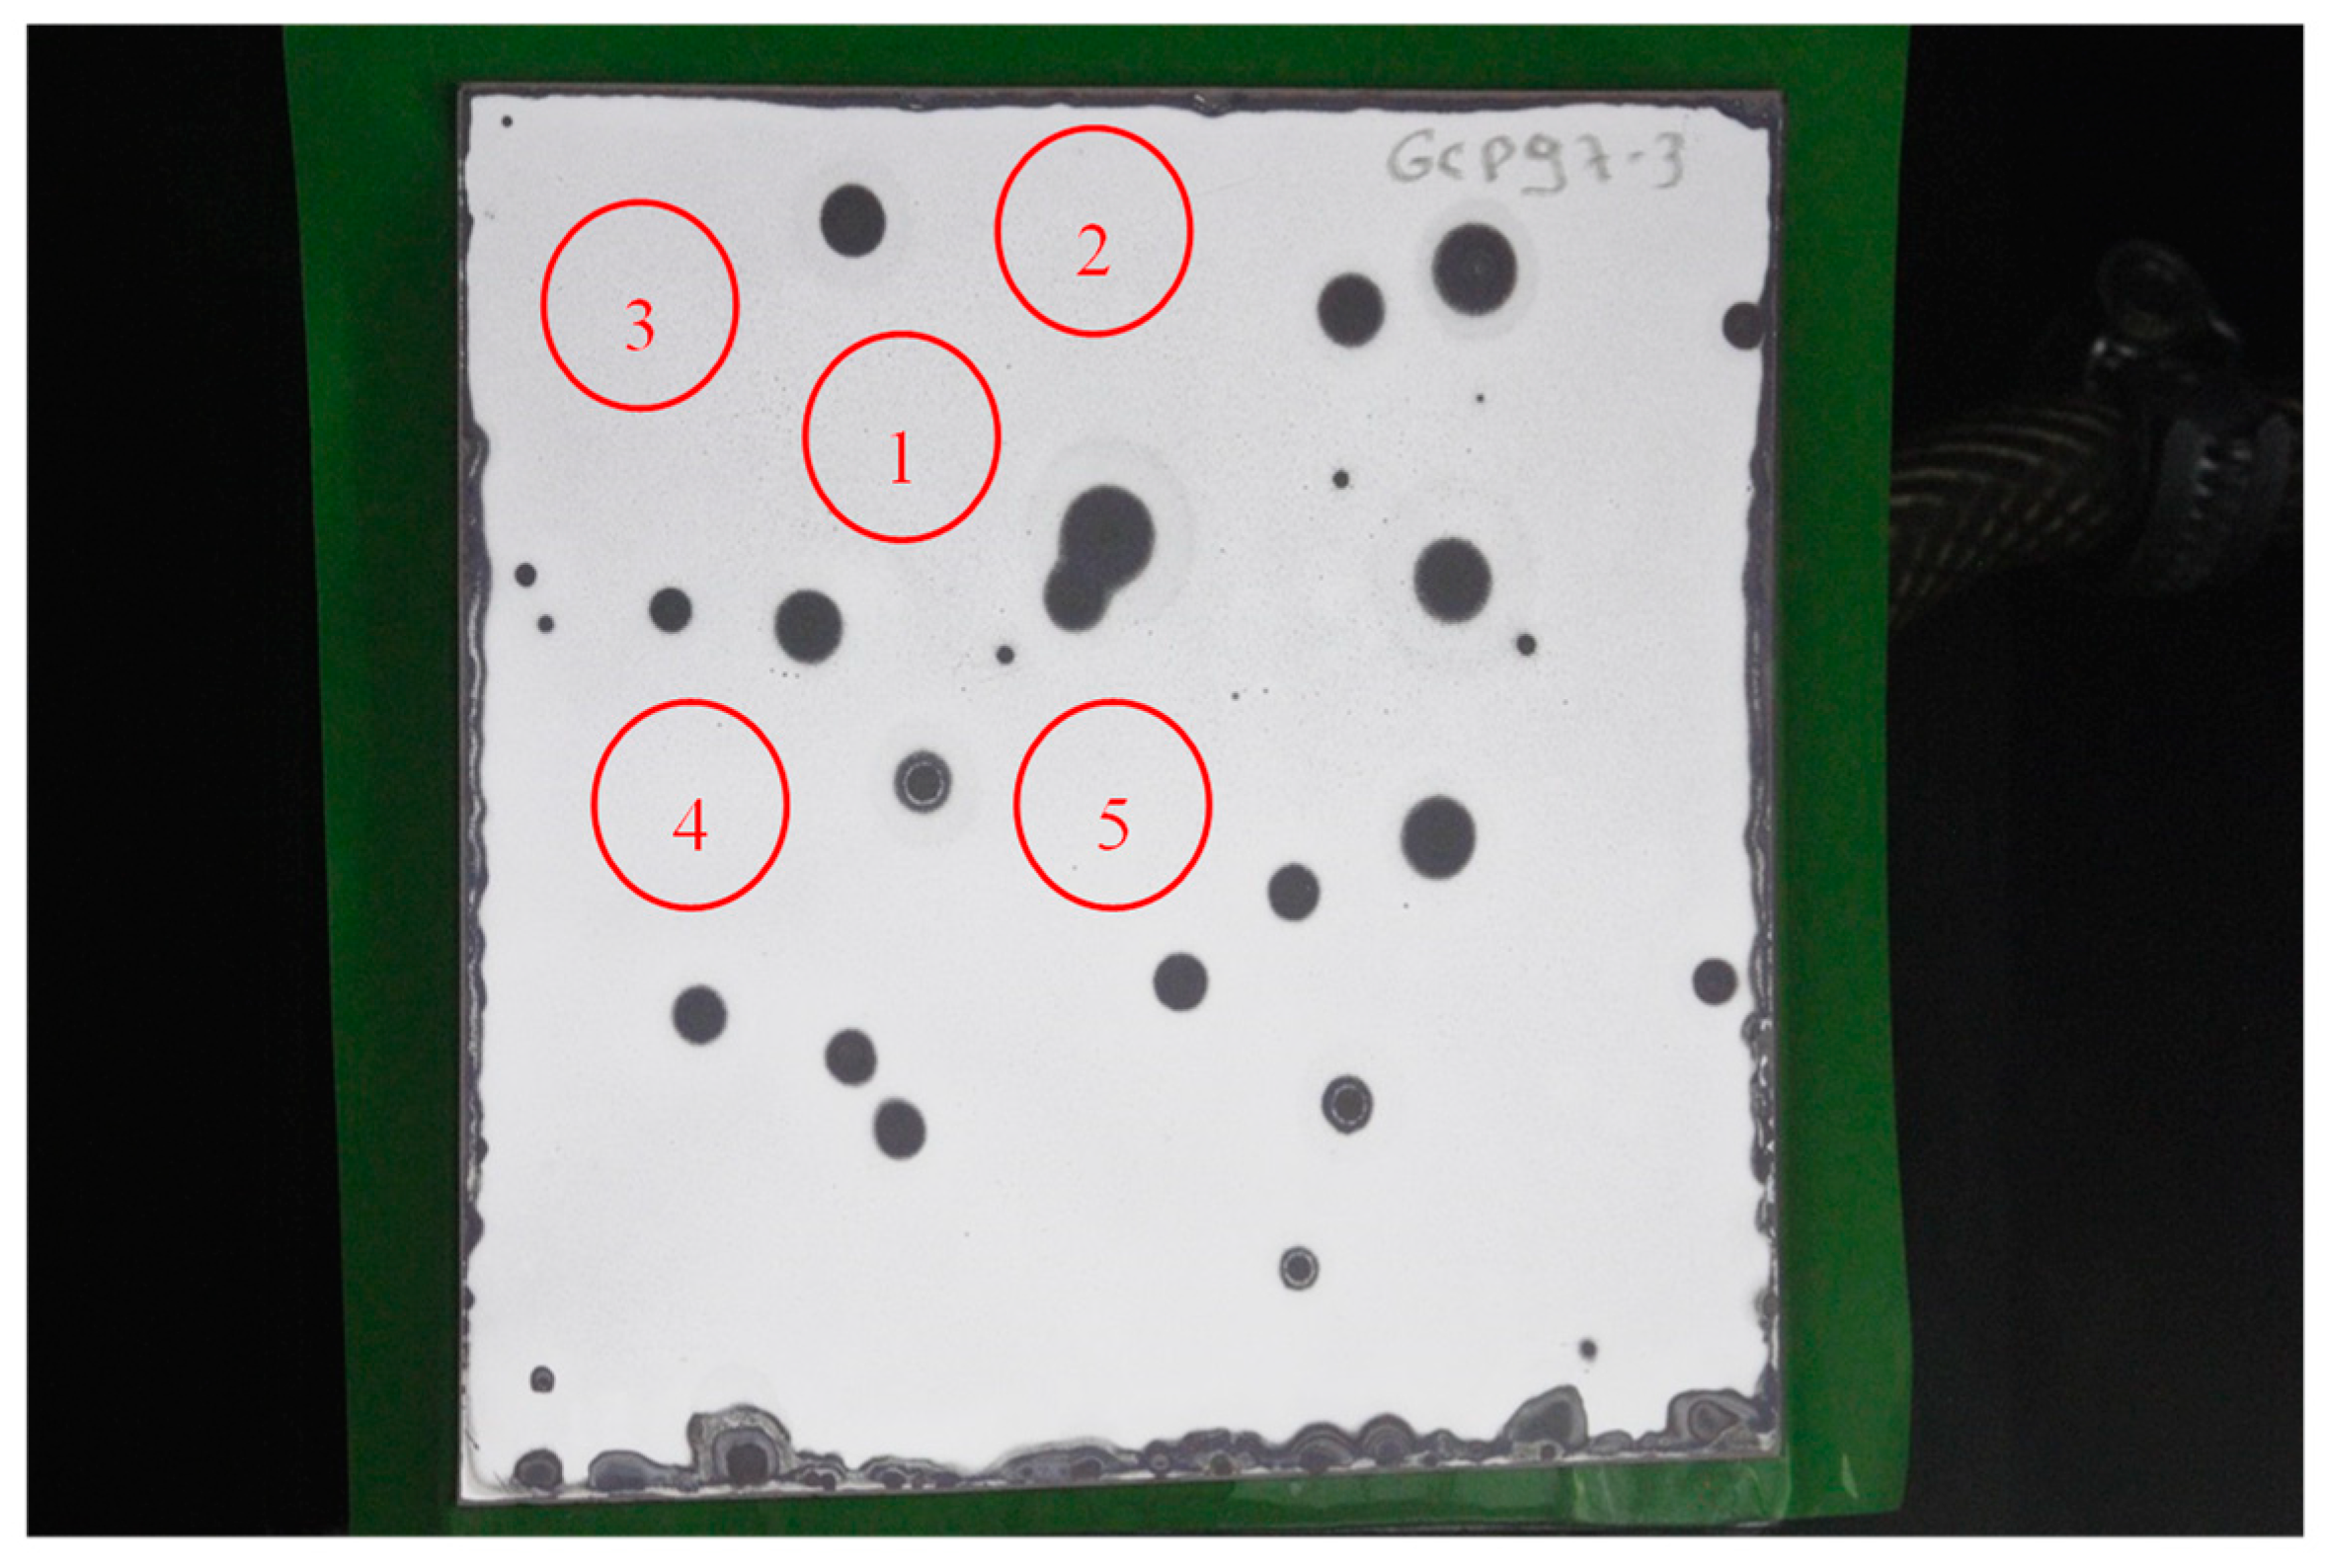
2.4.1. Reflectometer
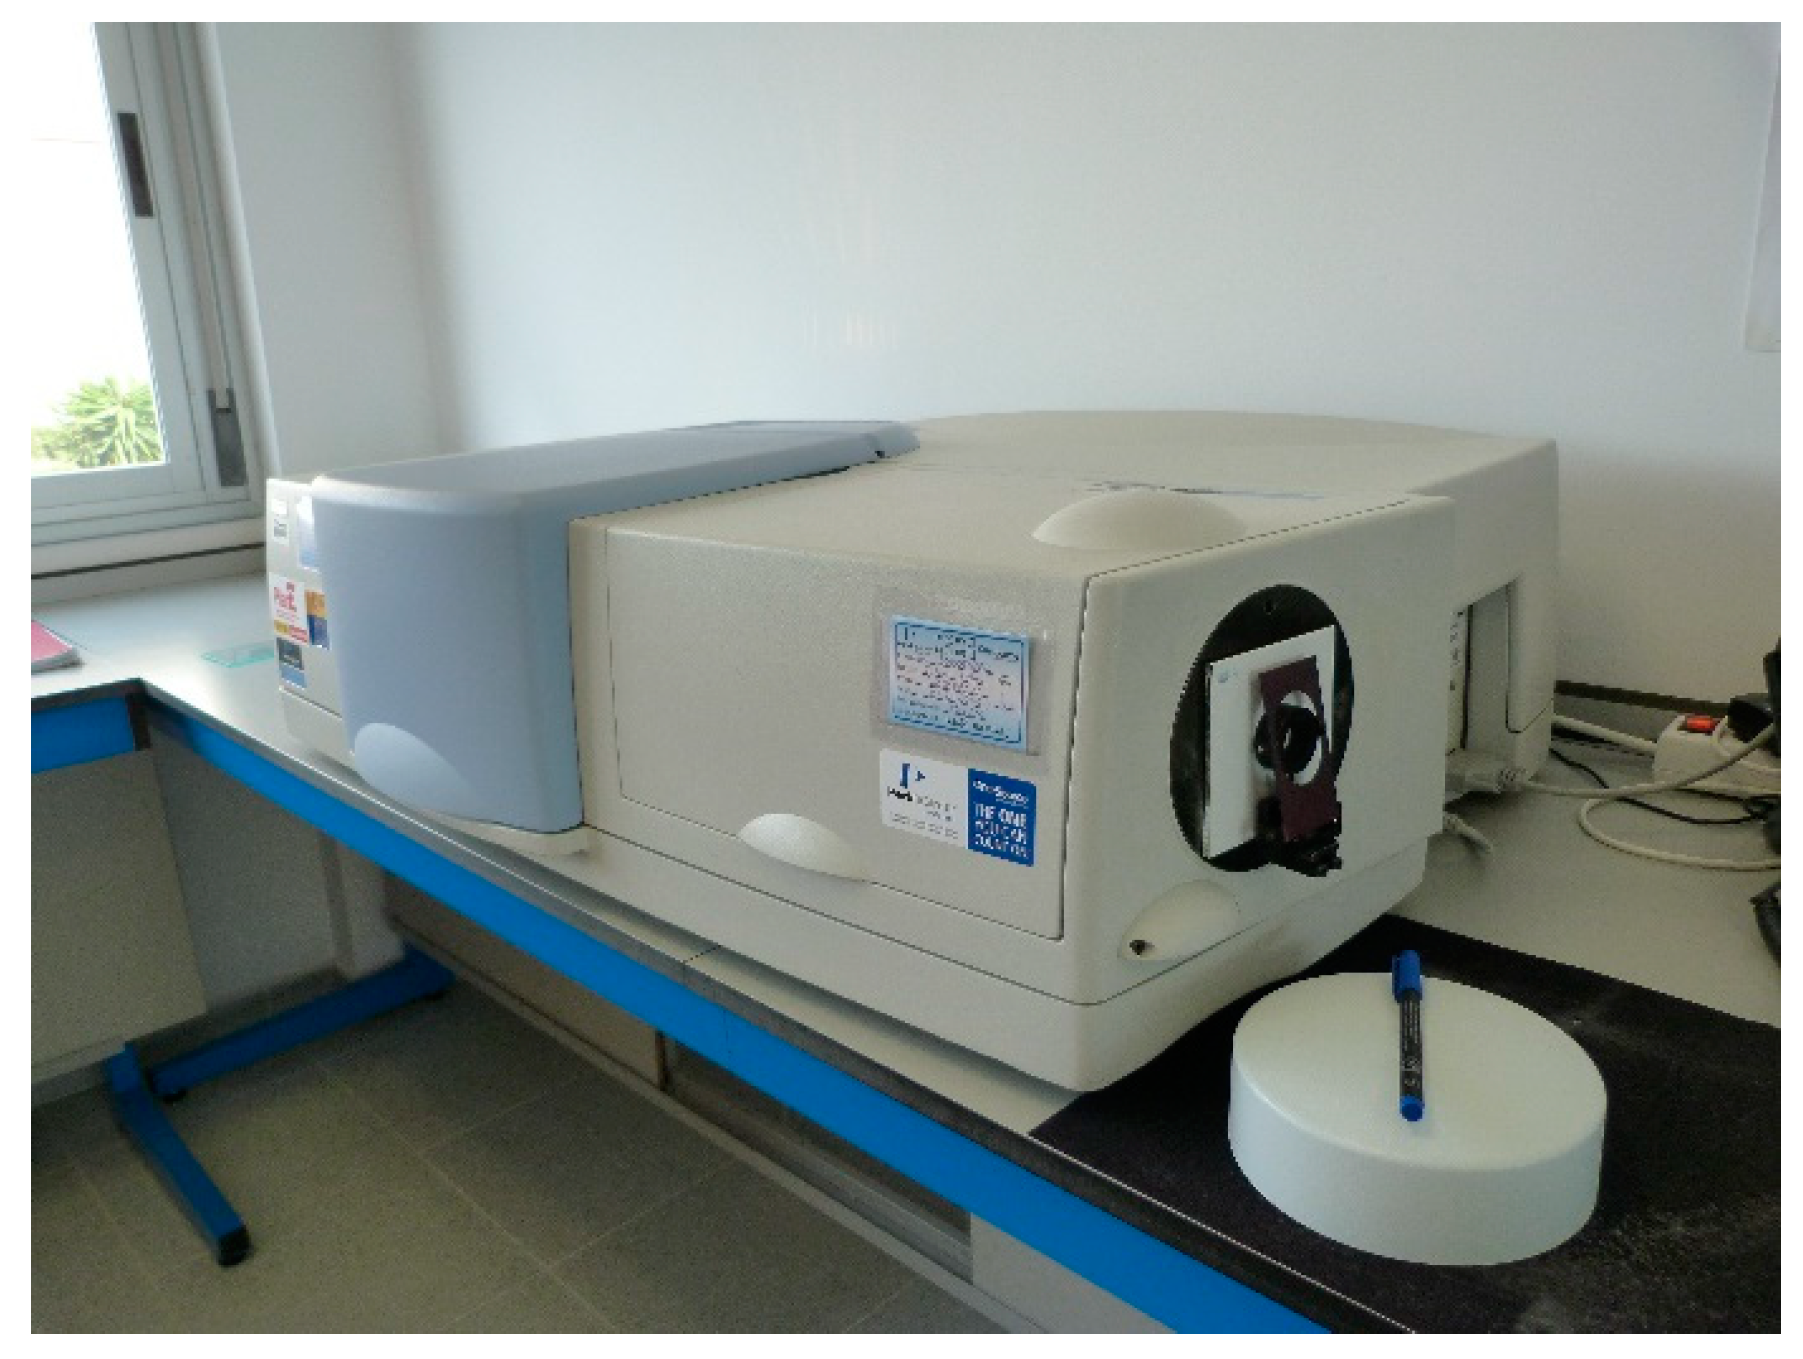
2.4.2. Spectrophotometer
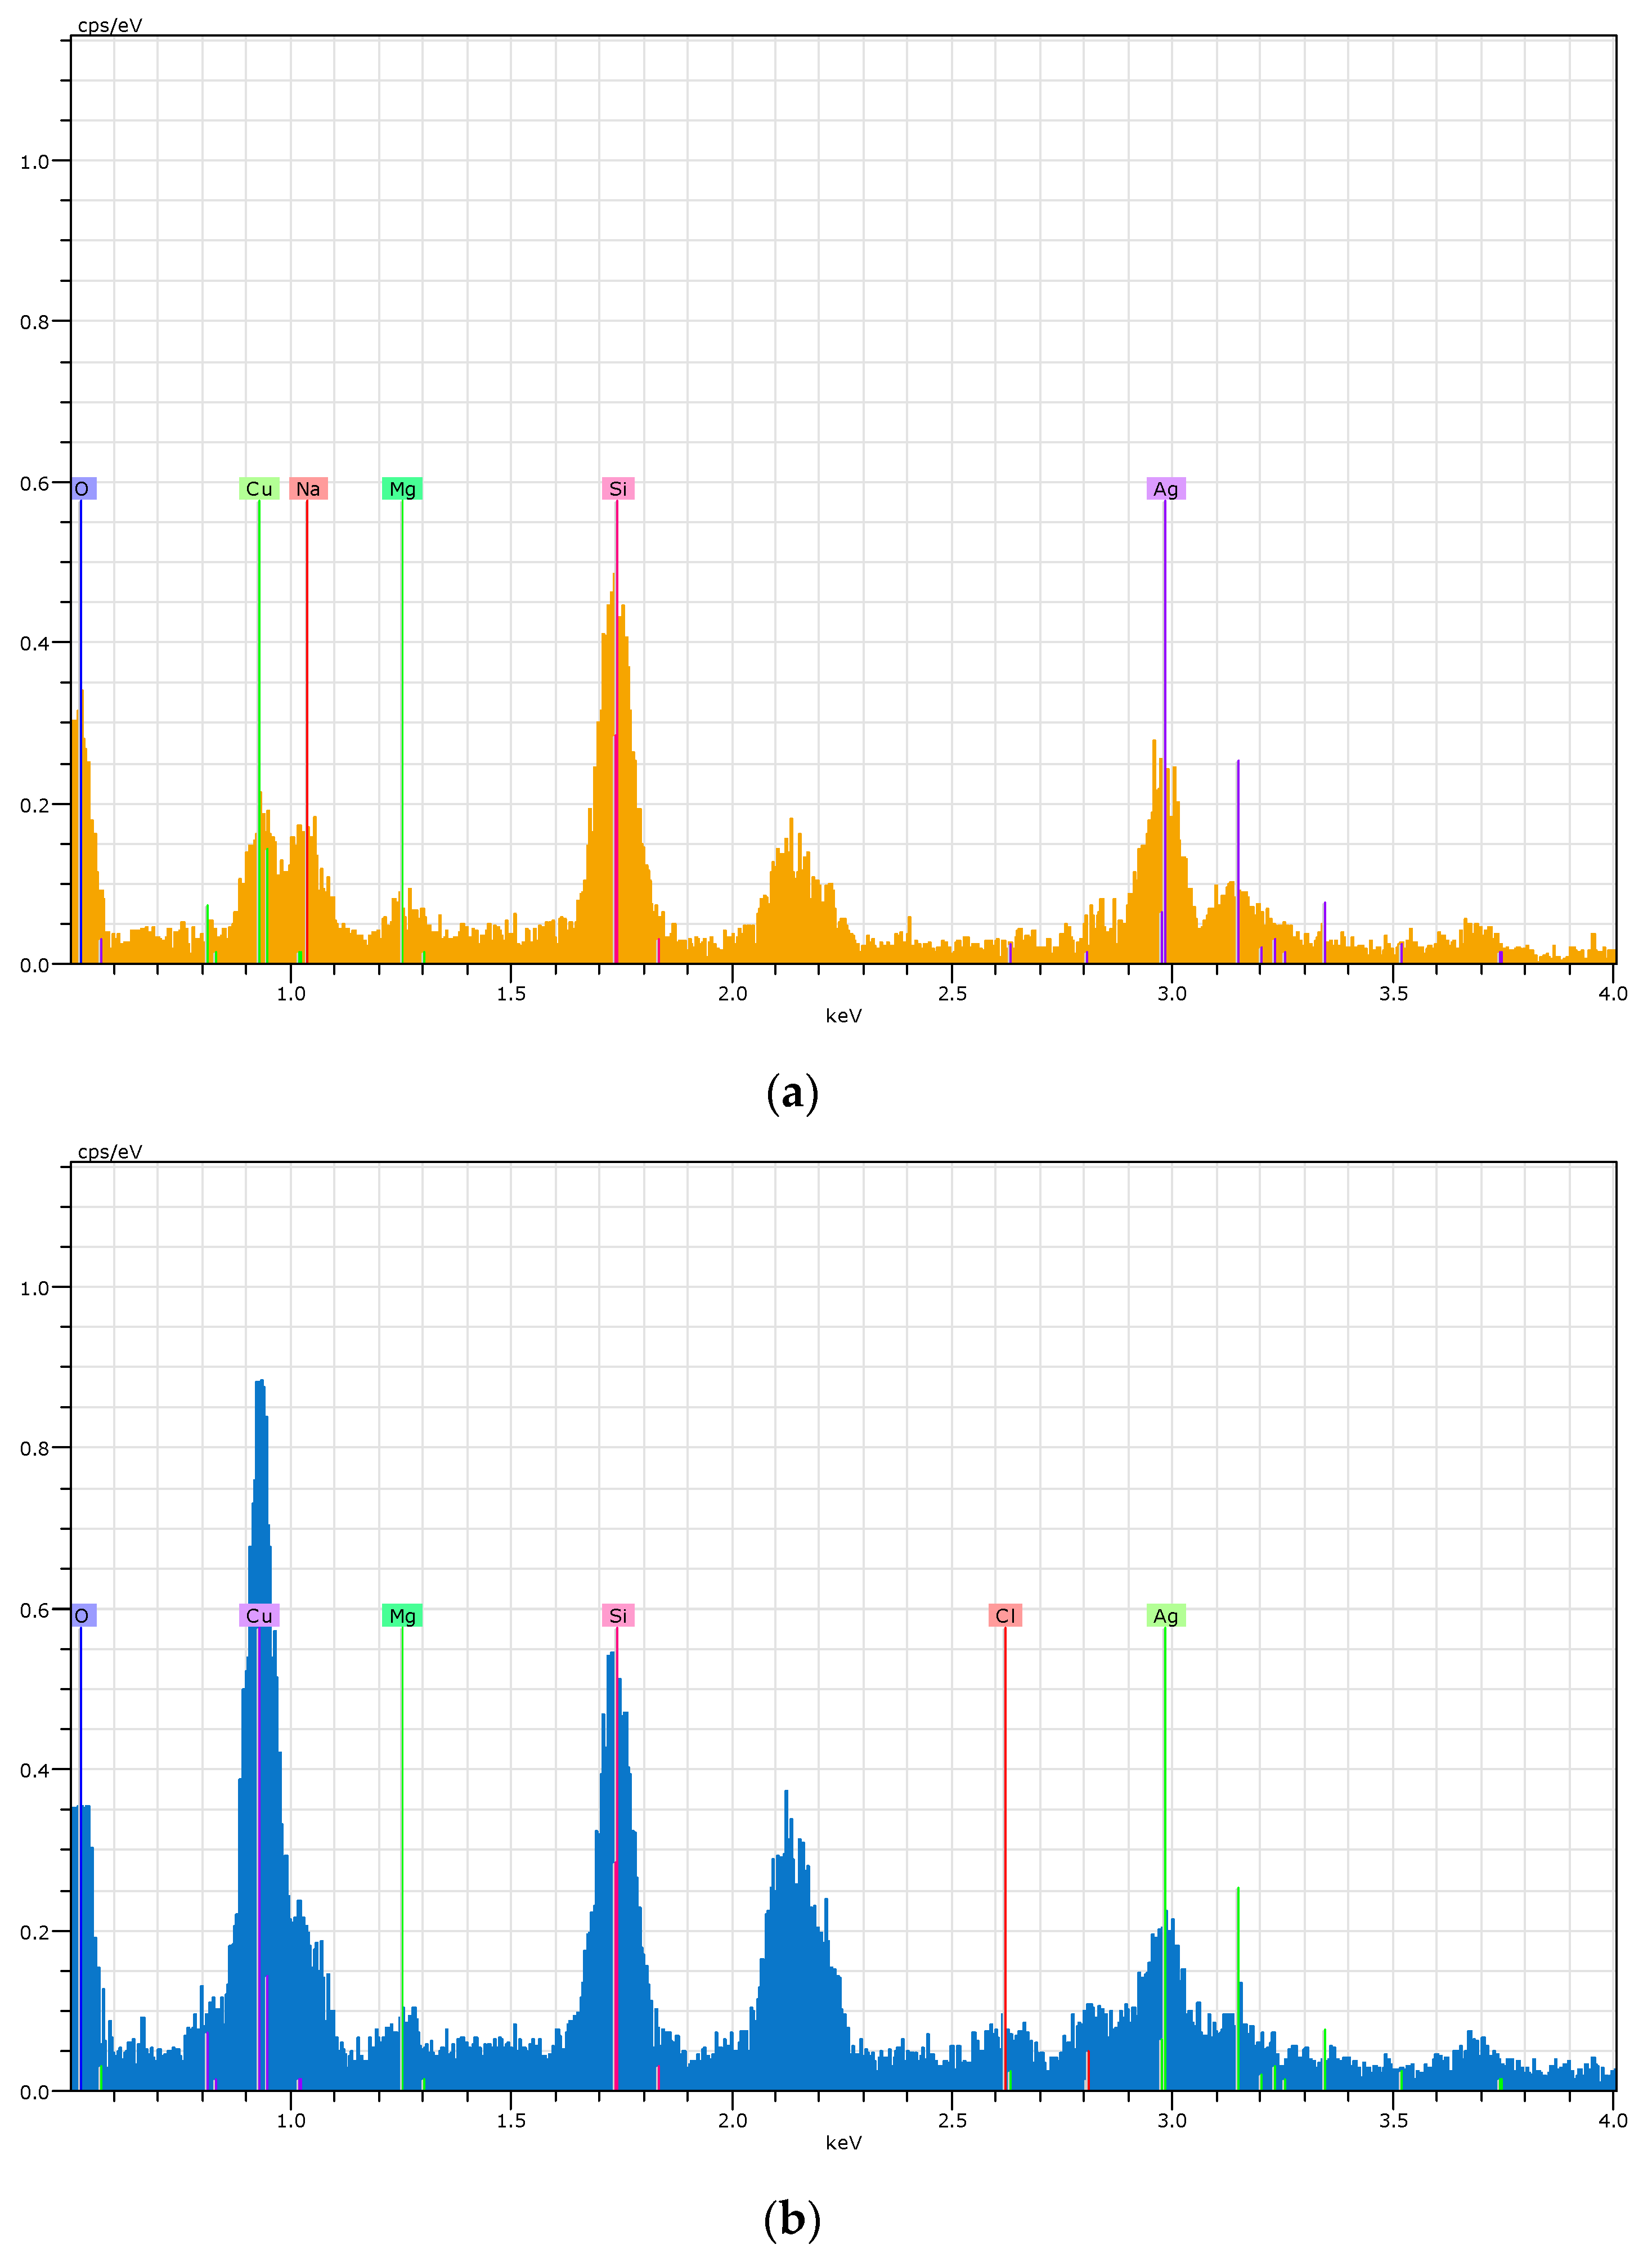
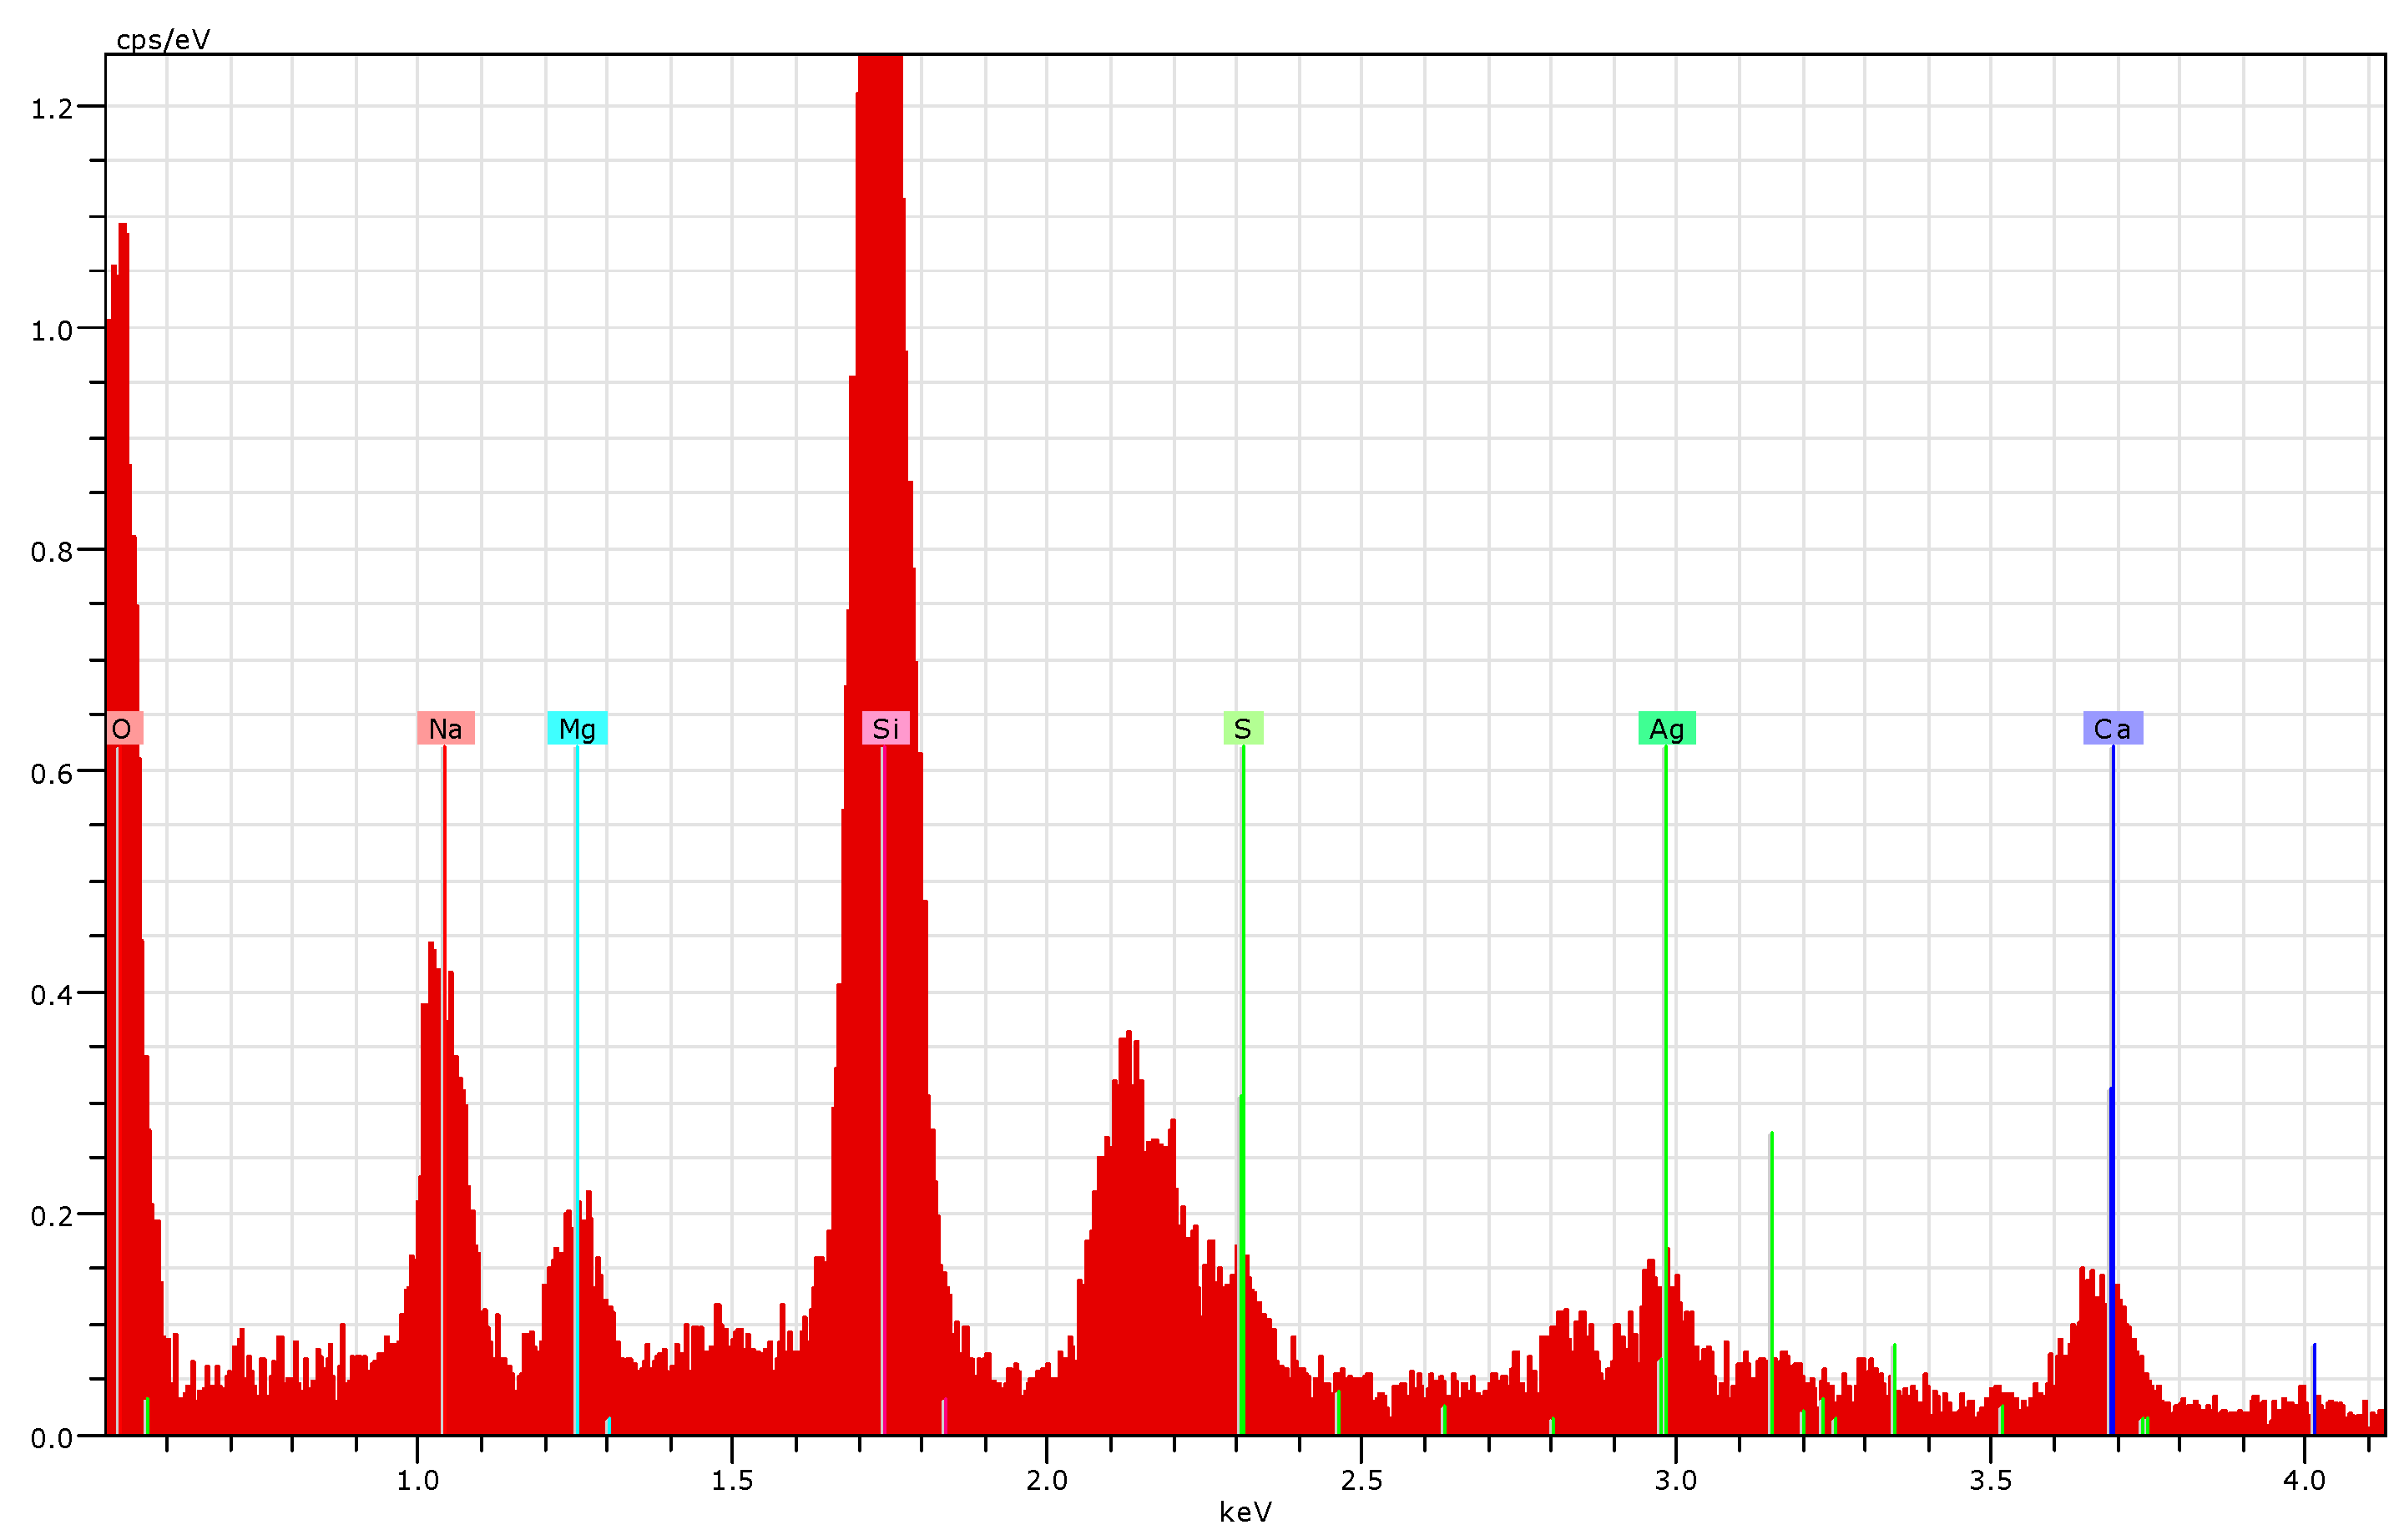
2.4.3. EDX
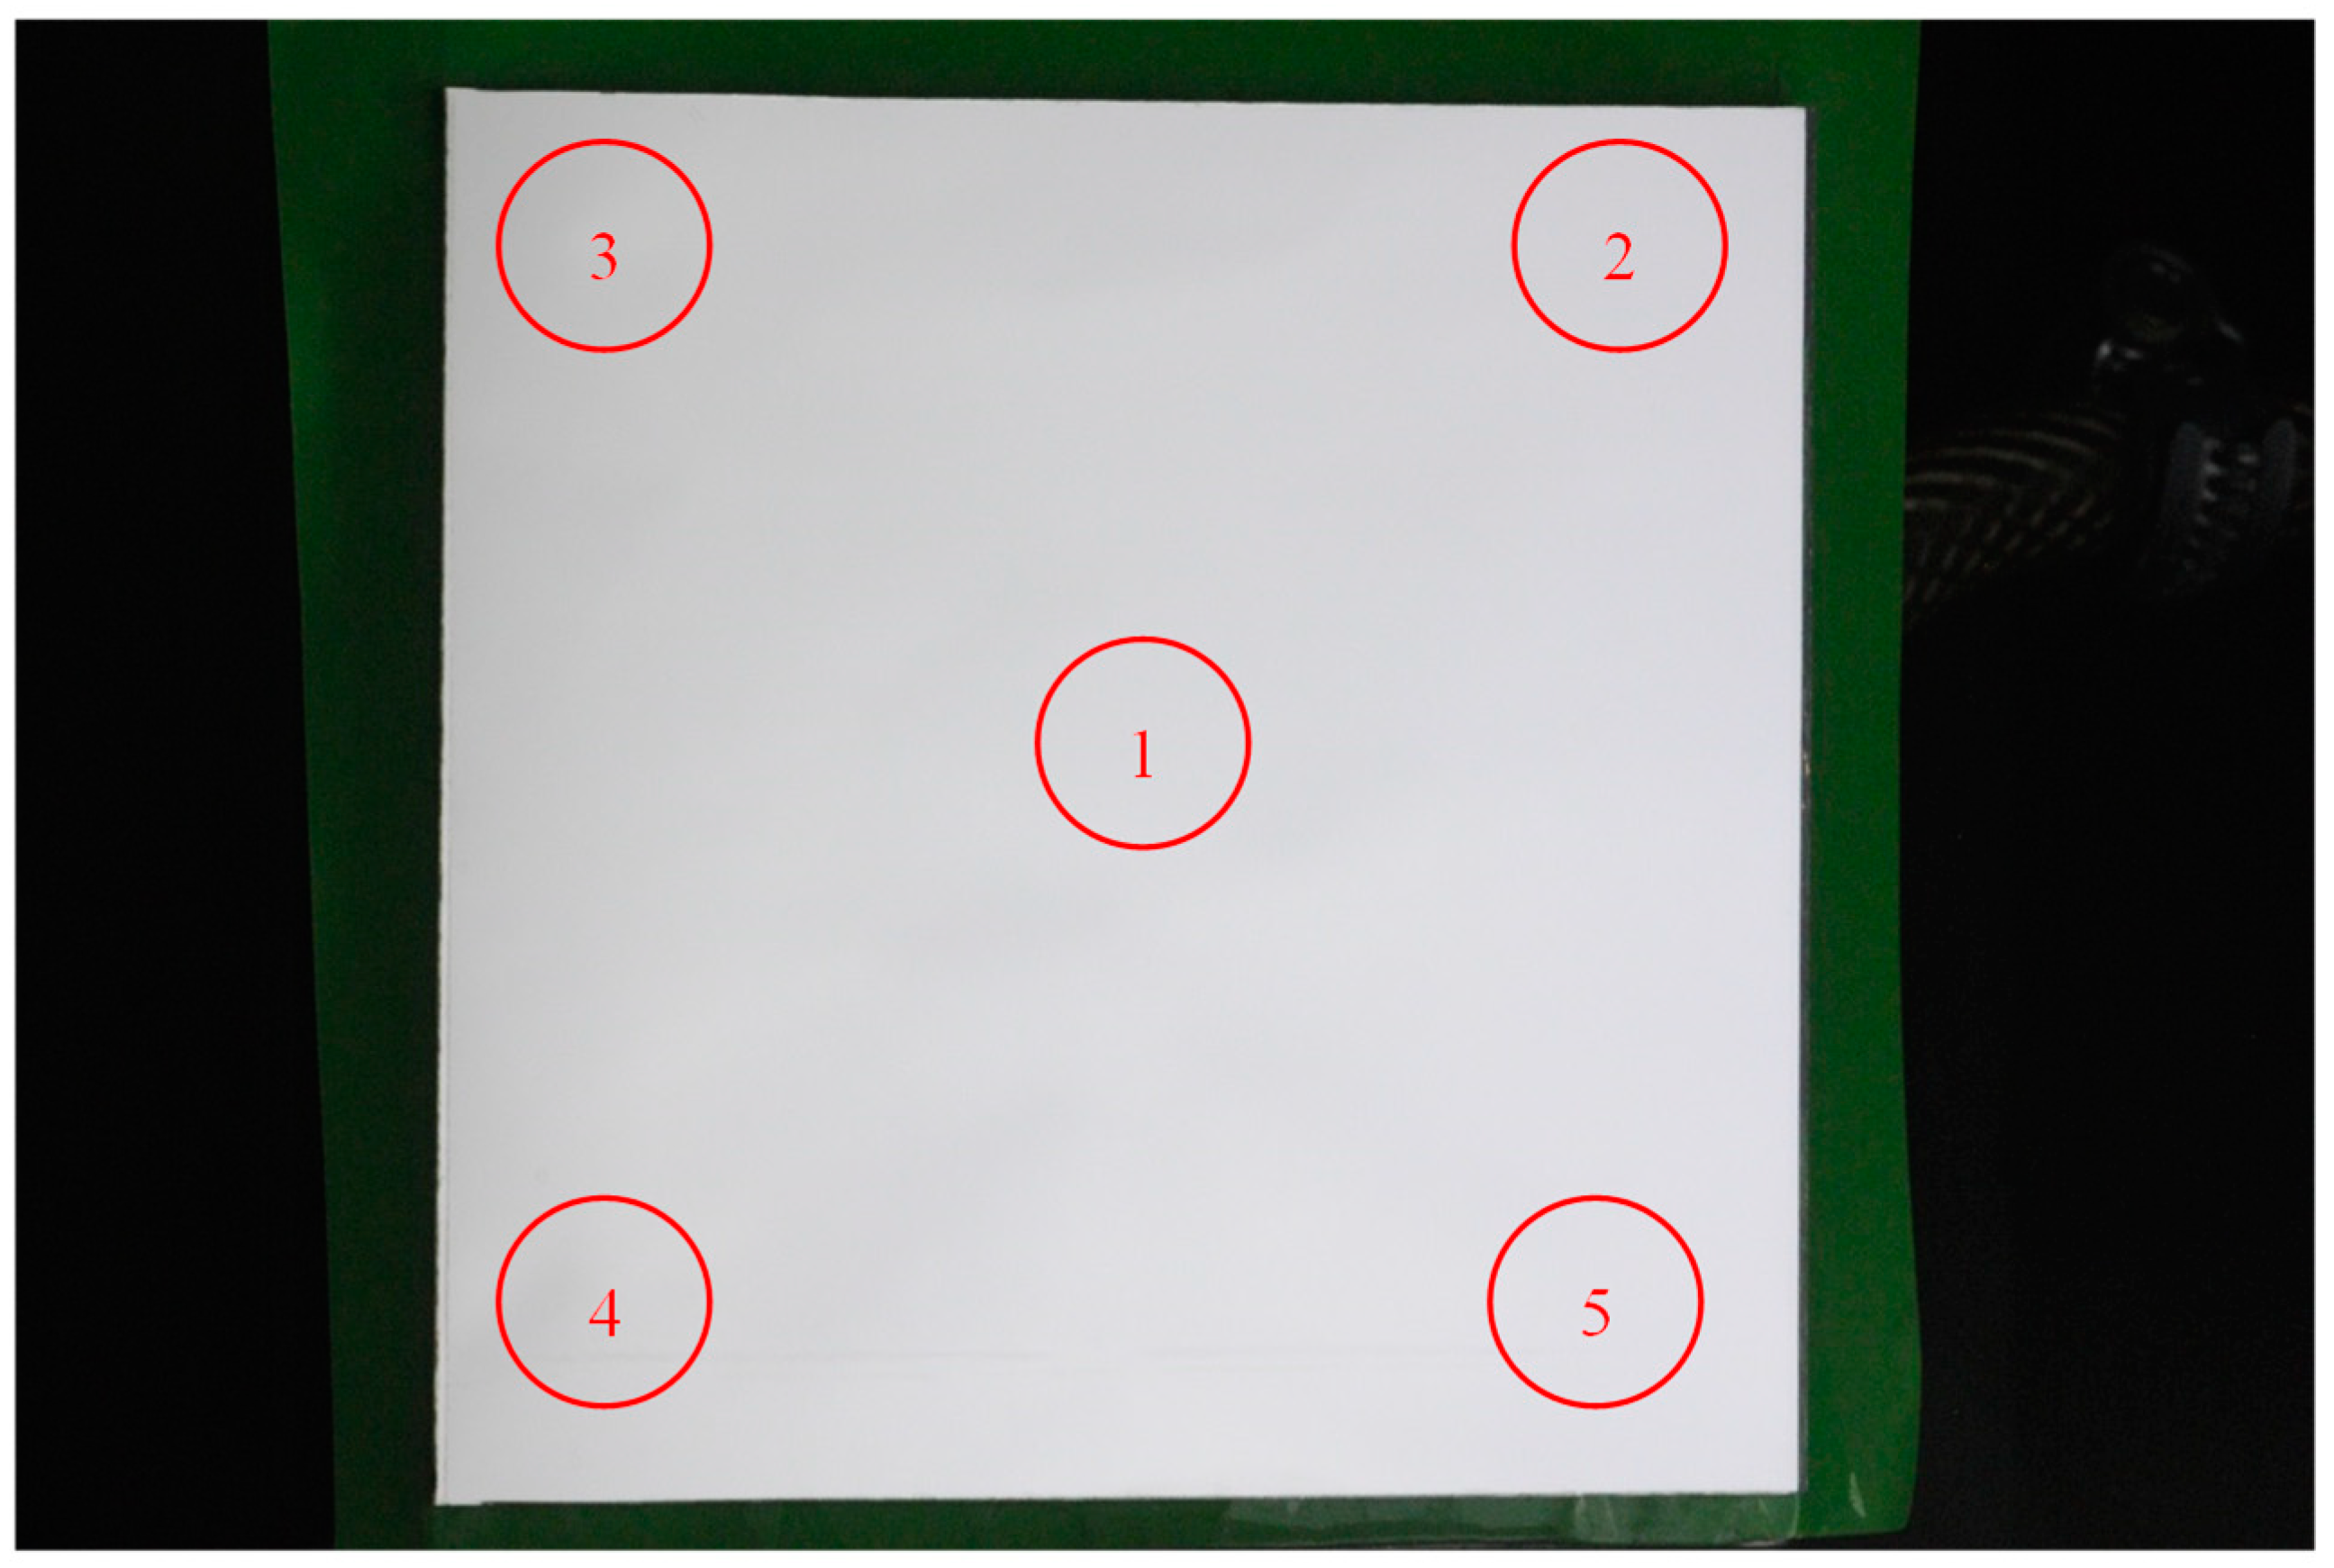
2.5. Conventional Reflectance Measurement Technique
- ρs,h at θi ≤ 15° and in the range λ = [320, 2500] nm.
- ρλ,φ at one defined λ in the range λ = [400, 700] nm, θi ≤ 15°, and a φ in the range of φ = [0, 20] mrad.
- ρλ,h at the same λ as for ρλ,φ to calculate the specularity of the reflector samples.
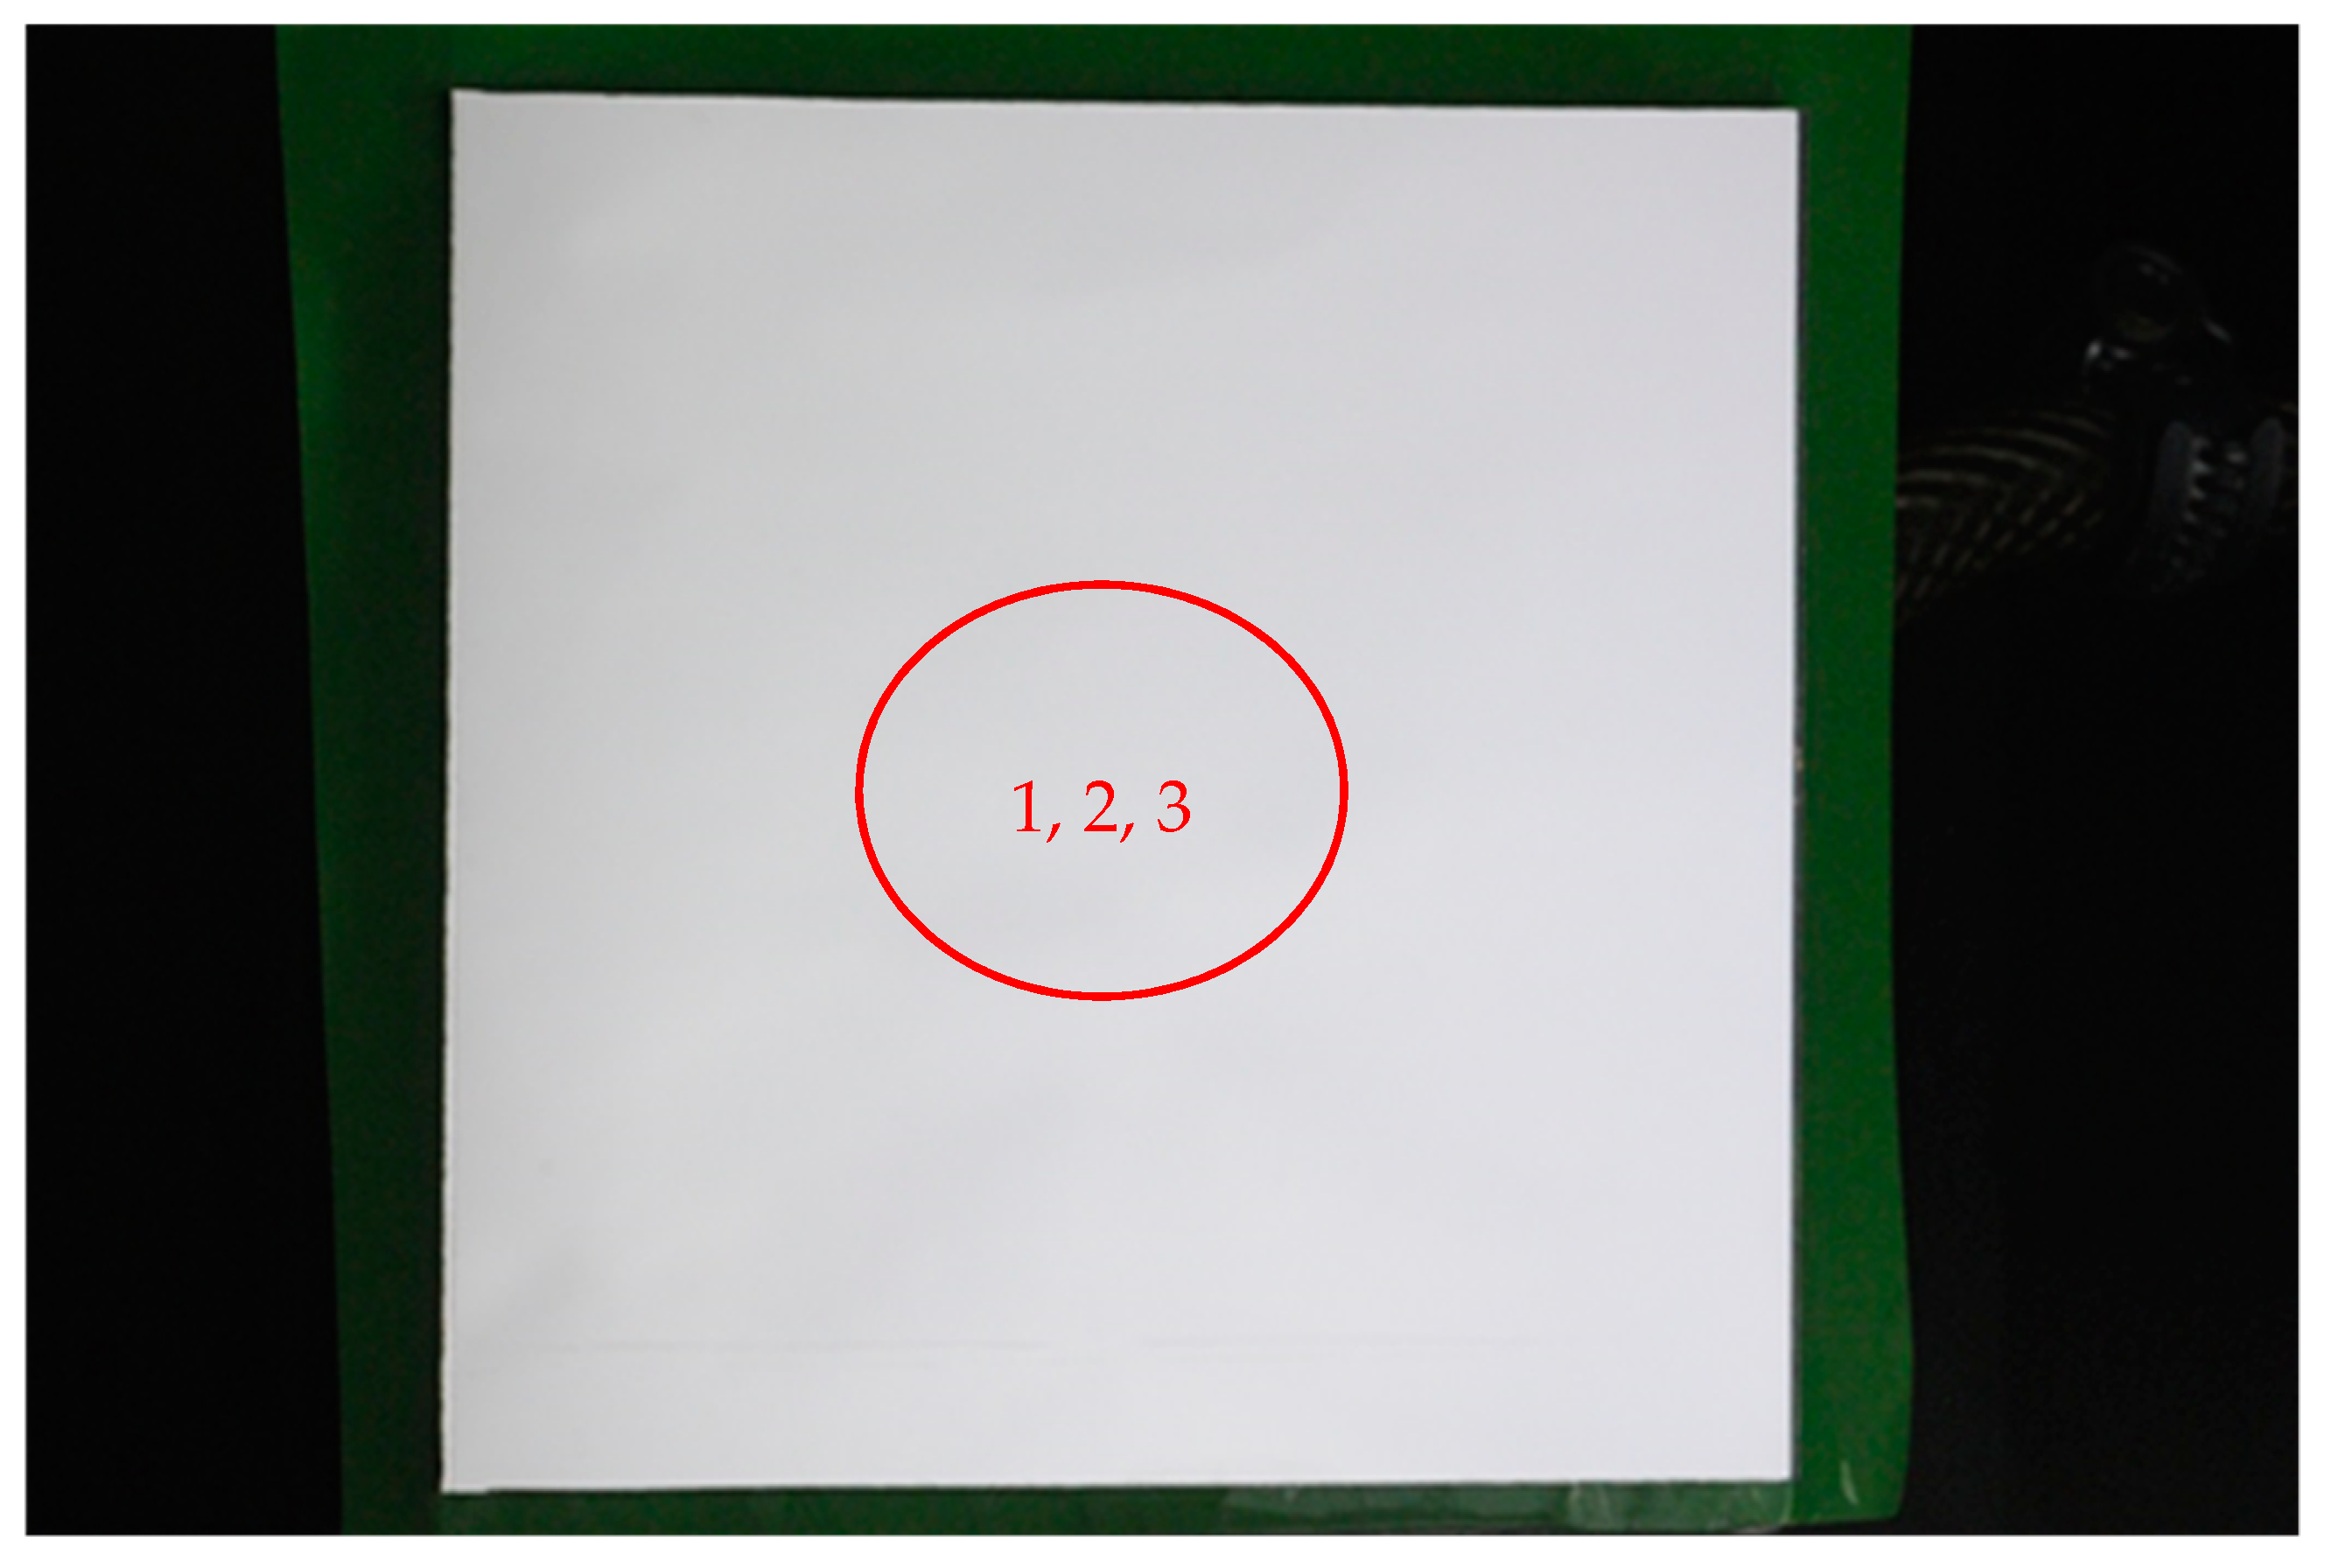
2.6. Improved Reflectance Measurement Technique
3. Results and Discussion
3.1. Reflectance Analysis
3.1.1. CASS Test
3.1.2. Kesternich Test
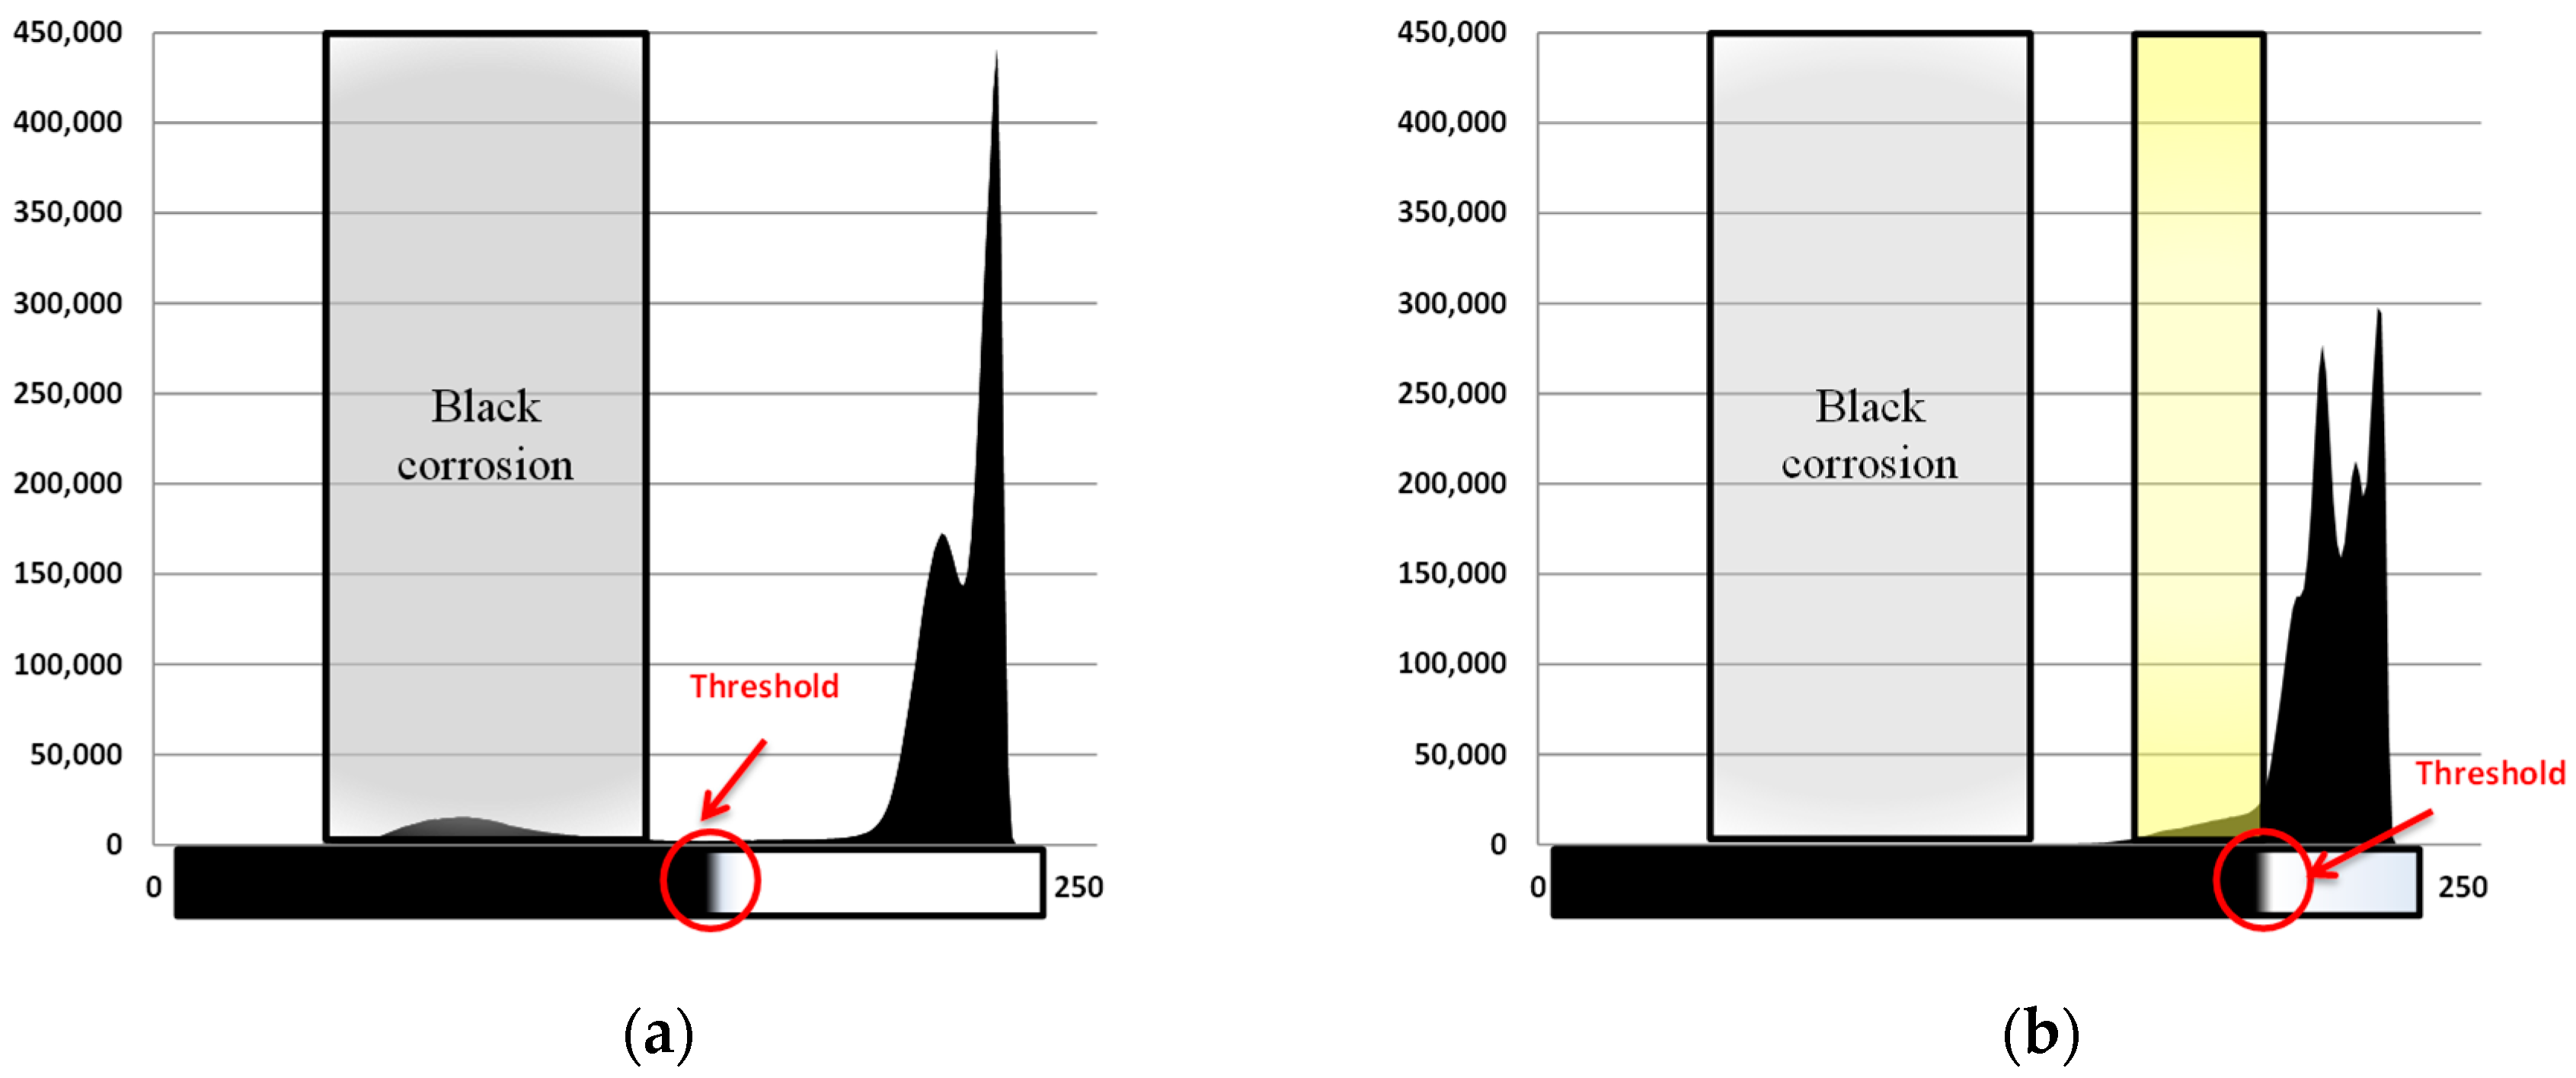
3.1.3. Discussion of the Measurement Techniques
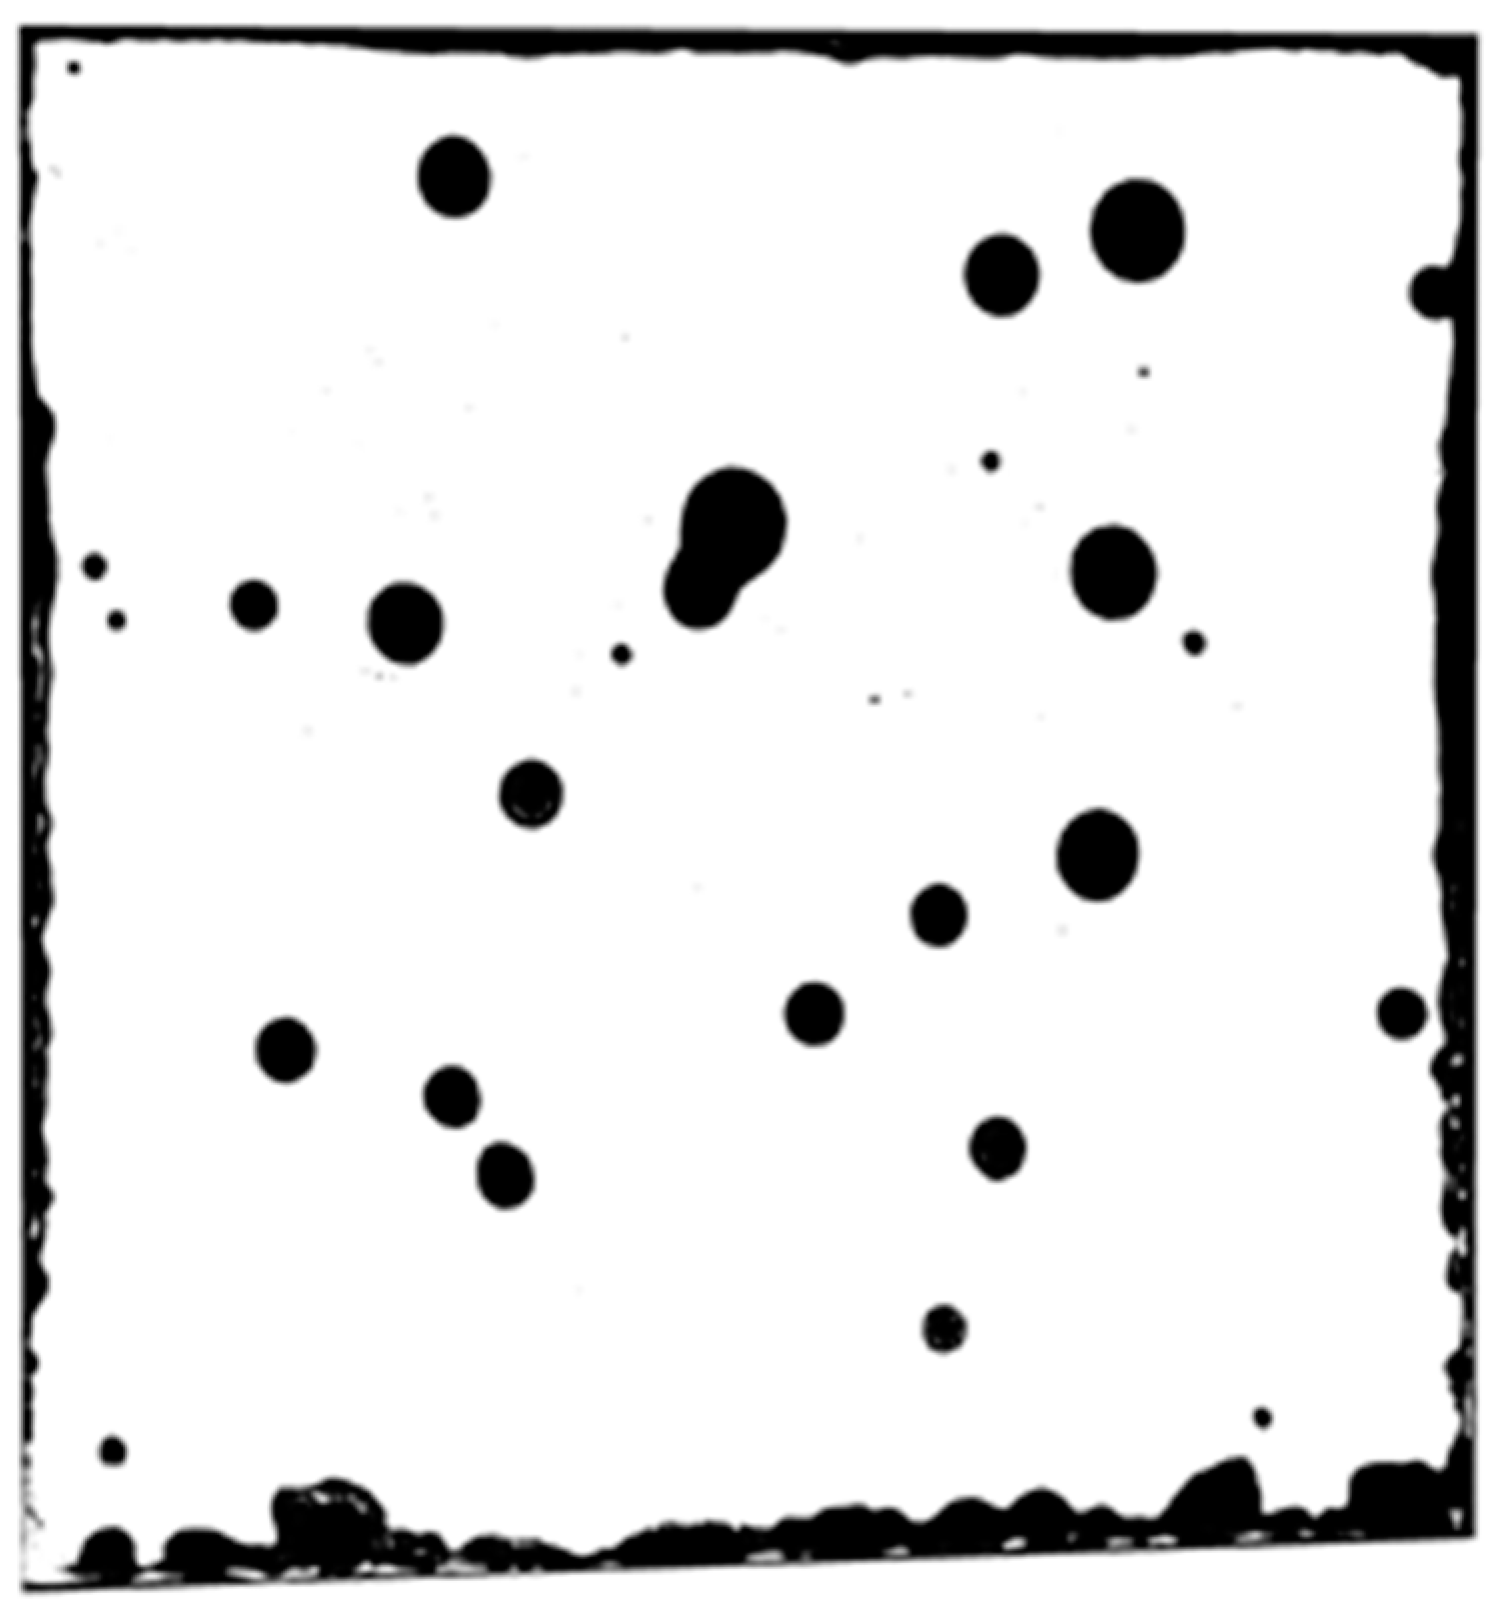
3.2. Corrosion Products Formed and Corrosion Rates
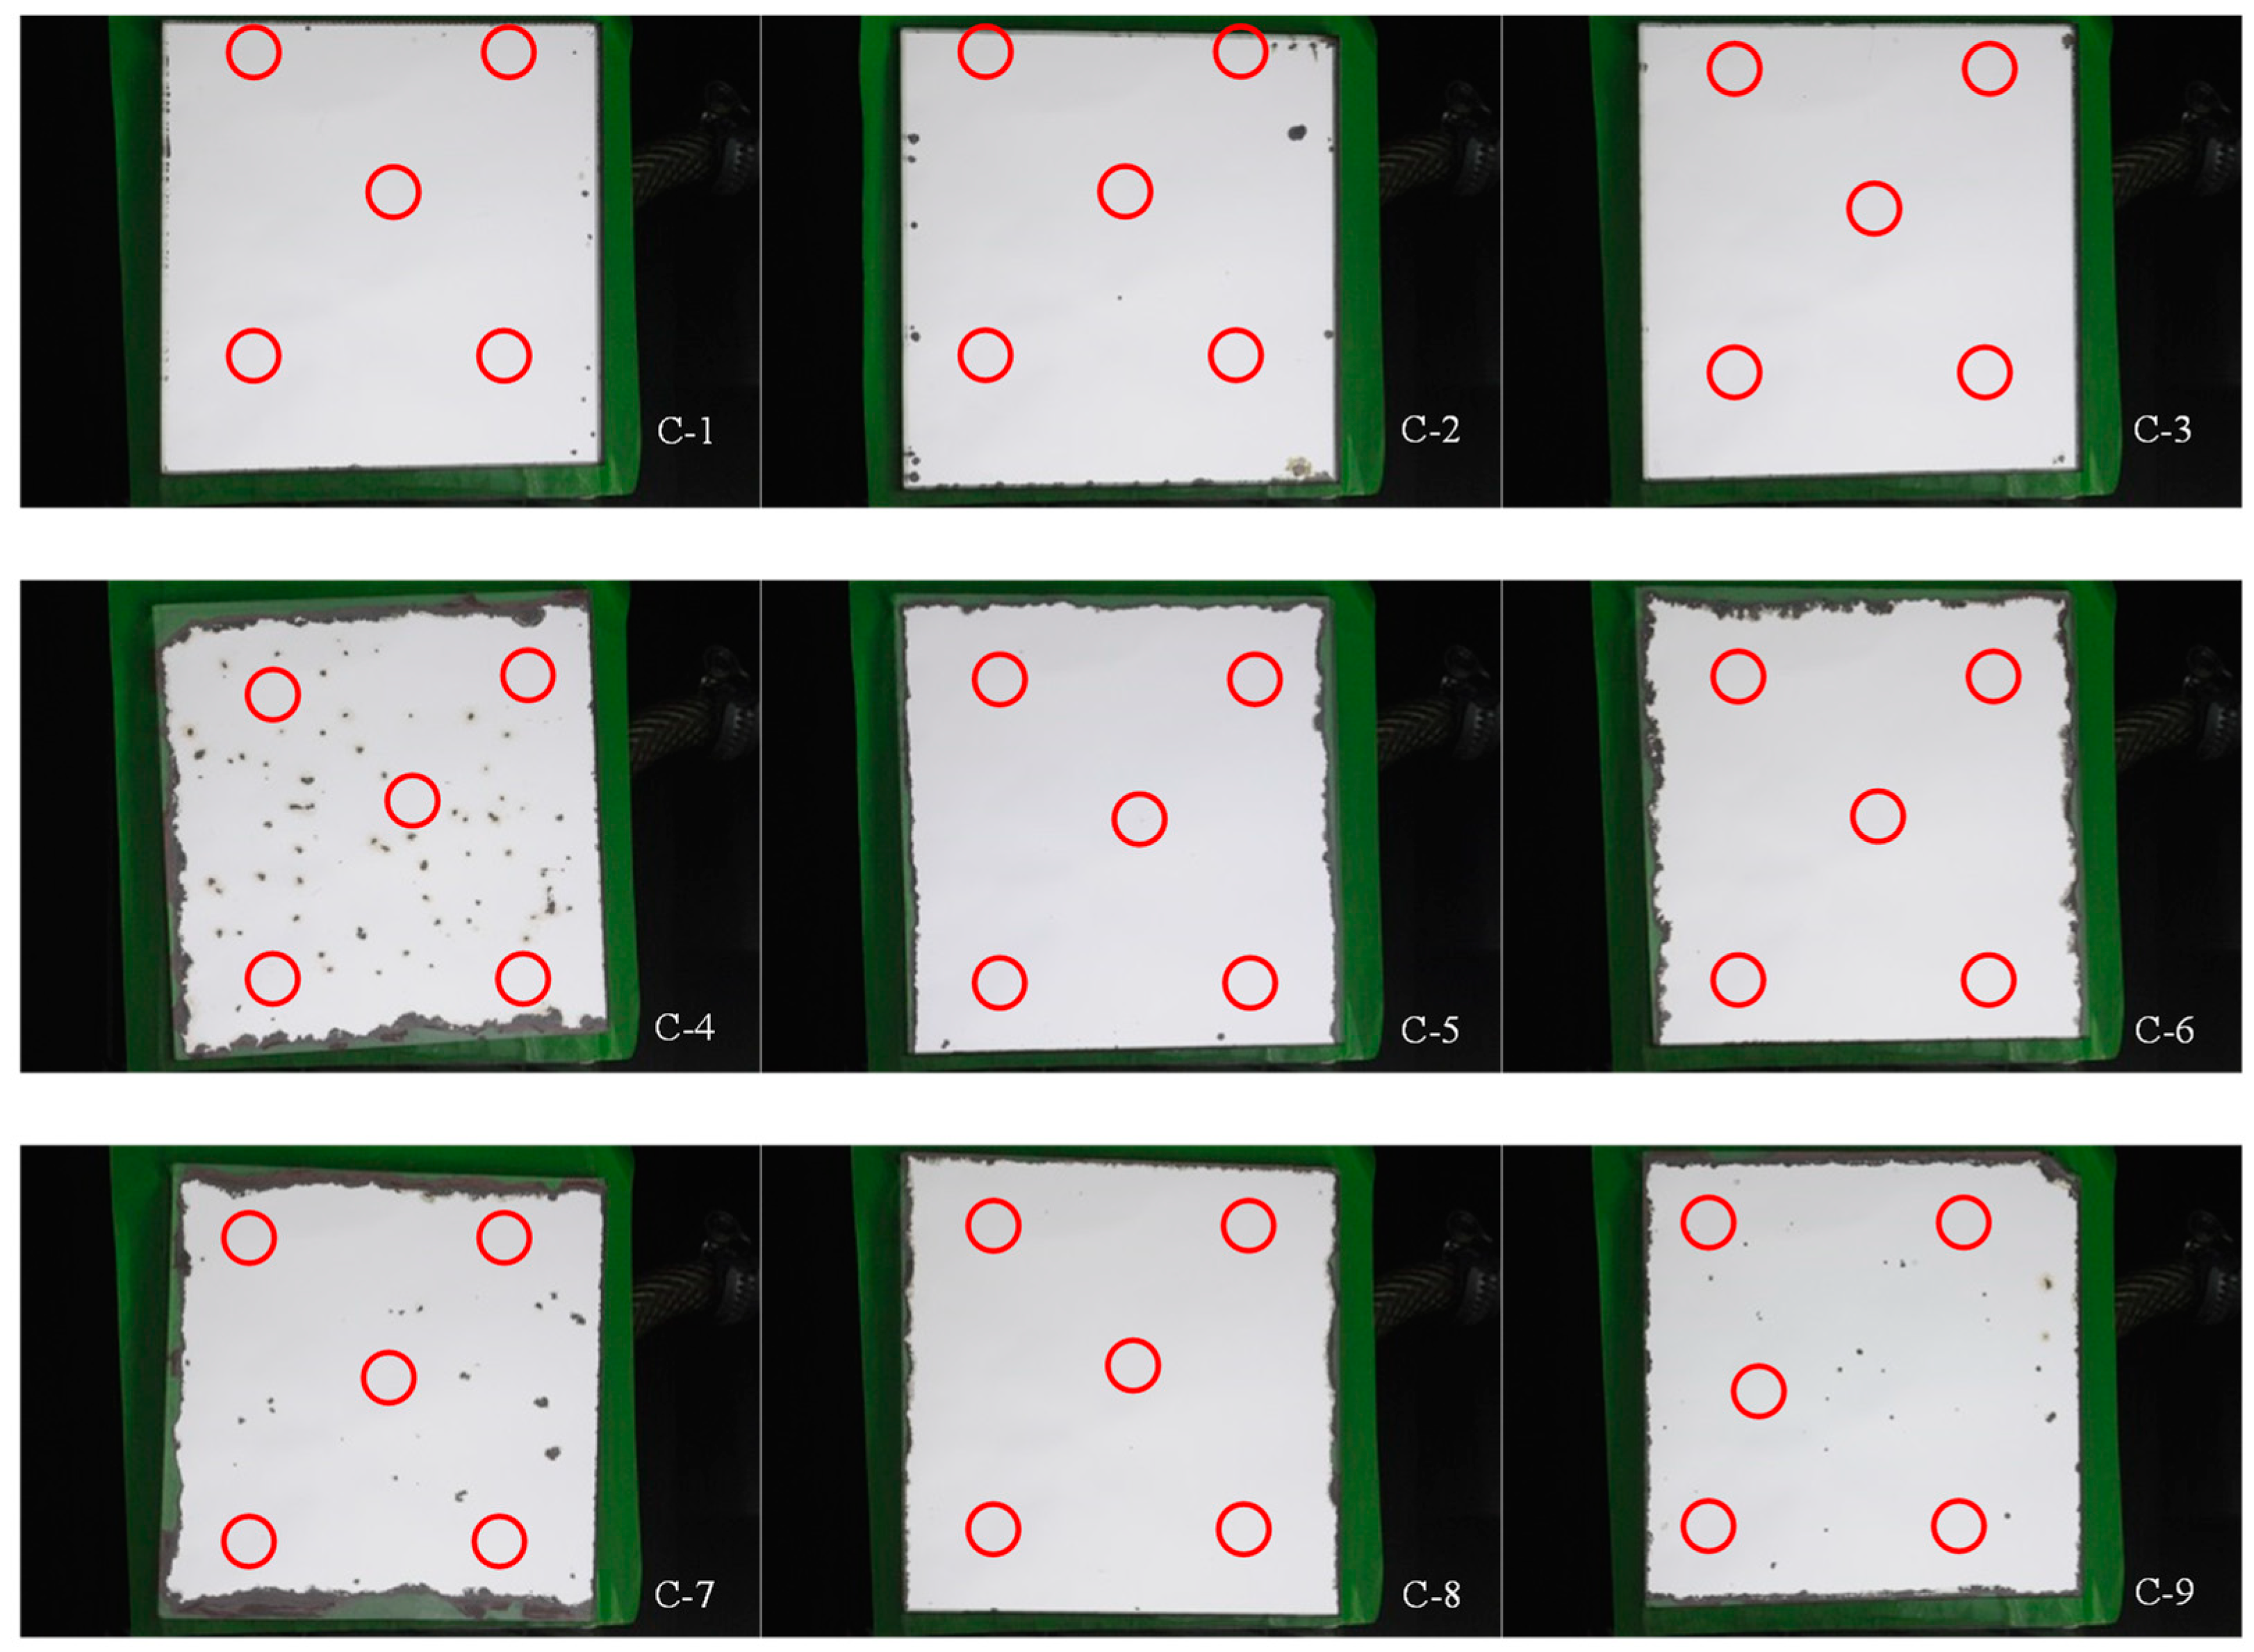
3.2.1. CASS Test
- The protection of the edges is essential to improve the durability of a reflector. As it is shown in the Table 5, the samples tested during the longest time obtained the lowest corrosion rate because all of the edges were protected.
- As for the number of paint layers, the samples C-4, C-5, C-6, and C-7 were tested during the same time (430 h). However, a great difference is observed among their corrosion rates, being higher for samples C-4 and C-7, which contain two paint layers instead of three. The same argument is used for samples tested during 330 h, where C-9 (two paint layers) has a corrosion rate twice as high as C-8 (three paint layers).
- Another parameter to consider in the evaluation of the corrosion rate is the testing time. As can be seen for samples with only one protected edge and the same number of paint layers, the corrosion rate increases with time. For example, this is the case of C-4 and C-7 against C-9 (both with two paint layers), where C-7 has higher corrosion rate due to the longer testing time.
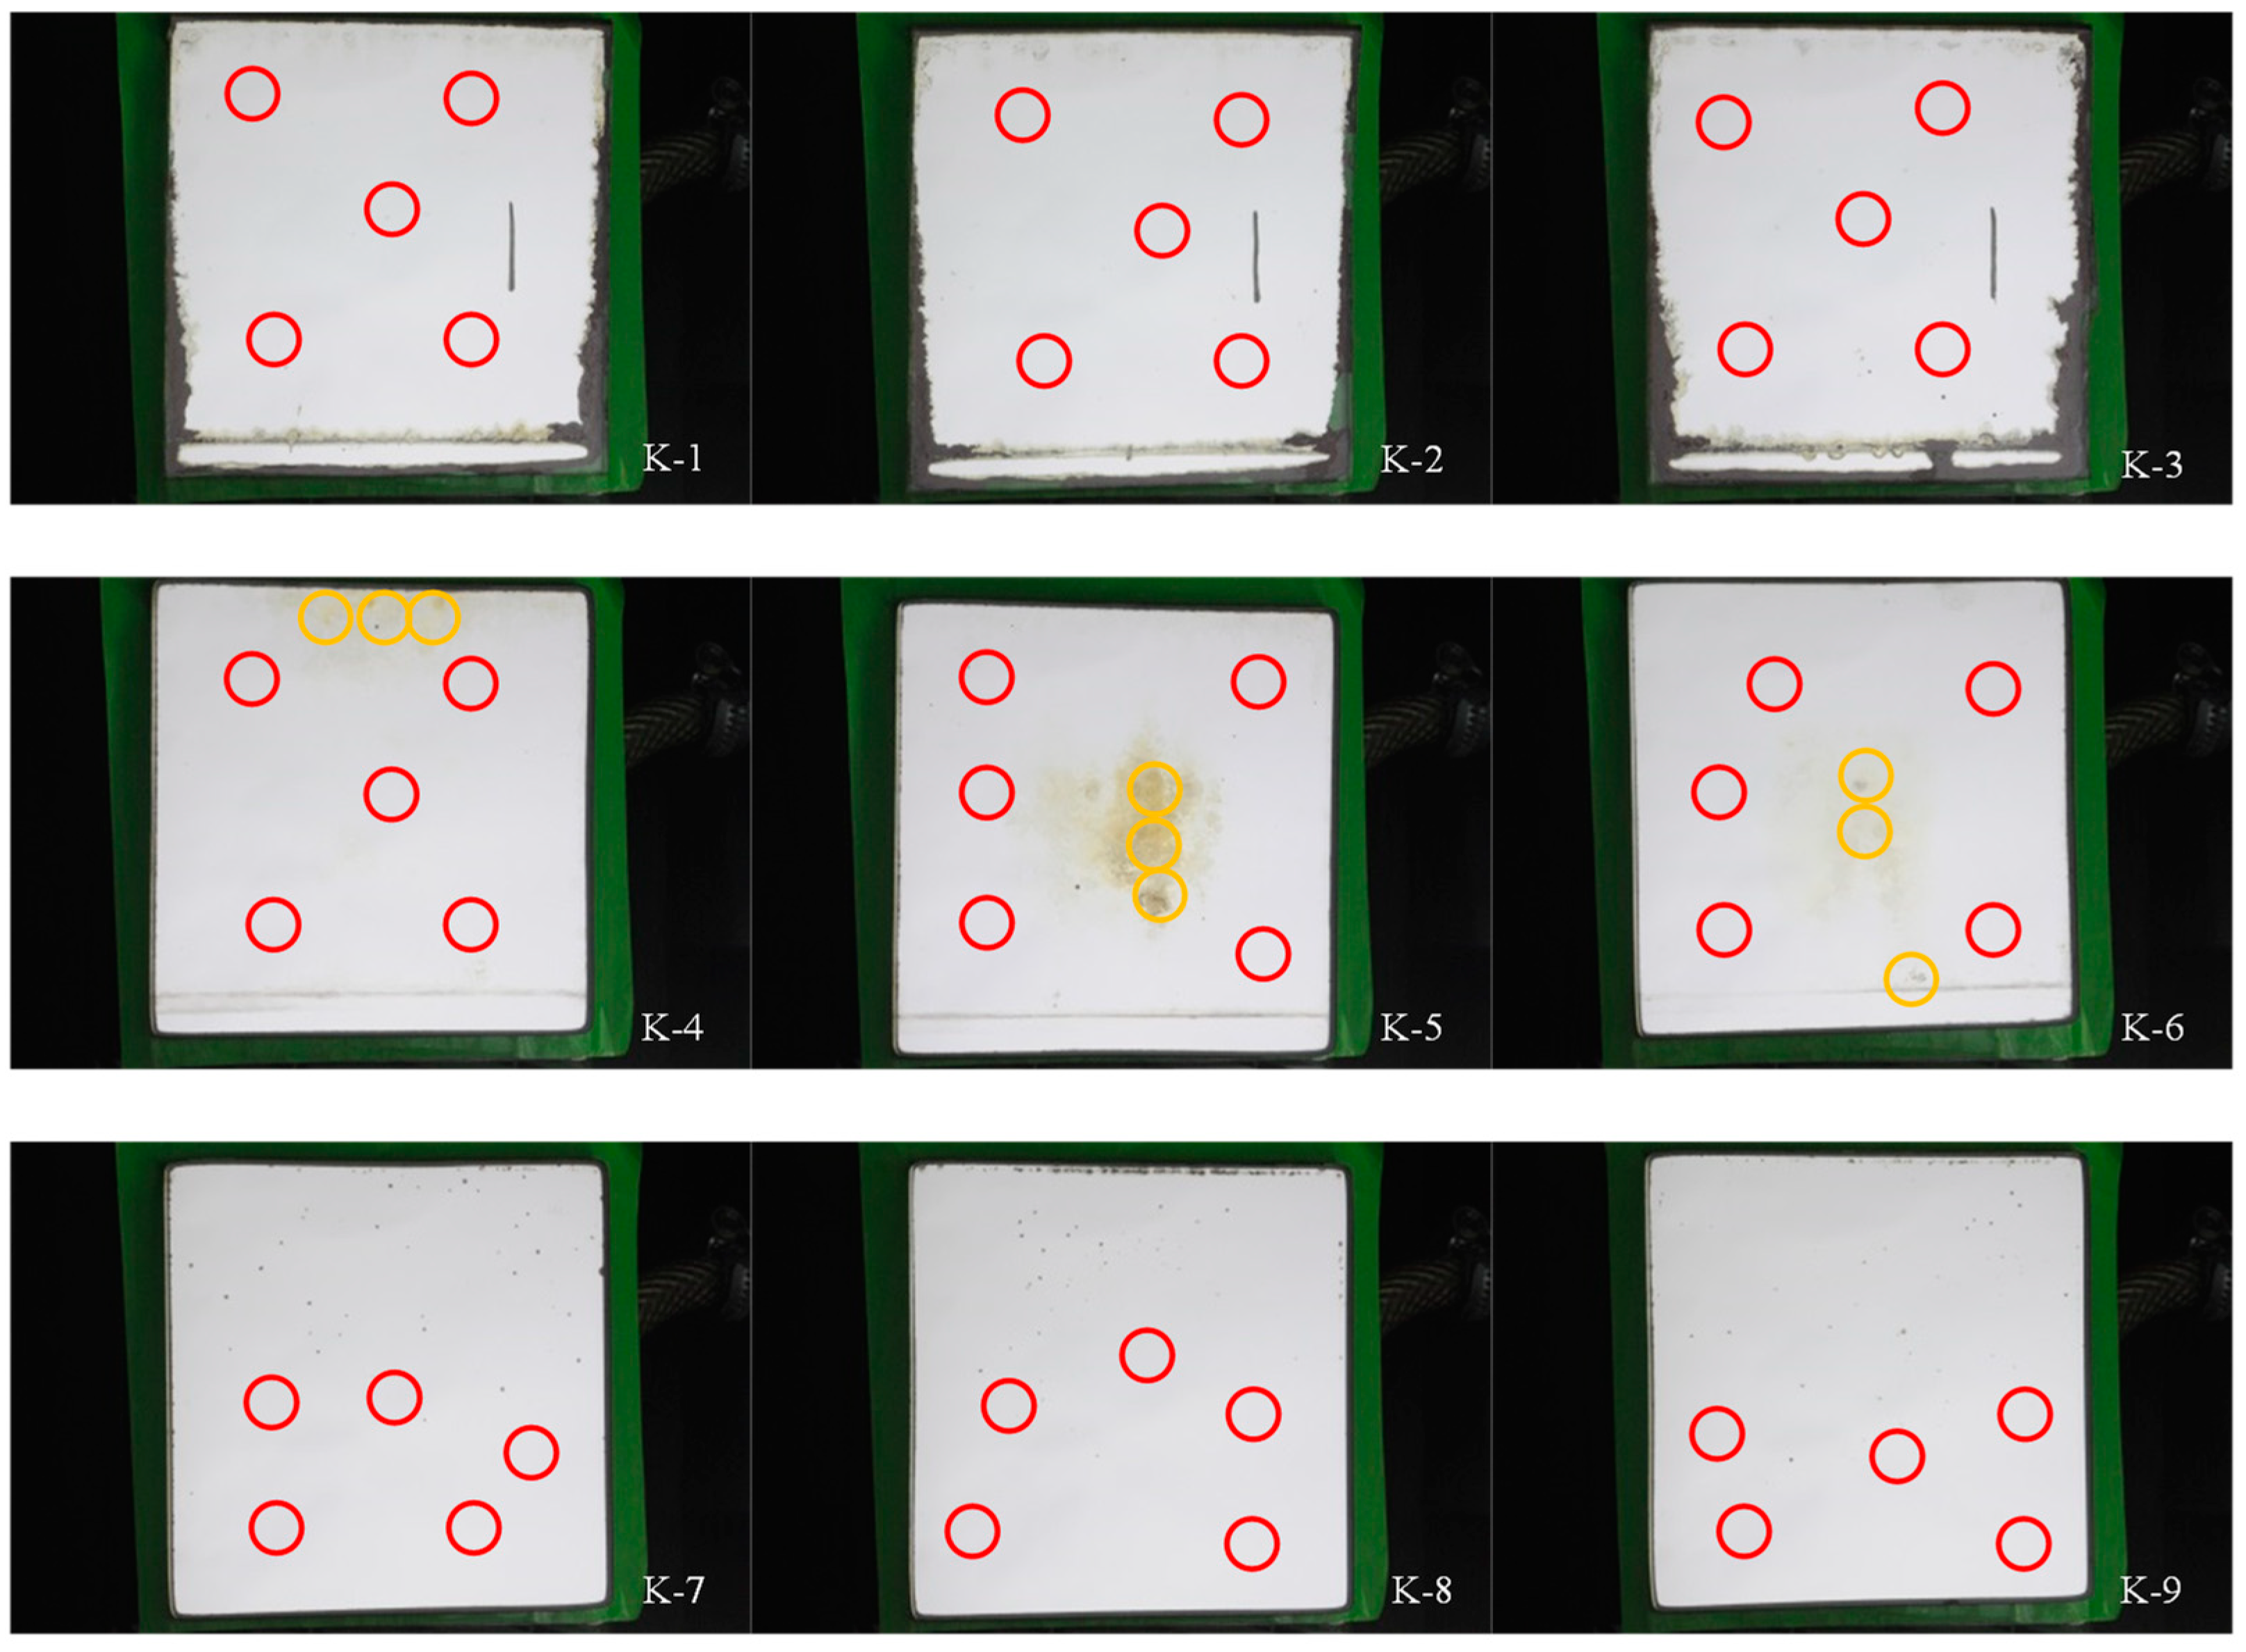
3.2.2. Kesternich Test
- As it was mentioned in the CASS results, the protection of the edges is a very important issue. This was also noticed in the Kesternich test because the three samples with only one protected edge (K-1, K-2, and K-3) showed the highest corrosion rates.
- With respect to the gas concentration, it was also noticed that the degradation is increased at the highest SO2 concentration (samples K-1, K-2, and K-3).
- Finally, the influence of the testing temperature can be analyzed by comparing samples tested at the same SO2 concentration (3333 ppm) but at different temperatures, i.e., samples K-4, K-5, and K-6 (tested at 50 °C) against samples K-7, K-8, and K-9 (tested at 25 °C). As can be observed, the corrosion rates are much higher for samples tested at the highest temperature. Consequently, the influence of the temperature is crucial in this test.
4. Conclusions
Author Contributions
Funding
Acknowledgments
Conflicts of Interest
References
- Tian, C.; Feng, G.; Li, S.; Xu, F. Scenario analysis on energy consumption and CO2 emissions reduction potential in building heating sector at community level. Sustainability 2019, 11, 5392. [Google Scholar] [CrossRef]
- Jäger-Waldau, A. Photovoltaics and renewable energies in Europe. Renew. Sustain. Energy Rev. 2007, 11, 1414–1437. [Google Scholar] [CrossRef]
- Montoya, F.G.; Aguilera, M.J.; Manzano-Agugliaro, F. Renewable energy production in Spain: A review. Renew. Sustain. Energy Rev. 2014, 33, 509–531. [Google Scholar] [CrossRef]
- Eldeen, H.; Aleem, A.; Andina, D.; Baldi, S.; Barone, M.; Bruno, M.; Daniel Carletti, D.; Carrillo, R.; Carvalho, M.; Souza, S. Advances in Renewab Energies and Power Technologies; Elsevier: Amsterdam, The Netherlands, 2018. [Google Scholar]
- Mohtasham, J. Review article-renewable energies. Energy Procedia 2015, 74, 1289–1297. [Google Scholar] [CrossRef]
- Solangi, K.H.; Islam, M.R.; Saidur, R.; Rahim, N.A.; Fayaz, H. A review on global solar energy policy. Renew. Sustain. Energy Rev. 2011, 15, 2149–2163. [Google Scholar] [CrossRef]
- Cooke, P. Green governance and green clusters: Regional & national policies for the climate change challenge of Central & Eastern Europe. J. Open Innov. Technol. Mark. Complex. 2015, 1, 1–17. [Google Scholar]
- Ummadisingu, A.; Soni, M.S. Concentrating solar power—Technology, potential and policy in India. Renew. Sustain. Energy Rev. 2011, 15, 5169–5175. [Google Scholar] [CrossRef]
- International Energy Agency. Renewables Information: Overview; IEA Stat: Paris, France, 2017; p. 3. [Google Scholar]
- García-Segura, A.; Fernández-García, A.; Buendía-Martínez, F.; Ariza, M.J.; Sutter, F.; Valenzuela, L. Durability studies of solar reflectors used in concentrating solar thermal technologies under corrosive sulfurous atmospheres. Sustainability 2018, 10, 3008. [Google Scholar] [CrossRef]
- International Energy Agency. Technology Roadmap—Solar Thermal Electricity; IEA Stat: Paris, France, 2014. [Google Scholar]
- Mills, D. Advances in solar thermal electricity technology. Sol. Energy 2004, 76, 19–31. [Google Scholar] [CrossRef]
- García-Segura, A.; Fernández-García, A.; Ariza, M.J.; Valenzuela, L.; Sutter, F. Durability studies of solar reflectors: A review. Renew. Sustain. Energy Rev. 2016, 62, 453–467. [Google Scholar] [CrossRef]
- Fernández-García, A.; Sutter, F.; Fernández-Reche, J.; Lüpfert, E. The Performance of Concentrating Solar Power (CSP) Systems—Modelling Measurement and Assessment; Elsevier: Amsterdam, The Netherlands, 2017; ISBN 978-0-08-100447-0. [Google Scholar]
- Fernández-García, A.; Sutter, F.; Montecchi, M.; Sallaberry, F.; Heimsath, A.; Heras, C.; Le Baron, E.; Soum-Glaude, A. Parameters and Method to Evaluate Reflectance Properties of Reflector Materials for Concentrating Solar Power Technology; Oficial Reflectance Guideline Version 3.0; SolarPACES: Almería, Spain, 2018. [Google Scholar]
- UNE 206016. Reflector Panels for Concentrating Solar Technologies; UNE: Madrid, Spain, 2018. [Google Scholar]
- Montecchi, M.; Delord, C.; Raccurt, O.; Disdier, A.; Sallaberry, F.; García de Jalón, A.; Fernández-García, A.; Meyen, S.; Happich, C.; Heimsath, A.; et al. Hemispherical reflectance results of the SolarPACES reflectance round robin. Energy Procedia 2015, 69, 1904–1907. [Google Scholar] [CrossRef]
- Fernández-García, A.; Sutter, F.; Heimsath, A.; Montecchi, M.; Sallaberry, F.; Peña-Lapuente, A.; Delord, C.; Martínez-Arcos, L.; Reche-Navarro, T.J.; Schmid, T.; et al. Simplified analysis of solar-weighted specular reflectance for mirrors with high specularity. AIP Conf. Proc. 2016, 1734, 130006. [Google Scholar]
- Calvo, R.; Cantero, D. A new high sensitivity and low cost solution for the measurement of reflectance loss due to dust deposition in solar collectors. In Proceedings of the SolarPACES 2013, International Conference on Concentrating Solar Power and Chemical Energy Systems, Las Vegas, NV, USA, 17–20 September 2013. [Google Scholar]
- Wolfertstetter, F.; Pottler, K.; Geuder, N.; Affolter, R.; Merrouni, A.A.; Mezrhab, A.; Pitz-Paal, R. Monitoring of mirror and sensor soling with TraCS for improved quality of ground based irradiance measurements. Energy Procedia 2014, 49, 2422–2432. [Google Scholar] [CrossRef]
- Bouaddi, S.; Ihlal, A.; Fernández-García, A. Soiled CSP solar reflectors modelling using dynamic linear models. Sol. Energy 2015, 122, 847–863. [Google Scholar] [CrossRef]
- Heimsath, A.; Nitz, P. The effect of soiling on the reflectance of solar reflector materials—Model for prediction of incidence angle dependent reflectance and attenuation due to dust deposition. Sol. Energy Mater. Sol. Cells 2019, 195, 258–268. [Google Scholar] [CrossRef]
- Sutter, F.; Meyen, S.; Heller, P.; Pitz-Paal, R. Development of a spatially resolved reflectometer to monitor corrosion of solar reflectors. Opt. Mater. 2013, 35, 1600–1609. [Google Scholar] [CrossRef]
- Sutter, F.; Meyen, S.; Fernández-García, A.; Heller, P. Spectral characterization of specular reflectance of solar mirrors. Sol. Energy Mater. Sol. Cells 2016, 145, 248–254. [Google Scholar] [CrossRef]
- Montecchi, M. Upgrading of ENEA solar mirror qualification set-up. Energy Procedia 2014, 49, 2154–2161. [Google Scholar] [CrossRef][Green Version]
- Heimsath, A.; Schmid, T.; Nitz, P. Angle resolved specular reflectance measured with VLABS. Energy Procedia 2015, 69, 1895–1903. [Google Scholar] [CrossRef]
- Sutter, F.; Fernández-García, A.; Heimsath, A.; Montecchi, M.; Pelayo, C. Advanced measurement techniques to characterize the near-specular reflectance of solar mirrors. AIP Conf. Proc. 2019, 2126, 110003. [Google Scholar]
- ISO 9050. Glass in Building, Determination of Light Transmittance, Solar Direct Transmittance, Total Solar Energy Transmittance, Ultraviolet Transmittance and Related Glazing Factors; International Organization for Standardization: Geneva, Switzerland, 2003. [Google Scholar]
- ASTM G173-03. Standard Tables for Reference Solar Spectral Irradiances: Direct Normal and Hemispherical on 37° Tilted Surface; ASTM: West Conshohocken, PA, USA, 2003. [Google Scholar]
- Sutter, F.; Fernández-García, A.; Heller, P.; Anderson, K.; Wilson, G.; Schumücker, M.; Marvig, P. Durability testing of silvered-glass mirrors. Energy Procedia 2015, 69, 1568–1577. [Google Scholar] [CrossRef]
- García-Segura, A.; Fernández-García, A.; Ariza, M.J.; Sutter, F.; Diamantino, T.; Martínez-Arcos, L.; Reche-Navarro, T.J.; Valenzuela, L. Influence of gaseous pollutants and their synergistic effects on the aging of reflector materials for concentrating solar thermal technologies. Sol. Energy Mater. Sol. Cells 2019, 200, 109955. [Google Scholar] [CrossRef]
- García-Segura, A.; Fernández-García, A.; Ariza, M.J.; Sutter, F.; Valenzuela, L. Effects of reduced sulphur atmospheres on reflector materials for concentrating solar thermal applications. Corros. Sci. 2018, 133, 78–93. [Google Scholar] [CrossRef]
- Kennedy, C.E.; Terwilliger, K. Optical durability of candidate solar reflectors. J. Sol. Energy Eng. 2005, 127, 262–269. [Google Scholar] [CrossRef]
- Sutter, F.; Fernández-García, A.; Wette, J.; Heller, P. Comparison and evaluation of accelerated aging tests for reflectors. Energy Procedia 2014, 49, 1718–1727. [Google Scholar] [CrossRef]
- Sansom, C.; Fernández-García, A.; King, P.; Sutter, F.; Garcia Segura, A. Reflectometer comparison for assessment of back-silvered glass solar mirrors. Sol. Energy 2017, 155, 496–505. [Google Scholar] [CrossRef]
- Pettit, R.B. Characterizing Solar Mirror Materials Using Portable Reflectometers; Sandia National Laboratories: Albuquerque, NM, USA, 1982. [Google Scholar]
- Fernández-García, A.; Sutter, F.; Martínez-Arcos, L.; Sansom, C.; Wolfertstetter, F.; Delord, C. Equipment and methods for measuring reflectance of concentrating solar reflector materials. Sol. Energy Mater. Sol. Cells 2017, 167, 28–52. [Google Scholar] [CrossRef]
- Wiesinger, F.; Sutter, F.; Fernández-García, A.; Reinhold, J.; Pitz-Paal, R. Sand erosion on solar reflectors: Accelerated simulation and comparison with field data. Sol. Energy Mater. Sol. Cells 2016, 145, 303–3013. [Google Scholar] [CrossRef]
- Bouaddi, S.; Ihlal, A.; Fernández-García, A. Comparative analysis of soiling of CSP mirror materials in arid zones. Renew. Energy 2017, 101, 437–449. [Google Scholar] [CrossRef]


| Sample Code | Number of Protected Edges | Number of Back Paint Layers | Thickness of the Back Paint Layers (μm) | Initial ρλ,φ (–) | Initial ρs,h (–) |
|---|---|---|---|---|---|
| C-1 | 4 | 3 | 32-40-30 | 0.964 | 0.951 |
| C-2 | 4 | 3 | 32-40-30 | 0.964 | 0.951 |
| C-3 | 4 | 3 | 32-40-30 | 0.964 | 0.953 |
| C-4 | 1 | 2 | 30-30 | 0.967 | 0.955 |
| C-5 | 1 | 3 | 28-35-35 | 0.961 | 0.951 |
| C-6 | 1 | 3 | 28-35-35 | 0.964 | 0.951 |
| C-7 | 1 | 2 | 30-30 | 0.966 | 0.955 |
| C-8 | 1 | 3 | 28-35-35 | 0.961 | 0.951 |
| C-9 | 1 | 2 | 30-30 | 0.965 | 0.954 |
| K-1 | 1 | 3 | 28-37-37 | 0.954 | 0.945 |
| K-2 | 1 | 3 | 28-37-37 | 0.956 | 0.944 |
| K-3 | 1 | 3 | 28-37-37 | 0.956 | 0.944 |
| K-4 | 4 | 3 | 28-37-37 | 0.957 | 0.944 |
| K-5 | 4 | 3 | 28-37-37 | 0.957 | 0.943 |
| K-6 | 4 | 3 | 28-37-37 | 0.958 | 0.945 |
| K-7 | 4 | 3 | 28-37-37 | 0.959 | 0.944 |
| K-8 | 4 | 3 | 28-37-37 | 0.959 | 0.945 |
| K-9 | 4 | 3 | 28-37-37 | 0.958 | 0.943 |
| Sample Code | Durability Test | Testing Conditions | Testing Time (h) |
|---|---|---|---|
| C-1, C-2, C-3 | CASS | T = 50 ± 2 °C, pH = [3.1, 3.3] at 25 °C Sprayed NaCl solution of 50 ± 5 g/L and 0.26 ± 0.02 g/L CuCl2 | 480 |
| C-4, C-5, C-6, C-7 | 430 | ||
| C-8, C-9 | 330 | ||
| K-1, K-2, K-3 | Kesternich | T = 40 °C, RH = 100% [SO2] gas = 6667 ppm | 910 |
| K-4, K-5, K-6 | T = 50 °C, RH = 100% [SO2] gas= 3333 ppm | 768 | |
| K-7, K-8, K-9 | T = 25 °C, RH = 100% [SO2] gas = 3333 ppm | 720 |
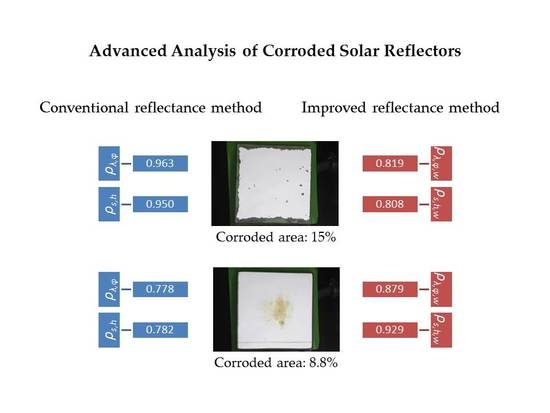
| Sample Code | Corroded Area (%) | Monochromatic Specular Reflectance | Solar Hemispherical Reflectance | ||||||||||
|---|---|---|---|---|---|---|---|---|---|---|---|---|---|
| Conventional Reflectance Method | Improved Reflectance Method | Conventional Reflectance Method | Improved Reflectance Method | ||||||||||
| ρλ,φ (–) | ρλ,φ,NC (–) | ρλ,φ,w (–) | ρs,h (−) | ρs,h,NC (−) | ρs,h,w (−) | ||||||||
| σ | σ | σ | σ | σ | σ | ||||||||
| C-1 | 0.30 | 0.964 | 0.001 | 0.963 | 0.001 | 0.960 | 0.001 | 0.950 | 0.000 | 0.951 | 0.001 | 0.948 | 0.001 |
| C-2 | 1.42 | 0.963 | 0.001 | 0.962 | 0.000 | 0.949 | 0.000 | 0.949 | 0.004 | 0.951 | 0.000 | 0.937 | 0.000 |
| C-3 | 0.11 | 0.964 | 0.001 | 0.964 | 0.001 | 0.963 | 0.001 | 0.952 | 0.000 | 0.952 | 0.000 | 0.951 | 0.000 |
| C-4 | 13.00 | 0.921 | 0.040 | 0.945 | 0.012 | 0.822 | 0.010 | 0.931 | 0.008 | 0.935 | 0.007 | 0.813 | 0.006 |
| C-5 | 7.72 | 0.960 | 0.002 | 0.959 | 0.000 | 0.886 | 0.000 | 0.951 | 0.000 | 0.951 | 0.000 | 0.878 | 0.000 |
| C-6 | 9.45 | 0.963 | 0.001 | 0.964 | 0.000 | 0.873 | 0.000 | 0.951 | 0.002 | 0.951 | 0.001 | 0.861 | 0.001 |
| C-7 | 15.00 | 0.963 | 0.001 | 0.963 | 0.000 | 0.819 | 0.000 | 0.950 | 0.001 | 0.951 | 0.000 | 0.808 | 0.000 |
| C-8 | 3.80 | 0.959 | 0.003 | 0.959 | 0.002 | 0.922 | 0.002 | 0.949 | 0.000 | 0.949 | 0.000 | 0.913 | 0.000 |
| C-9 | 7.00 | 0.959 | 0.003 | 0.964 | 0.001 | 0.892 | 0.001 | 0.943 | 0.000 | 0.949 | 0.000 | 0.883 | 0.000 |
| Sample Code | Corroded Area (%) | Monochromatic Specular Reflectance | Solar Hemispherical Reflectance | ||||||||||
|---|---|---|---|---|---|---|---|---|---|---|---|---|---|
| Conventional Reflectance Method | Improved Reflectance Method | Conventional Reflectance Method | Improved Reflectance Method | ||||||||||
| ρλ,φ (–) | ρλ,φ,NC (–) | ρλ,φ,w (–) | ρs,h (–) | ρs,h,NC (–) | ρs,h,w (–) | ||||||||
| σ | σ | σ | σ | σ | σ | ||||||||
| K-1 | 9.00 | 0.954 | 0.001 | 0.954 | 0.001 | 0.869 | 0.001 | 0.945 | 0.000 | 0.943 | 0.000 | 0.858 | 0.000 |
| K-2 | 9.58 | 0.951 | 0.003 | 0.953 | 0.001 | 0.862 | 0.001 | 0.944 | 0.000 | 0.942 | 0.000 | 0.852 | 0.000 |
| K-3 | 12.78 | 0.954 | 0.002 | 0.955 | 0.001 | 0.833 | 0.001 | 0.944 | 0.001 | 0.942 | 0.000 | 0.822 | 0.000 |
| K-4 | 4.32 | 0.955 | 0.003 | 0.957 | 0.002 | 0.952 | 0.002 | 0.944 | 0.000 | 0.941 | 0.001 | 0.938 | 0.001 |
| K-5 | 8.82 | 0.778 | 0.300 | 0.932 | 0.030 | 0.879 | 0.027 | 0.782 | 0.020 | 0.939 | 0.004 | 0.929 | 0.004 |
| K-6 | 7.02 | 0.929 | 0.040 | 0.960 | 0.003 | 0.953 | 0.003 | 0.887 | 0.010 | 0.943 | 0.002 | 0.938 | 0.002 |
| K-7 | 0.37 | 0.954 | 0.002 | 0.957 | 0.001 | 0.953 | 0.001 | 0.945 | 0.000 | 0.945 | 0.000 | 0.942 | 0.000 |
| K-8 | 0.95 | 0.954 | 0.002 | 0.955 | 0.001 | 0.946 | 0.001 | 0.944 | 0.000 | 0.945 | 0.000 | 0.936 | 0.000 |
| K-9 | 0.43 | 0.954 | 0.001 | 0.956 | 0.000 | 0.951 | 0.000 | 0.942 | 0.001 | 0.944 | 0.000 | 0.940 | 0.000 |
| Sample Code | C-1 | C-2 | C-3 | C-4 | C-5 | C-6 | C-7 | C-8 | C-9 |
| Corrosion Rate (cm2/h) | 0.0006 | 0.003 | 0.0002 | 0.0300 | 0.0220 | 0.0200 | 0.0500 | 0.012 | 0.0210 |
| Sample Code | K-1 | K-2 | K-3 | K-4 | K-5 | K-6 | K-7 | K-8 | K-9 |
| Corrosion Rate (cm2/h) | 0.010 | 0.010 | 0.014 | 0.005 | 0.010 | 0.009 | 0.001 | 0.001 | 0.001 |
© 2019 by the authors. Licensee MDPI, Basel, Switzerland. This article is an open access article distributed under the terms and conditions of the Creative Commons Attribution (CC BY) license (http://creativecommons.org/licenses/by/4.0/).
Share and Cite
Buendía-Martínez, F.; Fernández-García, A.; Sutter, F.; Valenzuela, L.; García-Segura, A. Advanced Analysis of Corroded Solar Reflectors. Coatings 2019, 9, 749. https://doi.org/10.3390/coatings9110749
Buendía-Martínez F, Fernández-García A, Sutter F, Valenzuela L, García-Segura A. Advanced Analysis of Corroded Solar Reflectors. Coatings. 2019; 9(11):749. https://doi.org/10.3390/coatings9110749
Chicago/Turabian StyleBuendía-Martínez, Francisco, Aránzazu Fernández-García, Florian Sutter, Loreto Valenzuela, and Alejandro García-Segura. 2019. "Advanced Analysis of Corroded Solar Reflectors" Coatings 9, no. 11: 749. https://doi.org/10.3390/coatings9110749
APA StyleBuendía-Martínez, F., Fernández-García, A., Sutter, F., Valenzuela, L., & García-Segura, A. (2019). Advanced Analysis of Corroded Solar Reflectors. Coatings, 9(11), 749. https://doi.org/10.3390/coatings9110749