Article

Thermal Fatigue Failure Behavior of Surface/Interface of Plasma Cladding Layer

1
National-Local Joint Engineering Laboratory of Intelligent Manufacturing Oriented Automobile Die & Mould, Tianjin University of Technology and Education, Tianjin 300222, China
2
Institute of Surface/Interface Science and Technology, Key Laboratory of Superlight Material and Surface Technology of Ministry of Education, College of Material Science and Chemical Engineering, Harbin Engineering University, Harbin 150001, China
*
Author to whom correspondence should be addressed.
Coatings 2019, 9(10), 646; https://doi.org/10.3390/coatings9100646
Submission received: 16 September 2019 / Revised: 27 September 2019 / Accepted: 3 October 2019 / Published: 6 October 2019

Abstract

:
Co-based coating was prepared by plasma cladding on FV520B substrates. Microstructure of the coatings was observed by scanning electron microscope. Finite element simulation as a predictive method to research the stress distributed after thermal cycling. Thermal fatigue resistance of the coating-substrate was evaluated at temperature of 600 °C, 700 °C, 800 °C, and 900 °C. Results indicate that the surface/interface structure has excellent thermal fatigue resistance at 600 °C, and the thermal fatigue crack initiated near the interface and extended along the grain boundary. The difference of expansion coefficient of the coating and substrate is small near 600 °C, and the difference increased when the temperature climbed above 600 °C. The diffuse elements could be found near the interface after the thermal cycle, and the dislocations and precipitated phase were observed.

1. Introduction

Protective methods in the surface engineering field have an enormous application to fabricate excellent abrasion performance, high strength, high hardness, and excellent corrosion resistance coatings [1,2,3,4,5,6,7]. The plasma cladding technique is one of the most common methods for surface repair and enhancement. Compared with spraying and brush plating, plasma cladding possesses a superior metallurgical bonding between the cladding layer and substrate, and plasma cladding has a lower cost and higher efficiency than laser cladding [8,9,10]. Given its characteristics, plasma cladding has been widely applied to variable temperature environments [11,12,13]. It is well known that temperature variation will give rise to thermal fatigue failure, therefore the fatigue failure will be our concern.
With the rapid development of modern industry, the thermal fatigue strength of components and parts that serve at high temperature and high load has become an important criterion to estimate the properties of coatings [14,15]. The thermal fatigue means that the free expansion or contraction of material is restrained, caused by the temperature variation. While the temperature changes repeatedly, the thermal stress also repeatedly changes, so the material will be damaged [16]. The critical components of many mechanical devices are bound to experience temperature variation (temperature cycle) during service. In these tough service conditions, surface damage or thermal fatigue cracking in the form of abrasion, erosion, corrosion, and heat-checking can be observed [17,18,19,20]. Thermal fatigue failure is one of the main reasons for the damage of parts, thus leading to time waste and economic loss.
At present, many outstanding achievements have been achieved in surface abrasion resistance, corrosion resistance, and oxidation resistance in the areas of surface cladding [21,22], but there have been few reports on the thermal fatigue behavior of plasma cladding layer, which leads to an insufficient understanding of the fatigue failure mechanism. Therefore, it is necessary to study the thermal fatigue behavior of plasma cladding such as the compatibility of the heterogeneous combination (coating and material), failure crack growth, and microstructure evolution before and after fatigue failure.
This paper took the large compressor rotor shaft and blade as the research object, and the actual application temperature of the compressor rotor shaft and blade was near 600 °C. This paper aimed to evaluate the thermal matching ability of the coating and substrate, and explore the thermal fatigue behavior of the plasma cladding.

2. Materials and Methods

2.1. Materials and Plasma Cladding Processing

FV520B was employed as the raw material of the substrate. Before the experiment, the FV520B material was split in 100 mm × 100 mm × 10 mm specimens and cleaned through mechanical means. Co50 composite powder served as the cladding powder after drying for two hours at 120 °C. The coating was prepared by a plasma cladding system with a provision for a synchronous delivering powder device. The current of the plasma cladding was 100 A, and the scanning velocity was 3 mm/s.

2.2. Tests

The microstructure of the plasma cladding layer was observed with a scanning electron microscope (SEM). The thermal fatigue test was conducted in a muffle furnace according to the standard (HB6660-1992). The samples were put into the muffle furnace for holding for 3 minutes at the specified temperature, and then put again into the muffle furnace, followed by cooling to room temperature by water (20 ± 5 °C). This process was repeated until a crack formed and the cycle times were recorded. The fracture morphology was observed using a SteREO Discovery V12 (ZEISS) stereomicroscope and the precision of the tool microscope was not lower than 0.01 mm. The coefficient of expansion test was performed by a DIL805L (Baehr-Thermo) thermal expansion instrument, and the size of the test part was φ4 × 10 mm. Finite element modeling was implemented using ABAQUS software in order to investigate the stress distribution after the thermal cycle process. Some basic assumptions are needed in finite element analysis regarding the thermal fatigue process: the initial temperature of the material and cooling medium are constant; the material is isotropous; and the density of the material is constant. The entity module grid was divided to obtain the exact result, and then the Hex unit grid was obtained, so that the computational cycles can be decreased and the calculation accuracy improved. Eight-node hexahedral elements were selected as the unit type of the finite element modeling. The boundary condition was convection and radiative mixed heat transfer. An electron probe micro-analyzer (EPMA, JXA-8230) was used to further study the relationship between the distribution of the elements and thermal fatigue properties. A JEM-2100 transmission electron microscope (TEM) was used to explore the change in microstructure before and after the thermal cycle.

3. Results and Discussions

3.1. Scanning Electron Microscope and Energy Disperse Spectroscopy Analysis

Figure 1a shows the morphology of the coating, substrate, and interface. The results show that the coating had a dense microstructure, and metallurgically combined with the substrate. Figure 1b shows the energy Disperse Spectroscopy results of the interface position between the substrate and the cladding layer in Figure 1a, and the results show that the interface consisted of several elements such as Fe, Co, Cr, and Ni. The diffusion of the elements can be seen through the EDS analysis of the coating and substrate. Fe spread to the interface from the substrate, the Co and Cr diffused from the coating to the interface as shown in Figure 1c, and the line scanning results showed that there was no conspicuous element diffusion through the interface.

3.2. Prediction of Finite Element Simulation

Finite element simulation served as a prediction method for the failure mode before the test. Figure 2 shows that the maximum stress was distributed near the interface after the thermal cycling simulation. The stress decayed rapidly as it moved away from the interface. The stress distribution status of the inner parts under thermal cycling conditions is shown in Figure 2b, and the maximum stress distribution was observed near the interface from the finite element model. All the simulated results conforms to the test results shown in Figure 2c. Therefore, the failure position of the thermal fatigue specimen will be located near the interface.

3.3. Thermal Fatigue Analysis

Figure 3 shows the thermal cycling times under different temperatures. The thermal cycling times of fatigue failure were 50, 80 and 320 at 900 °C, 800 °C and 700 °C, respectively. No cracks were found after 400 cycles at 600 °C, indicating the excellent thermal fatigue resistance of the composites at 600 °C.
Figure 4a presents the test sample subjected to 74 rounds of thermal cycling at 800 °C and Figure 4b shows the samples that experienced thermal cycling 82 times at 800 °C. It can be seen that each sample had a crack at the interface in Figure 4a,b, and the red circle represents the end of the crack. According to the width of the crack, it was identified that the crack originated from the interface. In order to further confirm that the crack originated in the interface, the fracture morphology was observed in Figure 4c. Figure 4c indicates the radial fracture morphology, and the radial source location corresponded to the location marked by the white circle in Figure 4d. In conclusion, the crack source located in the white circle revealed that the crack originated in the interface between the coating and substrate. The test result was in good agreement with the calculated stress distribution at the surface as shown in Figure 2. This showed better fitness between the numerical solutions and experimental results and also indicates the effectiveness of the analysis model.
Figure 5 shows the formation and propagation of the thermal fatigue crack at 800 °C. It is clear that the crack originated near the interface. There was obvious plastic deformation in the red area, which was caused by the phase transformation of the substrate, but there was no phase transformation in the coatings at 800 °C, so the uncoordinated deformation caused the formation of cracks near the interface. Repeated thermal cycles will cause great stress concentration, and then the stress concentration urges the interface to move from dotted yellow line 1 to solid yellow line 2. After the crack initiation, the repeated thermal cycle will continue to produce stress, so the crack will continue to expand to release the stress along the brittle coating (as shown in Figure 5).
Figure 6a,b show the crack propagation path in the coating. As shown in the enlarged figure, the crack tended to expand in the grain boundary rather than inside the grain. The crack extended along the grain boundary, indicating that the grain boundary was more brittle than that of the grain as brittleness is the condition of crack propagation. The nano-indentation test results shown in Figure 6c,d provide corresponding evidence for the brittleness problem of the grain and grain boundary. The nano-indentation hardness values of the grain boundary and grain interior were 10.592 Gpa and 5.375 Gpa, respectively. Due to the corresponding relationship between hardness and brittleness, the larger the hardness, the higher the brittleness of the material, and the hardness of the grain boundary position is much larger than that of the grain interior, so the brittleness of the grain boundary position is also much larger than that of the grain interior. Therefore, the crack can easily expand along the grain boundary of the coating because the grain boundary has a greater brittleness.

3.4. Coefficient of Expansion and Matching Ability Analysis

The expansion coefficients of the coating and substrate were tested to investigate the fracture reasons for the thermal fatigue failure and evaluate the matching ability under actual conditions.
The formula for calculating linear thermal expansi on rate ( Δ L i / L 0 ) is:
Δ L i   /   L 0 = ( L i L 0 ) / L 0
The formula to calculate average linear thermal expansion ( α m ) is:
α m = ( L i L 0 ) / [ L 0 × ( t i t 0 ) ] = ( Δ L i / L 0 ) / Δ t
Which L 0 and L i are the original lengths (mm) of the samples at t 0 and t i temperatures, respectively; and Δ L i is the length change from the start temperature to the test temperature. The discrepancy of the linear expansion coefficient causes the residual stress ( σ ) between the coating and substrate, and can be calculated by the following formula [23]:
σ = E Δ β Δ T 1 v
where E represents the elastic modulus of the cladding layer; Δ β is the gap of the expansion coefficient between the coating material and substrate material; Δ T is the difference between the room temperature and cladding temperature; and v represents Poisson’s ratio. According to the formula, while the expansion coefficient of the coating material is greater than the expansion coefficient of the substrate material, Δ β > 0, so σ > 0, and the stress is regarded as tensile stress. This stress is not suitable to protect the combination of the coating and substrate and causes cracks; in contrast, when Δ β < 0, σ < 0, and the stress is regarded as compressive stress. It is generally known that this kind of stress will reduce the cracking tendency. Therefore, the residual stress will be reduced when the cladding layer’s expansion coefficient is close to or even less than the substrate. To reduce the cracking tendency, it is crucial to match the physical parameters of the cladding layer and substrate.
Figure 7 shows the α m –t curve. The red curve and the black curve represent the expansion coefficient of cladding layer and substrate, respectively, and the blue line in the graph marks 600 °C. By interpreting the curves from Figure 7, the material continued to expand with increase in temperature and the size expansion was caused by the metal expanding on heating and contracting on cooling when it less than 600 °C, but with no phase change occurring. The small bifurcation of the wo curves demonstrates that the expansion coefficient of the cladding layer was close to that of the substrate at 600 °C.
According to the previous description, the matching ability is good if the cladding layer’s expansion coefficient is close to the substrate’s expansion coefficient. The discrepancy of the expansion coefficient between the plasma cladding layer and substrate material at 600, 700, 800 and 900 °C is obvious by examining the curve. The difference was smaller at 600 °C than at the other temperatures because the phase transition of the substrate material occurred when the temperature reached 700 °C, which resulted in great volume changes. Therefore, a large discrepancy of expansion coefficient between coating and substrate material led to the relatively inferior thermal fatigue resistance at 700, 800 and 900 °C. In other words, as a poor matching ability existed between the coating and the substrate at 700, 800 and 900 °C, the thermal fatigue resistance was worse than that at 600 °C.

3.5. Evolution Behavior of Elements and Microstructure

Electron probe microanalysis and transmission electron microscopy tests were carried out on samples subjected to 600 °C, 400 times in order to study the evolution of the element distribution and the microstructure before and after the thermal cycle. Figure 8 shows the EPMA results of the composite coating and substrate before and after the thermal fatigue experiment. Through a comparison of the EPMA results, it can be easily seen that the diffusion of iron was obvious from the substrate to the coating after the thermal cycle, as shown in Figure 8c,d. Diffusion can improve the matching ability, so to some extent, diffusion occurring between the substrate and coating is beneficial to performance. Cobalt was mainly located in the intragranular position, so the spread of cobalt mainly occurred from the intragranular position to the grain boundary in the coating, as shown in Figure 8e,f. Chromium was located in the grain boundary, as shown in Figure 8g, and then it diffused from the grain boundary to the intragranular position, while diffusing from the coating to the substrate after the thermal cycle, as shown in Figure 8h. The spread can reduce the gaps in the composition of heterogeneous materials, so it has a beneficial influence on the service materials. Figure 9 shows the TEM image of the coating before and after the thermal cycle. Dislocation and the black precipitate phase appeared after the thermal cycle. Th relevant literature shows that dislocation and the nano-precipitation phase will improve the strength–toughness properties and oxidation resistance, which will then improve the thermal fatigue property [15]. Therefore, the thermal fatigue resistance will be improved as the thermal cycle progresses.

4. Conclusions

A high quality metallurgical coating was obtained by plasma cladding. The main conclusions are as follows:
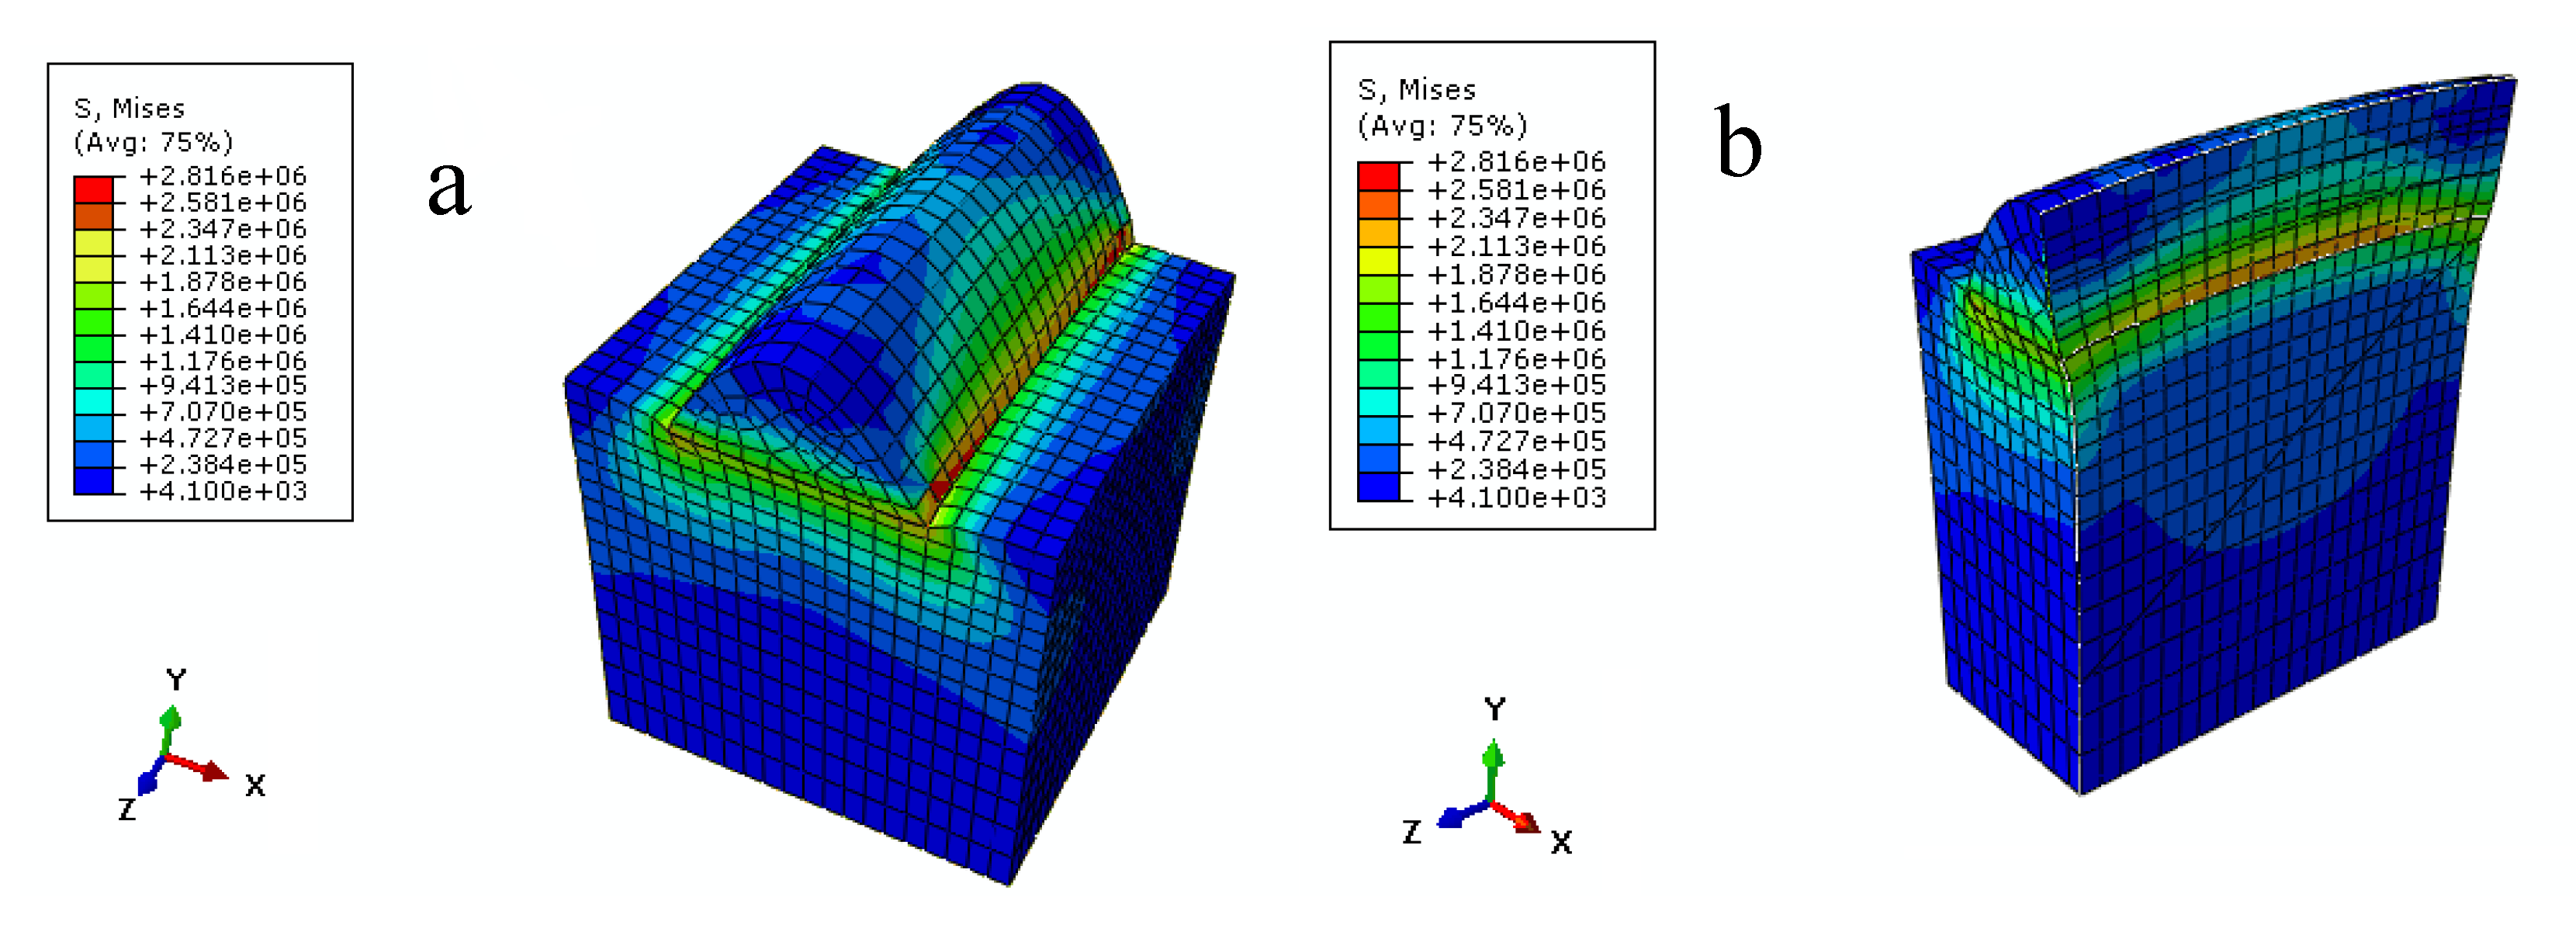
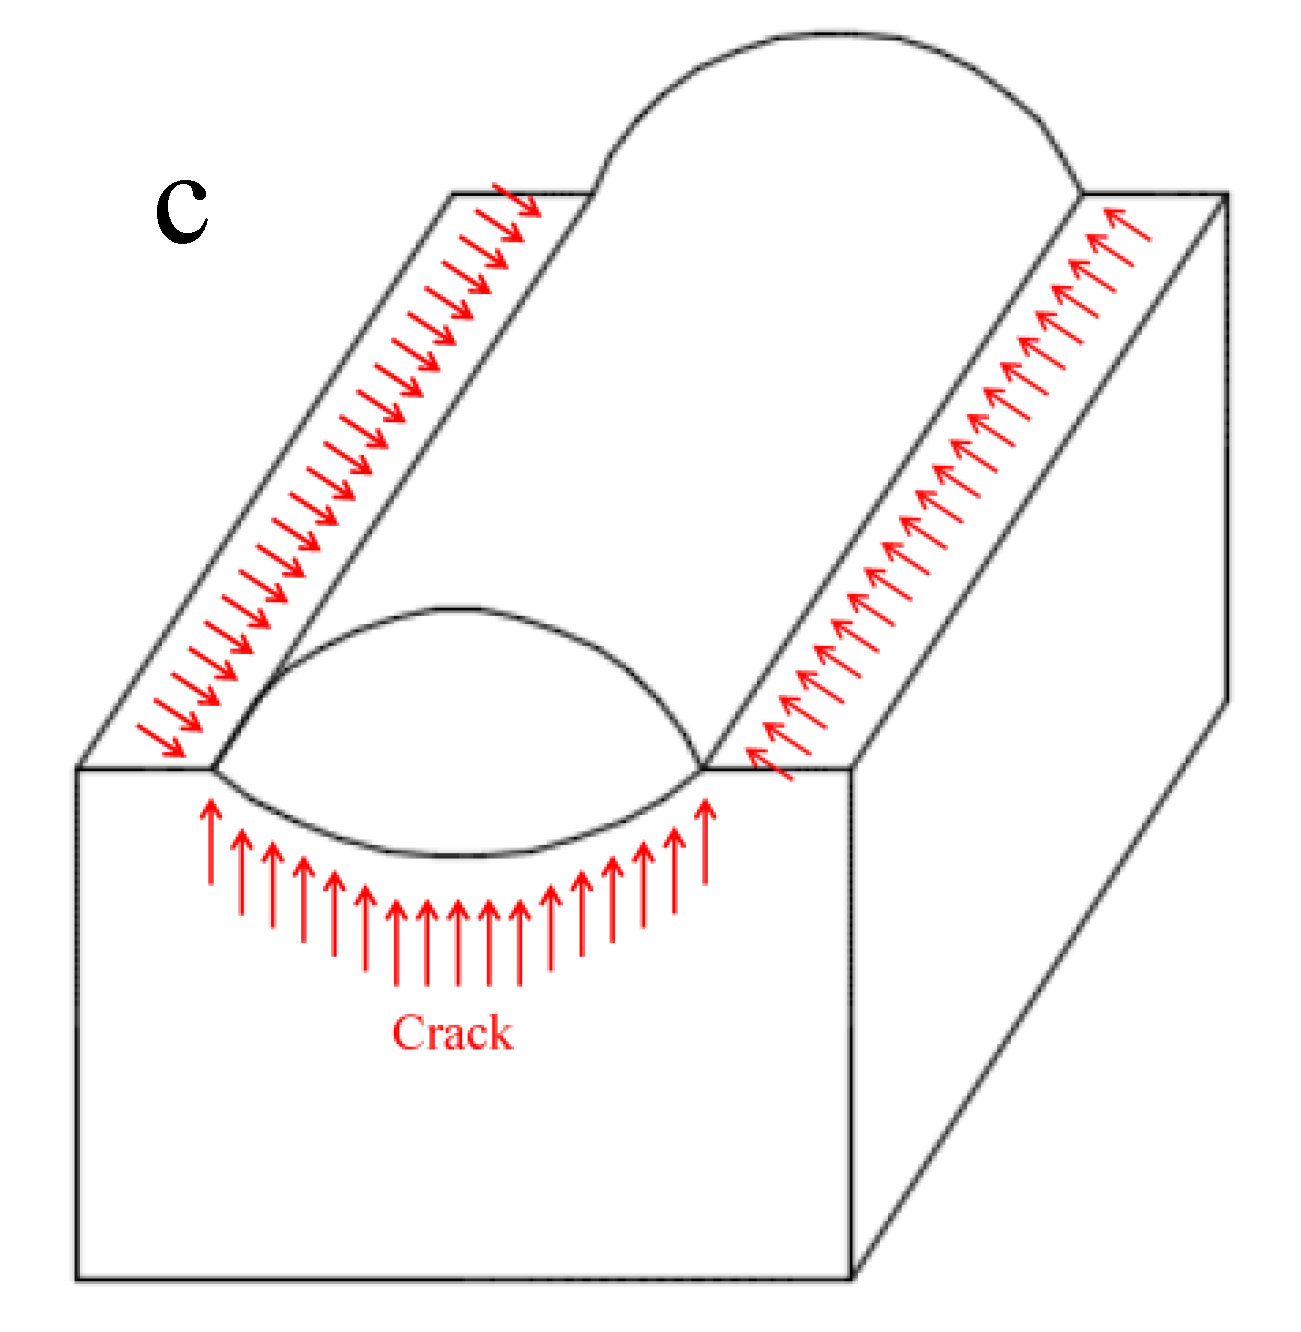
  • The maximum stress was distributed near the interface after the thermal cycling simulation. Stress decreased with the distance increasing from the interface.
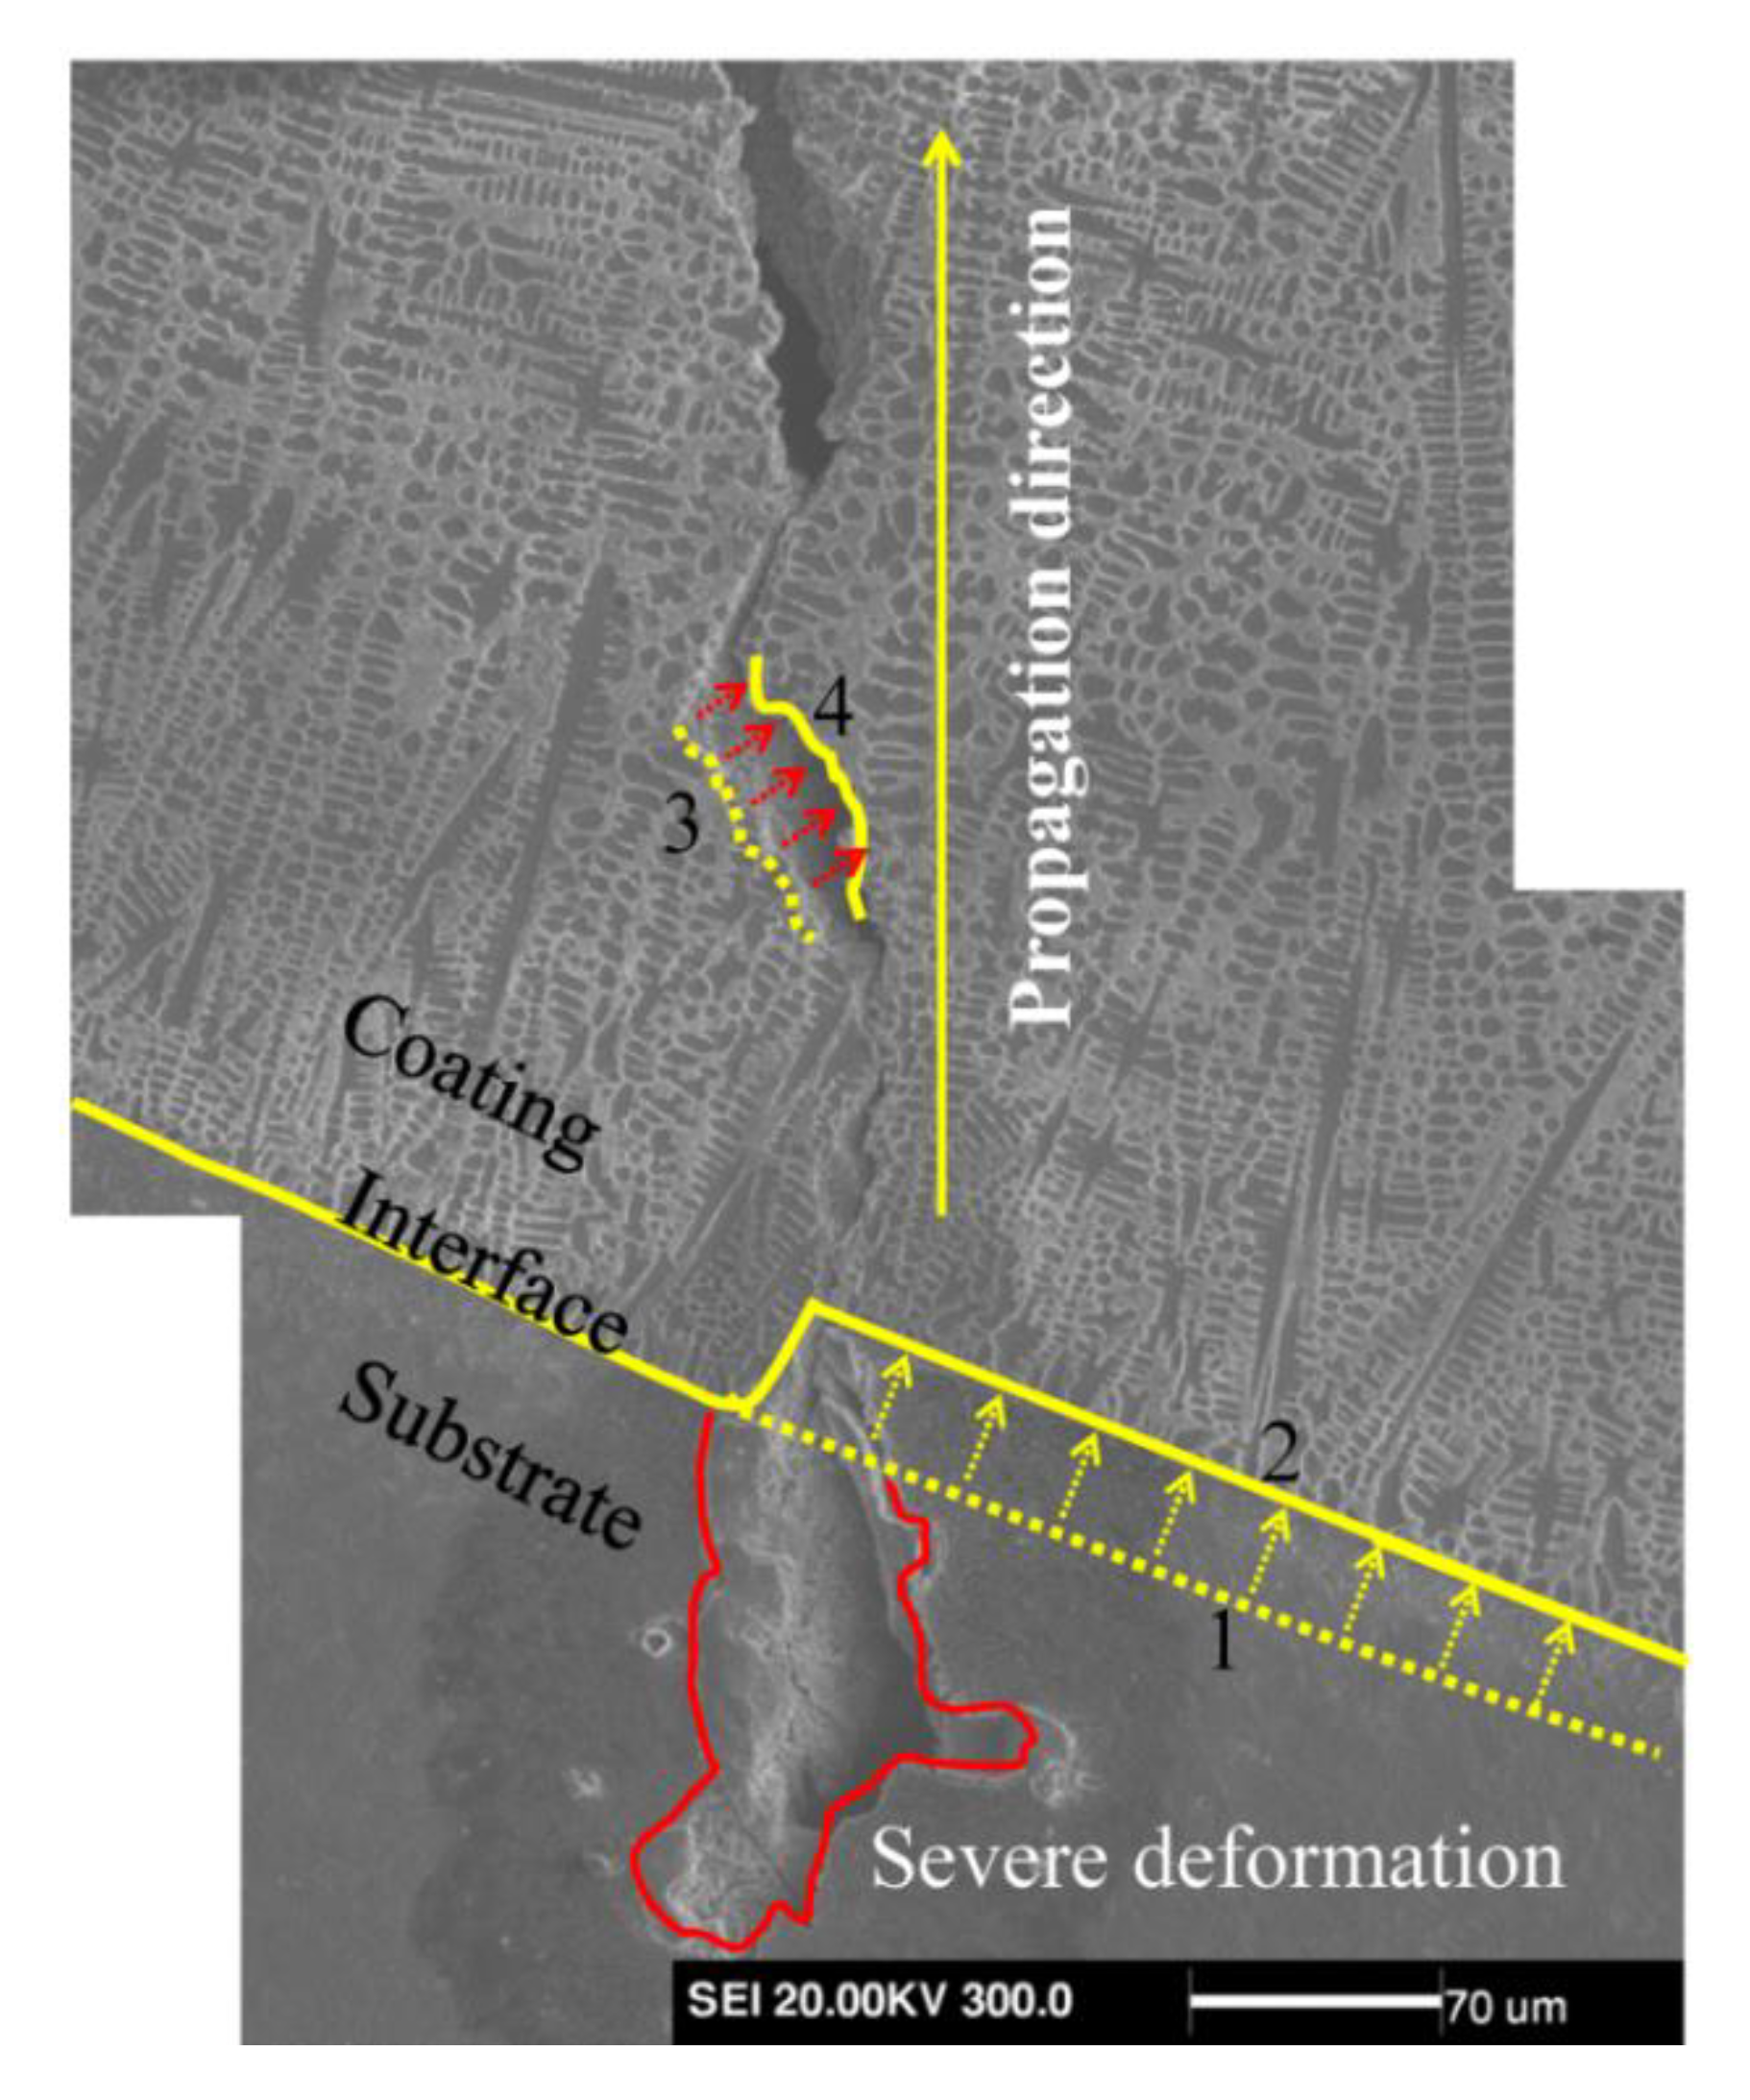
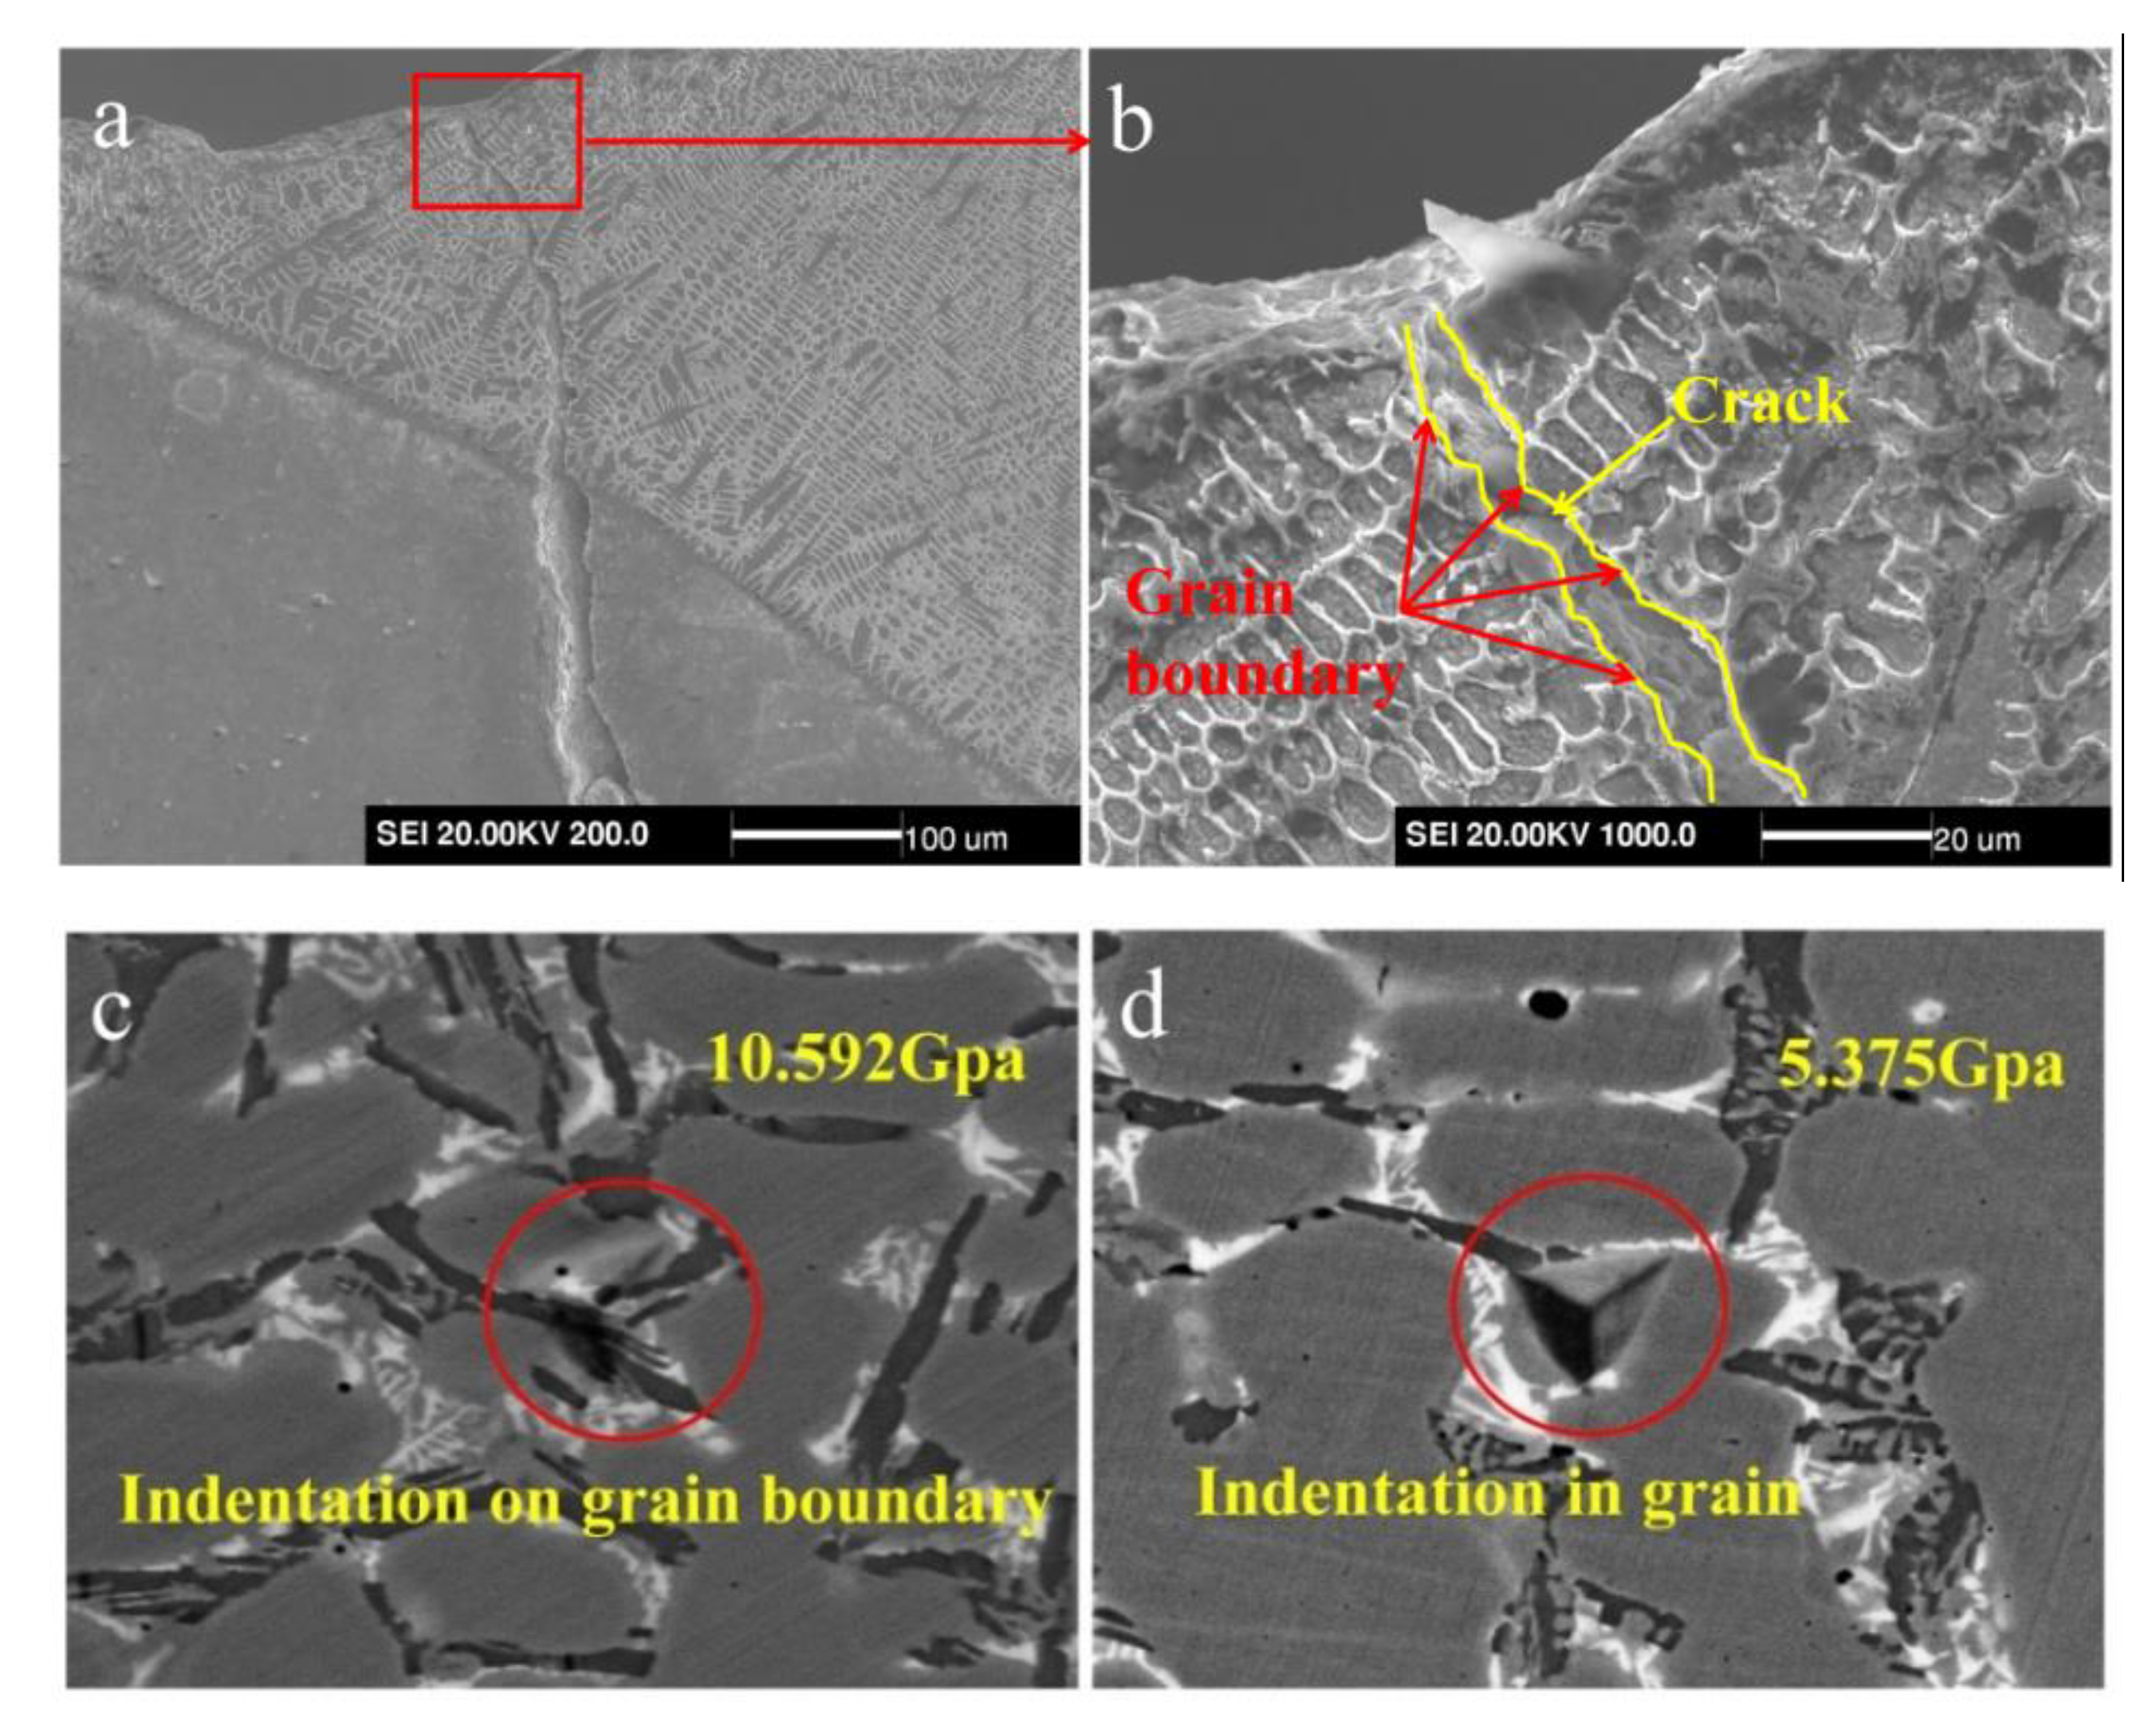
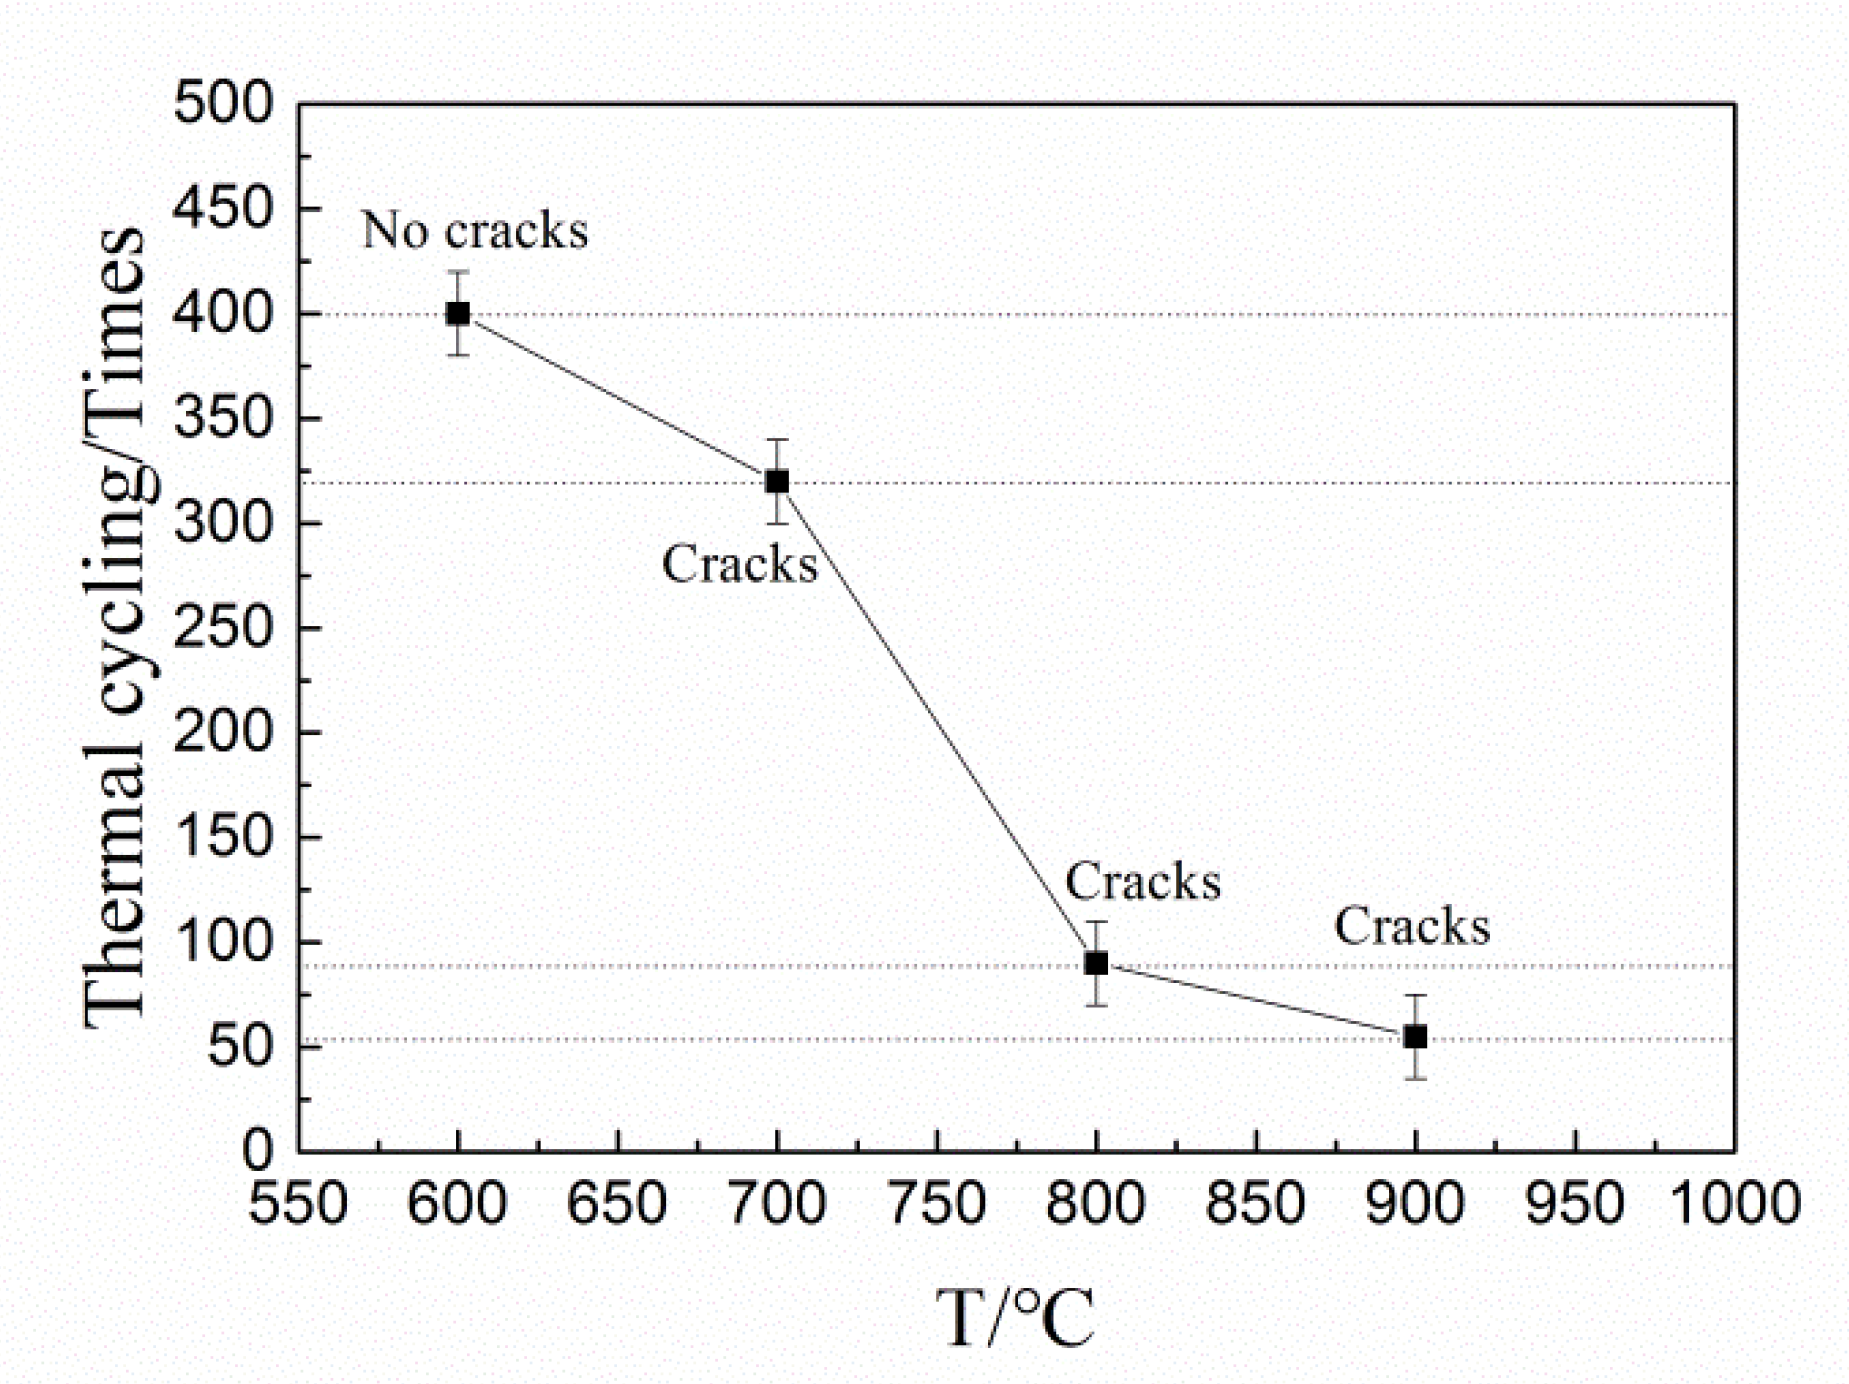
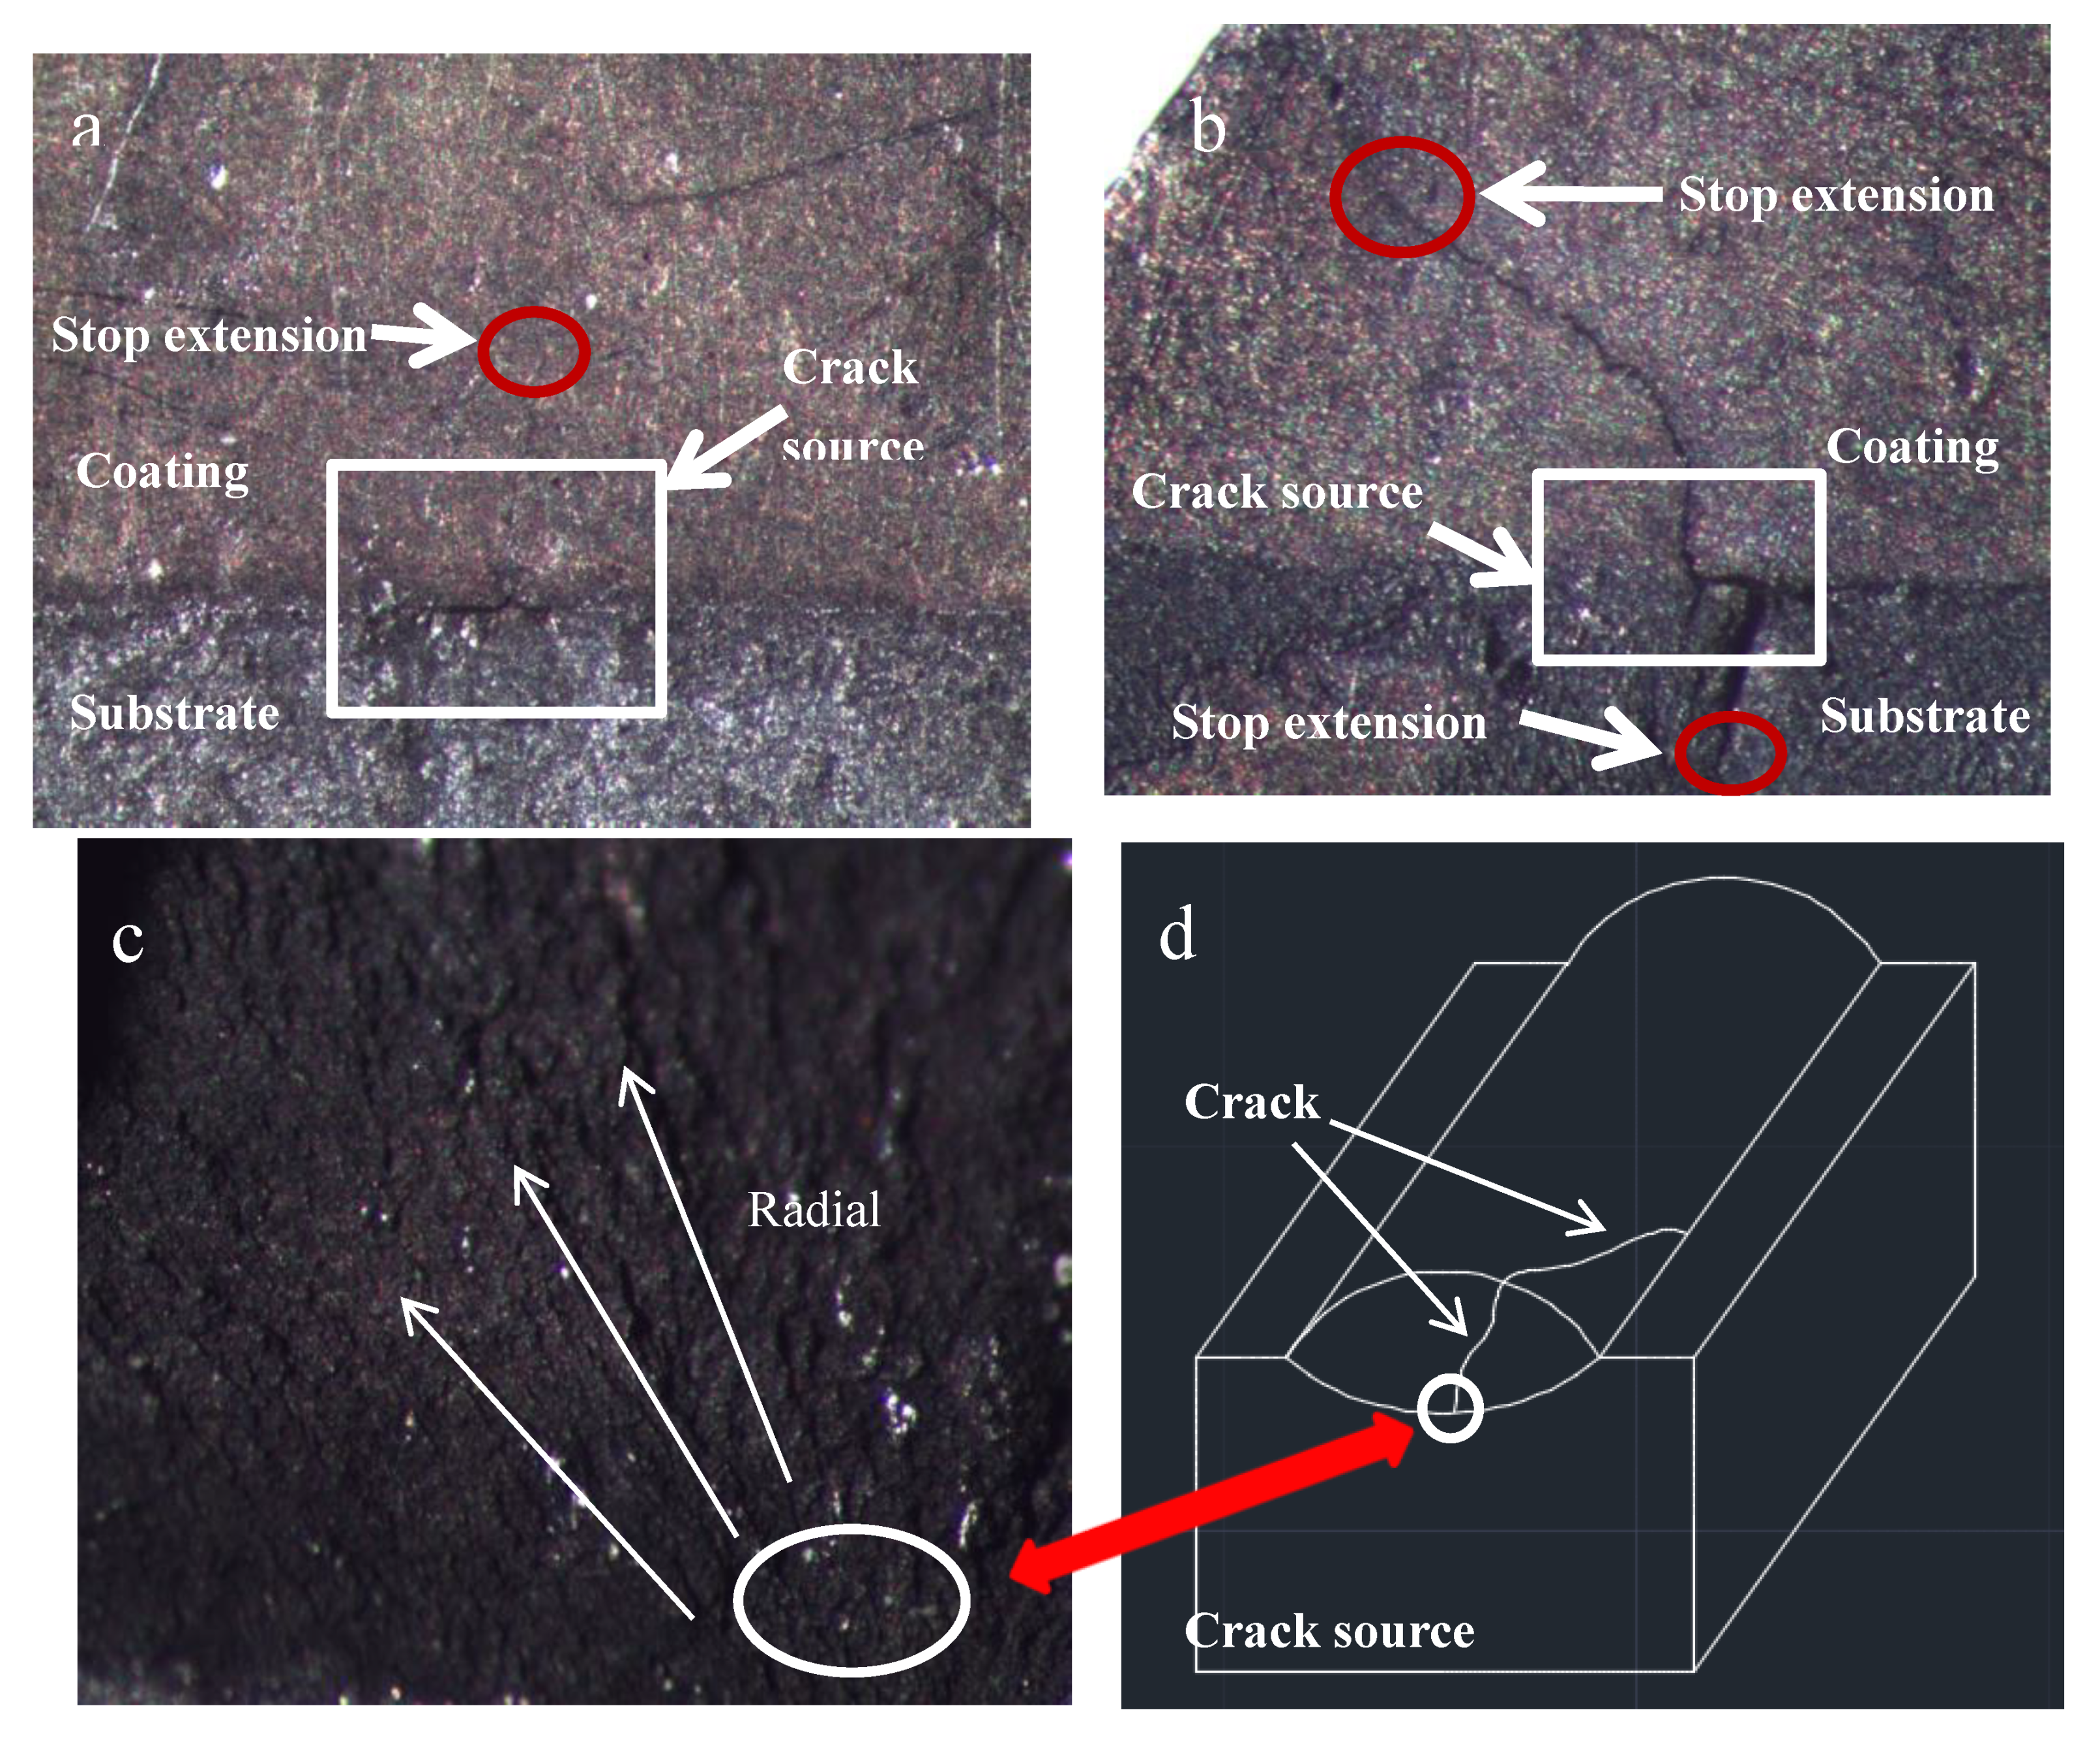
  • The thermal fatigue test showed that the thermal fatigue resistance was best at 600 °C. No cracks had initiated at 600 °C when the thermal cycling times reached 400 times. The thermal cycling of fatigue failure reached 50 times, 80 times, and 320 times at 900, 800 and 700 °C, respectively. In addition, the crack source located near the interface shows that the simulated result conformed to the test result, and the crack extended along the brittle grain boundary.
  • The thermal fatigue resistance of the coating was good as the expansion coefficient of the coating was close to the that of the substrate at 600 °C. The discrepancy of the expansion coefficient between the plasma cladding layer and substrate material increased with the increase in temperature, which was caused by the phase transition of the substrate materials, so it is easier to fail when the temperature is above 600 °C.
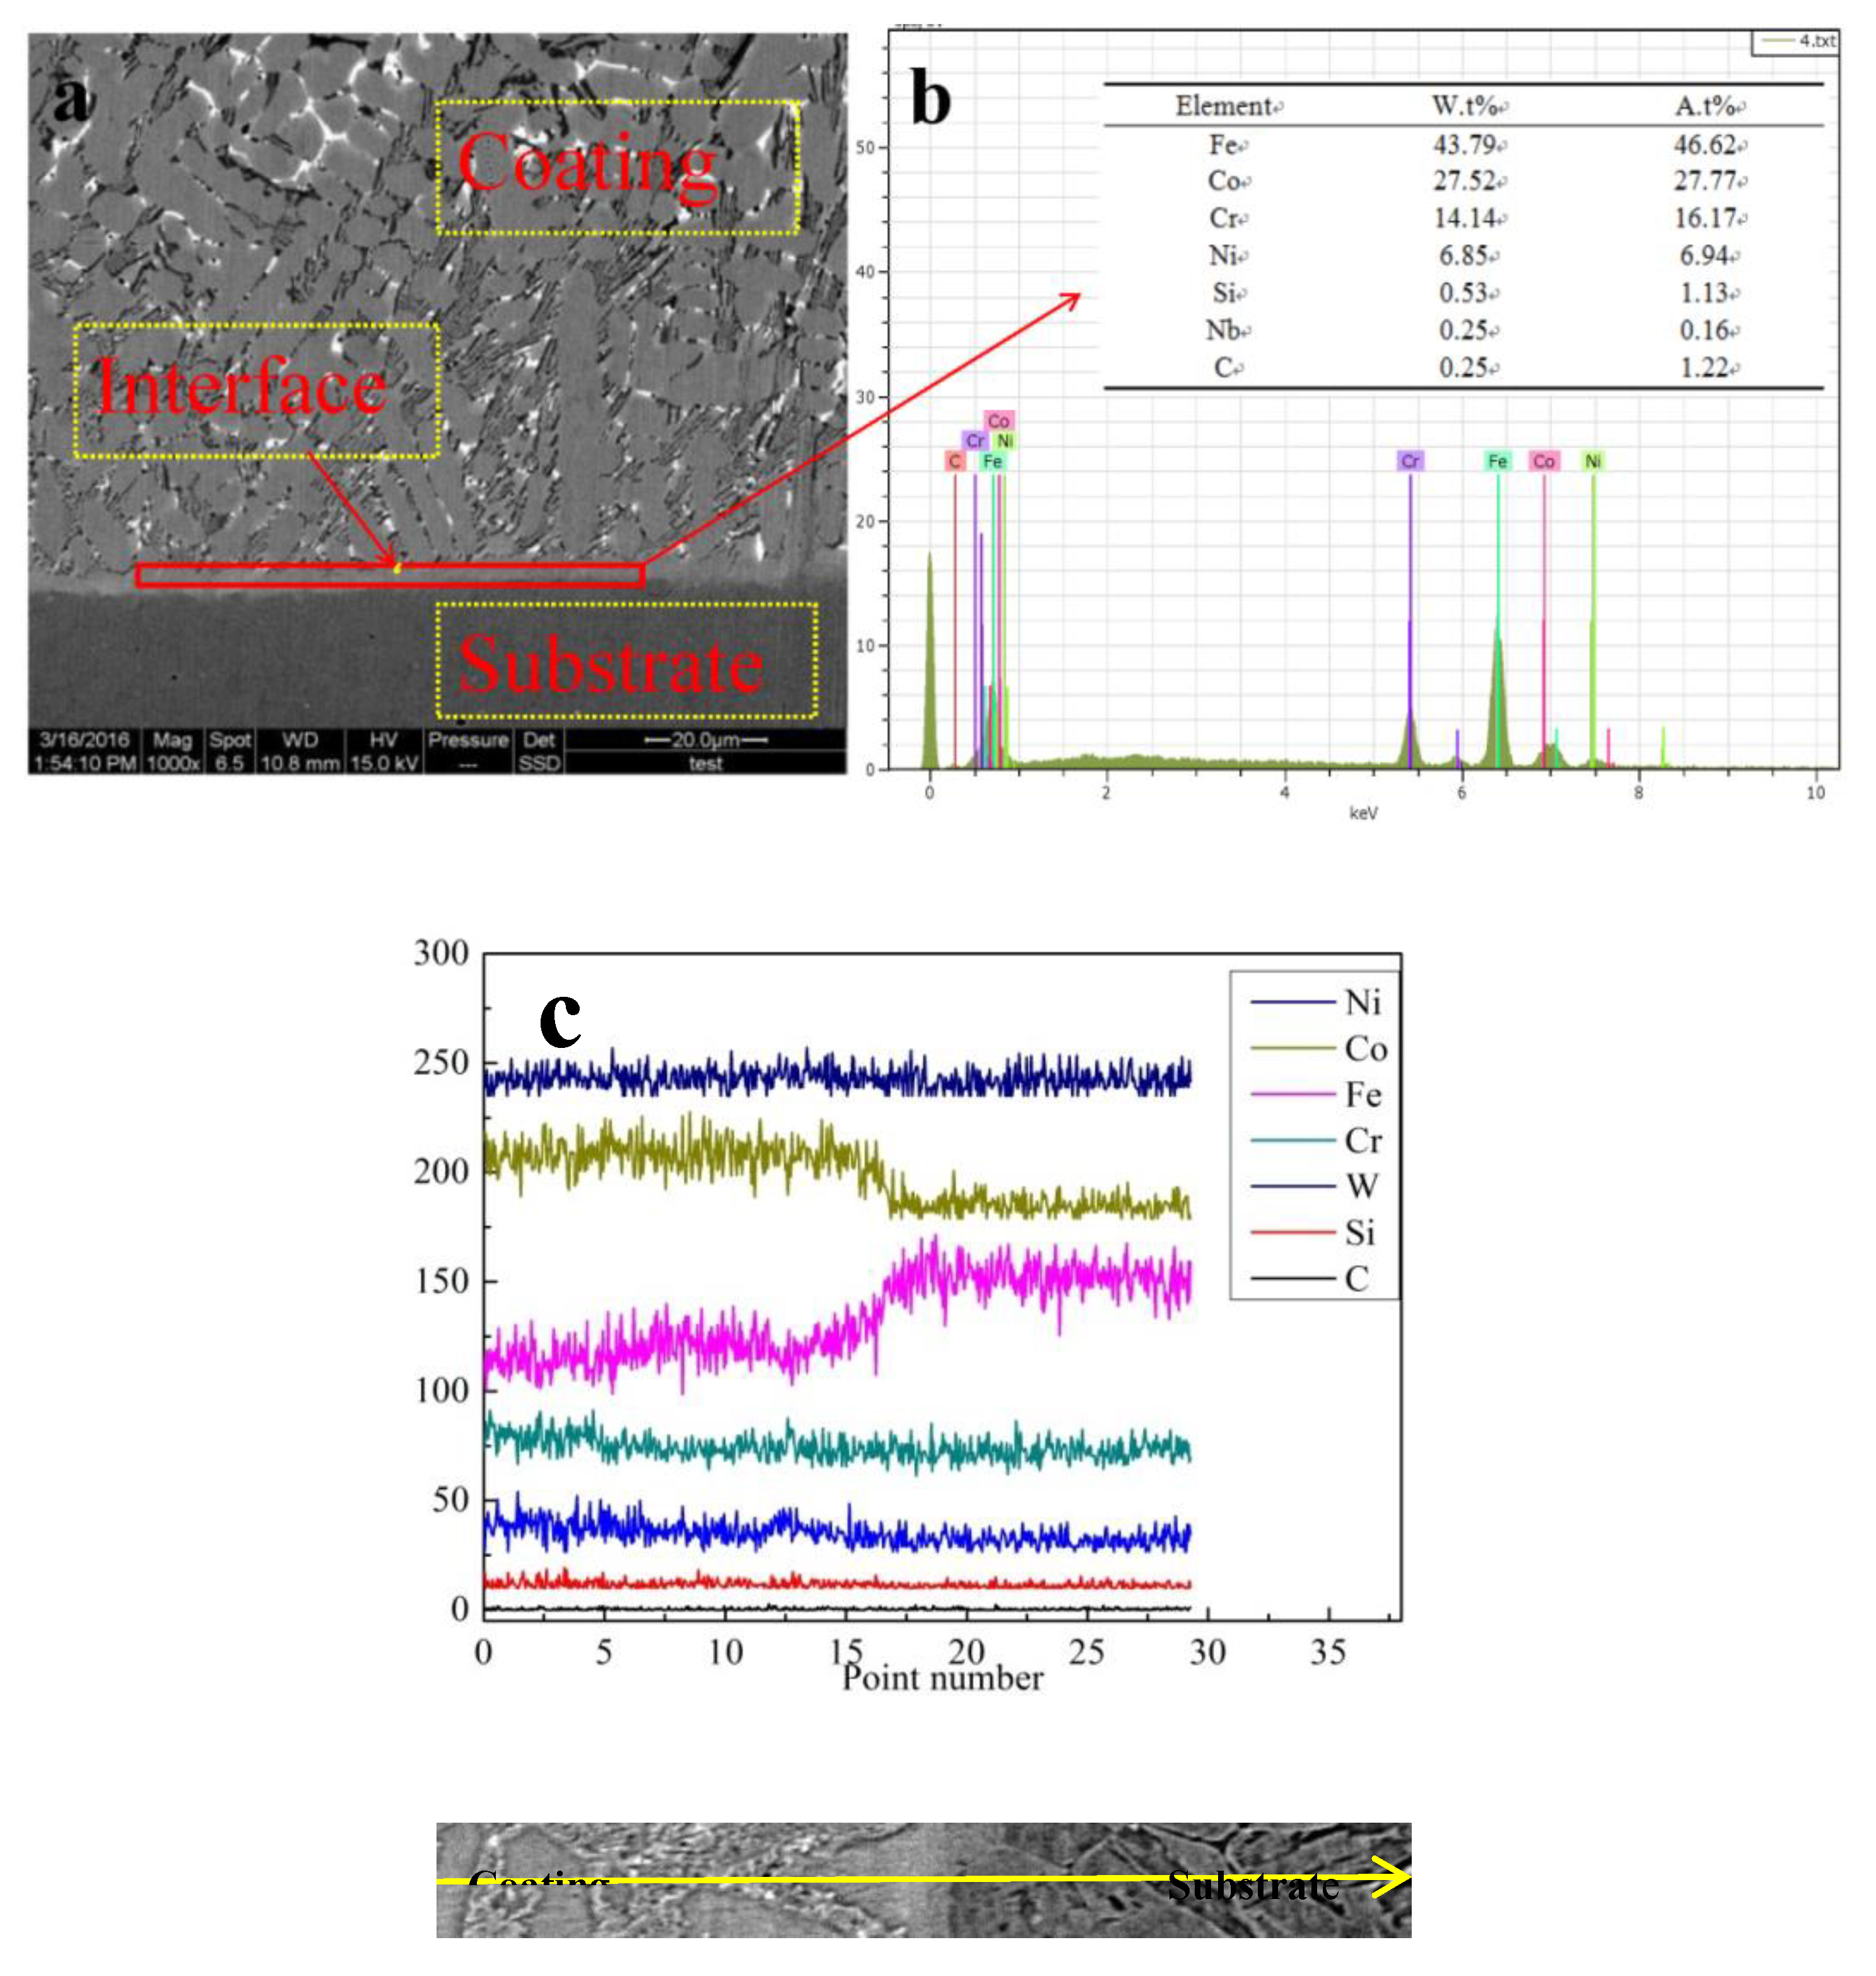
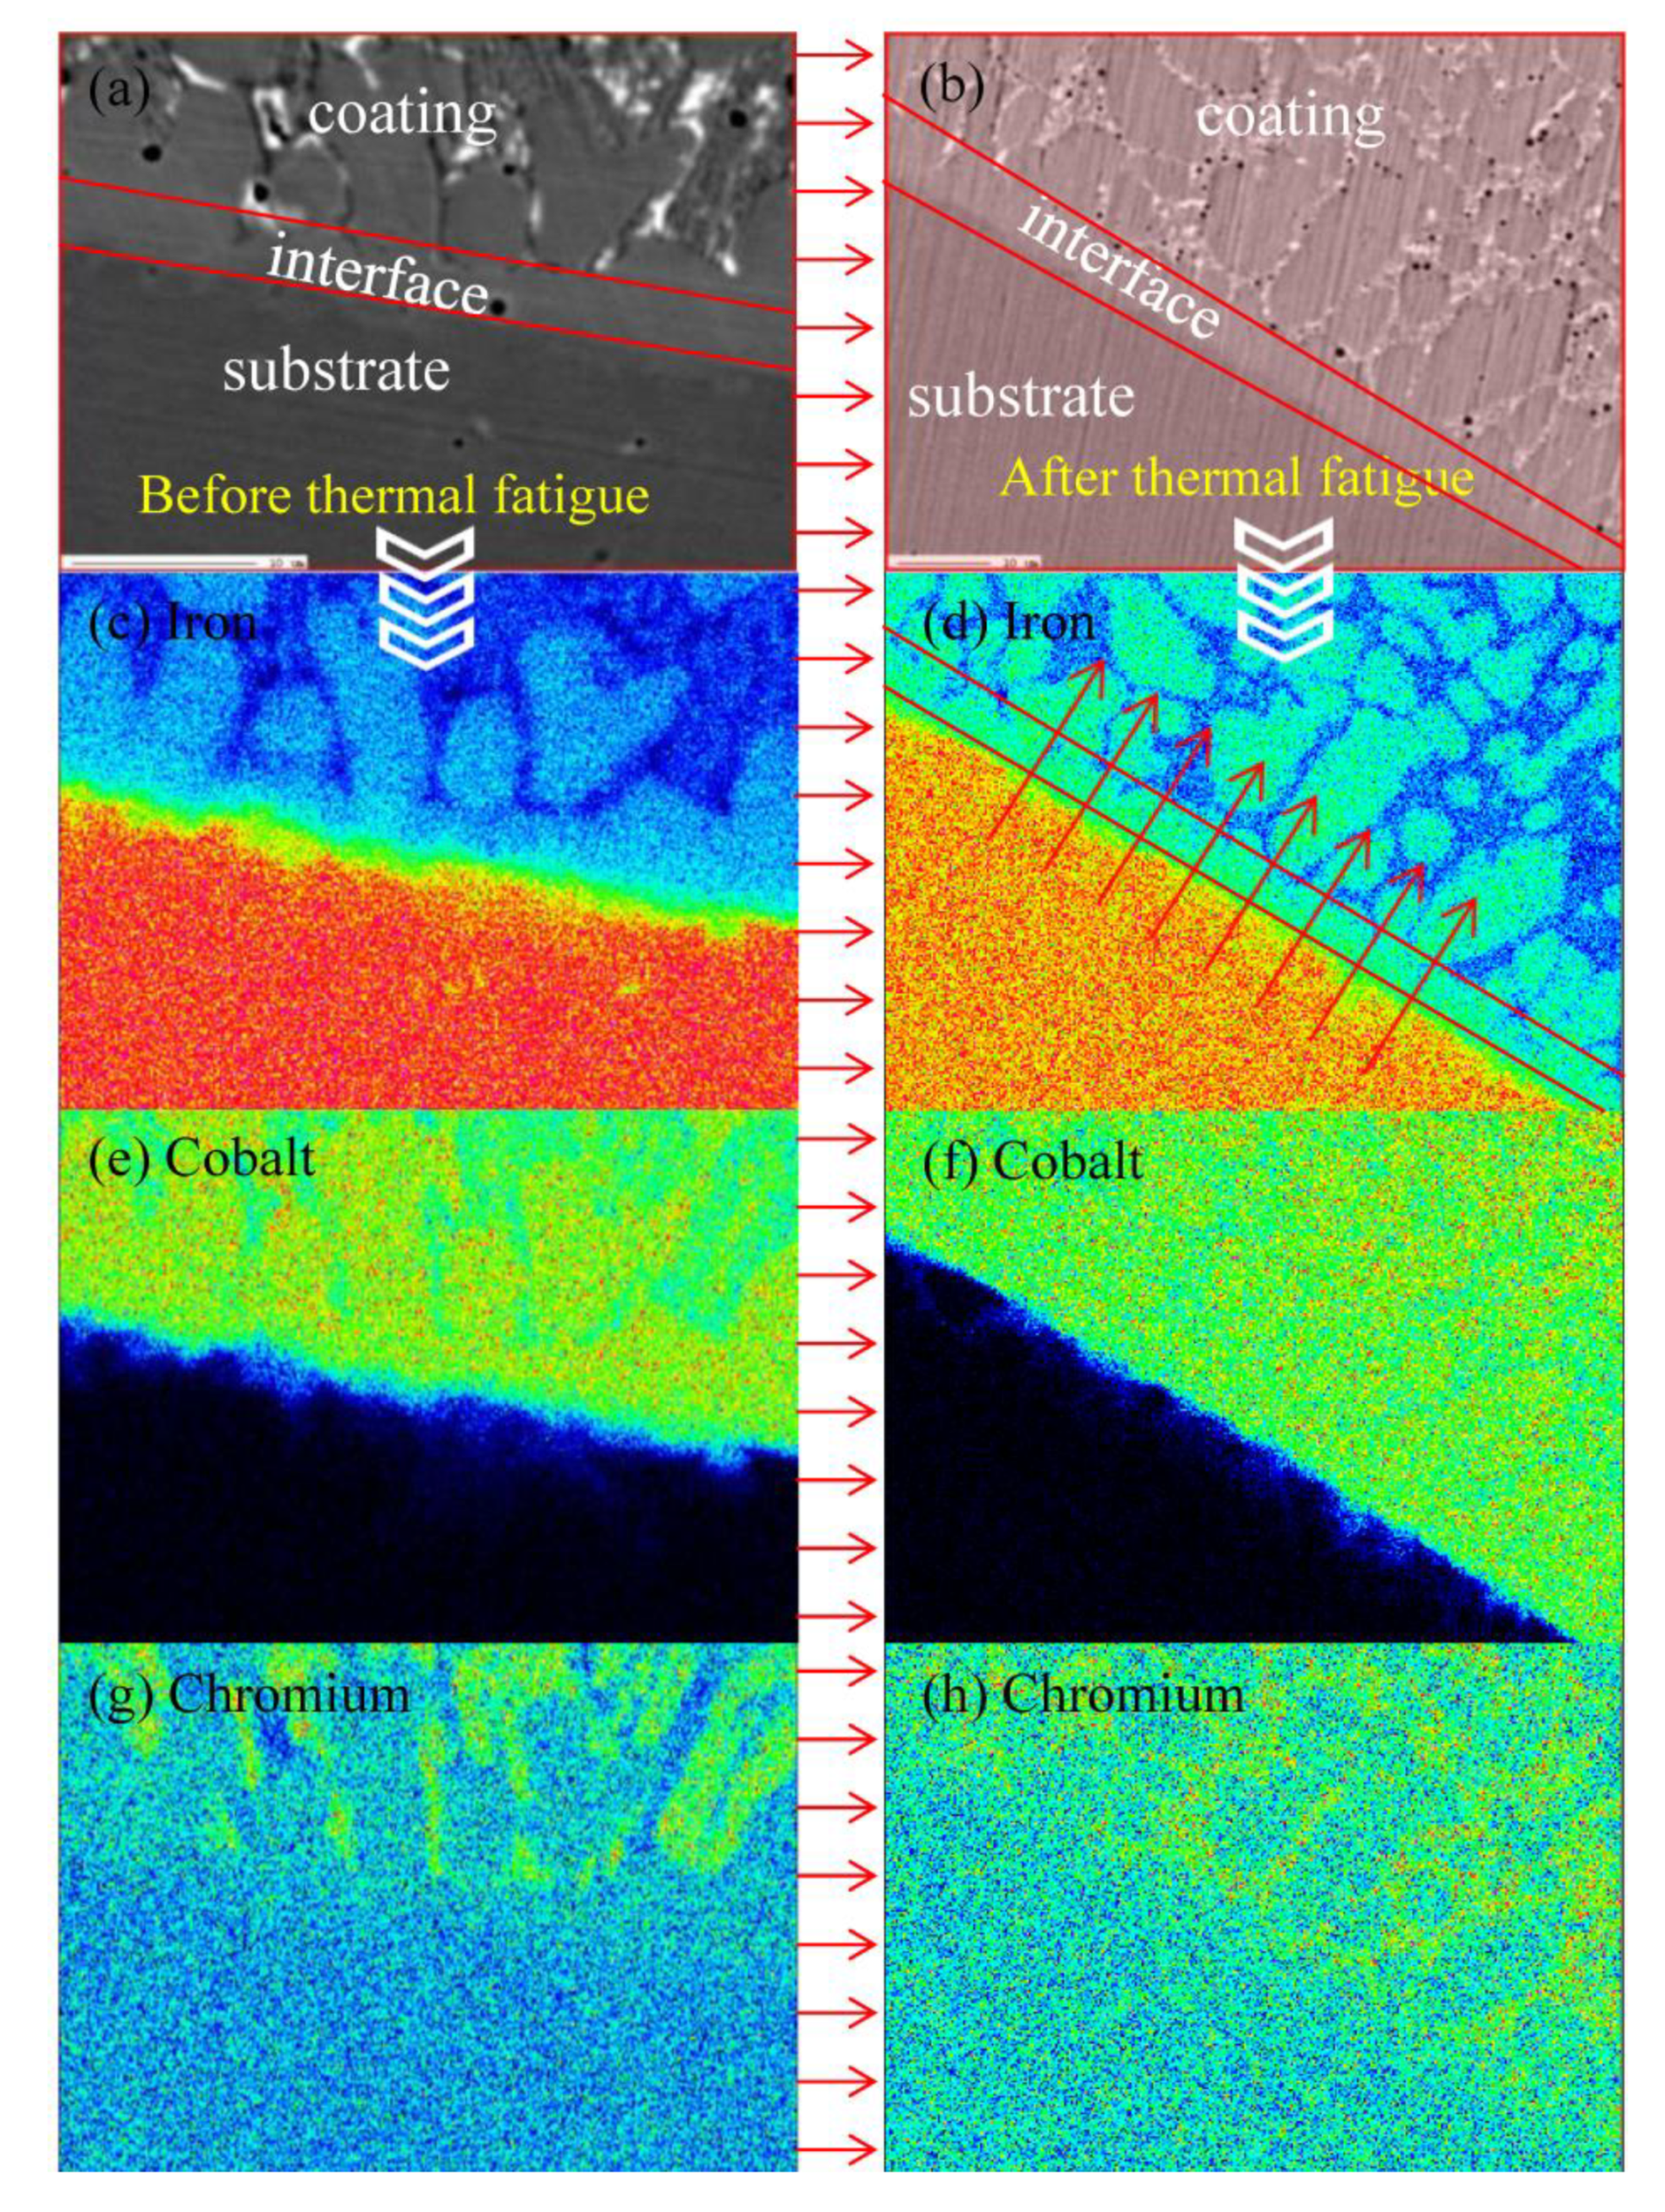
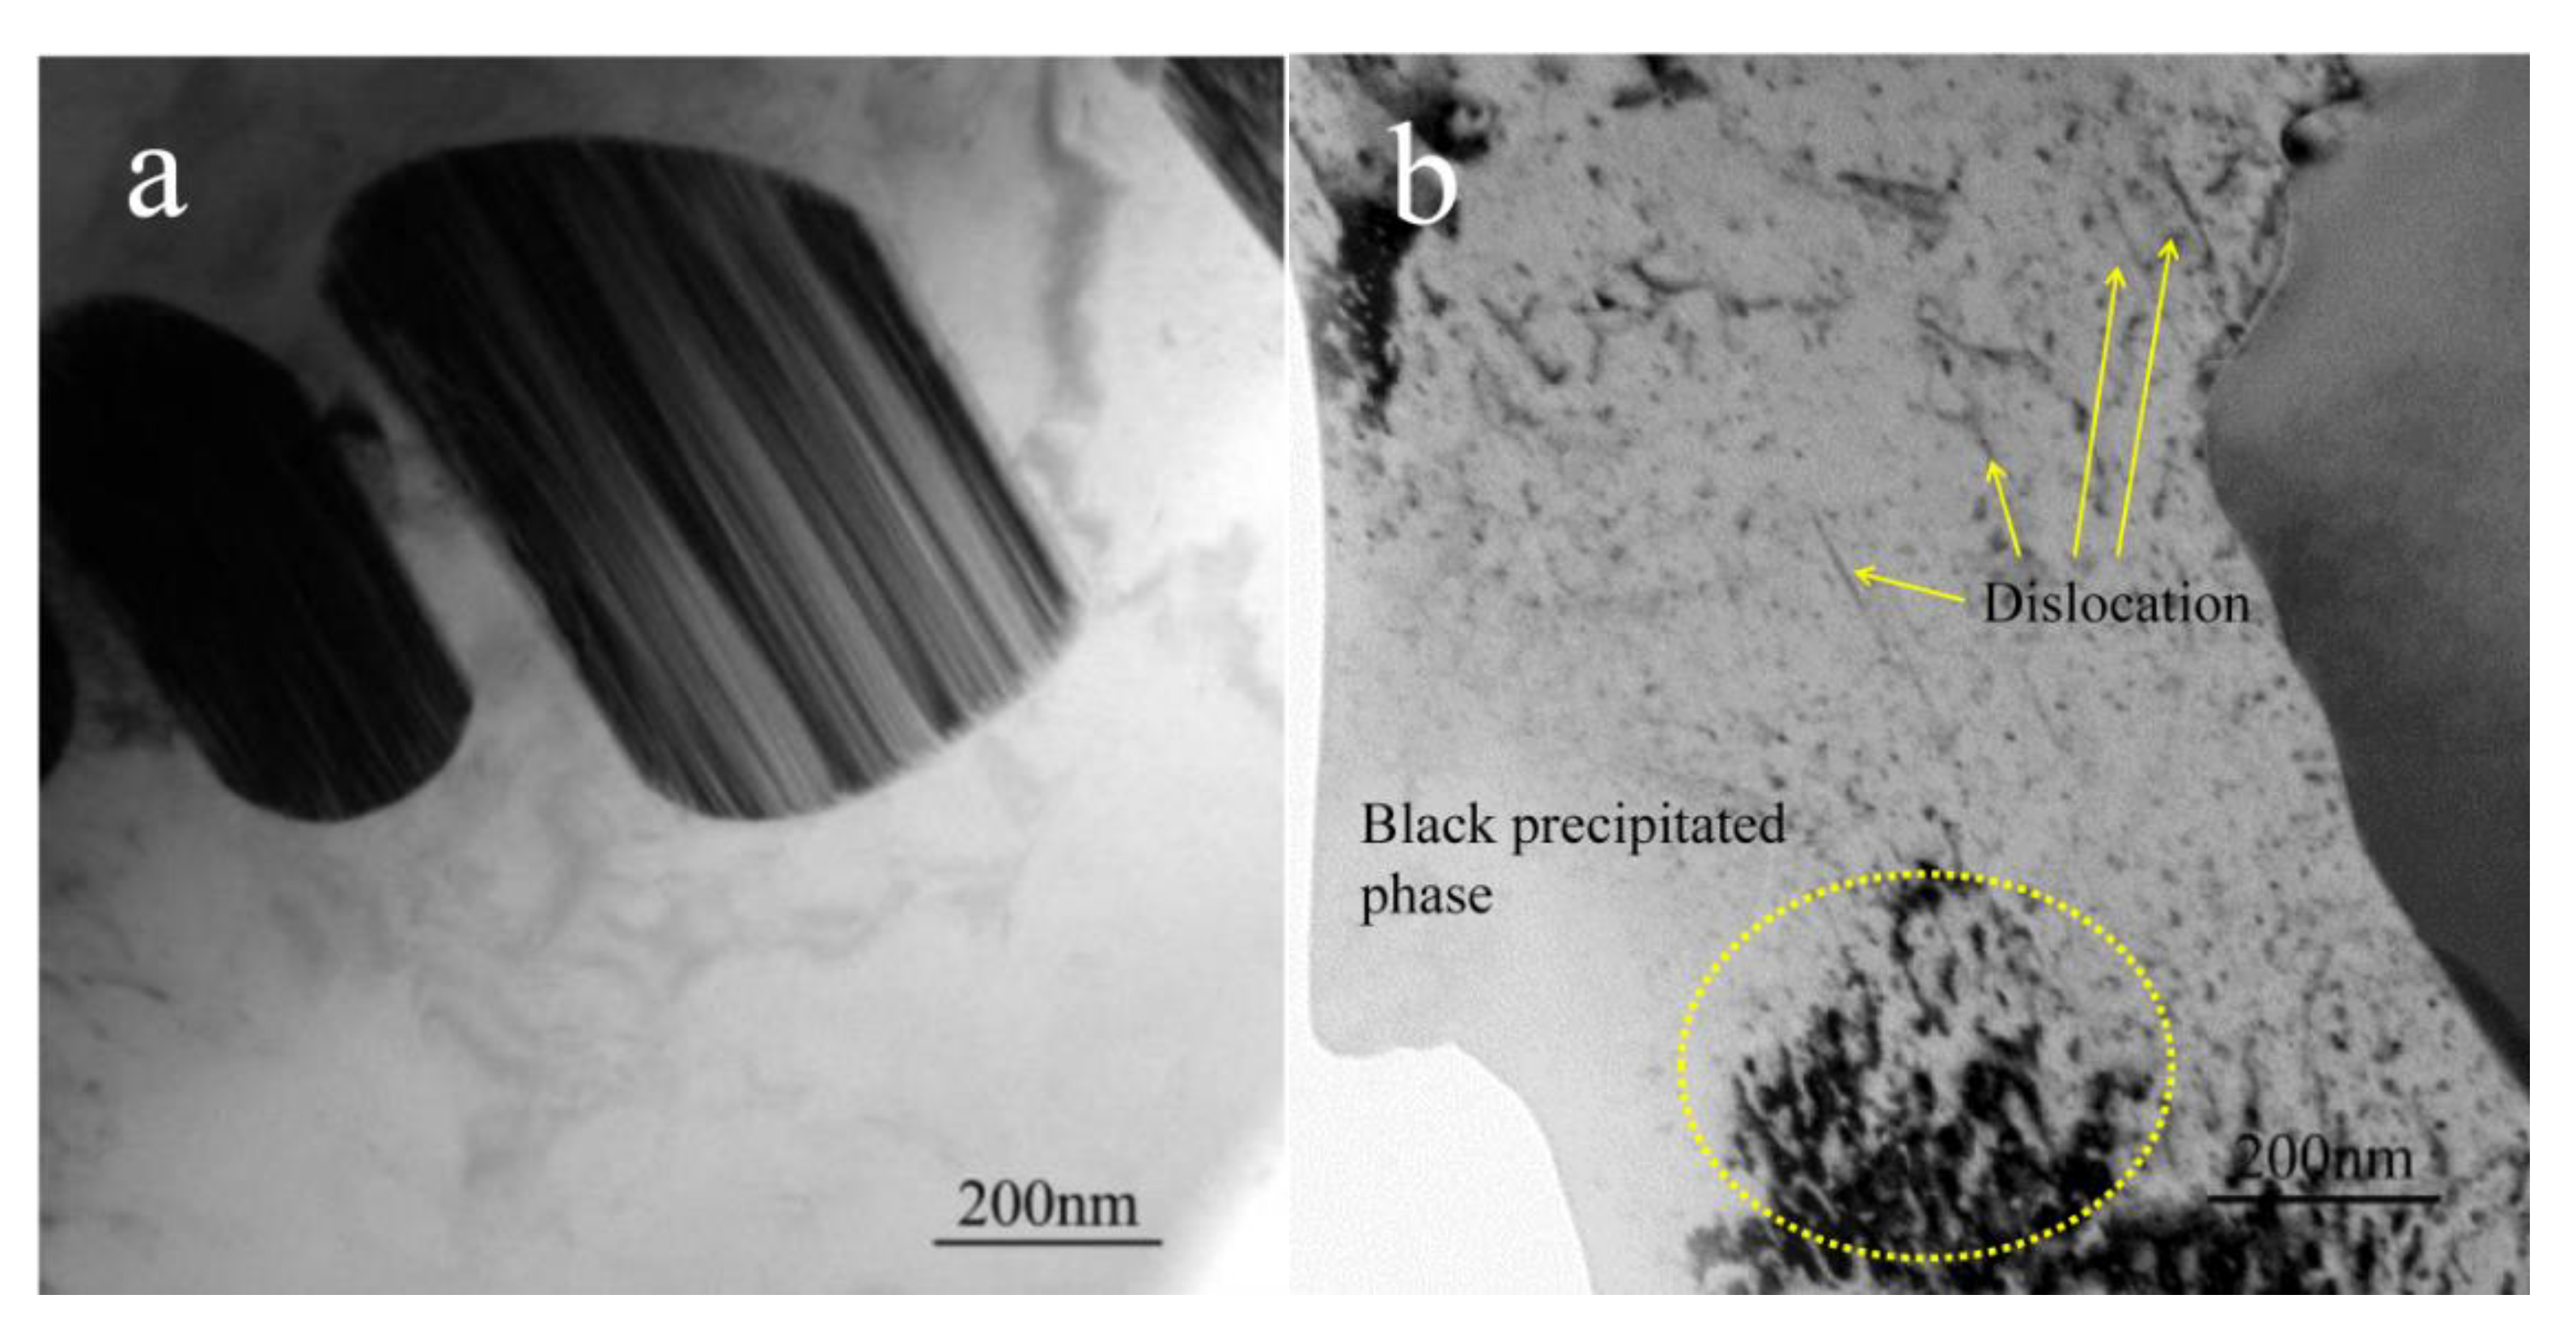
  • Element diffusion occurred between the substrate and coating in the process of the thermal cycle, thus increasing the compatibility of heterogeneous materials. Dislocation and the nano-precipitation phase will improve the thermal fatigue property.

Author Contributions

Data curation, N.T.; Funding acquisition, G.J. and X.C.; Investigation, Y.L; Methodology, Y.L.; Writing – original draft, Y.L.; Writing – review & editing, N.T., X.C. and Q.L.

Funding

This work was financially supported by the National Natural Science Foundation of China (No. 51775127, 51575118, 11772227), the National Basic Research Program of China (973 Program) (No. 61328303), the Natural Science Foundation of Heilongjiang Province (No. E2018020), and the Fundamental Research Funds for the Central Universities (No. HEUCFG201838).

Conflicts of Interest

The authors declare no conflict of interest.

References

  1. Fan, Y.; Jin, G.; Cui, X.; Li, Y.; Gao, Z. Effect of Nb and CeO2 on the mechanical and tribology properties of Co-based cladding coatings. Surf. Coat. Technol. 2016, 288, 25–29. [Google Scholar] [CrossRef]
  2. Zhang, P.; Liu, Z. Effect of sequential turning and burnishing on the surface integrity of Cr-Ni-based stainless steel formed by laser cladding process. Surf. Coat. Technol. 2015, 276, 327–335. [Google Scholar] [CrossRef]
  3. Weng, F.; Yu, H.; Chen, C.; Liu, J.; Zhao, L. Microstructures and properties of TiN reinforced Co-based composite coatings modified with Y2O3 by laser cladding on Ti-6Al-4V alloy. J. Alloy. Compd. 2015, 650, 178–184. [Google Scholar] [CrossRef]
  4. Hou, G.; An, Y.; Zhao, X.; Zhou, H.; Chen, J. Effect of alumina dispersion on oxidation behavior as well as friction and wear behavior of HVOF-sprayed CoCrAlYTaCSi coating at elevated temperature up to 1000 degrees C. Acta Mater. 2015, 95, 164–175. [Google Scholar] [CrossRef]
  5. Ang, A.S.M.; Howse, H.; Wade, S.A.; Berndt, C.C. Manufacturing of nickel based cermet coatings by the HVOF process. Surf. Eng. 2016, 32, 713–724. [Google Scholar] [CrossRef]
  6. Gurbuz, M.; Gunkaya, G.; Dogan, A. Electrospray deposition of SnO2 films from precursor solution. Surf. Eng. 2016, 32, 725–732. [Google Scholar] [CrossRef]
  7. Tang, M.K.; Huang, X.J.; Yu, J.G.; Li, X.W.; Zhang, Q.X. Simple fabrication of large-area corrosion resistant superhydrophobic surface with high mechanical strength property on TiAl-based composite. J. Mater. Process. Technol. 2017, 239, 178–186. [Google Scholar] [CrossRef]
  8. Lyu, Y.; Sun, Y.; Jing, F. On the microstructure and wear resistance of Fe-based composite coatings processed by plasma cladding with B4C injection. Ceram. Int. 2015, 41, 10934. [Google Scholar] [CrossRef]
  9. Zhang, L.; Sun, D.; Yu, H.; Li, H. Characteristics of Fe-based alloy coating produced by plasma cladding process. Mater. Sci. Eng. Struct. Mater. Prop. Microstruct. Process. 2007, 457, 319–324. [Google Scholar] [CrossRef]
  10. Jiang, S.Q.; Wang, G.; Chang-Yue, L. Effect of(Ti+B4C)/Fe901 Ratio on Microstructure and Microhardness of Fe-based Coatings Synthesized by Plasma Cladding. Surf. Technol. 2017. Available online: https://www.semanticscholar.org/paper/Effect-of-(Ti%2BB4C)%2FFe901-Ratio-on-Microstructure-of-Shao-qun-Gang/6767ef8cf6e5a290a1d144fbaf25249b816d8ec6 (accessed on 5 October 2019).
  11. Zhang, D.; Yu, R.; Kai, C.; Yang, X.; Yuan, L.; Yan, Y. Corrosion and corrosion-friction properties of plasma cladding wear-resistant layer on Fe-based alloy. Mater. Res. Express. 2018, 5, 026525. [Google Scholar] [CrossRef]
  12. Cai, Z.; Wang, Y.; Cui, X.; Guo, J.; Yang, L.; Zhe, L. Design and microstructure characterization of FeCoNiAlCu high-entropy alloy coating by plasma cladding: In comparison with thermodynamic calculation. Surf. Coat. Technol. 2017, 330, S0257897217310198. [Google Scholar] [CrossRef]
  13. Li, Y.; Cui, X.; Jin, G.; Cai, Z.; Tan, N.; Lu, B. Interfacial bonding properties between cobalt-based plasma cladding layer and substrate under tensile conditions. Mater. Des. 2017, 123, 54–63. [Google Scholar] [CrossRef]
  14. Mansuri, M.; Hadavi, S.M.M.; Zare, E.; Nabi, M.M. Thermal fatigue behaviour of Al-Si coated Inconel 713LC. Surf. Eng. 2016, 32, 201–206. [Google Scholar] [CrossRef]
  15. Pourbafrani, M.; Razavi, R.S.; Bakhshi, S.R.; Loghman-Estarki, M.R.; Jamali, H. Effect of microstructure and phase of nanostructured YSZ thermal barrier coatings on its thermal shock behaviour. Surf. Eng. 2015, 31, 64–73. [Google Scholar] [CrossRef]
  16. Li, J.; Shi, Y.; Wu, X. Effect of initial hardness on the thermal fatigue behavior of AISI H13 steel by experimental sand numerical investigations. Fatigue Fract. Eng. Mater. Struct. 2018, 41, 1260–1274. [Google Scholar] [CrossRef]
  17. Kundalkar, D.; Mavalankar, M.; Tewari, A. Effect of gas nitriding on the thermal fatigue behavior of martensitic chromium hot-work tool steel. Mater. Sci. Eng. Struct. Mater. Prop. Microstruct. Process. 2016, 651, 391–398. [Google Scholar] [CrossRef]
  18. Belyakov, A.V.; Gorbachev, A.N.; Mikhailov, V.V.; Reutov, B.F.; Fokin, A.A. Installations for producing electrospark erosion- and abrasion-resistant coatings on the blades of steam turbines of thermal and nuclear power plants. Surf. Eng. Appl. Electrochem. 2017, 53, 274–284. [Google Scholar] [CrossRef]
  19. Zhe, Z.; Yu, T.; Kovacevic, R. Erosion and corrosion resistance of laser cladded AISI 420 stainless steel reinforced with VC. Appl. Surf. Sci. 2017, 410, 225–240. [Google Scholar]
  20. Irfan, O.M.; Al-Mufadi, F.A.; Djavanroodi, F. Surface Properties and Erosion–Corrosion Behavior of Nanostructured Pure Titanium in Simulated Body Fluid. Metall. Mater. Trans. A 2018, 11, 1–10. [Google Scholar] [CrossRef]
  21. Przestacki, D.; Majchrowski, R.; Marciniak-Podsadna, L. Experimental research of surface roughness and surface texture after laser cladding. Appl. Surf. Sci. 2016, 388, 420–423. [Google Scholar] [CrossRef]
  22. Maliutina, I.N.; Si-Mohand, H.; Sijobert, J.; Bertrand, P.; Lazurenko, D.V.; Bataev, I.A. Structure and oxidation behavior of γ-TiAl coating produced by laser cladding on titanium alloy. Surf. Coat. Technol. 2017, 319, 136–144. [Google Scholar] [CrossRef]
  23. McDonald, G.; Hendricks, R.C. Effect of thermal cycling on ZrO2-Y2O3 thermal barrier coatings. Thin Solid Film. 1980, 73, 491–496. [Google Scholar] [CrossRef]
Figure 1. (a) Micrograph of the interface between the cladding layer and substrate. (b) Energy Disperse Spectroscopy results of the interface between the coating and substrate. (c) Line scanning analysis from the substrate to the coating.
Coatings 09 00646 g001
Figure 2. (a) Stress distribution in the whole sample, (b) stress distribution in the longitudinal section and (c) forecast failure position in the test.
Coatings 09 00646 g002aCoatings 09 00646 g002b
Figure 3. Thermal cycling times at different temperatures.
Coatings 09 00646 g003
Figure 4. (a) Thermal cycling 74 times at 800 °C; (b) thermal cycling 82 times at 800 °C; (c) fracture morphology corresponding to the position in (d) sketch of the failure specimen.
Coatings 09 00646 g004
Figure 5. The formation and propagation of the thermal fatigue crack at 800 °C.
Coatings 09 00646 g005
Figure 6. (a) Crack growth track in the coating; (b) Enlarge of the crack; Nano-indentation hardness of the (c) grain boundary and (d) grain interior position of coating.
Coatings 09 00646 g006
Figure 7. Average linear thermal expansion (αm) curve change with temperature.
Coatings 09 00646 g007
Figure 8. Morphology image (a) before the thermal fatigue experiment and (b) after the thermal fatigue experiment; Electron probe microanalysis result of (c) iron, (e) cobalt, and (g) chromium before the thermal fatigue experiment; EPMA result of (d) iron, (f) cobalt, and (h) chromium after the thermal fatigue experiment.
Coatings 09 00646 g008
Figure 9. Microstructure of the plasma cladding layer (a) before and (b) after the thermal fatigue experiment.
Coatings 09 00646 g009

