Article

Effect of Surface Topography and Structural Parameters on the Lubrication Performance of a Water-Lubricated Bearing: Theoretical and Experimental Study

1
School of Electro-Mechanical Engineering, Xidian University, Xi’an 710071, China
2
Laboratory of Vibration, Shock and Noise, Shanghai Jiao Tong University, Shanghai 200240, China
*
Author to whom correspondence should be addressed.
Coatings 2019, 9(1), 23; https://doi.org/10.3390/coatings9010023
Submission received: 14 October 2018 / Revised: 3 December 2018 / Accepted: 10 December 2018 / Published: 2 January 2019
(This article belongs to the Special Issue Superhydrophobic Coatings for Corrosion and Tribology)

Abstract

:
This study explored the influence of the surface topography of a bushing on the lubrication performance of a water-lubricated bearing. Bushing deformations were considered in the mathematical model. Theoretical calculations and experiments were performed. The test data corresponded well with the simulation. The main stiffness and cross stiffness coefficients were measured and compared with the theoretical values, and the empirical formula of friction coefficient was fitted based on the test data.

1. Introduction

In recent decades, the rapid development of the ship-building industry has witnessed the large and extensive application of water-lubricated bearings, due to their unparalleled advantages over other bearings. Many problems have occurred in this application, which, in turn, has promoted the study of lubrication mechanism and lubrication performance of these types of bearings. A growing interest has been given to investigating the lubrication performance of water-lubricated plain journal bearings, especially the influence of the surface topography of bearing coatings.
Researchers make great efforts to improve the lubrication performance [1,2,3] of the bearing, such as the exploitation of surface textures [4,5,6], the optimum design of bearing structures [7,8,9], and the introduction of longitudinal grooves. Many studies [10,11,12] focused on the effect of surface topography [13] on the bearing performance [10,14,15,16,17,18,19,20]. For example, Tala-Ighil et al. [21] investigated the modeling of journal bearing characteristics. They found that the lubrication performance of the textured bearing improved significantly with appropriate surface texture geometry and texture distribution. Brito et al. [22] explored the effect of grooves in single and twin axial groove journal bearings under varying load directions. Their results also showed that the friction coefficient deceased compared with the smooth surface bearing. The characteristics of textured journal bearings with consideration of thermal effects were analyzed by Tala-Ighil et al. [23] using the finite difference method (FDM). In other references [24,25,26,27,28,29], scholars have investigated lubrication performance from different perspectives.
Dadouche et al. [30] investigated the operational performance of textured journal bearings lubricated with contaminated fluid. Special attention was focused on the load-carrying capacity, friction, and wear under different contamination levels in the lubricant. Results indicated the effectiveness of textures in capturing contaminant particles and reducing the possibility of failure. Lu et al. [31] performed experiments on the friction characteristic of journal bearings with dimpled bushings manufactured using machining and chemical etching techniques. Their results indicated that a bushing with etched dimples over the entire circumference offered a better frictional performance than a bushing with dimples etched on half of its circumference. Tala-Ighil et al. [32] presented the influence of a textured area on the lubrication performance of hydrodynamic journal bearings. Analysis indicated that a textured area on a bearing bushing could effectively increase the load-carrying capacity and increase the minimum film thickness in the main load-carrying area, while decreasing the friction coefficient at the same time. Cristea et al. [33] studied lubrication performance (transient pressure and temperature field measurements) of journal bearings with circumferential grooves, where the operating modes were lightly loaded from startup to steady-state thermal stabilization. Fluid film pressure, temperature field, friction torque, and lubricant side leakage were detected simultaneously through experimental methods. Their results indicated that film rupture starts from cavitation downstream and the minimum film thickness. This occurred because of the existence of the circumferential grooves and the surface topography. Xie et al. [34,35,36] explored the lubrication states, lubrication performance with consideration of the bushing macro deformation using theoretical simulation and experimental verification. Their results indicated that the surface roughness had a significant influence on the lubrication state transition and the lubrication performance. A summary of the coupled factors on the lubrication states was also given. However, even though researchers have carried out much work, investigation of the lubrication performance of plain journal bearings is rather insufficient. Only a few studies address the significance of surface topography and bushing deformation on lubrication performance, particularly the experimental verification of the bearings.
In view of the above problems, this study focused on the influence of surface topography on the lubrication performance of water-lubricated bearings. The research sheds light on the lubrication mechanism of the bearing and has a certain significance for guiding the design of such bearings.

2. Theoretical Model

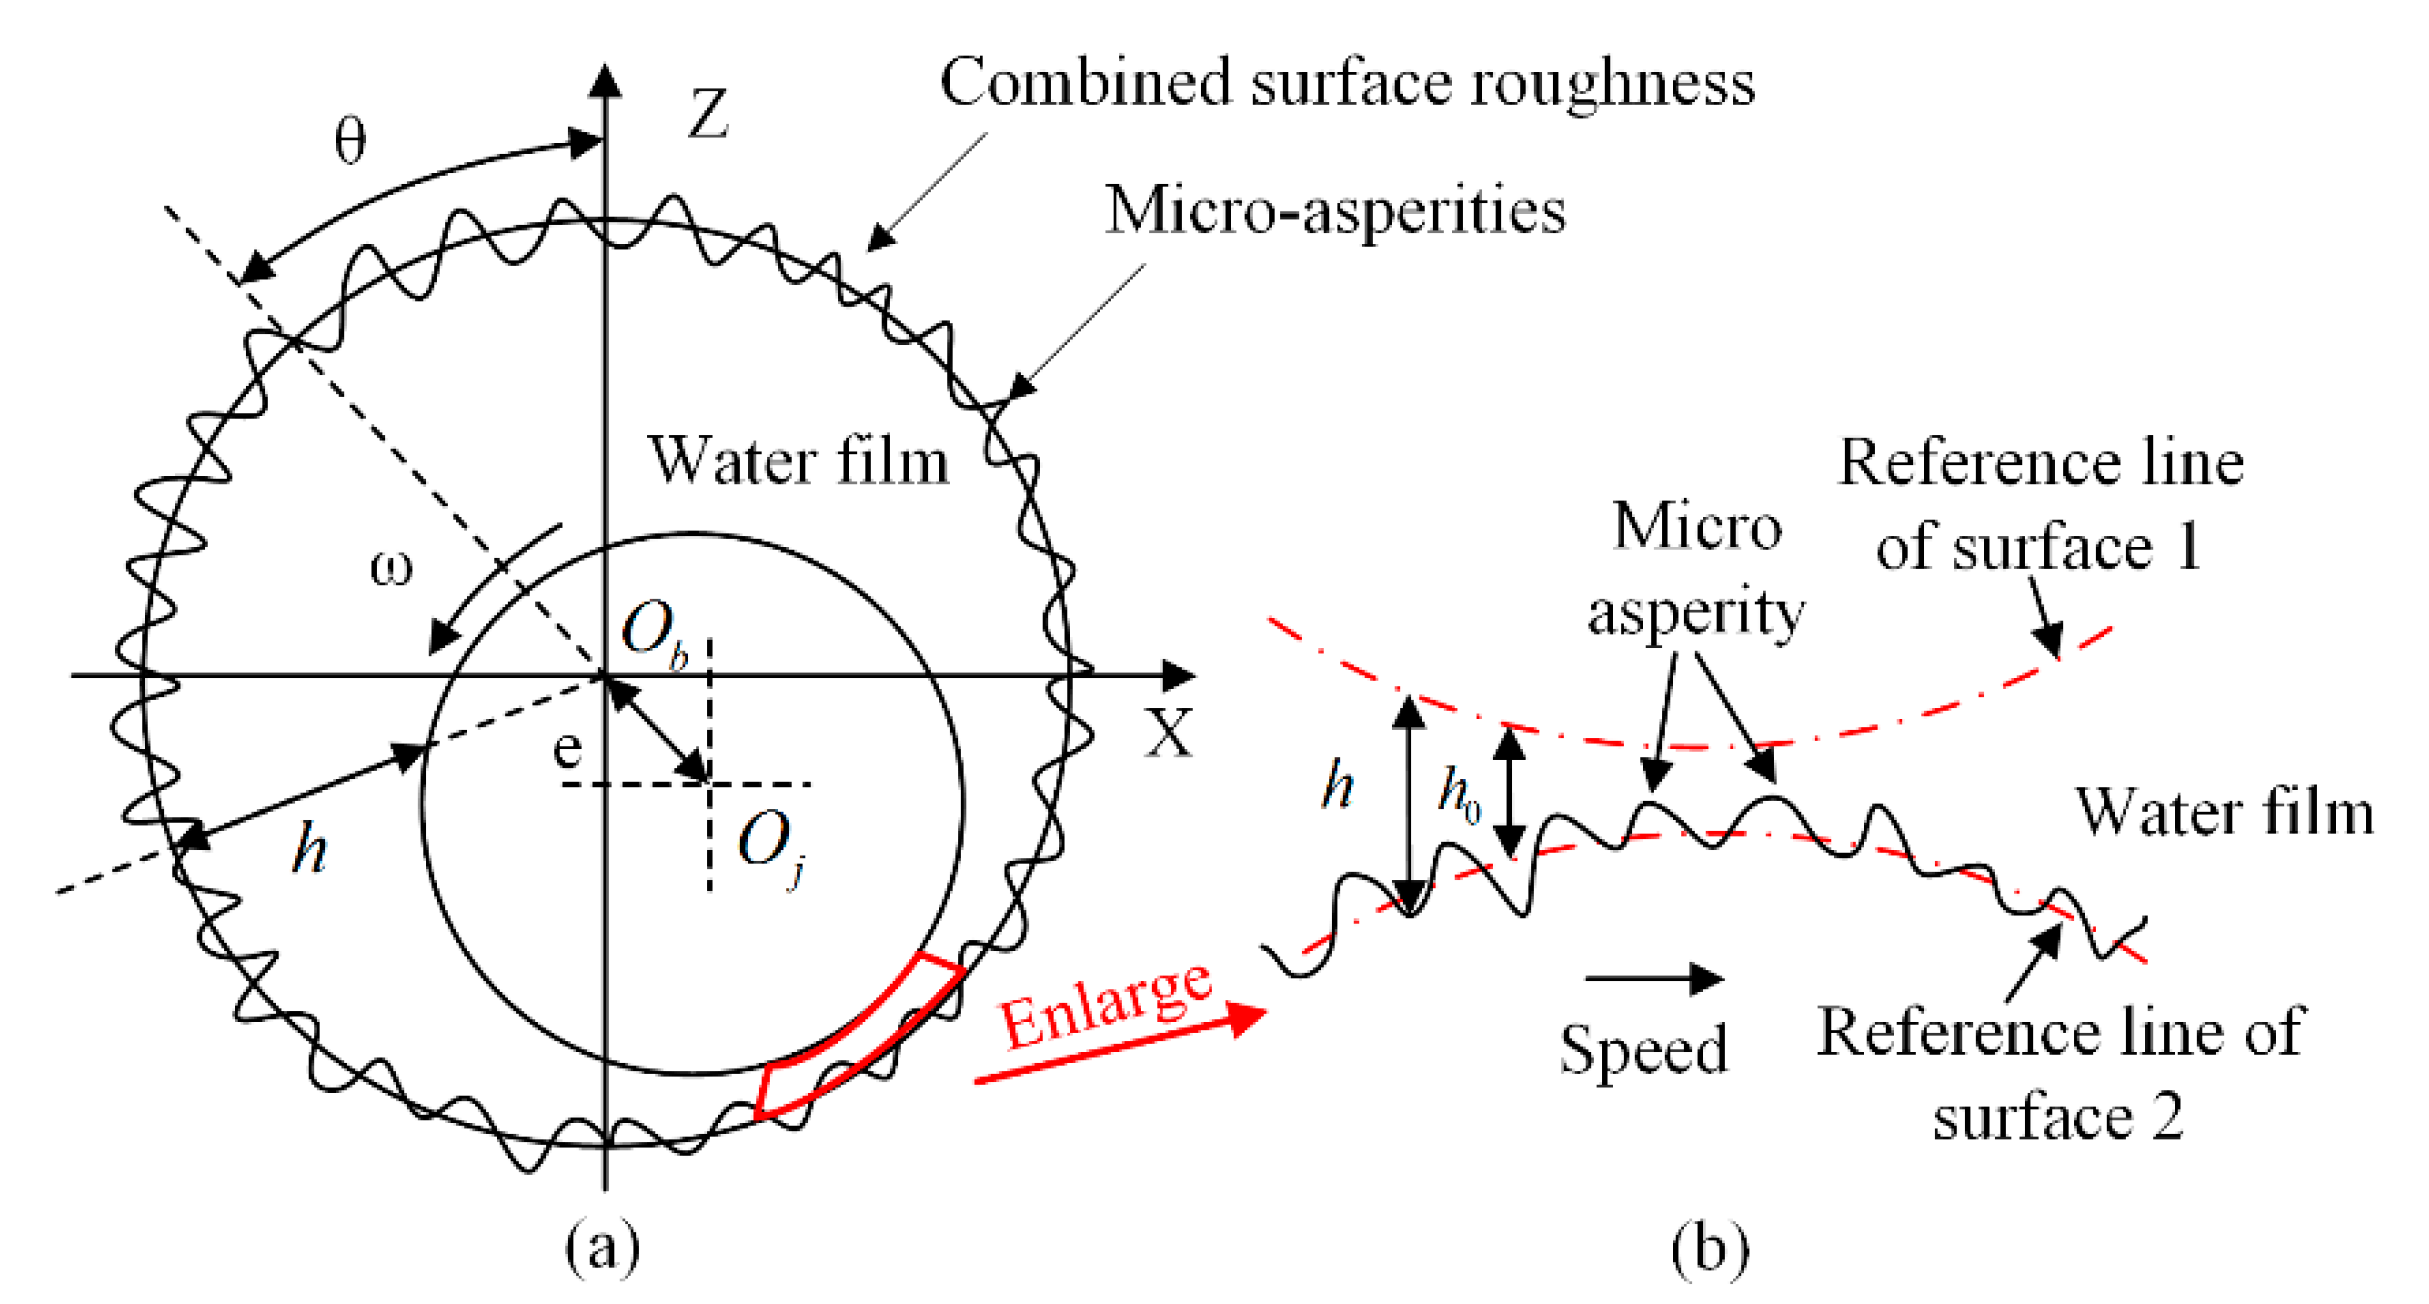
2.1. Mathematic Model

Figure 1 shows the practical plain journal bearing, with the surface topography. The bearing is completely submerged in the lubricant. It carries the vertical load. Surface topography effect is considered in the analysis. For the convenience of simulation, the bushing and journal surfaces are equivalent to the bushing with combined surface roughness, while the journal is absolutely smooth (as shown in Figure 1a). Figure 1b presents the closer view of the surface roughness.
In the Cartesian coordinates, the modified Reynolds Equation with consideration of surface topography effect is as follows:
x ( ϕ x ρ h 3 μ p x ) + z ( ϕ z ρ h 3 μ p z ) = 6 U ( ϕ c ρ h T ) x + 6 U σ s ( ρ ϕ s ) x + 12 ( ϕ c ρ h T ) t
Surface topography is considered using these parameters: ϕ x , ϕ z are the pressure flow factors, ϕ s is the shear flow factor, and ϕ c is the contact factor.
For the Equation above, the pressure distribution of the fluid field is governed by the structure and operating parameters, as well as the film thickness.
The modified formula of the film thickness is as follows:
h = h 0 + δ h + δ 1 + δ 2
δ h is the macroscopic elastic deformation of the bearing bushing. The macroscopic elastic deformation of the bushing surface due to the normal hydrodynamic effect is calculated using the following Boussinesq Formula:
δ h = 2 π E Ω p ( ξ , ζ ) ( x ξ ) 2 + ( y ζ ) 2 d ξ d ζ
If a groove is considered in the model, the film thickness should be modified as follows:
h = { h 0 + δ h + δ 1 + δ 2 , 0 θ θ s , θ f θ 2 π h 0 + δ h + δ 1 + δ 2 + δ groove , θ s < θ f < θ
where θs, θf are the start angle and the end angle of the groove, respectively δgroove is the height of the fluid film in the groove.
δ groove = d 0 C ( 1 + cos ( θ π / 2 ) )
The surface plastic macro deformation can also be added into the calculation if needed. However, for composite materials due to their wear resistance, impact, and corrosion properties, the calculation of plastic macro deformation is rather cumbersome. The equilibrium Equation for the hydrodynamic force, contact force, and external load P are calculated by:
P + F fluid + W asp = 0
where hydrodynamic force F fluid = 0 1 0 2 π p d θ dz and film pressure are determined by the mixed lubrication (ML) model. Contact force W asp = 0 1 0 2 π p asp d θ dz .
Formula of friction coefficient:
f total = α 1 f asp + α 2 f fluid α 1 + α 2 = 1 , α 1 , α 2 [ 0 , 1 ]
where fasp is the friction coefficient due to micro-asperities contacts effect and ffluid is the friction coefficient due to “viscous effect” (i.e., the shearing stress of the fluid molecules).

2.2. Boundary Conditions

For water-lubricated bearings, the commonly used boundary conditions include the Reynolds, Jakobsson-Floberg–Olsson (JFO), and Sommerfeld boundary conditions. For different boundary conditions, the calculated lubrication performance differs.
For JFO boundary conditions [20], the calculated pressure distribution is limited to the positive pressure region, and both the cavitation upper and lower boundaries are based on the mass conservation equation. In the cavitation region, the pressure is equal to the cavitation pressure Pcav, whereas in the rupture region (x0,z0),
P x 0 , z 0 = P cav , ( P x ) | x = x 0 = ( P z ) | z = z 0 = 0
For Reynolds boundary conditions, the nature rupture boundary condition, which considers the water film to be continuous, and the end point of the film are a nature rupture phenomenon. The film will fracture automatically after striking the minimum film thickness. Generally speaking, Reynolds boundary conditions are closer to the practical engineering operations:
{ z = 0 , P = P a , z = z 2 , d P d z = 0 0 < z < z 2 , P = P ( z ) , z 2 < z < 2 π , P = P a , d P d z = 0
In this study, the above two boundary conditions are used to investigate the influence on lubrication performance.
For the bearing-rotor system, when the rotor is disturbed, the support force of the film will change correspondingly. If the disturbance is small, the force can be expanded through the Taylor series near the equilibrium point, then:
{ F x = F x 0 + F x x Δ x + F x y Δ y + F x x ˙ Δ x ˙ + F x y ˙ Δ y ˙ + F y = F y 0 + F y x Δ x + F y y Δ y + F y x ˙ Δ x ˙ + F y y ˙ Δ y ˙ +
where Fx, Fy are the components of the film forces and Fx, Fy are the components of the film forces on the equilibrium position. When the disturbance is small, the high order components of the second order and above are ignored, whereas the first order components are retained:
{ Δ F x = F x F x 0 = k x x Δ x + k x y Δ y + c x x Δ x ˙ + c x y Δ y ˙ Δ F y = F y F y 0 = k y x Δ x + k y y Δ y + c y x Δ x ˙ + c y y Δ y ˙
For the dynamic coefficients of the film:
{ k x x = F x x | 0 , k x y = F x y | 0 , k y x = F y x | 0 , k y y = F y y | 0 c x x = F x x ˙ | 0 , c x y = F x y ˙ | 0 , c y x = F y x ˙ | 0 , c y y = F y y ˙ | 0
( k x x k y x ) = 0 1 0 2 π p x ( sin x cos x ) d x d z
( k x y k y y ) = 0 1 0 2 π p y ( sin x cos x ) d x d z
( c x x c y x ) = 0 1 0 2 π p x ˙ ( sin x cos x ) d x d z
( c x y c y y ) = 0 1 0 2 π p y ˙ ( sin x cos x ) d x d z

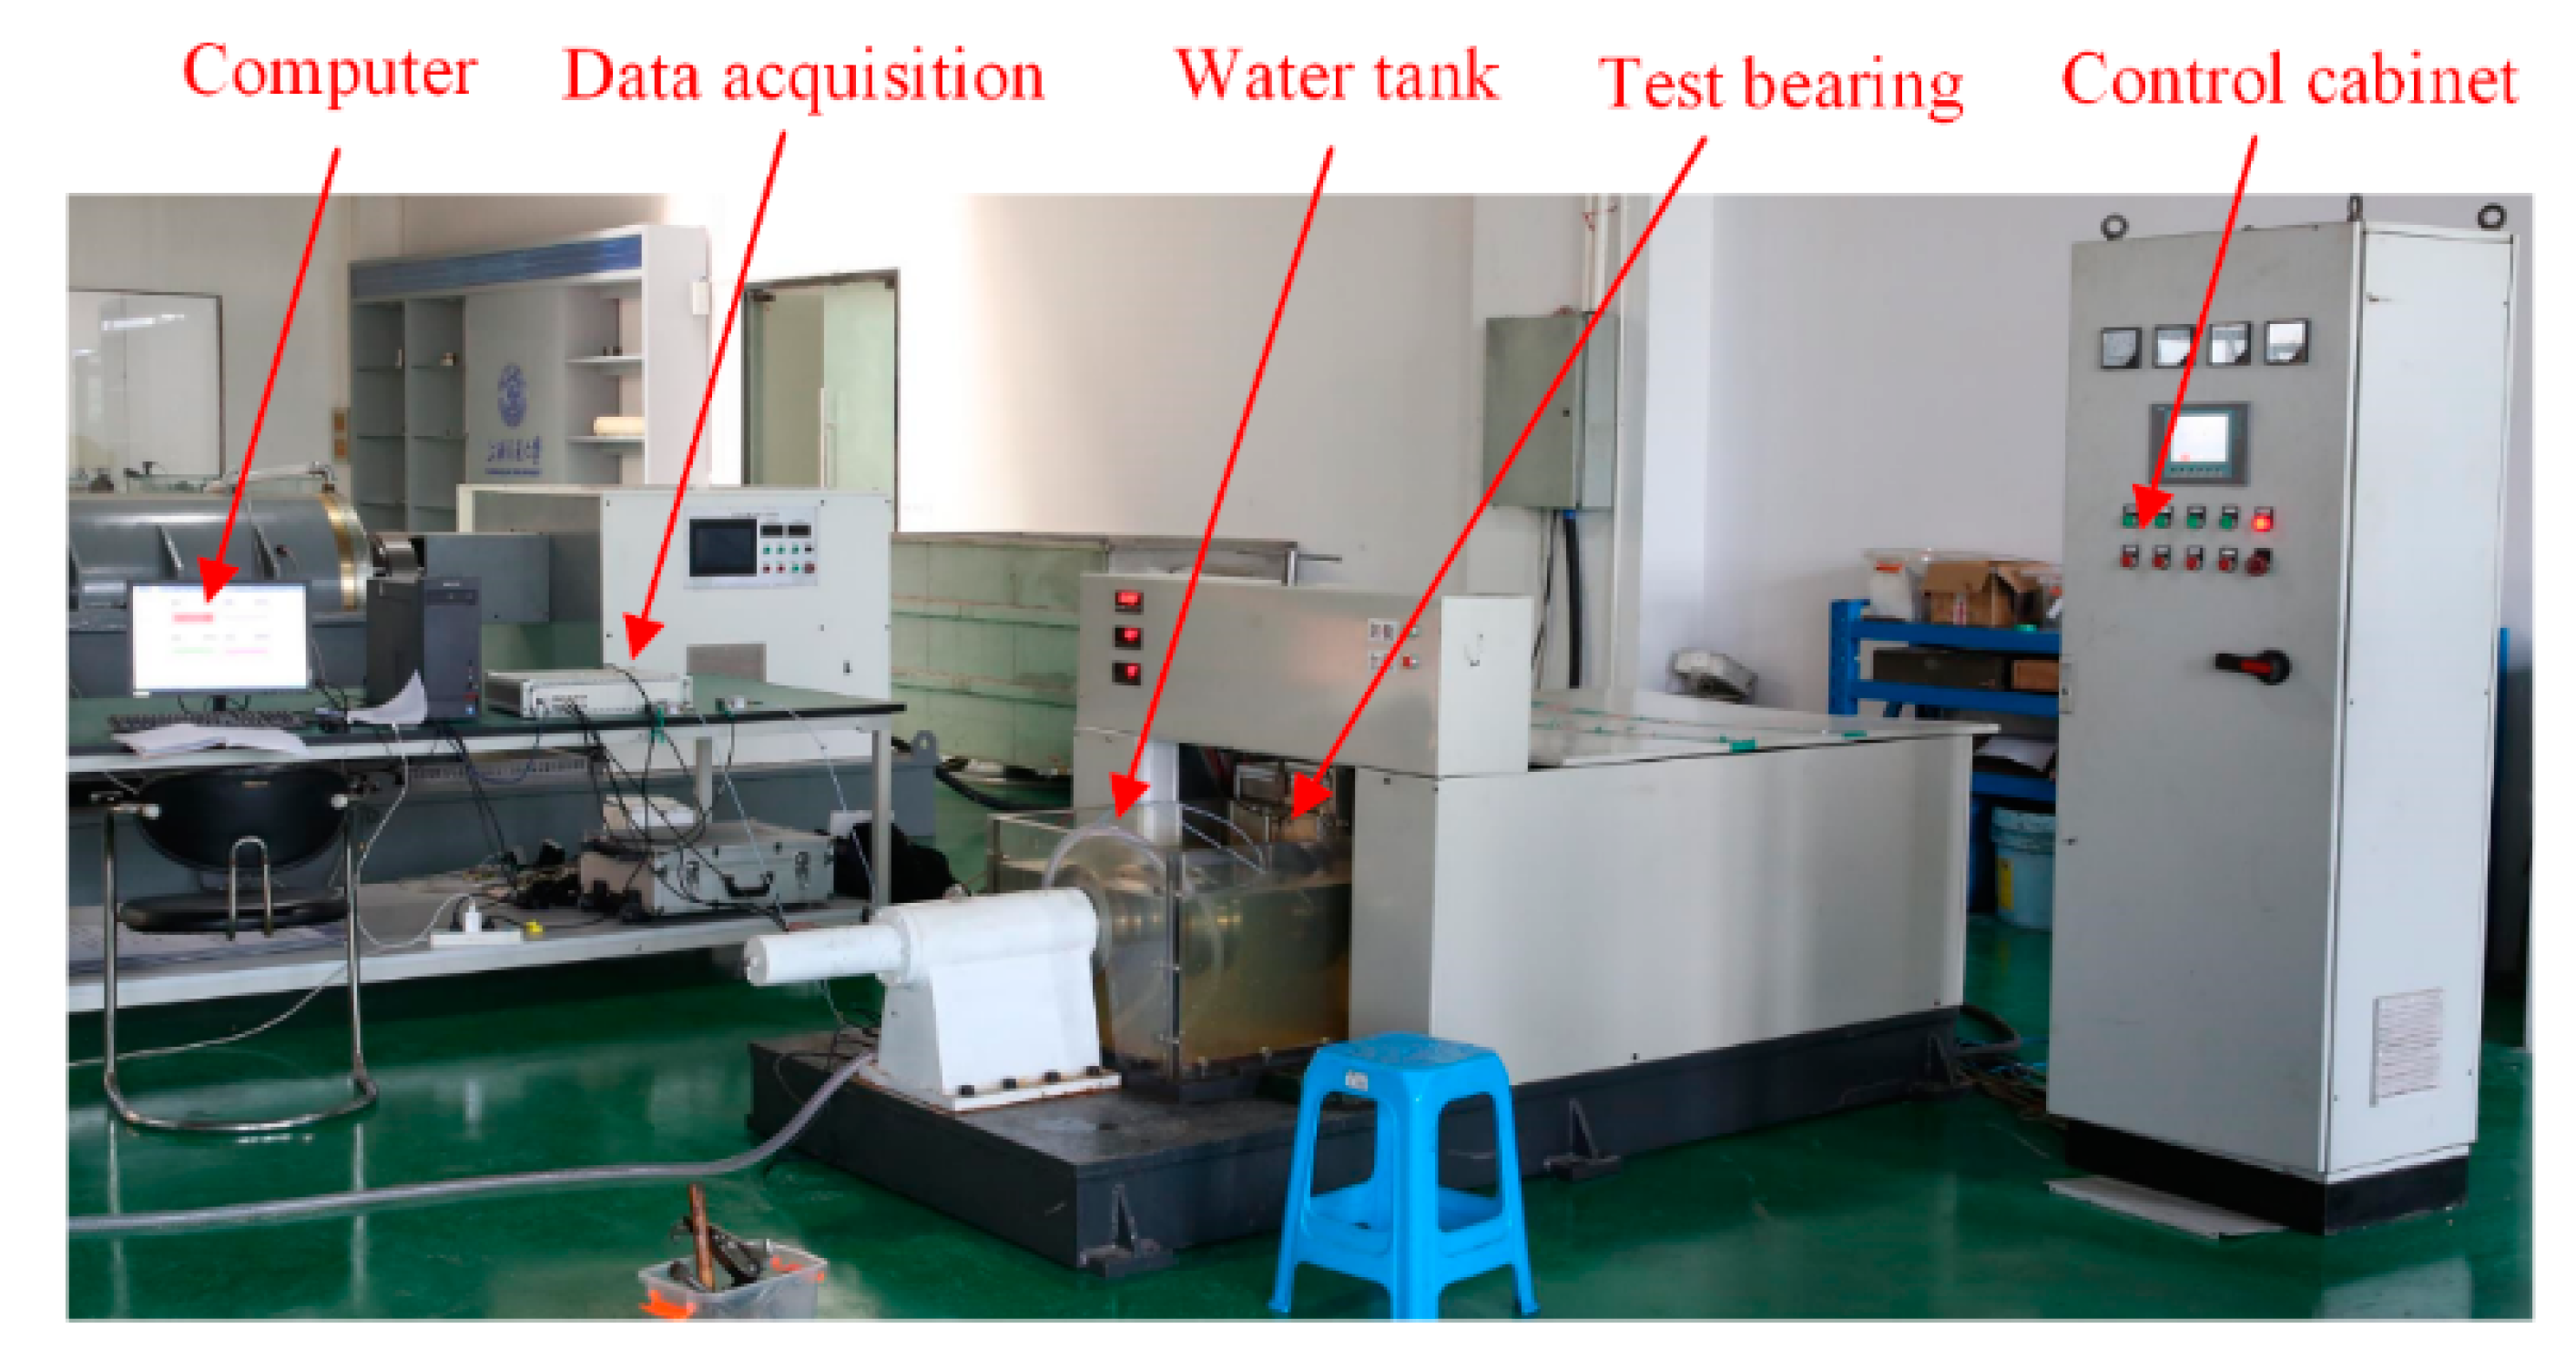
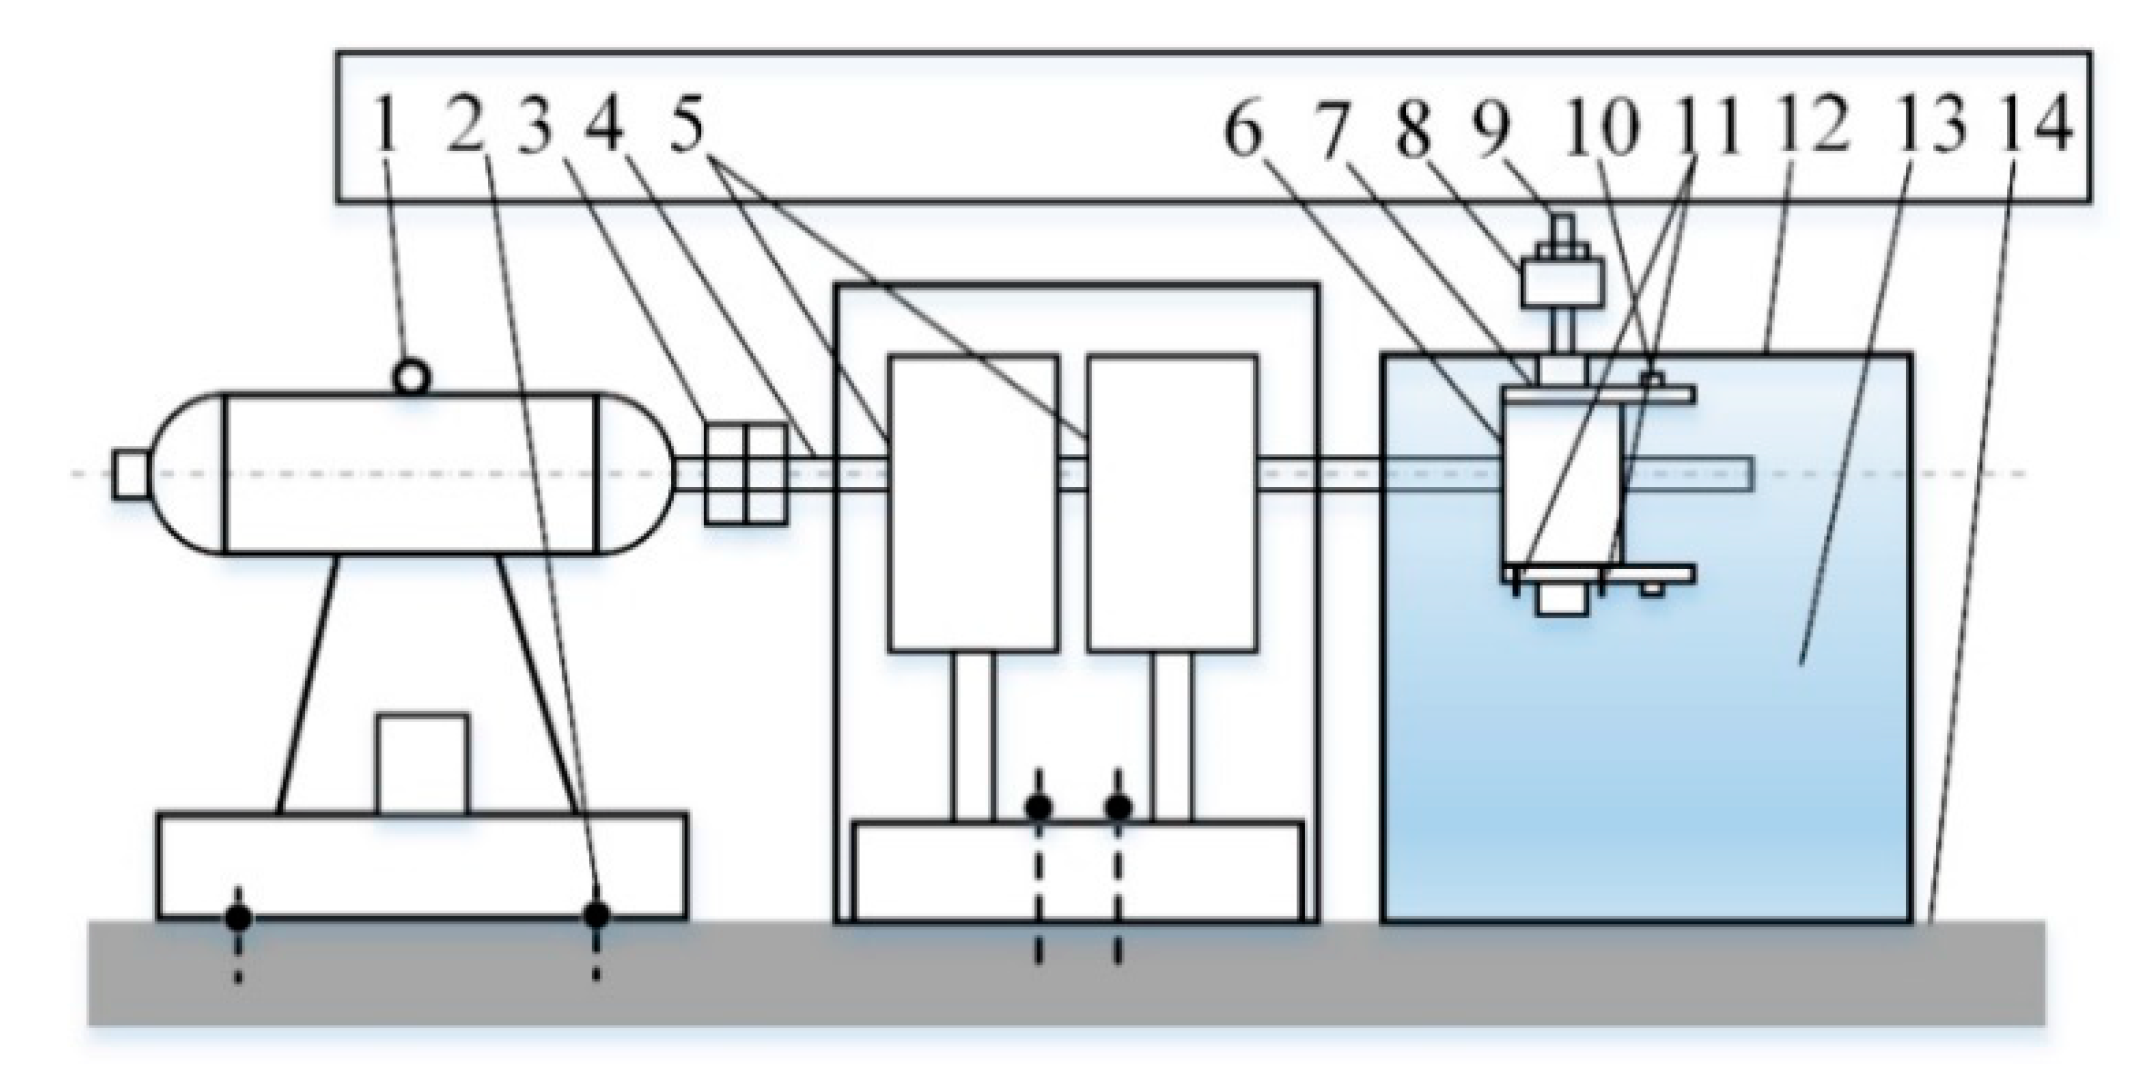
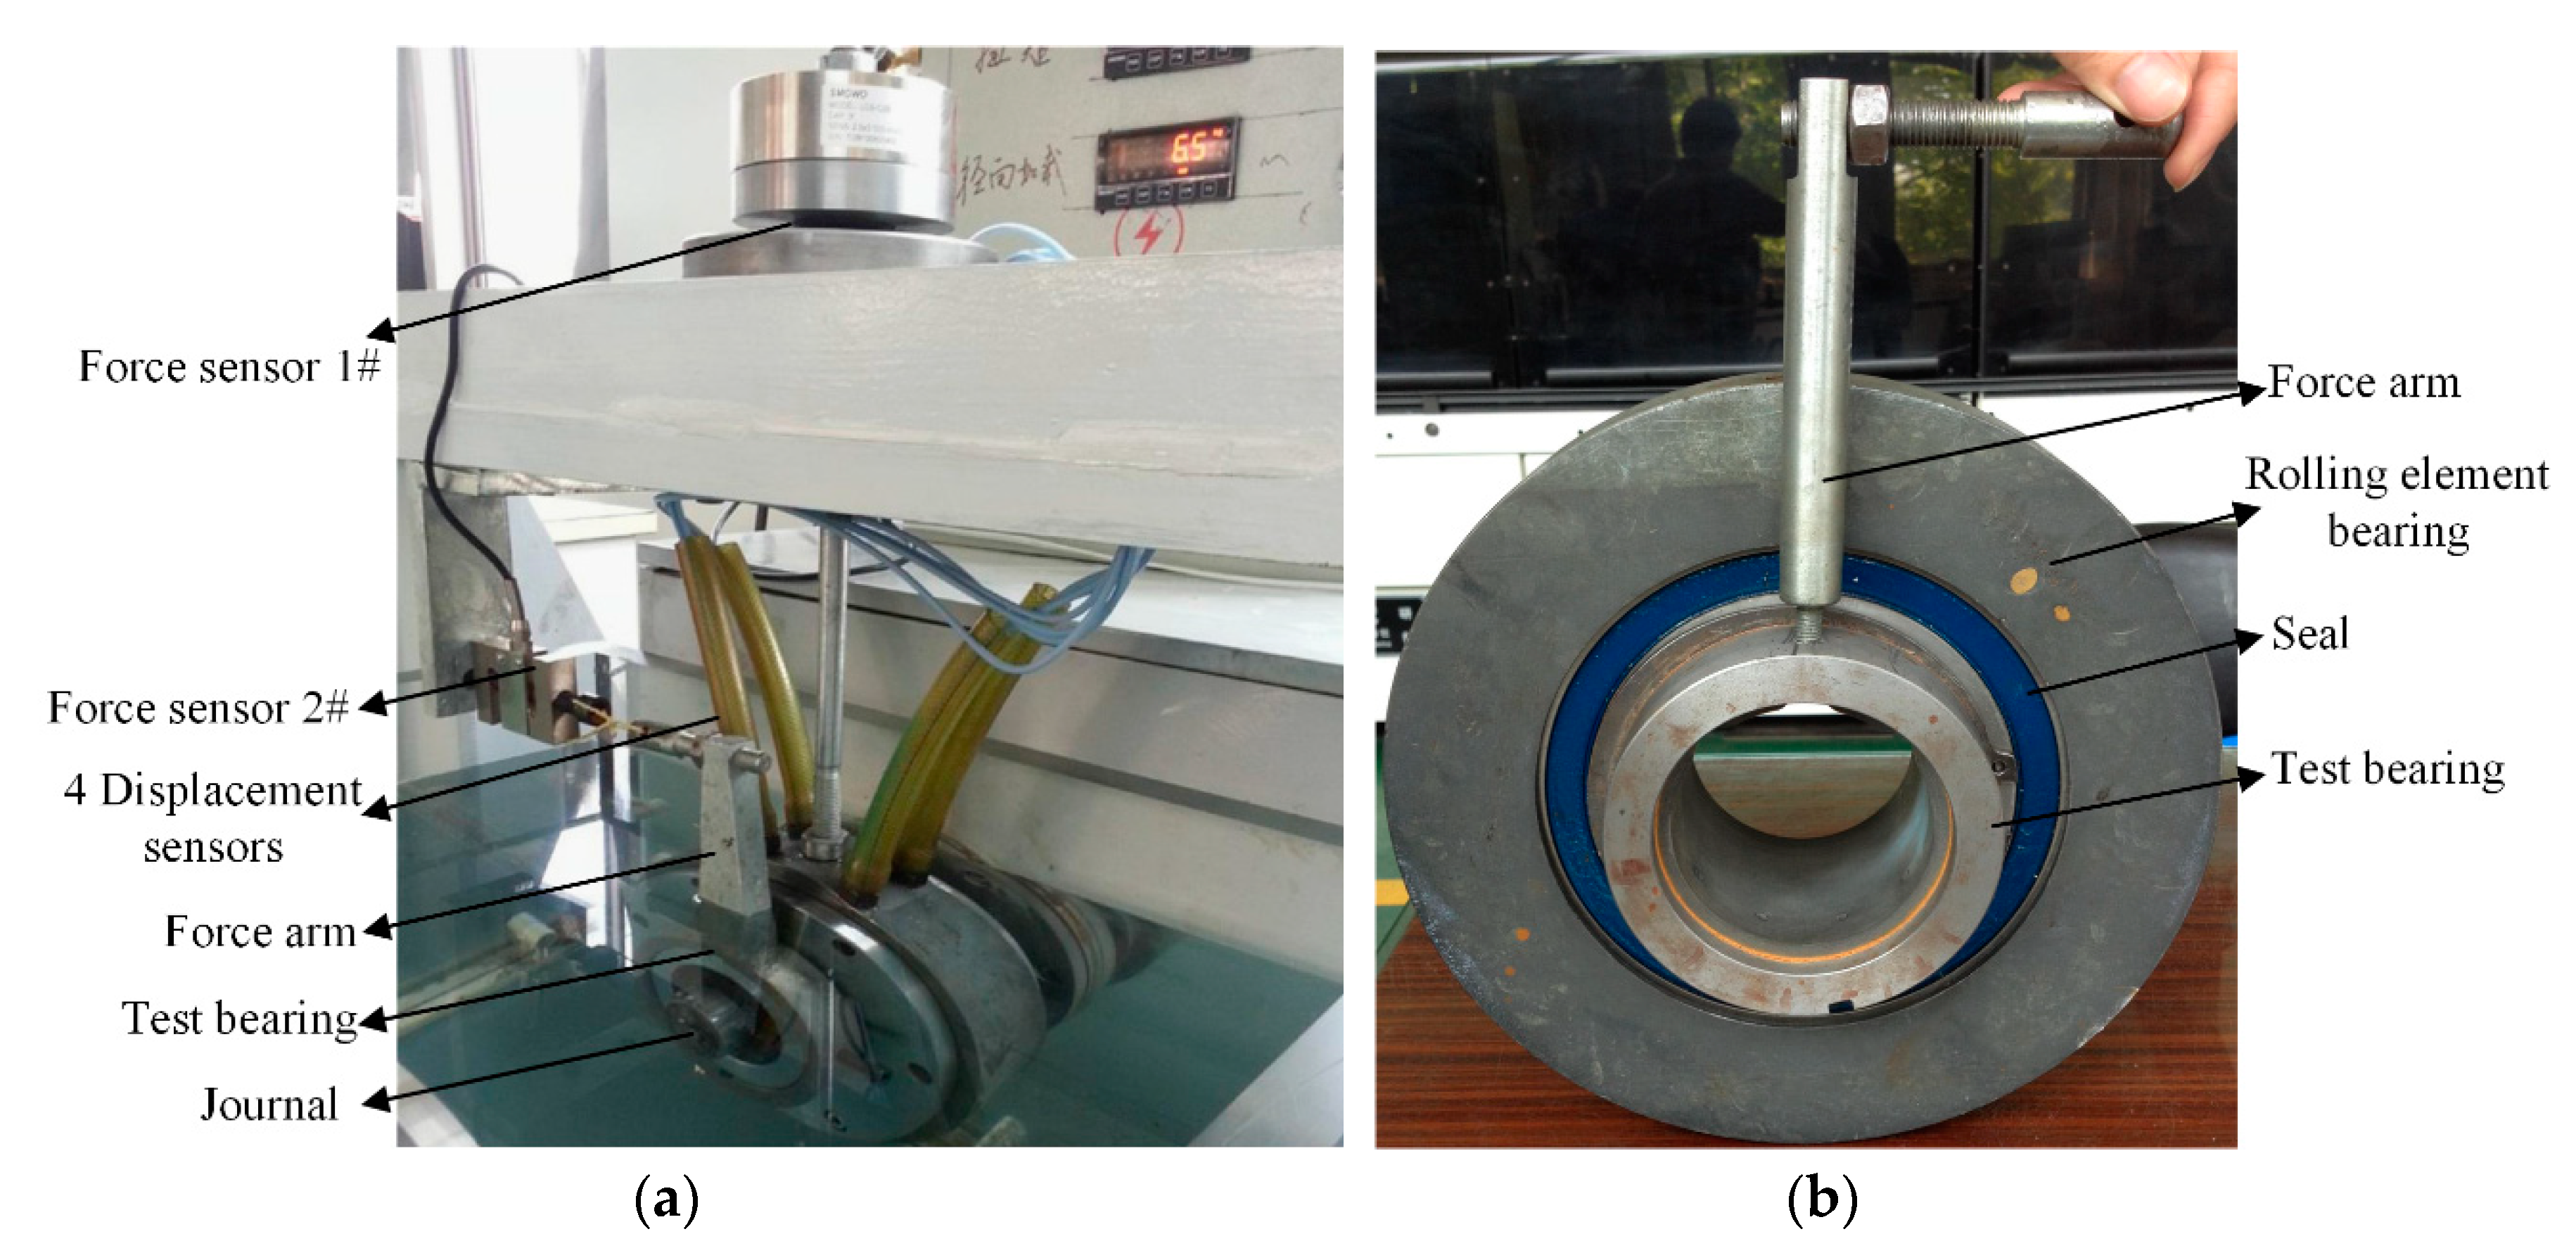
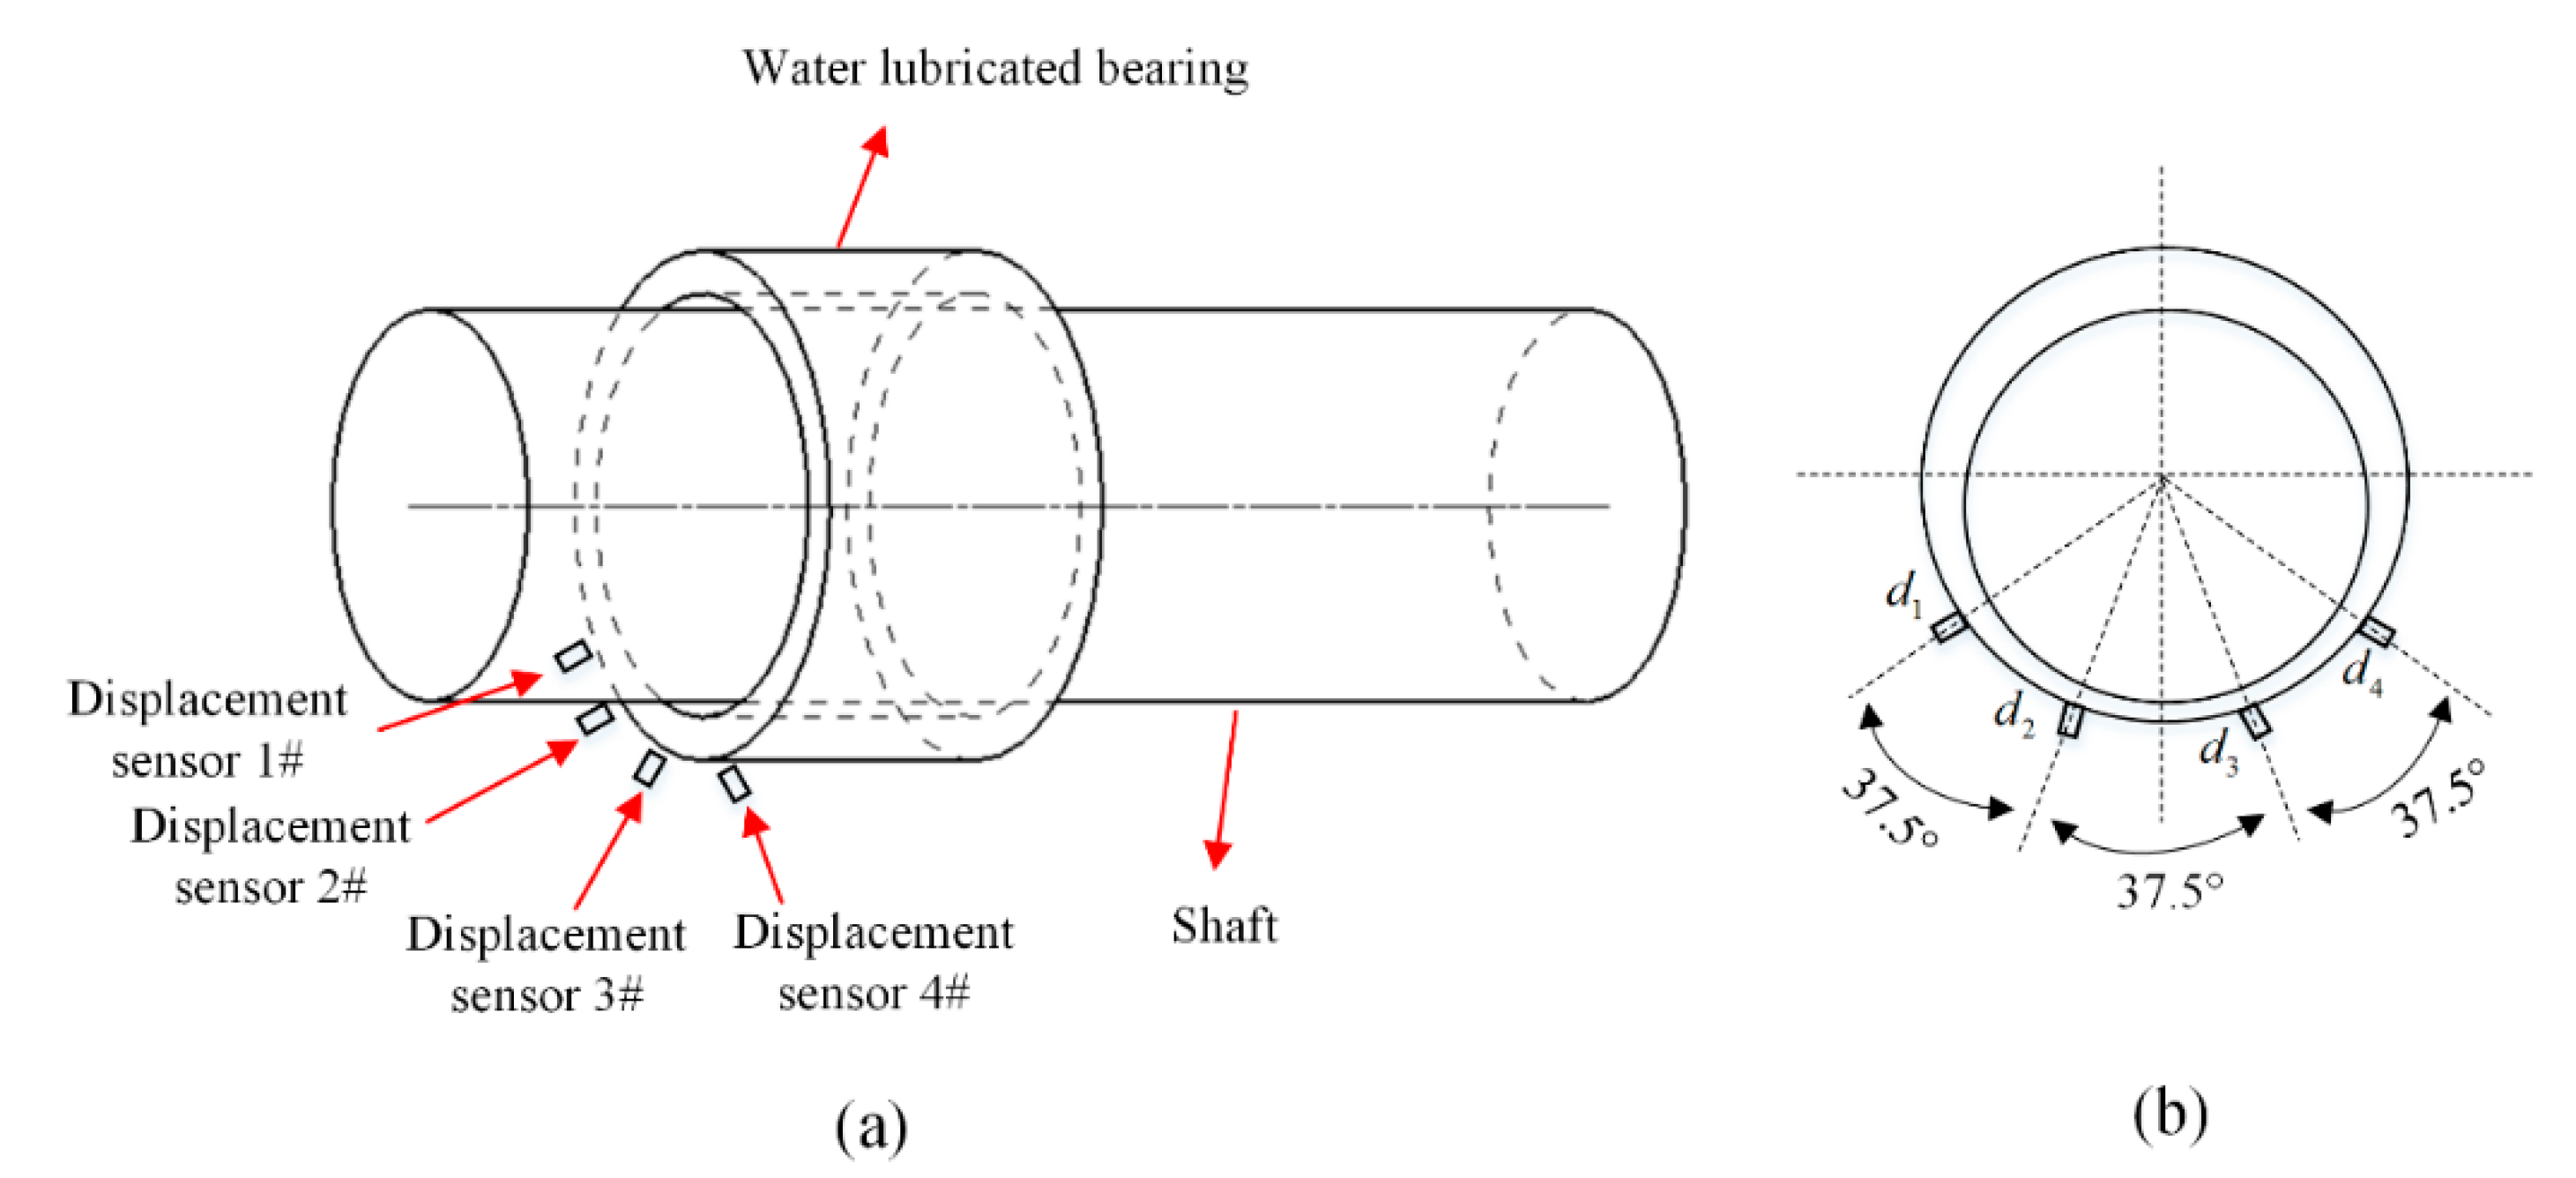
3. Experimental Section

3.1. Test Apparatus

Figure 2 presents the experimental apparatus, and Figure 3 illustrates the simple line drawing of the system. For this study, a multi-function bearing-rotor coupled system was used. Different types of bearings could be tested, for example, plain journal bearings, rolling element bearings, and thrust bearings. The shaft was supported by two hydrostatic bearings between the coupling and the test bearing. These two hydrostatic bearings stiffened the rotor system and decreased the deformation of the shaft when vertical load was applied on the tested bearing. They decreased the influence of overhung load and improved the accuracy of the system.
The lubricant tank contained the lubricant (for this test, it was water), and the test bearing was completely immersed into the lubricant to guarantee full film lubrication. For the lubricant, water at room temperature (20 °C) was used. Then, the bearing was fully submerged into the water tank; thermal effects were negligible during the experiment. In the case of water, the viscosity is almost independent of the temperature, which means that the viscosity remains constant.
Four displacement sensors were installed in the housing along the circumferential direction. The test bearing was subjected to external load through a hydraulic cylinder system. Maximum velocity of the shaft was 6000 rpm. Specific pressure for the bearing was 0–2 MPa, which could be adjusted according to the practical operating mode.
The test bearing was subjected to external load through the vertical load unit. Figure 4a presents the load unit on the bearing. Two force sensors and four displacement sensors were installed on the apparatus. Force sensor #1 measured the external load in the vertical direction, and Force sensor #2 measured the tangential force in the circumferential direction. Four displacement sensors were uniformly distributed along the circumferential direction and measured the rotor vibration and the film thickness. The bearing was completely immersed into the lubricant in order to guarantee full-film lubrication. Figure 4b gives a closer view of the external load unit.

3.2. Experimental Procedure
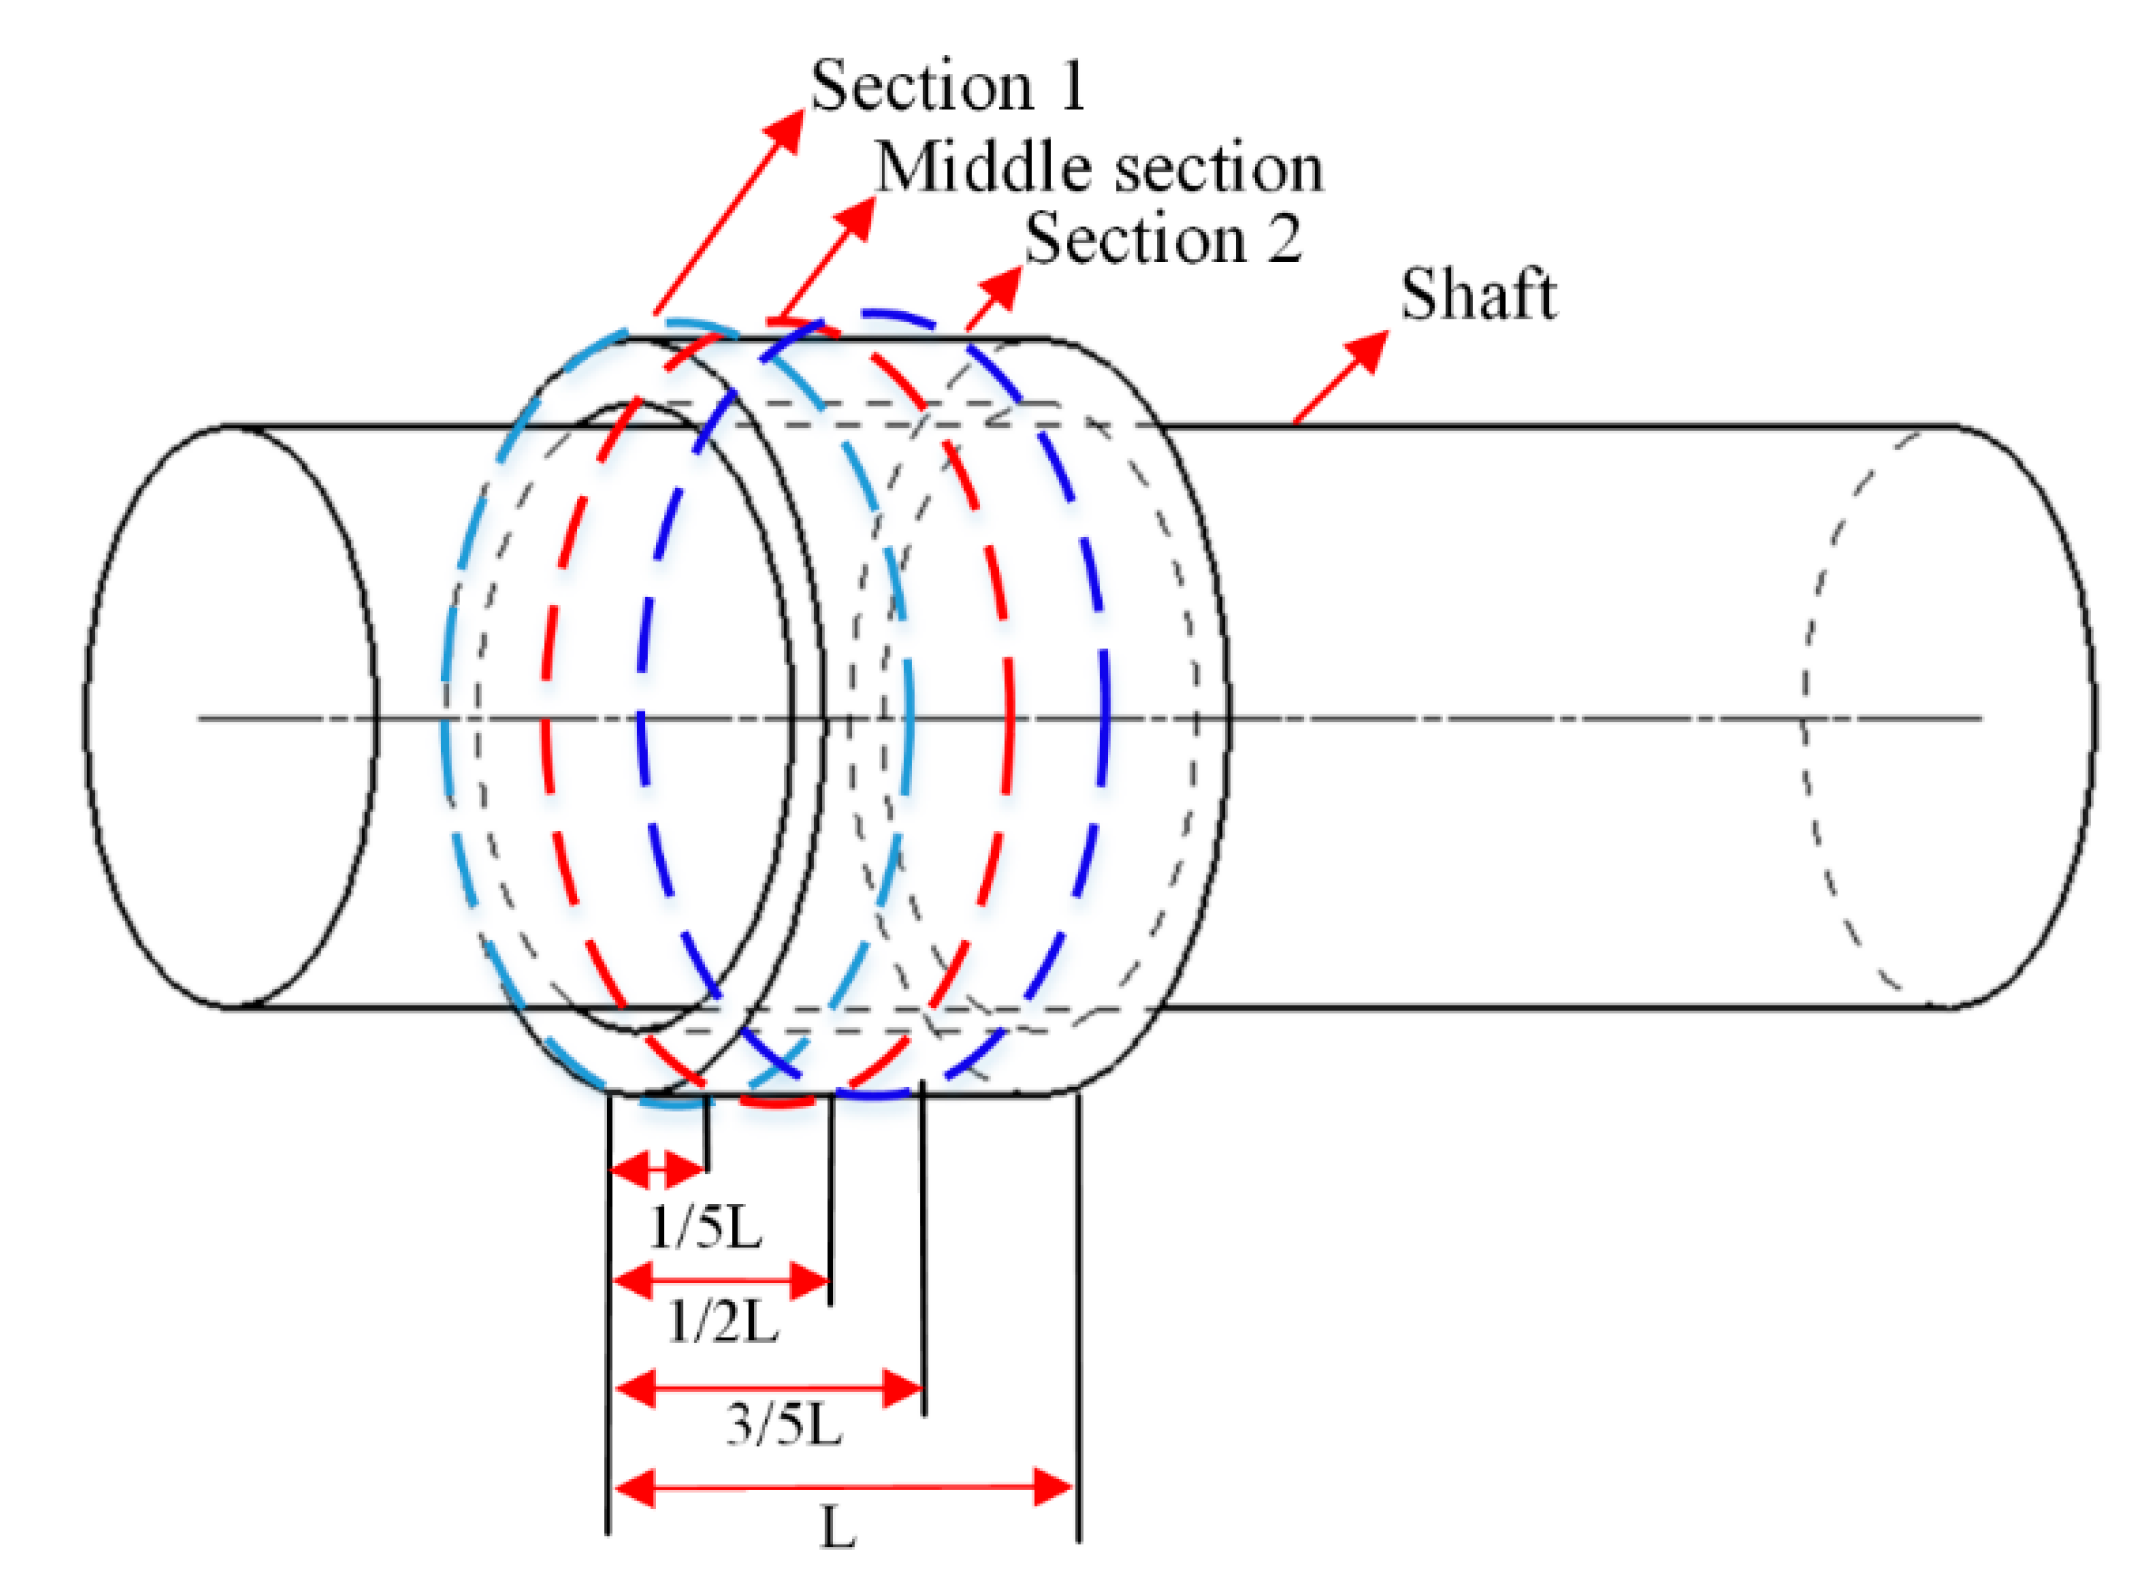
In order to measure the film thickness, four displacement sensors were mounted along the circumferential direction (as can be seen in Figure 5a,b). If the exact value of the radial clearance is C0, then assume the initial value of the radial clearance to be C. With the given parameters, the film thickness distribution h and the pressure distribution p can be calculated theoretically. Furthermore, the distances between the bushing and shaft can also be obtained: d10, d20, d30, d40. At the same time, the distances can also be measured: d1, d2, d3, d4.
If | d 10 d 1 | 0.5 μ m , | d 20 d 2 | 0.5 μ m , | d 30 d 3 | 0.5 μ m , | d 40 d 4 | 0.5 μ m , the radial clearance of the bearing is C. Otherwise, one can modify the value of the clearance and restart the loop until it is convergent. The convergent criterion was 0.5 μm. Then, after the minimum value of the film thickness distribution is found, the minimum film thickness hmin is obtained.

3.3. Test Bearing

Geometry parameters of the test bearings can be found in Table 1. The measured dry friction coefficient between steel and bushing is 0.13. Therefore, in order to explore the effect of surface topography on lubrication performance of the bearing, several sets of test bearings with different surface roughness Sa were processed (as can be seen in Table 2).
In the experiment, the following parameters were measured: F is the total external load exerted on the bearing, which includes the bearing gravity, Tf is the tangential force, and Tf × R is the friction torque. Other parameters include the following: D is the diameter and G is the bearing gravity.
The force applied on the bearing is as follows:
F r = F G
The coefficient of friction of the bearing is as follows:
f = 2 × T f × R F r × D
For the test bearing, R = 205 mm, D = 62 mm, G = 150 N, the expression of the friction coefficient is as follows:
f = 205 T f 31 F r
The measuring accuracy of the eddy–current sensor was 0.1 μm, whereas the sampling frequency was 1000 Hz. The nonlinear error ≤ ±0.1%, and the response frequency was 10 kHz. The measuring accuracy of the force sensor was 0.1 N. During the test, the data acquisition system should balance to ensure the equilibrium position of the shaft. The test data were recorded about 180 s under each working mode. Before the data acquisition, the test bearing should run for several minutes. The friction values fluctuate periodically with time with a small amplitude. A more detailed description of the test bearing can be found in the reference [34,35].

4. Results and Discussion

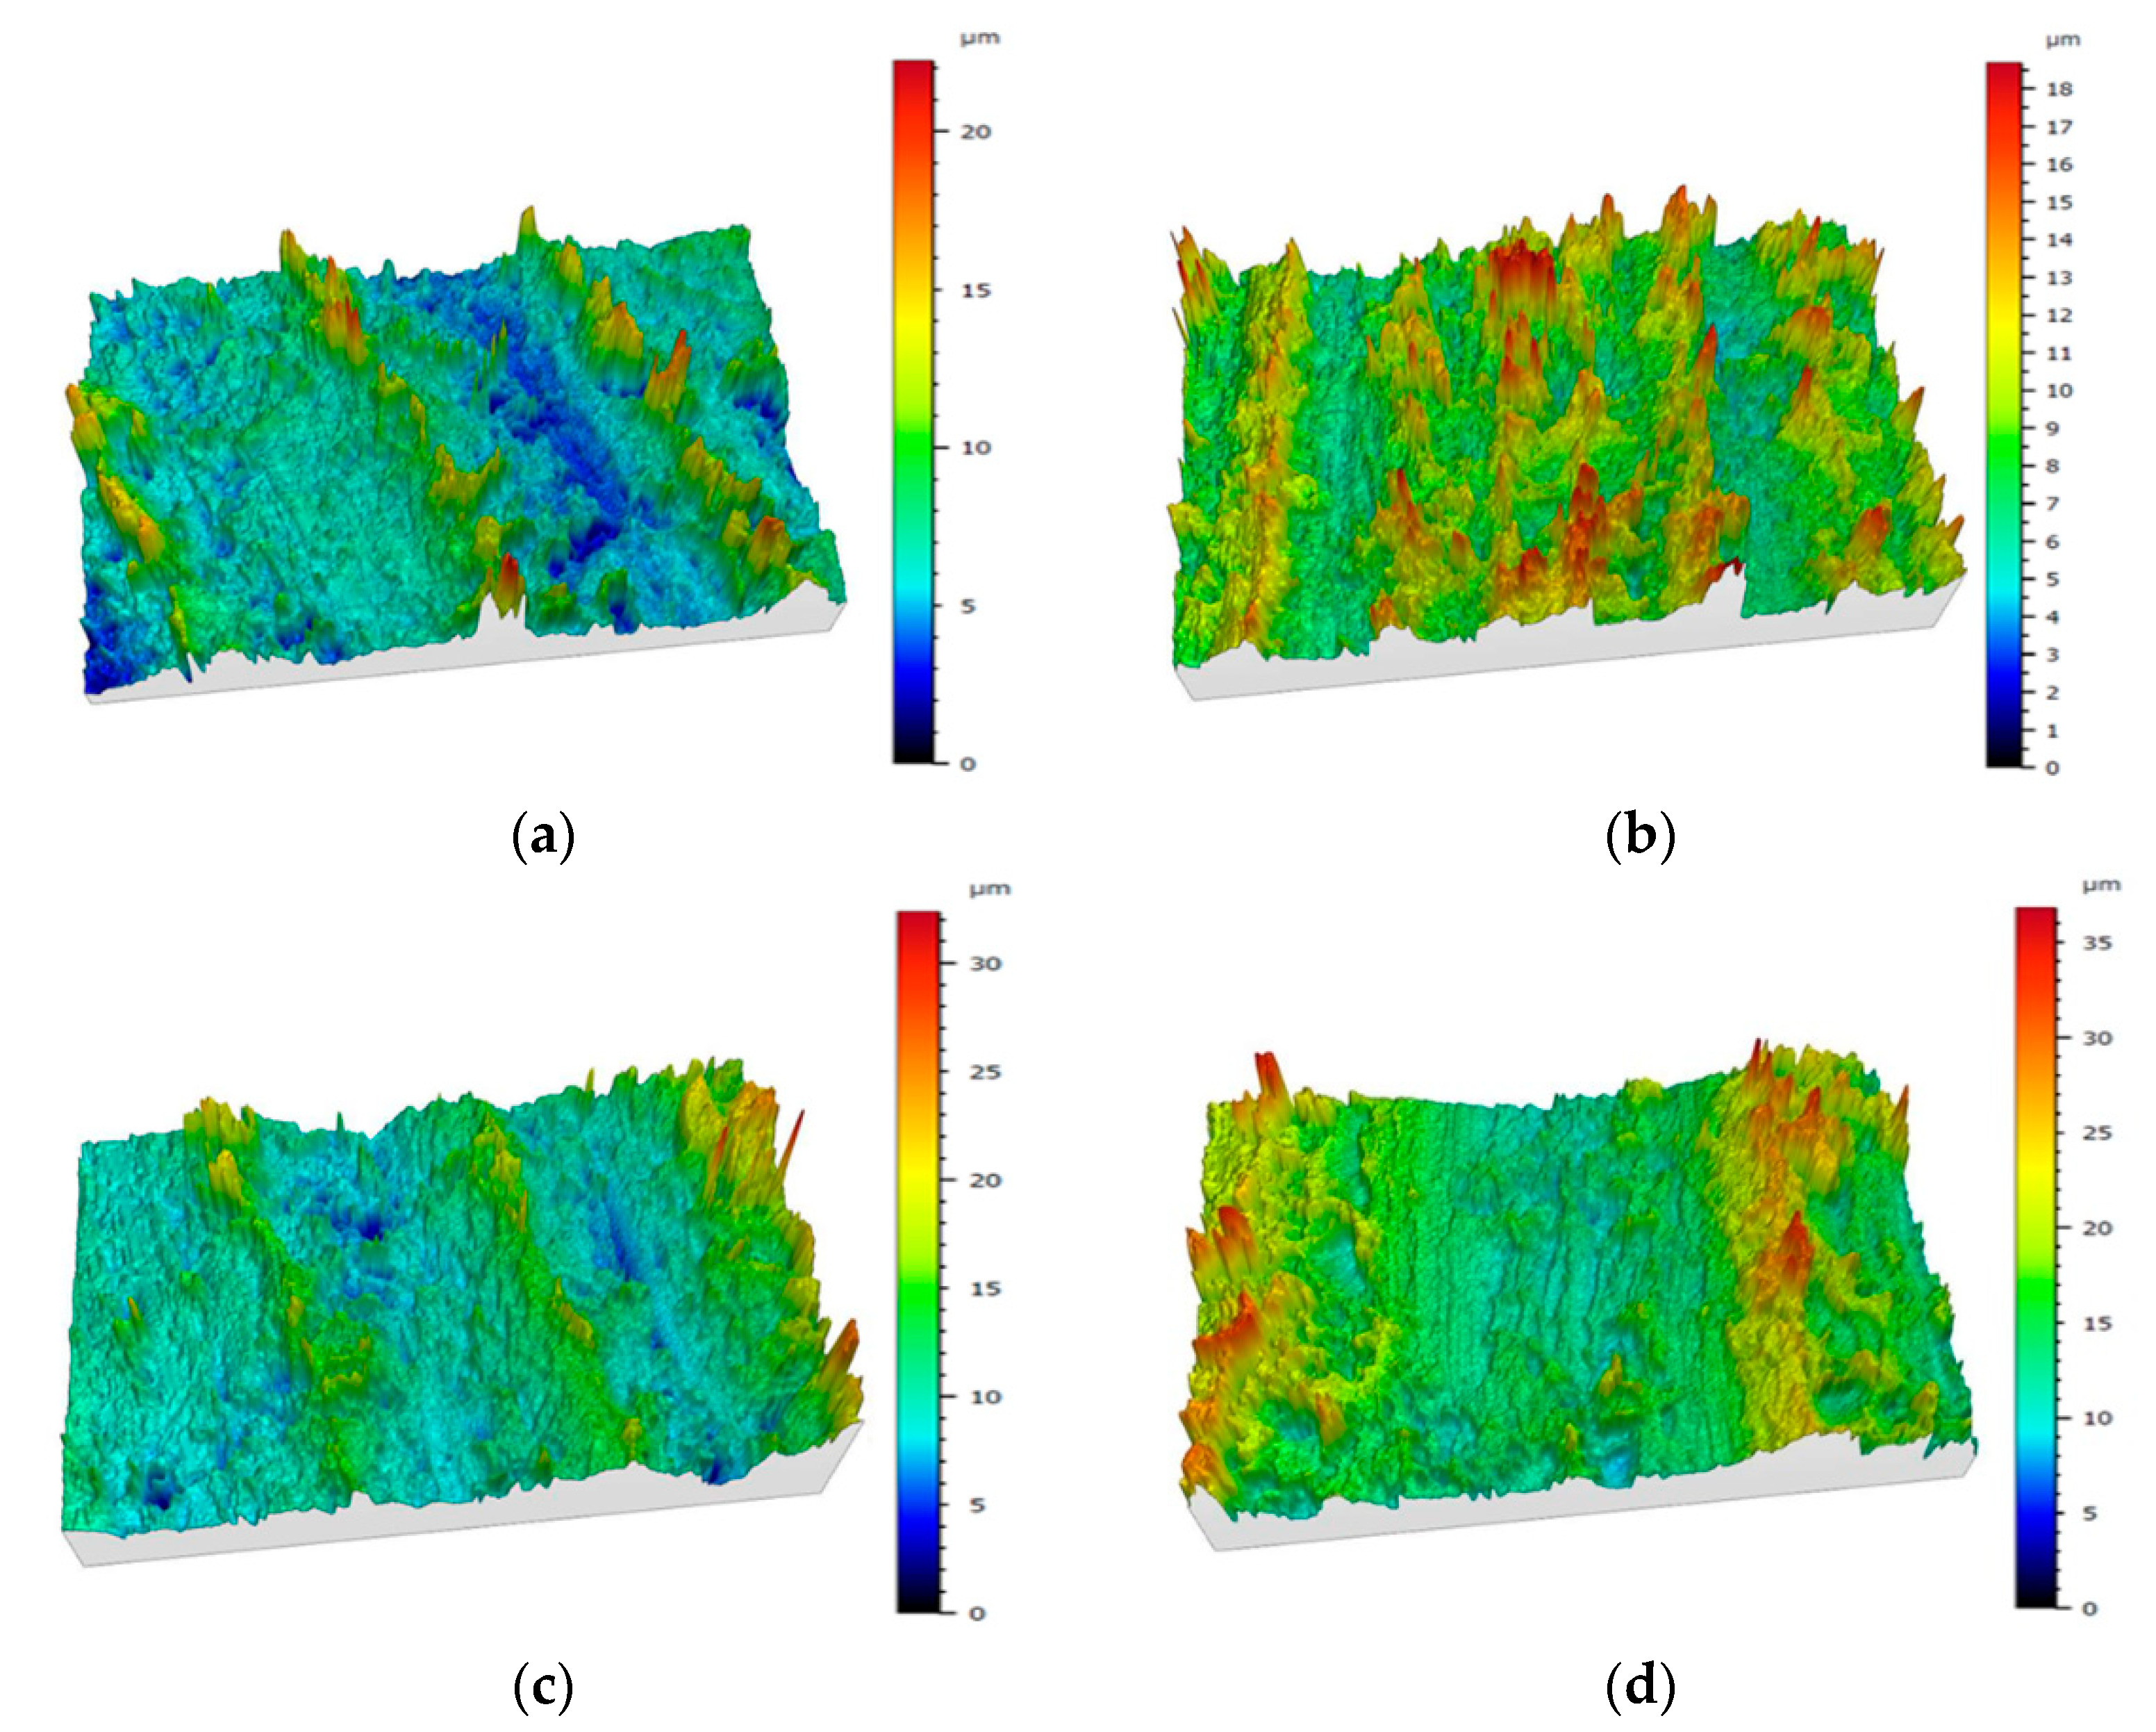
4.1. Measurement of Surface Topography

Figure 6a–d shows the 3D morphology distribution of the four test bearings. Table 2 gives the characteristic parameters of the surface topography for the four tested samples. Sa is the arithmetic mean height; Sq is the root mean square height; Vmp is the peak material volume, which represents the part that will be worn out in the test; and Vvv is the pit void volume.
One thing to note for scientific validity is that more than one sample extract per surface should be investigated. In the experiment, dozens of samples were extracted for one surface. Characteristic surface parameters were measured for the samples. Mathematic algorithms exist within the Universal Profilometer that can automatically deduce the characteristic surface parameters for the surface. In this study, we only present one 3D morphology distribution contour for each test surface.
From Table 2 we can see the variation of the real surface topography for the four tested samples. For samples #1, #2, #3, and #4, the arithmetic mean height and the root mean square height increase correspondingly with the surface roughness. After the experiment, characteristic parameters were significantly reduced, which shows the improvement of the surface topography.
Typically, in the start-up and shut-down stage of the bearing-rotor coupled system, the water-lubricated plain journal bearing is at low speed and heavy load state and the film is thin (film thickness may be less than 10 μm in most cases). In some extreme operating conditions, the film thickness may be just a few microns. Water film thickness has almost the same order of magnitude as the bushing interface topography (machining accuracy of composite material bushing >1.6 μm), thus the film thickness ratio is very small. Direct contacts of micro-asperities take place under certain conditions. These undoubtedly affect the fluid hydrodynamic. Therefore, we will investigate further and experimentally verify the lubrication state transitions of the bearing.

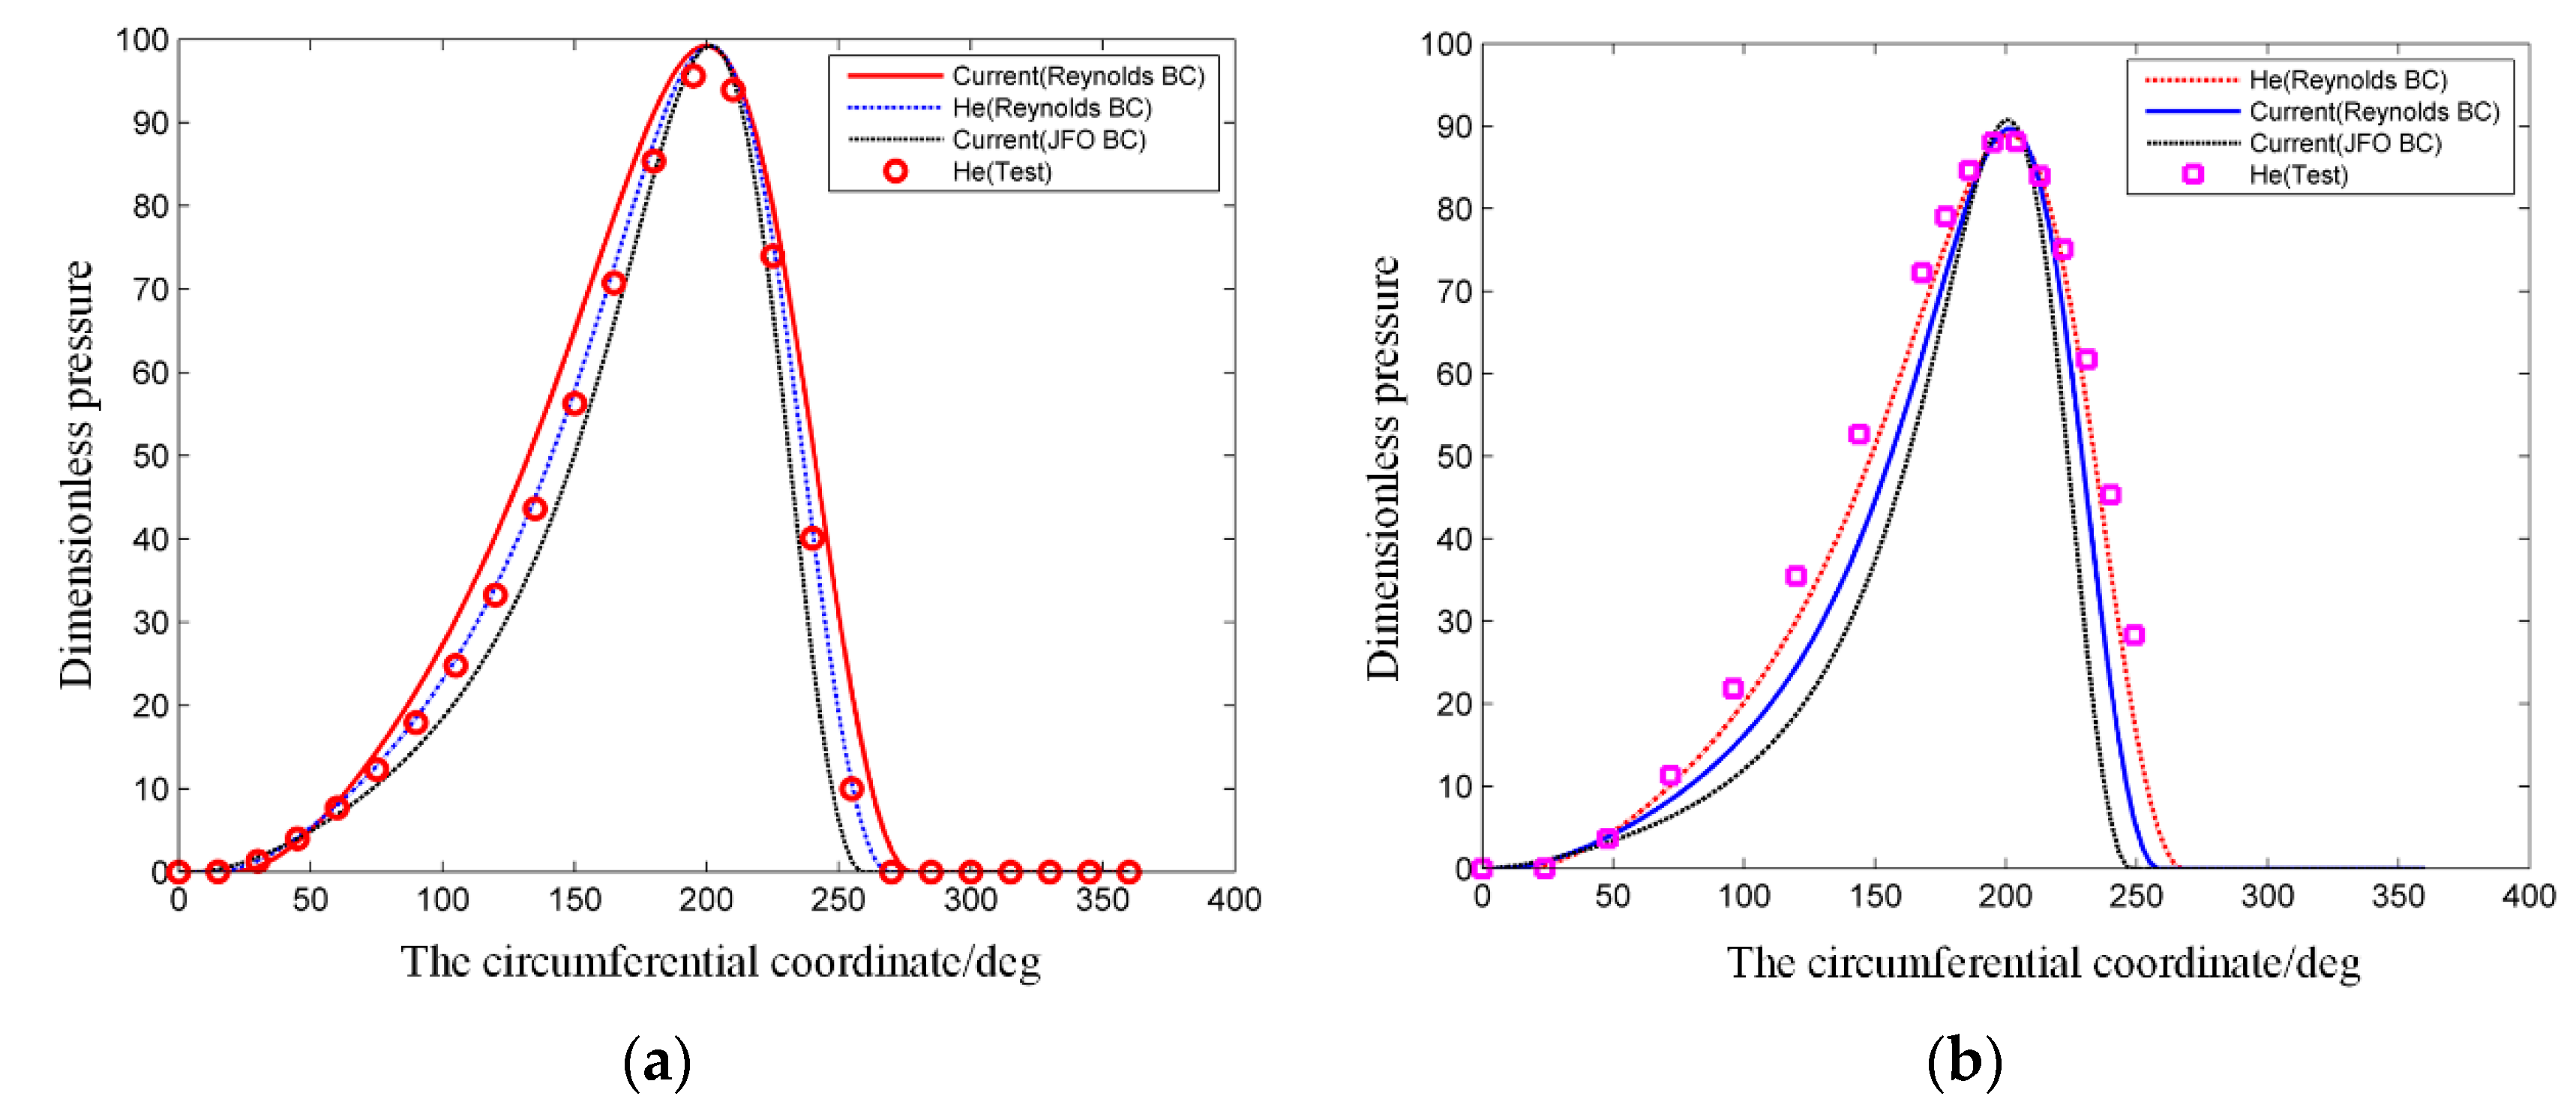
4.2. Verification of the Model

The accuracy and reliability of the model and algorithm were prerequisites for the study. The accuracy of the model was verified by comparing the results with reference [20]. Figure 7 presents the schematic diagram of the relative position of Sections 1 and 2 on the test bearing. Sections 1 and 2 are the two separate sections on the bearing in the axial direction. Section 1 is located at the 1/5 L of the bearing, whereas Section 2 is located at the 3/5 L of the bearing. Figure 8 shows the comparison of pressure distribution between this research and the reference, for Sections 1 and 2 (as shown in Figure 7). Pressure data in the circumferential direction along the liquid film at the two sections of the bearing were extracted and compared with the theoretical analysis and experimental results in the reference, as shown in Figure 8.
From Figure 8, we can see that this study’s simulation corresponds well with the literature under two boundary conditions, the Reynolds boundary condition and the Jakobsson-Floberg-Olsson (JFO) boundary condition, which proves the accuracy of the model and algorithm. Pressure under the Reynolds boundary conditions shows better correspondence with the reference [20]. The following calculation is based on this model under the Reynolds boundary conditions.

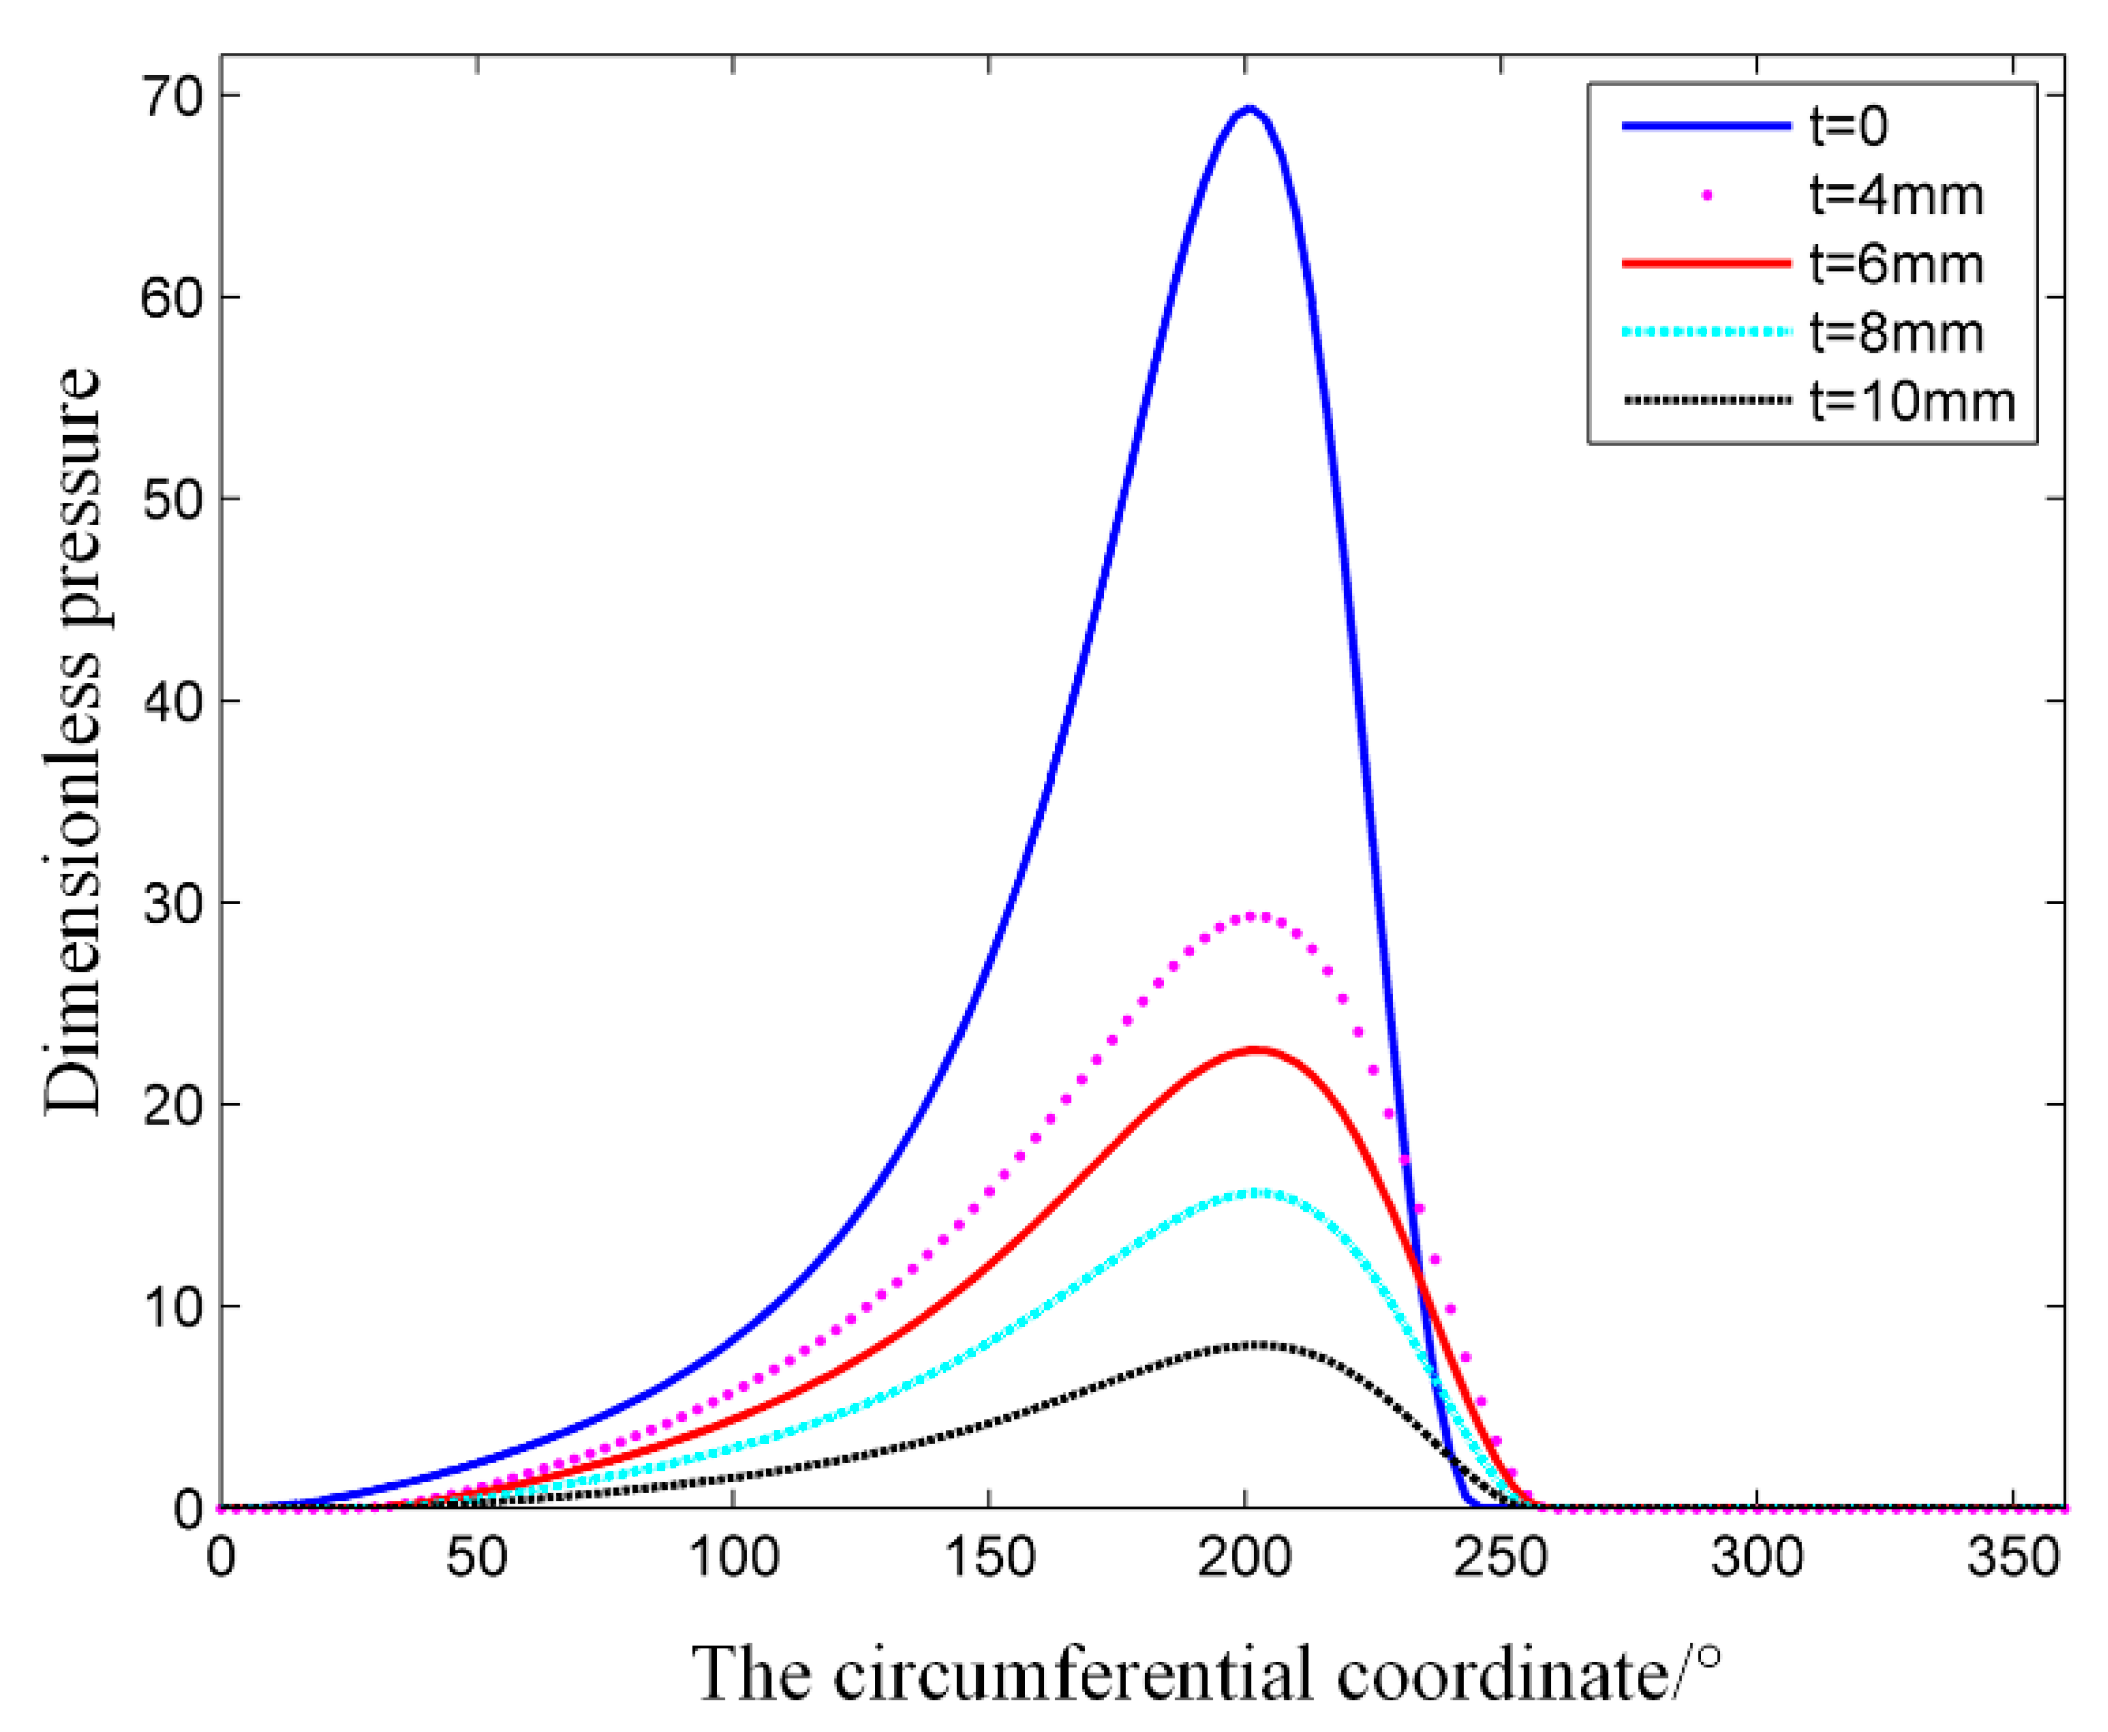
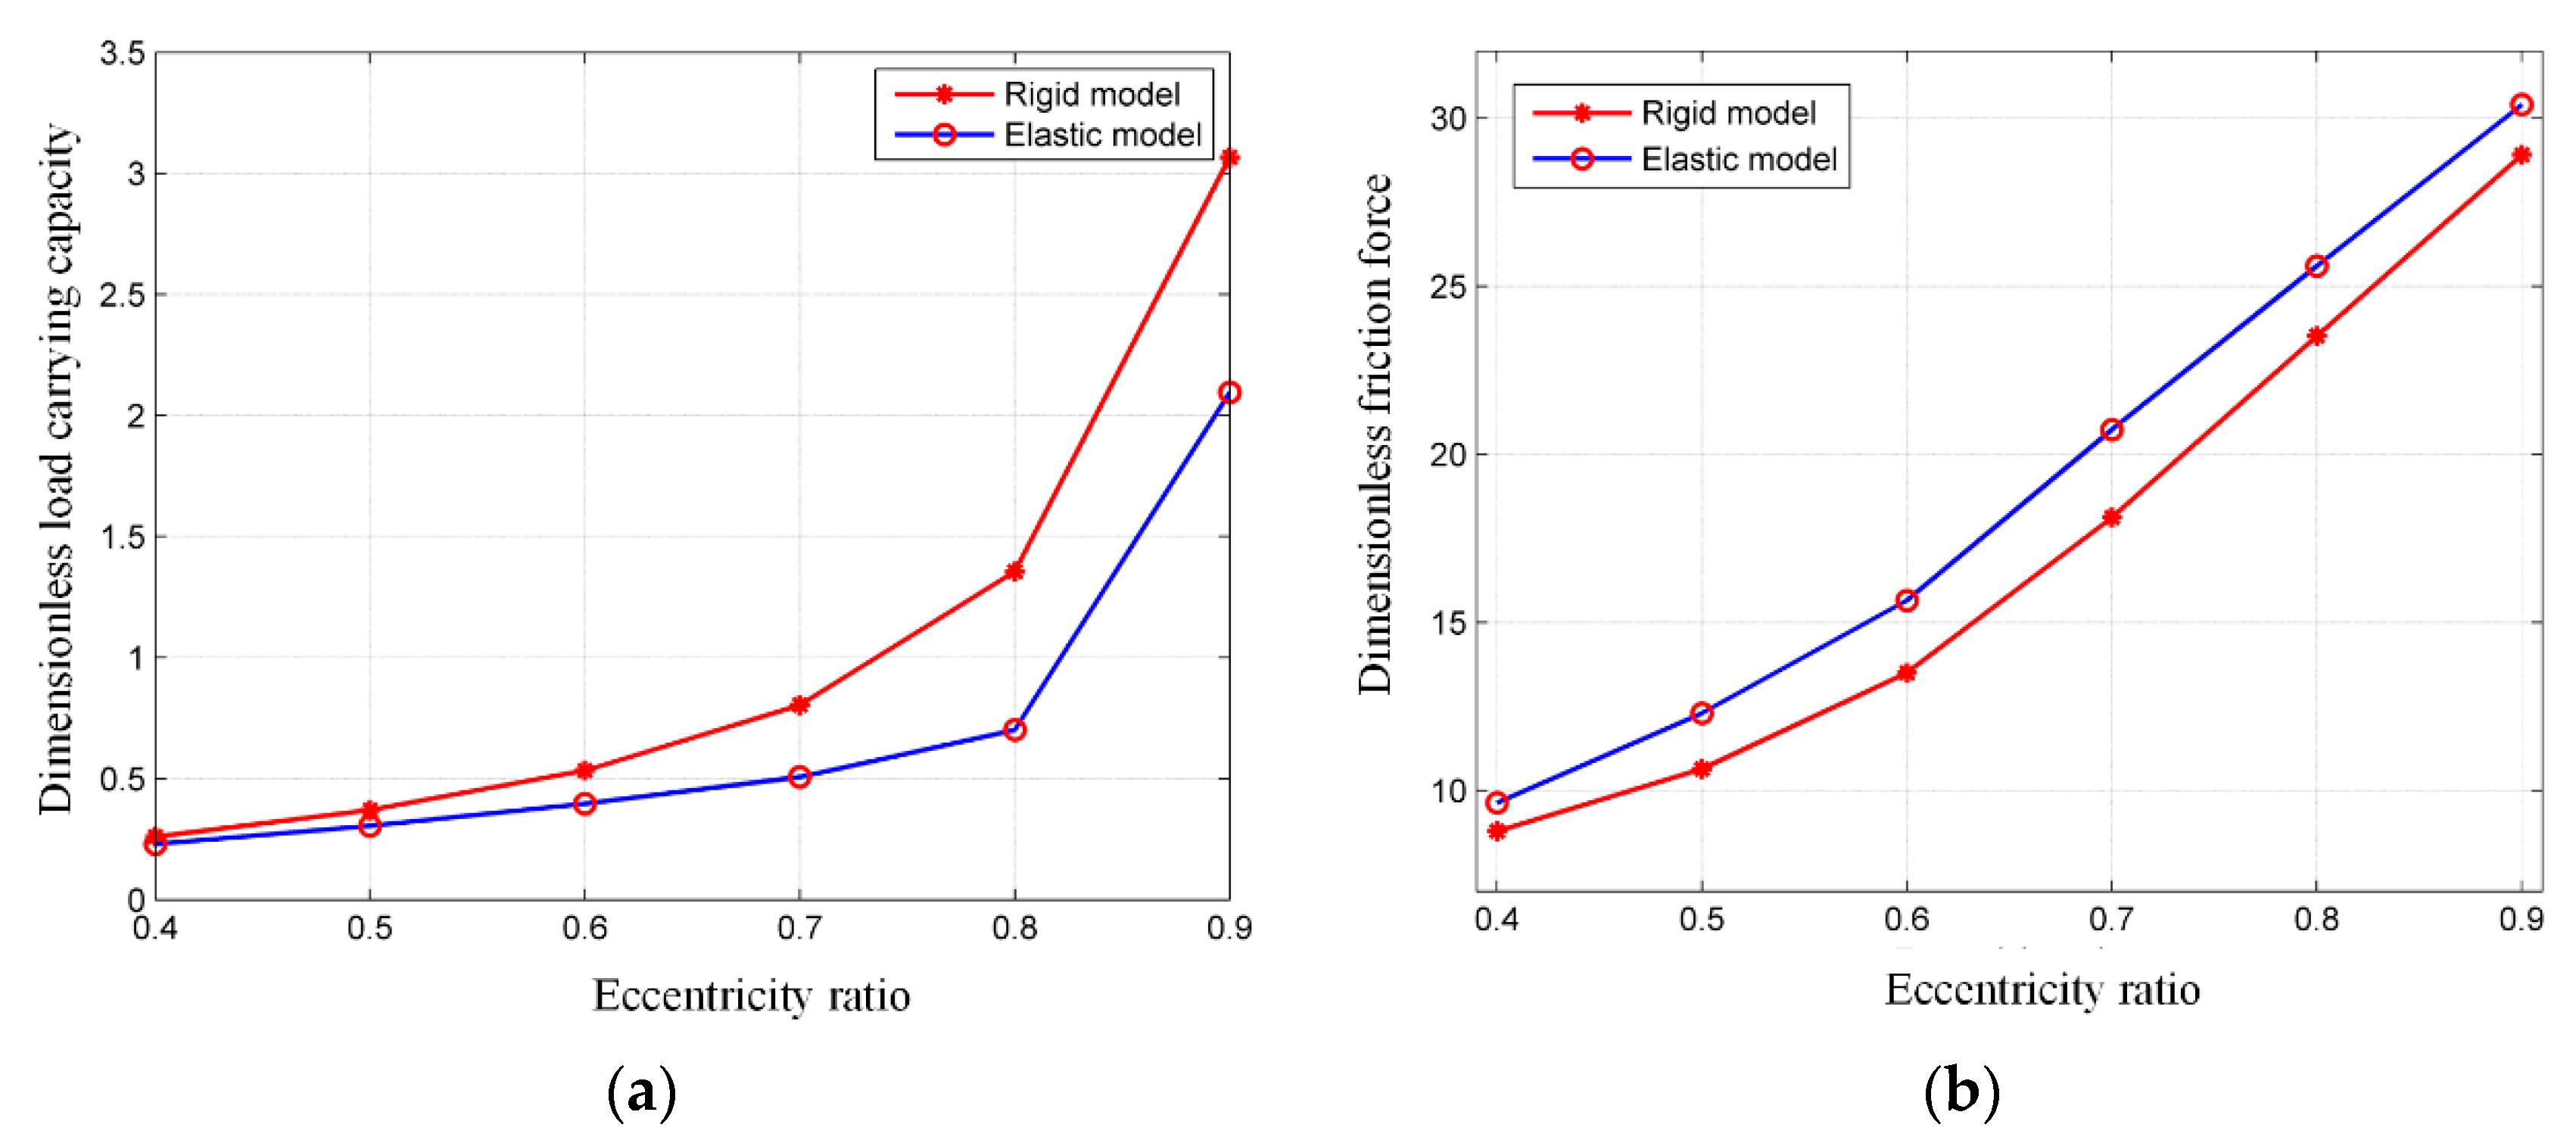
4.3. Effect of Elastic Deformation of the Bushing

Figure 9 shows the effect of eccentricity ratio epsilon on the pressure distribution in the circumferential direction. As the eccentricity ratio epsilon increases, the maximum value of pressure increases, which shows a strong nonlinearity. At the same time, the main load-carrying area decreases.
Figure 10 shows the effect of bushing thickness on the pressure distribution in the circumferential direction. We observe that the thicker the bushing, the smaller the film maximum pressure. The main load-carrying area also increases with the bushing thickness increase. Correspondingly, the load-carrying capacity and friction coefficient decrease. This can be explained from the perspective of energy, that is, if the bearing bushing is absolutely rigid without elastic deformation, the external load will be balanced by the film thickness. However, under the same conditions, the bushing deformation will absorb part of the energy and share the external load together with the water film. The thicker the bushing, the more energy the bushing will absorb thereby reducing the maximum pressure of the film. This is also the bushing’s mechanism of cushion and shock absorption.
Figure 11 shows the effect of elastic deformation on the dimensionless load-carrying capacity and the friction force. The rigid model represents the model which does not consider the deformation of the bushing, whereas the elastic model considers the deformation. Load-carrying capacity and friction force both increase with the eccentricity ratio. Load-carrying capacity with elastic deformation is smaller than that of the rigid model, whereas friction force is higher than that of the rigid model. The difference between the rigid and elastic models gradually increases with the eccentricity ratio.
Figure 12 shows the effect of elastic deformation on the dynamic coefficients. With the increase in the eccentricity ratio, the dynamic coefficients Kxx, Kxy, Kyx, Kyy, Cxx, Cxy, Cyx, Cyy, increase for the rigid and elastic models. Dynamic coefficients with elastic deformation are smaller than that of the rigid model. The existence of elastic deformation decreases the rigidity of the bearing, which is beneficial for the stability of the bearing-rotor system. Elastic deformation decreases the maximum pressure and dynamic characteristics. The difference between the rigid and elastic models gradually increases with the eccentricity ratio.

4.4. Minimum Film Thickness

The minimum film thickness is the major judging criterion for the lubrication regime’s transition and the lubrication performance. Specific pressure, velocity and viscosity are the dominant influencing factors on the minimum film thickness. It is of vital significance to examine the minimum film thickness and its influencing factors.
Figure 13 presents the measured minimum film thickness as a function of velocity under different specific pressures for the test bearing. Under the same specific pressure, the minimum film thickness increases with the velocity. For different specific pressures, the changing rule is different. When the bearing is subjected to a light load (specific pressure of 0.125 MPa), the minimum film thickness rises sharply in the low velocity range, rises moderately in the medium velocity range, and remains the same in the high velocity range, which illustrates that the contribution of velocity to minimum film thickness is greater than that of specific pressure. When the bearing is subjected to a medium load (specific pressure of 0.156, 0.313 and 0.625 MPa), the minimum film thickness increases almost linearly over the entire velocity range. In the case of a high load condition (specific pressure of 0.938 MPa), the minimum film thickness increase slowly with the velocity over the entire velocity range, which indicates that the contribution of specific pressure to minimum film thickness is greater than that of velocity.

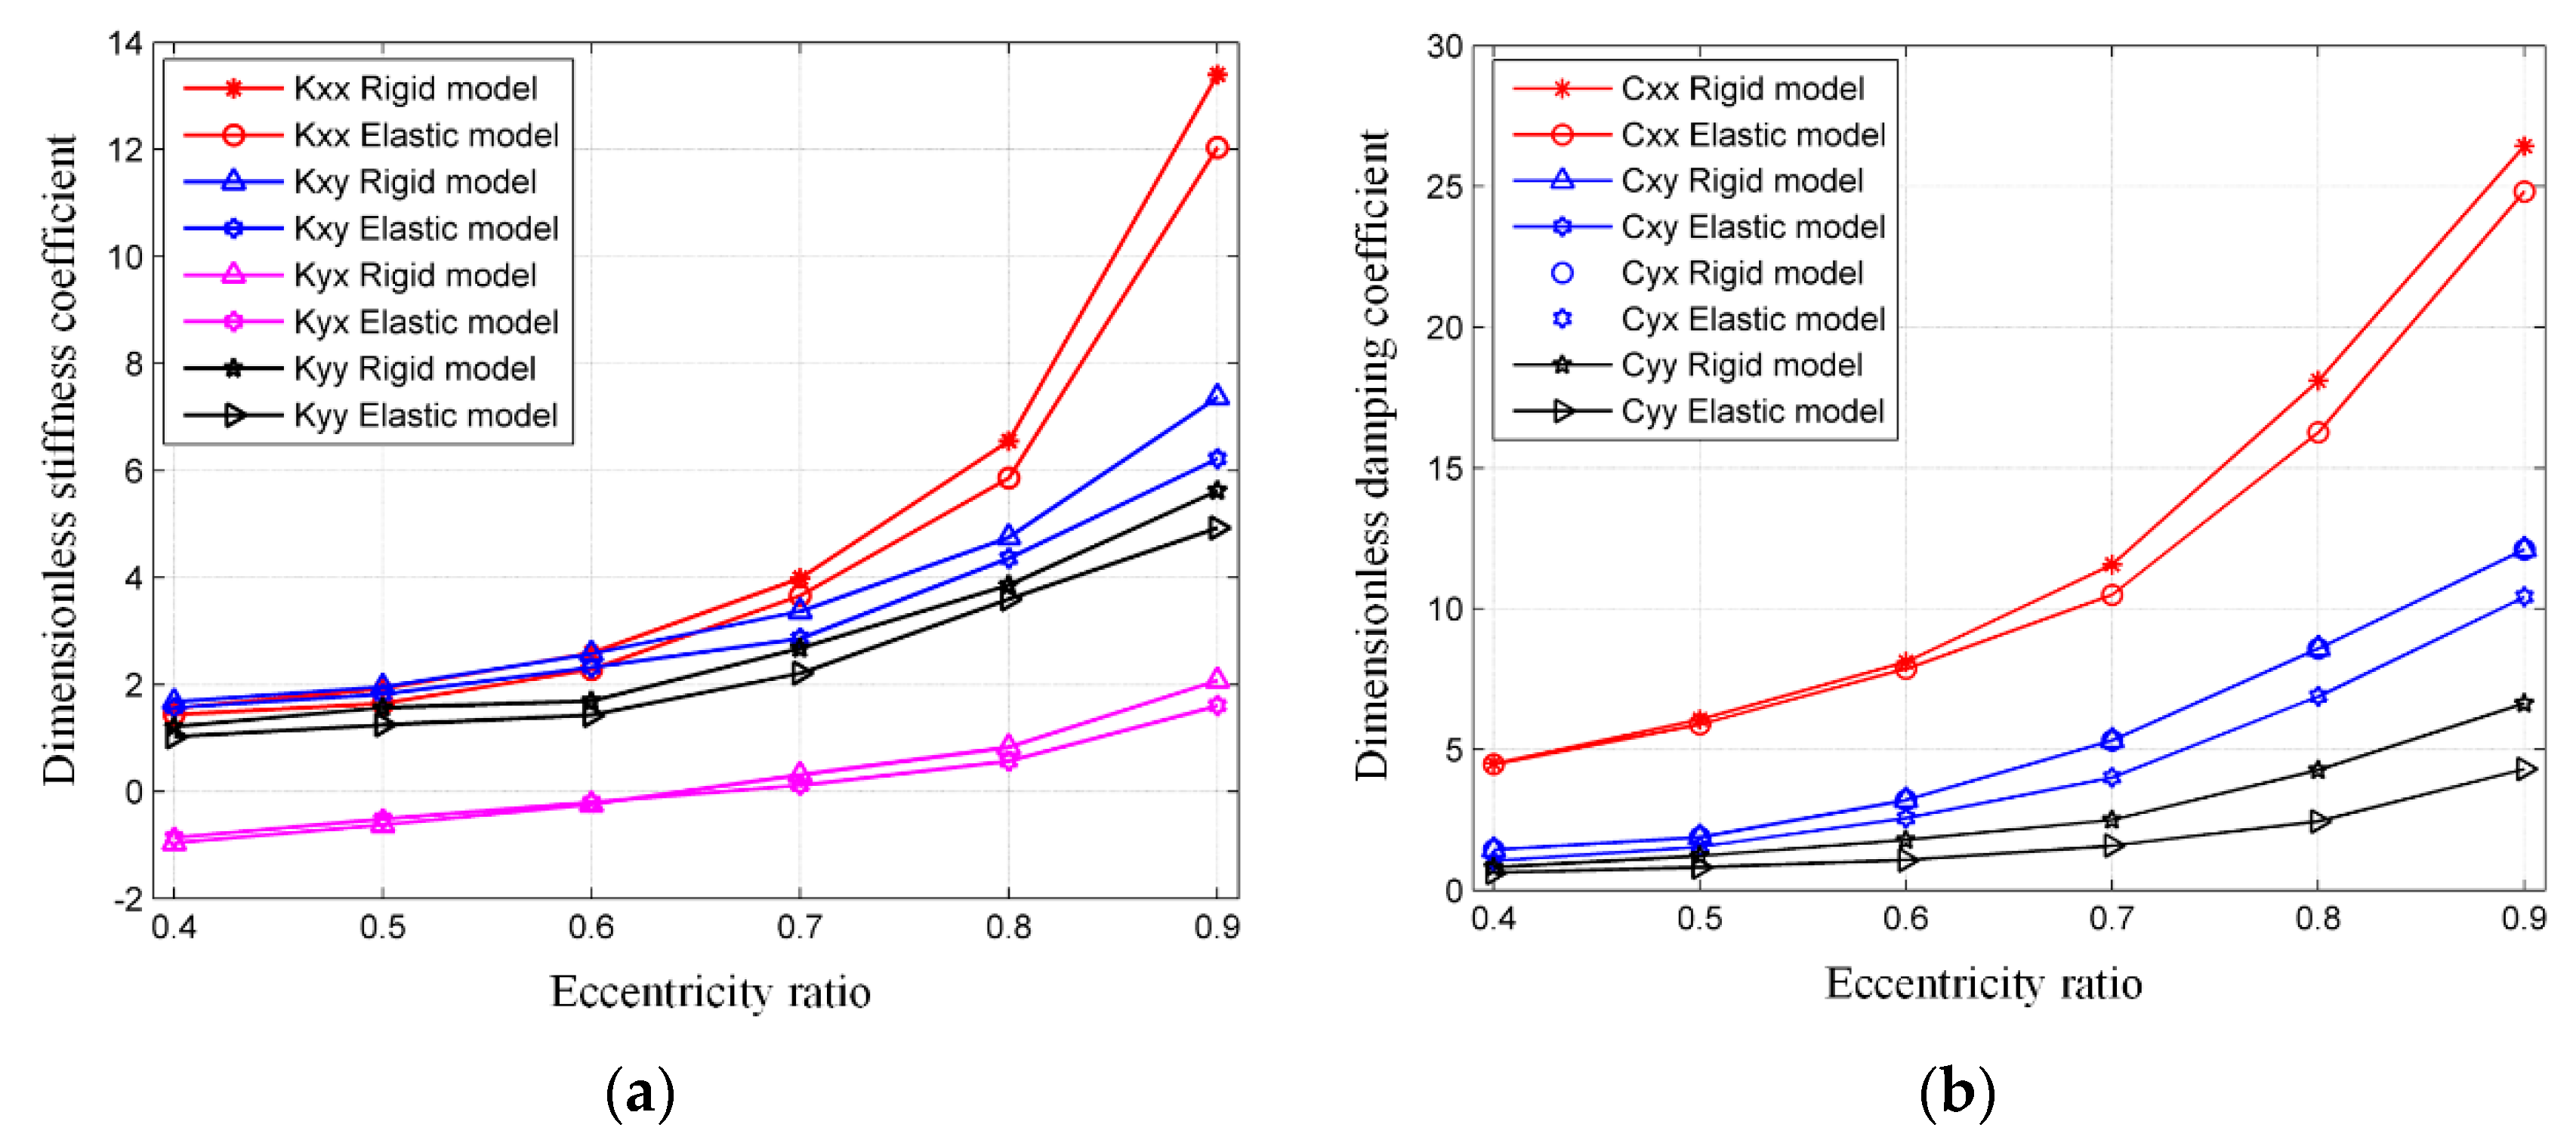
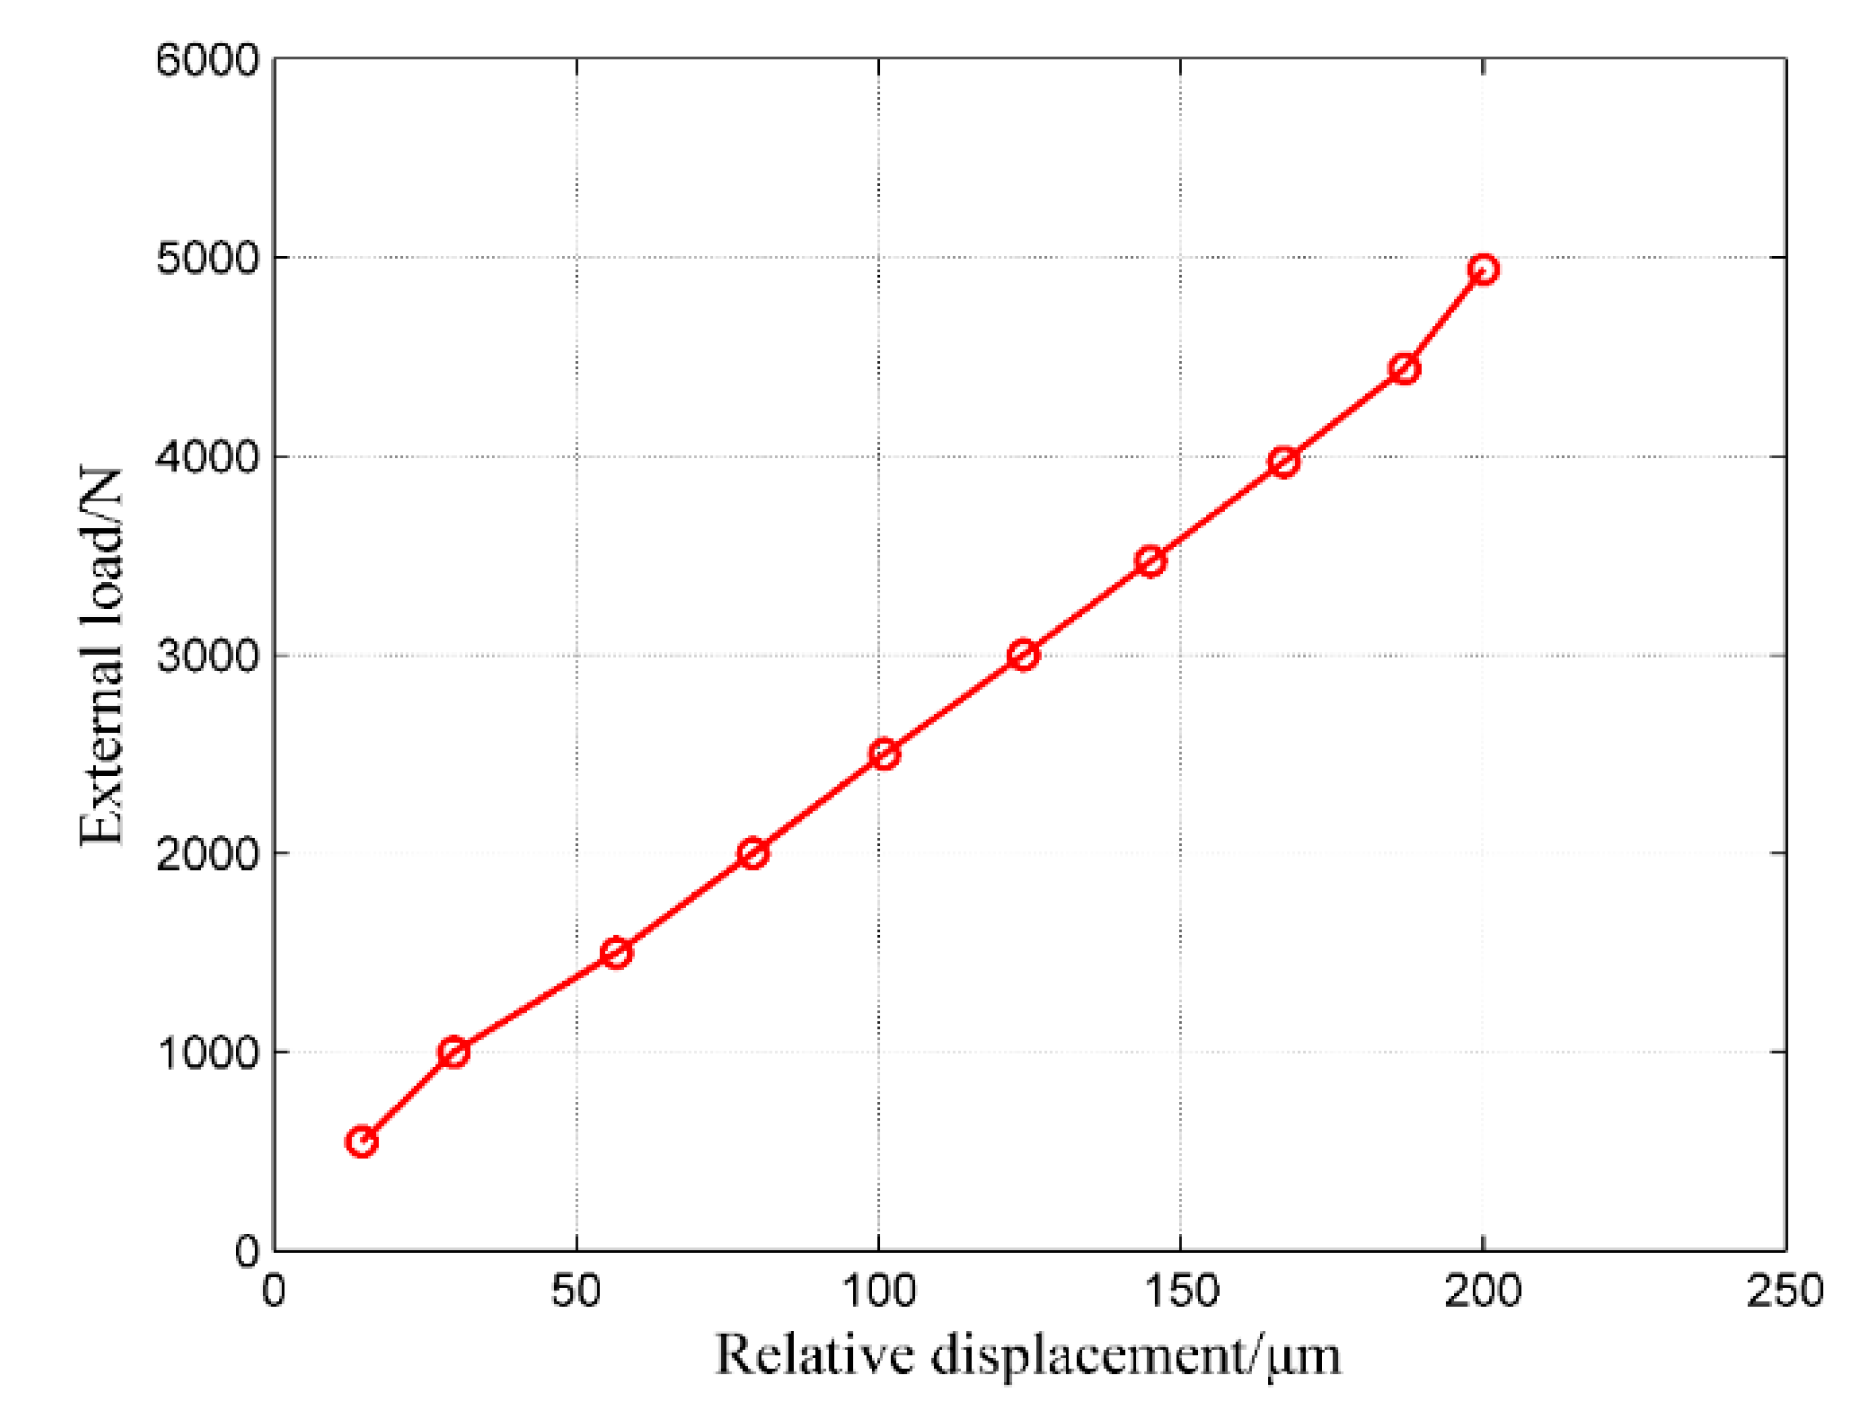
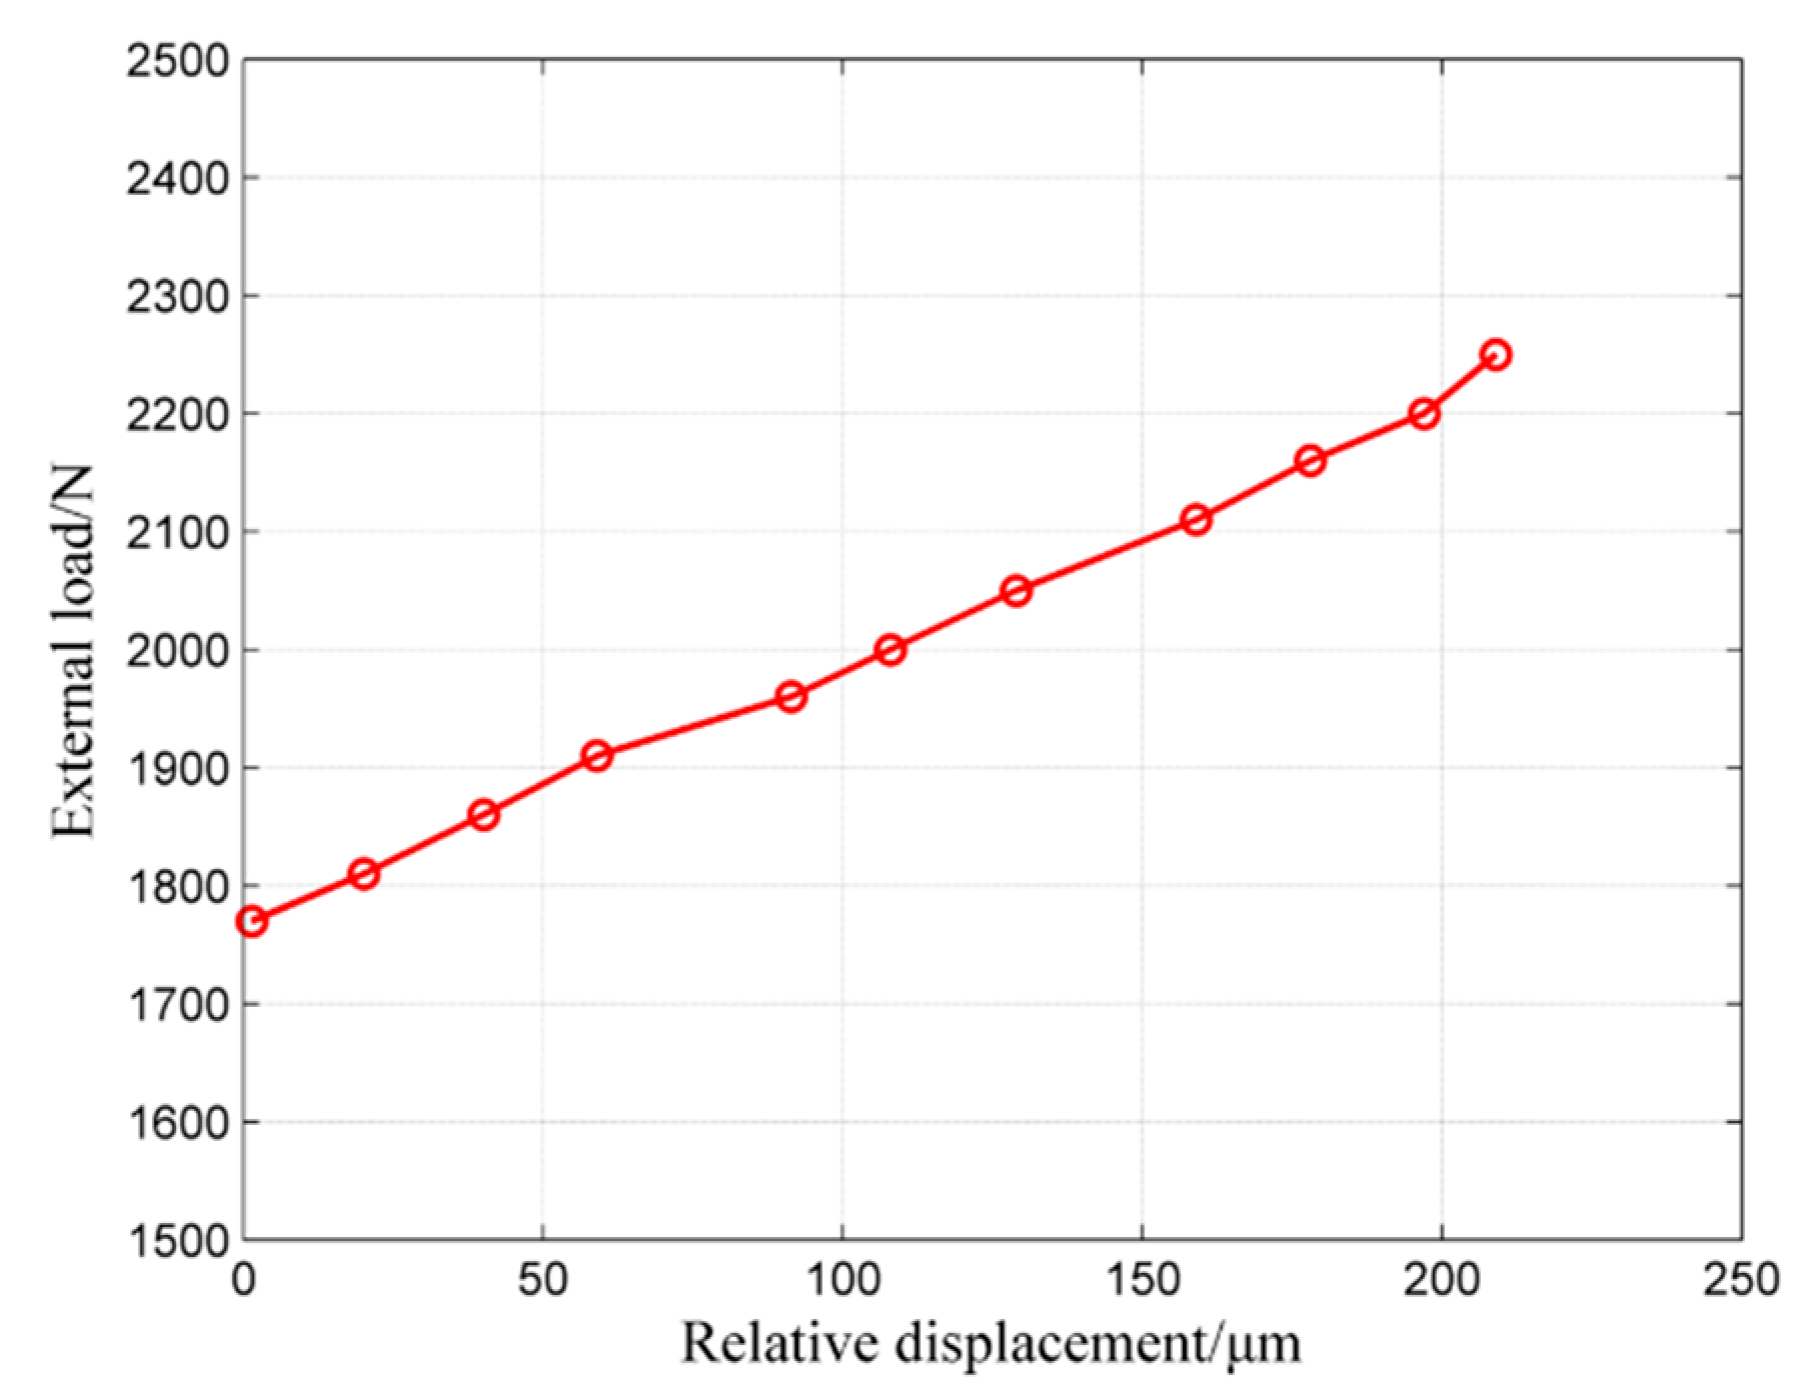
4.5. Stiffness Coefficients

The stiffness of the bearing in the vertical direction Kyy is equal to the ratio of the load increment Δ F y in the y direction to the displacement increment Δ y in the y direction. The expression is as follows:
K y y = Δ F y Δ y = F y 2 F y 1 y 2 y 1
Figure 14 shows the relationship between the external load and the relative displacement in the y direction. When the load is in the range 1.50–4.50 × 10³ N, the linearity of the curve is better. The slope of the curve represents the stiffness coefficient, Kyy = 2.1 × 10⁷ N m−1, and its theoretical value is Kyy = 2.86 × 10⁷ N m−1 with a relative error of 26.57%, as shown in Table 3.
Similarly, the cross stiffness coefficient Kyx is equal to the ratio of the load increment ∆Fy in the y direction to the displacement increment ∆x in the x direction. The expression is as follows:
K y x = Δ F y Δ x = F y 2 F y 1 x 2 x 1
For the same conditions as in Figure 14, Figure 15 presents the relationship between the external load and the relative displacement in the x direction. The slope of the curve represents the stiffness coefficient, Kyx = 2.72 × 10⁶ N m−1, and its theoretical value is Kyx = 3.29 × 10⁶ N m−1 with a relative error of 21.00%, as shown in Table 3.

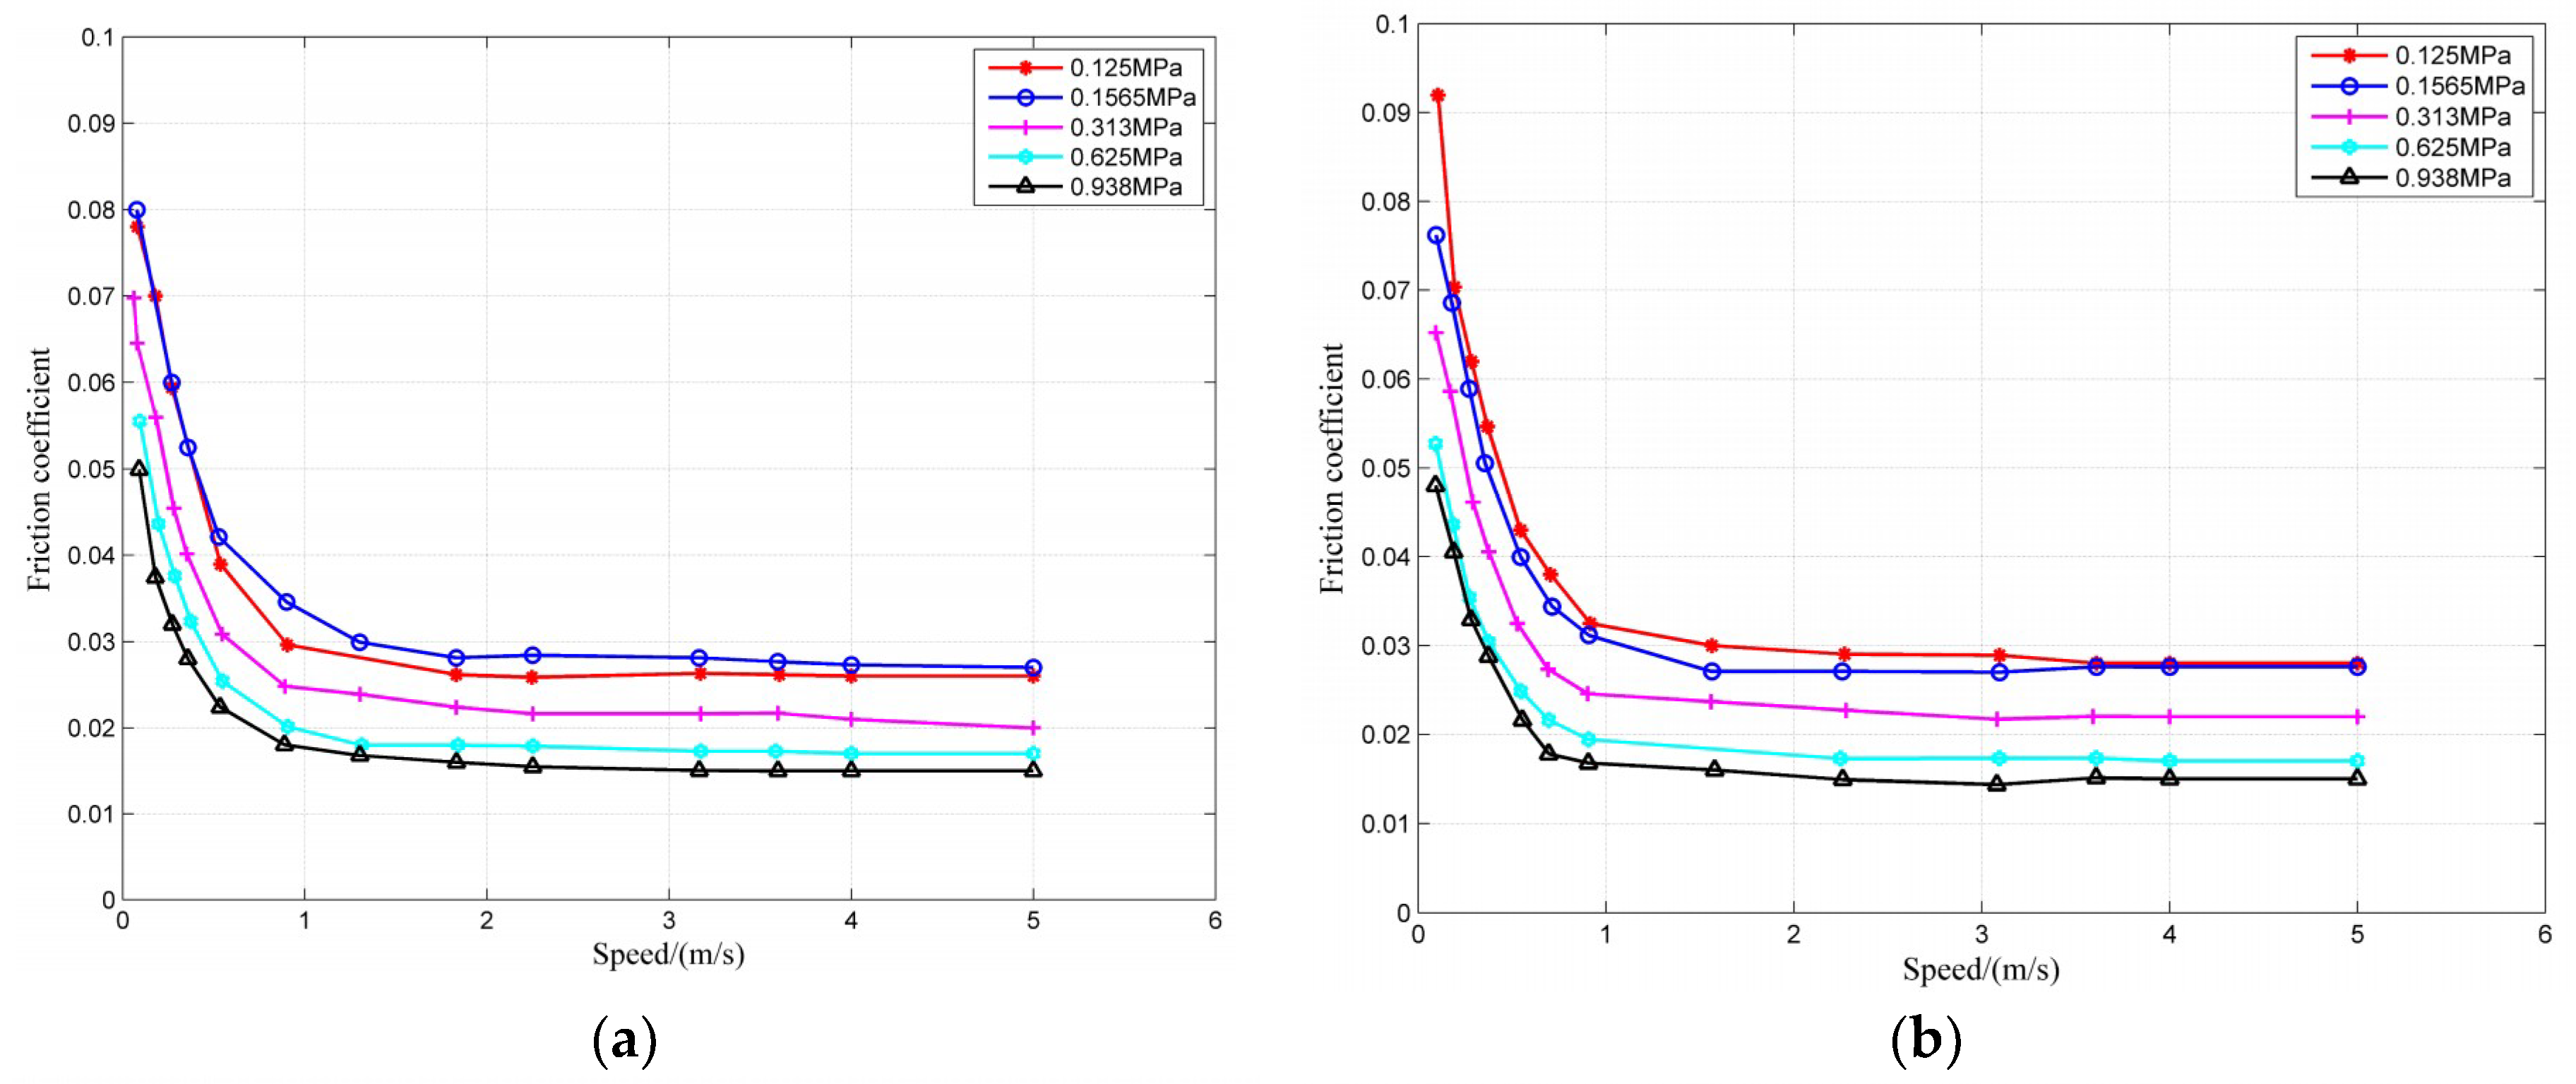
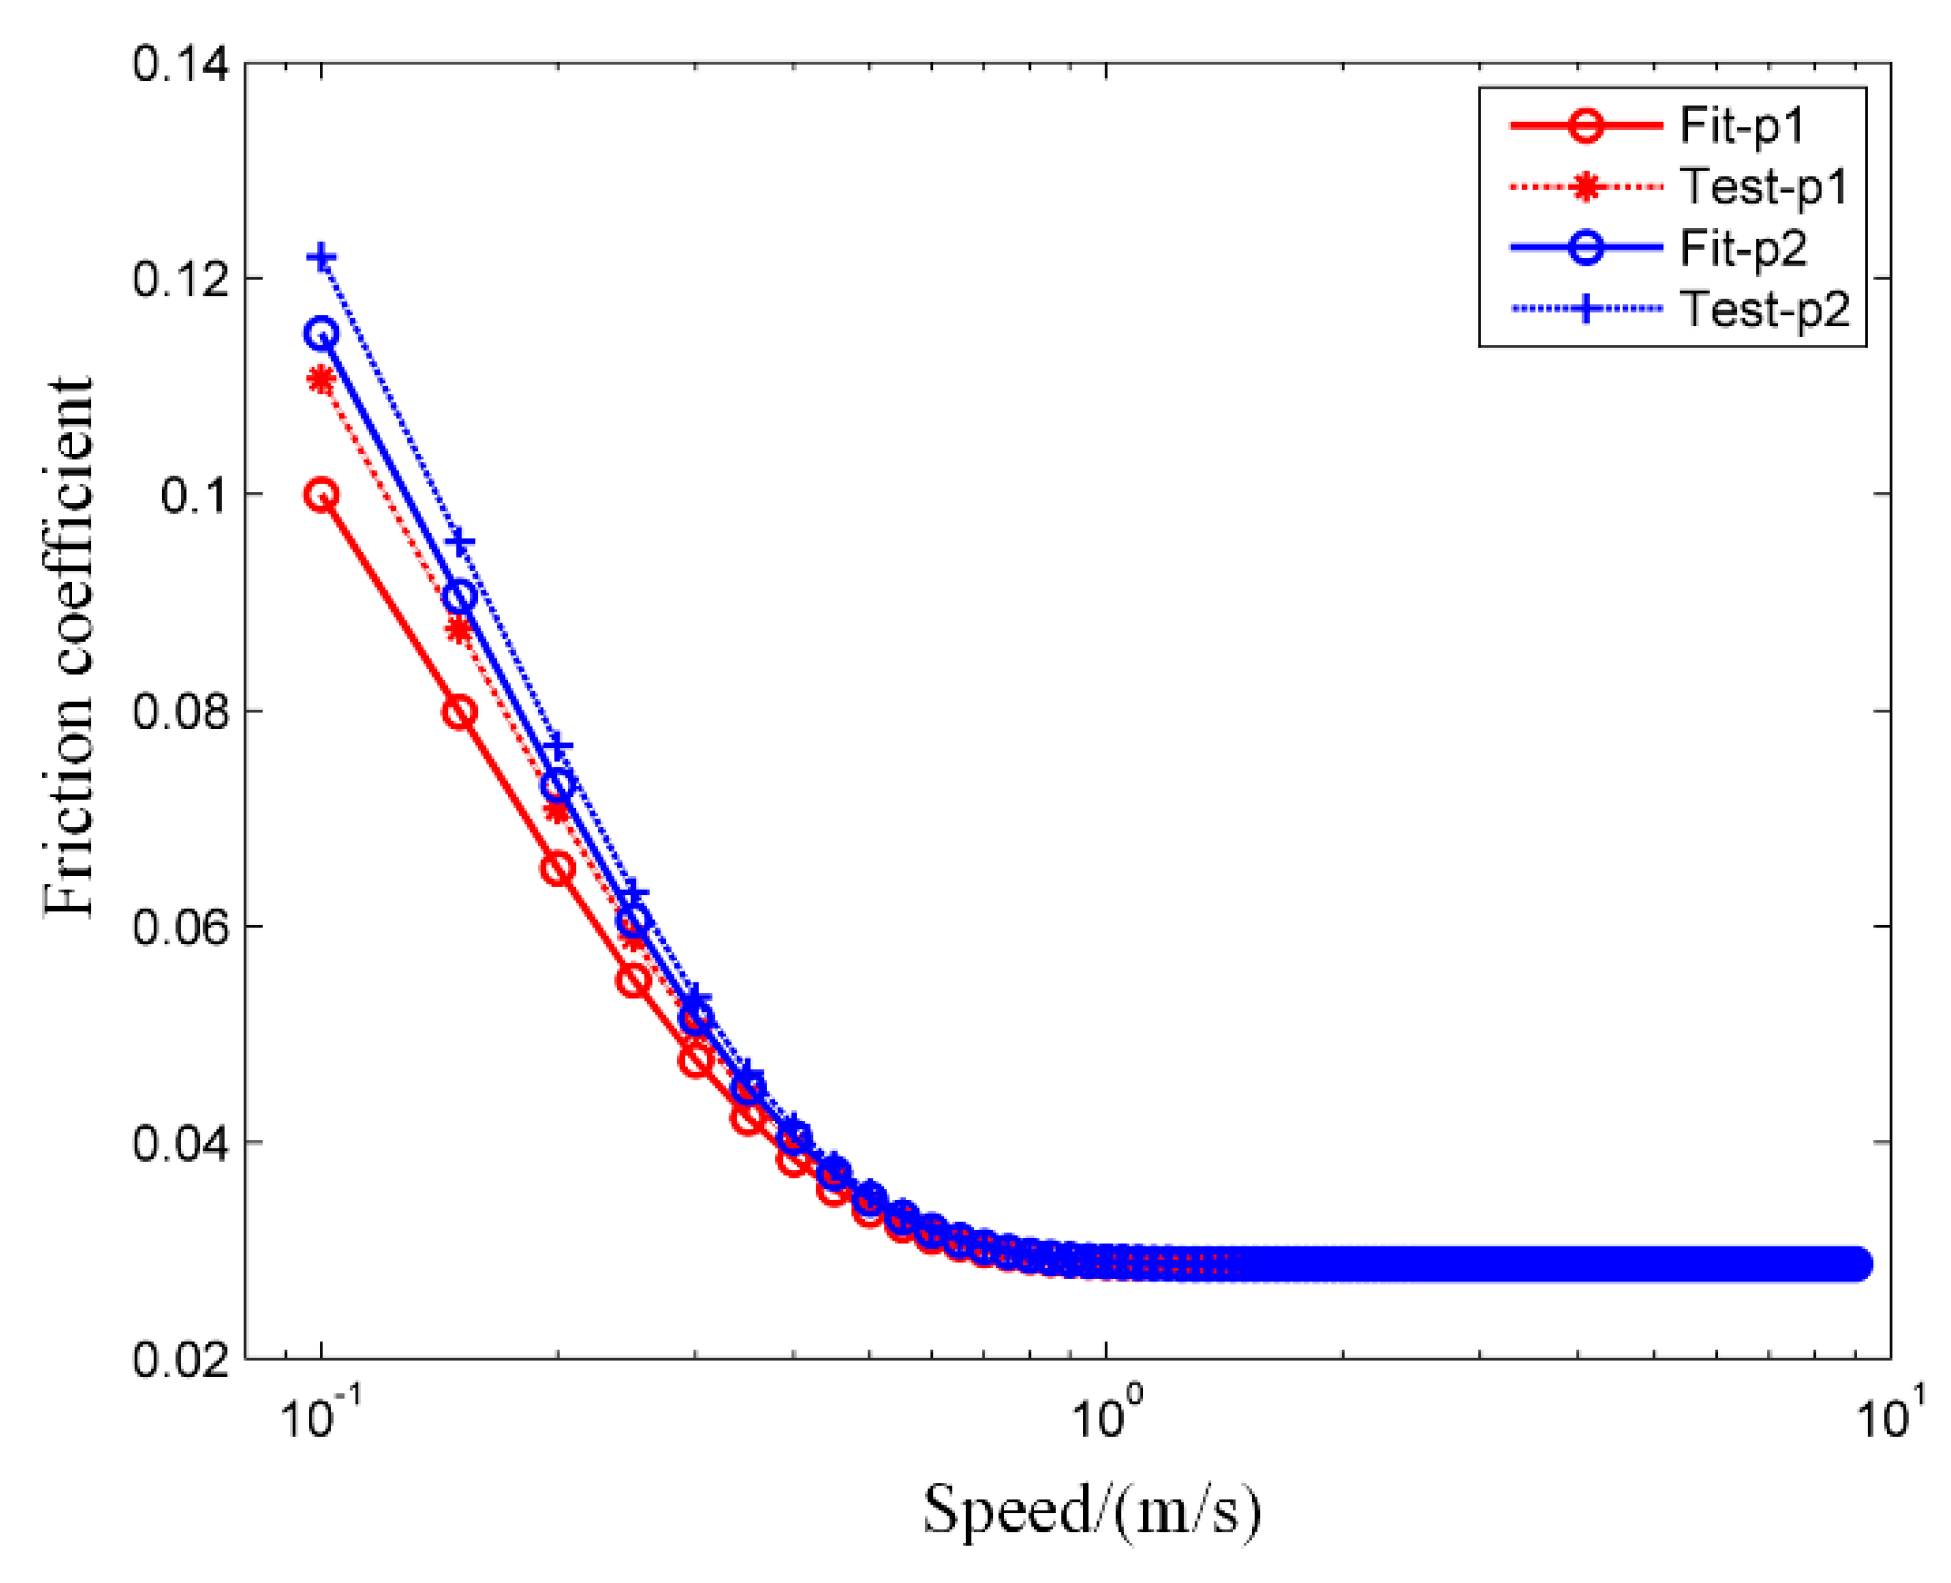
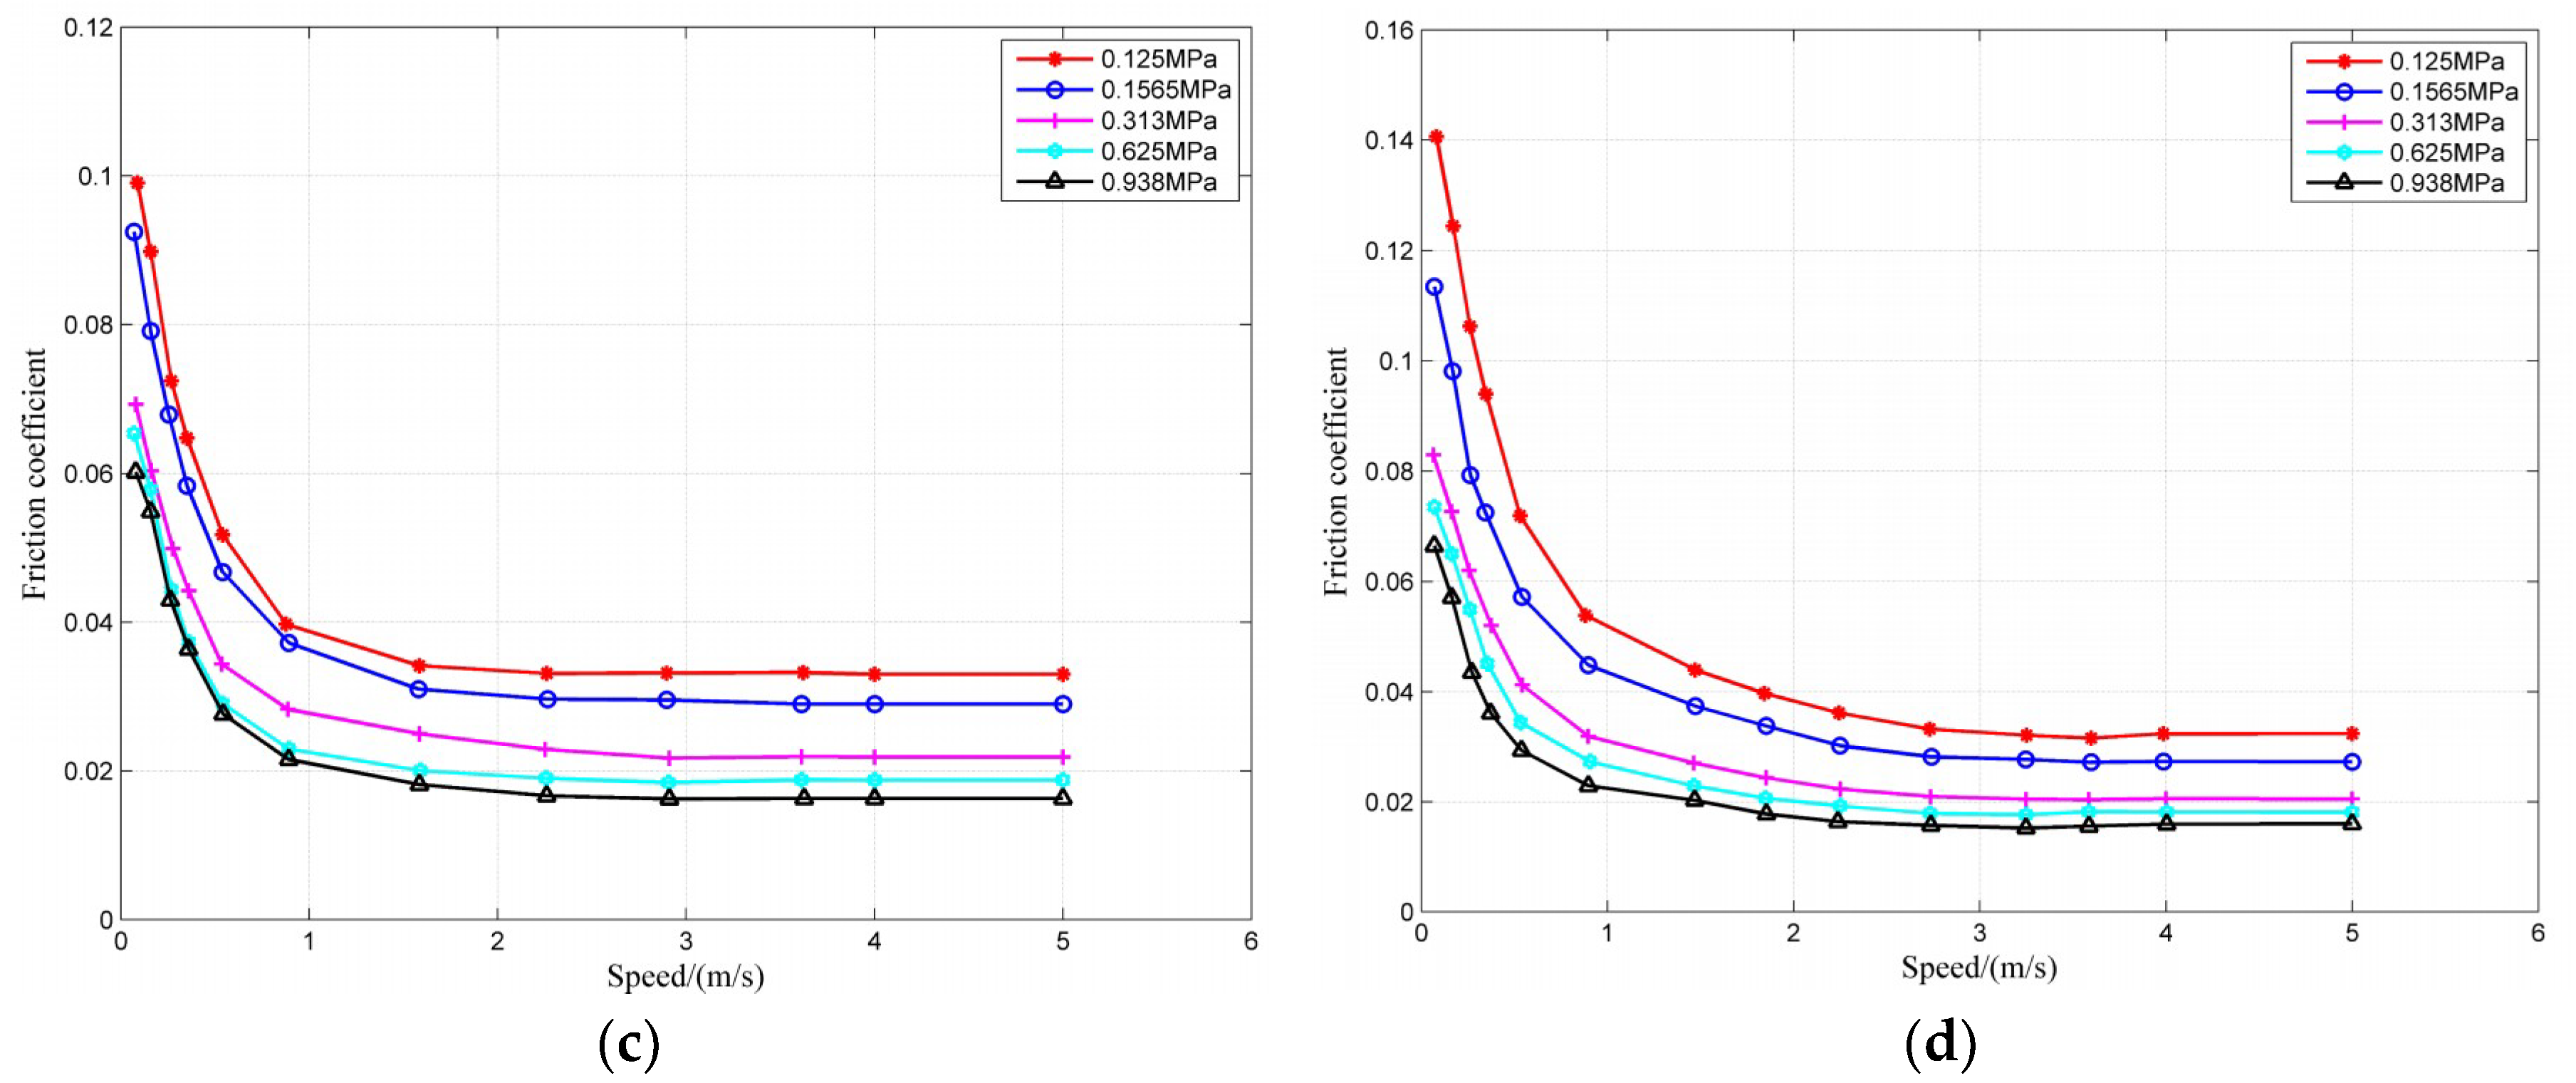
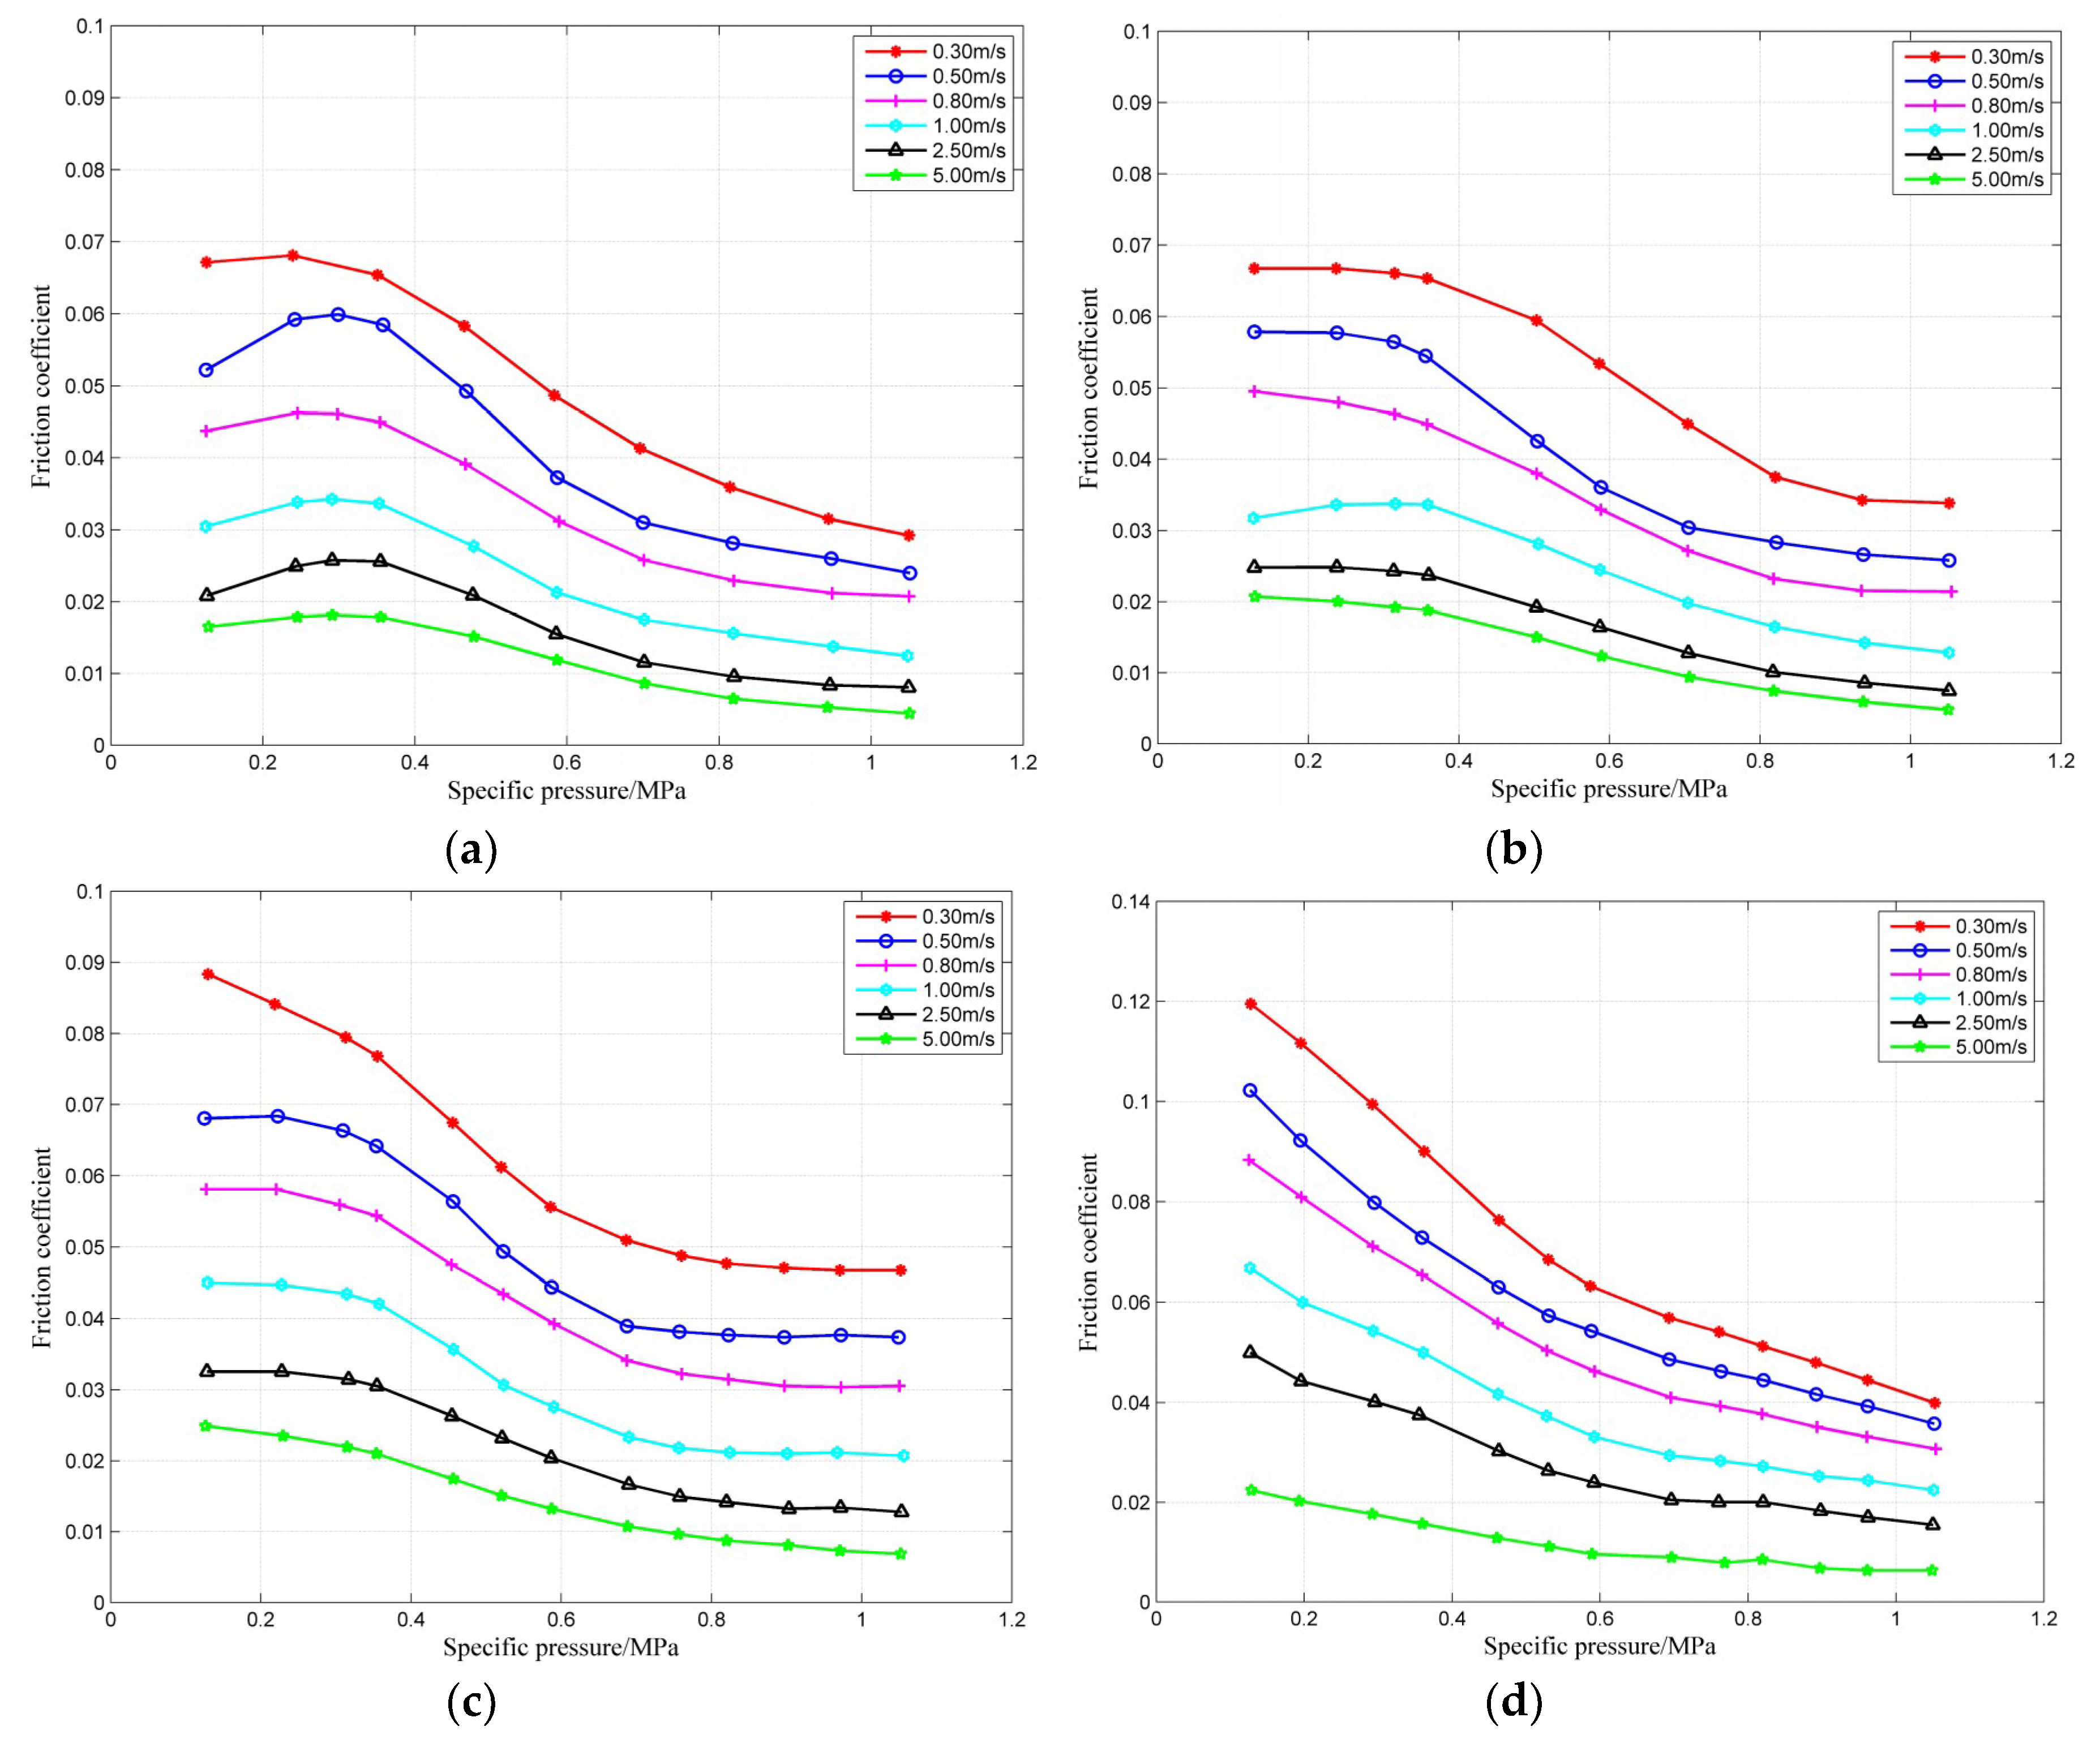
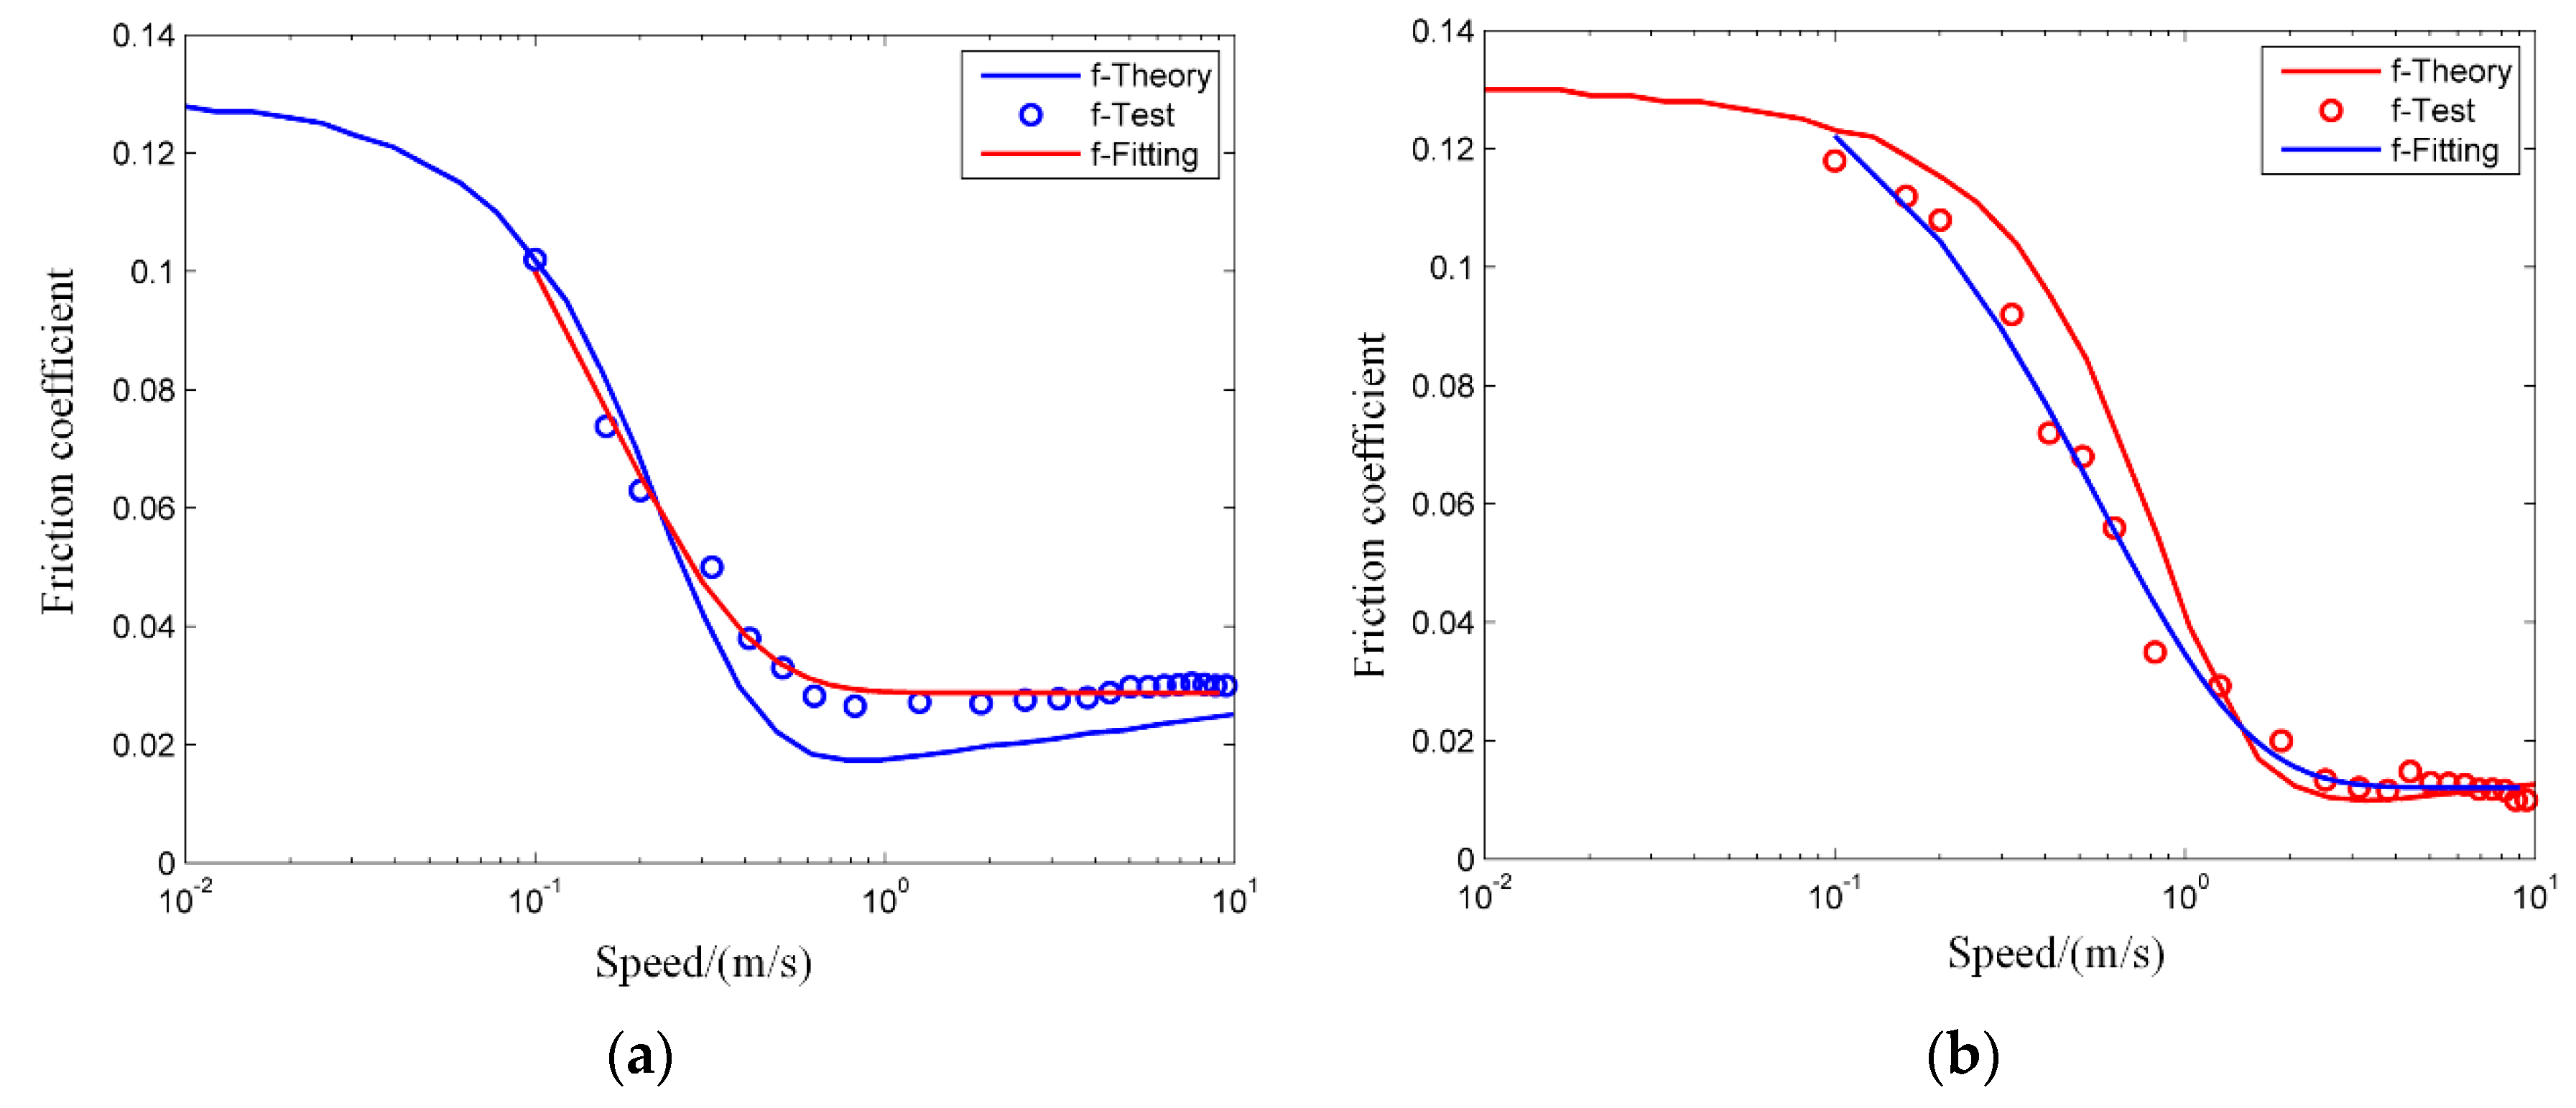
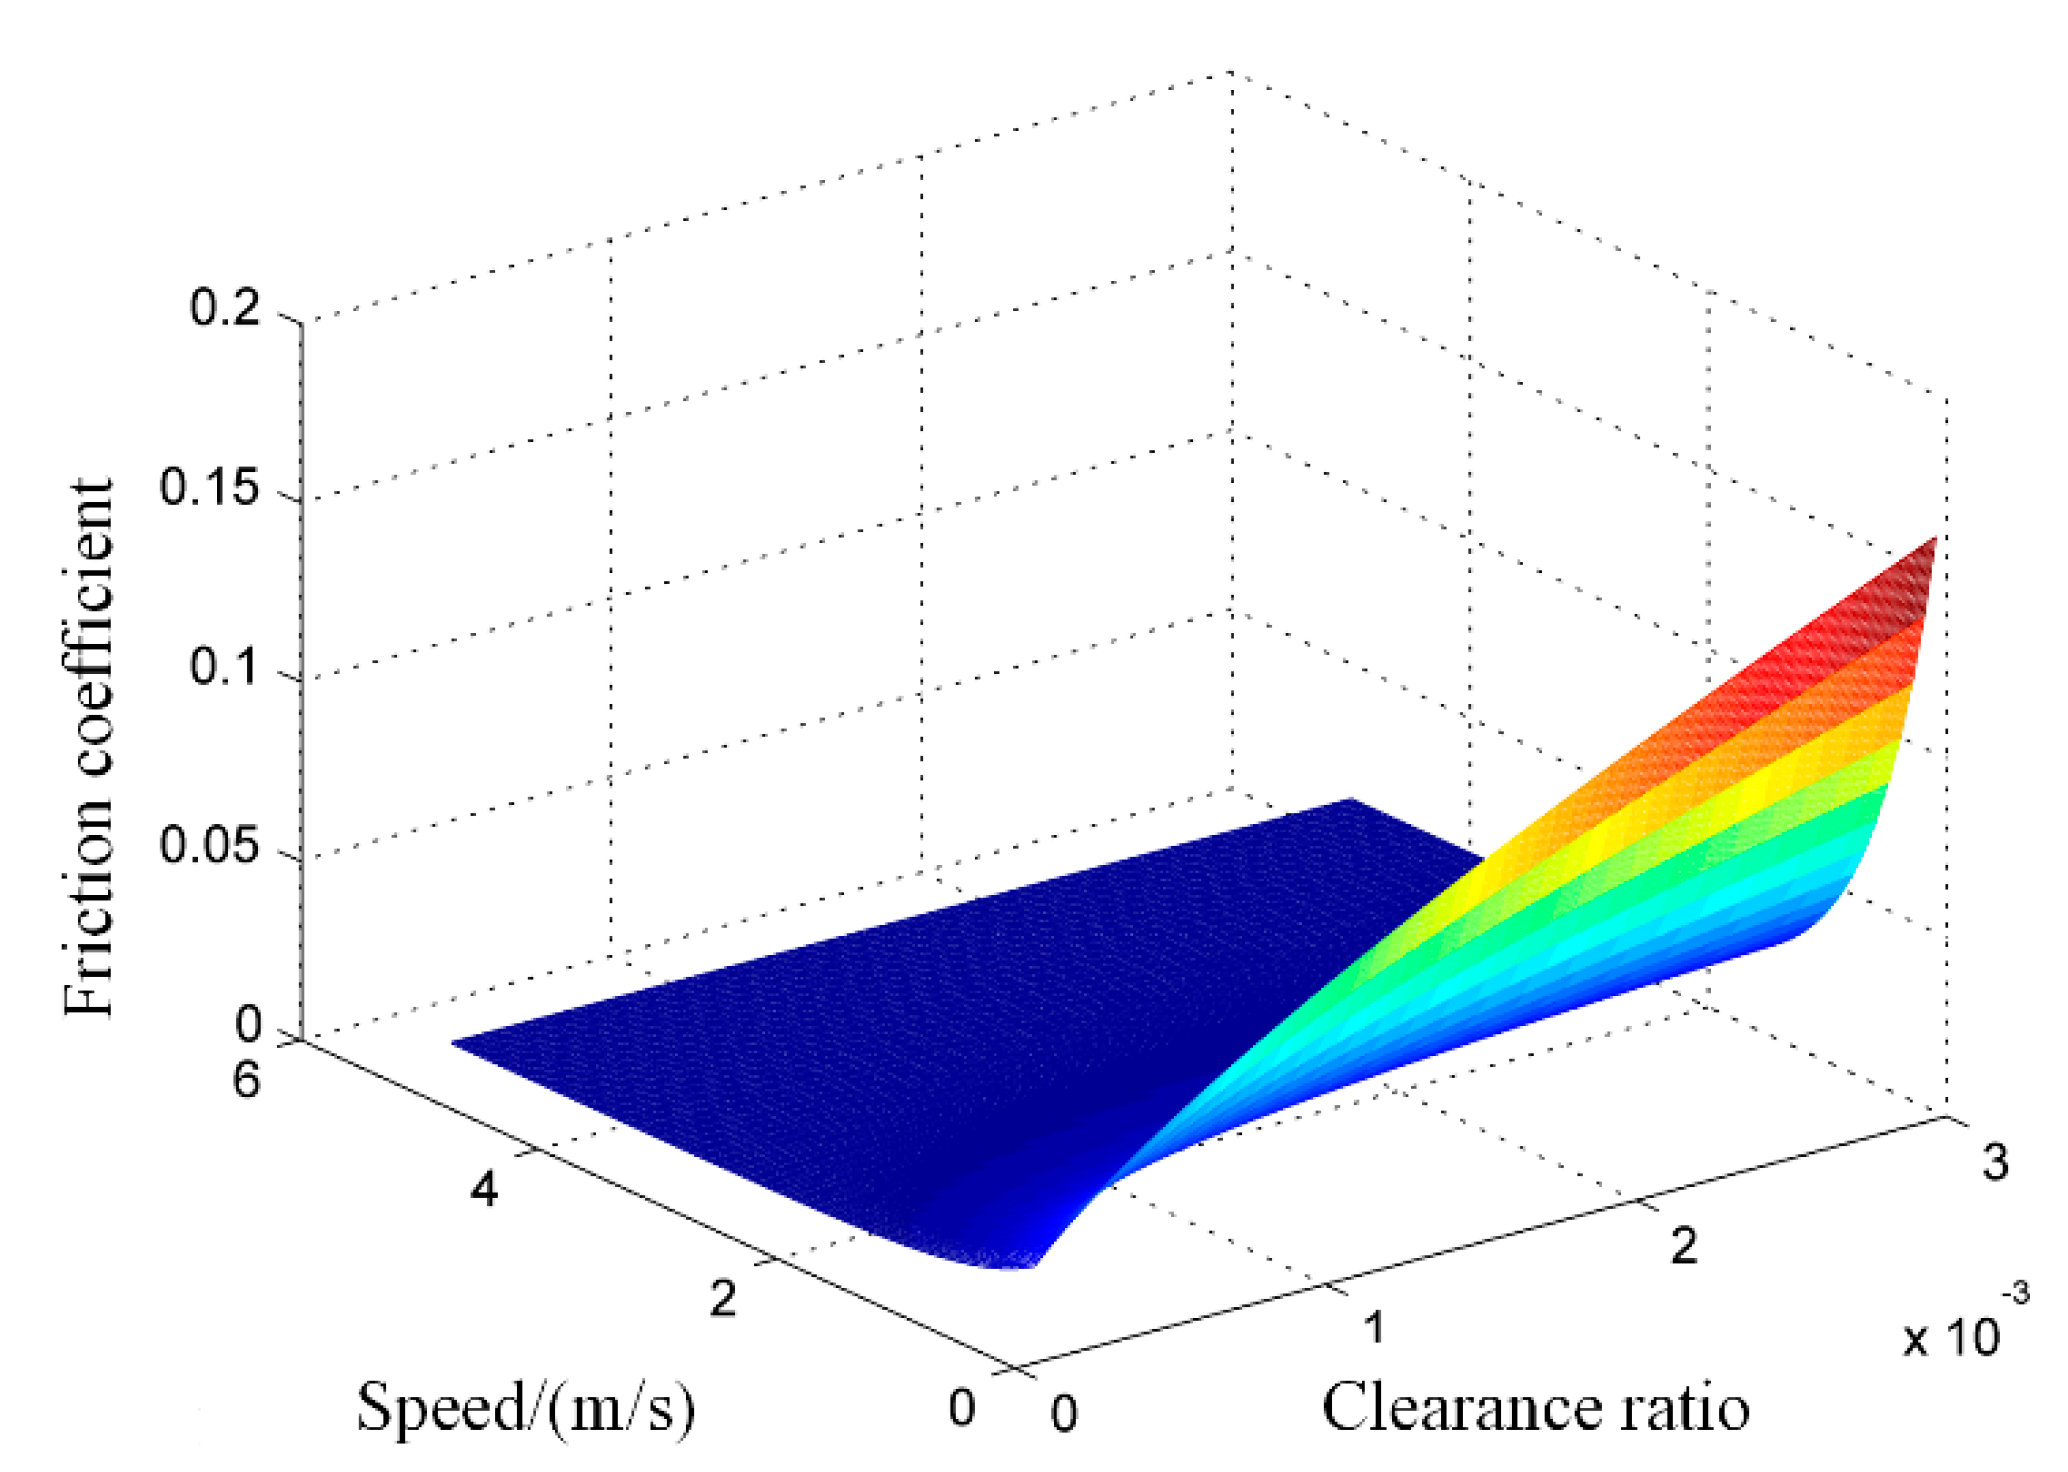
4.6. Empirical Formula of Friction Coefficient

Figure 16 shows the experimental verification of the friction coefficient for two test bearings with different surface roughness. Specifically, σ1 and σ2 represent bearings #1 and #2, respectively. Test data correspond well with the simulation, for the high velocity region, and the relative error is very small, especially for bearing #2.
For the practical engineering bearings, it is generally difficult to accurately measure the film thickness. Friction coefficient is the commonly used parameter, which can be measured exactly [37,38,39,40].
Figure 17a,b shows the relationship between the friction coefficient and the velocity under different clearance ratios, namely, (a) ψ = 0.5‰, (b) ψ = 1.0‰, (c) ψ = 1.5‰, and (d) ψ = 2.0‰. From the figures we observe that as the velocity increases, the friction coefficient decreases sharply in the low speed range, and decreases moderately in the medium and high speed range.
Figure 18a,b shows the relationship between the friction coefficient and the specific pressure under different clearance ratios, namely, (a) ψ = 0.5‰, (b) ψ = 1.0‰, (c) ψ = 1.5‰, and (d) ψ= 2.0‰. From the figures we observe that the friction coefficient decreases moderately with the increase in the specific pressure over the entire speed range [41].
Generally speaking, it is of great concern to estimate the friction coefficient and evaluate the lubrication performance. The main influencing factors affecting the bearing’s performance include the specific pressure, the clearance ratio, the velocity, and the width to diameter ratio. The friction coefficient is closely related to these parameters. Based on the tested data, the relationship between the friction coefficient and the above factors was obtained through fitting. The effects of the bearing’s structural parameters and operating conditions on tribological properties were examined. The empirical formula developed with velocity, specific pressure, and clearance ratio is as follows:
f ( v , p , ψ ) = α 1 e ( α 2 v + α 3 ) p α 4 ψ α 5 + α 6
where p is the specific pressure, which is equal to the external load divided by the equivalent loaded area, p = F total A , with the unit N m−2; A is the equivalent loaded area, which is equal to the diameter multiplied by the width, A = D × L, with the unit m2; ψ is the clearance ratio, which is equal to the radial clearance divided by the eccentricity, ψ = c e ; α1 to α6 are coefficients and through fitting experimental data, estimated values can be obtained. Table 4 gives the estimated values of the coefficients α1 to α6. The range of values for α1 to α6 and the recommended values for α1 to α6 are also found in Table 4.
Thus, the empirical formula of the friction coefficient obtained through fitting the measured data is as follows:
f 1 ( v , p , ψ ) = 0.0967 e ( 6.646 v + 0.1531 ) p 0.2745 ψ 0.4439 + 0.0288
Theoretical calculations, experimental results and the fitting data are plotted in Figure 19, where in (a) the clearance ratio is 1.0‰ and in (b) the clearance ratio is 1.5‰. Fitting curves correspond well with the experimental data, while some deviation occurs compared to the theoretical calculations. Nevertheless, the empirical formula is beneficial for the optimum design of structures, the rationale for selecting the parameters (e.g., the clearance ratio, the specific pressure) and the prediction of tribological characteristics.
The empirical formula can be used to predict the friction coefficient of the bearing. Figure 20 shows the comparison of the empirical formula values and the experimental data. For P1 and P2 the specific pressure is 0.15 and 0.20 MPa, respectively, and the clearance ratio is 1.0‰. Predicted values using the empirical formula correspond well with experimental data in the medium and high velocity region, while deviations occur in the low velocity region.
Figure 21 shows the three-dimensional distribution of the friction coefficient with the velocity and the clearance ratio. From Figure 21 it is clear that the optimum range of the clearance ratio is approximately from 0.8‰ to 2.0‰. This is of important significance for guiding the parameter optimization and structure design of such bearings.

5. Conclusions

This study has a certain significance for guiding the future investigation of the lubrication state transition of water-lubricated plain journal bearings. An empirical formula was proposed using test data fitting. Predicted values corresponded well with the experiment, and they will be beneficial for the optimum structure design of the bearing. From the analysis, the following conclusions can be made:
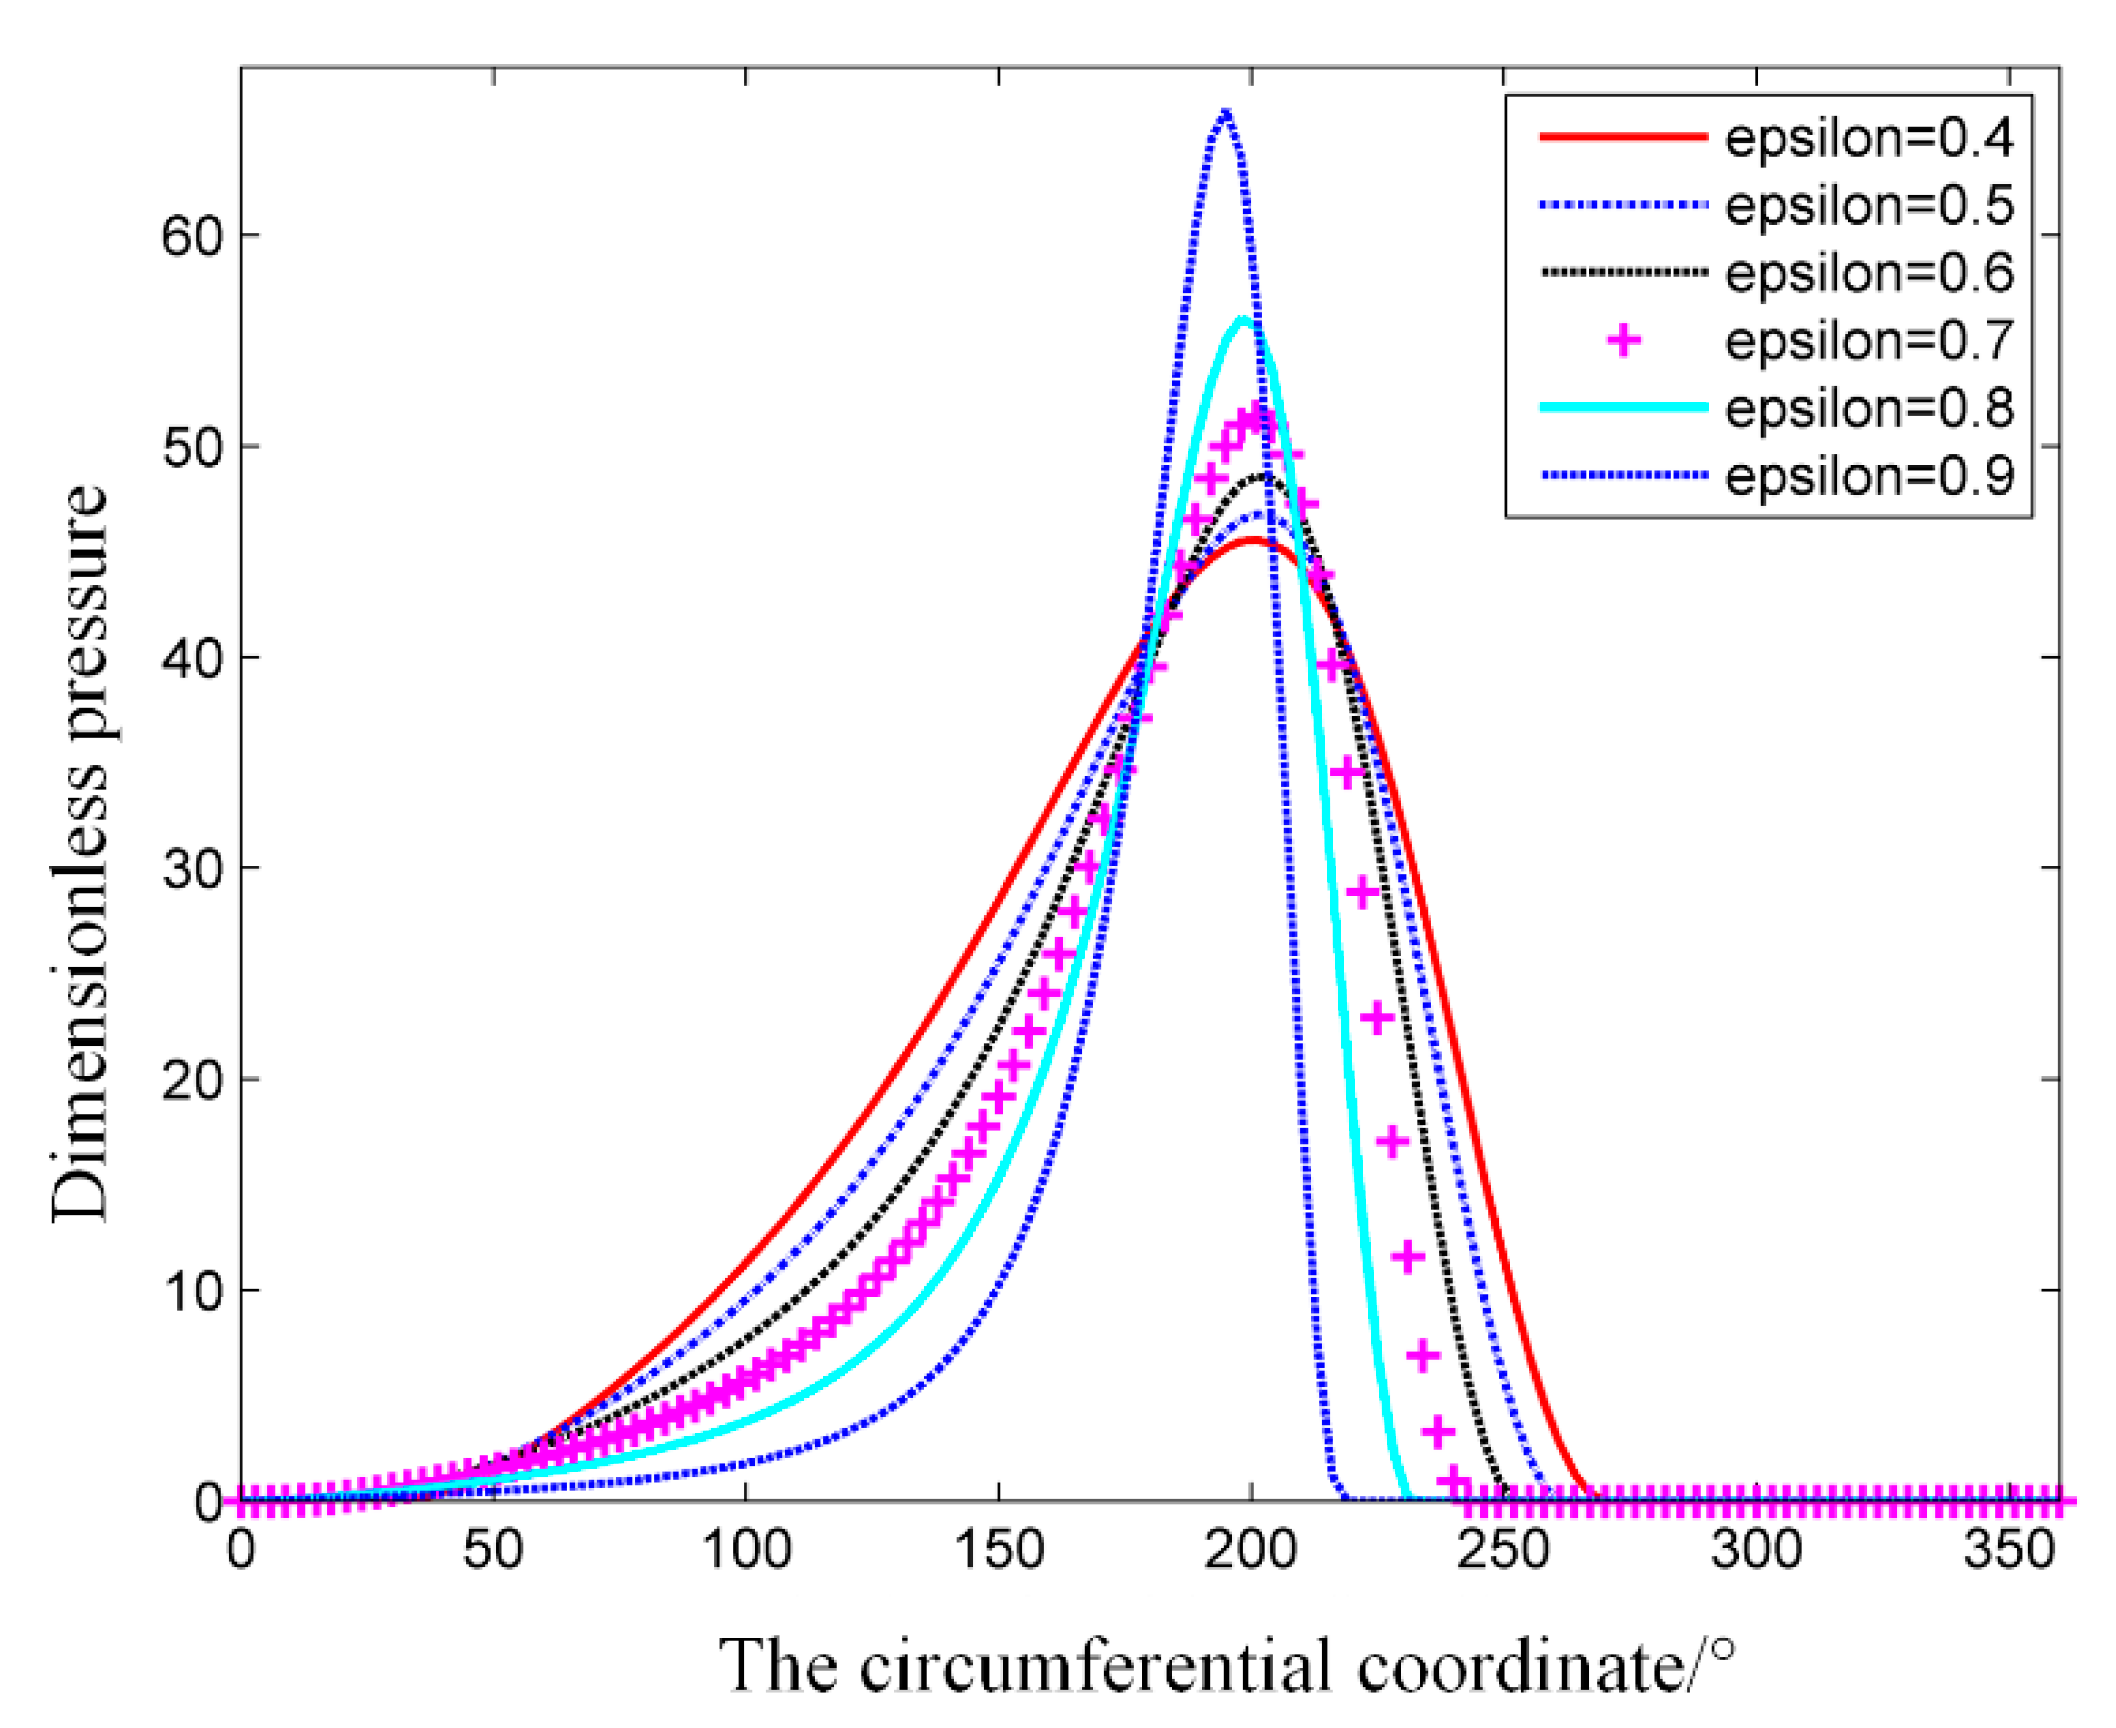
  • The existence of bushing decreases the dimensionless pressure. With the increase in the bushing thickness, the dimensionless pressure decreases correspondingly;
  • With the increase in the eccentricity ratio, the dimensionless load-carrying capacity and the friction force increase. The existence of bushing deformation (elastic model) decreases the load-carrying capacity but increases the friction force;
  • With the increase in the eccentricity ratio, the dimensionless stiffness and damping coefficients increase. The existence of the bushing deformation (elastic model) decreases the dynamic characteristic coefficients;
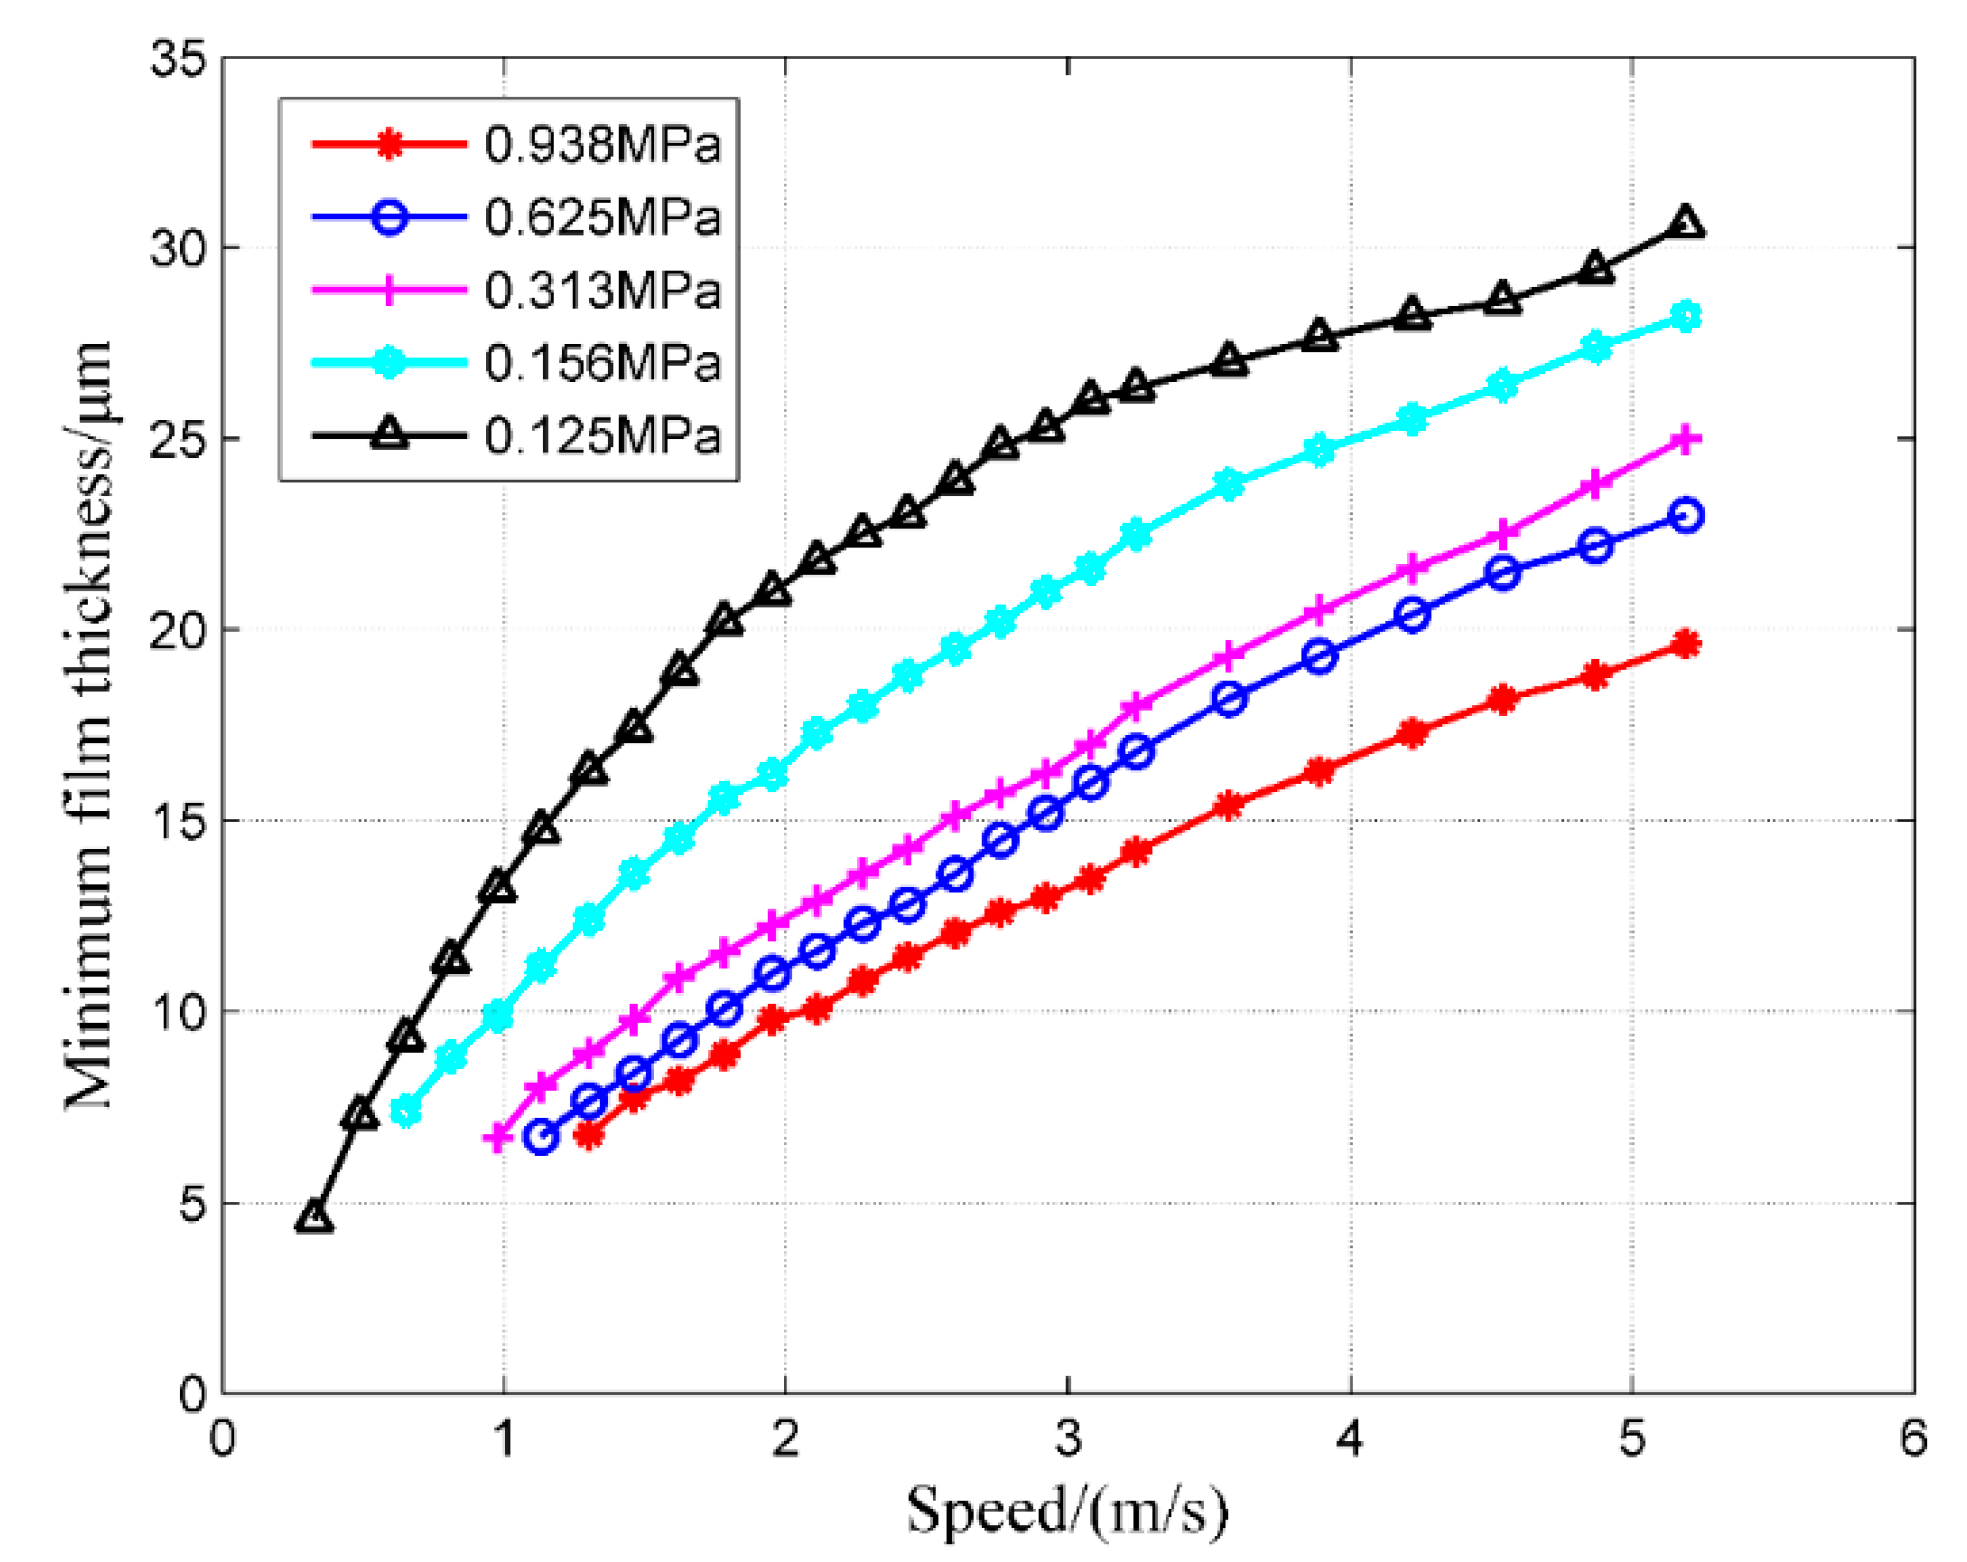
  • Under the same specific pressure, with the increase in the speed, the minimum film thickness increases. Under the same speed, with the increase in the specific pressure, the minimum film thickness decreases. Specific pressure and velocity are the dominant influencing factors on the measured minimum film thickness;
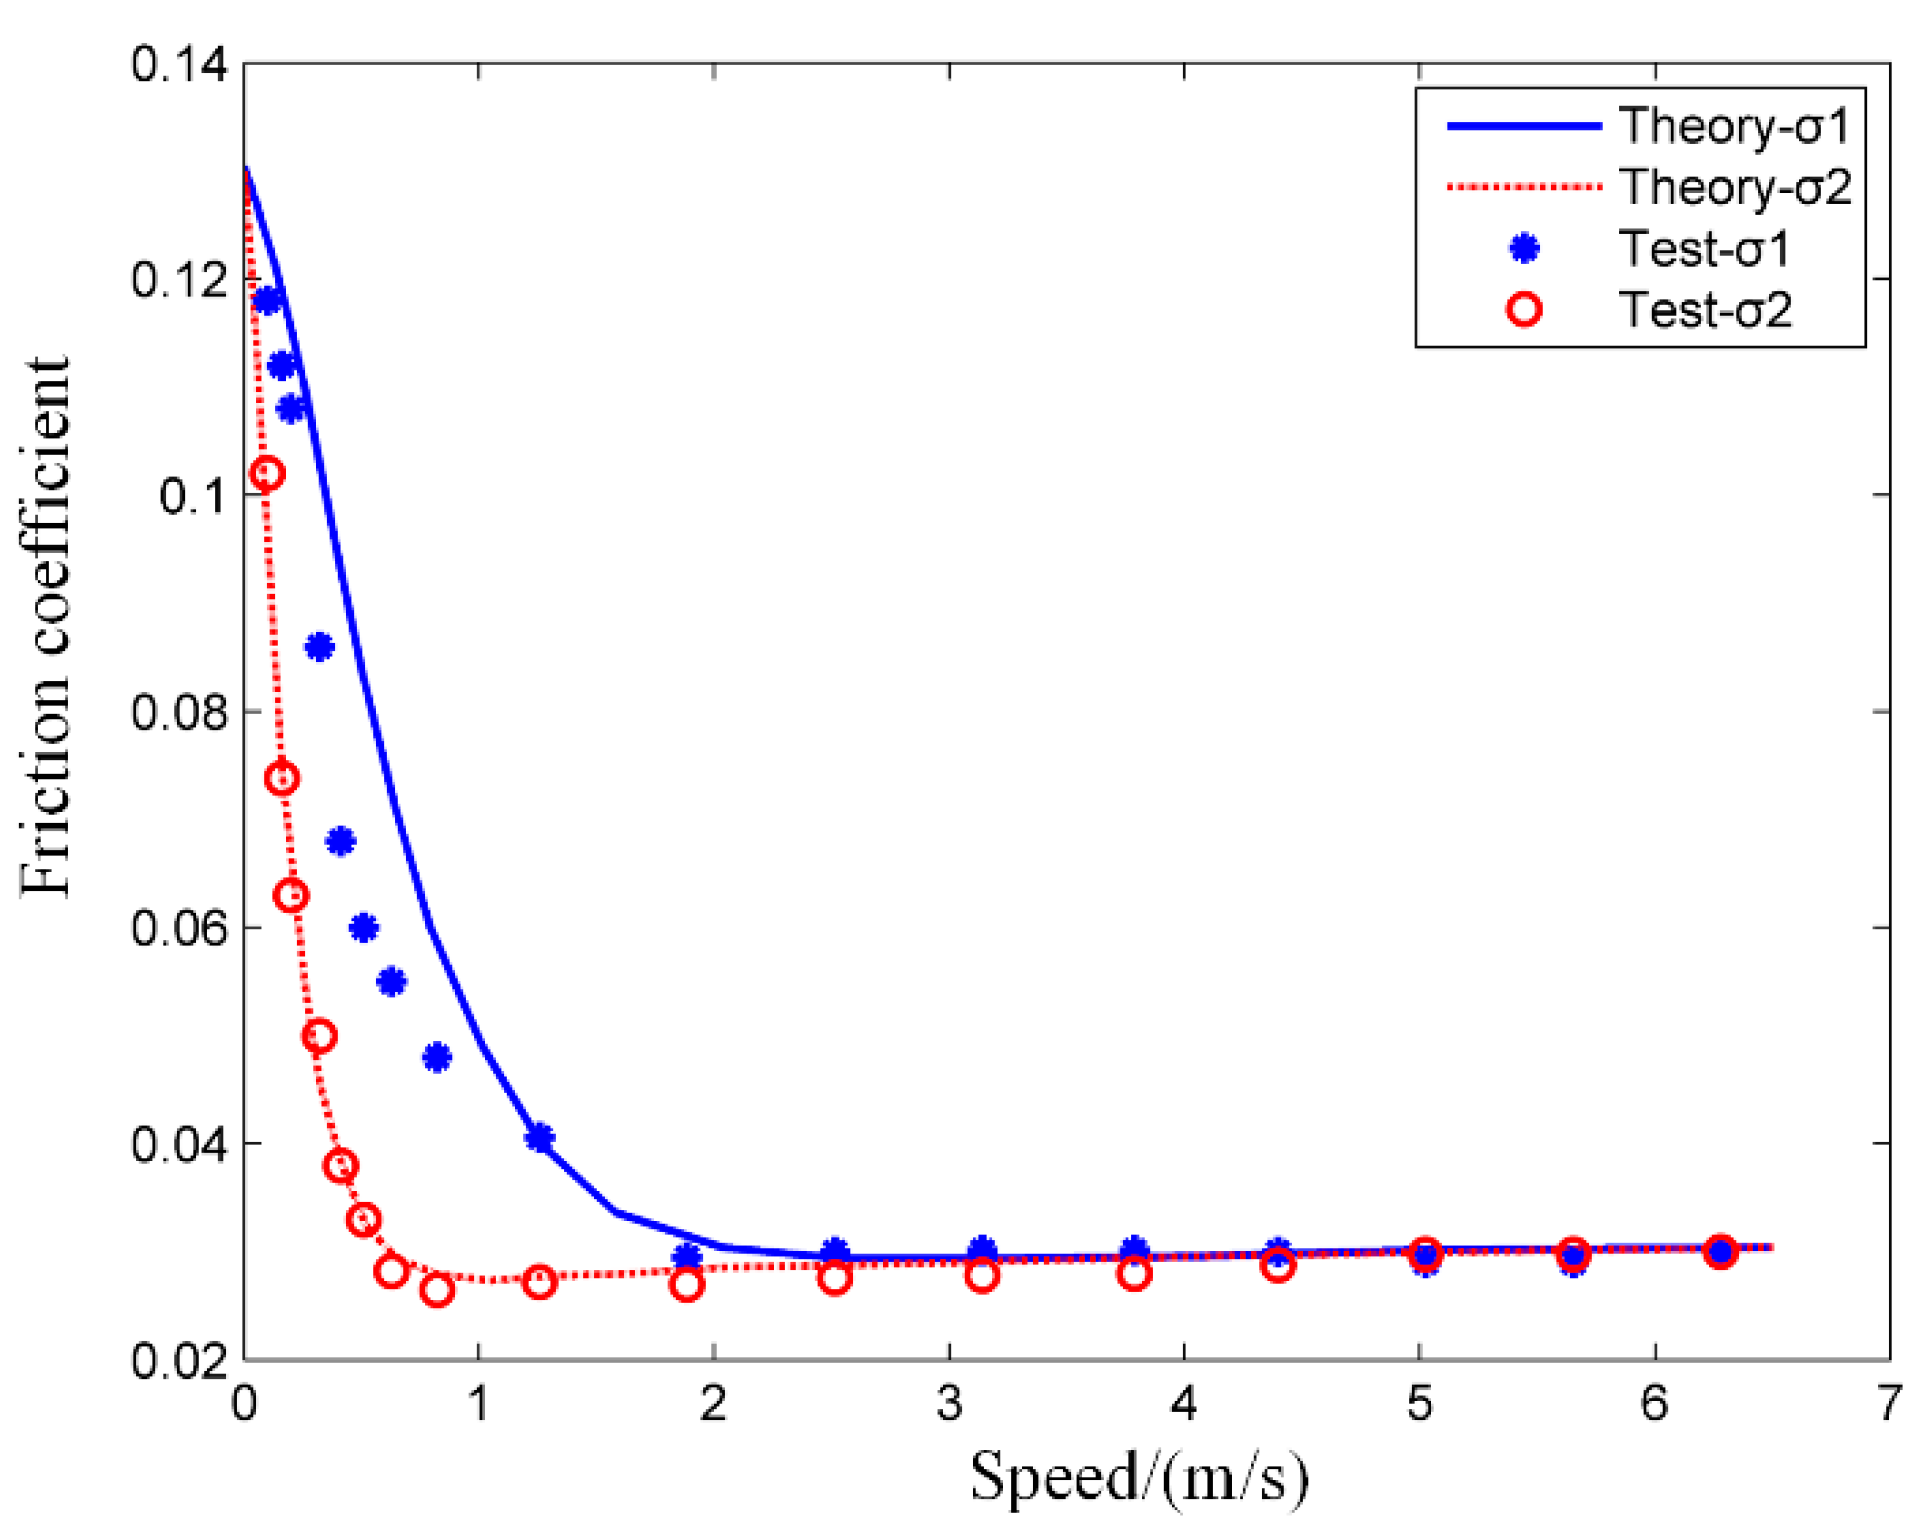
  • The empirical formula of friction coefficient with velocity, specific pressure, and clearance ratio is obtained based on experimental data. The empirical formula is beneficial for the optimum design of structures and the prediction of tribological characteristics.
These conclusions are useful for the structure design, analysis, and optimization of journal bearings. For future research, we will continue to improve the test rig and the measurement accuracy. The mathematical model will also need to consider more comprehensive influencing factors.

Author Contributions

Conceptualization, Z.X. and Z.R.; Data curation, Z.X.; Formal analysis, Z.X.; Funding acquisition, Z.X. and Z.R.; Investigation, Z.X. and H.L.; Methodology, Z.X.; Project Administration, Z.X. and Z.R.; Resources, Z.X.; Software, Z.X.; Supervision, Z.X.; Validation, Z.X.; Visualization, Z.X.; Writing–Original Draft, Z.X.; Writing–Review and Editing, Z.X., Z.R., and H.L.

Funding

This research was funded by the National Natural Science Foundation of China (No. 1167020010).

Acknowledgments

The authors thank Chunxiao Jiao and Xiuli Zhang in Shanghai Jiao Tong University for their contributions to the experiments.

Conflicts of Interest

The authors declare no conflict of interest.

Nomenclature

Cradial clearance = RbRj
Rb, Rjbearing and journal radii
eeccentricity
εeccentricity ratio, e/c
L, Dwidth and diameter of bearing
phydrodynamic pressure
hminminimum film thickness
δhmacroscopic elastic deformation of the bushing
hreal film thickness
h0nominal film thickness
P total external load
ωangular velocity = 2πN
ρ lubricant density
µlubricant viscosity
Tftangential force
k x x , k x y , k y x , k y y coefficient of stiffness
O b , O j bearing, journal left
θangular coordinate
σ 1 , σ 2 RMS surface roughness of two surfaces
δ 1 , δ 2 roughness height of two surfaces
σ combined surface roughness
λ film thickness ratio
Tbushing thickness
Ecombined elastic modulus
ϕ s shear flow factor
ϕ c contact factor
ϕ x , ϕ z pressure flow factors
θ s , θ f start angle and end angle of the groove
δ groove height of fluid film in the groove
ψ clearance ratio
Gbearing gravity
c x x , c x y , c y x , c y y coefficient of damping

References

  1. Hirani, H.; Verma, M. Tribological study of elastomeric bearings for marine propeller shaft system. Tribol. Int. 2009, 42, 378–390. [Google Scholar] [CrossRef]
  2. Huang, W.; Xu, Y.; Zheng, Y.; Wang, X. The tribological performance of Ti(C,N)-based cermet sliding against Si3N4 in water. Wear 2011, 270, 682–687. [Google Scholar] [CrossRef]
  3. Wang, J.; Yan, F.; Xue, Q. Tribological behavior of PTFE sliding against steel in sea water. Wear 2009, 267, 1634–1641. [Google Scholar] [CrossRef]
  4. Wang, N.; Meng, Q.; Wang, P.; Geng, T.; Yuan, X. Experimental Research on Film Pressure Distribution of Water-Lubricated Rubber Bearing with Multiaxial Grooves. J. Fluids Eng. 2013, 135, 084501. [Google Scholar] [CrossRef]
  5. Litwin, W. Experimental research on water lubricated three layer sliding bearing with lubrication grooves in the upper part of the bush and its comparison with a rubber bearing. Tribol. Int. A 2015, 82, 153–161. [Google Scholar] [CrossRef]
  6. Cabrera, D.; Woolley, N.; Allanson, D.; Tridimas, Y. Film pressure distribution in water-lubricated rubber journal bearings. Proc. Inst. Mech. Eng. J J. Eng. Tribol. 2005, 219, 125–132. [Google Scholar] [CrossRef]
  7. Heberley, B.D. Advances in Hybrid Water-Lubricated Journal Bearings for Use in Ocean Vessels. Ph.D. Thesis, Massachusetts Institute of Technology, Cambridge, MA, USA, 2013. [Google Scholar]
  8. Majumdar, B.; Pai, R.; Hargreaves, D. Analysis of water-lubricated journal bearings with multiple axial grooves. Proc. Inst. Mech. Eng. J J. Eng. Tribol. 2004, 218, 135–146. [Google Scholar] [CrossRef]
  9. Wang, X.; Adachi, K.; Otsuka, K.; Kato, K. Optimization of the surface texture for silicon carbide sliding in water. Appl. Surf. Sci. 2006, 253, 1282–1286. [Google Scholar] [CrossRef]
  10. Litwin, W. Influence of surface roughness topography on properties of water-lubricated polymer bearings: Experimental research. Tribol. Trans. 2011, 54, 351–361. [Google Scholar] [CrossRef]
  11. Wang, J.; Chen, B.; Liu, N.; Han, G.; Yan, F. Combined effects of fiber/matrix interface and water absorption on the tribological behaviors of water-lubricated polytetrafluoroethylene-based composites reinforced with carbon and basalt fibers. Compos. A Appl. Sci. Manuf. 2014, 59, 85–92. [Google Scholar] [CrossRef]
  12. Zhao, B.; Zhang, S.; Man, J.; Zhang, Q.; Chen, Y. A modified normal contact stiffness model considering effect of surface topography. Proc. Inst. Mech. Eng. J J. Eng. Tribol. 2015, 229, 677–688. [Google Scholar] [CrossRef]
  13. Pai, R.; Pai, R. Stability of four-axial and six-axial grooved water-lubricated journal bearings under dynamic load. Proc. Inst. Mech. Eng. J J. Eng. Tribol. 2008, 222, 683–691. [Google Scholar] [CrossRef]
  14. Zhu, D.; Wang, Q.J. On the λ ratio range of mixed lubrication. Proc. Inst. Mech. Eng. J J. Eng. Tribol. 2012, 226, 1010–1022. [Google Scholar] [CrossRef]
  15. Yeo, C.-D.; Katta, R.R.; Lee, J.; Polycarpou, A.A. Effect of asperity interactions on rough surface elastic contact behavior: Hard film on soft substrate. Tribol. Int. 2010, 43, 1438–1448. [Google Scholar] [CrossRef]
  16. Sahlin, F.; Larsson, R.; Marklund, P.; Almqvist, A.; Lugt, P. A mixed lubrication model incorporating measured surface topography. Part 2: Roughness treatment, model validation, and simulation. Proc. Inst. Mech. Eng. J J. Eng. Tribol. 2010, 224, 353–365. [Google Scholar] [CrossRef]
  17. Sahlin, F.; Larsson, R.; Almqvist, A.; Lugt, P.; Marklund, P. A mixed lubrication model incorporating measured surface topography. Part 1: Theory of flow factors. Proc. Inst. Mech. Eng. J J. Eng. Tribol. 2010, 224, 335–351. [Google Scholar] [CrossRef]
  18. Lin, J.-R.; Hsu, C.-H.; Lai, C. Surface roughness effects on the oscillating squeeze-film behavior of long partial journal bearings. Comput. Struct. 2002, 80, 297–303. [Google Scholar] [CrossRef]
  19. Hsu, T.-C.; Chen, J.-H.; Chiang, H.-L.; Chou, T.-L. Lubrication performance of short journal bearings considering the effects of surface roughness and magnetic field. Tribol. Int. 2013, 61, 169–175. [Google Scholar] [CrossRef]
  20. He, T.; Zou, D.; Lu, X.; Guo, Y.; Wang, Z.; Li, W. Mixed-lubrication analysis of marine stern tube bearing considering bending deformation of stern shaft and cavitation. Tribol. Int. 2014, 73, 108–116. [Google Scholar] [CrossRef]
  21. Tala-Ighil, N.; Fillon, M. A numerical investigation of both thermal and texturing surface effects on the journal bearings static characteristics. Tribol. Int. 2015, 90, 228–239. [Google Scholar] [CrossRef]
  22. Brito, F.P.; Miranda, A.S.; Fillon, M. Analysis of the effect of grooves in single and twin axial groove journal bearings under varying load direction. Tribol. Int. 2016, 103, 609–619. [Google Scholar] [CrossRef] [Green Version]
  23. Tala-Ighil, N.; Fillon, M.; Chaouche, A.B.; Mokhtari, A. Numerical study of thermal effects in the hydrodynamic behavior of textured journal bearings. AIP Conf. Proc. 2015, 1648, 850076. [Google Scholar] [CrossRef]
  24. Zhang, H.; Hua, M.; Dong, G.-N.; Zhang, D.-Y.; Chin, K.-S. A mixed lubrication model for studying tribological behaviors of surface texturing. Tribol. Int. 2016, 93, 583–592. [Google Scholar] [CrossRef]
  25. Vlădescu, S.-C.; Medina, S.; Olver, A.V.; Pegg, I.G.; Reddyhoff, T. Lubricant film thickness and friction force measurements in a laser surface textured reciprocating line contact simulating the piston ring–liner pairing. Tribol. Int. 2016, 98, 317–329. [Google Scholar] [CrossRef] [Green Version]
  26. Litwin, W.; Dymarski, C. Experimental research on water-lubricated marine stern tube bearings in conditions of improper lubrication and cooling causing rapid bush wear. Tribol. Int. 2016, 95, 449–455. [Google Scholar] [CrossRef]
  27. Zhang, X.; Yin, Z.; Gao, G.; Li, Z. Determination of stiffness coefficients of hydrodynamic water-lubricated plain journal bearings. Tribol. Int. 2015, 85, 37–47. [Google Scholar] [CrossRef]
  28. Illner, T.; Bartel, D.; Deters, L. Determination of the transition speed in journal bearings under consideration of bearing deformation. Tribol. Int. A 2015, 82, 58–67. [Google Scholar] [CrossRef]
  29. Gonçalves, D.; Graça, B.; Campos, A.V.; Seabra, J.; Leckner, J.; Westbroek, R. On the film thickness behaviour of polymer greases at low and high speeds. Tribol. Int. 2015, 90, 435–444. [Google Scholar] [CrossRef]
  30. Dadouche, A.; Conlon, M.J. Operational performance of textured journal bearings lubricated with a contaminated fluid. Tribol. Int. 2016, 93, 377–389. [Google Scholar] [CrossRef]
  31. Lu, X.; Khonsari, M.M. An Experimental Investigation of Dimple Effect on the Stribeck Curve of Journal Bearings. Tribol. Lett. 2007, 27, 169. [Google Scholar] [CrossRef]
  32. Tala-Ighil, N.; Fillon, M.; Maspeyrot, P. Effect of textured area on the performances of a hydrodynamic journal bearing. Tribol. Int. 2011, 44, 211–219. [Google Scholar] [CrossRef]
  33. Cristea, A.-F.; Bouyer, J.; Fillon, M.; Pascovici, M.D. Transient Pressure and Temperature Field Measurements in a Lightly Loaded Circumferential Groove Journal Bearing from Startup to Steady-State Thermal Stabilization. Tribol. Trans. 2017, 60, 988–1010. [Google Scholar] [CrossRef]
  34. Xie, Z.; Rao, Z.-S.; Liu, L.; Chen, R. Theoretical and experimental research on the friction coefficient of water lubricated bearing with consideration of wall slip effects. Mech. Ind. 2016, 17, 106–119. [Google Scholar] [CrossRef]
  35. Xie, Z.L.; Rao, Z.S.; Na, T.; Liu, L. Investigations on transitions of lubrication states for water lubricated bearing. Part I: Determination of friction coefficients and film thickness ratios. Ind. Lubr. Tribol. 2016, 68, 404–415. [Google Scholar] [CrossRef]
  36. Xie, Z.L.; Rao, Z.S.; Na, T.; Liu, L. Investigations on transitions of lubrication states for water lubricated bearing. Part II: Further insight into the film thickness ratio lambda. Ind. Lubr. Tribol. 2016, 68, 416–429. [Google Scholar] [CrossRef]
  37. Bungartz, H.-J.; Mehl, M.; Schäfer, M. Fluid Structure Interaction II: Modelling, Simulation, Optimization; Springer: Berlin, Germany, 2010. [Google Scholar]
  38. Chung, T.J. Computational Fluid Dynamics; Cambridge University Press: Cambridge, UK, 2010. [Google Scholar]
  39. Hamrock, B.J. Fundamentals of Fluid Film Lubrication; Marcel Dekker: New York, NY, USA, 2004. [Google Scholar]
  40. Szeri, A.Z. Fluid Film Lubrication; Cambridge University Press: Cambridge, UK, 2011. [Google Scholar]
  41. Leighton, M.; Rahmani, R.; Rahnejat, H. Surface specific flow factors for prediction of cross-hatched surfaces. Surf. Topogr. Metrol. Prop. 2016, 4, 025002. [Google Scholar] [CrossRef]
Figure 1. Schematic representation of the film thickness in contact with rough surfaces.
Coatings 09 00023 g001
Figure 2. Physical layout of the bearing-rotor test rig system.
Coatings 09 00023 g002
Figure 3. Line drawing of the experiment system: 1-motor; 2-damper; 3-coupling; 4-shaft; 5-hydrostatic bearing; 6-tested bearing; 7-shaft sleeve; 8-hydraulic cylinder; 9-leading bar; 10-force sensor; 11-eddy–current sensor; 12-water tank; 13-water; 14-base.
Coatings 09 00023 g003
Figure 4. Closer view of the load unit. (a) load unit; (b) closer view of the load unit.
Coatings 09 00023 g004
Figure 5. Layout of measuring points for the bearing. (a) displacement sensors along the circumferential; (b) relative positions of the displacement sensors.
Coatings 09 00023 g005
Figure 6. 3D morphology distribution of the four test samples (the height scale is not the same in all subfigures). (a) sample 1#; (b) sample 2#; (c) sample 3#; (d) sample 4#.
Coatings 09 00023 g006
Figure 7. Schematic diagram of Sections 1 and 2.
Coatings 09 00023 g007
Figure 8. Comparison of the pressure distribution between this research and reference [20]. (a) Section 1; (b) Section 2.
Coatings 09 00023 g008
Figure 9. Effect of eccentricity ratio on the pressure distribution.
Coatings 09 00023 g009
Figure 10. Effect of bushing thickness on the pressure distribution.
Coatings 09 00023 g010
Figure 11. Effect of elastic deformation on the lubrication performance: (a) load-carrying capacity; (b) friction coefficient.
Coatings 09 00023 g011
Figure 12. Effect of elastic deformation on the dynamic coefficients: (a) stiffness coefficient; (b) damping coefficient.
Coatings 09 00023 g012
Figure 13. Minimum film thickness under different specific pressures.
Coatings 09 00023 g013
Figure 14. Curve of the external load and the relative displacement in the vertical direction.
Coatings 09 00023 g014
Figure 15. Curve of the external load and the relative displacement in the horizontal direction.
Coatings 09 00023 g015
Figure 16. Verification of friction coefficient (σ1 represents bearing #1, σ2 represents bearing #2).
Coatings 09 00023 g016
Figure 17. Relationship between the friction coefficient and the velocity for different clearance ratios ψ: (a) ψ = 0.5‰, (b) ψ = 1.0‰, (c) ψ = 1.5‰, and (d) ψ = 2.0‰.
Coatings 09 00023 g017aCoatings 09 00023 g017b
Figure 18. Relationship between the friction coefficient and the specific pressure for different clearance ratios ψ: (a) ψ = 0.5‰, (b) ψ = 1.0‰, (c) ψ = 1.5‰, and (d) ψ = 2.0‰.
Coatings 09 00023 g018
Figure 19. Fitting curve of the friction coefficient: (a) ψ=1‰, (b) ψ=1.5‰.
Coatings 09 00023 g019
Figure 20. Fitting curve of the friction coefficient (ψ = 1‰).
Coatings 09 00023 g020
Figure 21. Fitting curve of the friction coefficient.
Coatings 09 00023 g021
Table 1. Geometry of the bearing.
DescriptionSymbolValueDimension
WidthL80mm
DiameterD62mm
L/D ratioL/D1.30
Radial clearanceC0.03–0.07mm
Clearance ratioΨ0.096‰–2.25‰
VelocityV0.001–10m/s
External loadF80–6000N
Table 2. Characteristic parameters of the surface topography for the four tested samples. Sa: arithmetic mean height; Sq: root mean square height; Vmp: peak material volume; Vvv: pit void volume.
ParameterBefore/After ExperimentUnitS1S2S3S4
SaBeforeµm1.439 (±0.0288)2.046 (±0.0409)2.107 (±0.0421)3.134 (±0.0627)
Afterµm1.222 (±0.0244)1.914 (±0.0383)1.853 (±0.0371)2.238 (±0.0448)
SqBeforeµm1.995 (±0.0399)2.656 (±0.0531)2.821 (±0.0564)4.028 (±0.0842)
Afterµm1.668 (±0.0334)2.216 (±0.0452)2.029 (±0.0406)2.870 (±0.0574)
VmpBeforeµm³/µm20.183 (±0.0037)0.197 (±0.0039)0.230 (±0.0046)0.323 (±0.0065)
Afterµm³/µm20.141 (±0.0028)0.158 (±0.0032)0.208 (±0.0041)0.305 (±0.0061)
VvvBeforeµm³/µm20.171 (±0.0034)0.206 (±0.0041)0.254 (±0.00510.259 (±0.0052)
Afterµm³/µm20.165 (±0.0033)0.162 (±0.0032)0.211 (±0.0042)0.213 (±0.0043)
Table 3. Dynamic coefficient of the bearing.
ItemTheoretical (N/m)Test (N/m)Relative Error
Kyy2.86 × 1072.10 × 10726.57%
Kyx3.29 × 1062.72 × 10621.00%
Table 4. Estimated values of the coefficients.
ItemRange of the ValueRecommended Value
α 1 0.02468–0.12060.0967
α 2 5.5180–7.84706.6460
α 3 0.1018–0.22260.1531
α 4 0.1035–0.40690.2745
α 5 0.3372–0.68000.4439
α 6 0.02758–0.029970.0288

