Tribocorrosion Properties of PEO Coatings Produced on AZ91 Magnesium Alloy with Silicate- or Phosphate-Based Electrolytes

 ,
, 
 ,
, 
Abstract
:1. Introduction
2. Experimental
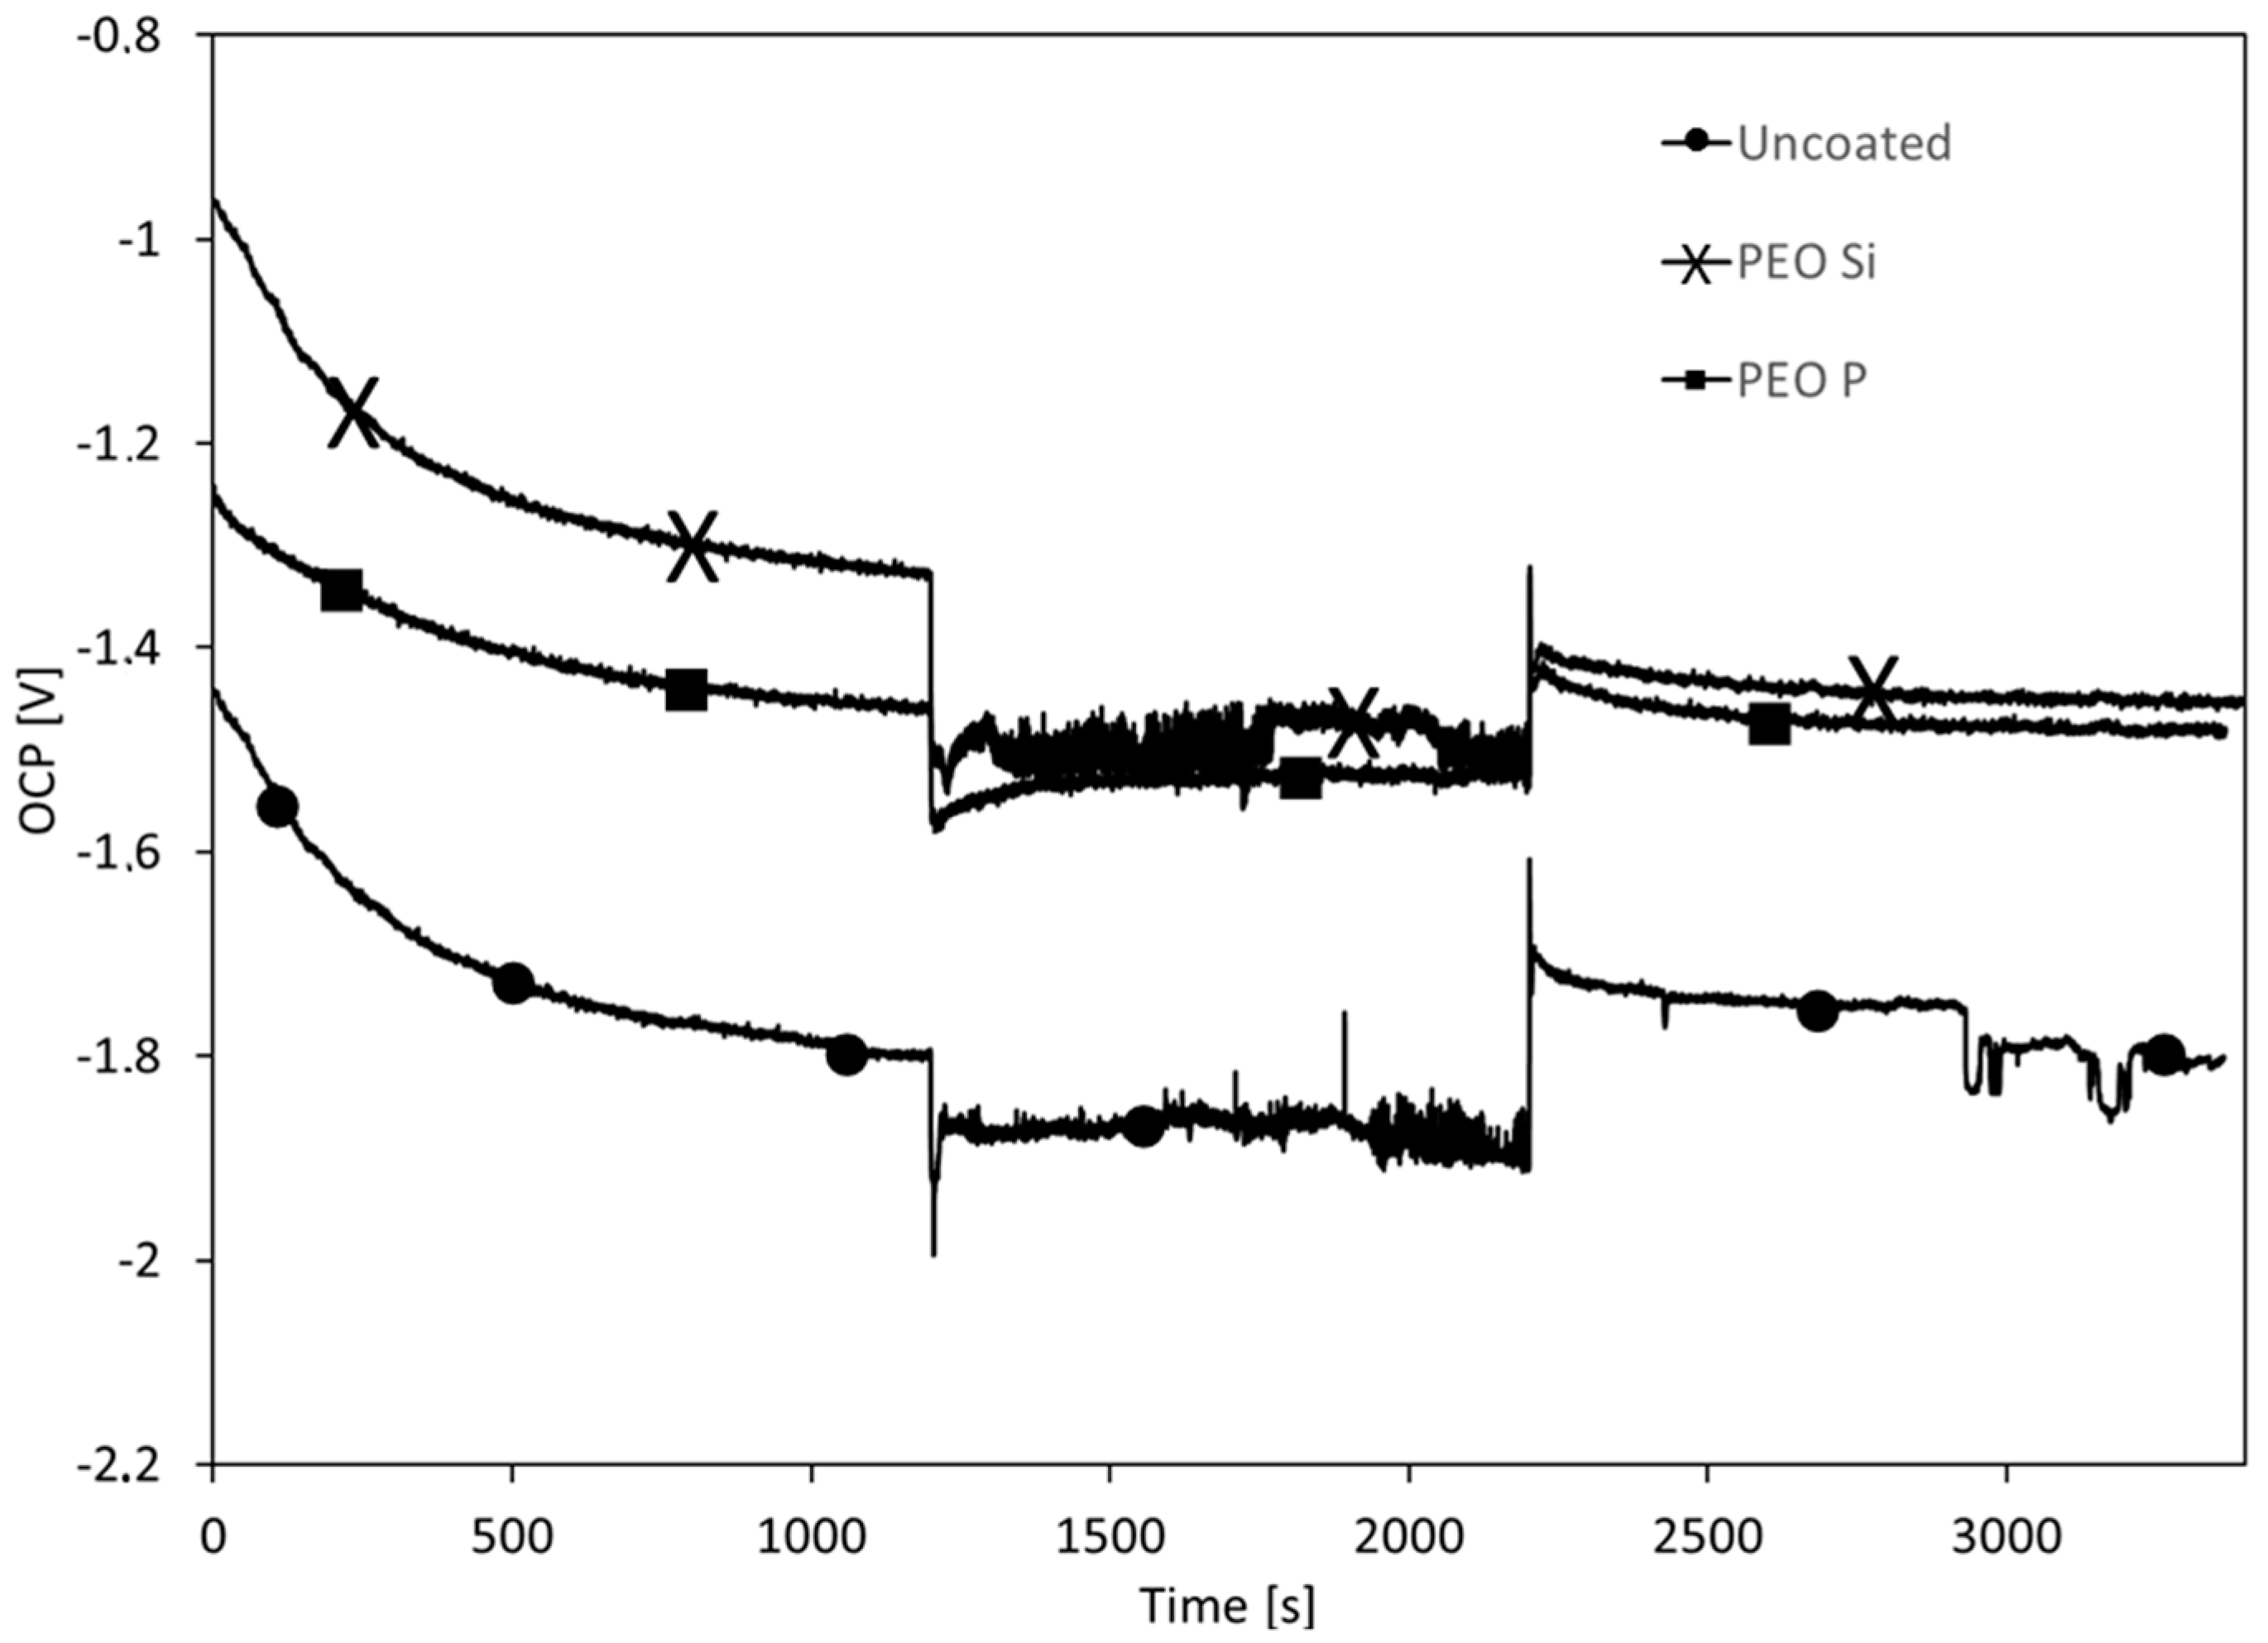
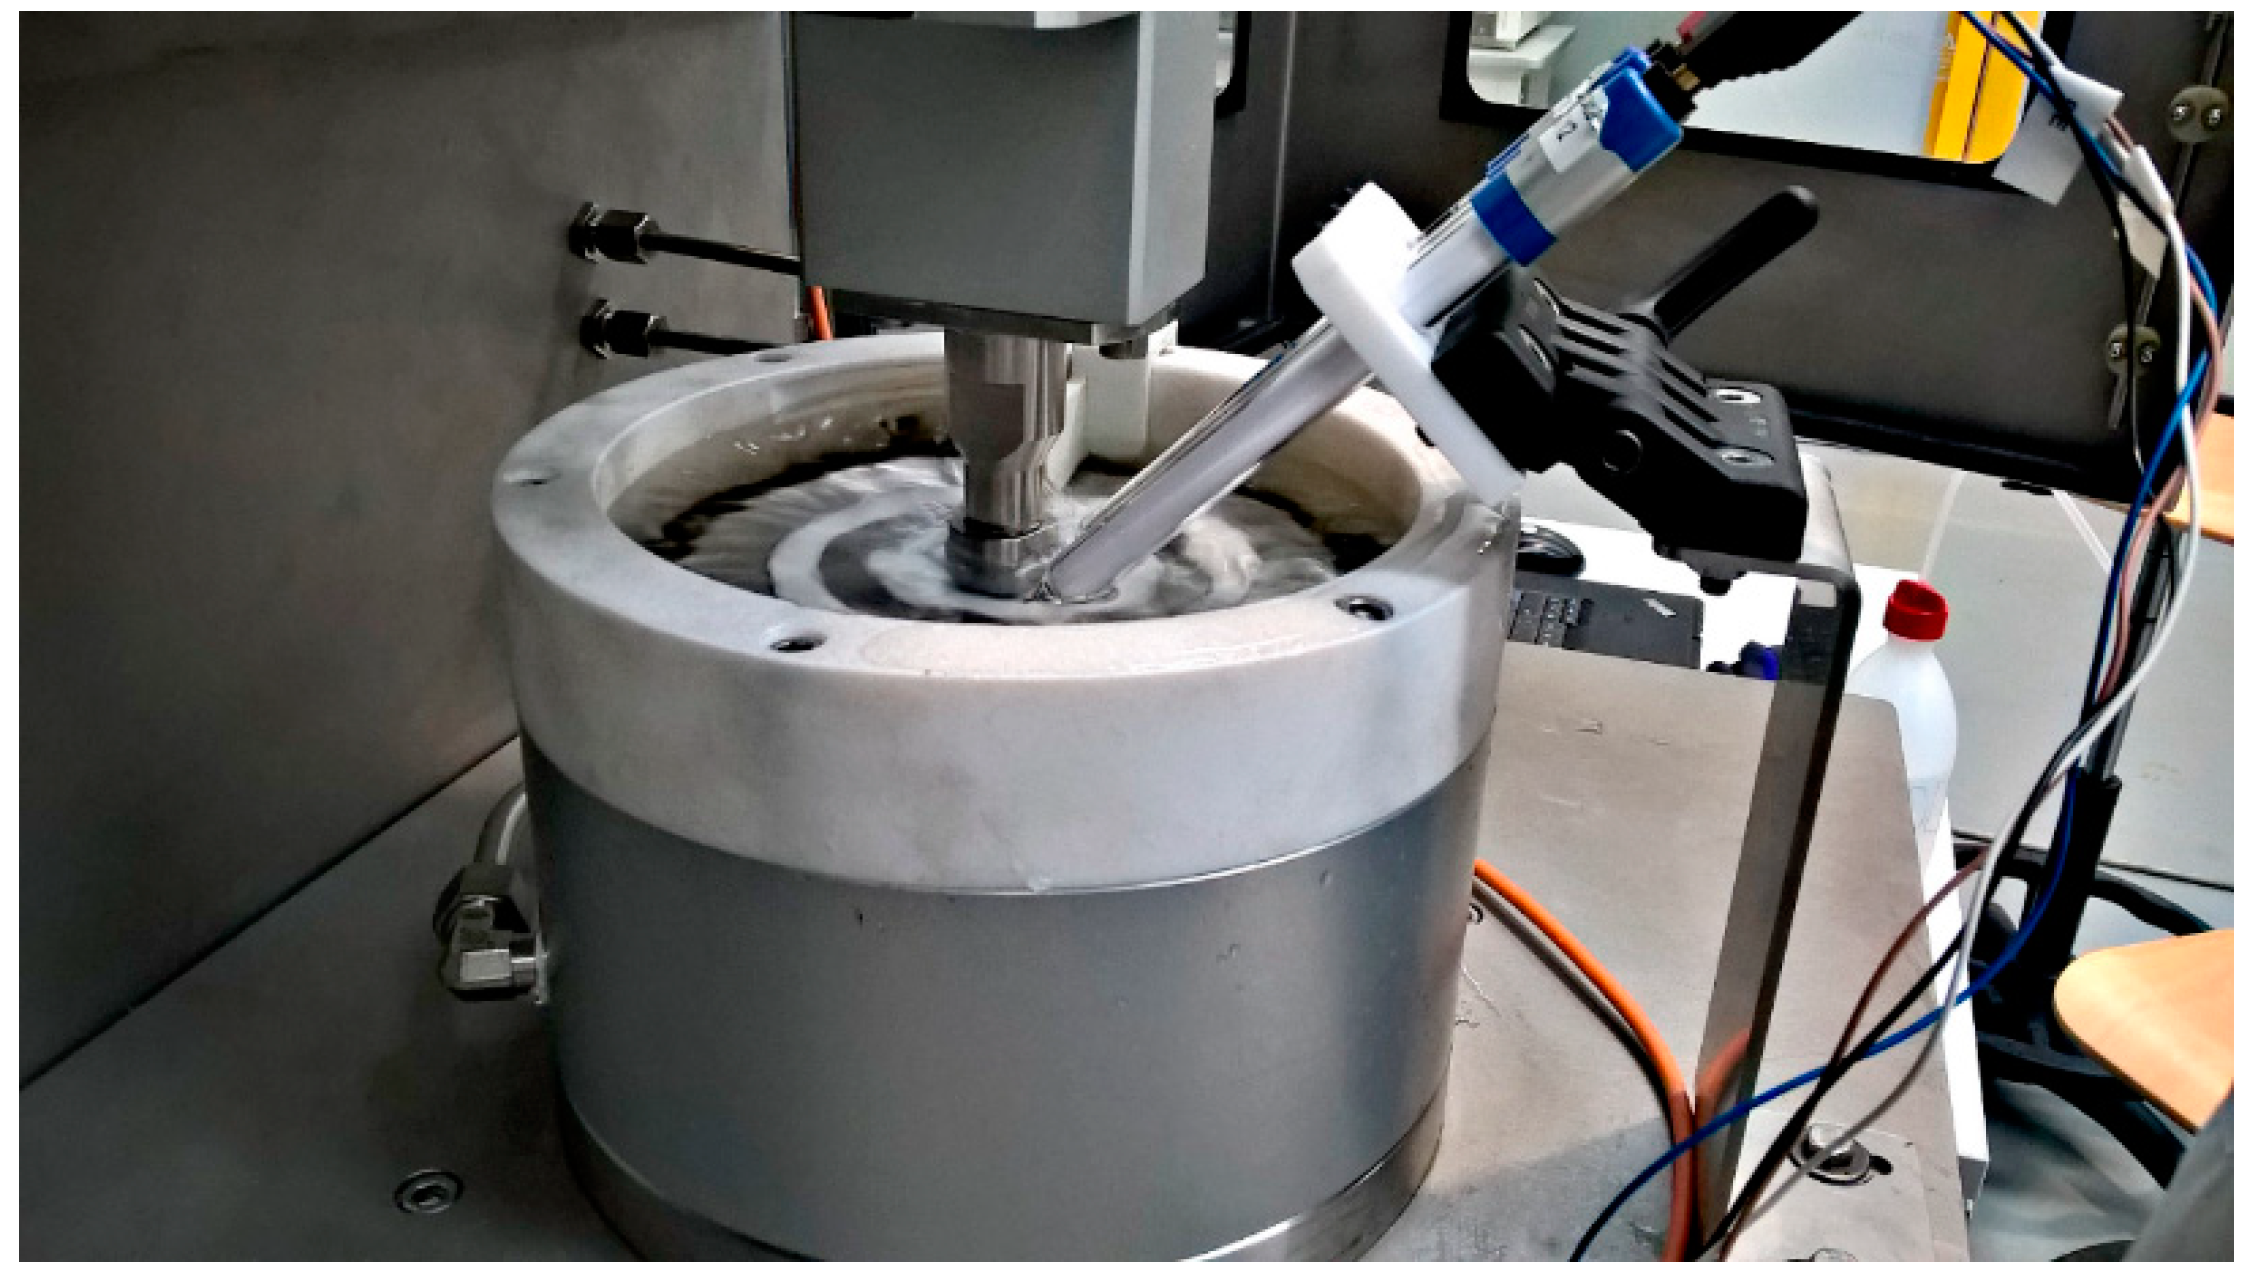
- the sample is left immersed in the electrolyte for 5 min for OCP stabilization;
- the OCP value is measured for the following 20 min without any wear;
- the pin is lowered with a force of 20 N and the OCP value is measured; this phase lasts 1000 s;
- finally, the OCP value is again measured without wear for another 20 min.
3. Results and Discussion
3.1. Surface Analysis
3.2. Corrosion Resistance
3.3. Micro-Hardness
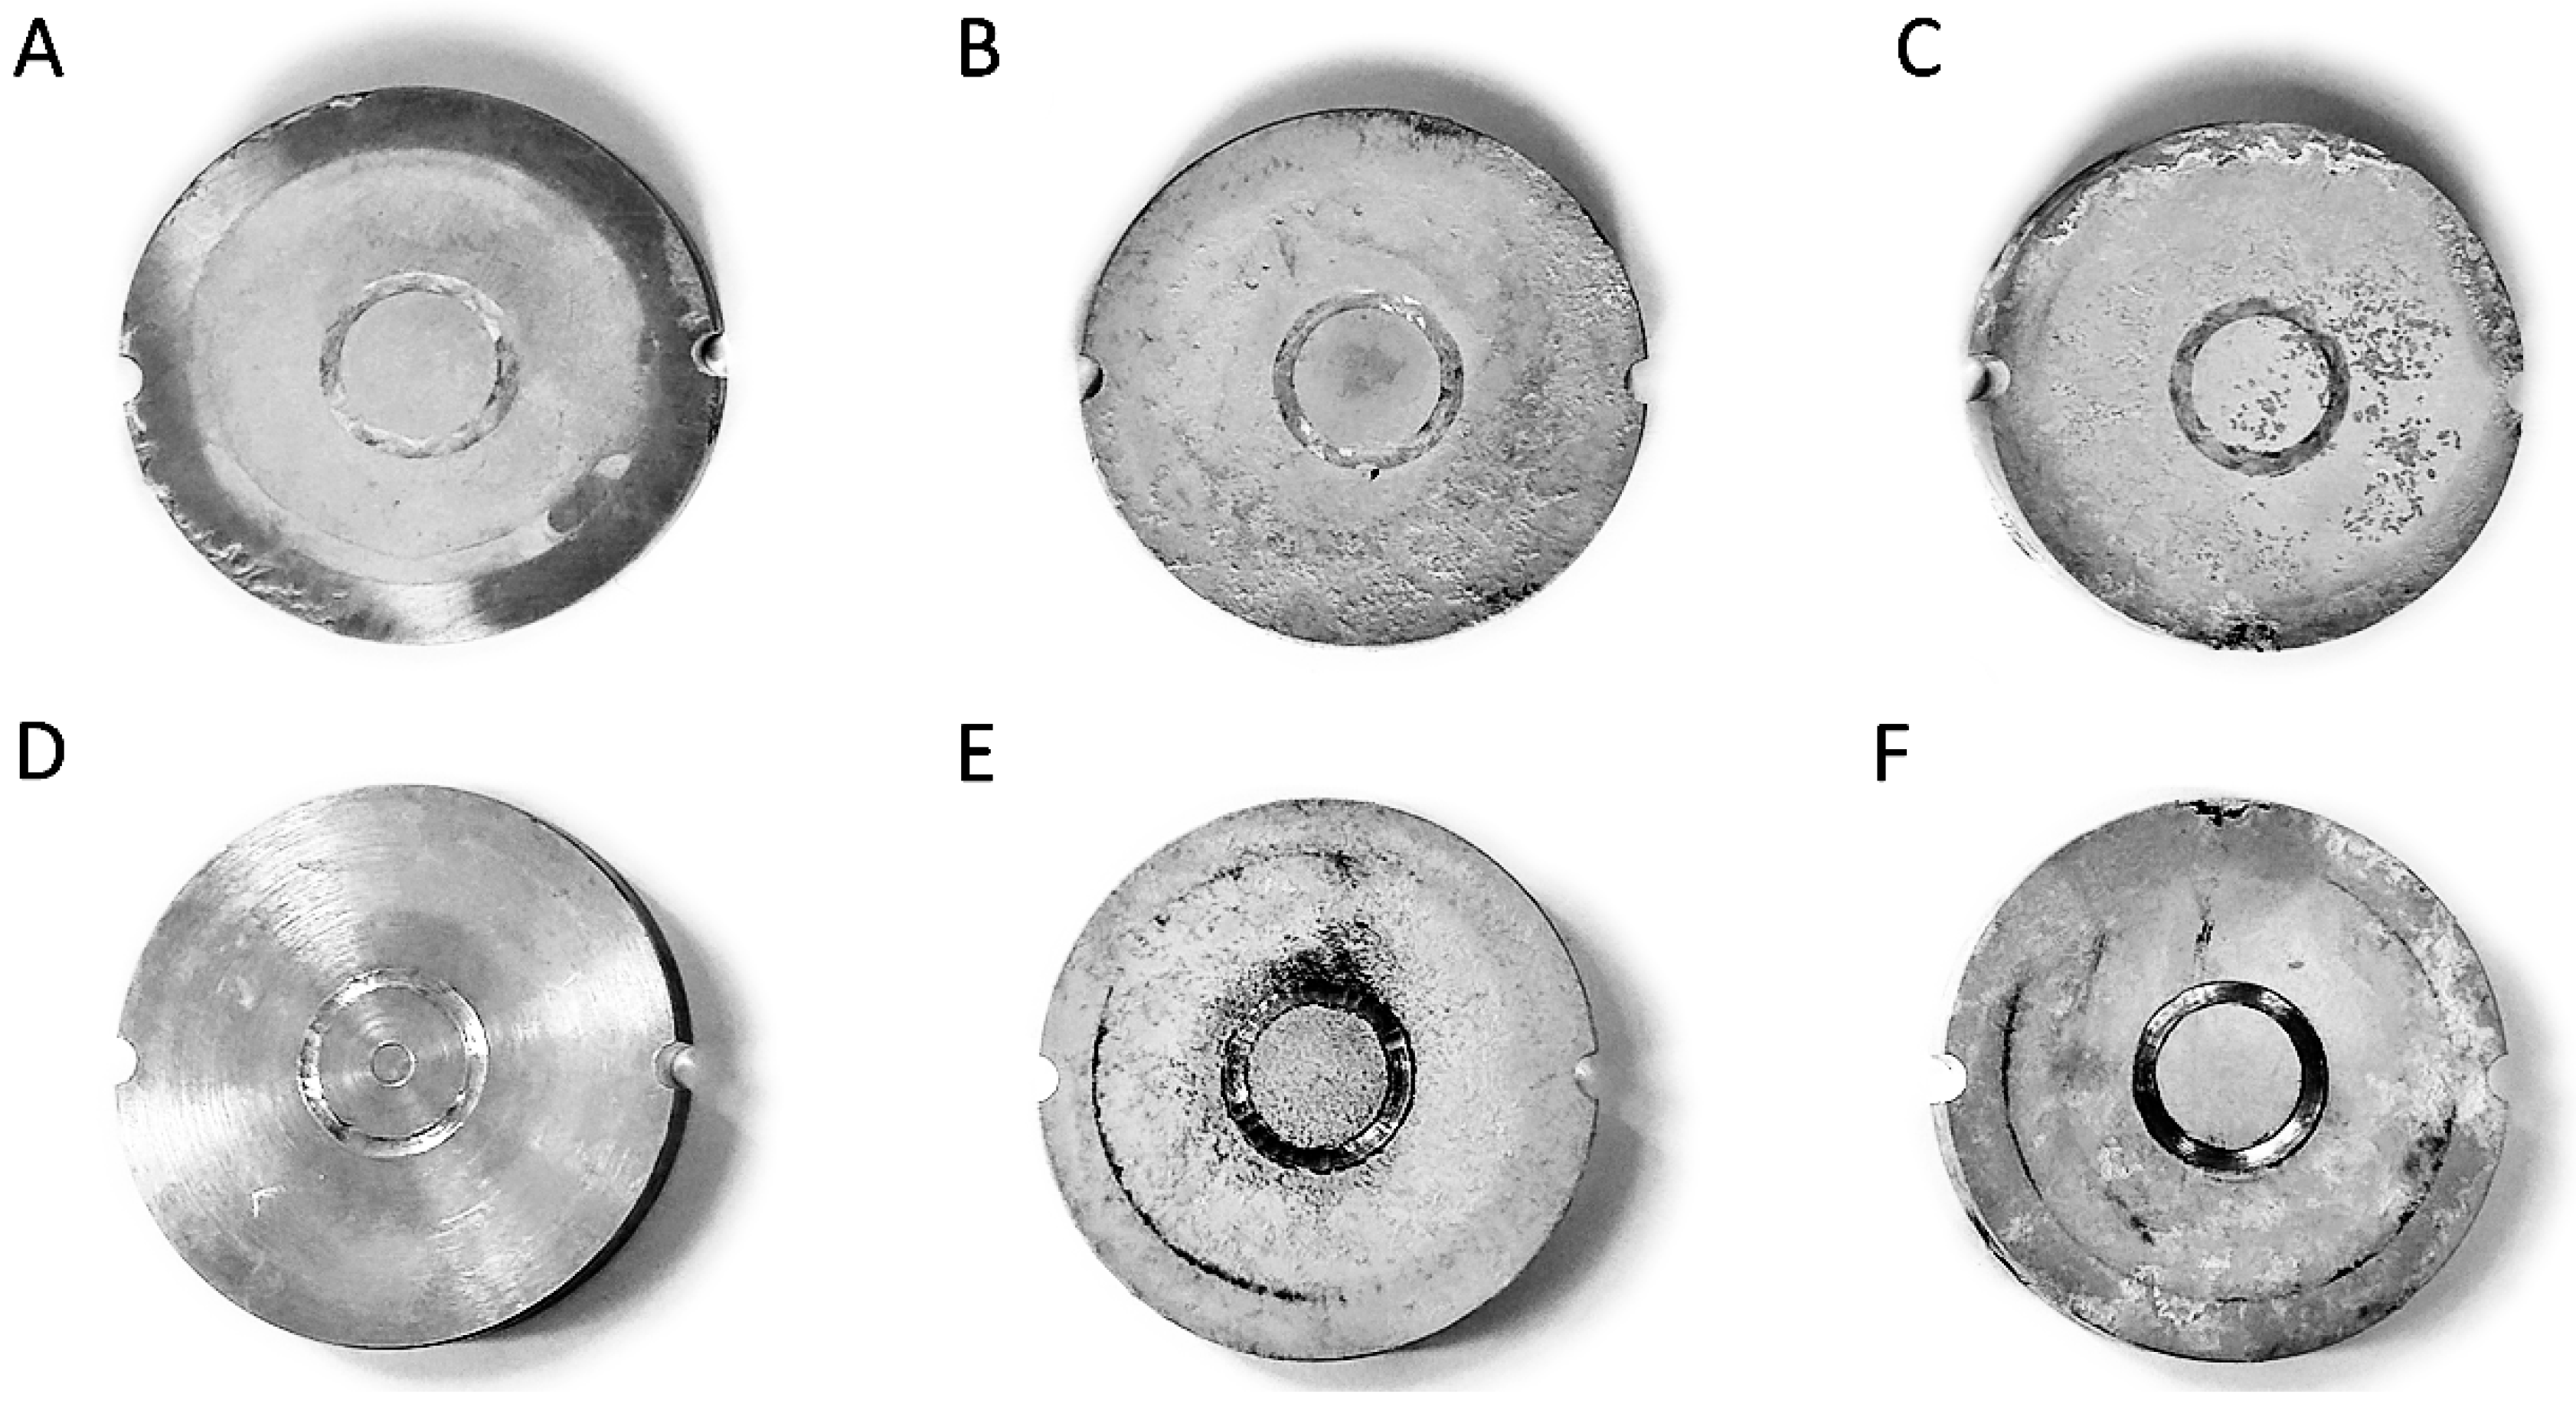
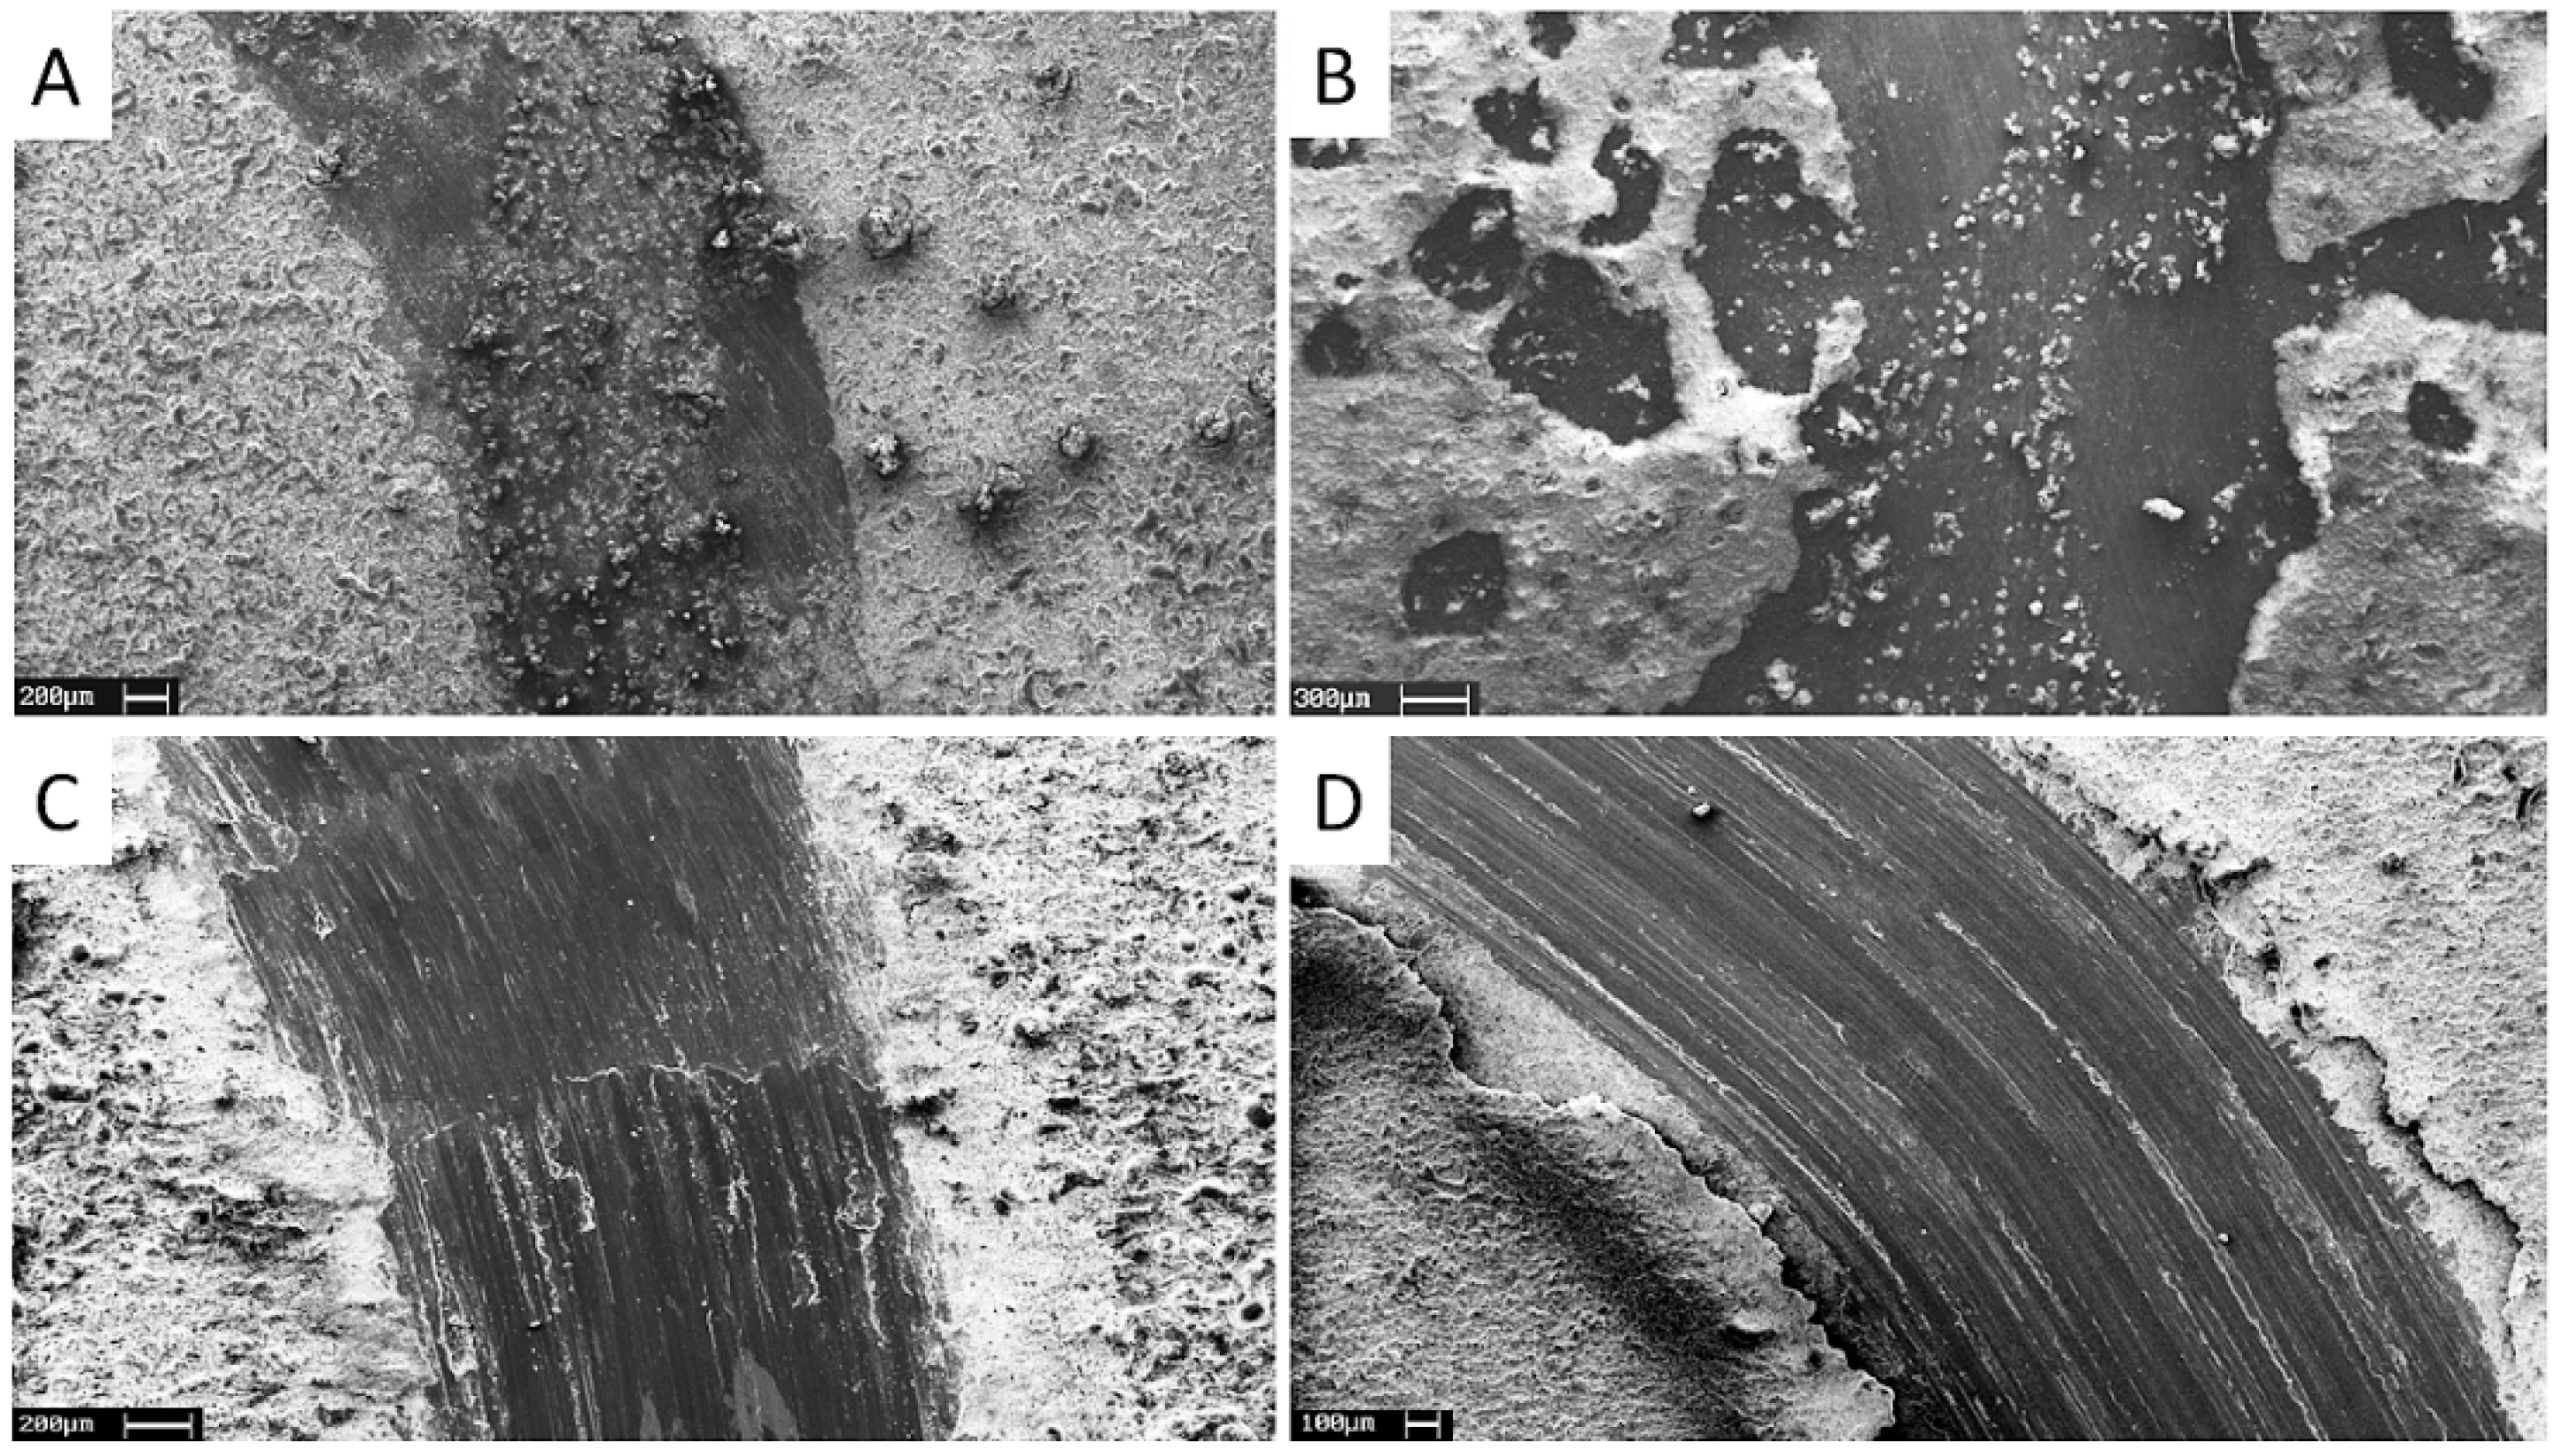
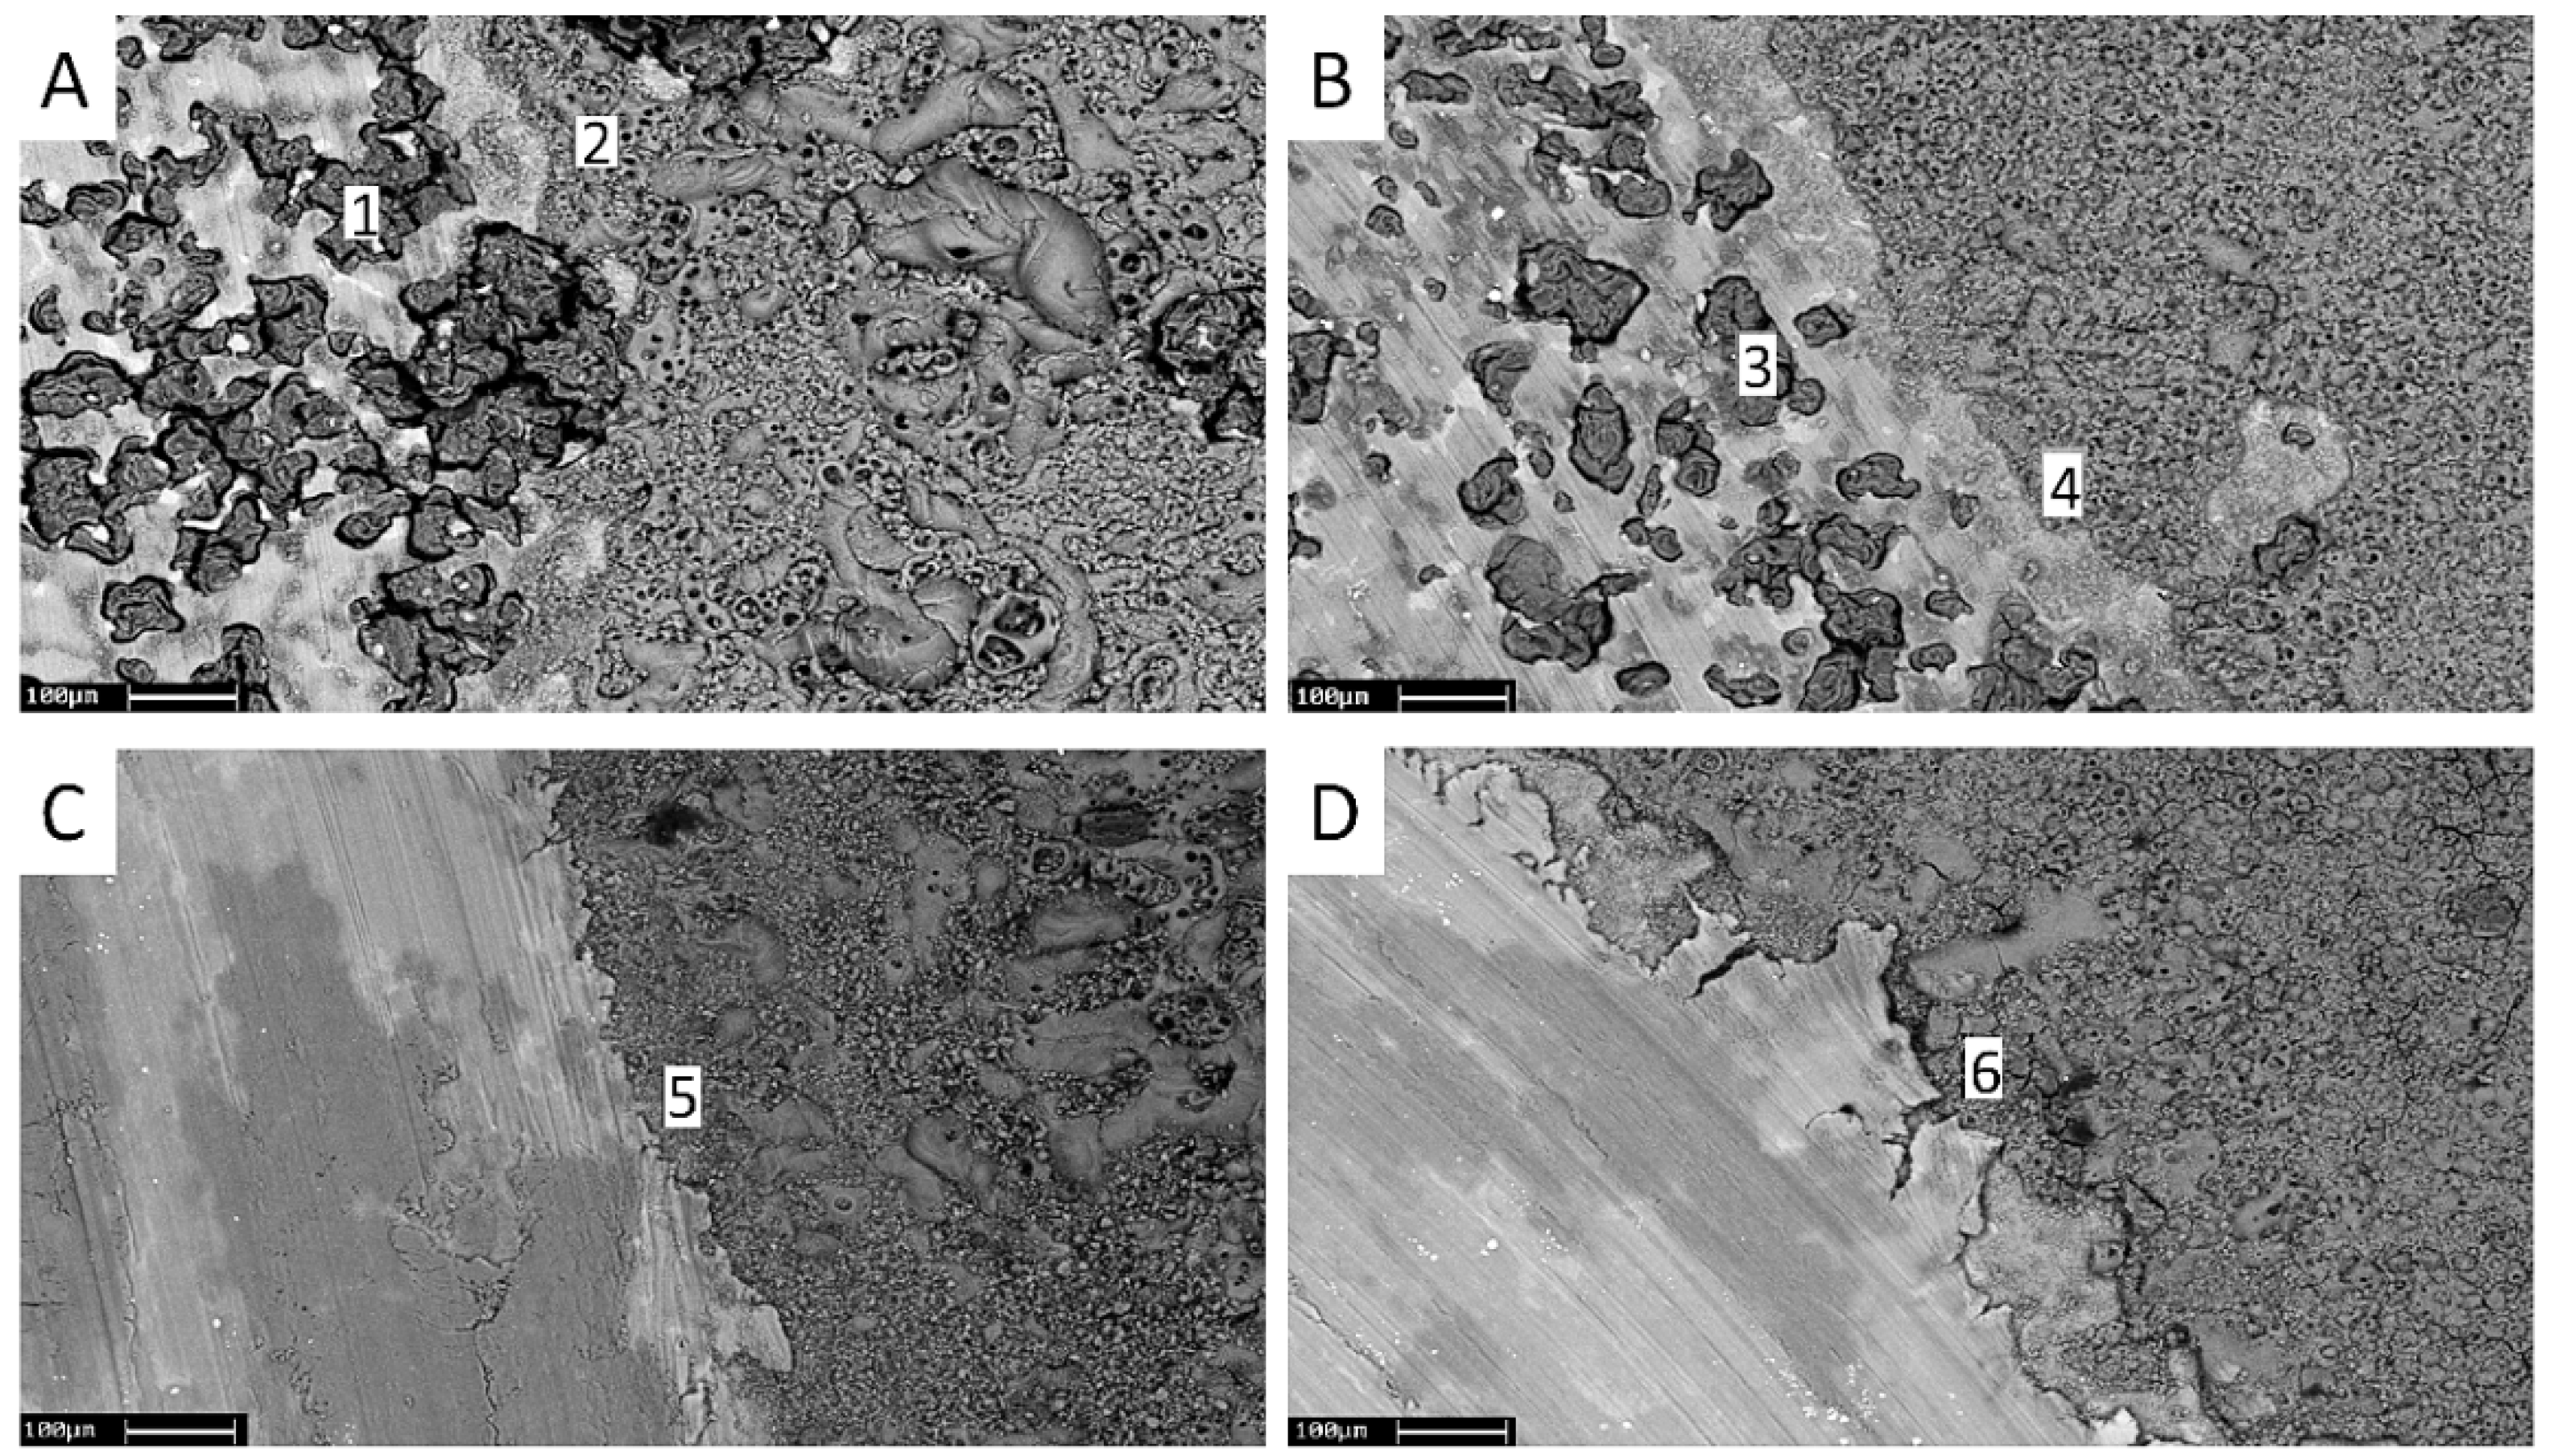
3.4. Tribocorrosion
4. Conclusions
Author Contributions
Funding
Acknowledgments
Conflicts of Interest
References
- Mordike, B.L.; Ebert, T. Magnesium properties—applications—potential. Mater. Sci. Eng. A 2001, 302, 37–45. [Google Scholar] [CrossRef]
- Wang, L.; Chen, L.; Yan, Z.C.; Wang, H.L.; Peng, J.Z. Growth and corrosion characteristics of plasma electrolytic oxidation ceramic films formed on AZ31 magnesium alloy. Chin. J. Process Eng. 2009, 9, 592–597. [Google Scholar]
- Song, G.; Atrens, A. Understanding magnesium corrosion—A framework for improved alloy performance. Adv. Eng. Mater. 2003, 5, 837–858. [Google Scholar] [CrossRef]
- Ponthiaux, P.; Wenger, F.; Celis, J.P. Tribocorrosion: Material Behavior under Combined Conditions of Corrosion and Mechanical Loading. In Corrosion Resistance; Shi, H., Ed.; InTech: Cambridge, UK, 2012; ISBN 978-953-51-0467-4. [Google Scholar]
- Wood, R.J.K.; Wharton, J.A. Coatings for Tribocorrosion Protection. In Tribocorrosion of Passive Metals and Coatings; Landolt, D., Mischler, S., Eds.; Woodhead Publishing Limited: Cambridge, UK, 2011; ISBN 978-0-85709-373-8. [Google Scholar]
- Snizhko, L.O.; Yerokhin, A.L.; Pilkington, A.; Gurevina, N.L.; Misnyankin, D.O.; Leyland, A.; Matthews, A. Anodic processes in plasma electrolytic oxidation of aluminium in alkaline solutions. Electrochim. Acta 2004, 49, 2085–2095. [Google Scholar] [CrossRef]
- Cao, F.H.; Lin, L.Y.; Zhang, Z.; Zhang, J.Q.; Cao, C.N. Environmental friendly plasma electrolytic oxidation of AM60magnesium alloy and its corrosion re-sistance. Trans. Nonferr. Met. Soc. China 2008, 18, 240–247. [Google Scholar] [CrossRef]
- Pezzato, L.; Brunelli, K.; Gross, S.; Magrini, M.; Dabalà, M. Effect of process parameters of plasma electrolytic oxidation on microstructure and corrosion properties of magnesium alloys. J. Appl. Electrochem. 2014, 44, 867–879. [Google Scholar] [CrossRef]
- Martin, J.; Melhem, A.; Shchedrina, I.; Duchanoy, T.; Nominè, A.; Henrion, G.; Czerwiec, T.; Belmonte, T. Effects of electrical parameters on plasma electrolytic oxidation of aluminium. Surf. Coat. Technol. 2013, 221, 70–76. [Google Scholar] [CrossRef]
- Cao, F.H.; Cao, J.L.; Zhang, Z.; Zhang, J.Q.; Cao, C.N. Plasma electrolytic oxidation of AZ91D magnesium alloy with different additives and its corrosion behavior. Mater. Corros. 2007, 58, 696–703. [Google Scholar] [CrossRef]
- Zhuang, J.J.; Song, R.G.; Xiang, N.; Xiong, Y.; Hu, Q. Effect of current density on microstructure and properties of PEO ceramic coatings on magnesium alloy. Surf. Eng. 2017, 33, 744–752. [Google Scholar] [CrossRef]
- Shim, G. Factors influencing plasma electrolytic oxidation (PEO) coatings on magnesium alloys: A review. J. Korean Inst. Met. Mater. 2017, 55, 296–307. [Google Scholar]
- Pezzato, L.; Brunelli, K.; Babbolin, R.; Dolcet, P.; Dabalà, M. Sealing of PEO coated AZ91 magnesium alloy using La-based solutions. Int. J. Corros. 2017, 2017, 5305218. [Google Scholar] [CrossRef]
- Mingo, B.; Arrabal, R.; Mohedano, M.; Llamazares, Y.; Matykina, E.; Yerokhin, A.; Pardo, A. Influence of sealing post-treatments on the corrosion resistance of PEO coated AZ91 magnesium alloy. Appl. Surf. Sci. 2018, 433, 653–667. [Google Scholar] [CrossRef]
- Ceschini, L.; Morri, A.; Angelini, V.; Messieri, S. Fatigue behavior of the rare earth rich EV31A Mg alloy: influence of plasma electrolytic oxidation. Metals 2017, 7, 212. [Google Scholar] [CrossRef]
- Pezzato, L.; Angelini, V.; Brunelli, K.; Martini, C.; Dabalà, M. Tribological and corrosion behavior of PEO coatings with graphite nanoparticles on AZ91 and AZ80 magnesium alloys. Trans. Nonferr. Met. Soc. 2018, 28, 259–272. [Google Scholar] [CrossRef]
- Garsivazjazi, M.R.; Golozar, M.A.; Raeissi, K.; Fazel, M. Evaluation of corrosion and tribocorrosion of plasma electrolytic oxidation treated Ti-6Al-4V alloy. Surf. Coat. Technol. 2014, 244, 29–36. [Google Scholar] [CrossRef]
- Barik, R.C.; Wharton, J.A.; Wood, R.J.K.; Stokes, K.R.; Jones, R.L. Corrosion, erosion and erosion–corrosion performance of plasma electrolytic oxidation (PEO) deposited Al2O3 coatings. Surf. Coat. Technol. 2005, 199, 158–167. [Google Scholar] [CrossRef]
- Nie, X.; Meletis, E.I.; Jiang, J.C.; Leyland, A.; Yerokhin, A.L.; Matthews, A. Abrasive wear/corrosion properties and TEM analysis of Al2O3 coatings fabricated using plasma electrolysis. Surf. Coat. Technol. 2002, 149, 245–251. [Google Scholar] [CrossRef]
- Li, X.; Liu, X.; Luan, B.L. Corrosion and wear properties of PEO coatings formed on AM60B alloy in NaAlO2 electrolytes. Appl. Surf. Sci. 2011, 257, 9135–9141. [Google Scholar] [CrossRef]
- Demirci, E.E.; Arslan, E.; Ezirmik, K.V.; Baran, O.; Totik, Y.; Efeoglu, I. Investigation of wear, corrosion and tribocorrosion properties of AZ91 Mg alloy coated by micro arc oxidation process in the different electrolyte solutions. Thin Solid Films 2013, 528, 116–122. [Google Scholar] [CrossRef]
- Hornberger, H.; Virtanen, S.; Boccaccini, A.R. Biomedical coatings on magnesium alloys—A review. Acta Biomater. 2012, 8, 2442–2455. [Google Scholar] [CrossRef] [PubMed]
- Li, Q.; Linag, J.; Wang, Q. Plasma Electrolytic Oxidation Coatings on Lightweight Metals. In Modern Surface Engineering Treatments; Aliofkhazraei, M., Ed.; InTech: Cambridge, UK, 2013; ISBN 978-953-51-1149-8. [Google Scholar]
- Blawert, C.; Bala Srinivasan, P. Plasma Electrolytic Oxidation Treatment of Magnesium Alloys. In Surface Engineering of Light Alloys; Dong, H., Ed.; Woodhead Publishing Limited: Cambridge, UK, 2010; ISBN 978-1-84569-945-1. [Google Scholar]
- Jiang, B.L.; Wang, J.M. Plasma Electrolytic Oxidation Treatment of Aluminium and Titanium Alloys. In Surface Engineering of Light Alloys; Dong, H., Ed.; Woodhead Publishing Limited: Cambridge, UK, 2010; ISBN 978-1-84569-945-1. [Google Scholar]
- Dehnavi, V.; Shoesmith, D.W.; Li, L.B.; Yari, M.; Yang, L.X.; Rohani, S. Corrosion properties of plasma electrolytic oxidation coatings on aluminum alloys-The effect of the PEO process stage. Mater. Chem. Phys. 2015, 161, 49–58. [Google Scholar] [CrossRef]
- Sreekanth, D.; Rameshbabu, N.; Venkateswarlu, K. Effect of various additives on morphology and corrosion behavior of ceramic coatings developed on AZ31 magnesium alloy by plasma electrolytic oxidation. Ceram. Int. 2012, 38, 4607–4615. [Google Scholar] [CrossRef]
- Pezzato, L.; Brunelli, K.; Dolcet, P. Dabalà M. Plasma electrolytic oxidation coating produced on 39NiCrMo3 steel. Surf. Coat. Technol. 2016, 48, 729–738. [Google Scholar]
- Liang, J.; Bala Srinivasan, P.; Blawert, C.; Störmer, M.; Dietzel, W. Electrochemical corrosion behaviour of plasma electrolytic oxidation coatings on AM50 magnesium alloy formed in silicate and phosphate based electrolytes. Electrochim. Acta 2009, 54, 3842–3850. [Google Scholar] [CrossRef]


| Mg | Al | Zn | Si | Mn | Fe | Cu |
|---|---|---|---|---|---|---|
| 90.8 | 8.5–9.5 | 0.7 | 0.35 | 0.18 | 0.014 | 0.003 |
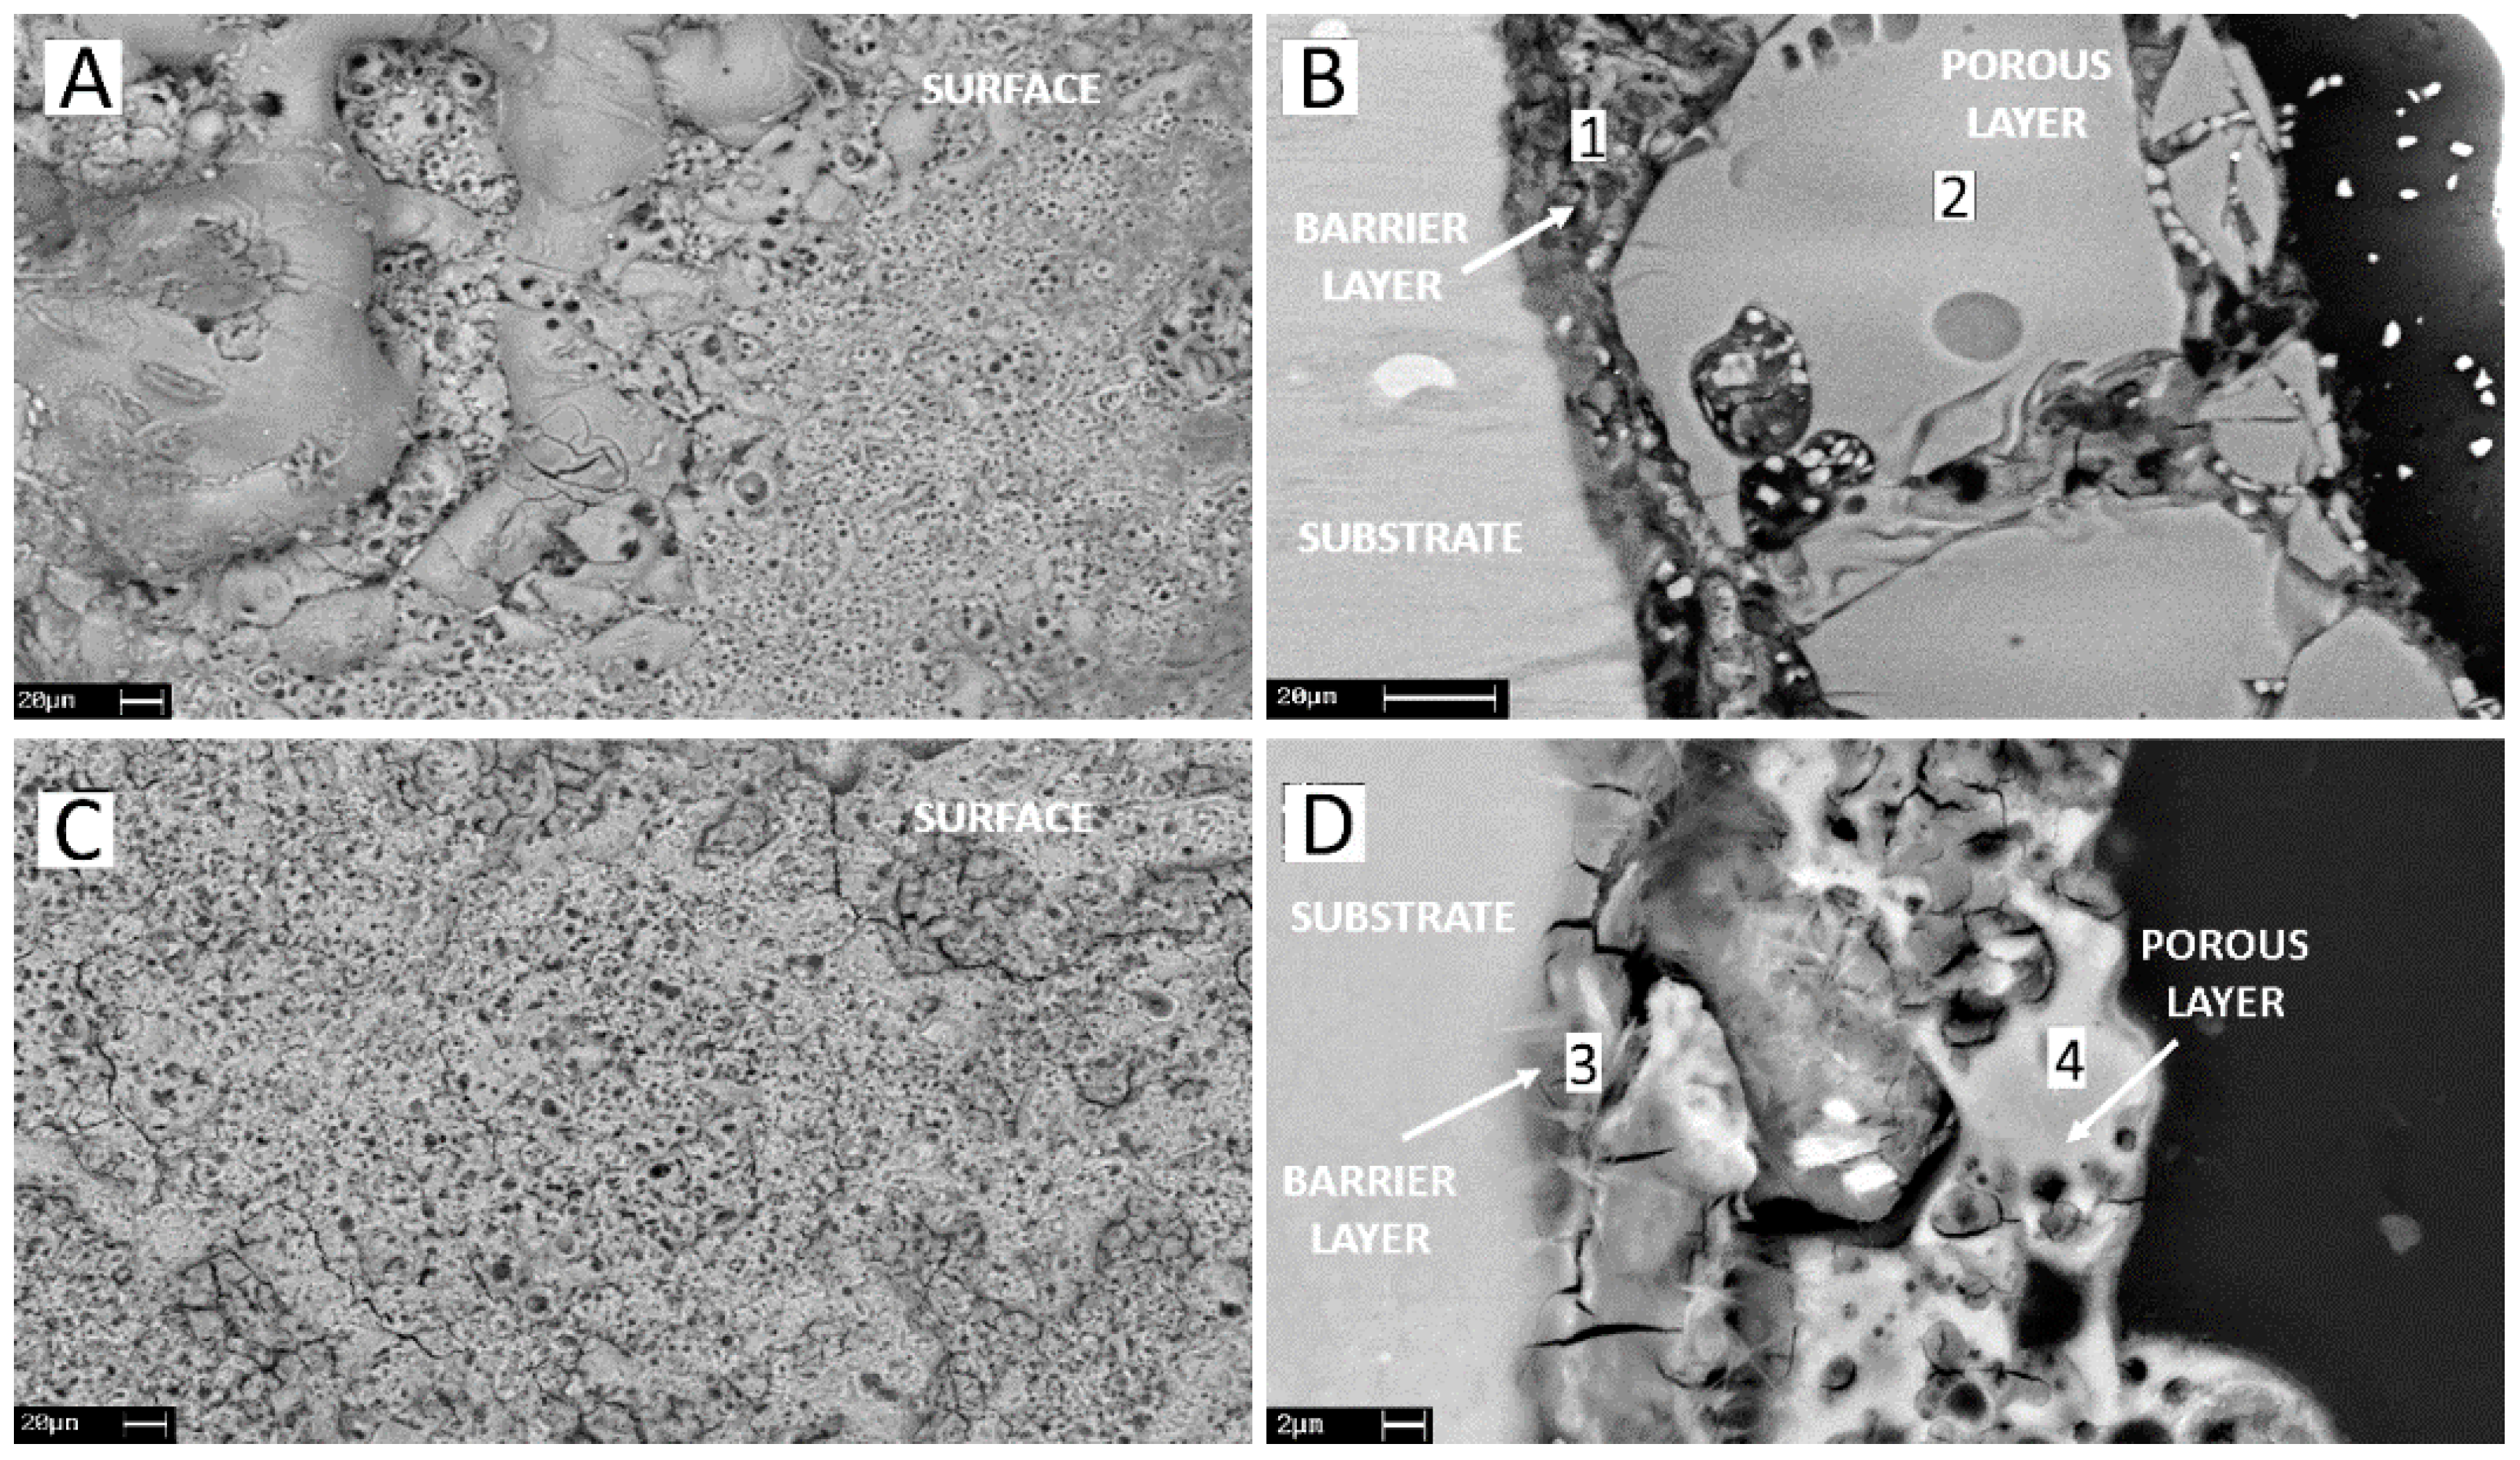
| Zone/Sample | O | Na | Mg | Al | Si | P |
|---|---|---|---|---|---|---|
| Surface PEO-Si | 50.9 | 9.8 | 18.2 | 1.0 | 20.1 | – |
| Barrier layer PEO-Si (1) | 47.4 | 10.9 | 22.5 | 1.4 | 17.8 | – |
| Porous layer PEO-Si (2) | 48.2 | 5.7 | 16.7 | 1.8 | 27.6 | – |
| Surface PEO-P | 45.2 | 7.1 | 24.4 | 2.9 | – | 20.4 |
| Barrier layer PEO-P (3) | 52.0 | 5.6 | 16.7 | 4.3 | – | 21.3 |
| Porous layer PEO-P (4) | 48.7 | 5.3 | 22.9 | 2.9 | – | 20.2 |
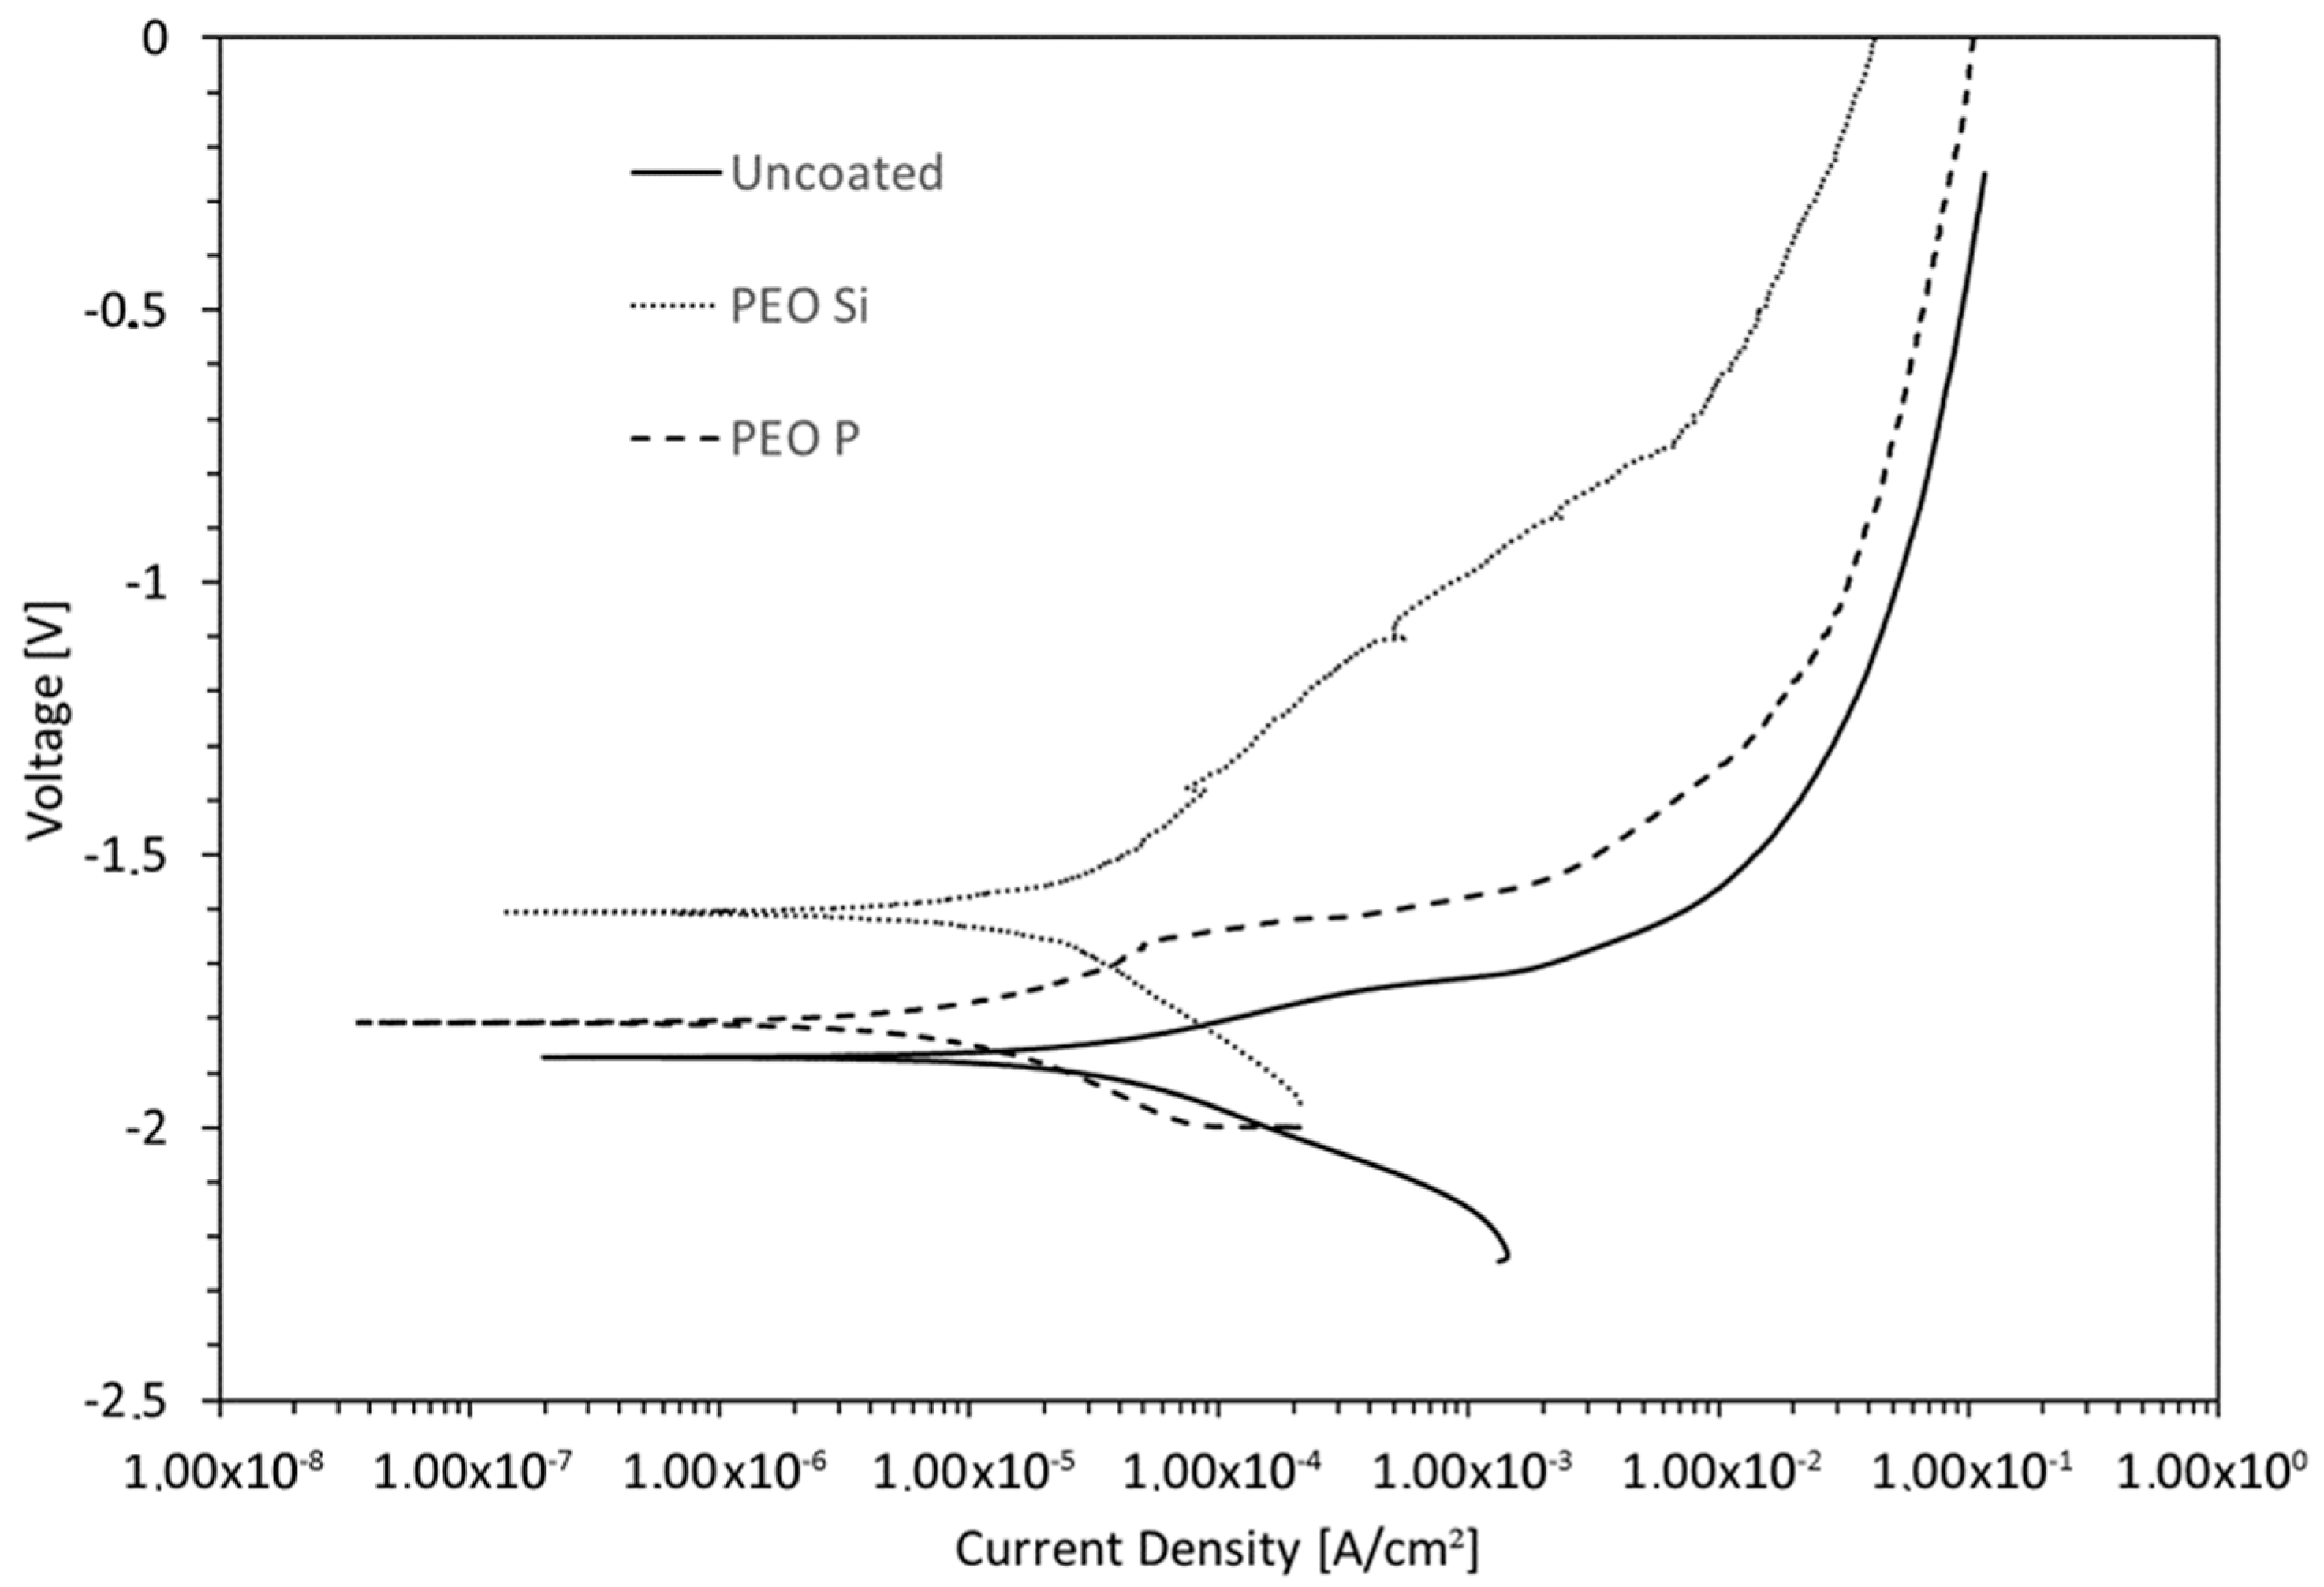
| Sample | [A/cm2] | [V] |
|---|---|---|
| Uncoated | −1.9 | |
| PEO Si | −1.6 | |
| PEO P | −1.8 |
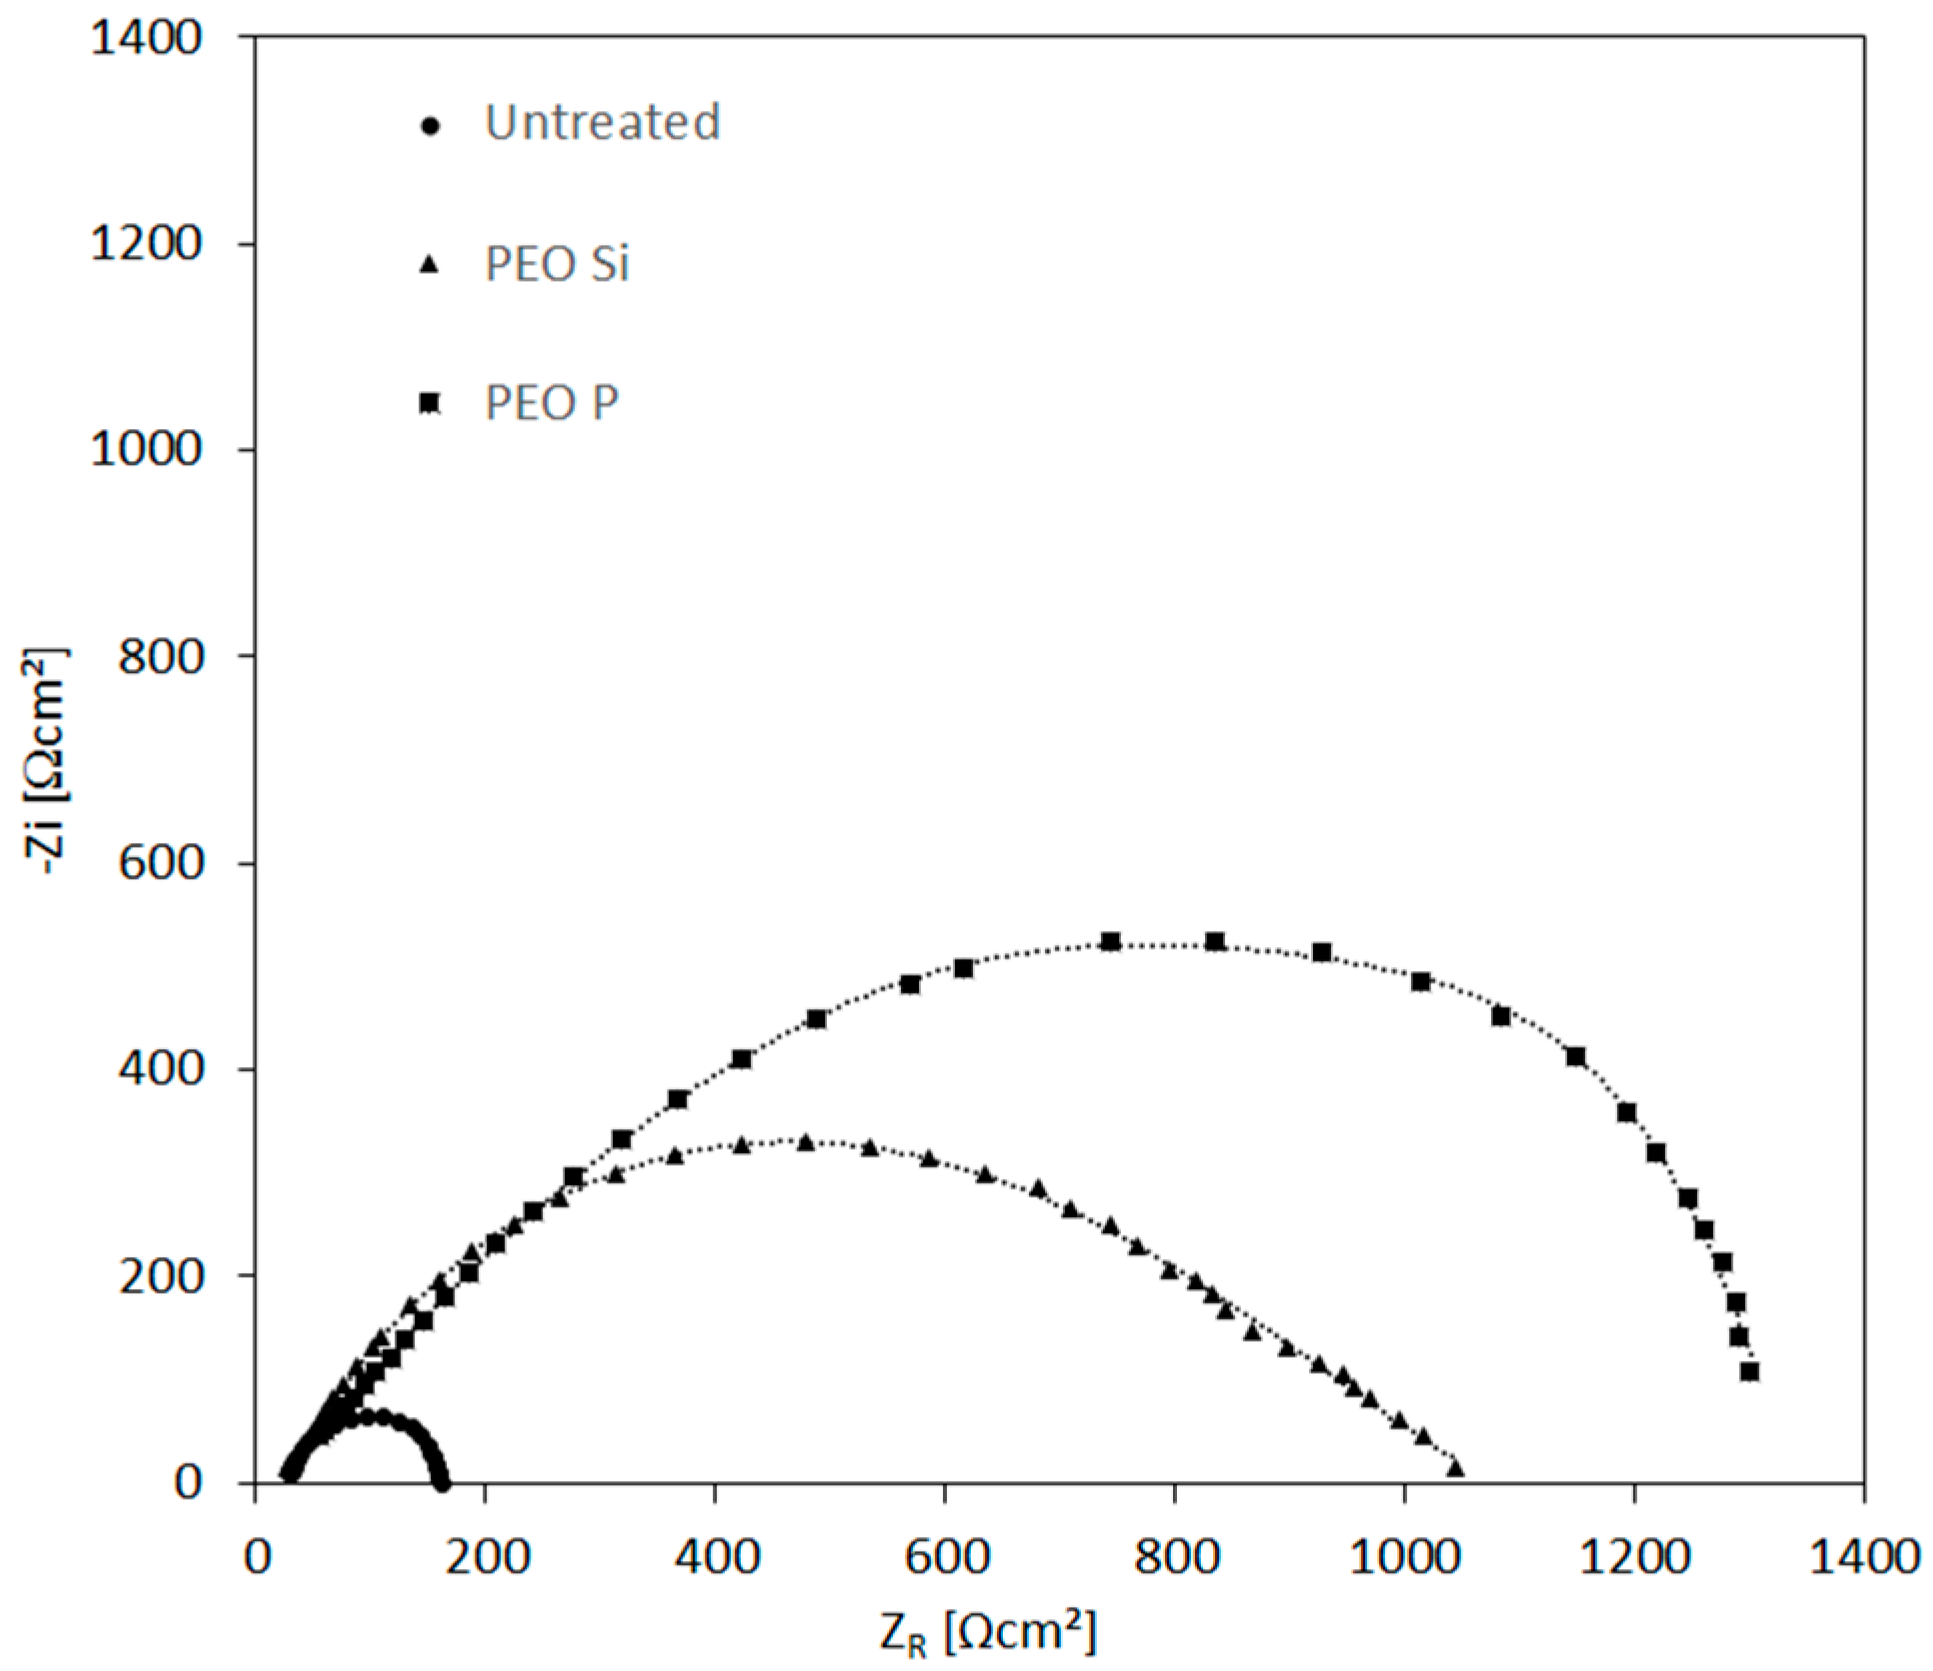
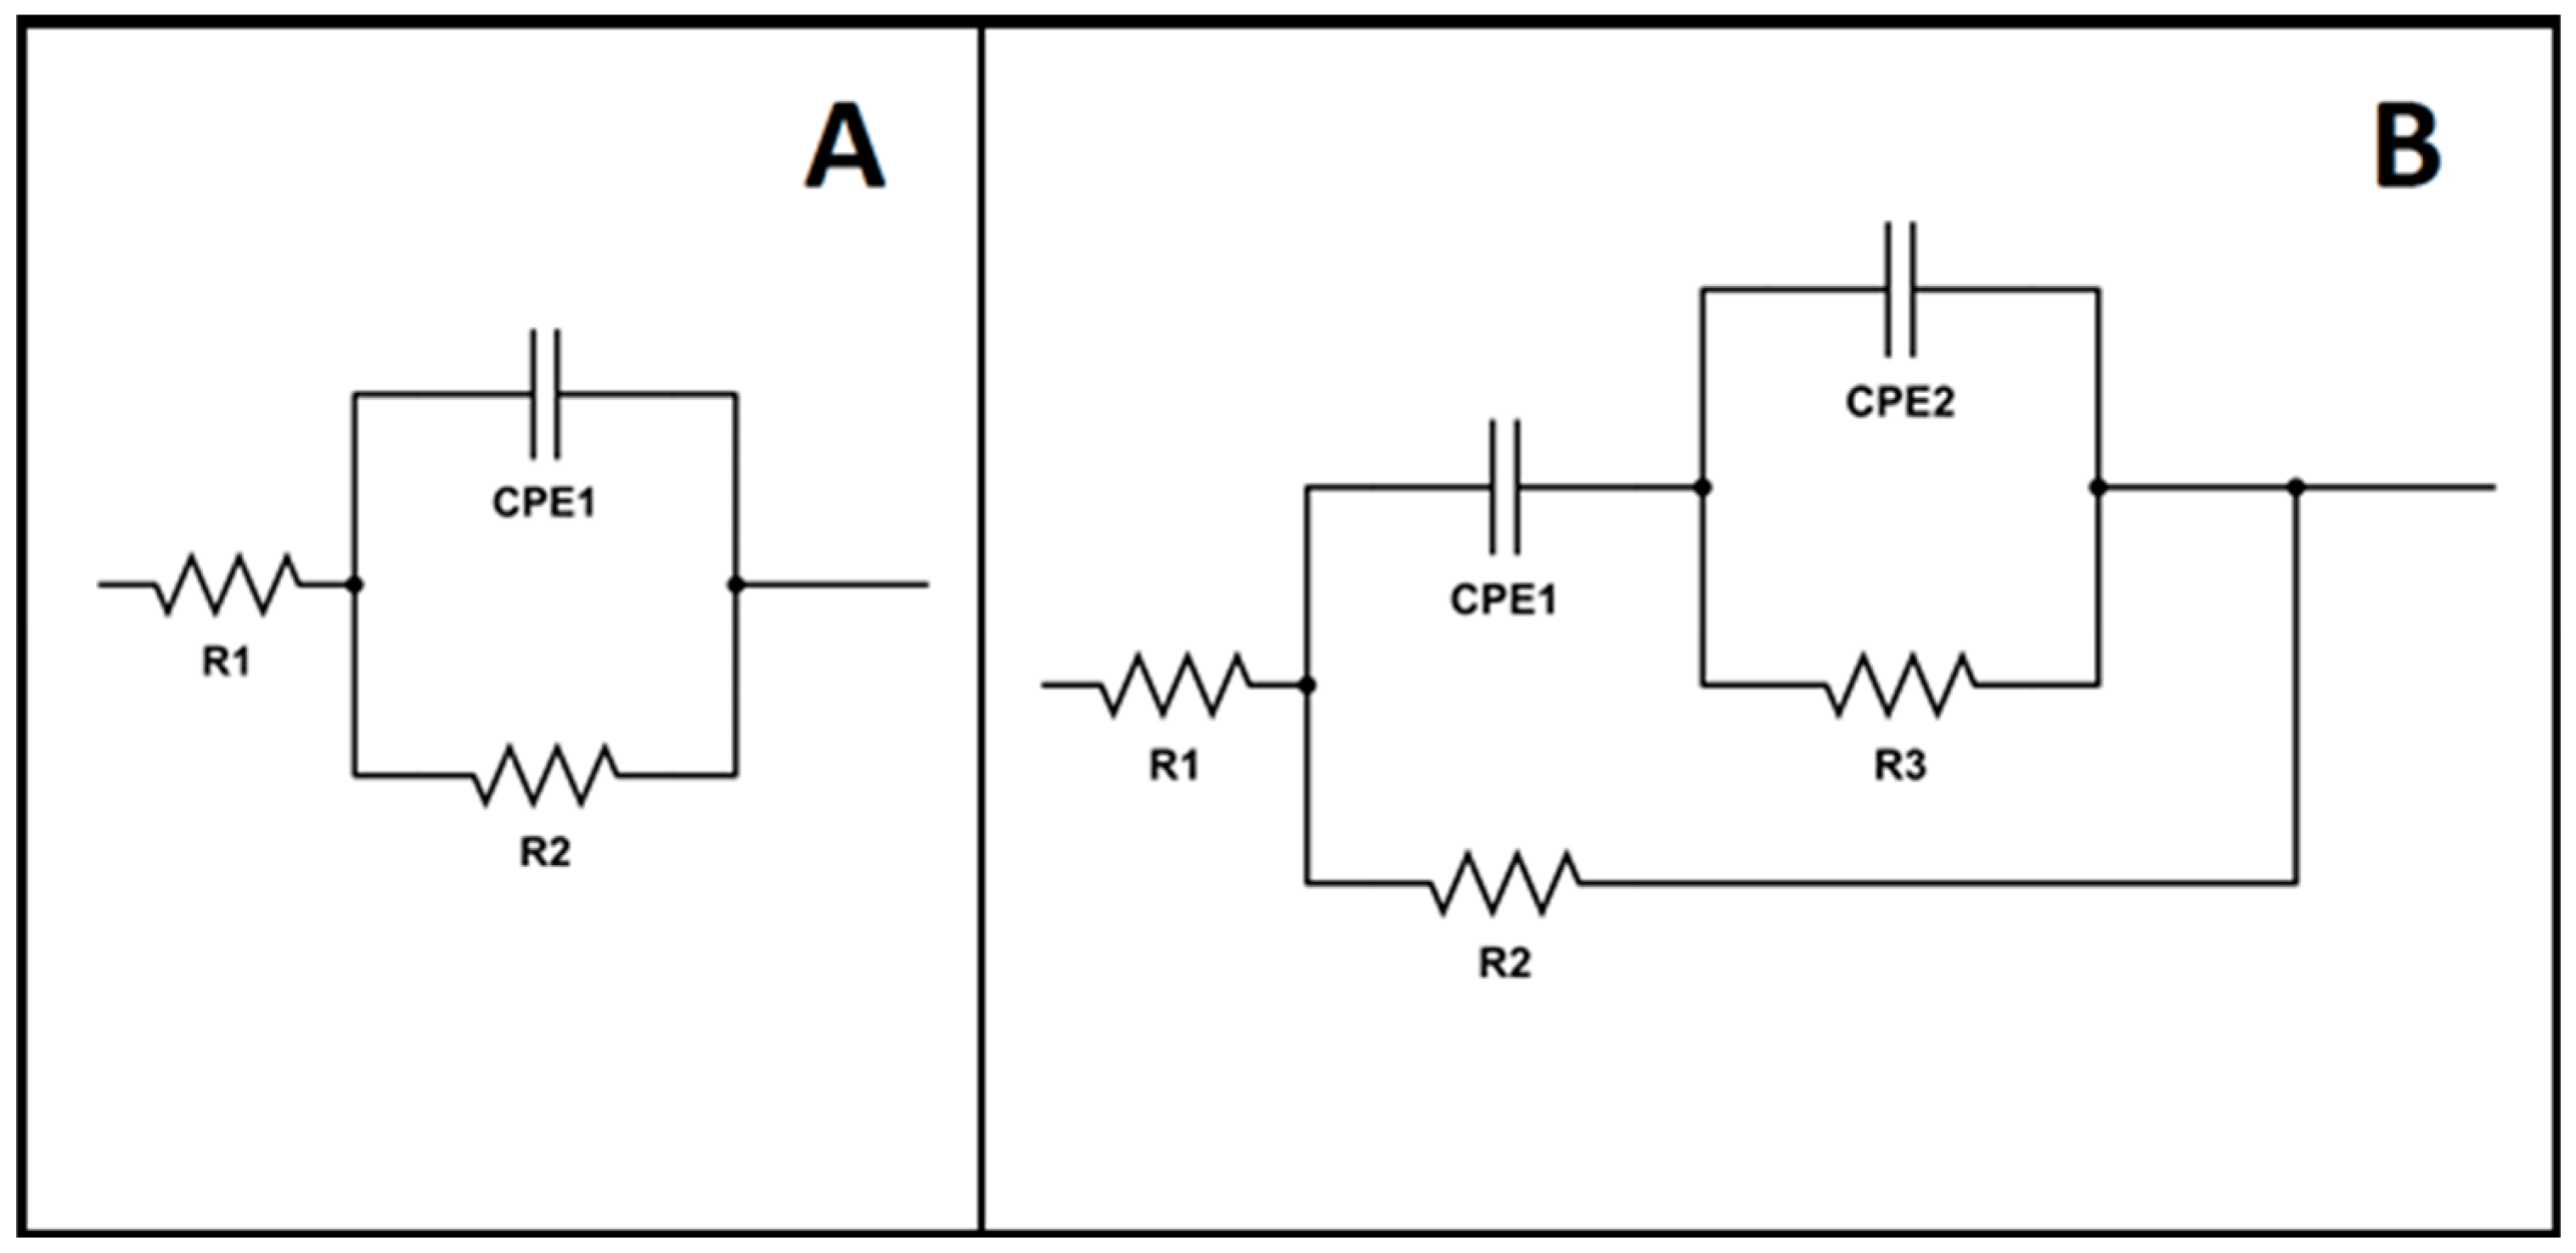
| Parameter | Uncoated | PEO-Si | PEO-P |
|---|---|---|---|
| [Ω cm2] | 29 | 30 | 30.95 |
| [Ω cm2] | 140 | 120 | 150 |
| [Ω cm2] | – | 909 | 1372 |
| [F Hz1−n] | – | ||
| – | 0.74 | 0.73 | |
| [F Hz1−n] | |||
| 0.93 | 0.9 | 0.94 | |
| 0.0005 | 0.0006 | 0.0003 |
| Sample | Micro-Hardness HV0.05 |
|---|---|
| Substrate | 54 |
| PEO-Si | 359 |
| PEO-P | 353 |
| Zone | Mg | Al | Zn | Na | O | Si | P | Cl | S |
|---|---|---|---|---|---|---|---|---|---|
| 1 | 25.8 | 5.6 | 0.9 | 7.2 | 53.9 | – | – | 1.3 | 5.8 |
| 2 | 13.8 | 2.0 | 0.7 | 13.0 | 47.3 | 19.7 | – | 0.3 | 3.3 |
| 3 | 26.7 | 8.8 | 0.4 | 2.2 | 56.8 | – | 0.4 | 0.5 | 4.3 |
| 4 | 26.0 | 2.4 | 0.4 | 7.0 | 44.3 | – | 19.2 | 0.2 | 0.4 |
| 5 | 17.6 | 1.8 | 0.2 | 10.6 | 48.5 | 21.3 | – | – | – |
| 6 | 26.9 | 2.8 | 0.2 | 7.4 | 48.3 | – | 14.4 | – | – |
© 2018 by the authors. Licensee MDPI, Basel, Switzerland. This article is an open access article distributed under the terms and conditions of the Creative Commons Attribution (CC BY) license (http://creativecommons.org/licenses/by/4.0/).
Share and Cite
Pezzato, L.; Vranescu, D.; Sinico, M.; Gennari, C.; Settimi, A.G.; Pranovi, P.; Brunelli, K.; Dabalà, M. Tribocorrosion Properties of PEO Coatings Produced on AZ91 Magnesium Alloy with Silicate- or Phosphate-Based Electrolytes. Coatings 2018, 8, 202. https://doi.org/10.3390/coatings8060202
Pezzato L, Vranescu D, Sinico M, Gennari C, Settimi AG, Pranovi P, Brunelli K, Dabalà M. Tribocorrosion Properties of PEO Coatings Produced on AZ91 Magnesium Alloy with Silicate- or Phosphate-Based Electrolytes. Coatings. 2018; 8(6):202. https://doi.org/10.3390/coatings8060202
Chicago/Turabian StylePezzato, Luca, Dragos Vranescu, Marco Sinico, Claudio Gennari, Alessio Giorgio Settimi, Pietro Pranovi, Katya Brunelli, and Manuele Dabalà. 2018. "Tribocorrosion Properties of PEO Coatings Produced on AZ91 Magnesium Alloy with Silicate- or Phosphate-Based Electrolytes" Coatings 8, no. 6: 202. https://doi.org/10.3390/coatings8060202
APA StylePezzato, L., Vranescu, D., Sinico, M., Gennari, C., Settimi, A. G., Pranovi, P., Brunelli, K., & Dabalà, M. (2018). Tribocorrosion Properties of PEO Coatings Produced on AZ91 Magnesium Alloy with Silicate- or Phosphate-Based Electrolytes. Coatings, 8(6), 202. https://doi.org/10.3390/coatings8060202