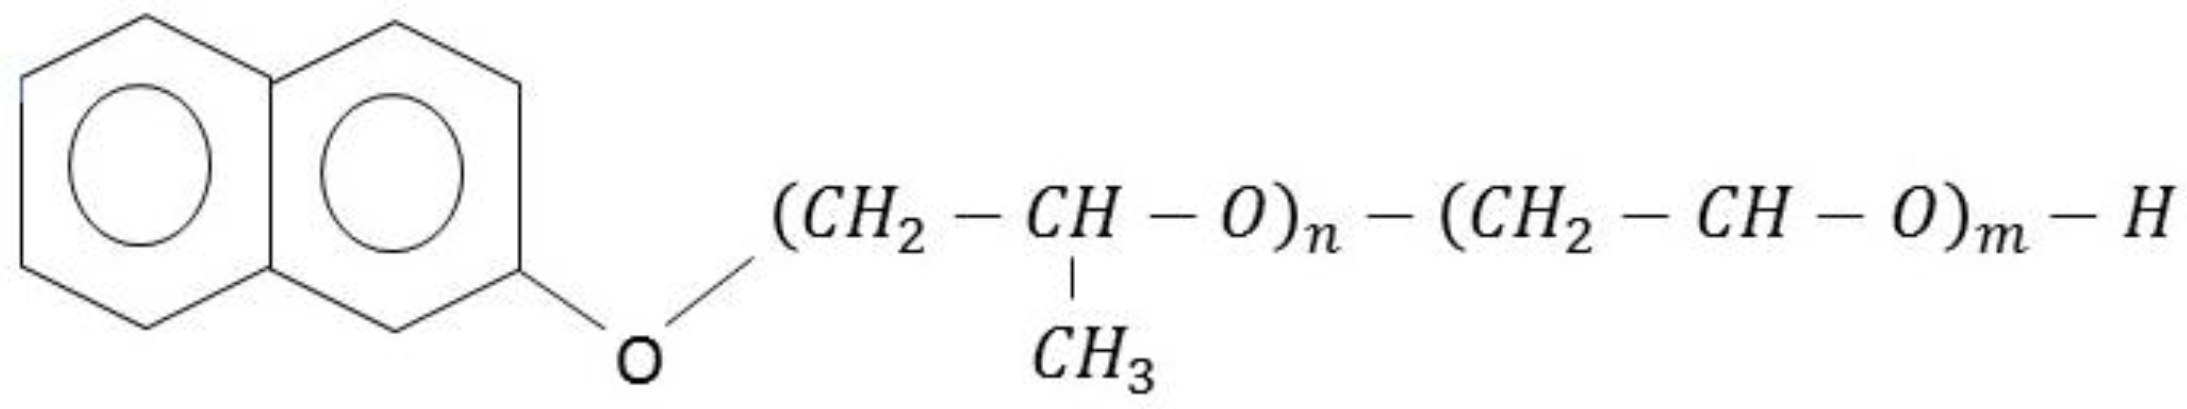
Alkoxylated β-Naphthol as an Additive for Tin Plating from Chloride and Methane Sulfonic Acid Electrolytes

 ,
, 
Abstract
:1. Introduction
2. Materials and Methods
2.1. Electrochemical Characterization
2.2. Sn Electrodeposition
2.3. Structural Characterization
3. Results
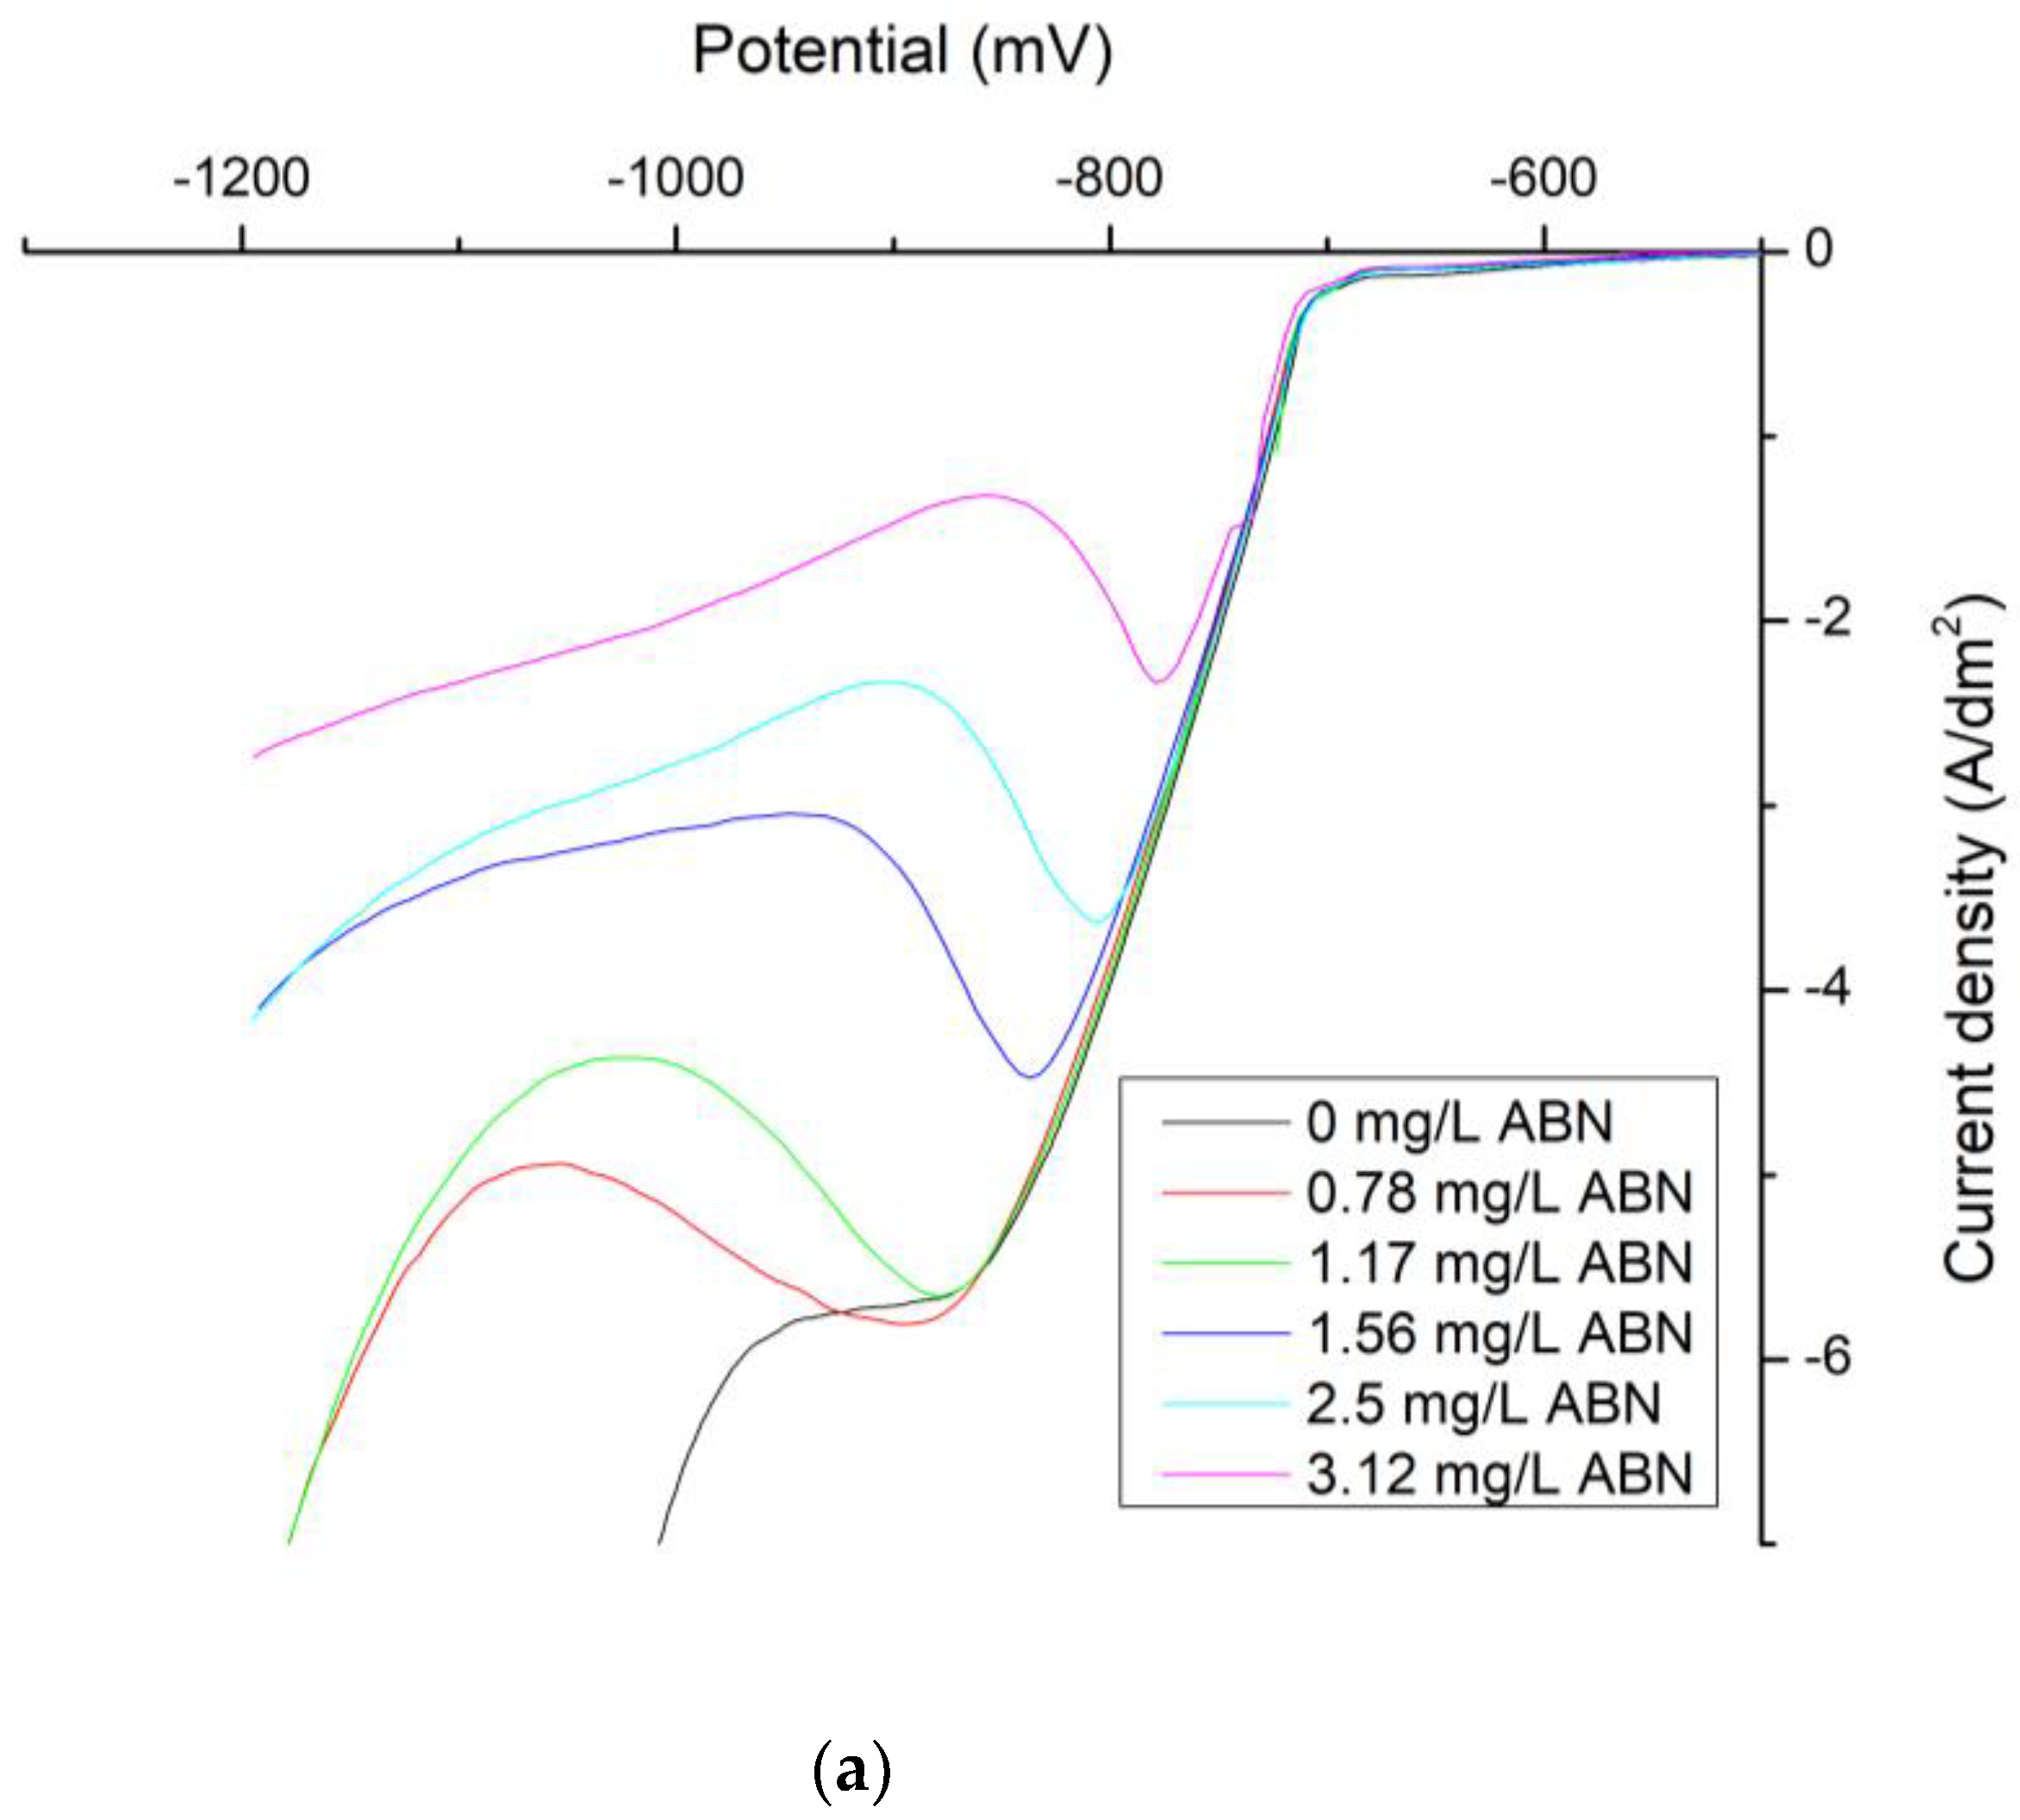
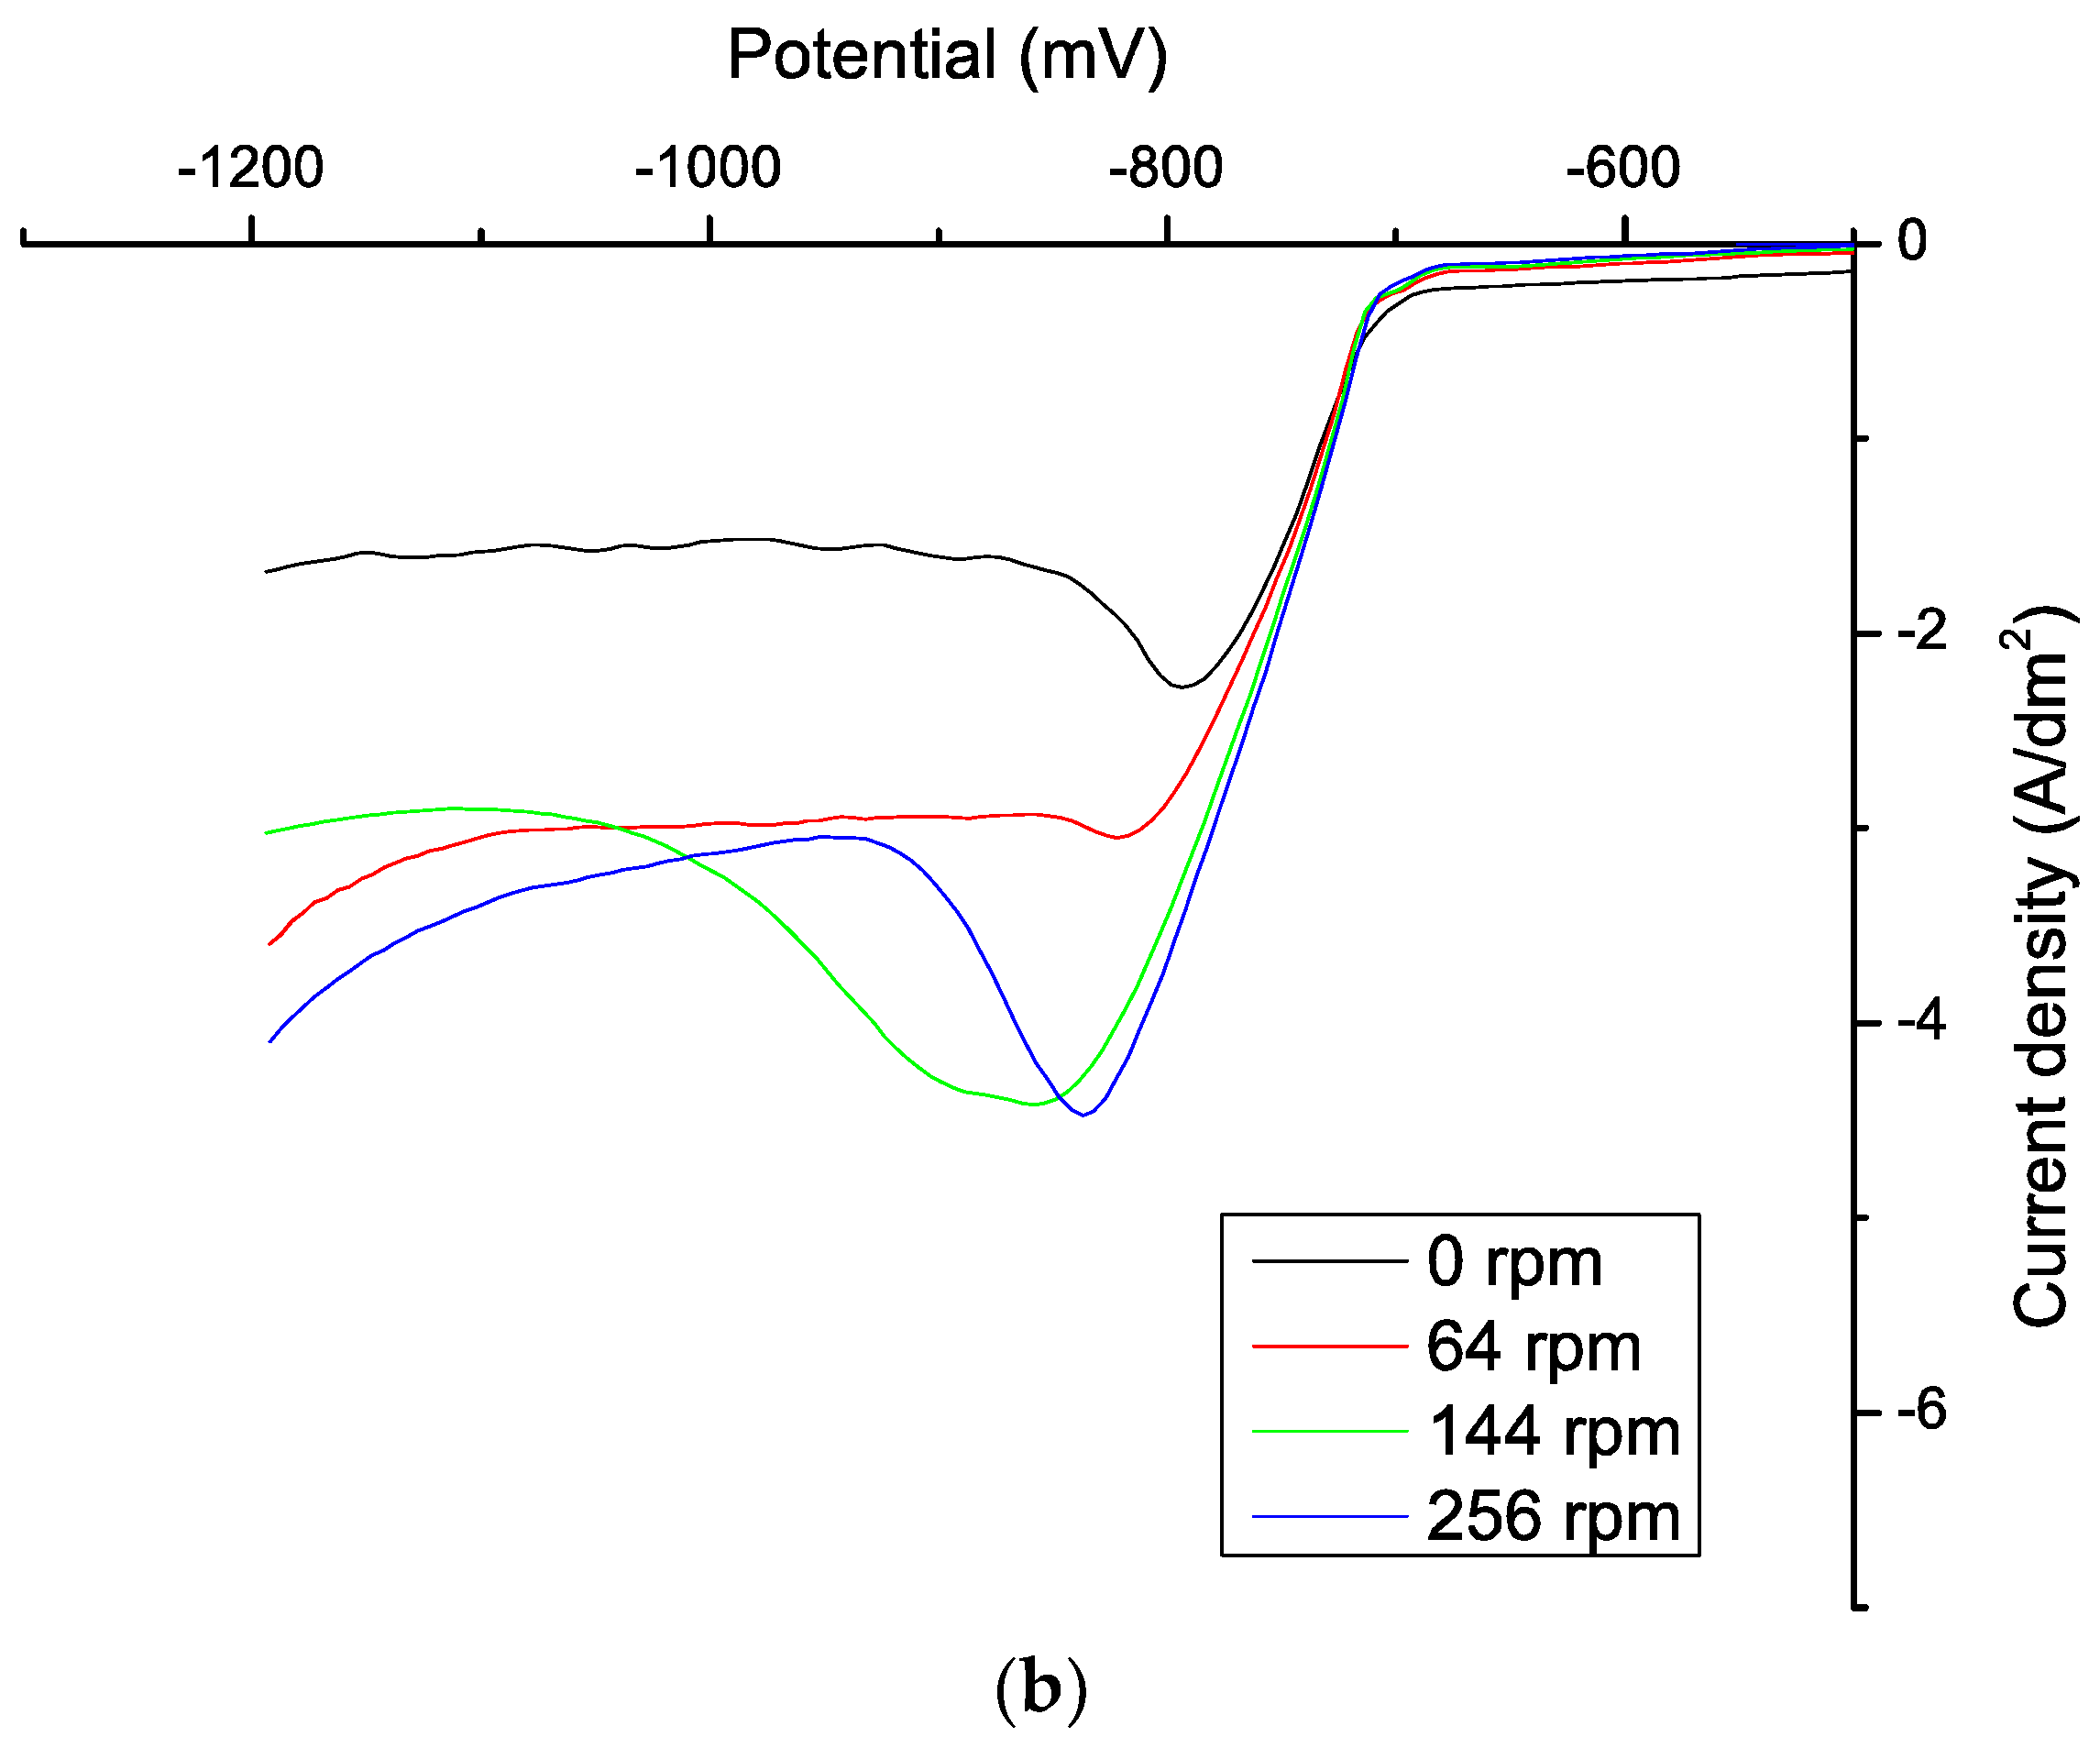
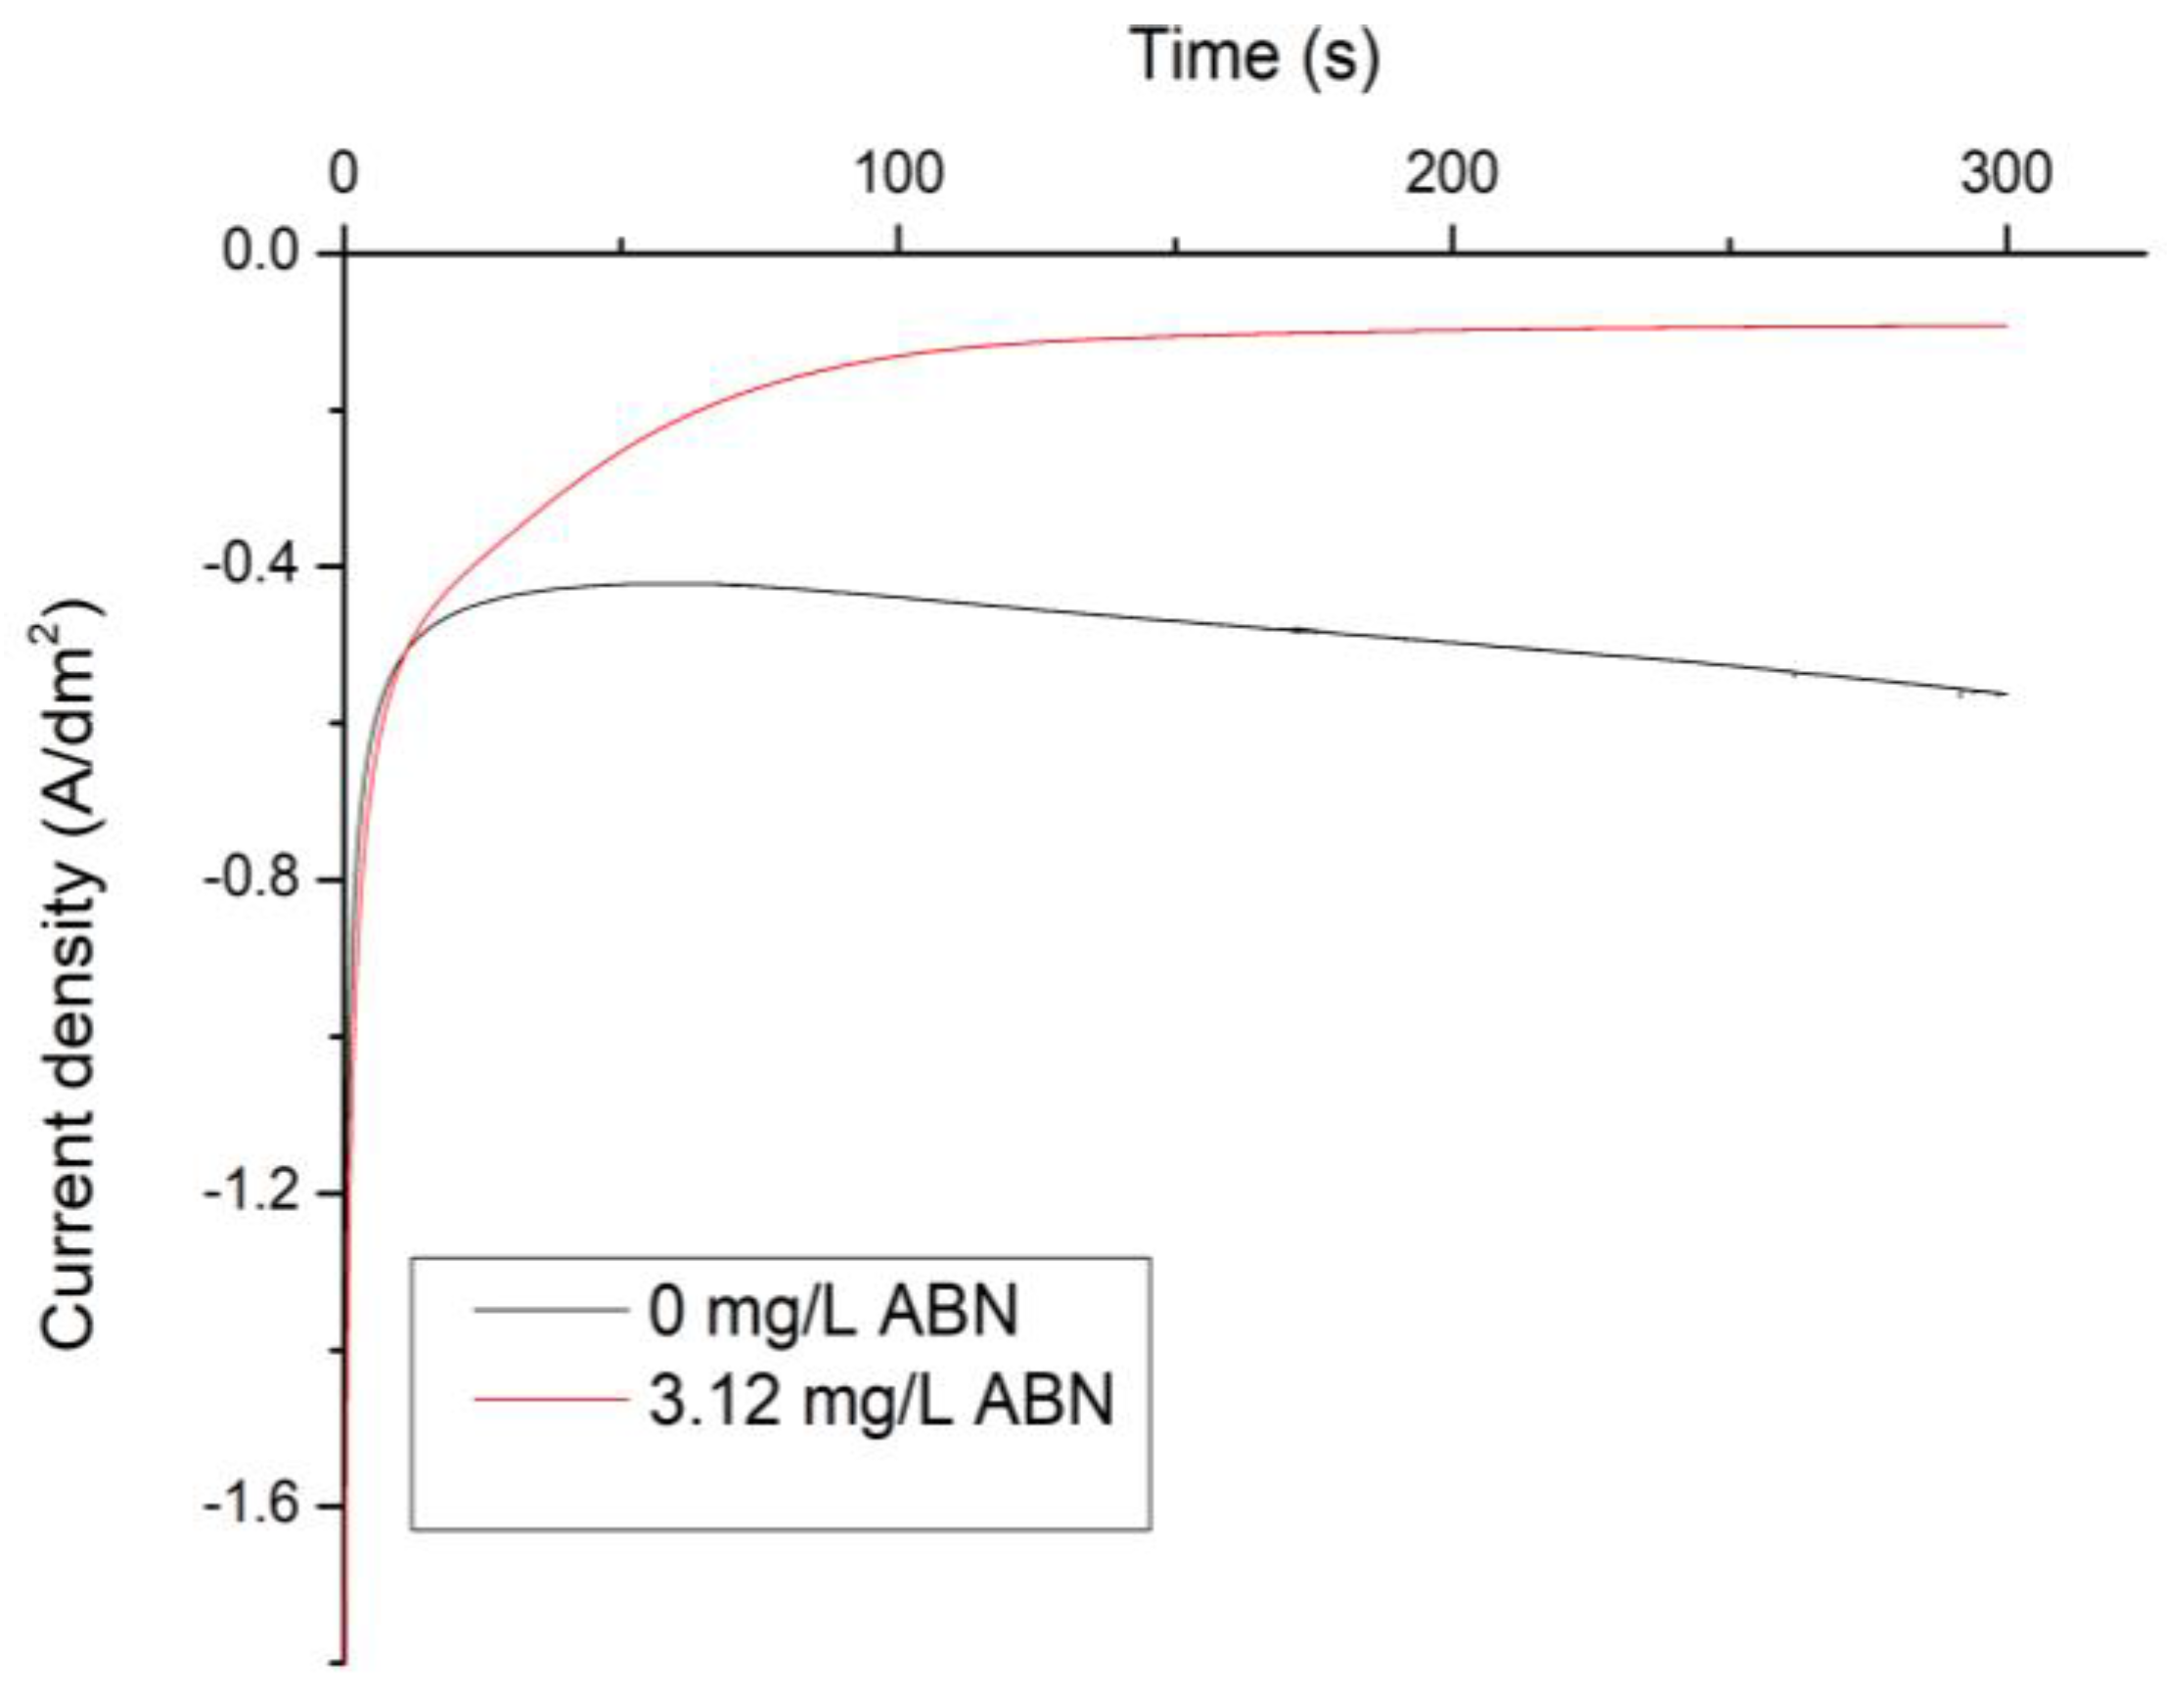
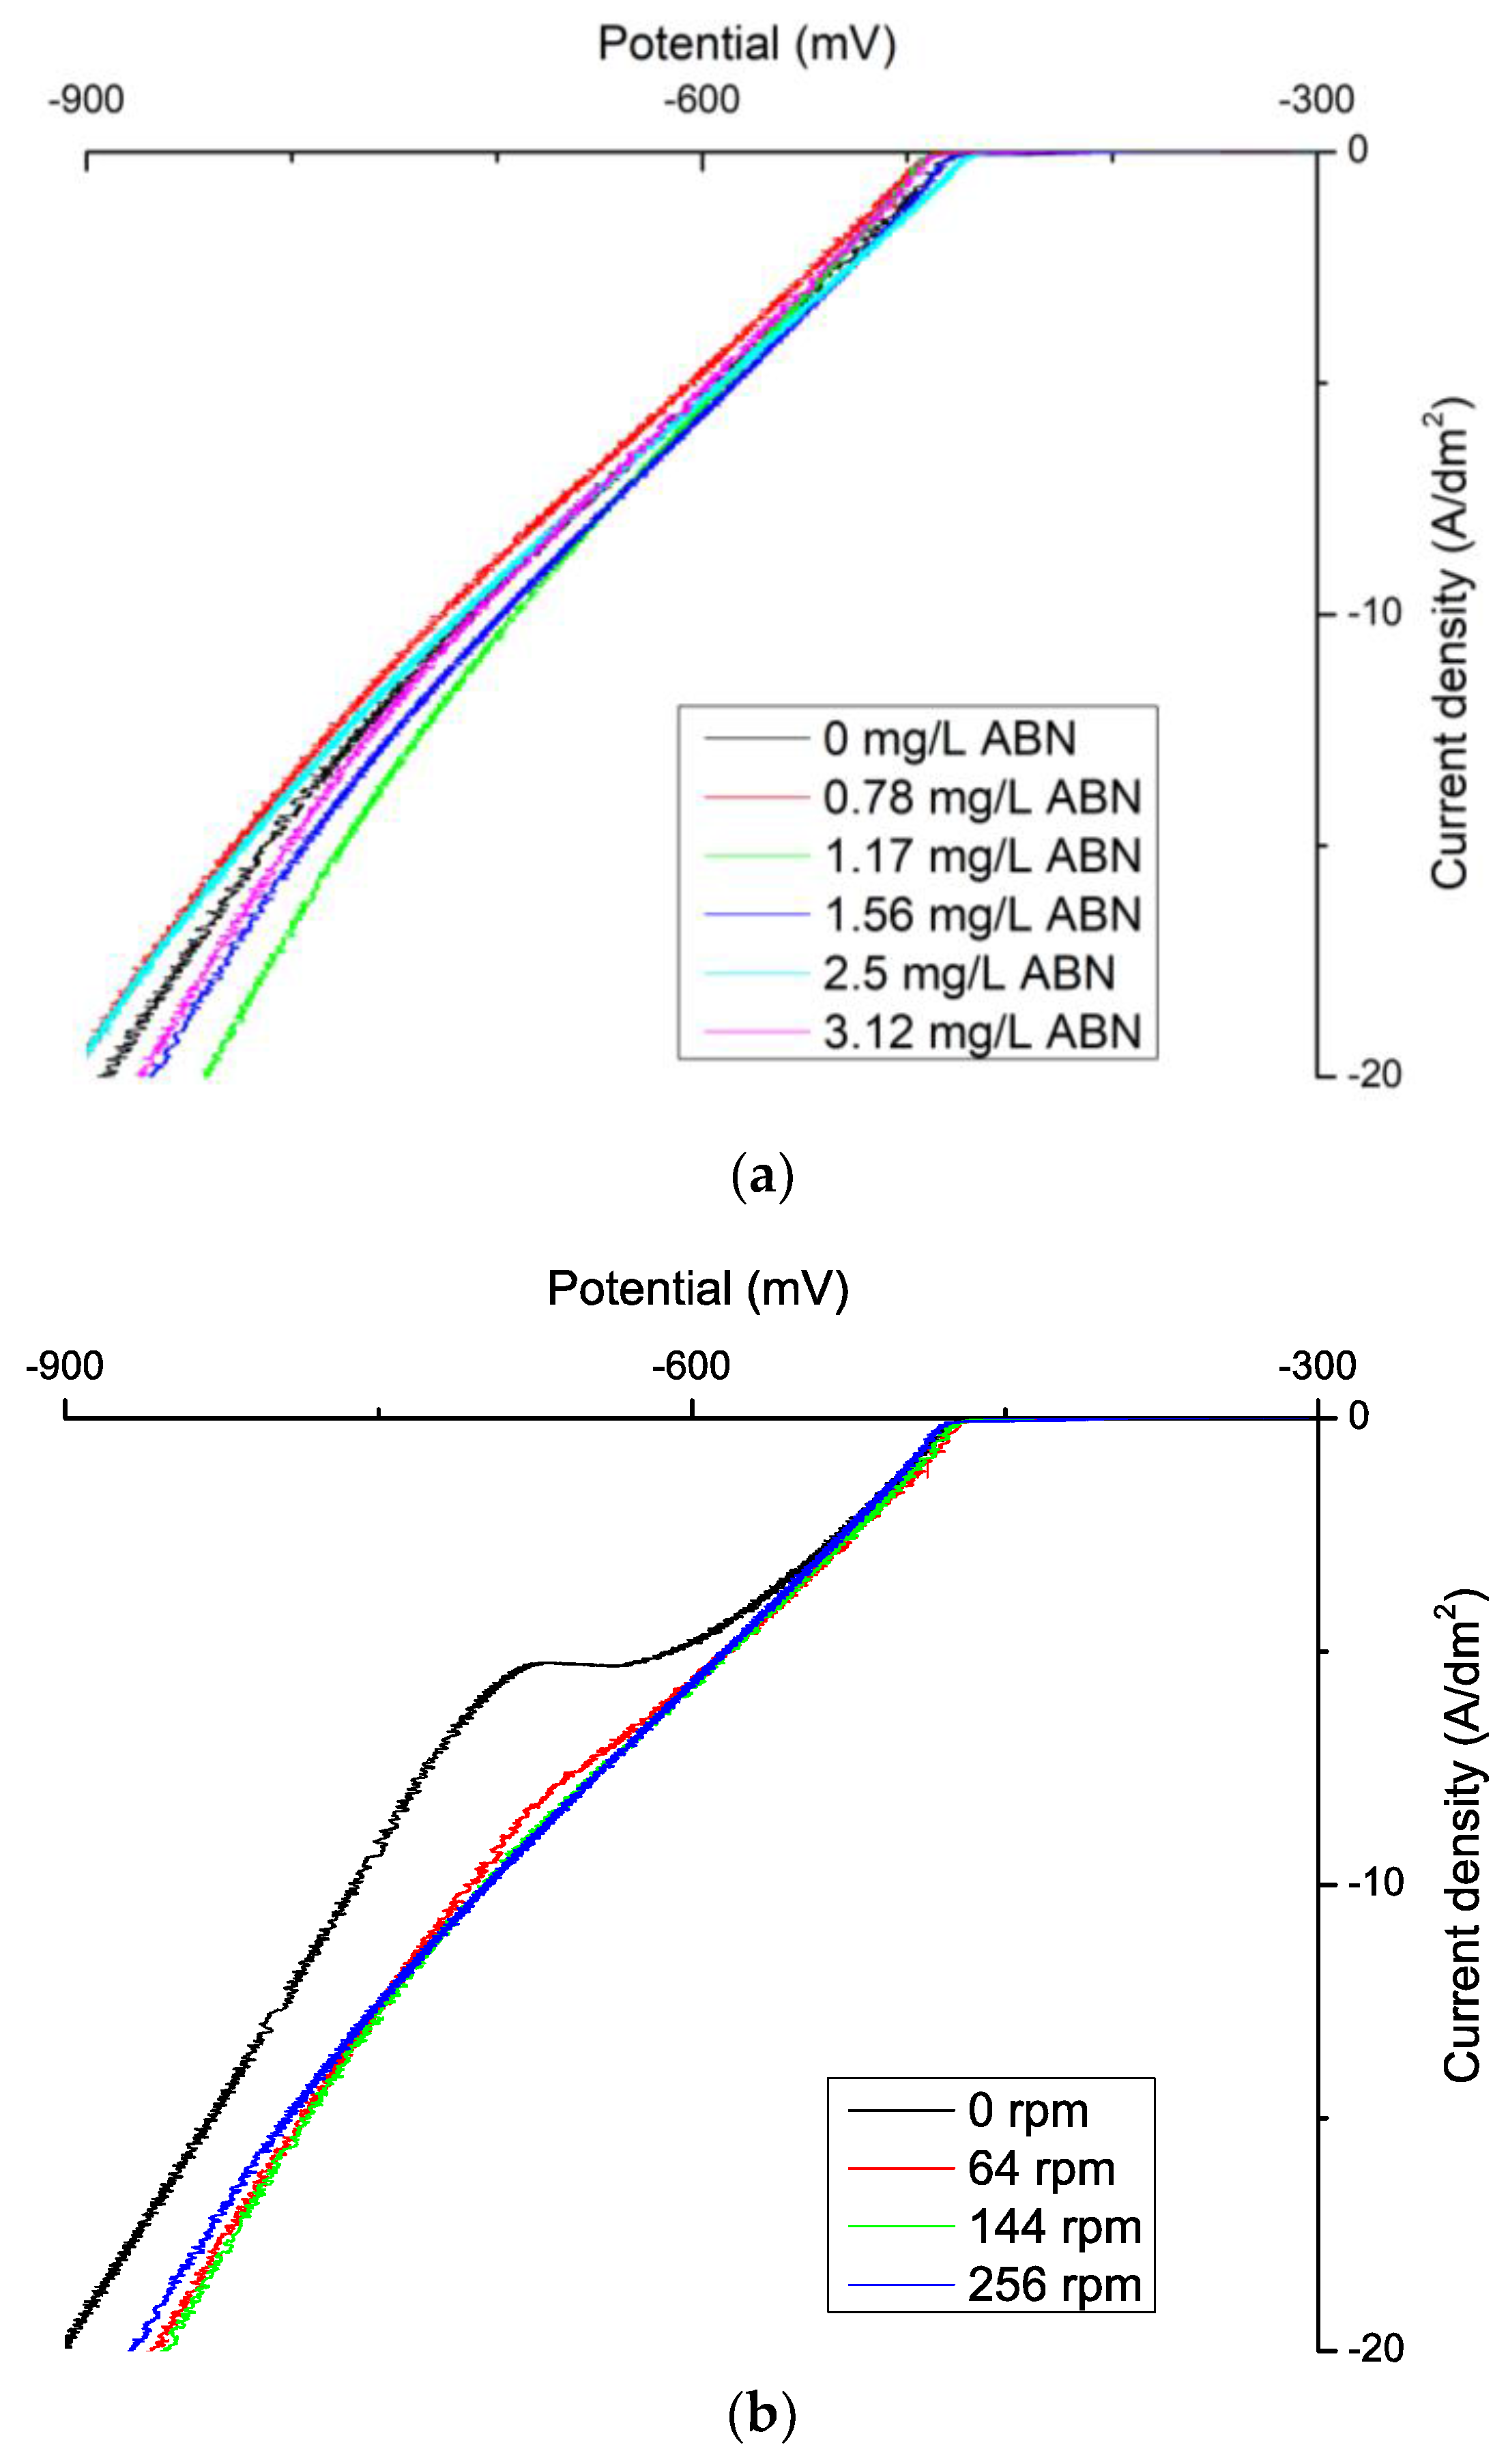
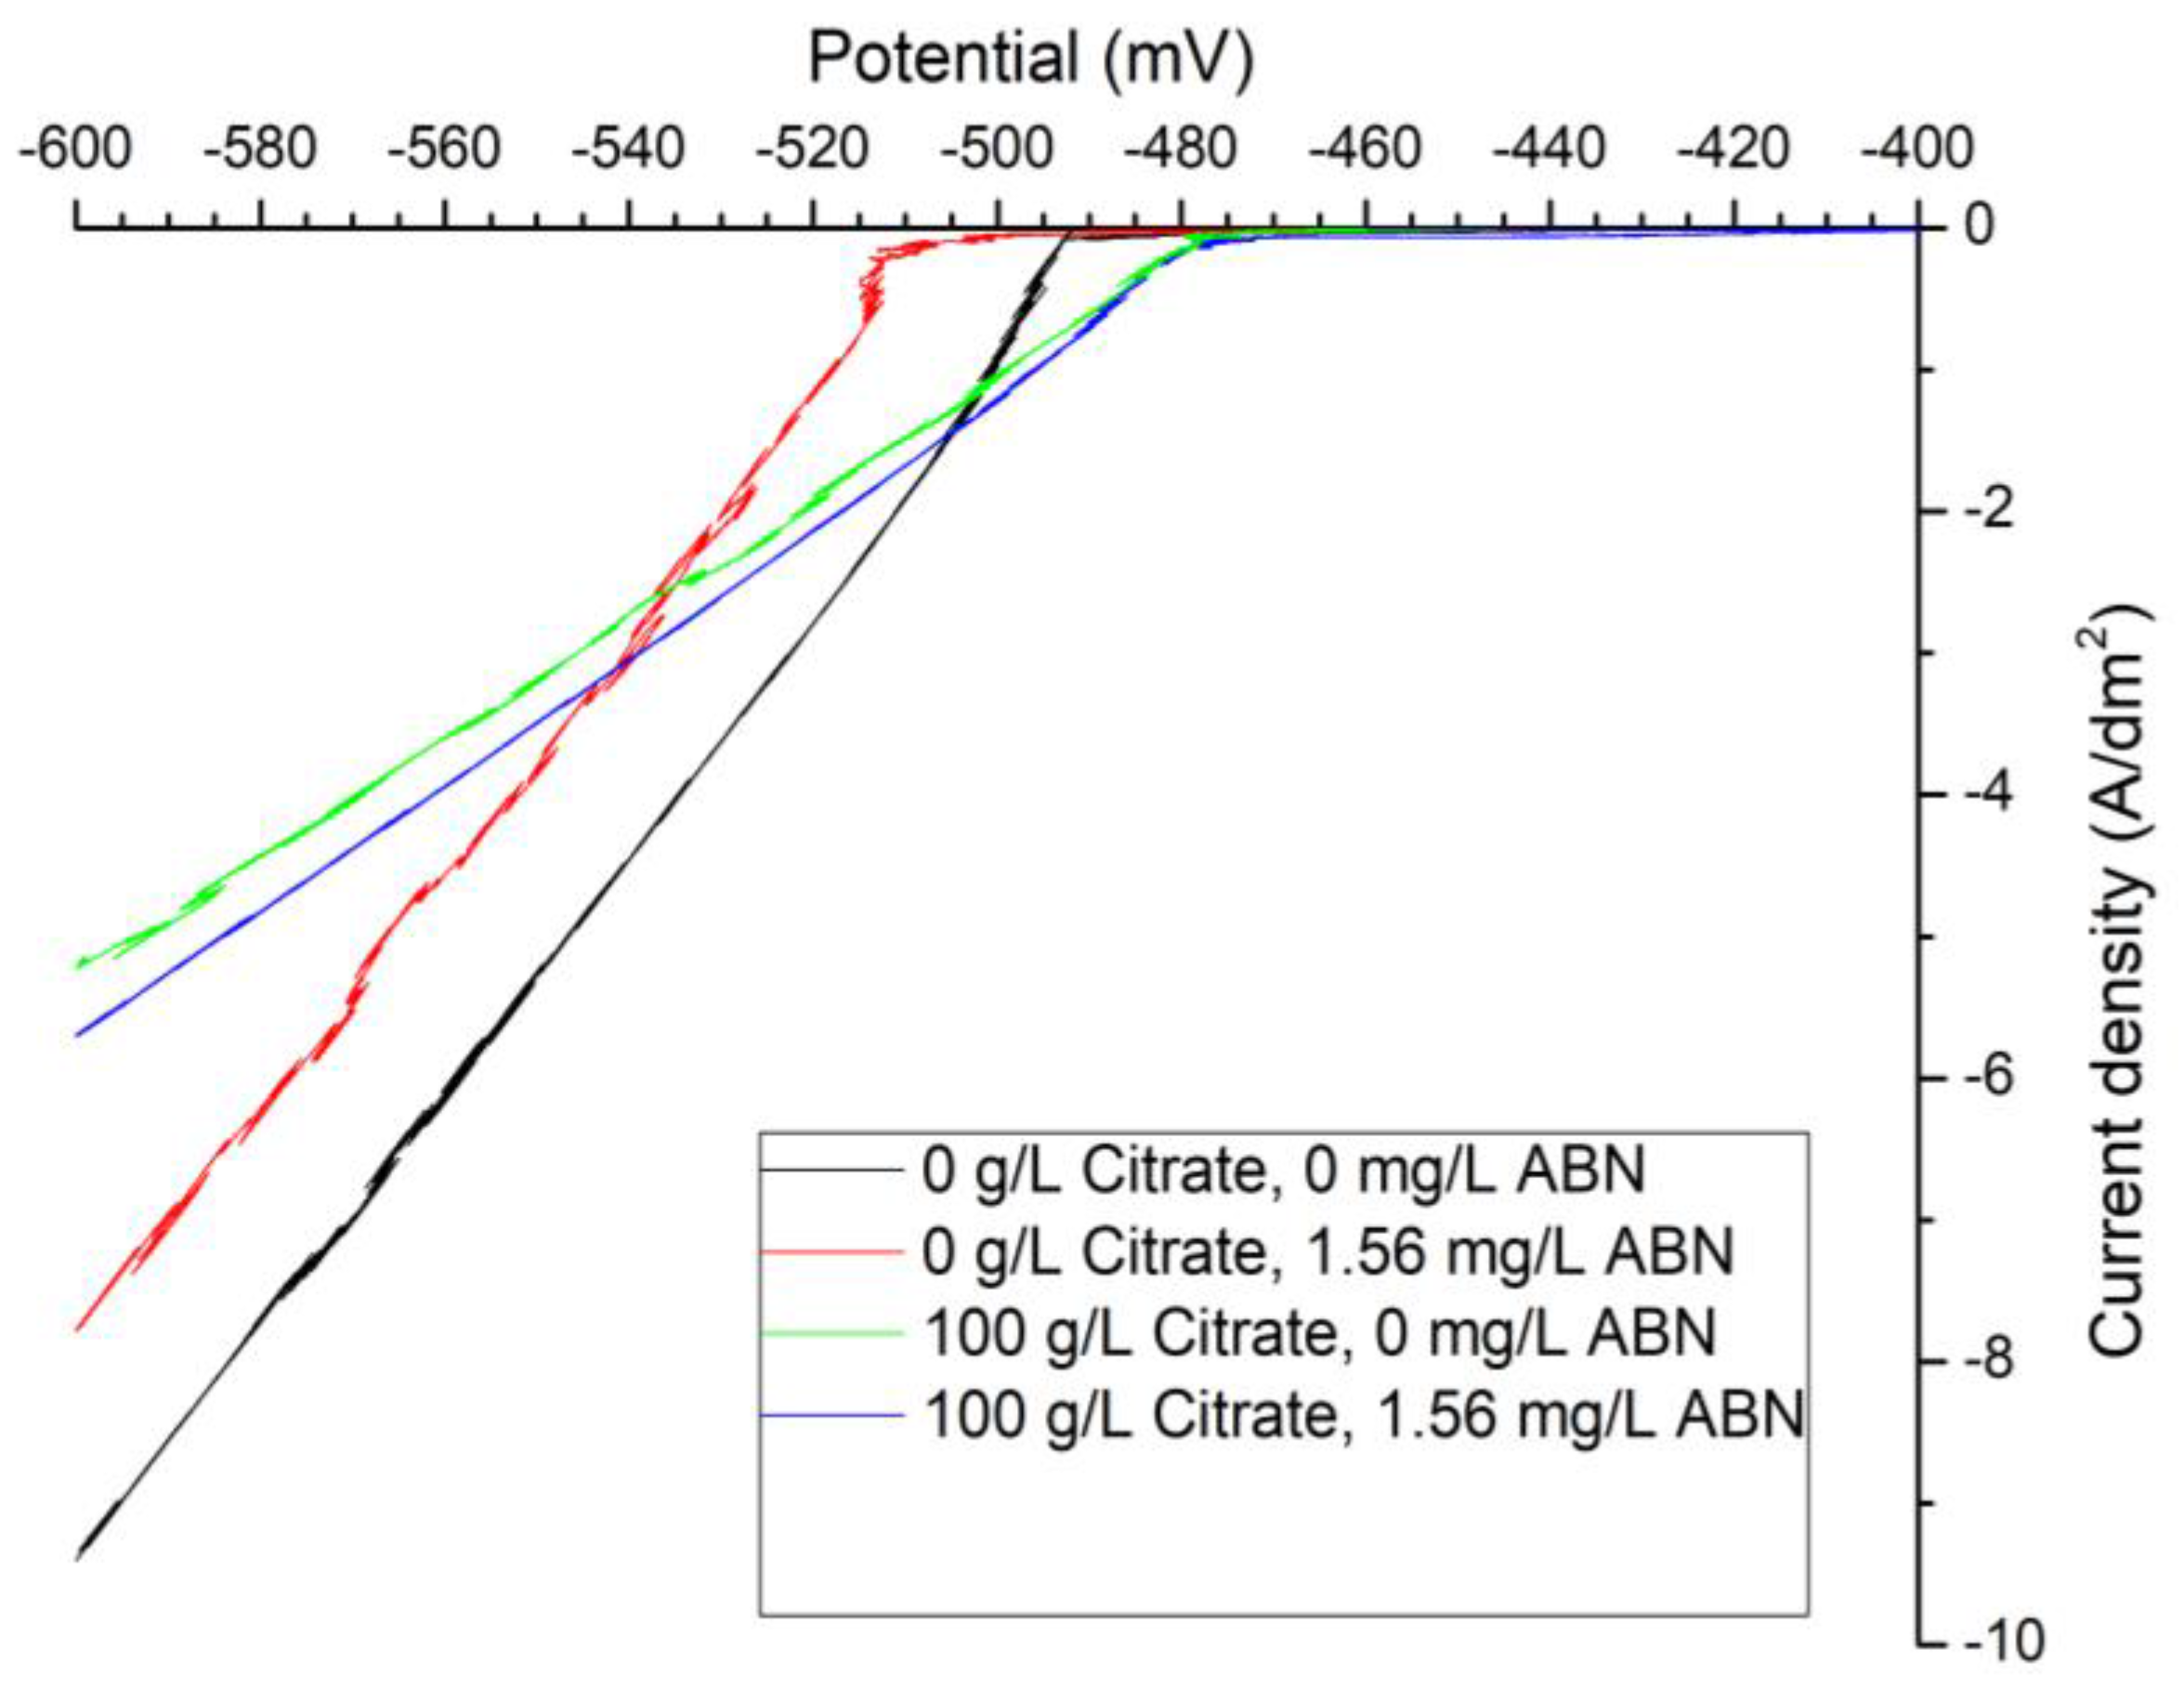
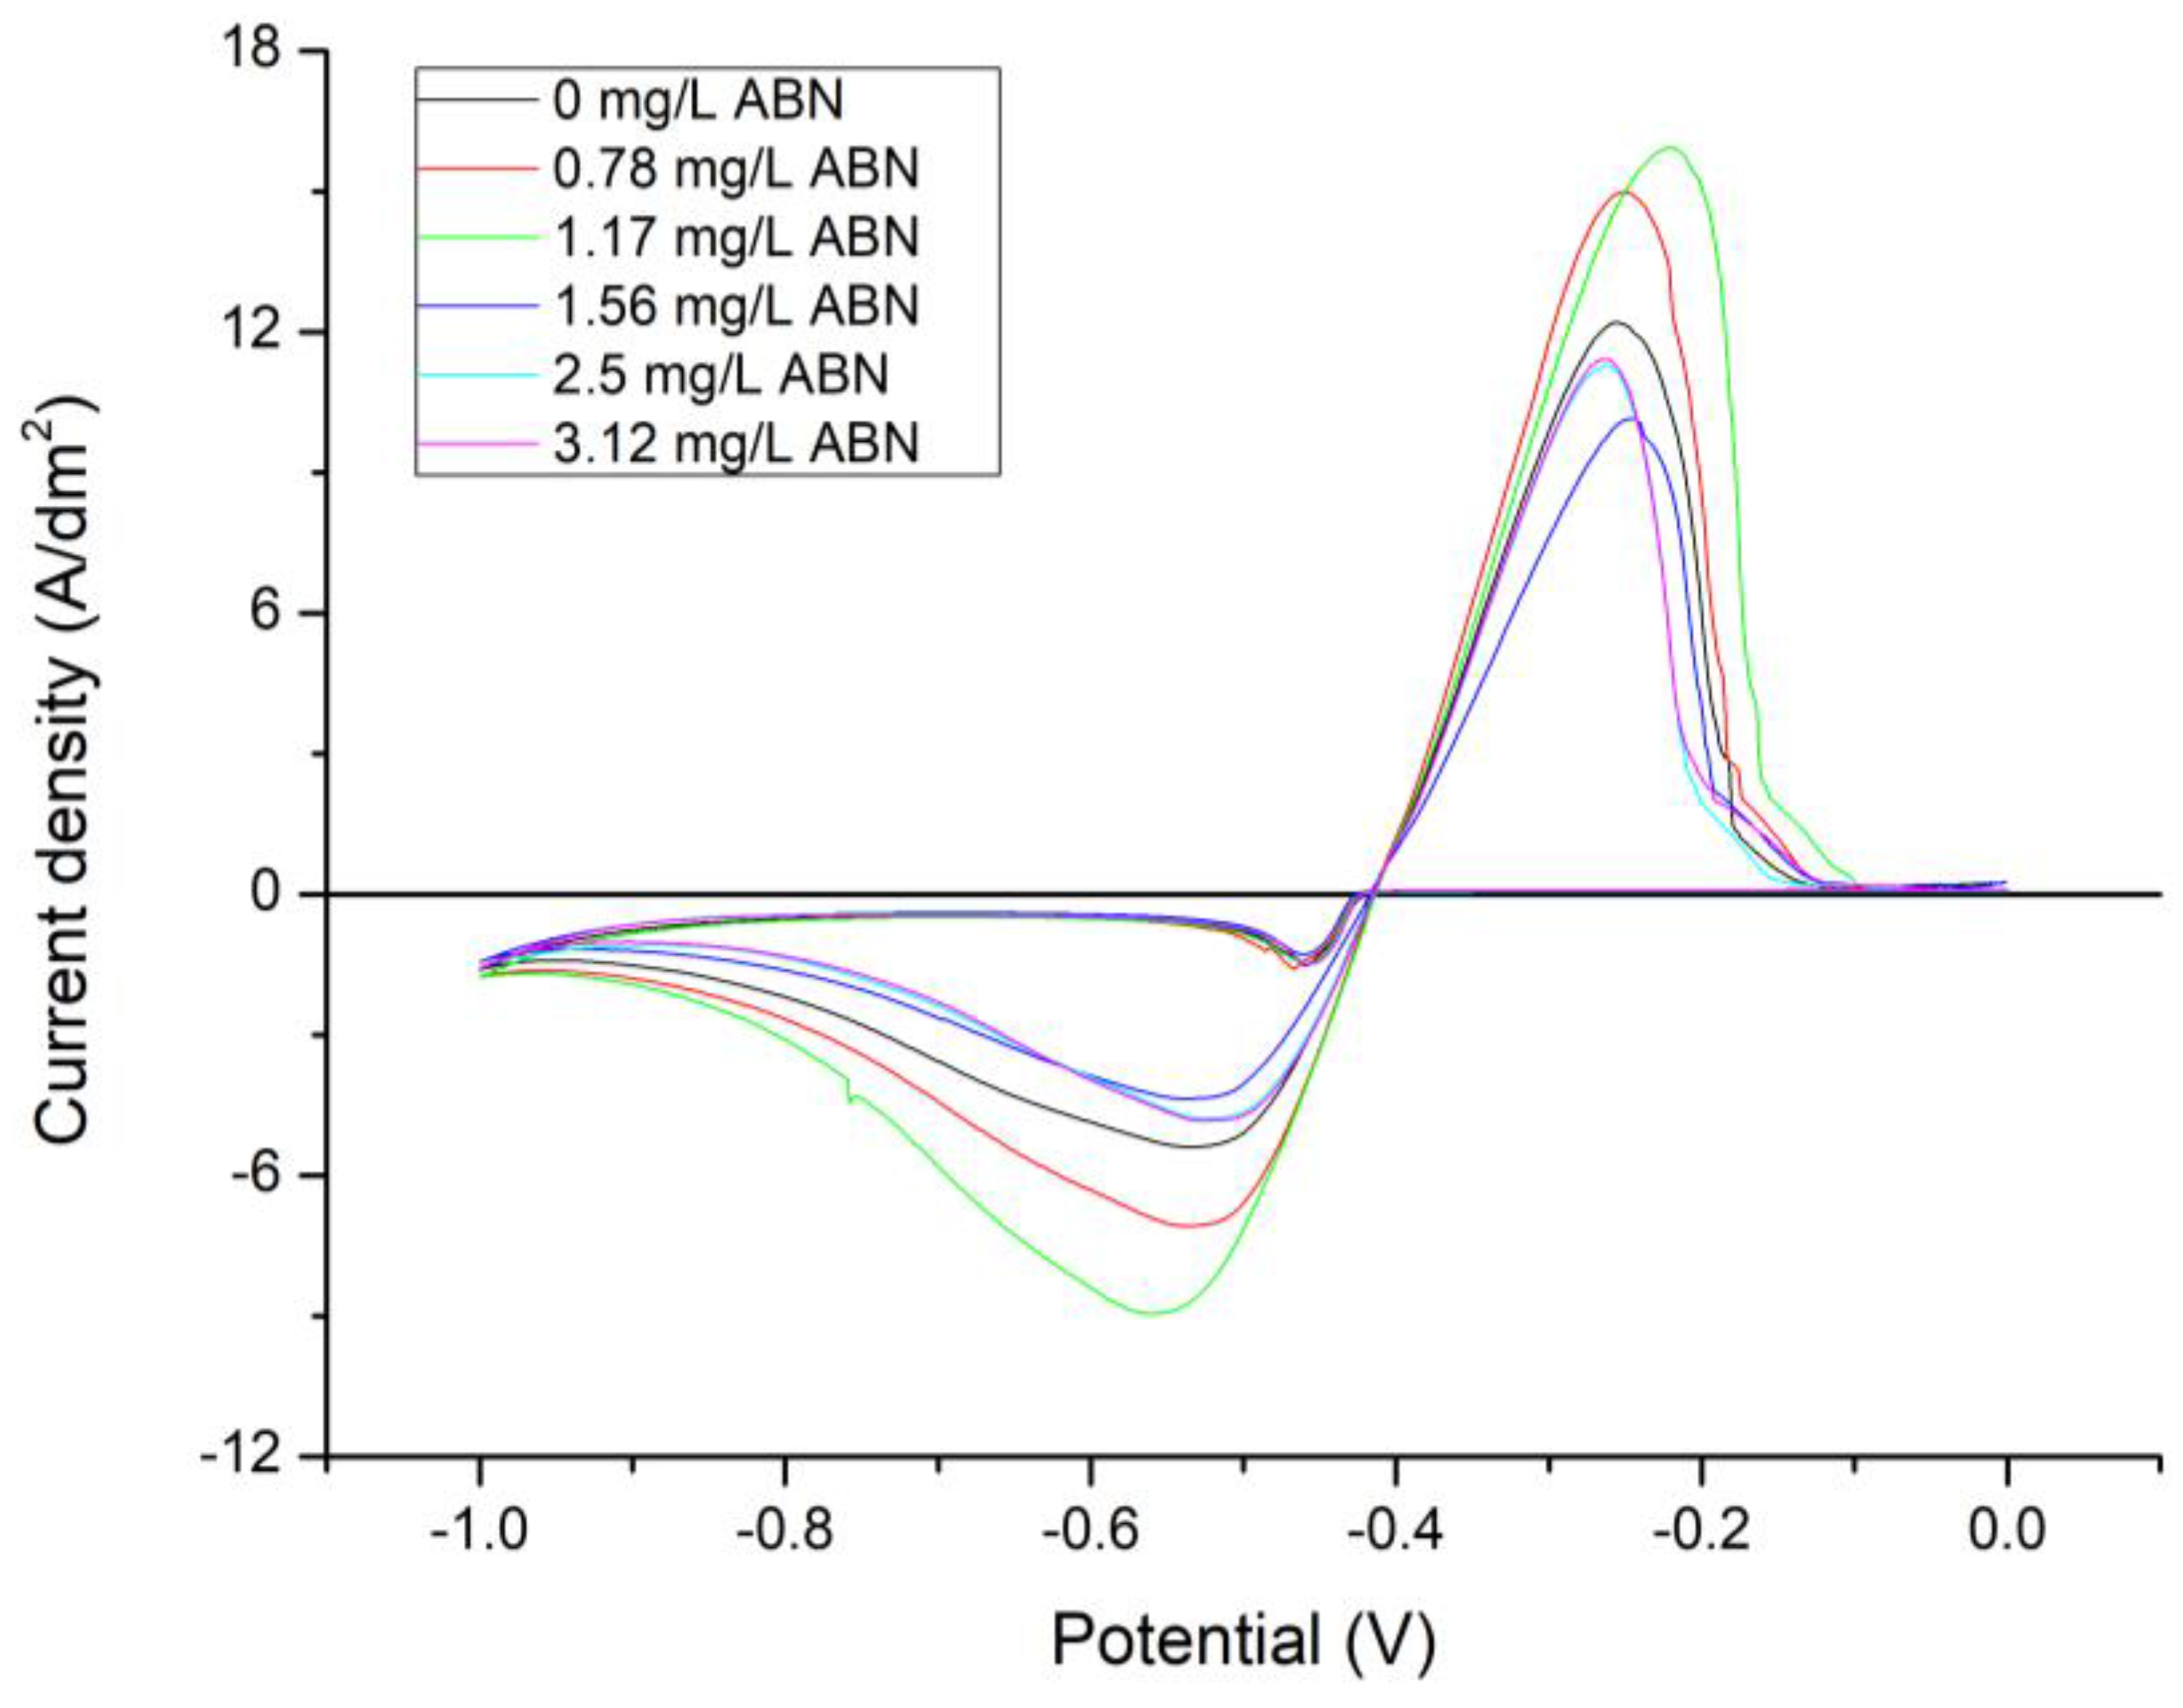
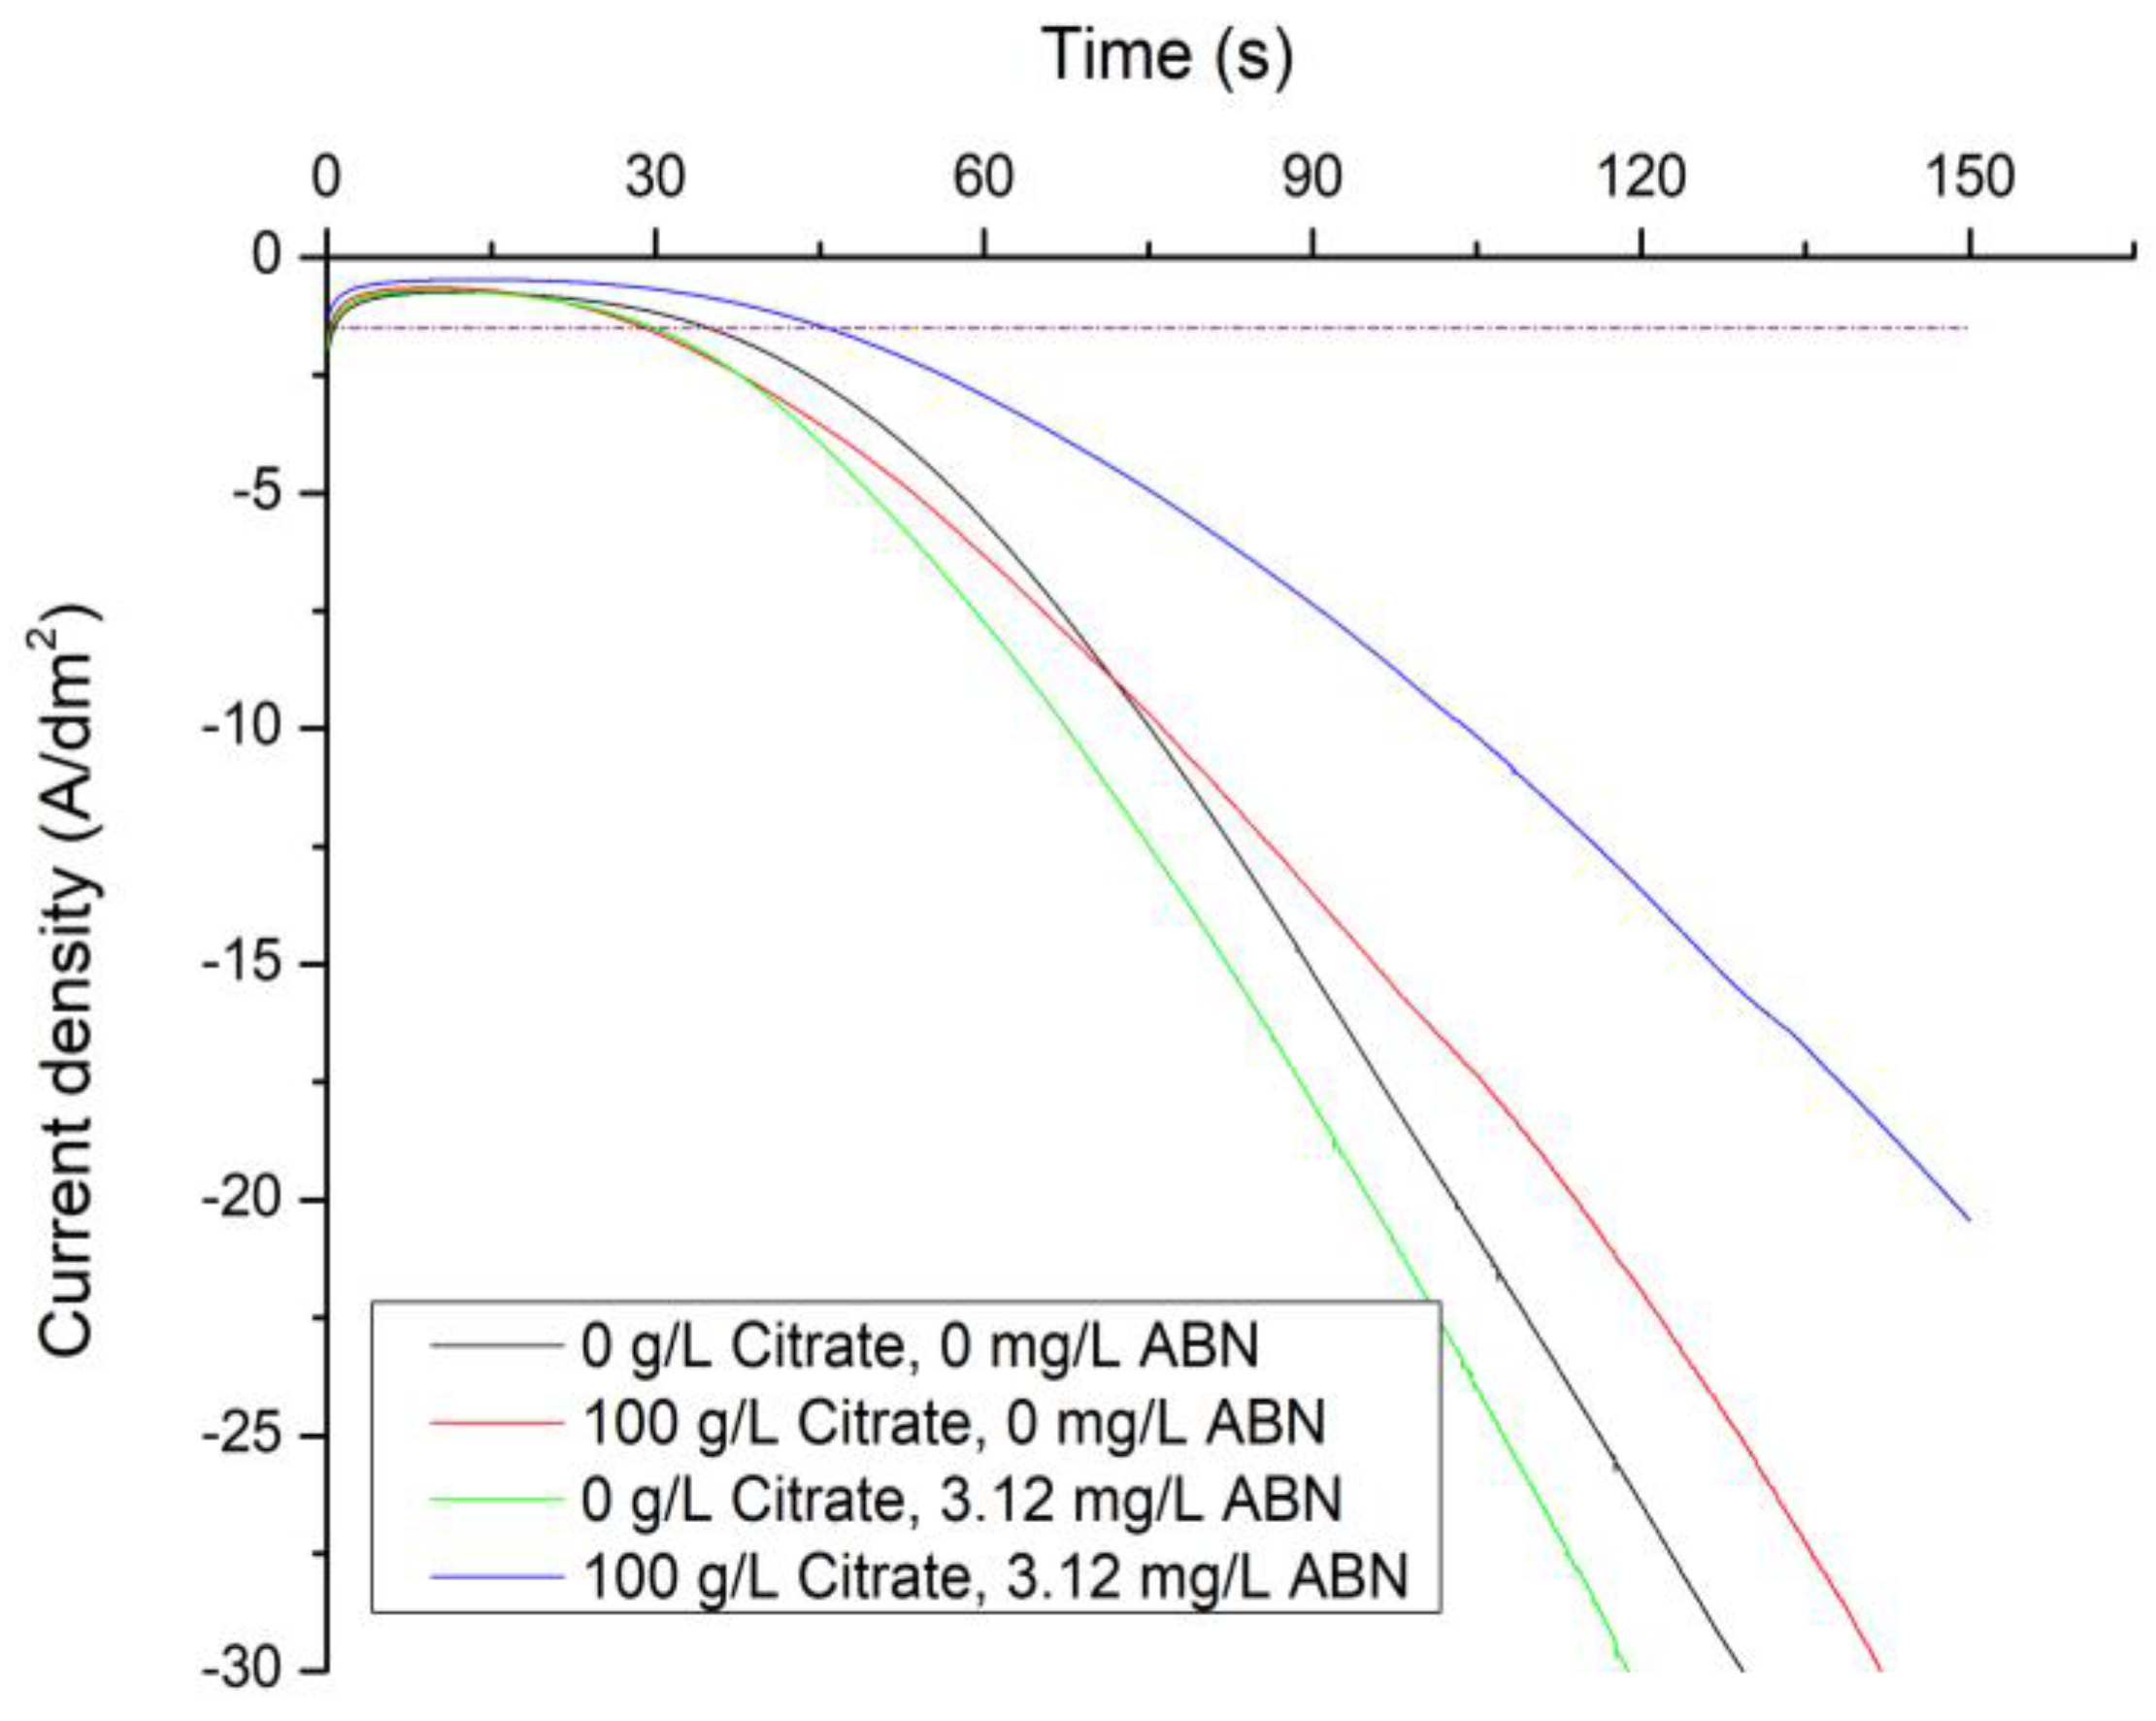
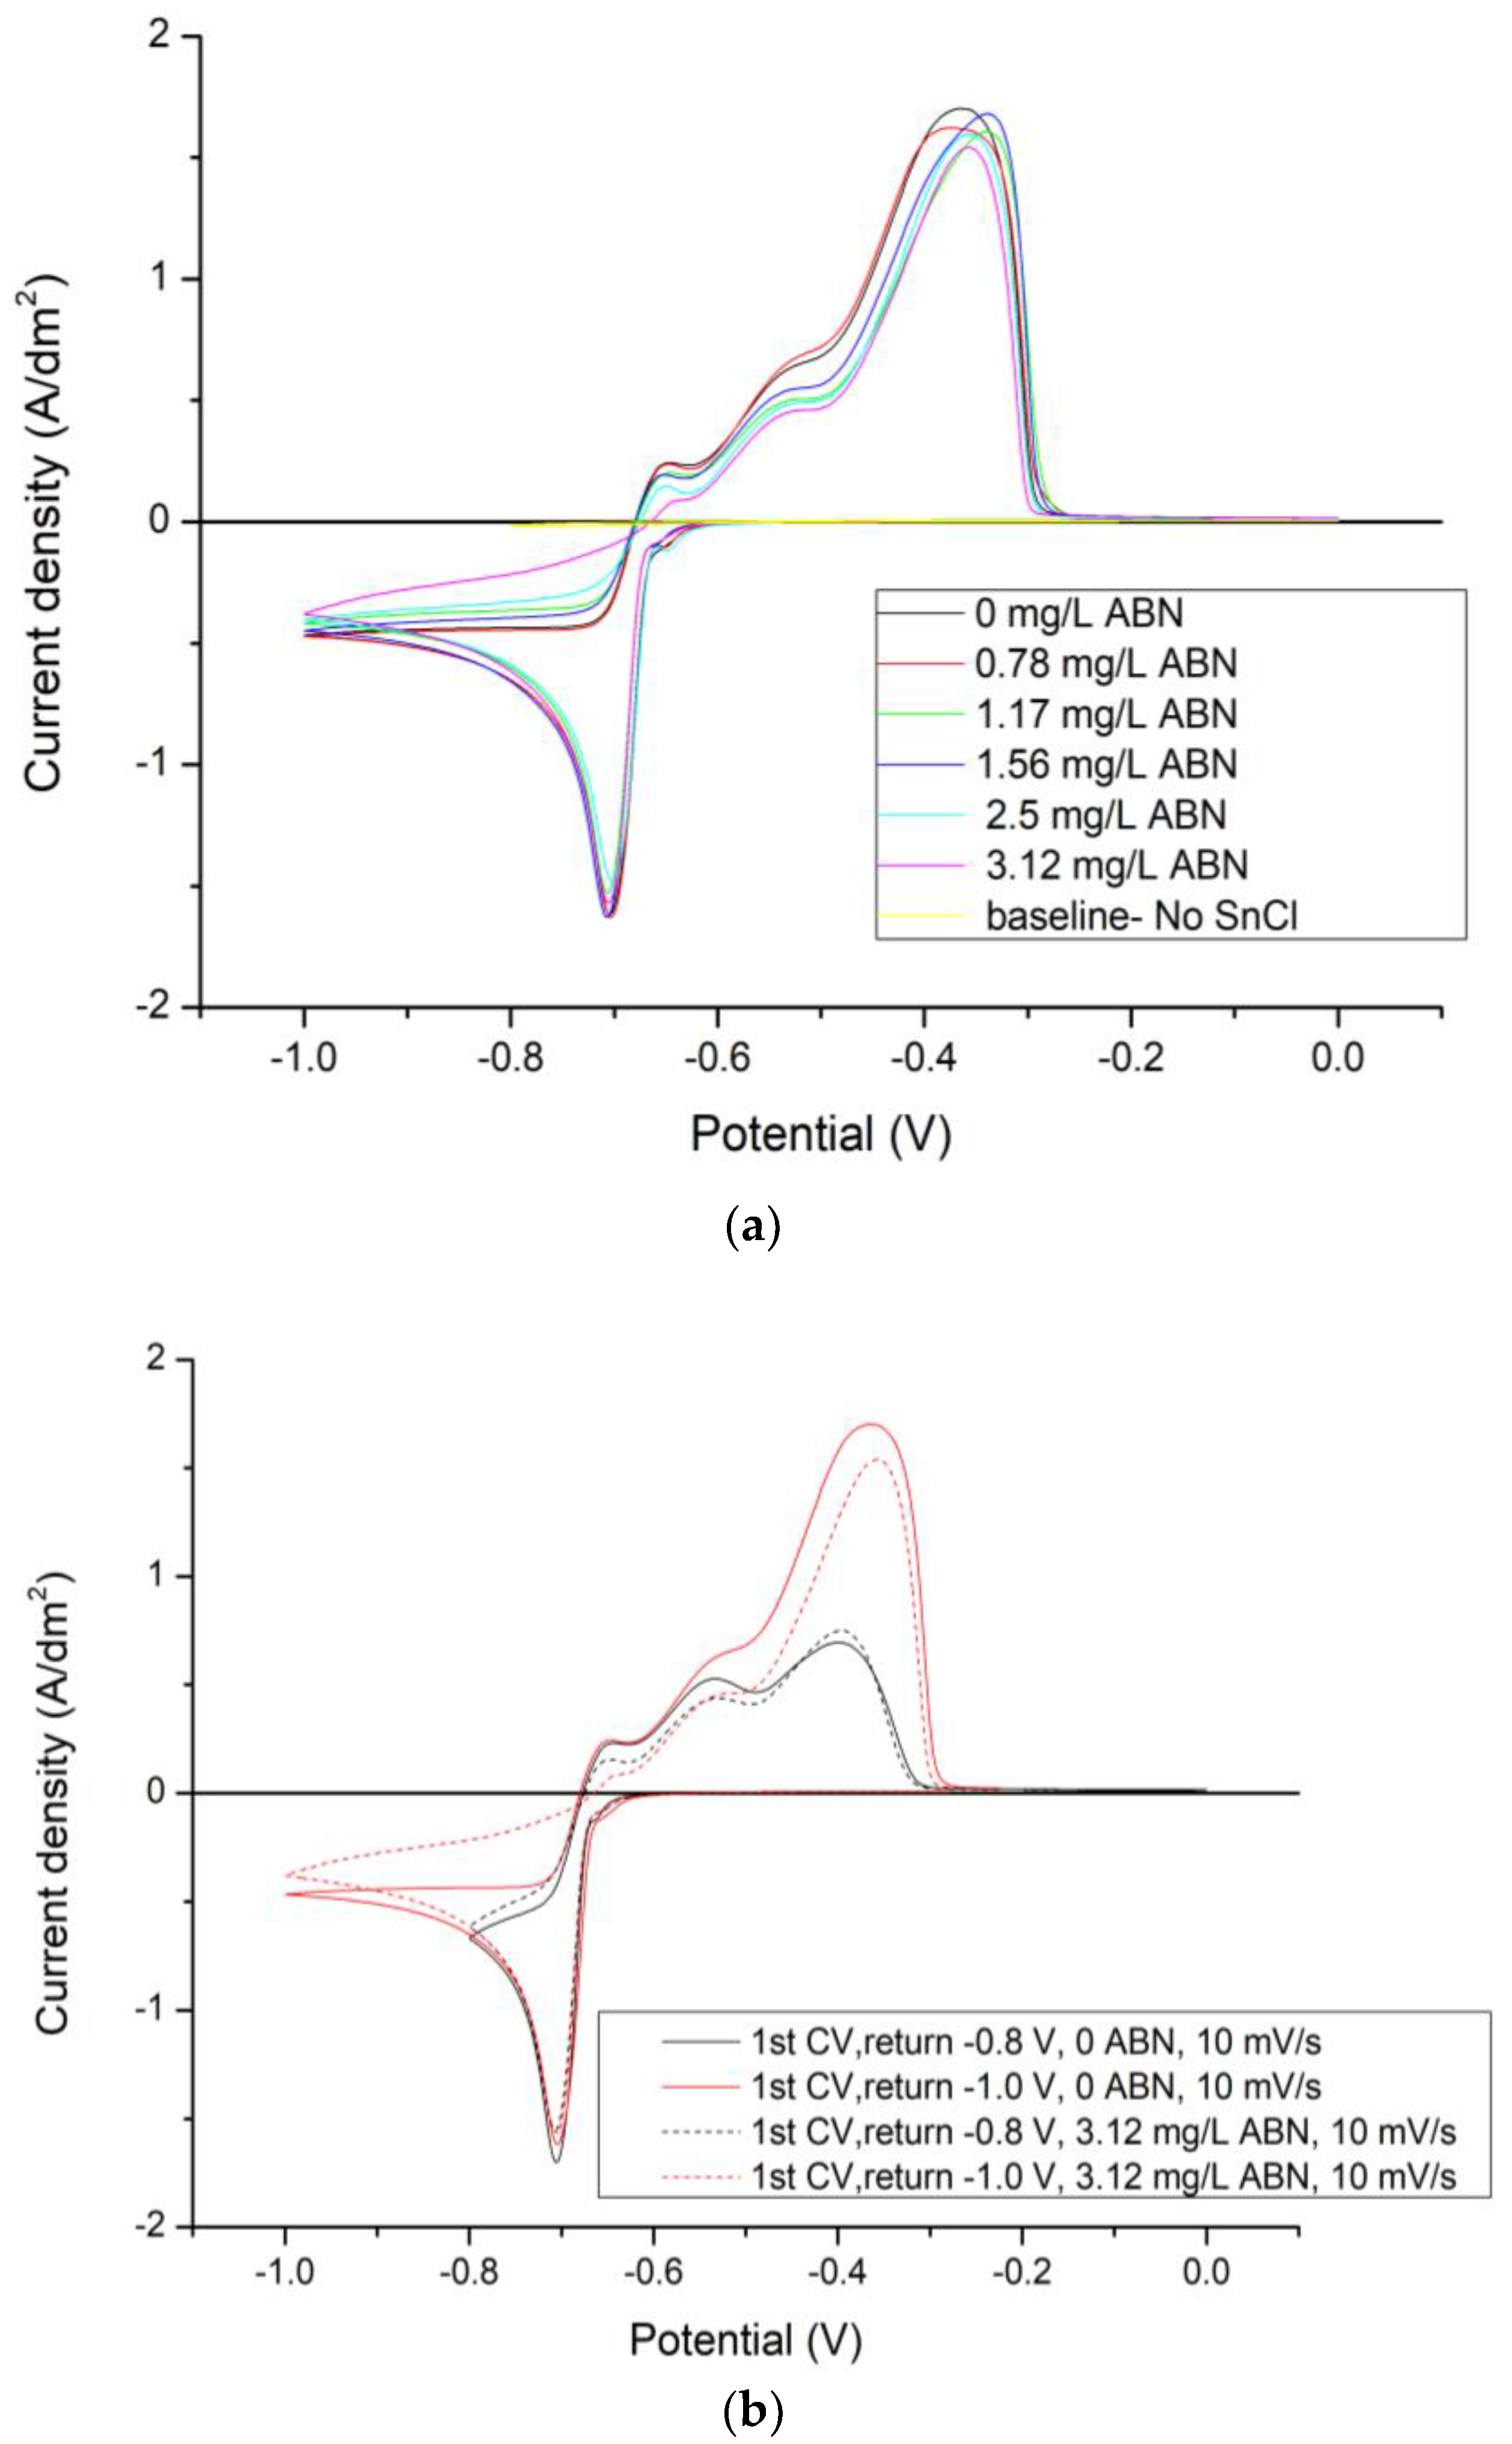
3.1. Electrochemical Characterization
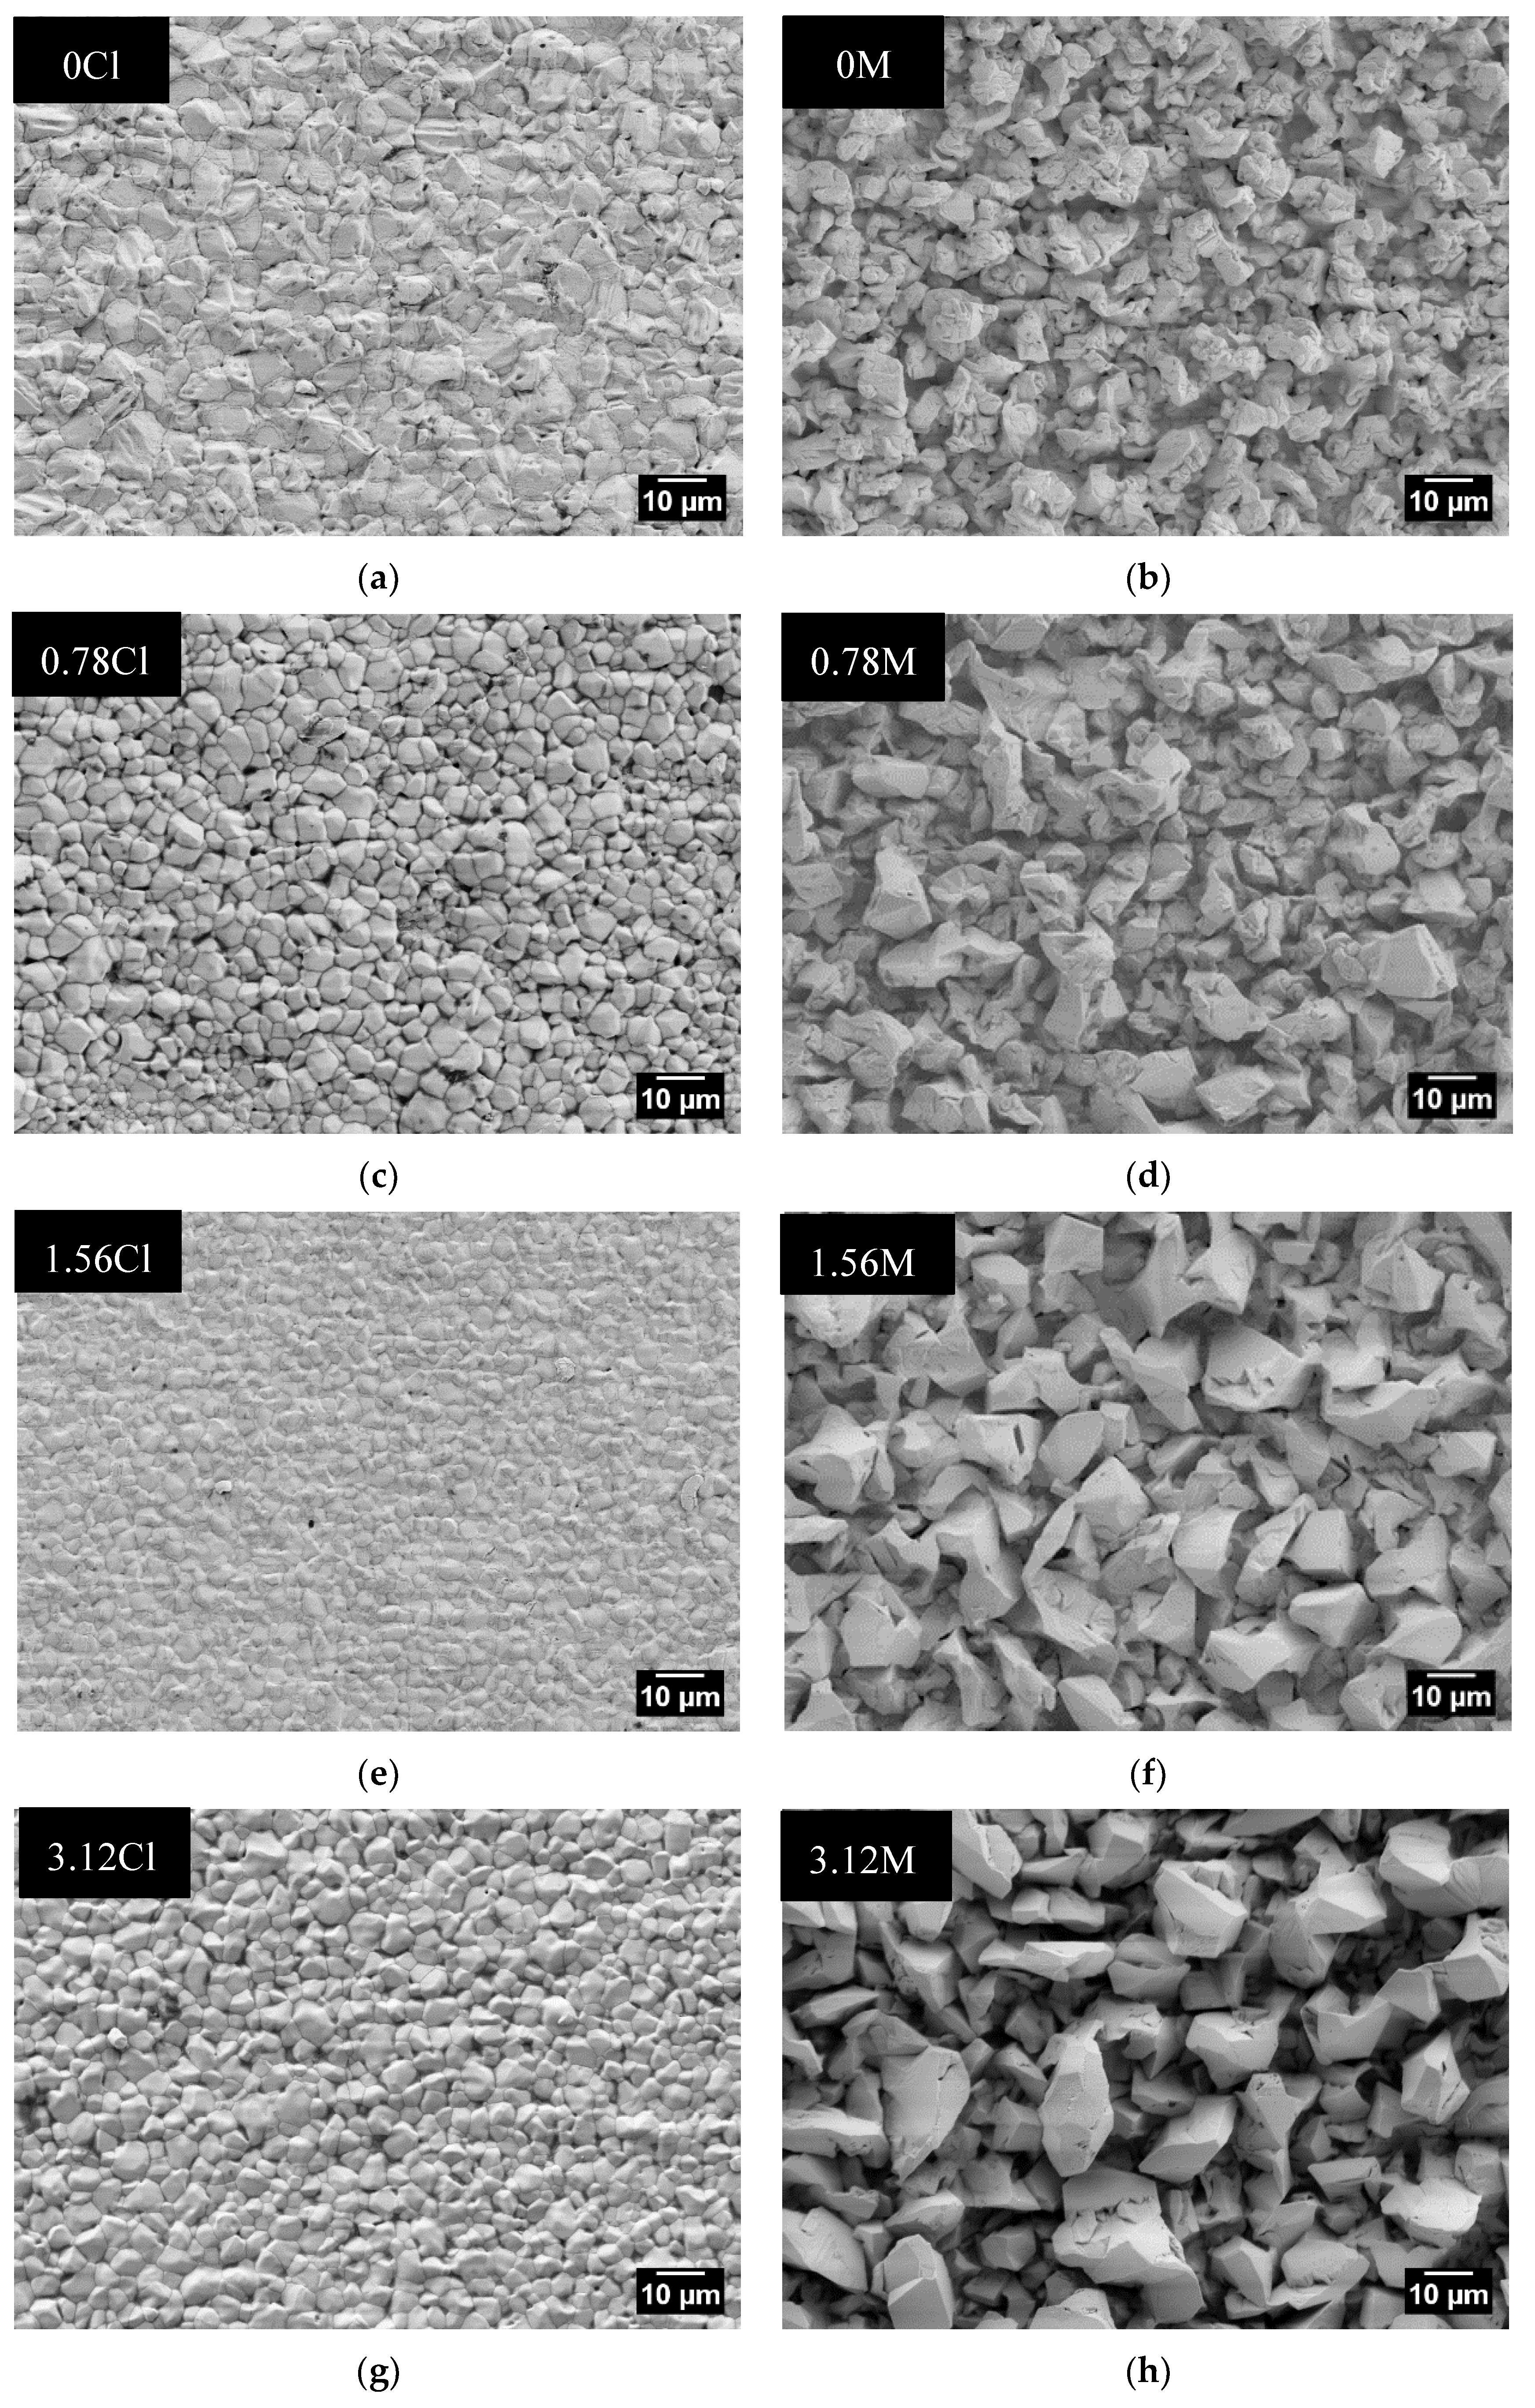
3.2. Surface Morphology
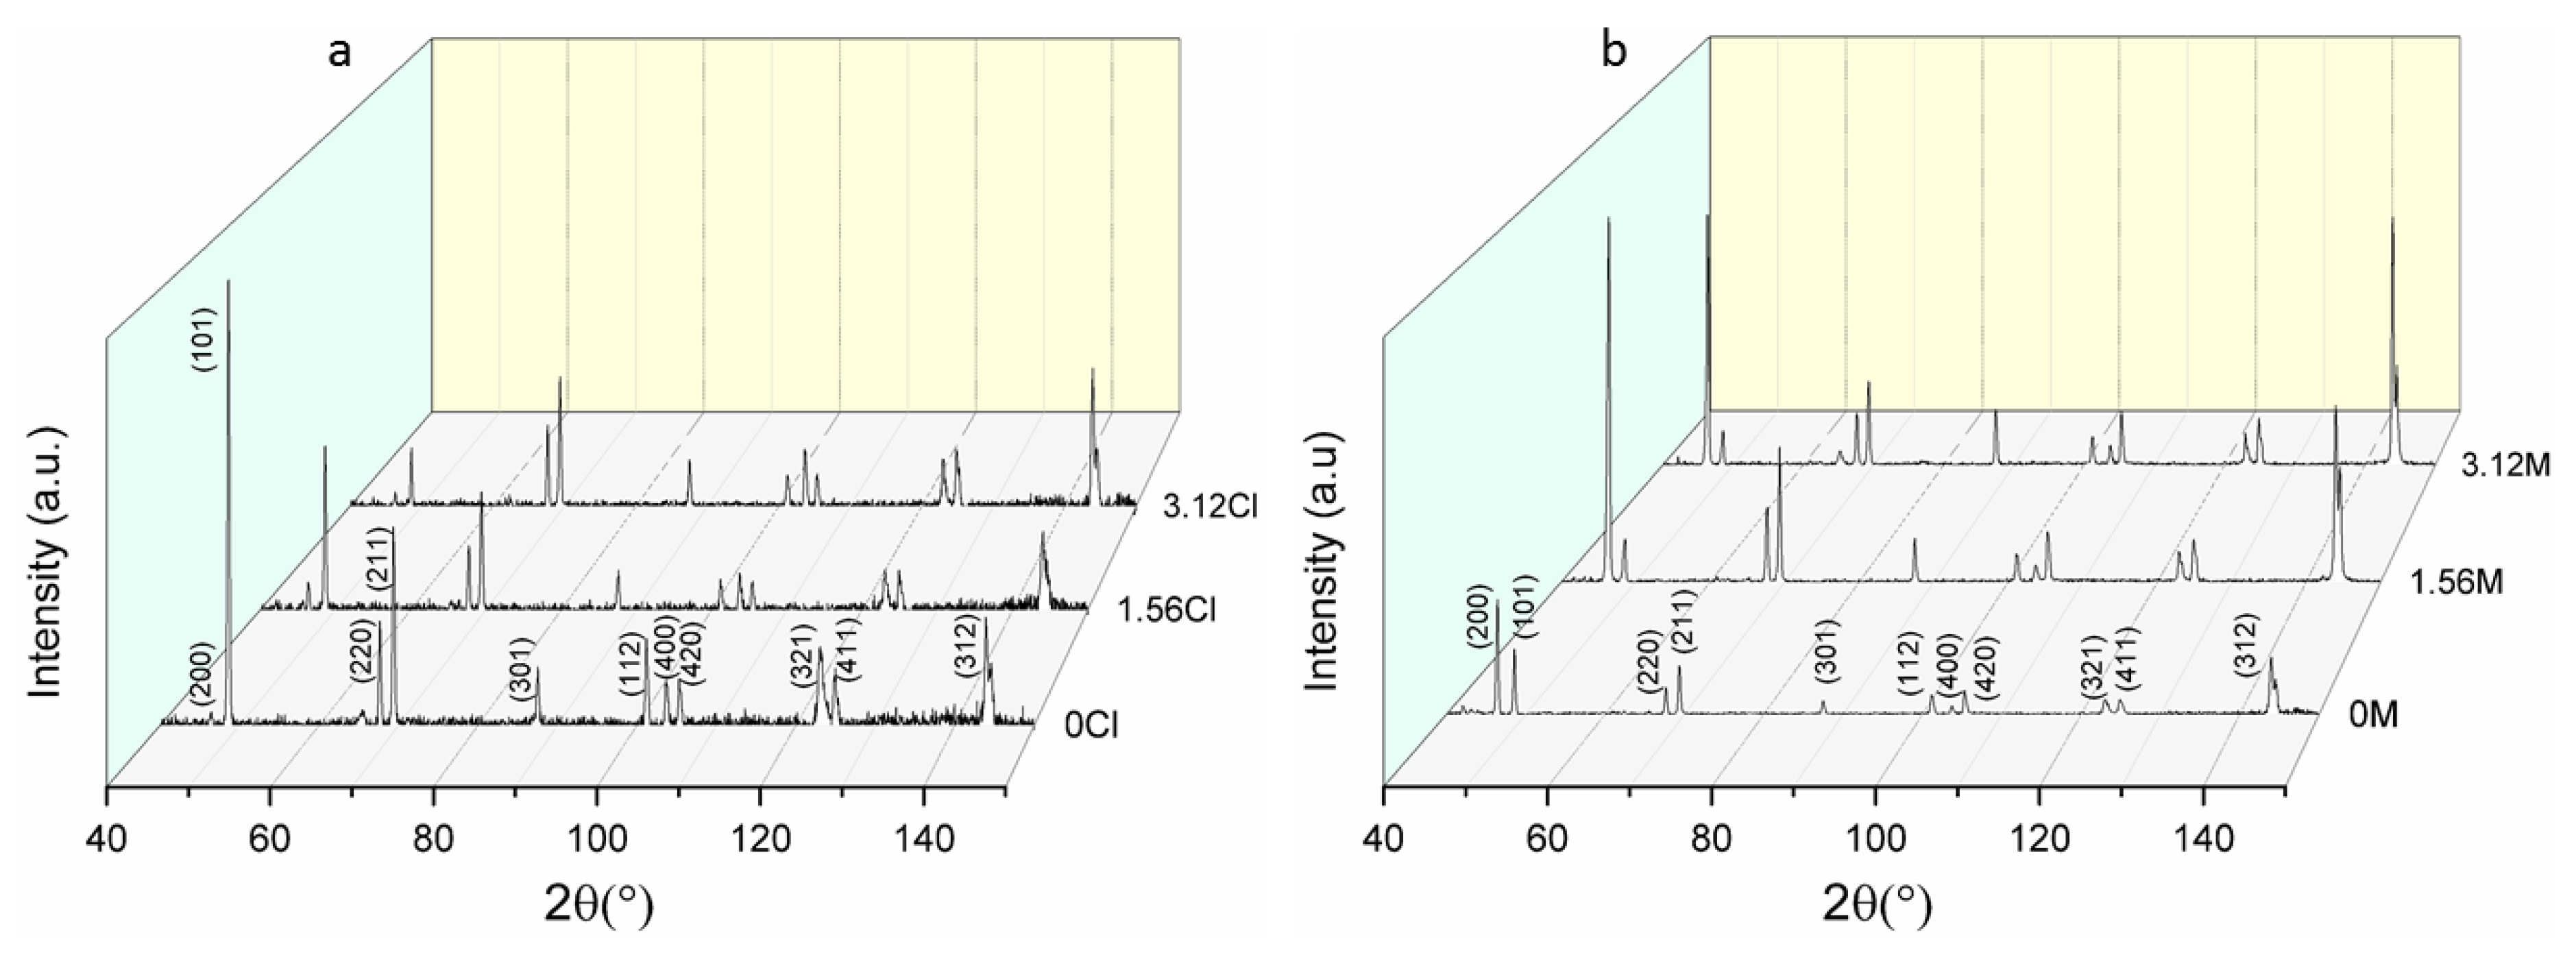
3.3. XRD Analysis
4. Discussion
Acknowledgments
Author Contributions
Conflicts of Interest
References
- Lowenheim, F.A. Modern Electroplating, 3rd ed.; Electrochemical Society series; Wiley: New York, NY, USA, 1974. [Google Scholar]
- Rosenstein, C. Methane sulfonic acid as an electrolyte for tin, lead and tin-lead plating for electronics. Met. Finish. 1990, 19, 17–21. [Google Scholar]
- Walsh, F.C.; Low, C.T.J. A review of developments in the electrodeposition of tin. Surf. Coat. Technol. 2016, 288, 79–94. [Google Scholar] [CrossRef]
- Hansal, W.E.G.; Halmdienst, M.; Hansal, S.; Boussaboua, I.; Darchen, A. Influence of pulse plating parameters on morphology and hardness of pure tin deposit. Trans. Inst. Met. Finish. 2008, 86, 115–121. [Google Scholar] [CrossRef]
- Jordan, M. The Electrodeposition of Tin and Its Alloys; Eugen G. Leuze Publishers: Saulgau, Germany, 1995. [Google Scholar]
- Schlesinger, M.; Paunovic, M. Modern Electroplating, 5th ed.; John Wiley & Sons, Inc.: Hoboken, NJ, USA, 2010. [Google Scholar]
- Medvedev, G.I.; Makrushin, N.A. Electrodeposition of tin from sulfate electrolyte in the presence of syntanol, formaldehyde, and allyl alcohol. Russ. J. Appl. Chem. 2004, 77, 1781–1785. [Google Scholar] [CrossRef]
- Low, C.T.J.; Walsh, F.C. The stability of an acidic tin methanesulfonate electrolyte in the presence of a hydroquinone antioxidant. Electrochim. Acta 2008, 53, 5280–5286. [Google Scholar] [CrossRef]
- Low, C.T.J.; Walsh, F.C. Electrodeposition of tin, copper and tin–copper alloys from a methanesulfonic acid electrolyte containing a perfluorinated cationic surfactant. Surf. Coat. Technol. 2008, 202, 1339–1349. [Google Scholar] [CrossRef]
- Martyak, N.M.; Seefeldt, R. Additive-effects during plating in acid tin methanesulfonate electrolytes. Electrochim. Acta 2004, 49, 4303–4311. [Google Scholar] [CrossRef]
- Sekar, R.; Eagammai, C.; Jayakrishnan, S. Effect of additives on electrodeposition of tin and its structural and corrosion behaviour. J. Appl. Electrochem. 2010, 40, 49–57. [Google Scholar] [CrossRef]
- Sharma, A.; Bhattacharya, S.; Das, S.; Das, K. Influence of current density on surface morphology and properties of pulse plated tin films from citrate electrolyte. Appl. Surf. Sci. 2014, 290, 373–380. [Google Scholar] [CrossRef]
- Walsh, F.C.; Ponce de León, C. Versatile electrochemical coatings and surface layers from aqueous methanesulfonic acid. Surf. Coat. Technol. 2014, 259, 676–697. [Google Scholar] [CrossRef]
- Gernon, M.D.; Wu, M.; Buszta, T.; Janney, P. Environmental benefits of methanesulfonic acid. Green Chem. 1999, 1, 127–140. [Google Scholar] [CrossRef]
- Low, C.T.J.; Kerr, C.; Des Barker, B.; Smith, J.R.; Campbell, S.A.; Walsh, F.C. Electrochemistry of tin deposition from mixed sulphate and methanesulphonate electrolyte. Trans. Inst. Met. Finish. 2008, 86, 148–152. [Google Scholar] [CrossRef]
- Jordan, M. Electrodeposition of Tin and Its Alloys; Eugen G. Leuze Publishers: Saulgau, Germany, 1995. [Google Scholar]
- Panizza, M.; Cerisola, G. Influence of anode material on the electrochemical oxidation of 2-naphthol. Part 1. Cyclic voltammetry and potential step experiments. Electrochim. Acta 2003, 48, 3491–3497. [Google Scholar] [CrossRef]
- American Society for Testing and Materials, Committee E-4 on Metallography. ASTM Standard E112-12: Standard Test Methods for Determining Average Grain Size; ASTM International: Philadelphia, PA, USA, 2012; pp. 1–27. [Google Scholar]
- Barry, F.J.; Cunnane, V.J. Synergistic effects of organic additives on the discharge, nucleation and growth mechanisms of tin at polycrystalline copper electrodes. J. Electroanal. Chem. 2002, 537, 151–163. [Google Scholar] [CrossRef]
- Kapusta, S.D.; Hackerman, N. Annodic passivation of tin in slightly alkaline solution. Electrochim. Acta 1980, 25, 1625–1639. [Google Scholar] [CrossRef]
- Šeruga, M.; Metikoš-Hukovič, M. Passivation of tin in citrate buffer solution. Electrochim. Acta 1992, 334, 223–240. [Google Scholar] [CrossRef]
- Vračar, L.M.; Dražić, D.M. Adsorption and corrosion inhibitive properties of some organic molecules on iron electrode in sulfuric acid. Corros. Sci. 2002, 44, 1669–1680. [Google Scholar] [CrossRef]
- Meibuhr, S.; Yeager, E.; Kozawa, A.; Hovorka, F. The electrochemistry of tin. J. Electrochem. Soc. 1963, 110, 190–202. [Google Scholar] [CrossRef]
- Bengoa, L.N.; Tuckart, W.R.; Zabala, N.; Prieto, G.; Egli, W.A. Tin coatings electrodeposited from sulfonic acid-based electrolytes: Tribological behavior. J. Mater. Eng. Perform. 2015, 24, 2274–2281. [Google Scholar] [CrossRef]
- Han, C.; Liu, Q.; Ivey, D.G. Kinetics of Sn electrodeposition from Sn(II)-citrate solutions. Electrochim. Acta 2008, 53, 8332–8340. [Google Scholar] [CrossRef]
- Zhang, Y. Tin and tin alloys for lead-free solder. In Modern Electroplating, 5th ed.; John Wiley & Sons, Inc.: Hoboken, NJ, USA, 2011; pp. 139–204. [Google Scholar]
- Popov, K.I.; Nikolić, N.D. General theory of disperse metal electrodeposits formation. In Electrochemical Production of Metal Powders; Djokić, S.S., Ed.; Springer: New York, NY, USA; Heidelberg, Germany; Dordrecht, The Netherlands; London, UK, 2012; pp. 1–62. [Google Scholar]
- Zhang, Y.; Abys, J.A. A unique electroplating tin chemistry. Circuit World 1999, 25, 30–37. [Google Scholar] [CrossRef]
- Kakeshita, T.; Shimizu, K.; Kawanaka, R.; Hasegawa, T. Grain size effect of electro-plated tin coatings on whisker growth. J. Mater. Sci. 1982, 17, 2560–2566. [Google Scholar] [CrossRef]
- Fischer, H. Elektrolytische Abscheidung und Elektrokristallisation von Metallen; Springer: Berlin, Germany, 1954. [Google Scholar]
- Winand, R. Electrocrystallization—Theory and applications. Hydrometallurgy 1992, 29, 567–598. [Google Scholar] [CrossRef]
- Wen, S.; Szpunar, J.A. Nucleation and growth of tin on low carbon steel. Electrochim. Acta 2005, 50, 2393–2399. [Google Scholar] [CrossRef]
- Jagtap, P.; Kumar, P. Manipulating crystallographic texture of Sn coatings by optimization of electrodeposition process conditions to suppress growth of whiskers. J. Electron. Mater. 2015, 44, 1206–1219. [Google Scholar] [CrossRef]
- He, A.; Liu, Q.; Ivey, D.G. Electrodeposition of tin: A simple approach. J. Mater. Sci. Mater. Electron. 2008, 19, 553–562. [Google Scholar] [CrossRef]


| Electrolyte Composition | Chloride (g/L) | MSA (g/L) |
|---|---|---|
| SnCl2·2H2O (abcr, Karlsruhe, Germany) | 25 | – |
| Na3C6H5O7 (Sigma Aldrich, Seelze, Germany) | 80 | 100 |
| KNaC4H4O6·6H2O (Carl Roth, Karlsruhe, Germany) | 25 | – |
| (NH4)2SO4 (Sigma Aldrich, Seelze, Germany) | 60 | – |
| MSA (70%) (Carl Roth, Karlsruhe, Germany) | – | 157 mL/L |
| SnMSA (300 g/L Sn2+) (Atotech, Berlin, Germany) | – | 166 mL/L |
| ABN Concentration (mg/L) | J0 (mA/cm2) | Tafel Slope Cathodic (mV) | Tafel Slope Anodic (mV) | Uoc (mV) |
|---|---|---|---|---|
| 0 | 7.08 | −0.0007 | 0.0152 | −734.1 |
| 0.5 | 3.31 | −0.0022 | 0.0139 | −734.6 |
| 0.78 | 0.79 | −0.0042 | 0.0185 | −722.9 |
| 1.17 | 1.12 | −0.004 | 0.0161 | −720.6 |
| 1.56 | 1.12 | −0.0039 | 0.0179 | −723.8 |
| 2.5 | 0.89 | −0.0035 | 0.0185 | −723.8 |
| 3.12 | 0.71 | −0.0041 | 0.0217 | −720.8 |
| 4.37 | 0.65 | −0.0045 | 0.0201 | −718.8 |
| ABN Concentration (mg/L) | J0 (mA/cm2) | Tafel Slope cathodic (mV) | Tafel Slope Anodic (mV) | Uoc (mV) |
|---|---|---|---|---|
| 0 | 25.12 | −0.0034 | 0.0044 | −440.75 |
| 0.5 | 22.39 | −0.0033 | 0.0039 | −443.56 |
| 0.78 | 23.99 | −0.0037 | −0.0037 | −456.25 |
| 1.17 | 23.99 | −0.0034 | 0.0036 | −460.34 |
| 1.56 | 23.99 | −0.0030 | 0.0030 | −458.75 |
| 2.5 | 22.91 | 0.0033 | 0.0033 | −464.06 |
| 3.12 | 20.89 | −0.0038 | 0.0037 | −460.58 |
| 4.37 | 15.14 | −0.0038 | 0.0035 | −462.17 |
| ABN Concentration (mg/L) | j0 (mA/cm2) | Tafel Slope Cathodic (mV) | Tafel Slope Anodic (mV) | Uoc (mV) |
|---|---|---|---|---|
| 0 | 51.29 | –0.0036 | 0.0044 | –457.66 |
| 1.56 | 52.48 | –0.0037 | 0.0038 | –466.81 |
| 3.12 | 40.74 | –0.0036 | 0.0034 | –471.69 |
| Chloride Electrolyte | MSA Electrolyte | ||||
|---|---|---|---|---|---|
| Sample Code | From Stirred Solution | From Non-Stirred Solution | Sample Code | From Stirred Solution | From Non-Stirred Solution |
| – | l ± S.D. (µm) | l ± S.D. (µm) | – | l ± S.D. (µm) | l ± S.D. (µm) |
| 0Cl | 6.1 ± 0.4 | 6.1 ± 0.6 | 0M | 7.9 ± 1 | 7.9 ± 0.9 |
| 0.78Cl | 4 ± 0.3 | 3.8 ± 0.3 | 0.78M | 8.2 ± 0.9 | 8.3 ± 0.6 |
| 1.56Cl | 2.4 ± 0.3 | 2.3 ± 0.2 | 1.56M | 11 ± 1.6 | 9.2 ± 1.3 |
| 3.12Cl | 3.9 ± 0.2 | 3.9 ± 0.4 | 3.12M | 11.8 ± 1.7 | 9.7 ± 1.8 |
© 2018 by the authors. Licensee MDPI, Basel, Switzerland. This article is an open access article distributed under the terms and conditions of the Creative Commons Attribution (CC BY) license (http://creativecommons.org/licenses/by/4.0/).
Share and Cite
Zajkoska, S.P.; Mulone, A.; Hansal, W.E.G.; Klement, U.; Mann, R.; Kautek, W. Alkoxylated β-Naphthol as an Additive for Tin Plating from Chloride and Methane Sulfonic Acid Electrolytes. Coatings 2018, 8, 79. https://doi.org/10.3390/coatings8020079
Zajkoska SP, Mulone A, Hansal WEG, Klement U, Mann R, Kautek W. Alkoxylated β-Naphthol as an Additive for Tin Plating from Chloride and Methane Sulfonic Acid Electrolytes. Coatings. 2018; 8(2):79. https://doi.org/10.3390/coatings8020079
Chicago/Turabian StyleZajkoska, Simona P., Antonio Mulone, Wolfgang E. G. Hansal, Uta Klement, Rudolf Mann, and Wolfgang Kautek. 2018. "Alkoxylated β-Naphthol as an Additive for Tin Plating from Chloride and Methane Sulfonic Acid Electrolytes" Coatings 8, no. 2: 79. https://doi.org/10.3390/coatings8020079
APA StyleZajkoska, S. P., Mulone, A., Hansal, W. E. G., Klement, U., Mann, R., & Kautek, W. (2018). Alkoxylated β-Naphthol as an Additive for Tin Plating from Chloride and Methane Sulfonic Acid Electrolytes. Coatings, 8(2), 79. https://doi.org/10.3390/coatings8020079