Article

Effect of Coating Palm Oil Clinker Aggregate on the Engineering Properties of Normal Grade Concrete

by
Fuad Abutaha
,
Hashim Abdul Razak
* and
Hussein Adebayo Ibrahim
StrucHMRS Group, Department of Civil Engineering, Faculty of Engineering, University of Malaya, Kuala Lumpur 50603, Malaysia
*
Author to whom correspondence should be addressed.
Coatings 2017, 7(10), 175; https://doi.org/10.3390/coatings7100175
Submission received: 10 August 2017 / Revised: 4 September 2017 / Accepted: 5 September 2017 / Published: 21 October 2017
(This article belongs to the Special Issue Manufacturing and Surface Engineering)

Abstract

:
Palm oil clinker (POC) is a waste material generated in large quantities from the palm oil industry. POC, when crushed, possesses the potential to serve as an aggregate for concrete production. Experimental investigation on the engineering properties of concrete incorporating POC as aggregate and filler material was carried out in this study. POC was partially and fully used to replace natural coarse aggregate. The volumetric replacements used were 0, 20%, 40%, 60%, 80%, and 100%. POC, being highly porous, negatively affected the fresh and hardened concrete properties. Therefore, the particle-packing (PP) method was adopted to measure the surface and inner voids of POC coarse aggregate in the mixtures at different substitution levels. In order to enhance the engineering properties of the POC concrete, palm oil clinker powder (POCP) was used as a filler material to fill up and coat the surface voids of POC coarse, while the rest of the mix constituents were left as the same. Fresh and hardened properties of the POC concrete with and without coating were determined, and the results were compared with the control concrete. The results revealed that coating the surface voids of POC coarse with POCP significantly improved the engineering properties as well as the durability performance of the POC concrete. Furthermore, using POC as an aggregate and filler material may reduce the continuous exploitation of aggregates from primary sources. Also, this approach offers an environmental friendly solution to the ongoing waste problems associated with palm oil waste material.

1. Introduction

The construction industry has been identified to be one of the largest industries worldwide. Currently, an enormous worldwide development is occurring in this industry, especially in developing countries as a result of rapid industrial and economic developments leading to the improved standard of living and infrastructural development [1]. Nowadays, the scarcity of natural resources and the rising costs of raw materials have induced researchers to focus more on utilizing solid wastes and by-products as raw material in concrete production [1,2]. Economic and environmental benefits are some of the factors that determine the viability of using solid waste. From an economic standpoint, using solid waste is cheaper as compared to the costs of using natural resources or even the costs of producing new material [3]. Consequently, natural resources can be preserved and there will be a significant reduction in waste being discharged to the environment [4]. The solid wastes and by-products, when properly used, have shown to be a comparable construction raw material [4]. Palm oil clinker (POC) is a waste material generated in large quantities from the palm oil industry. POC, when crushed, has the potential to serve as a lightweight aggregate for concrete production.

2. Pam Oil Clinker (POC)

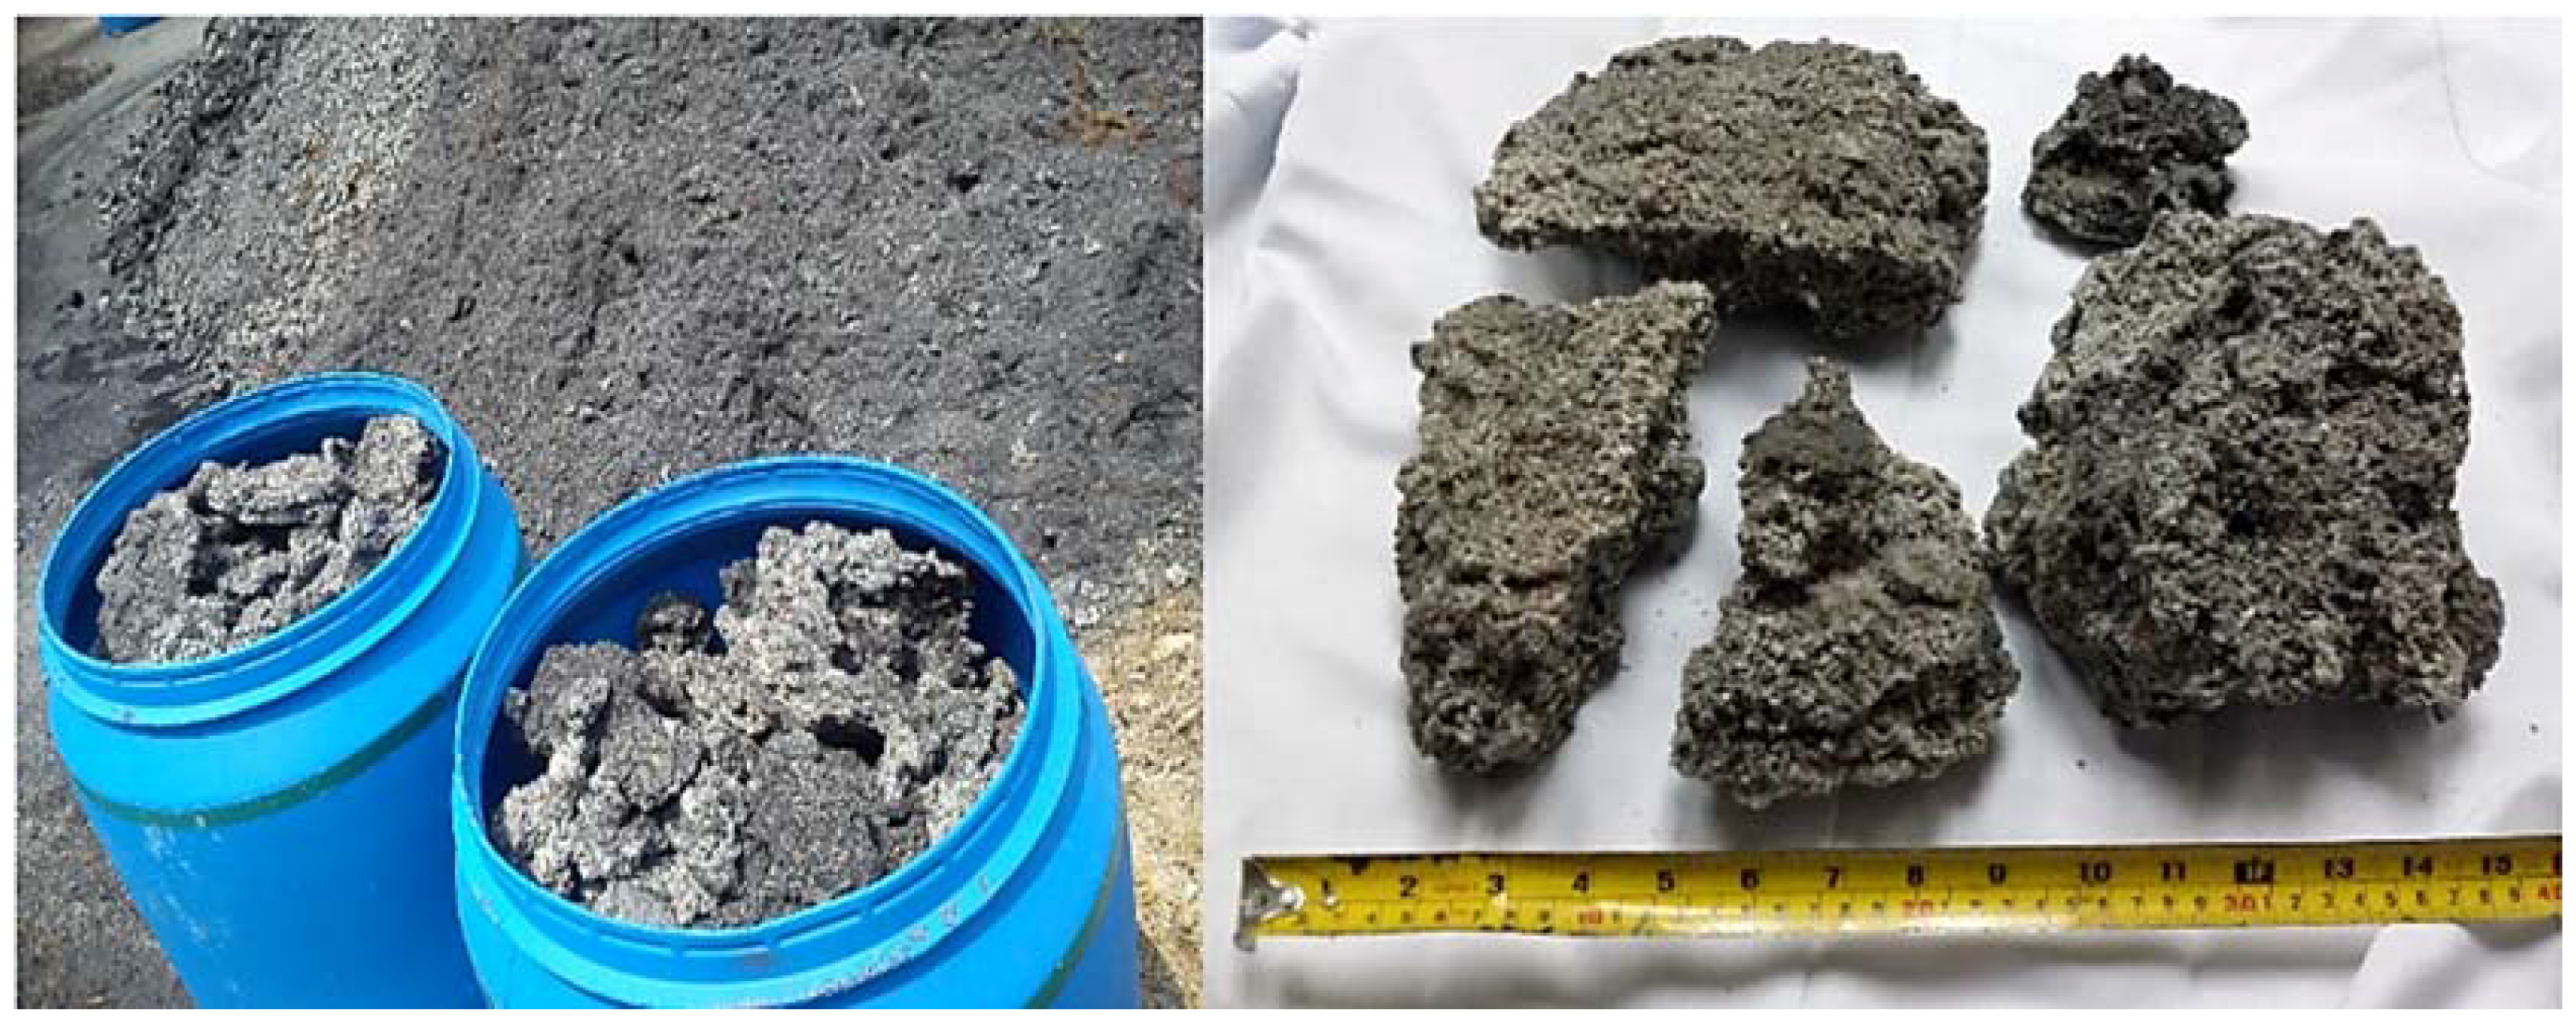
Malaysia is one of the primary producers of palm oil, contributing more than half of the world’s palm oil on a yearly basis [5]. In 2012, it was reported that the total production of crude palm oil was more than 18.7 million tons [6]. The extraction of useful material from these plants generates various types and forms of waste material, which need to be disposed of appropriately. Generally, they comprise of ash, grains, wastewater, and shells in large combined chunks [7]. POC is a palm oil shell incineration by-product in the form of a lightweight material (Figure 1). The large chunk of POC is flaky, irregularly shaped, and porous with a rough and sharp broken surface, as seen in Figure 2. POC, when crushed, represents a lightweight aggregate that can be potentially used in concrete production [8]. Kanadasan et al. (2015) [9] reported that the similarity of the particle size distribution and the grading features of sand and POC fine aggregate indicate the suitability of POC fine as a suitable substitution for sand in concrete production. Abdullahi et al. (2008) [10] prepared trial mix proportions for POC, and showed that it is possible to use POC as an aggregate in the mix design of concrete without adding admixture. Kanadasan et al. (2014) [7] reported that POC aggregates, which are often seen as a waste material for landfilling, performed satisfactorily as an aggregate material in the production of self-compacting concrete. Also, a study conducted by Ibrahim et al. (2016) [11] indicated the feasibility of incorporating POC aggregate as a suitable replacement for natural aggregates in Pervious Concrete (PC) production. In this study, palm oil clinker powder (POCP) was used as a filler material to fill up and coat the surface voids of POC coarse so as to enhance the engineering properties of normal grade POC concrete. The aim was to examine the applicability of palm oil waste as a natural aggregate replacement in concrete production towards improving the sustainability of the construction industry.

3. Materials

3.1. Aggregates

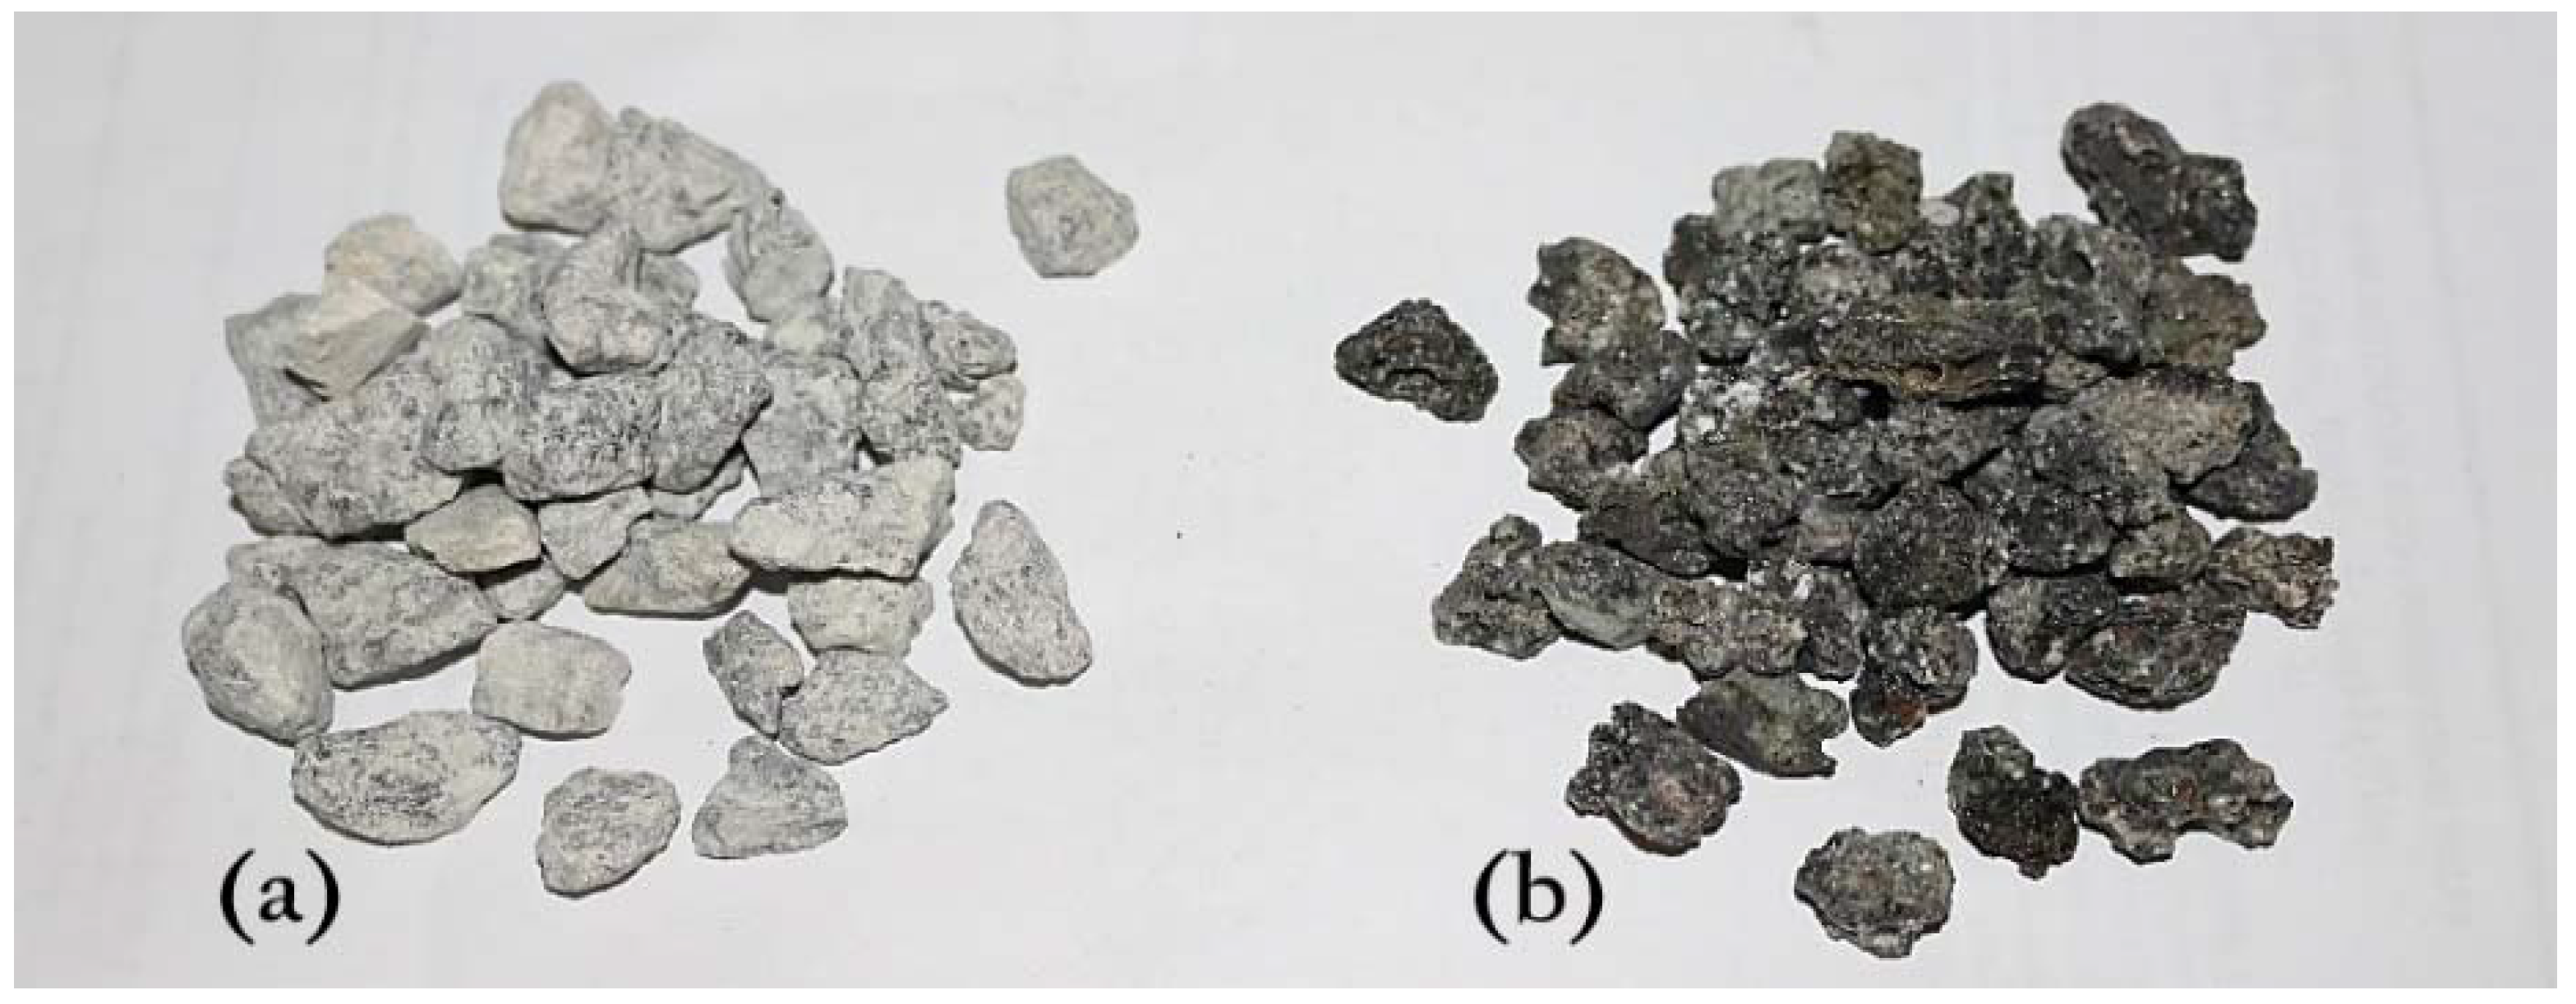
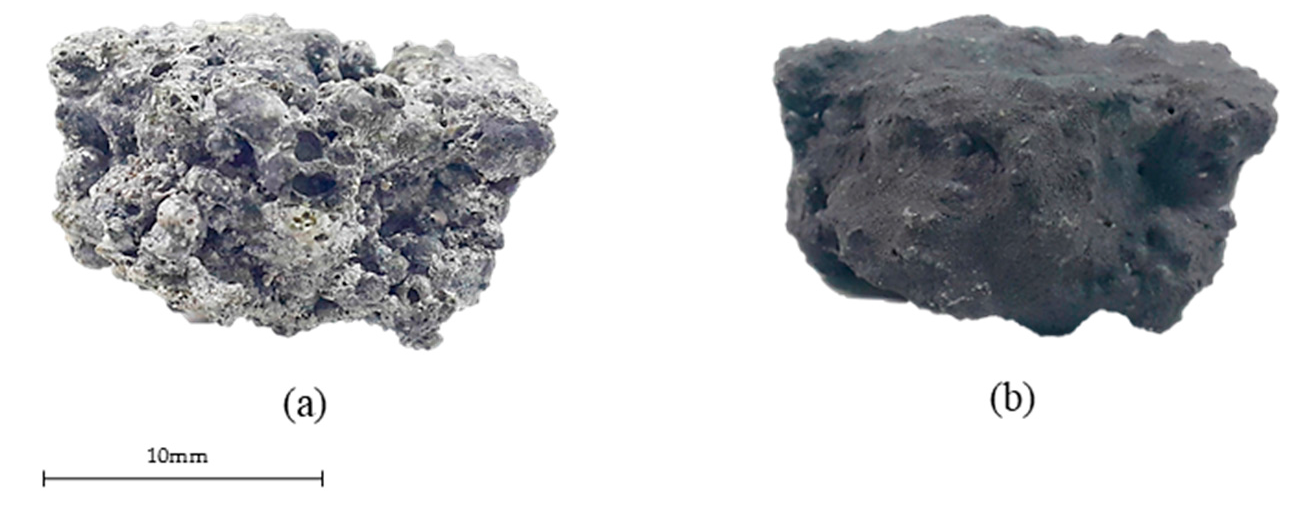
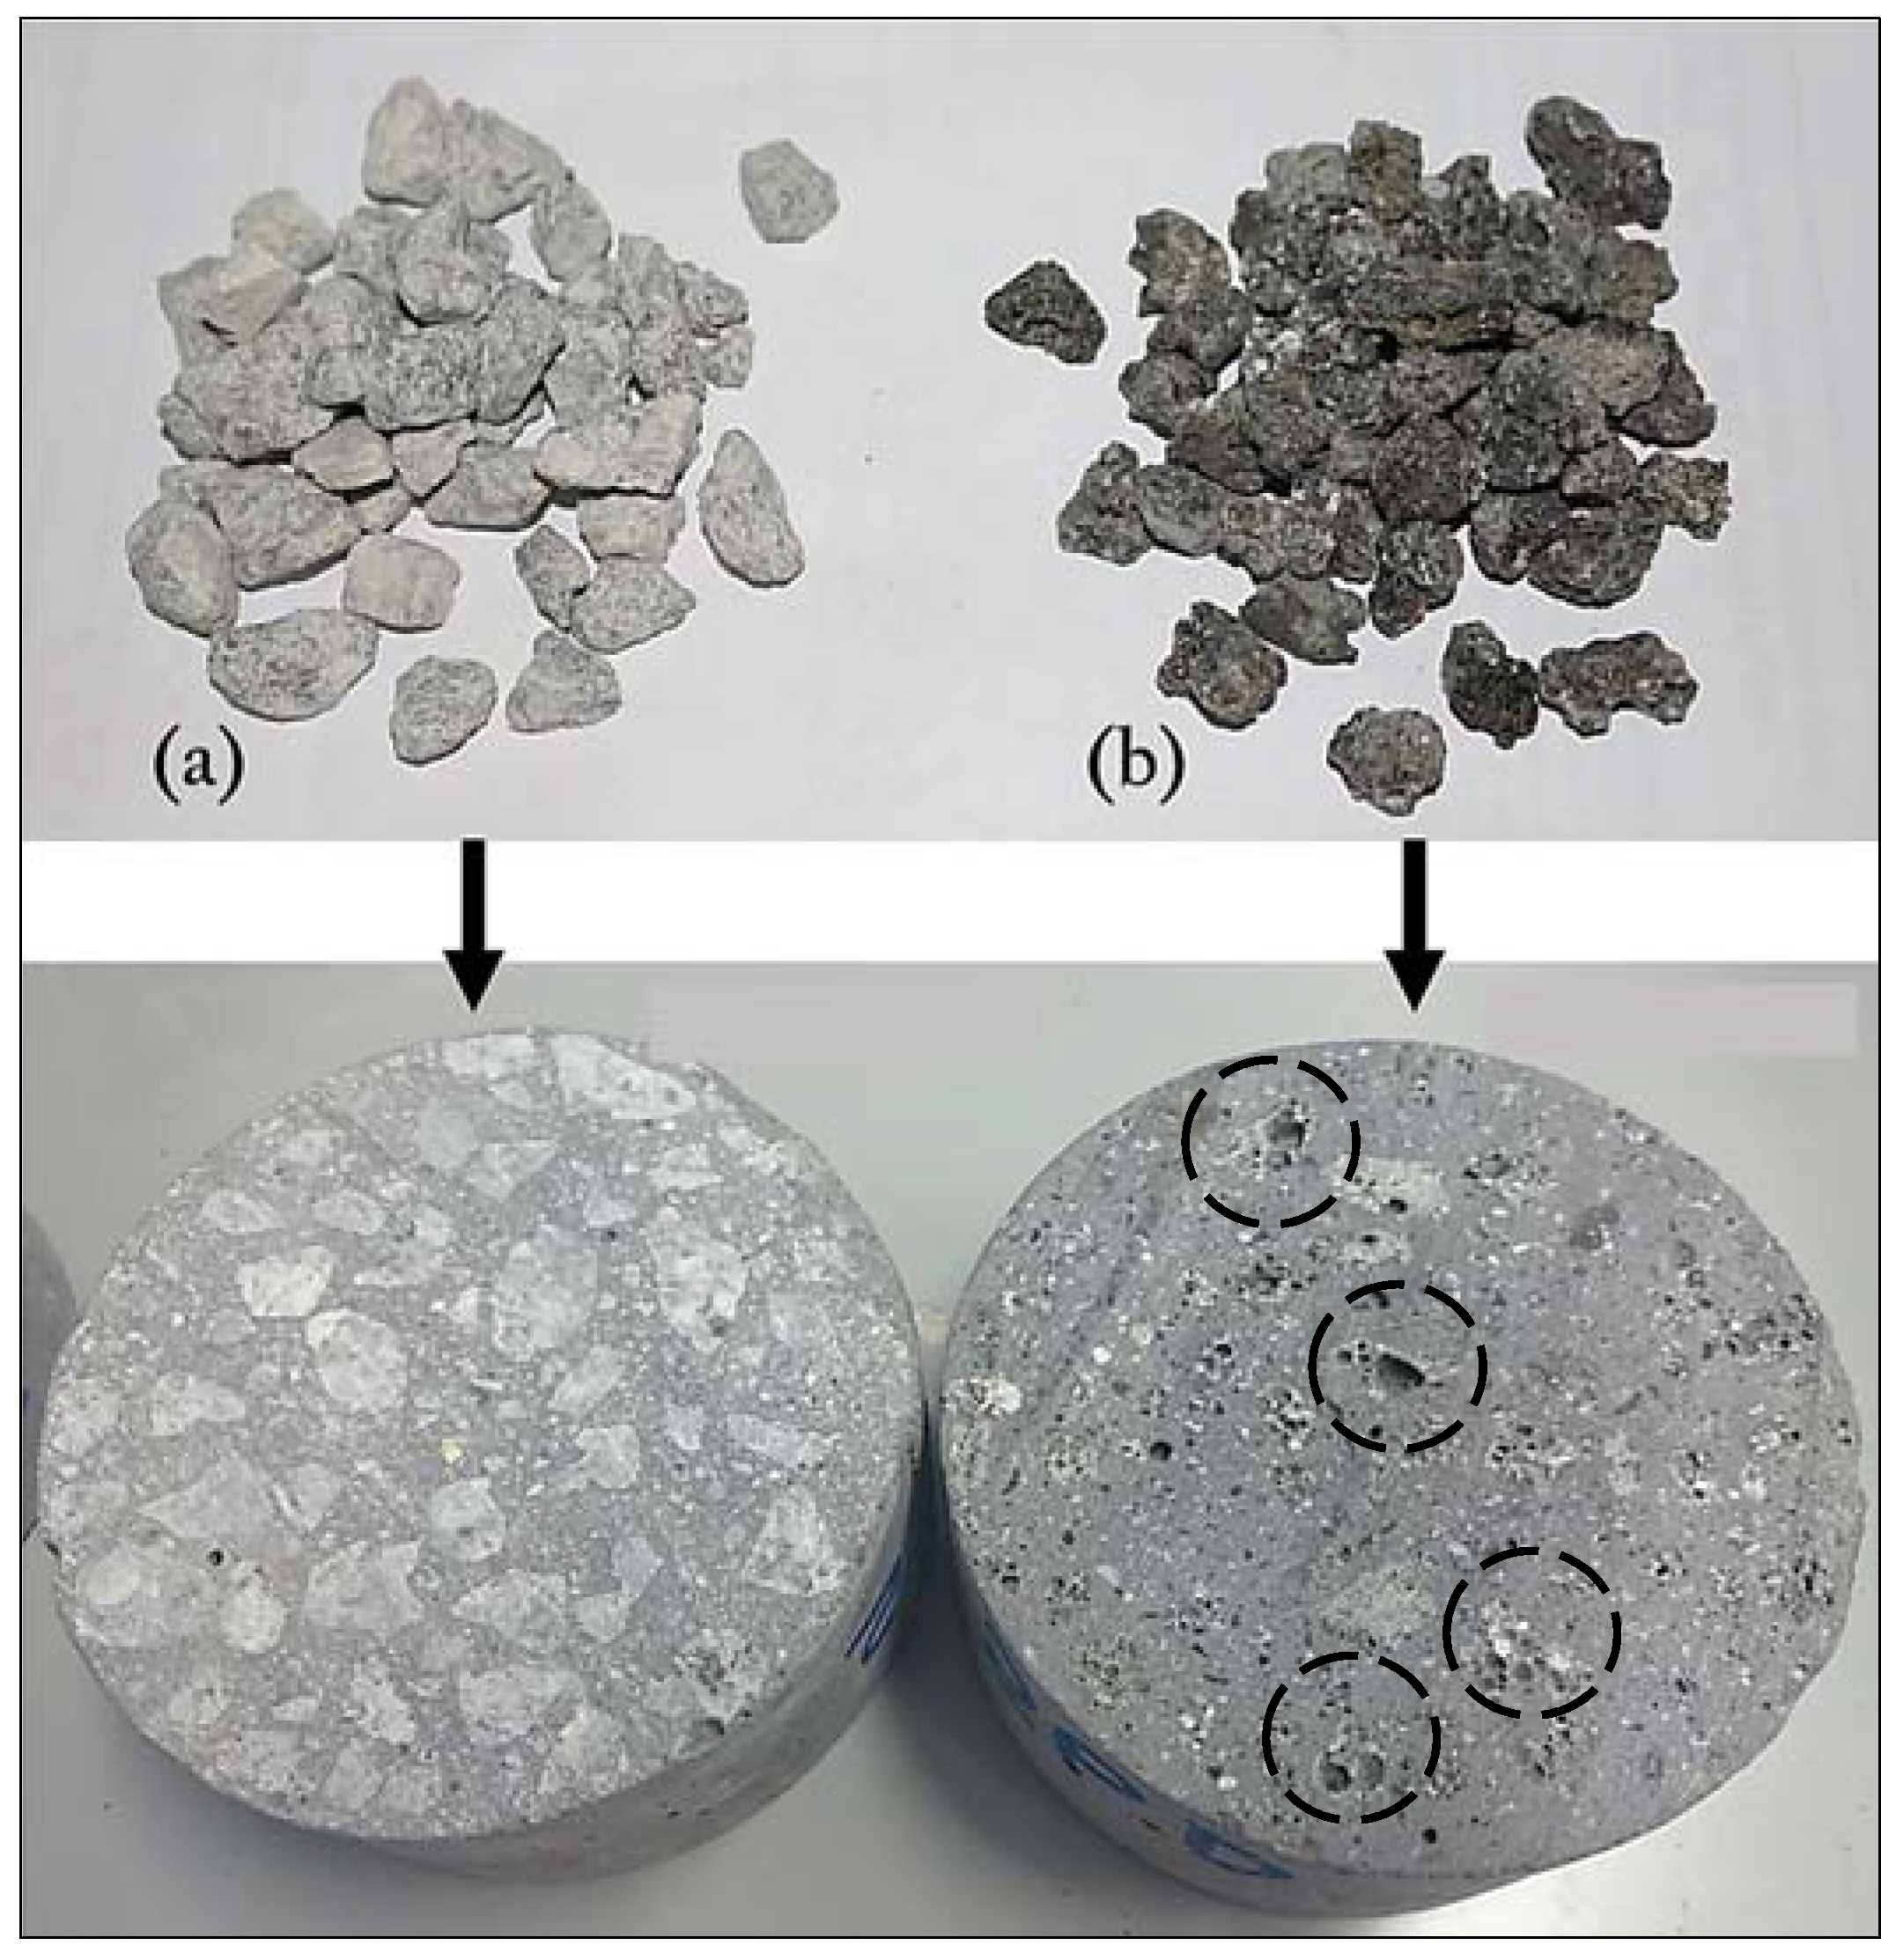
Three types of aggregate were used in this study, which includes POC, river sand as natural fine aggregate, and crushed granite rocks as a natural coarse aggregate. POC was collected from a local palm oil mill in the form of a large chunk. It was then crushed using a Jaw crusher machine and sieved to be used as a replacement for natural coarse aggregate (Figure 3). The physical properties of all aggregates used in this study are tabulated in Table 1.

3.2. Powders

Ordinary Portland Cement (OPC), equivalent to ASTM Type I, was used as the main binding material. POC powder was prepared by grinding POC into a fine powder form. POCP can be assumed to have a similar fineness with cement [12]. The particle size distribution curves of POCP and OPC are comparable and most of the particles sizes are less than 100 µm [13]. In this study, POCP was used as filler material to fill up and coat the surface voids of POC particles. A comparison of the physical properties and the chemical composition of POCP and OPC are presented in Table 2.

3.3. Admixtures

To enhance the concrete workability, Sika ViscoCrete 2199 from Sika Kimia Sdn Bhd, Kuala Lumpur, Malaysia, which is a modified polycarboxylate type was used as a high range water reducing admixture in the study. This admixture is chloride free according to BS 5075 and is compatible with all types of Portland cement.

4. Experimental Program

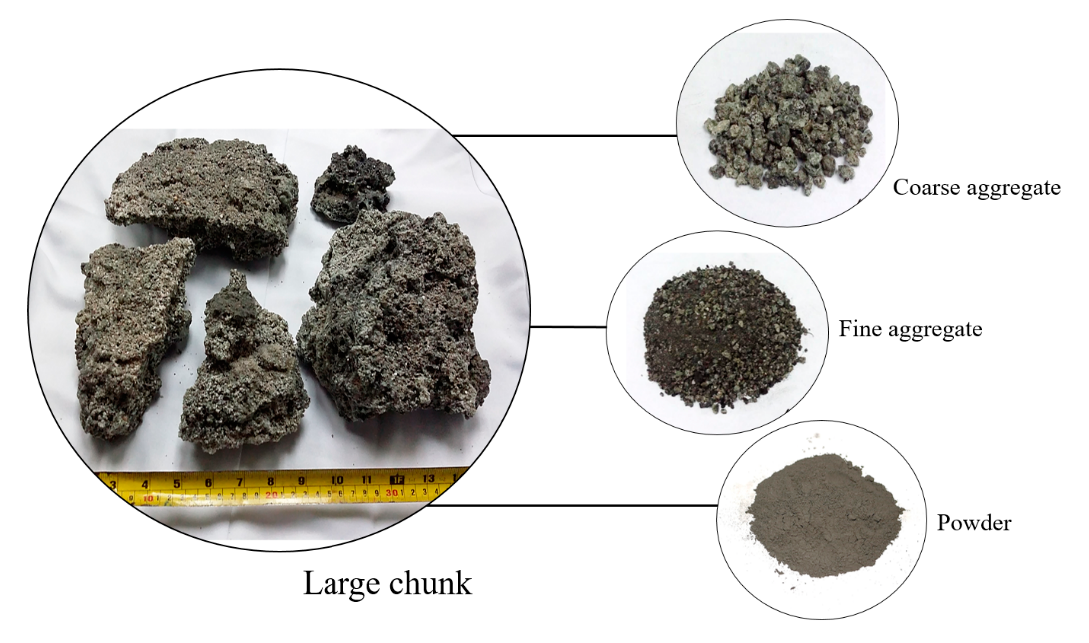
The experimental program involved determining the engineering properties of the concrete made with POC as a partial and full replacement of natural coarse aggregate with and without the surface coating. POC was collected in the form of large chunks from the palm oil mill factory, as shown in Figure 4. It was then crushed using a Jaw crusher machine, and it was sieved to the required size. The mix design was based on the Department of Environment (DOE) method to produce concrete grade 40 with slump in the range of 100 ± 25 mm. The volumetric replacement of granite coarse aggregate with POC adopted in this study are 0, 20%, 40%, 60%, 80%, and 100%. All of the mixes had a constant cement content and water to cement ratio of 420 kg/m3 and 0.53, respectively, so as to observe only the effect of POC incorporation on the fresh and hardened concrete properties. Details of the constituent materials proportion at different substitution levels are presented in Table 3.
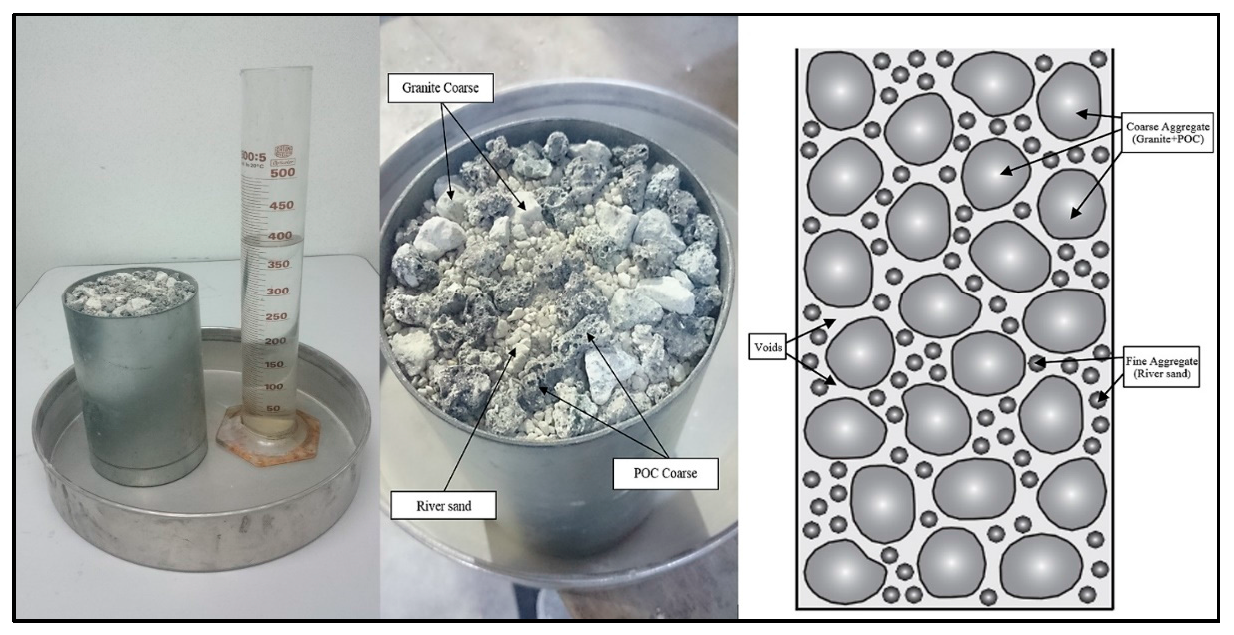
POC, being highly porous, and due to no standard guidelines available in literature on how to choose the quantity of powder required to coat the surface voids of such an aggregate, the particle packing (PP) method was adopted to determine the volume of voids due to the porosity of POC at different substitution levels. The PP method gives an assessment of the additional voids when POC is substituted with the natural aggregate. The steps for using the PP method to measure the voids are as follows:
  • Phase 1: All the aggregate particles were checked to ensure they have been soaked in water for 24 h. They were later brought into the saturated surface dry (SSD) condition to avoid any loss of fluid through absorption during the PP test.
  • Phase 2: The combination of the aggregates, i.e., POC coarse, granite coarse and river sand with proportion based on the mix designed by the DOE method, as tabulated in Table 3, was prepared on the baseplate. They were thoroughly mixed by using a scoop and trowel to get a homogenous mix. It was later placed into a container in a loosely packed state, as shown in Figure 5.
  • Phase 3: A known volume of clean water was prepared and it was subsequently poured slowly into the container filled with the aggregates.
  • Phase 4: Once the water level reached the top surface of the container, the water level is checked consecutively every 30 s for a period of 2 min. This is basically to allow for water to fill up all the voids between the aggregates. Water is constantly added if there is a reduction in the level. The amount of water utilized represents the total amount of voids present.

Determination of the Required POCP

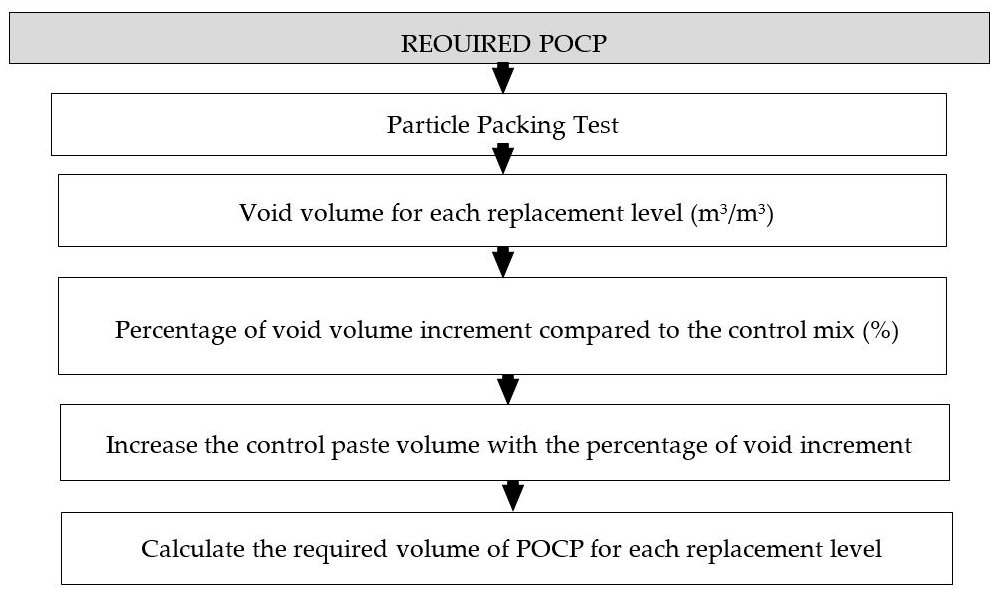
To determine the particle packing density of concrete, small particles should be selected to fill up the voids between the large particles [14]. In this study, palm oil clinker powder (POCP), which was obtained by a ball mill grinding process of POC, was selected as the suitable filler material to coat the surface voids of POC coarse in order to enhance the fresh and hardened properties of the POC concrete. It is important to design concrete structures and mixtures in such a way that any negative environmental impact is minimized. Thus, using POCP serves as an environmentally friendly alternative and is also a means of maximizing the use of palm oil waste in the concrete. The general procedure for determining the POCP required for each substitution level of POC coarse is shown in Figure 6, and the detailed calculations are given in Appendix A.
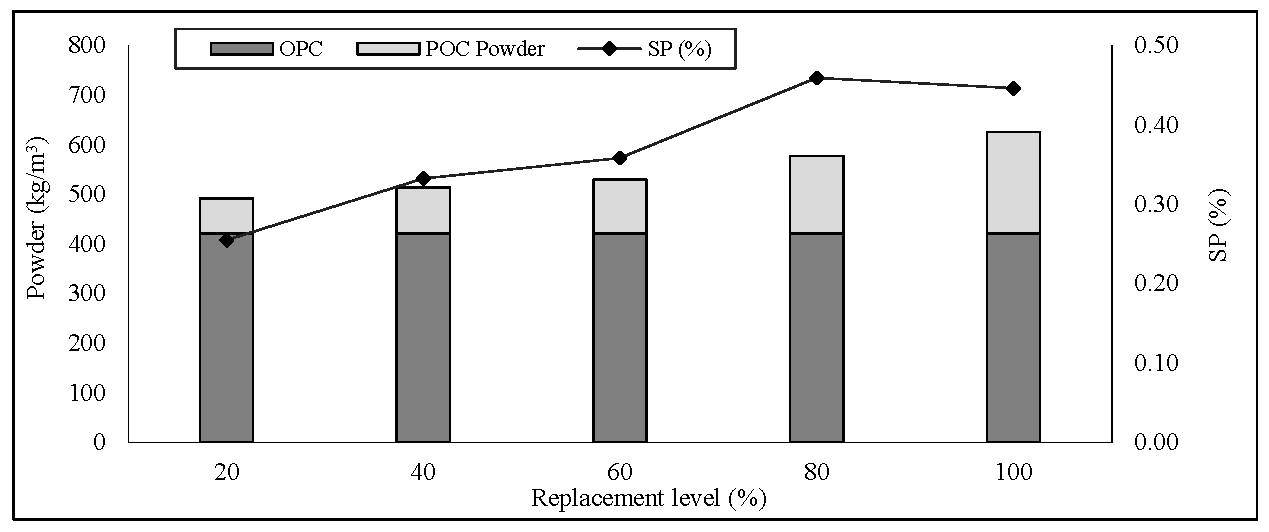
Based on the PP results, the final mix proportions after incorporating POCP to the six levels of POC concrete is presented in Table 4. Figure 7 shows the total powder and superplasticizer (SP) dosage required for different substitution levels of POC to obtain a constant slump range of 100 ± 25 mm. A comparison was conducted to determine the effect of the filling-ability of POCP on fresh and hardened properties of POC concrete.

5. Coating Process and Concrete Mixing

The volume of POCP required for each replacement level of POC coarse were calculated and presented in Table 4. POCP was calculated by determining the volume of the additional voids with reference to granite. Taking into consideration the substantial volume of voids and the irregular shape of POC coarse aggregate. The combination of POC and POCP with a proportion based on the PP mix design, as tabulated in Table 4, was prepared. They were thoroughly dry mixed for 4–5 min using a pan type mixer in order to fill up the voids and properly coat the POC particles, as shown in Figure 8.
The remaining aggregates i.e., sand and granite with cement, were added and allowed to dry mix for an additional 2 min. After that, two third of the mixing water was added and allowed to mix for 3 min. The remaining water and SP were gradually added to the mixture. The concrete mix was subjected to additional mixing for about 5 min to ensure a homogenous mix was obtained. Subsequently, fresh properties were determined by measuring the concrete workability and fresh density after completing the mixing process. The quantity of concrete was always prepared 20% in excess of the required amount. The fresh concrete was casted in steel moulds using shovels. Prior to casting, the surfaces of the moulds were cleaned and a thin layer of oil was applied to the interior faces of the moulds to facilitate the de-moulding process. Fresh concrete was casted in three layers and each layer was compacted using a vibration table. After the final layer had been compacted, the top was levelled to provide a smooth and flat surface, and it was then covered with gunnysacks to prevent moisture loss and minimize the plastic shrinkage. The specimens were de-moulded after 24 h and then subjected to full water curing until the date of the hardened concrete test. The final value of the mechanical properties was determined by taking the average of three identical specimens and the shrinkage value for each age is the average value of nine readings.

6. Results and Discussion

6.1. Workability

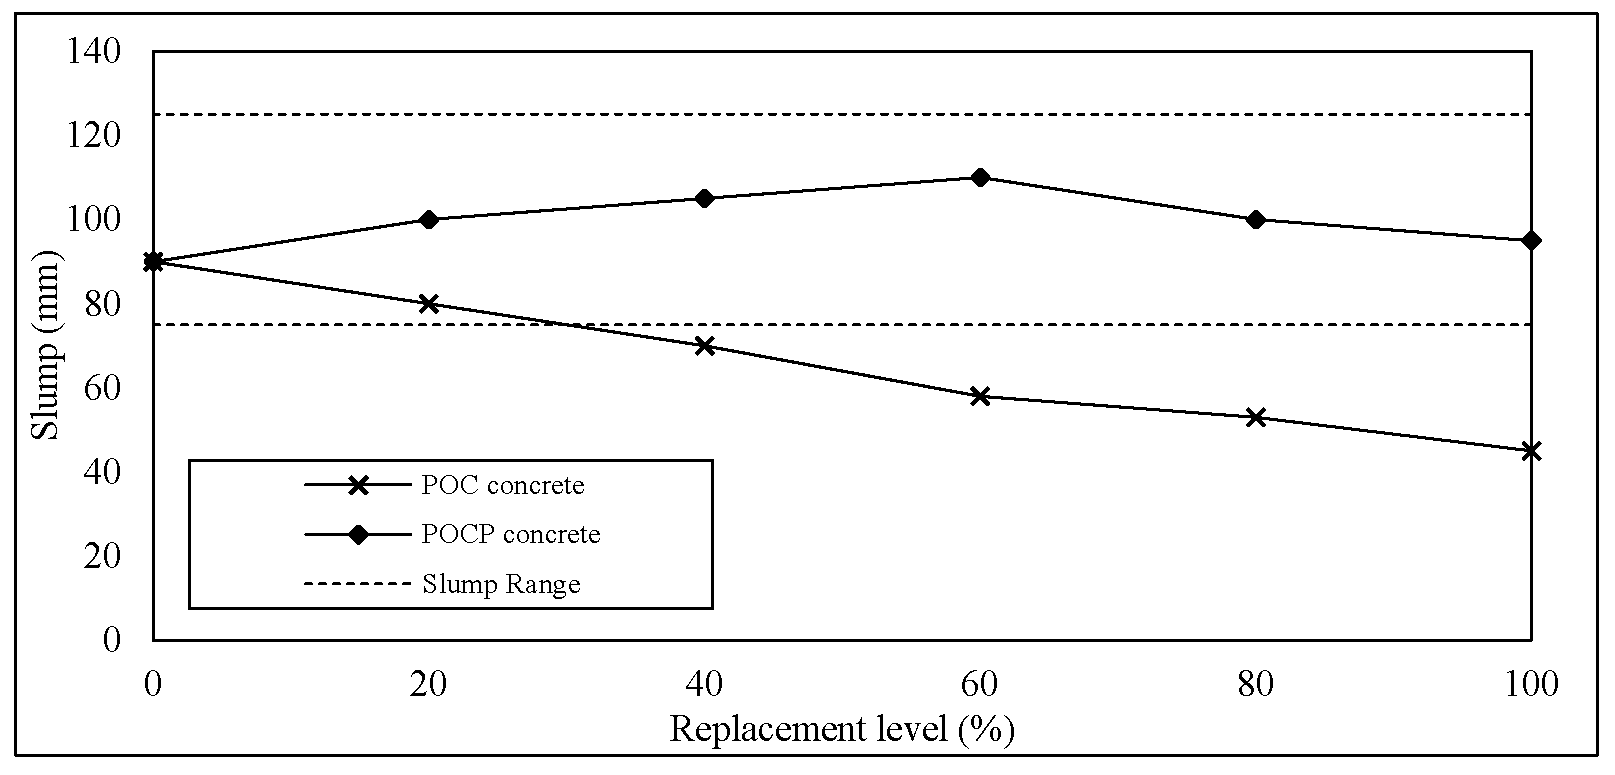
The consistency of the concrete was assessed by the measure of slump in this study. Slump results of the POC and POCP concrete mixes are depicted in Figure 9. The workability of the mixes was affected by incorporating the POC coarse. Increasing the substitution ratio of POC decreased the workability of the mix. The mixes up to a 40% replacement of POC achieved the target slump range of 100 ± 25 mm. Meanwhile, the mixes with more than 40% of POC coarse were found to be less cohesive, having a high segregation and being somewhat harsher than the corresponding conventional concrete. The reduction of workability can be attributed to the particle shape and rough surface, as well as the sharp broken edges of POC. The irregular shape of POC resulted in a higher surface area increasing the demand for extra paste volume to ensure a good workability and to avoid segregation. Based on the experimental study by Koehler and Fowler (2007) [15], they concluded that the workability of a mix is a function of the aggregate characteristics, the paste volume, and the rheology of the paste. However, it is obvious that the workability of the POCP concrete was improved when the addition of POCP was used as a filler material to fill up the voids of POC particles. The observed improvement in workability can be partly attributed to the higher paste volume that makes the concrete cohesive enough to be handled without segregation or bleeding. The POCP helped to coat the POC particles, filling the gaps between the aggregates, thereby providing a better chance for aggregate lubrication. It can be seen that the mixes incorporating a higher content of POC coarse tend to require a higher POCP content to give extra lubrication to the POC aggregate, as well as higher dosages of SP to make the mixes more cohesive and to achieve target slump range of 100 ± 25 mm.

6.2. Fresh Density

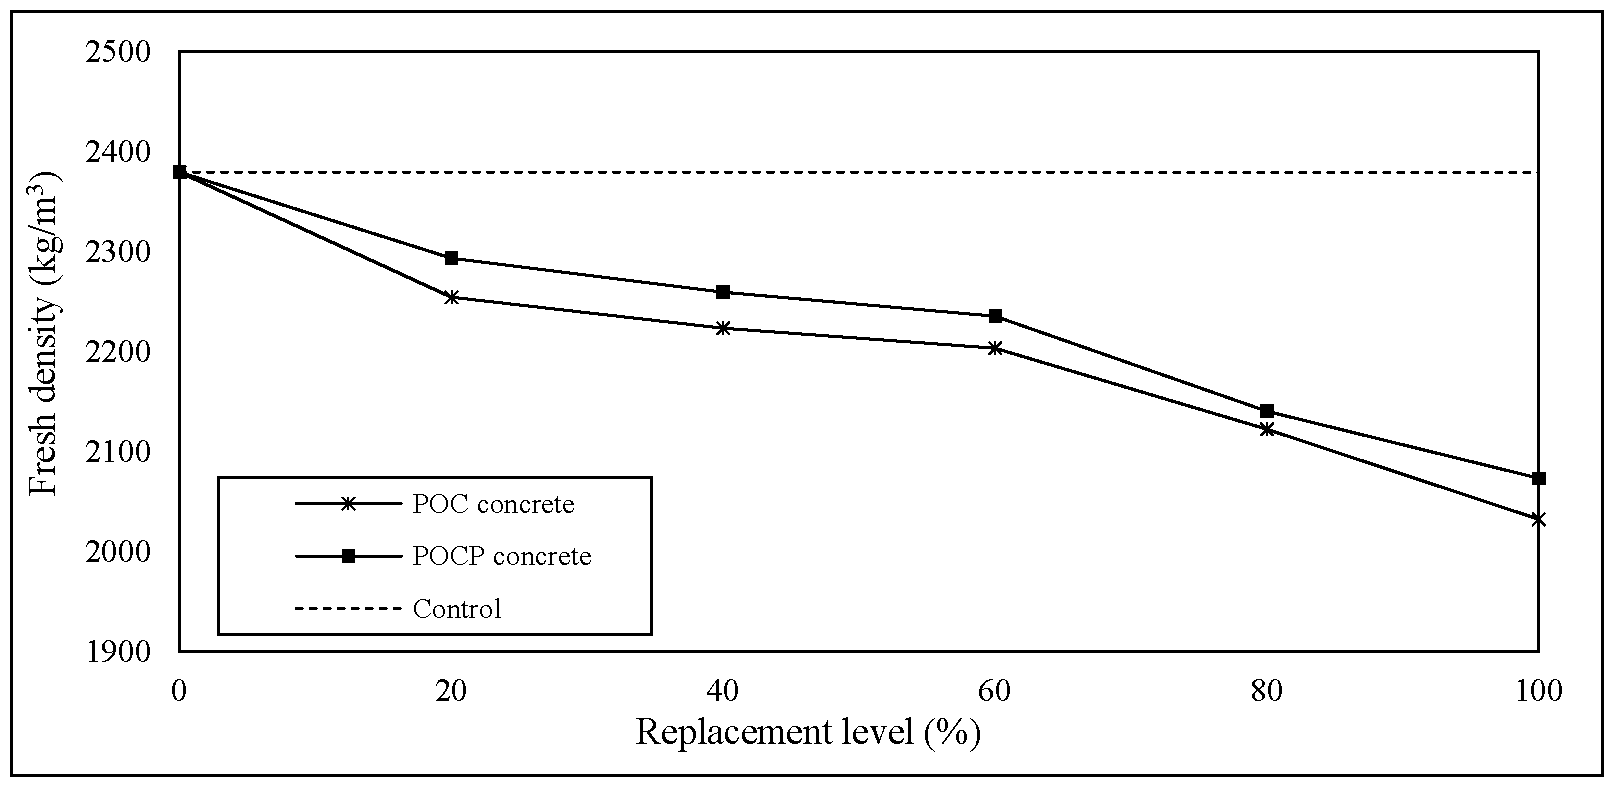
The fresh density of the POC and POCP concrete, respectively, ranged from 2032 to 2293 kg/m3, as shown in Figure 10. The unit weight of the concrete with POC aggregates is inversely proportional to the replacement level. Increasing the amount of POC in the mix reduced the unit weight of the concrete. The maximum reduction of fresh density was at full replacement, which registered a value of 14% less than that of normal concrete i.e., 2379 kg/m3. The low bulk density of the POC coarse resulted in the reduction of the unit weight of the POC concrete. The existence of a large number of voids and pores contributed significantly to the light nature of the POC aggregate. Kanadasan and Razak [16] reported that the lower unit weight, coupled with the porous nature of the POC aggregate, directly resulted in a lower mass per volume of POC Self Compacting Concrete (SCC) Their results revealed that a full replacement of POC produced a concrete with a density of less than 2000 kg/m3, which is approximately 16% lower than the control mix.

6.3. Compressive Strength

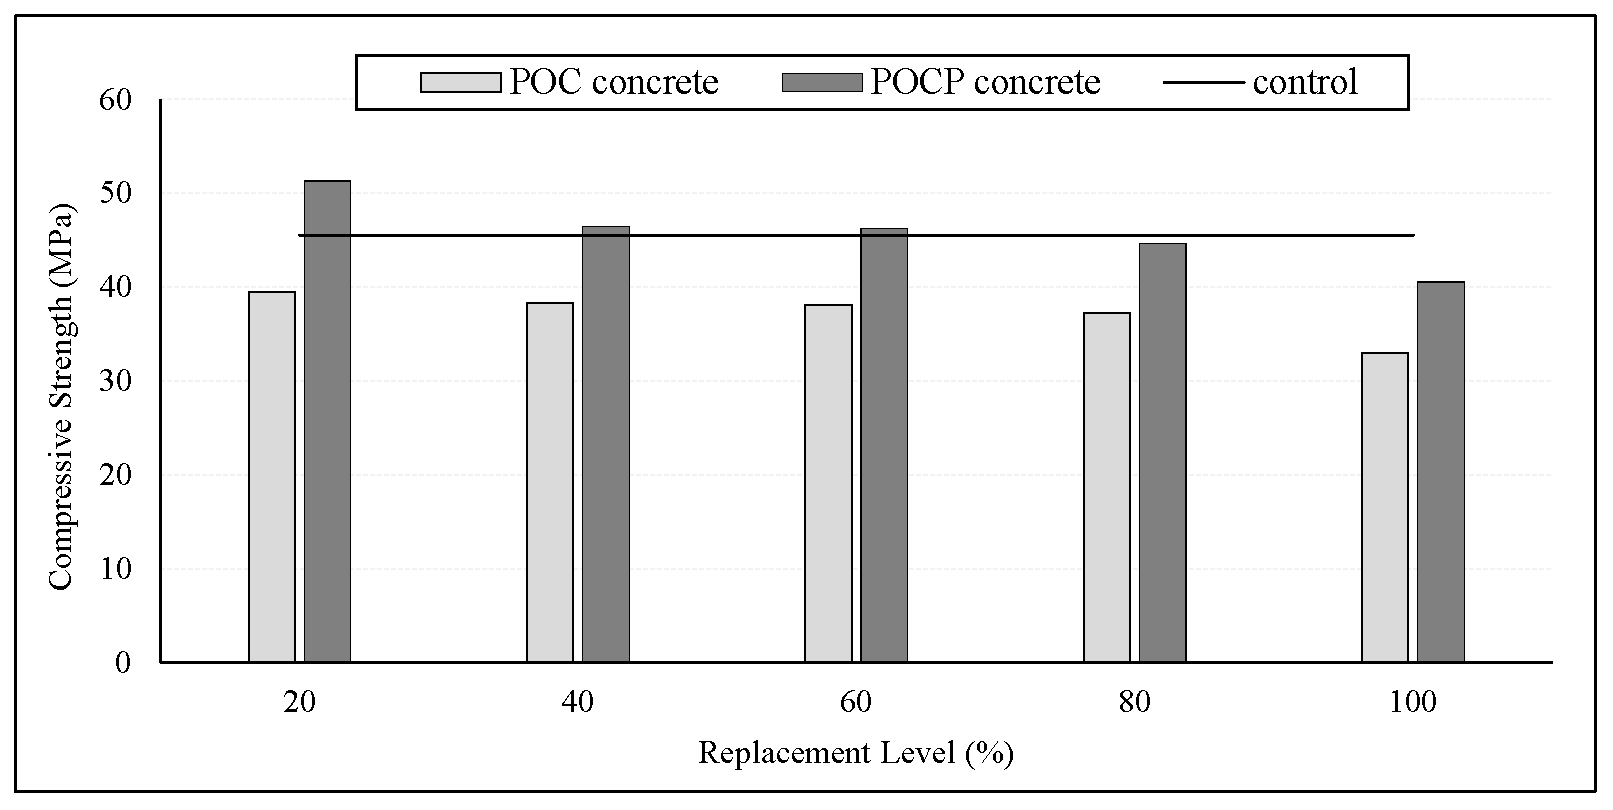
The compressive strength of the concrete was determined in accordance with BS EN 12390-3. In general, there was reduction in compressive strength when the POC coarse aggregate was used. The concrete strength was lower when the volume of the POC was higher than the volume of the conventional aggregate. At 28 days, the compressive strength of the POC concrete ranged between 33 and 39.45 MPa. The maximum reduction in strength was at full replacement of POC, i.e., approximately 30% lost with respect to the control concrete. The strength and stiffness of POC was much lower than the normal coarse aggregate due to its porous property, which significantly affected the concrete’s strength carrying capacity. This is also attributed to the fact that less matrix is available to fill the pores within the POC aggregates, leading to a higher total porosity in the concrete as observed in Figure 11. Abutaha et al. (2016) [17], and Ibrahim et al. (2017) [18] reported that the porosity of POC and the lower aggregate crushing value negatively affected the compressive strength when compared to the control mix. This also corroborates the results of the study by Rashid et al. (2012) [1] on the utilization of LWA from waste material by using crushed clay bricks as a coarse aggregate replacement. The study reported that the replacement resulted in a strength reduction of 9.6% and 32.9% at 50% and 100% replacement levels, respectively. Furthermore, lightweight concrete incorporating aggregate made from sewage sludge waste showed good hardened properties whereby they were able to produce 73% of the strength when compared to that of the control concrete [19]. However, it can be observed in this study that a significant reduction in the compressive strength was avoided with the use of POCP as a filler material to fill the voids of POC coarse. Additionally, POCP significantly improved the compressive strength of the POC concrete by providing a sufficient amount of paste to coat the POC surface voids.
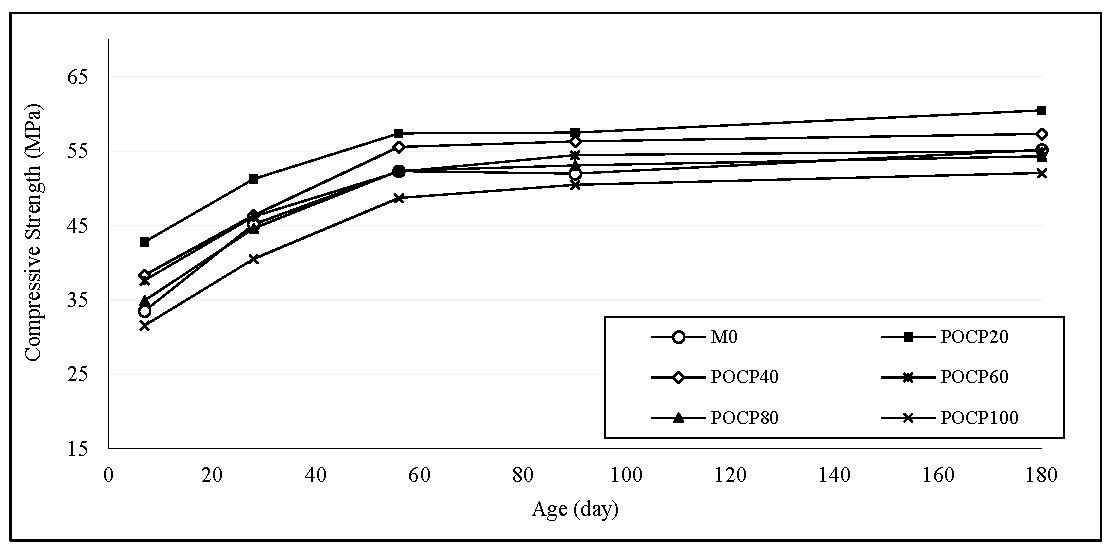
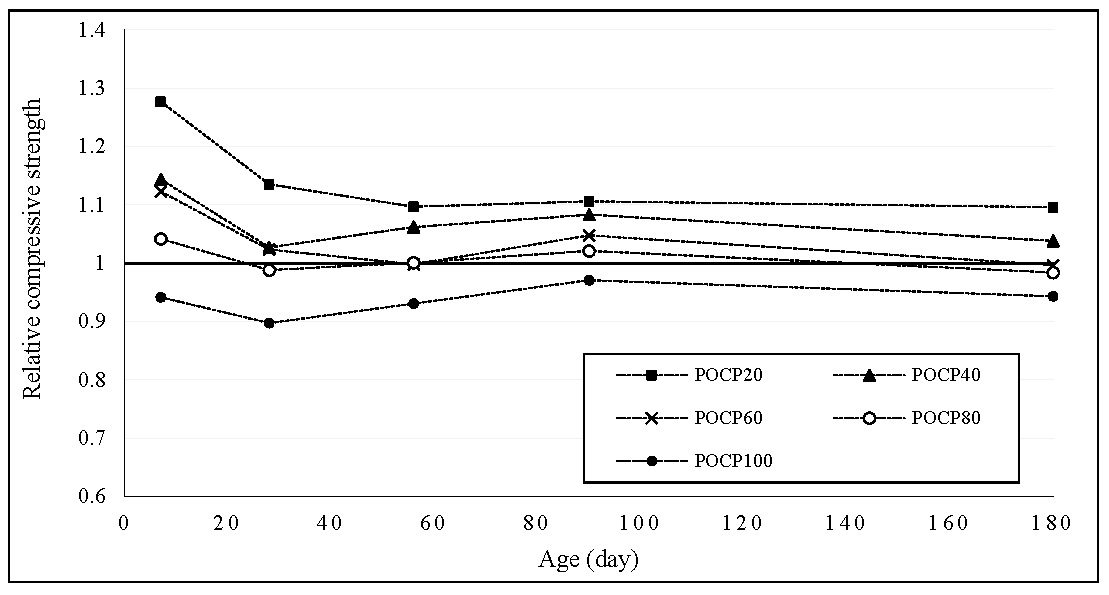
The influence of the additional POCP on the compressive strength of the POC concrete mixes is plotted in Figure 12. At 28 days, the POCP concrete had compressive strength values ranging between 40.52 and 51.27 MPa with maximum strength obtained at 20% POC coarse replacement. Compared to the mixes without POCP (pre-coating), the strength increased by 20% to 30%. Figure 13 illustrates the development of the POCP concrete strength. Figure 14 shows the variation of relative strength, which can be defined as the ratio of the tested specimen strength to that of control at the same age. For all replacement levels, the maximum relative strength occurred on the 3rd day for the mix of POCP20, and decreased until it reached a relatively constant value at 56 days and beyond. At a 20% replacement of POC coarse, the compressive strength improved due to the lesser percentage of POC in the mix when compared to the other replacement levels. Therefore, the effect of ACV of POC on the compressive strength of the concrete was not pronounced. The combined effect of POCP and the low percentage replacement of POC coarse ensured that POCP20 exhibited superior properties as compared to other replacement levels. However, at the age of 28 days, the mixes with up to an 80% replacement ratio of POC coarse exceeded the control strength. Meanwhile the mix at full replacement achieved 90% of the control strength, which continued to increase with age until it became close to the control strength value after 90 days, as shown in Figure 14. These results indicate that the inclusion of POCP gave a tremendous contribution to the strength property of the POC concrete. Thus, the finer POCP particles have better voids-filling ability, resulting in low void space that leads to a higher compressive strength. Furthermore, the use of superplasticizer also increases the strength by lowering the quantity of mixing water and increasing the flowing ability. It also contributed to achieving denser packing and a lower porosity of the concrete, and thus assisted in producing a higher strength and good durable concrete.

6.4. Splitting Tensile Strength

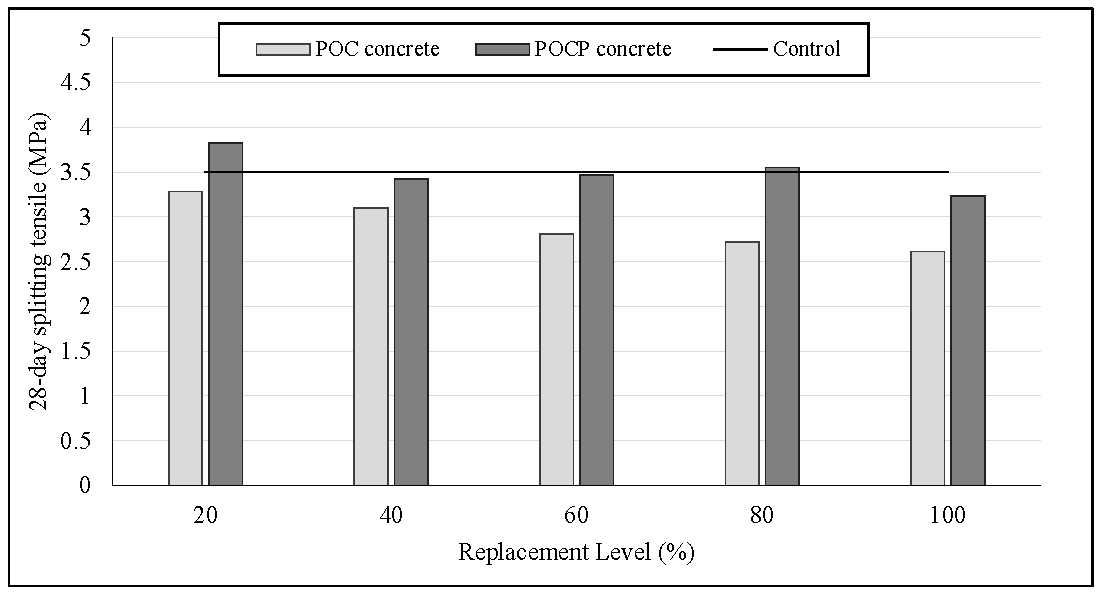
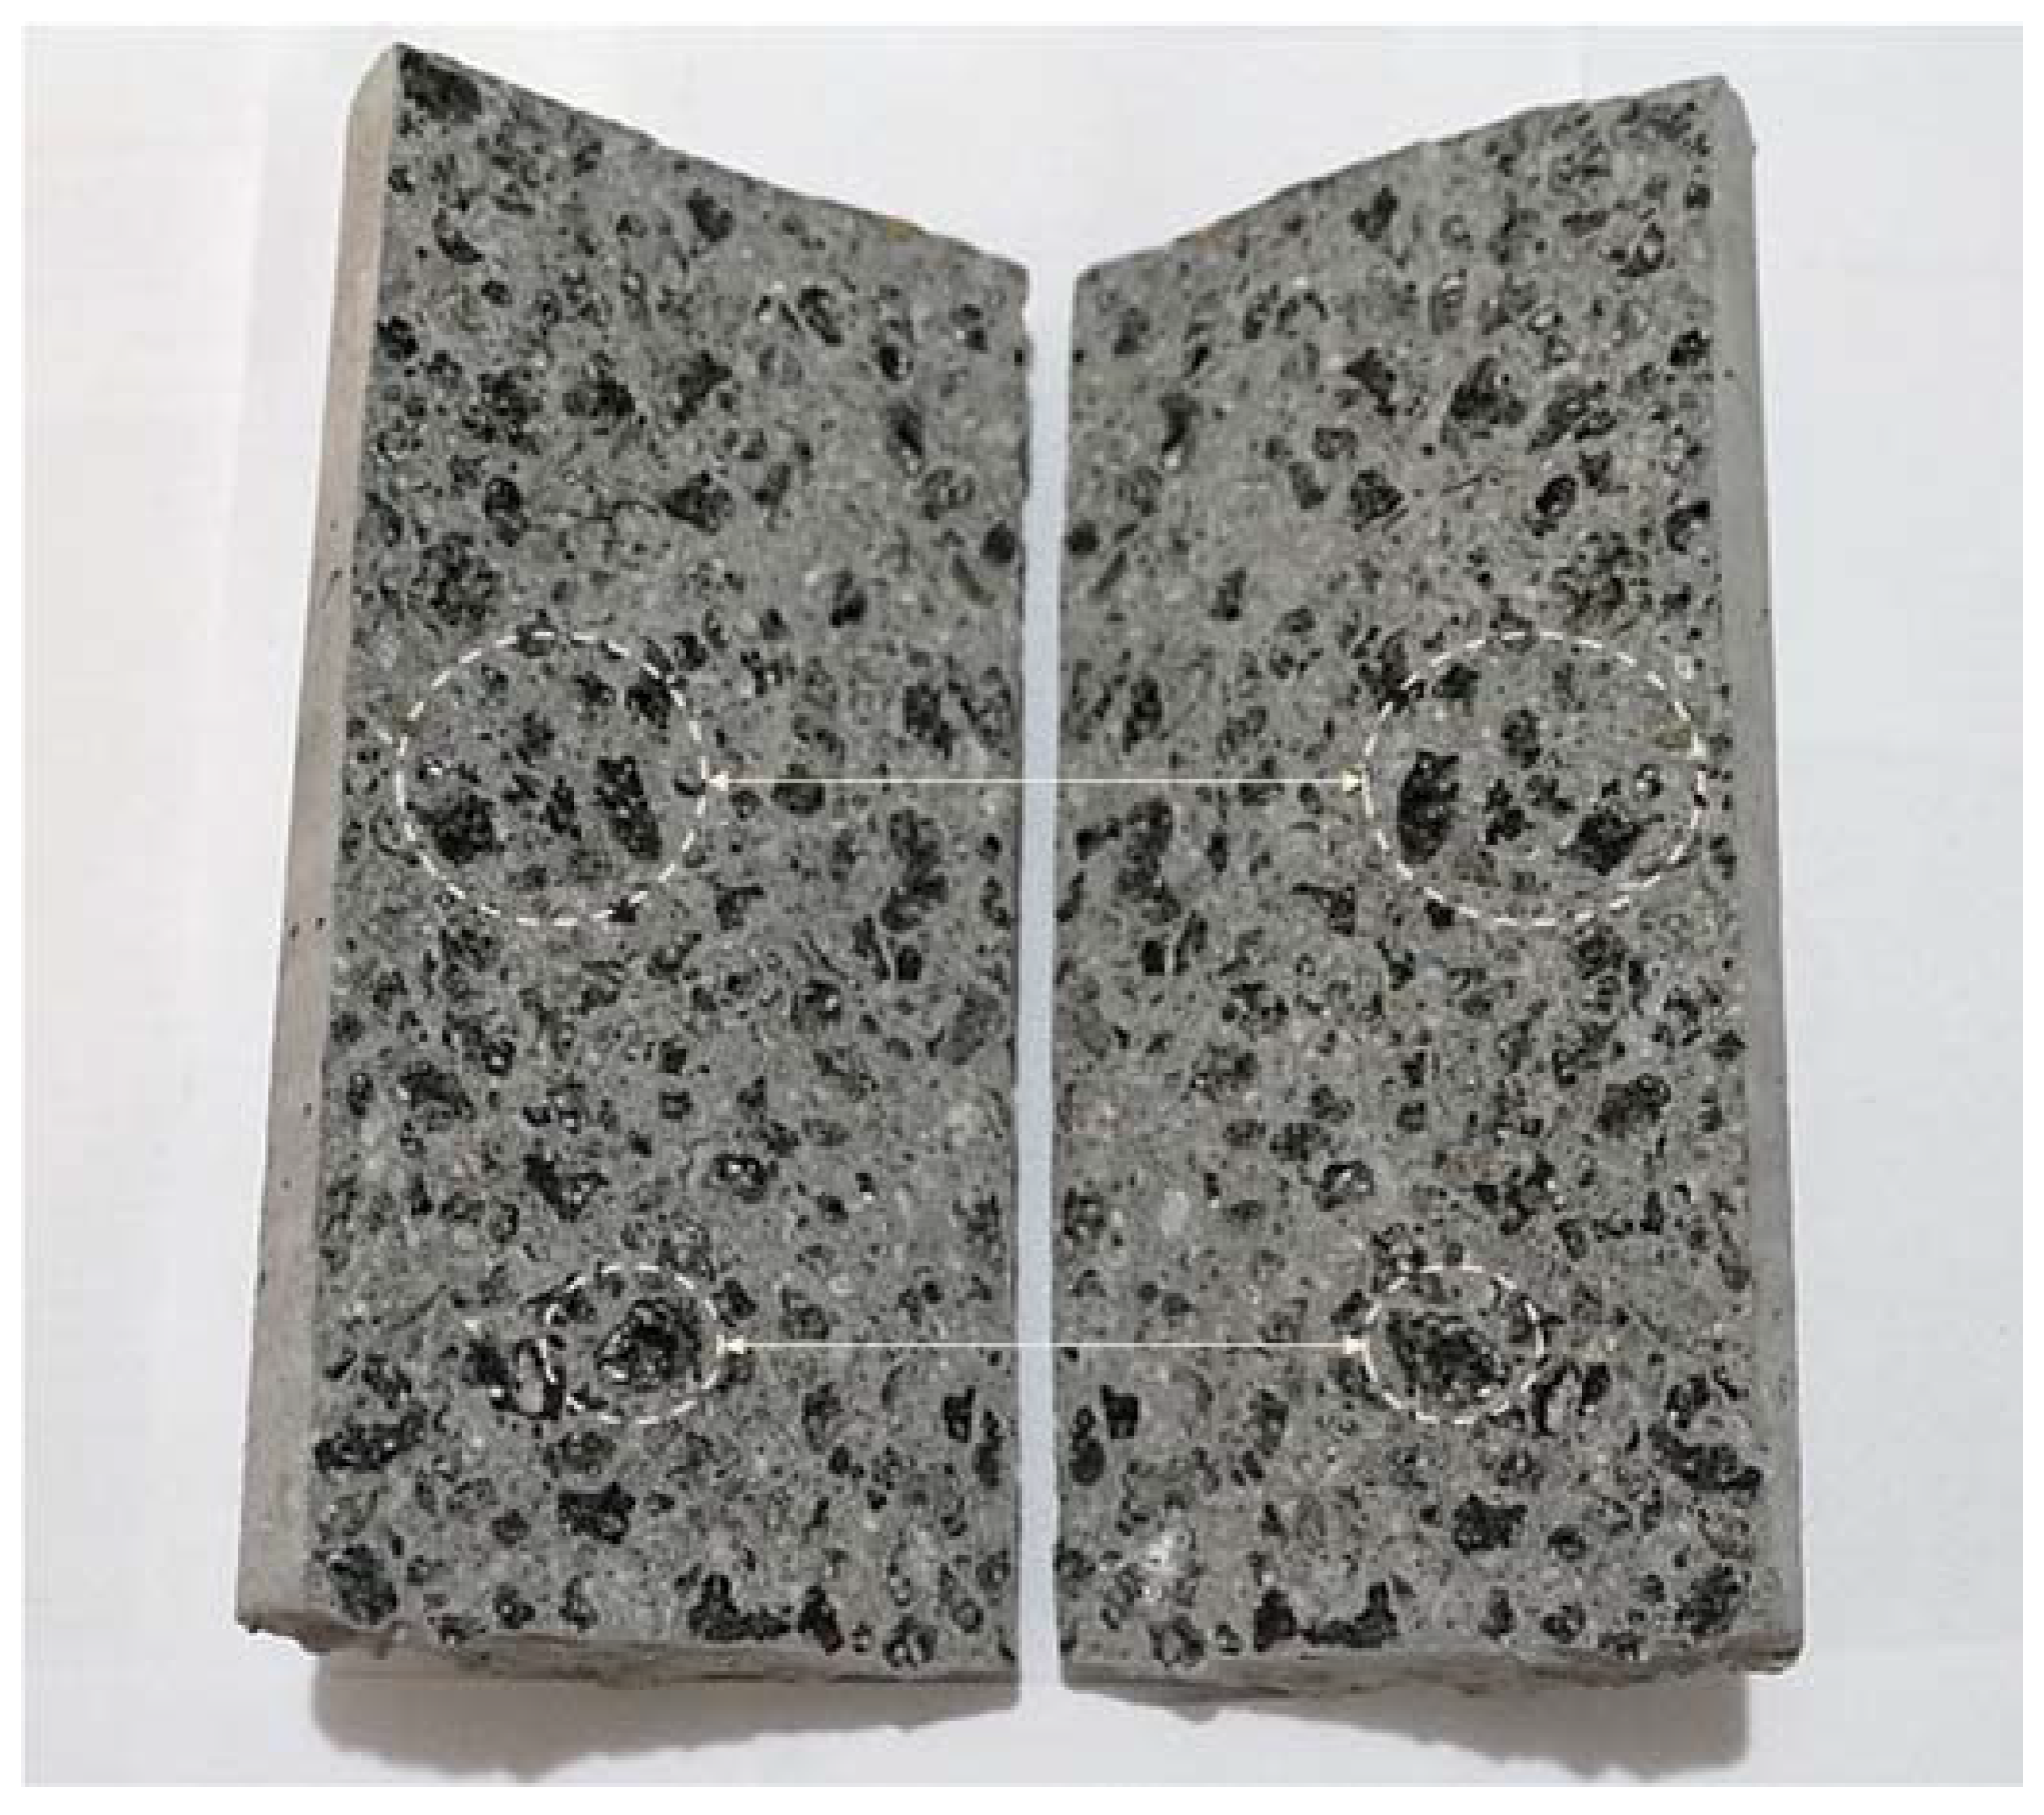
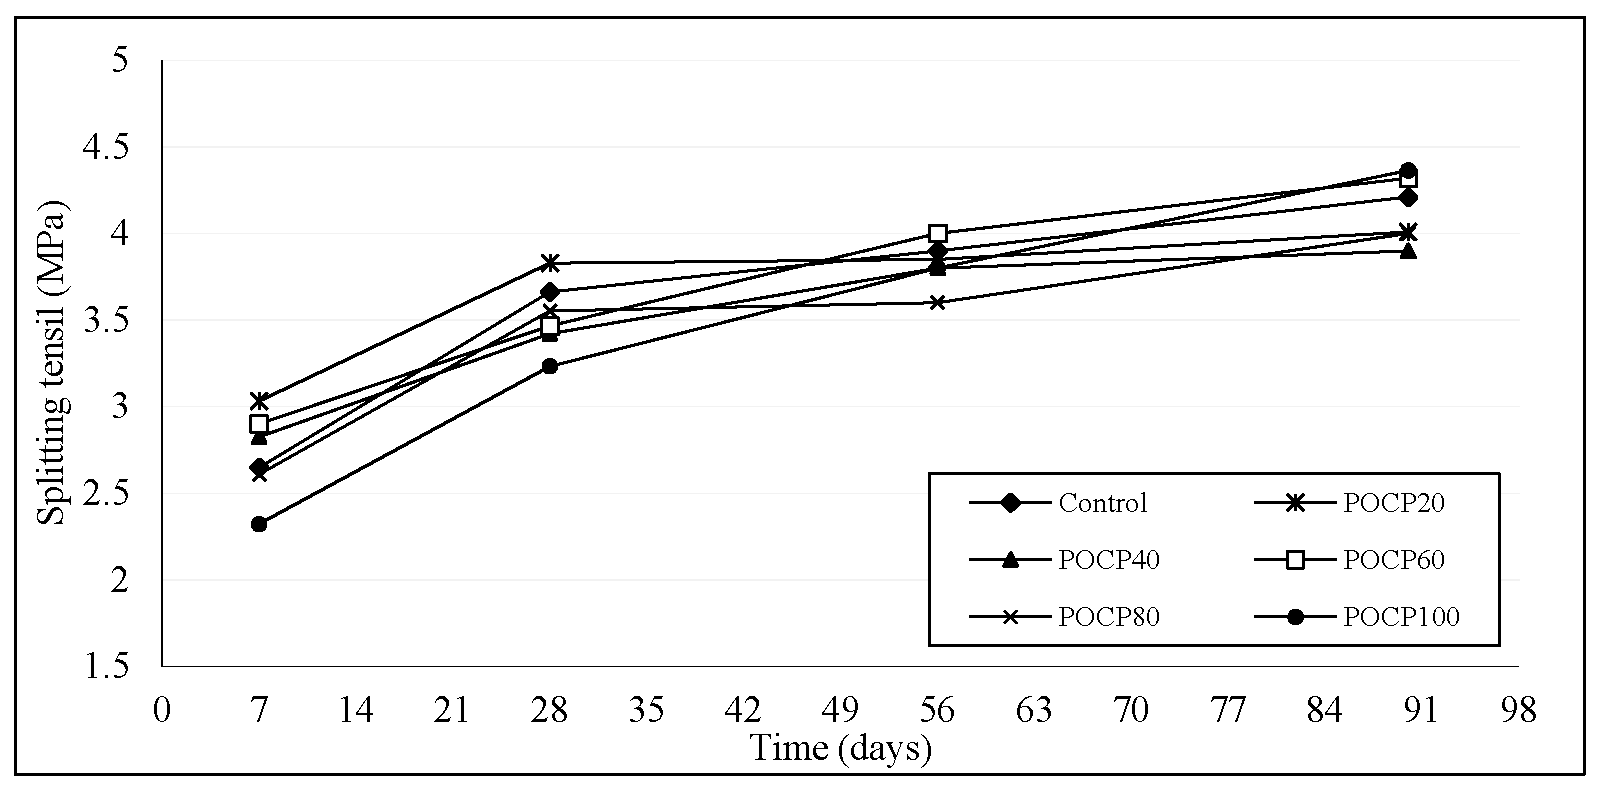
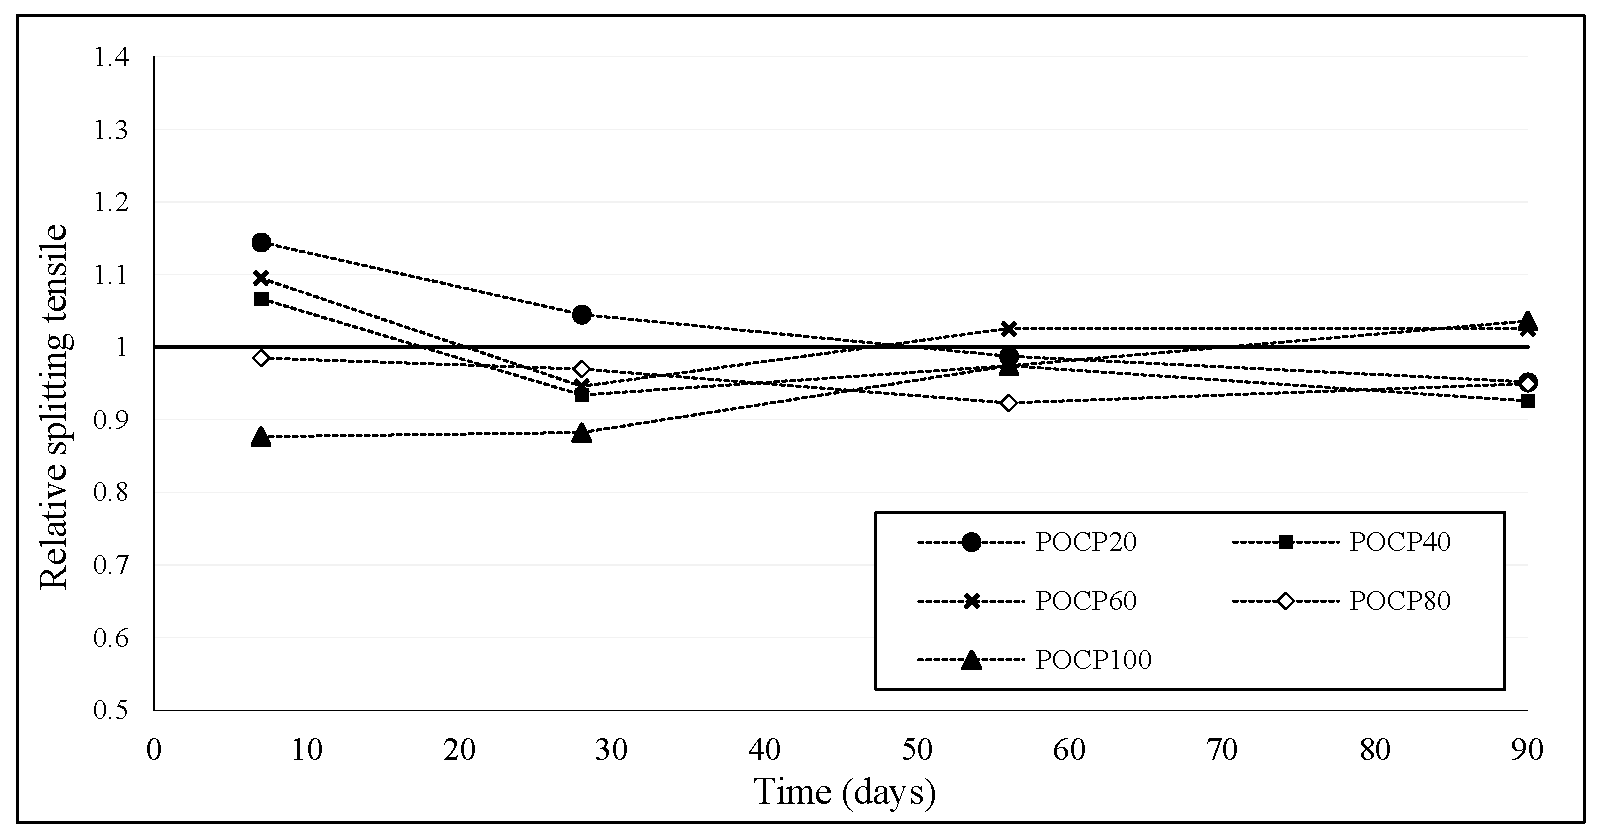
A splitting tensile strength test was carried out in accordance with BS 1881: Part 117 on a cylinder of (100 mm diameter × 200 mm length) at the age of 7, 28, 56, and 90 days. Splitting tensile strength results of the POC concrete generally showed a trend similar to that observed in the compressive strength. The replacement of POC with natural coarse aggregate led to a reduction in the splitting tensile property, as shown in Figure 15. The higher the contents of the POC coarse, the lower the splitting tensile value. At 28 days, the splitting tensile of the POC concrete was in the range of 2.61 to 3.28 MPa. The maximum reduction was at the full replacement of POC, which registered a value of 27% lower than the control concrete. During the visual examination of some broken specimens, as shown in Figure 16, the failure of the specimen was mainly due to the breaking of POC particles, while the bonding between the hardened cement paste and POC remained good. As such, the failure occurred through the POC coarse, which is weaker as compared to the concrete matrix and the aggregate-matrix interface. Meanwhile, at 28 days, the POCP concrete recorded an increase of between 10% and 31%, with respect to POC concrete mixes, while the splitting tensile values were in the range of 3.23 to 3.83 MPa. The development of the splitting tensile strength of the POCP concrete mixes up to 90 days is presented in Figure 17. All of the mixes had tensile strength values close to that of the control mix at different ages, and no trend was found linking this property with the replacement ratio of POC. The maximum strength reduction of the POCP concrete was at full replacement, which registered a value of 11% lower than the control mix. However, it became closer to the control at the age of 90 days as shown in Figure 18.
Nevertheless, the obtained tensile strength of the POCP concrete was always higher than the minimum recommended by ASTM C330 for structural lightweight concrete, which is 2 MPa. Previous studies [20,21,22] reported that the 28 days splitting tensile strength of lightweight concrete ranged between 1.10 and 2.41 MPa for moist cured concrete. In general, lightweight concrete with cube compressive strengths of 50, 40, and 30 MPa has a splitting tensile strength in the range of 2.5–3.8, 2.2–3.3, and 1.8–2.7 MPa, respectively [23]. However, the measured splitting tensile strength of POCP concrete in this study was in the range of 3.23–3.82 MPa at 28 days, which is higher than the values reported in previous studies on lightweight concrete.
The relationships between compressive strength, flexural, and splitting tensile strength at 28 days are tabulated in Table 5. In general, the splitting tensile strength for normal weight concrete ranges from 8% to 14% of its compressive strength [23]. The splitting/compressive strength ratio for normal weight concrete is higher when compared to the lightweight concrete [24]. Holm (2000) [25] reported that lightweight concrete that is moist cured has a splitting tensile strength of generally between 6% and 7% of its compressive strength. However, at the age of 28 days, the splitting tensile strength of the POCP concrete in this study ranged from 6.5% to 8% of the compressive strength. This is similar to the tensile/compressive strength ratio ranging from 6.6% to 9% of the lightweight concrete made with an artificial lightweight aggregate, as reported by Haque (2014) [24].
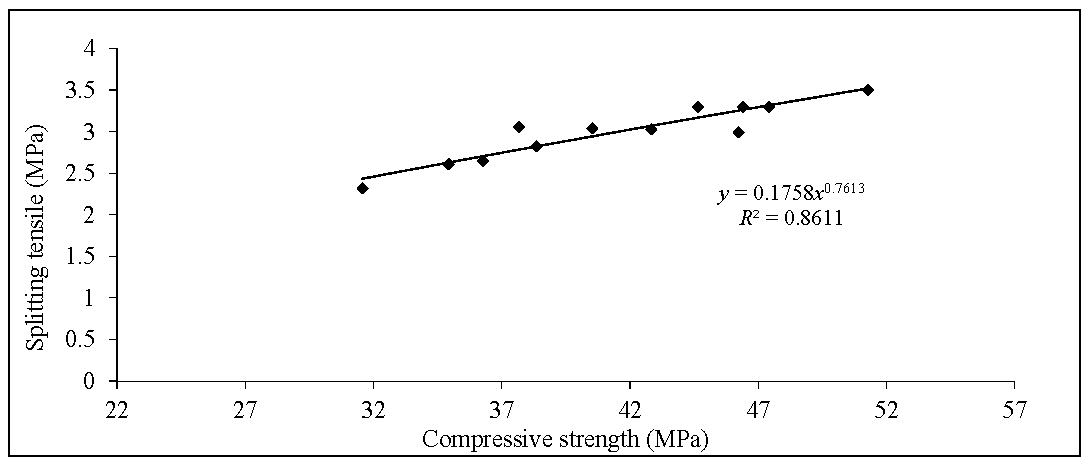
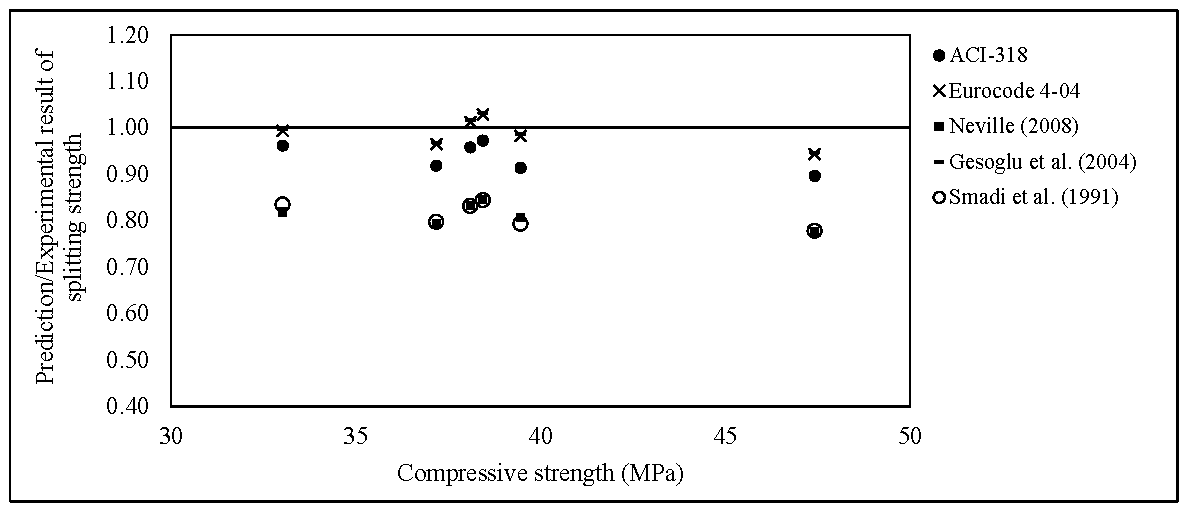
A parabolic relationship with a correlation coefficient of 0.86 was observed between the 28-day compressive strength and splitting tensile of the POCP concrete, as shown in Figure 19. Figure 20 shows the comparison between the splitting tensile strength predicted by various equations listed in Table 6 and the experimental values. Equation (1) was proposed based on the results in this study for the POCP concrete. All equations with their descriptions are tabulated in Table 6. It can be seen that the equation of POCP concrete in this study is different from the equations proposed in previous studies due to the usage of a different type of aggregate in the mixtures and its physical properties. Additionally, Figure 20 revealed that the predicted splitting tensile from compressive strength of the POCP concrete is close and comparable with the Equations of (2) and (6), and overestimation than that of Equations (3)–(5).

6.5. Flexural Strength

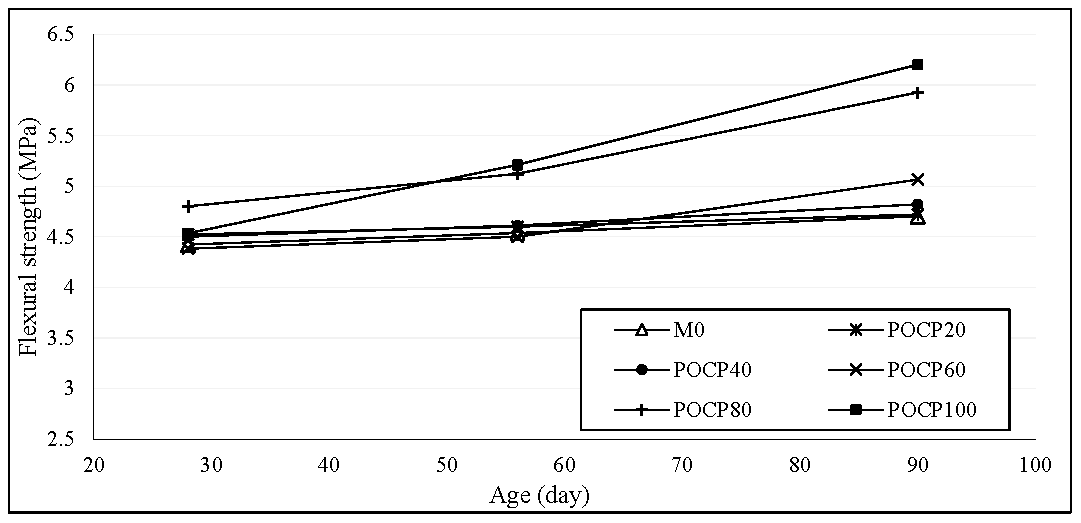
A flexural strength test was carried out in accordance with BS1881: Part 118. The flexural strength results of the POC and POCP concrete, respectively, revealed that as the POC coarse content increased, the flexural strength decreased, as shown in Figure 21. All POC concrete have slightly lower flexural strength values when compared to that of the control concrete. At 28 days, the flexural strength of the POC concrete was in the range of 3.75 to 4.42 MPa. The maximum reduction was at full replacement, with approximately 15% lower than the control concrete. However, a significant increase in the flexural strength was achieved with the use of POCP in the POC concrete mixtures. The improvement was in the range of 5%–25% higher when compared to the POC concrete (pre-coating). Figure 22 illustrates the flexural strength development with curing age of POCP concrete mixes of up to 90 days. Flexural strength of the POCP concrete at different ages ranged from 4.01 to 6.15 MPa, and it was always higher than the control mix value at a specific age. Previous studies [20,21,30,31] also revealed that lightweight concrete has flexural strength in the range of between 2.13 and 4.93 MPa. Shetty (2005) [32] reported that for concrete with a compressive strength of 25 MPa and above, under continuous moist curing, the flexural strength is generally within the range of 8% to 11% of its compressive strength. Teo et al. (2006) [21] showed that the flexural strength varied in the range of 8% to 13% of the compressive strength. As stipulated in Table 5, the POCP concrete had a ratio in the range of 9.8–11.2 for flexural to compressive strength. This result is in good agreement with conventional values derived for concrete made with natural aggregates.

6.6. Modulus of Elasticity

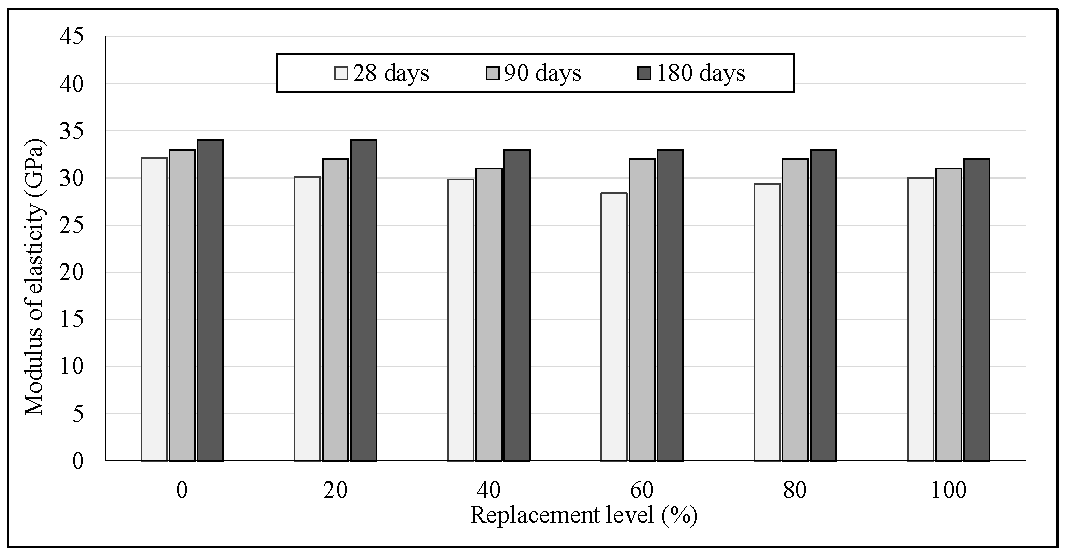
Modulus of elasticity (MOE) was conducted according to BS 1881: Part 121 on the cylinder specimens with a dimension of 150 mm diameter × 300 mm length. The results of the MOE of the concrete specimen containing different replacement levels of POC coarse with and without POCP are shown in Figure 23. Both POC and POCP concrete had a 28-day MOE ranging between 22 and 32 GPa, and the 28-day compressive strength ranged between 33 and 51 MPa. The incorporation of POC coarse negatively affected the MOE values of concrete. The results revealed that the MOE of the POC concrete was 9% to 31% lower than the control mix. Often, the quality of the coarse aggregate greatly affects the elastic modulus. A comparison between the MOE values of the POC and POCP concrete before and after coating at 28 days showed that the addition of POCP had a significant effect on the MOE of the POC concrete. POCP concrete had a 28-day MOE range between 28 and 32 GPa, which is 14%–46% higher than that of POC concrete (pre-coating). Furthermore, the addition of POCP resulted in the decreasing of the water to powder ratio, which benefited the elastic modulus property. Krizova et al. (2004) [33] studied the influence of the water-binder ratio on the static modulus of concrete and reported that using a lower volume of mixing water reduced the number of cracks created by drying, and consequently improved the elastic modulus.
The increase in the MOE values of the POCP concrete with respect to the POC concrete mixes can also attributed to the enhancement of the interfacial transition zone. Domagała et al. (2011) [34] reported that for LWAC, a strong bond was formed between the cement matrix and aggregate due to the higher water absorption of LWA and its rough texture, resulting in a higher modulus of elasticity. Also, the rough surface texture further ensured that the bond between the surrounding hydrated cement paste and aggregate was better, thus improving the mechanical properties of the concrete [34]. The development of the MOE values of the POCP concrete up to 180 days is shown in Figure 24.
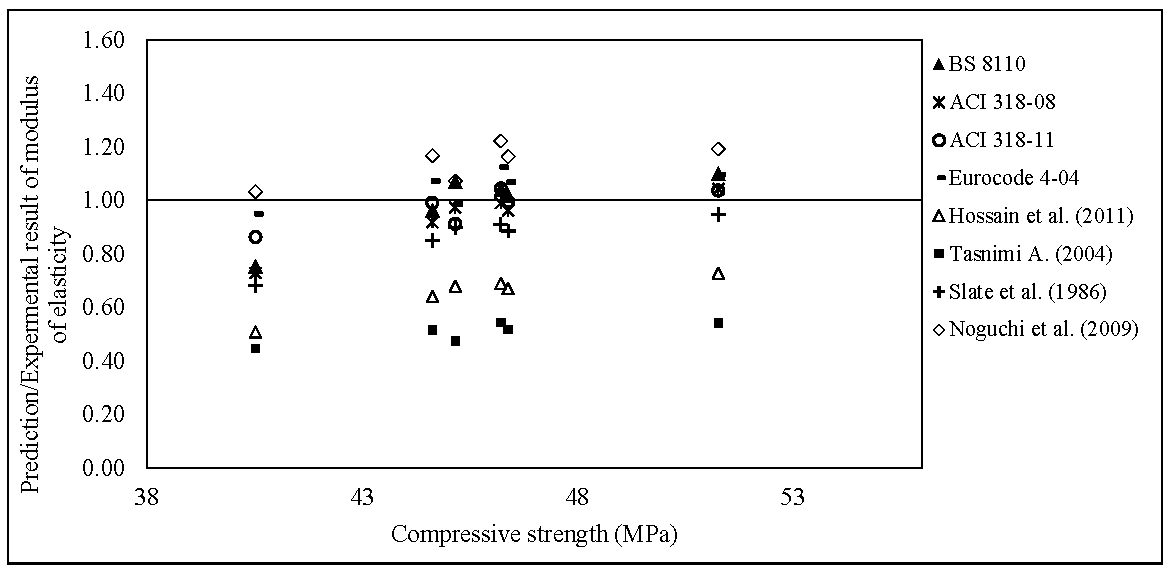
Various standards relate the MOE of concrete to its compressive strength and density. Figure 25 shows a comparison of the MOE value of the POCP concrete in this study with those predicted by various equations given in Table 7. The formulas presented in ACI 318 [35] defines this relationship in terms of either the square root of compressive strength or the combination of density and the square root of the compressive strength in Equations (8) and (9), respectively. This is applicable for density levels of 1440–2480 kg/m3 and strength levels of 21–35 MPa. Hossain et al. (2011) [36] proposed Equation (11) based on data for lightweight concrete incorporating pumice with 28-day density ranging between 1460 and 2185 kg/m3. Meanwhile, a cylinder compressive strength of 16–35 MPa. Equation (12) was proposed by Tasnimi (2004) [37], who presented information on artificial LWA concrete with a cylinder compressive strength of about 15–55 MPa.
As shown in Figure 25, among all of the equations, the MOE values of the POCP concrete at 28 days was close to and comparable with the values calculated using Equations (7), (8), and (10) as recommended by BS 8110, ACI 318 [35], and Noguchi et al. (2009) [38], respectively, for predicting the elastic modulus MOE of concrete in terms of its compressive strength and density. While the other equations underestimated the MOE values.

6.7. Water Absorption

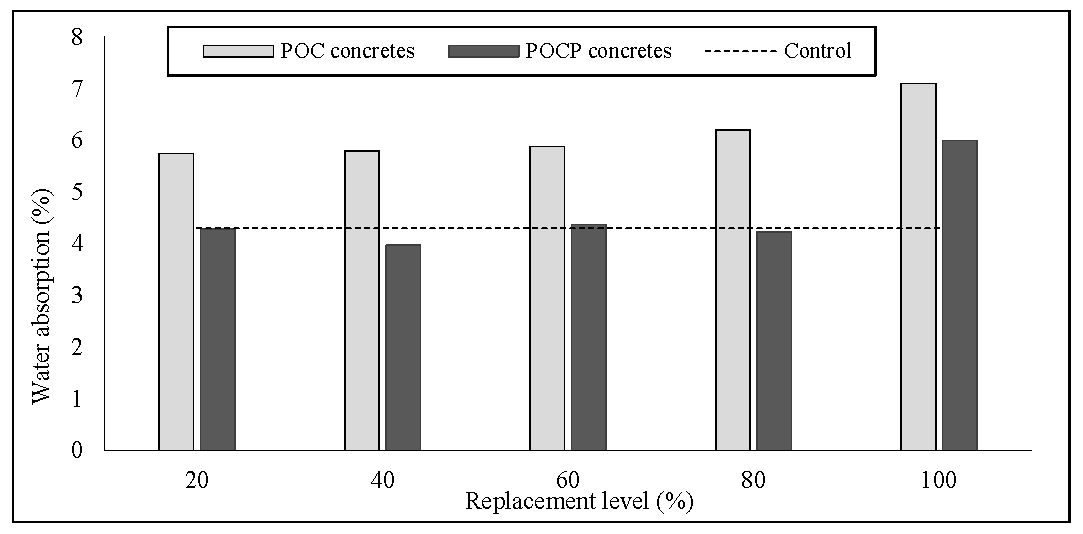
The water absorption was carried out according to BSI 1881-122 [42]. Figure 26 shows the percentage of water absorption of the POC and POCP concrete specimens, as well as for the control concrete at 28 days. It is obvious that at the same w/c ratio of POC concrete mixes, the water absorption was higher than the control mix and tends to increase with the increasing volume of POC contents. At 28 days, the water absorption of the POC concrete was in the range of 35% to 80%, higher than that of the control mix. The water absorption has a direct relationship with the voids, the absorption increased as the voids increased [43]. A similar trend was observed in the results obtained by Teo et al. (2010) [44], which indicated that the high porosity of OPS aggregate increased the water absorption of the concrete as compared to the conventional concrete, like other lightweight aggregates concrete.
The lower porosity of the granite aggregate in the normal concrete mixture restricts the rate of water absorption as compared to the POC concrete. Most artificial lightweight concrete exhibits significantly higher water absorption than normal weight concrete [20]. Topcu (1997) [45] is of the idea according to the result of his own study that there is a parabolic connection between water absorption and concrete density, “the lower the concrete density, the higher water absorption capacity”. However, the values of water absorption of the POCP concrete mixes are comparable to the natural aggregate concrete. The addition of POCP resulted in a decrease in the value of water absorption. At 28 days, the reduction was in the range of 15% to 32% with respect to the POC concrete. The increase of POCP content was advantageous to the concrete and resulted in a more condensed microstructure. The low water absorption of the POCP mixes is also attributed to the denser interfacial zone between the aggregate and mortar matrix with respect to that of the POC concrete mixes.
Moosberg et al. (2004) [46] reported that the physical effect of the mineral admixture on the concrete properties occurred as a result of pervading the fillers into the void between the cement particles. Therefore, the incorporation of POCP has a similar effect to the mineral admixtures in the concrete, by reducing the pore size, which resulted in highly densified paste. As such, the concrete water absorption decreased. It is also obvious that SP played an important role in enhancing the fluidity of the POCP concrete mixes and maximized the compaction subsequently resulting in the production of a high impermeable concrete. Figure 27 shows the percentage of water absorption of the POCP concrete specimens as well as for the control concrete subjected to 7, 28, 90, and 180 days of moist curing after demolding.

6.8. Drying Shrinkage

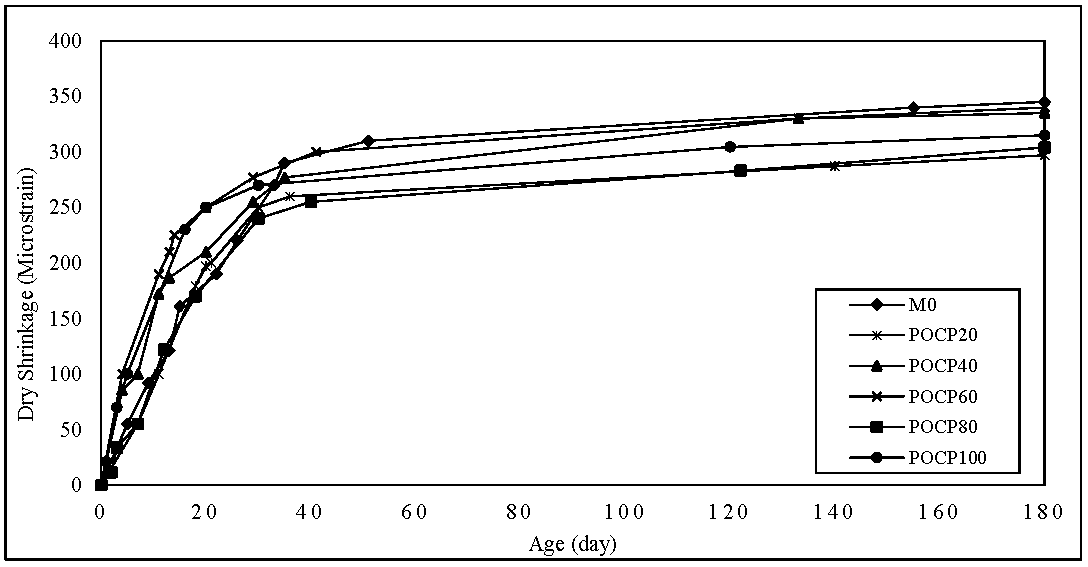
A demountable mechanical strain gauge (DEMEC), with a precision of 1 μm, was used to monitor the total liner shrinkage. The DEMEC was placed over two steel studs at a 200 mm gauge length, which had been glued onto the three as cast surfaces. The development of the shrinkage strains with a drying period of up to 180 days under an initial water curing condition of seven days is shown in Figure 28. The specimens were exposed to uncontrolled laboratory conditions, with humidity ranging between 60% and 85%, and temperature ranging between 26 and 35 °C. The test results showed that the POCP concrete mixes has a lower drying shrinkage strain when compared to the control concrete. Furthermore, the addition of POCP significantly improved the drying shrinkage of the POC concrete. The increase in POCP content resulted in decreased drying shrinkage. Also, it was observed that the mixes with a higher content of POCP have lower a drying shrinkage.
The lower drying shrinkage values of the POCP concrete with respect to the control concrete can be attributed to two main factors. Firstly, the incorporation of POCP reduced the pore sizes in concrete. The transformation of large pores to fine pores decreased the evaporation of water from the concrete surface, and hence, reduced the drying shrinkage strain [47]. Secondly, the quality of cement paste directly influenced the drying shrinkage of the concrete such that the dry shrinkage increased with the increase in water content of the paste [48]. POCP concrete mixes have lower water to powder ratio when compared to the control concrete, which would be expected to cause a lower drying shrinkage strain. In general, it was observed that the difference between all of the mixes shrinkage values was not significant at a specific age.

6.9. Chloride Permeability

According to the ASTM C1202 test, a concrete specimen of 50 mm thick and 100 mm diameter is subjected to a 60 V applied DC voltage for 6 h using the apparatus shown in Figure 29. 3.0% NaCl solution was filled in one reservoir while in the other reservoir is a 0.3 M NaOH solution. The total charge passed was determined and this was used to rate the concrete according to the criteria given in Table 8.
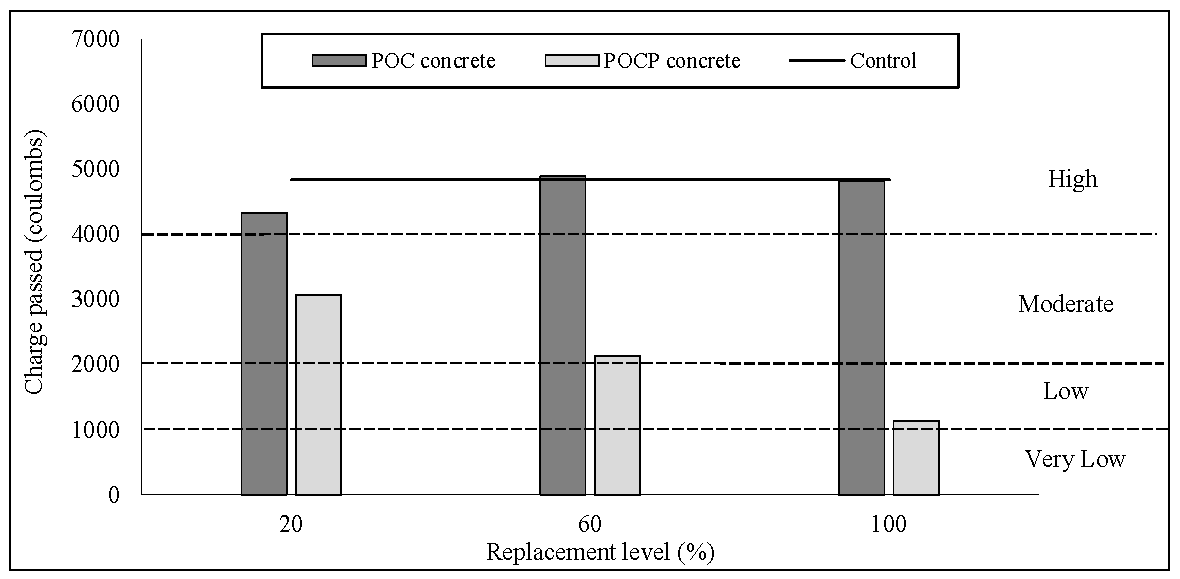
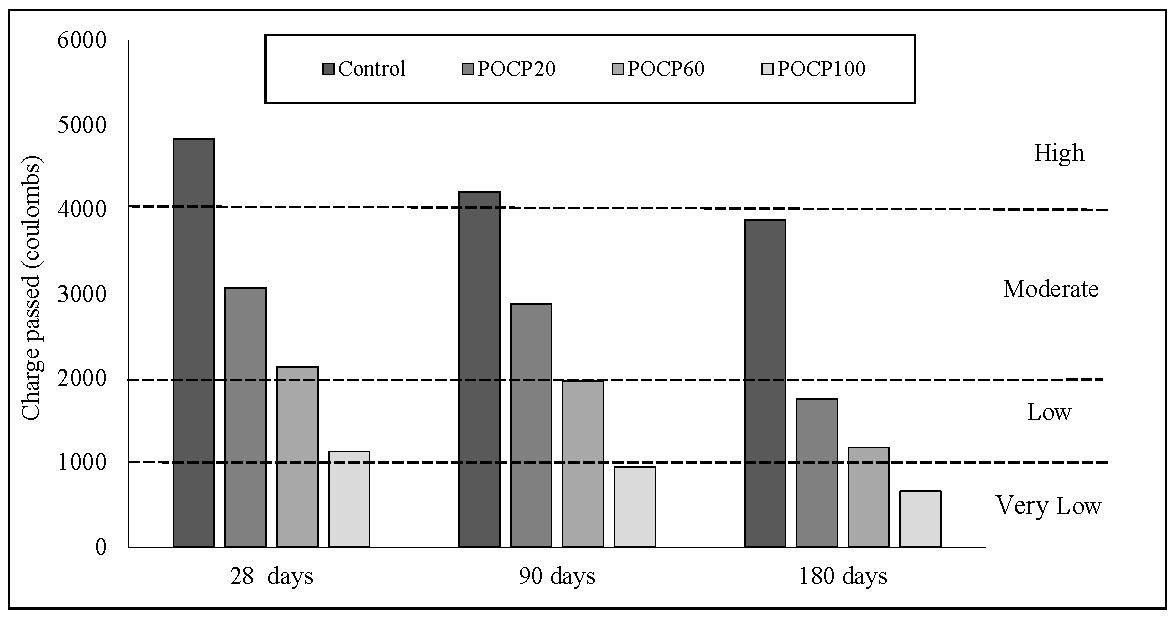
Rapid Chloride Permeability Test (RCPT) was conducted to investigate the performance of the concrete mixes against chloride ingress. The lower the total charge passed through the concrete matrix, the higher the resistance to chloride penetration. RCPT was conducted for the mixes containing a replacement of 20%, 60%, and 100% of POC coarse before and after coating as well as for the control concrete. The charged passed was obtained by measuring an average of three samples at the ages of 28, 90, and 180 days. According to the ASTM rating standard, the control concrete suffered high chloride-ion penetrability at the ages of 28 and 90 days since the charge passed was higher than 4000 coulombs. Meanwhile, at the age of 180 days, the control concrete showed moderate chloride-ion penetrability. At 28 days, a slight variation in the total charge passed with respect to the percentage of POC coarse replacement was observed, as shown in Figure 30. The chloride ion resistance of the POC concrete mixes was similar and comparable to the control concrete. The total charge that passed through the POC concrete ranged between 4331 and 4895 columns, falling in the range of high chloride penetrability. Similar to the study by Chia (2002) [49] on LWA concrete, the results of the RCPT indicated that the electric charge passed through the LWC was in the same order as those through the corresponding normal weight concrete (NWC). Furthermore, the water to cement ratio is one of the main factors affecting the total charge passing through the concrete specimens. All of the POC concrete, including the control mix, had the same water to cement ratio of 0.53. Therefore, the total charge passed values are expected to be similar for all of the specimens at a specific age. Shi (2003) [50] reported that the water to powder ratio ranging between 0.4 and 0.5 for conventional concrete can achieve a charge passed of 2000 to 4000 coulombs, which is indicated as Moderate. Meanwhile, from the results shown in Figure 31, a progressive reduction was observed in the chloride penetrability from the POC to POCP concrete, respectively. Specimens containing additional POCP exhibited a greater chloride-ion resistance as compared to POC mixes as well as to the control concrete. The chloride ion penetration exhibited a higher reduction for the mixes with a higher content of POCP. At 28 days, the charge passed of the POCP concrete was in the range of 12% to 70% lower than that of the POC concrete. The reason for the significant reduction in chloride ion penetration was due to the low water to powder ratio of the mixes, which made the concrete more densify. Chia (2002) [49] reported that the resistance of concrete to chloride penetration increased with the reduction of w/cm (water to cementitious materials ratio). At 90 and 180 days, the effect of this was even more favorable. POCP concrete exhibited a general downward trend in the amount of electrical charge passed as the age increased.
It is well known that the use of supplementary cementing materials improves pore structure and reduces the permeability of hardened concrete [51]. Smith (2006) [52] presented data that showed that the conductivity of the pore solution could be lowered with the use of mineral admixtures such as ground granulated blast furnace slag (GGBS), fly ash, and silica fume. One of the most important factors affecting the permeability of concrete is the internal pore structure, which in turn is dependent on the extent of the hydration of the cementitious materials [53]. Uysal et al. (2012) [54] reported that the factor that affects the pore system of concrete is the filler effect, which influences the total volume and size distribution of pores, and finally affecting the concrete permeability. Therefore, the incorporation of POCP had similar effect to the mineral admixtures in the concrete by reducing the pore size, which resulted in a highly densified paste and thus lowered the conductivity of the pore solution. The addition of POCP resulted in an increased powder material which is advantageous to the permeability resistance of the ions. Furthermore, the low permeability of chlorides for the POCP concrete can be justified by the low water to powder ratio in the POCP concrete mixes when compared to POC mixes, as well as to the control concrete.

7. Conclusions

Based on the experimental results of this work, the following conclusions can be drawn:
  • POC, being highly porous had a negative effect on the fresh and hardened concrete properties when the coarse aggregate is substituted with POC. However, incorporating additional POCP into the POC concrete mixes resulted in increasing the paste content required to make the mixes more cohesive. POCP together with SP proved to be beneficial to the workability of the POC concrete mixes.
  • In general, there was reduction in the compressive strength when POC coarse aggregate was used. The concrete strength was lower when a higher content of conventional aggregate was substituted with the POC. At 28 days, the compressive strength of the POC concrete obtained was in the range between 33.01 and 39.32 MPa. Meanwhile, a significant reduction in compressive strength was avoided when POC coarse was coated using POCP as a filler material to the surface voids. Thus, the compressive strength of the POCP concrete increased by 20% to 30% compared to the mixes before coating.
  • Splitting tensile strength results of the POC concrete generally showed a trend similar to that observed in the compressive strength. The higher the contents of POC coarse, the lower the splitting tensile value. At 28 days, the splitting tensile of the POC concrete was in the range of 2.61 to 3.28 MPa. The maximum reduction was at full replacement of POC, which registered a value of 27% lower than the control concrete. Meanwhile, the POCP concrete recorded an increased ranging between 10% and 31% with respect to POC concrete mixes (pre-coating).
  • All of the POC concrete mixes had slightly lower flexural strength values when compared to that of the control concrete. At 28 days, the flexural strength of the POC concrete was in the range of 3.75 to 4.42 MPa. The maximum reduction was at full replacement with approximately 15% lower than the control concrete. However, a significant increase in flexural strength was achieved when POCP was used in the POC concrete mixtures. The improvement was in the range of 5%–25% higher when compared to the POC concrete.
  • Incorporation of the POC coarse negatively affected the MOE value of the concrete. The MOE of the POC concrete dropped by 9% to 31% lower than that of the control concrete. However, the POCP concrete had a 28-day MOE values range of between 28 and 32 GPa which was 14%–46% higher than that of the POC concrete (pre-coating).
  • POC concrete mixes had higher water absorption when compared to the control mix and tends to rise with an increasing POC coarse contents. However, the addition of POCP resulted in a decrease in the value of water absorption when compared to the POC concrete by reducing the pore size, which resulted in highly densified paste.
  • Specimens containing additional POCP exhibited a greater chloride-ion resistance as compared to POC mixes, as well as to the control concrete. At 28 days, the charge passed of the POCP concrete was in the range of 12% to 70%, lower than that the POC concrete.
  • The results revealed that coating the surface voids of POC coarse with POCP significantly improved the engineering properties as well as the durability performance of the POC concrete. Thus, using POC as an aggregate and filler material may reduce the continuous exploitation of aggregates from primary sources. Also, this approach offers an environmentally friendly solution to the ongoing problems of palm oil waste material.

Acknowledgments

The authors would like to express their sincere thanks to the Ministry of Education (MOE), Malaysia for the support given through the research grant UM.C/625/1/HIR/MOHE/ENG/56 and Postgraduate Research Grant (PPP)—PG277-2015B.

Author Contributions

Fuad Abutaha designed and performed the experiments under the guidance and supervision of Hashim Abdul Razak. Hussein Adebayo Ibrahim assisted in the experimental works. The manuscript was written by Fuad Abutaha and revised by Hashim Abdul Razak.

Conflicts of Interest

The authors declare no conflict of interest.

Appendix A

Detailed calculation of determine the required POCP using PP method:
  • The void volume (VVoid) using PP method for all the POC concrete mixes is determined by adopting Equations (A1) and (A2). This is represented by the volume of water (VPPwater) required to fill up the PP container for different substitution levels of POC coarse as well as for the control mix. Please change the following equations to be Editable state.
    V V o i d ( m 3 ) = V P P w a t e r
    V V o i d ( m 3 / m 3 ) = V P P w a t e r V c o n t a i n e r = C o l u m n A C o l u m n B
  • Equation (A3) is adopted to determine the percentage of void increment resulting from each replacement level of POC coarse in which the PP control mix void volume (VPPcontrolVoid) is taken as a benchmark.
    V o i d   I n c r e m e n t   ( % ) = V v o i d V P P c o n t r o l V o i d V P P c o n t r o l V o i d × 100
  • Adjust the control paste volume using Equation (A4), multiplying the PP paste volume by the correction factor:
    V C o n t r o l P a s t e = C o r r e c t i o n F a c t o r × V P P c o n t r o l P a s t e
  • The total paste volume required for different substitution level of POC concrete (VTotalPaste) is calculated using (Equation A5) by increasing the control cement paste volume (VControlPaste) with the percentage of void increment obtained in Equation (A3).
    V T o t a l P a s t e = V C o n t r o l P a s t e + ( % o f   V o i d   I n c r e m e n t ) × V C o n t r o l P a s t e
  • The volume of the additional POCP (VPOCP) is obtained using Equation (A6) by deducting the control paste volume (VControlPaste) from the total paste volume (VTotalPaste) obtained in Equation (A5). Equation (A7) represents the additional POCP in kg/m3.
    V P O C P = V T o t a l P a s t e V C o n t r o l P a s t e
    P O C P   ( kg / m 3 ) = V P O C P × S G P O C P
    where SGPOCP is Specific Gravity of POCP.
Table A1. POCP required for each substitution levels of POC coarse.
ColumnABCDEFGKL
IDPP Water Vol. (m3)PP Container Vol. (m3)Void Vol. (m3/m3) A B Void Increment (%) C 0.3049 0.3049 × 100 Control Mix Correction FactorControl Paste Vol. (m3/m3) 0.3049 × 1.16Total Paste Vol. (m3/m3) ( D × 0.356 ) + 0.356 POCP Vol. Required (m3/m3) G-0356POCP (kg/m3) K × POCPSG
M00.000570.00186960.30491.160.3560.356
POCP200.000620.00186960.32897.920.3840.02870
POCP400.000630.00186960.33710.550.3930.03793
POCP600.000640.00186960.342312.310.3990.043108
POCP800.000670.00186960.358417.570.4180.062156
POCP1000.00070.00186960.374422.840.4370.081203

References

  1. Rashid, M.A.; Salam, M.A.; Shill, S.K.; Hasan, M.K. Effect of replacing natural coarse aggregate by brick aggregate on the properties of concrete. Dhaka Univ. Eng. Technol. J. 2012, 1, 17–22. [Google Scholar]
  2. Katz, A. Properties of concrete made with recycled aggregate from partially hydrated old concrete. Cem. Concr. Res. 2003, 33, 703–711. [Google Scholar] [CrossRef]
  3. Alnahhal, M.F.; Alengaram, U.J.; Jumaat, M.Z.; Alqedra, M.A.; Mo, K.H.; Sumesh, M. Evaluation of industrial by–products as sustainable pozzolanic materials in recycled aggregate concrete. Sustainability 2017, 9, 767. [Google Scholar] [CrossRef]
  4. Mannan, M.; Neglo, K. Mix design for oil–palm–boiler clinker (OPBC) concrete. J. Sci. Technol. 2010, 30, 111–118. [Google Scholar] [CrossRef]
  5. Hosseini, S.E.; Wahid, M.A. Utilization of palm solid residue as a source of renewable and sustainable energy in malaysia. Renew. Sustain. Energy Rev. 2014, 40, 621–632. [Google Scholar] [CrossRef]
  6. Halimah, M.; Tan, Y.A.; Nik Sasha, K.K.; Zuriati, Z.; Rawaida, A.I.; Choo, Y.M. Determination of life cycle inventory and greenhouse gas emissions for a selected oil palm nursery in malaysia: A case study. J. Oil Palm Res. 2013, 25, 343–347. [Google Scholar]
  7. Kanadasan, J.; Razak, H.A. Mix design for self–compacting palm oil clinker concrete based on particle packing. Mater. Des. 2014, 56, 9–19. [Google Scholar] [CrossRef]
  8. Fuad Abutaha, H.A.R. Jegathish Kanadasan. Effect of palm oil clinker (POC) aggregates on fresh and hardened properties of concrete. Constr. Build. Mater. 2016, 112, 416–423. [Google Scholar] [CrossRef]
  9. Kanadasan, J.; Fauzi, A.F.A.; Razak, H.A.; Selliah, P.; Subramaniam, V.; Yusoff, S. Feasibility studies of palm oil mill waste aggregates for the construction industry. Materials 2015, 8, 6508–6530. [Google Scholar] [CrossRef] [PubMed]
  10. Abdullahi, M.; Al-Mattarneh, H.; Hassan, A.A.; Hassan, M.; Mohammed, B. Trial mix design methodology for palm oil clinker (POC) concrete. In Proceedings of the International Conference on Construction and Building Technology, Kuala Lumpur, Malaysia, 16–20 June 2008. [Google Scholar]
  11. Ibrahim, H.A.; Razak, H.A. Effect of palm oil clinker incorporation on properties of pervious concrete. Constr. Build. Mater. 2016, 115, 70–77. [Google Scholar] [CrossRef]
  12. Kanadasan, J.; Abdul Razak, H. Utilization of palm oil clinker as cement replacement material. Materials 2015, 8, 8817–8838. [Google Scholar] [CrossRef] [PubMed]
  13. Karim, M.R.; Hashim, H.; Razak, H.A. Assessment of pozzolanic activity of palm oil clinker powder. Constr. Build. Mater. 2016, 127, 335–343. [Google Scholar] [CrossRef]
  14. Mangulkar, M.; Jamkar, S. Review of particle packing theories used for concrete mix proportioning. Int. J. Sci. Eng. Res. 2013, 4, 143–148. [Google Scholar]
  15. Koehler, E.P. Aggregates in Self-Consolidating Concrete; Final Report; International Center for Aggregate Research (ICAR) Report; University of Texas: Austin, TX, USA, 2007. [Google Scholar]
  16. Kanadasan, J.; Razak, H.A. Engineering and sustainability performance of self–compacting palm oil mill incinerated waste concrete. J. Clean. Prod. 2015, 89, 78–86. [Google Scholar] [CrossRef]
  17. Abutaha, F.; Abdul Razak, H.; Kanadasan, J. Effect of palm oil clinker (POC) aggregates on fresh and hardened properties of concrete. Constr. Build. Mater. 2016, 112, 416–423. [Google Scholar] [CrossRef]
  18. Ibrahim, H.A.; Abdul Razak, H.; Abutaha, F. Strength and abrasion resistance of palm oil clinker pervious concrete under different curing method. Constr. Build. Mater. 2017, 147, 576–587. [Google Scholar] [CrossRef]
  19. Tuan, B.L.A.; Hwang, C.-L.; Lin, K.-L.; Chen, Y.-Y.; Young, M.-P. Development of lightweight aggregate from sewage sludge and waste glass powder for concrete. Constr. Build. Mater. 2013, 47, 334–339. [Google Scholar] [CrossRef]
  20. Mannan, M.A.; Ganapathy, C. Engineering properties of concrete with oil palm shell as coarse aggregate. Constr. Build. Mater. 2002, 16, 29–34. [Google Scholar] [CrossRef]
  21. Teo, D.; Mannan, M.; Kurian, V. Structural concrete using oil palm shell (OPS) as lightweight aggregate. Turk. J. Eng. Environ. Sci. 2006, 30, 251–257. [Google Scholar]
  22. Abdullah, A. Palm oil shell aggregate for lightweight concrete. In Waste Materials Used in Concrete Manufacturing; Chandra, S., Ed.; Noyes Publ.: Westwood, NJ, USA, 1996; pp. 624–636. [Google Scholar]
  23. Shafigh, P.; Jumaat, M.Z.; Mahmud, H.B.; Hamid, N.A.A. Lightweight concrete made from crushed oil palm shell: Tensile strength and effect of initial curing on compressive strength. Constr. Build. Mater. 2012, 27, 252–258. [Google Scholar] [CrossRef]
  24. Haque, M.; Al-Khaiat, H.; Kayali, O. Strength and durability of lightweight concrete. Cem. Concr. Compos. 2004, 26, 307–314. [Google Scholar] [CrossRef]
  25. Holm, T.A.; Bremner, T.W. State of the Art Report on High-Strength, High-Durability Structural Low-Density Concrete for Applications in Severe Marine Environments; US Army Corps of Engineers, Engineer Research and Development Center: Vicksburg, MS, USA, 2000. [Google Scholar]
  26. ASTM International. Standard Test Method for Splitting Tensile Strength of Cylindrical Concrete Specimens; ASTM International: West Conshohocken, PA, USA, 2011. [Google Scholar]
  27. Smadi, M.; Migdady, E. Properties of high strength tuff lightweight aggregate concrete. Cem. Concr. Compos. 1991, 13, 129–135. [Google Scholar] [CrossRef]
  28. Neville, A.M. Properties of Concrete, 14th ed.; Prentice Hall: Upper Saddle River, NJ, USA, 2008. [Google Scholar]
  29. Gesoğlu, M.; Özturan, T.; Güneyisi, E. Shrinkage cracking of lightweight concrete made with cold-bonded fly ash aggregates. Cem. Concr. Res. 2004, 34, 1121–1130. [Google Scholar] [CrossRef]
  30. Okafor, F.O. Palm kernel shell as a lightweight aggregate for concrete. Cem. Concr. Res. 1988, 18, 901–910. [Google Scholar] [CrossRef]
  31. Mahmud, H. Ductility behaviour of reinforced palm kernel shell concrete beams. Eur. J. Sci. Res. 2008, 23, 406–420. [Google Scholar]
  32. Shetty, M.S. Concrete Technology Theory and Practice; S. Chand & Company Ltd.: New Delhi, India, 2005. [Google Scholar]
  33. Krizova, K.; Hela, R. Selected Technological Factors Influencing the Modulus of Elasticity of Concrete. World Acad. Sci. Eng. Technol. Int. J. Civ. Environ. Struct. Constr. Archit. Eng. 2014, 8, 593–595. [Google Scholar]
  34. Domagała, L. Modification of properties of structural lightweight concrete with steel fibres. J. Civ. Eng. Manag. 2011, 17, 36–44. [Google Scholar] [CrossRef]
  35. ACI 318-08 Building Code Requirements for Structural Concrete and Commentary; ACI Standard; American Concrete Institute: Farmington Hills, MI, USA, 2008; p. 465.
  36. Hossain, K.; Ahmed, S.; Lachemi, M. Lightweight concrete incorporating pumice based blended cement and aggregate: Mechanical and durability characteristics. Constr. Build. Mater. 2011, 25, 1186–1195. [Google Scholar] [CrossRef]
  37. Tasnimi, A. Mathematical model for complete stress-strain curve prediction of normal, light-weight and high-strength concretes. Mag. Concr. Res. 2004, 56, 23–34. [Google Scholar] [CrossRef]
  38. Noguchi, T.; Tomosawa, F.; Nemati, K.M.; Chiaia, B.M.; Fantilli, A.P. A practical equation for elastic modulus of concrete. ACI Struct. J. 2009, 106, 690. [Google Scholar]
  39. BS 8110: Part 2, Structural Use of Concrete. Part 2: Code of Practice for Special Circumstances. British Standards Institution: London, UK, 1985.
  40. Australian Standard. General Purpose and Blended Cements; Australian Standard: Sydney, Australia, 2014. [Google Scholar]
  41. Nilson, A.H.; Martinez., S. Mechanical properties of high-strength lightweight concrete. Aci Mater. J. 1991, 88, 240–247. [Google Scholar]
  42. BSI BS 1881: Part 122. Method for Determination of Water Absorption. British Standard Institution: London, UK, 1983.
  43. Wongkeo, W.; Thongsanitgarn, P.; Ngamjarurojana, A.; Chaipanich, A. Compressive strength and chloride resistance of self-compacting concrete containing high level fly ash and silica fume. Mater. Des. 2014, 64, 261–269. [Google Scholar] [CrossRef]
  44. Teo, D.; Mannan, M.; Kurian, V. Durability of lightweight OPS concrete under different curing conditions. Mater. Struct. 2010, 43, 1–13. [Google Scholar] [CrossRef]
  45. Topcu, I.B. Physical and mechanical properties of concretes produced with waste concrete. Cem. Concr. Res. 1997, 27, 1817–1823. [Google Scholar] [CrossRef]
  46. Moosberg-Bustnes, H.; Lagerblad, B.; Forssberg, E. The function of fillers in concrete. Mater. Struct. 2004, 37, 74–81. [Google Scholar] [CrossRef]
  47. Tangchirapat, W.; Jaturapitakkul, C.; Chindaprasirt, P. Use of palm oil fuel ash as a supplementary cementitious material for producing high-strength concrete. Constr. Build. Mater. 2009, 23, 2641–2646. [Google Scholar] [CrossRef]
  48. Ahmad, M.H.; Mohd Noor, N.; Adnan, S.H. Shrinkage of Malaysian palm oil clinker concrete. In Proceedings of the International Conference on Civil Engineering Practice (ICCE08), Kuantan, Pahang, 12–14 May 2008. [Google Scholar]
  49. Chia, K.S.; Zhang, M.-H. Water permeability and chloride penetrability of high-strength lightweight aggregate concrete. Cem. Concr. Res. 2002, 32, 639–645. [Google Scholar] [CrossRef]
  50. Shi, C. Another Look at the Rapid Chloride Permeability Test (Astm C1202 or Asshto T277); FHWA Resource Center: Baltimore, MD, USA, 2003. [Google Scholar]
  51. Stanish, K.D.; Hooton, R.D.; Thomas, M.D.A. Testing the Chloride Penetration Resistance of Concrete: A Literature Review; University of Toronto: Toronto, ON, Canada, 2000. [Google Scholar]
  52. Smith, D. The Development of a Rapid Test for Determining the Transport Properties of Concrete. Master’s Thesis, University of New Brunswick, Fredericton, NB, Canada, November 2006. [Google Scholar]
  53. Joshi, P.; Chan, C. Rapid chloride permeability testing. Concr. Constr. 2002, 47, 37–43. [Google Scholar]
  54. Uysal, M.; Yilmaz, K.; Ipek, M. The effect of mineral admixtures on mechanical properties, chloride ion permeability and impermeability of self-compacting concrete. Constr. Build. Mater. 2012, 27, 263–270. [Google Scholar] [CrossRef]
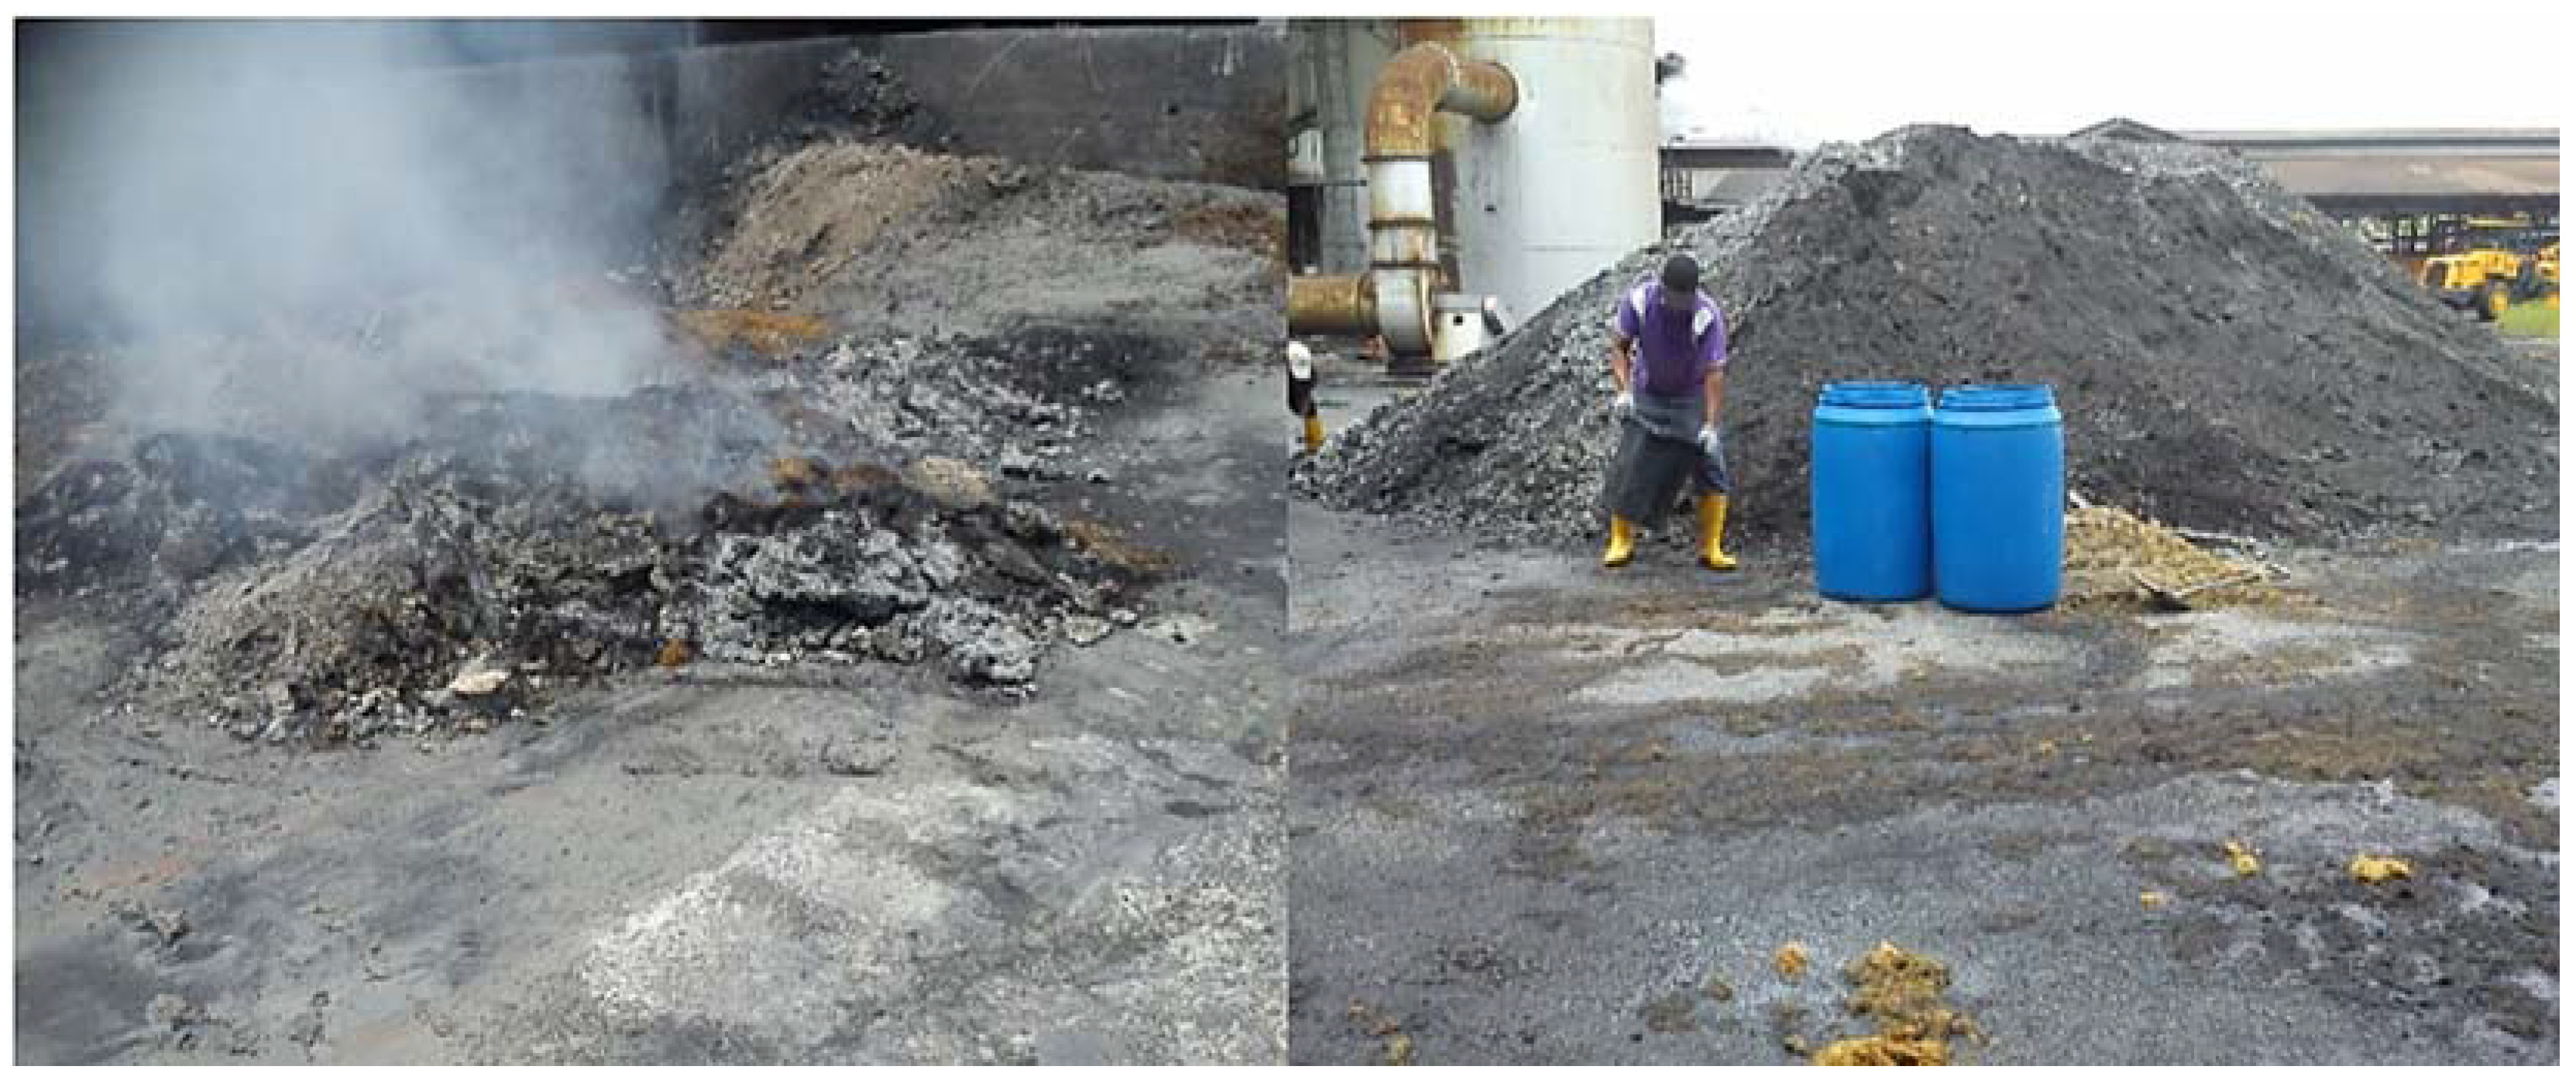
Figure 1. Solid waste of palm oil mill.
Coatings 07 00175 g001
Figure 2. Raw POC collected from palm oil mill.
Coatings 07 00175 g002
Figure 3. Coarse aggregate: (a) Granite; (b) Palm oil clinker (POC).
Coatings 07 00175 g003
Figure 4. Palm oil clinker (POC).
Coatings 07 00175 g004
Figure 5. Schematic diagram of PP test.
Coatings 07 00175 g005
Figure 6. Flow chart to determine the required POCP.
Coatings 07 00175 g006
Figure 7. POCP and SP dosage for each replacement level.
Coatings 07 00175 g007
Figure 8. POC particle: (a) Pre-coating; (b) After coating.
Coatings 07 00175 g008
Figure 9. Slump values of POC and POCP concrete mixes.
Coatings 07 00175 g009
Figure 10. Fresh density of POCP concrete and POC concrete.
Coatings 07 00175 g010
Figure 11. Difference in porosity of concrete. (a) Granite; (b) POC.
Coatings 07 00175 g011
Figure 12. Development of POCP concrete strength.
Coatings 07 00175 g012
Figure 13. 28-day compressive strength of POC and POCP concretes.
Coatings 07 00175 g013
Figure 14. Relative compressive strength of POCP concrete.
Coatings 07 00175 g014
Figure 15. 28-day splitting tensile of POC and POCP concretes.
Coatings 07 00175 g015
Figure 16. Splitting tensile failure.
Coatings 07 00175 g016
Figure 17. Development of splitting tensile of POCP concrete.
Coatings 07 00175 g017
Figure 18. Relative splitting tensile strength of POCP concrete.
Coatings 07 00175 g018
Figure 19. Splitting tensile and compressive strength relationship of POCP concrete.
Coatings 07 00175 g019
Figure 20. Experimental and theoretical 28-day splitting tensile of POCP concretes.
Coatings 07 00175 g020
Figure 21. 28-day Flexural strength of POC and POCP concrete.
Coatings 07 00175 g021
Figure 22. Developing of flexural strength of POCP concretes.
Coatings 07 00175 g022
Figure 23. 28-day modulus of elasticity of POC and POCP concretes.
Coatings 07 00175 g023
Figure 24. Development of modulus of elasticity of POCP concretes.
Coatings 07 00175 g024
Figure 25. Experimental and theoretical of 28-day modulus of elasticity of POCP concretes.
Coatings 07 00175 g025
Figure 26. 28-day water absorption of POC and POCP concretes.
Coatings 07 00175 g026
Figure 27. Water absorption of POCP concrete at different ages.
Coatings 07 00175 g027
Figure 28. Dry shrinkage for POCP concrete.
Coatings 07 00175 g028
Figure 29. Concrete specimens and test set up (ASTM C1202).
Coatings 07 00175 g029
Figure 30. 28-day charge passed coulombs value of POC and POCP concretes.
Coatings 07 00175 g030
Figure 31. Charge passed coulombs value of POCP concretes.
Coatings 07 00175 g031
Table 1. Physical characteristics of the aggregates.
PropertiesAggregates
River SandCoarse Aggregates
GranitePOC
Aggregate size (mm)<4.754.75–144.75–14
Specific gravity2.662.651.73
Water absorption (%)0.390.583 ± 2
Moisture content (%)0.080.281 ± 0.5
Aggregate crushing Value (%)17.9356.44
Aggregate crushing value (Ten per cent fines)16.99
Bulk Density (kg/m3)13011294732
Table 2. Chemical composition and physical properties of Ordinary Portland Cement (OPC) and palm oil clinker powder (POCP) [12].
PropertiesOPCPOCP
Chemical Composition (%)
CaO646.37
SiO220.2959.9
SO32.610.39
Fe2O32.946.93
Al2O35.373.89
MgO3.133.3
P2O50.073.47
K2O0.1715.1
TiO20.120.29
Mn2O30.12
Na2O0.24
others0.940.36
Loss on ignition1.41.89
Physical Properties
Specific gravity (g/cm3)3.152.59
Particle Distribution
Average size, D (V, 0.5)27.98 μm20.97 μm
Passing 10.48 µm27.5837.86
Retained 10.48 μm, Passing 48.27 μm (%)45.8034.05
Retained 48.27 μm (%)26.6228.09
Table 3. Mixture proportion for different replacement level of coarse aggregate.
Replacement LevelIDw/c RatioMix Proportion (kg/m3)
OPCFine AggregateCoarse Aggregate
River SandPOCGranitePOC
Control MixM00.534207601007
Coarse Aggregate Replacement (Series POC)
20%POC200.53420760806131
40%POC400.53420760604263
60%POC600.53420760402394
80%POC800.53420760201526
100%POC1000.53420760657
Table 4. Final mix proportion of POCP concrete.
Replacement LevelIDCement (kg/m3)POCP (kg/m3)w/p RatioFine Aggregate (kg/m3)Coarse Aggregate (kg/m3)
River SandGranitePOC
Control MixM042000.5376010070
20%POCP20420700.51760806131
40%POCP40420930.48760604263
60%POCP604201080.46760402394
80%POCP804201560.45760201526
100%POCP1004202030.437600657
Table 5. Flexure, splitting and compressive strength relationship at 28 days.
IDCompressive Strength (MPa) f c u Flexural Strength (MPa) f r f r f c u Splitting Tensile (MPa) f t f t f c u
M045.164.4229.793.6638.11
POCP2051.274.5218.823.8297.47
POCP4046.394.5019.703.4227.16
POCP6046.224.3819.483.3156.82
POCP8044.634.80010.763.5537.96
POCP10040.524.53411.193.2337.51
Table 6. Practical equations for splitting tensile strength of concrete.
EquationDescriptionReferenceEquation No.
f t = 0.176 f c u 0.76 POCP concrete with cube compressive strength ranging between 40 and 51 MPaThis studyEquation (1)
f t = 0.53 f c y 0.5 ACI-318-11[26]Equation (2)
f t = 0.3 f c y 0.67 Eurocode 4-04Eurocode 4-04Equation (3)
f t = 0.46 f c y 0.5 From natural Tuff LWAC with a compressive strength as high as 60 MPa[27]Equation (4)
f t = 0.23 f c u 0.66 For pelletized blast slag LWAC with cube compressive strength ranging from 10 to 65 MPa[28]Equation (5)
f t = 0.27 f c u 0.67 Concrete with an artificial LWA has cube compressive strength ranging between 21 and 47 MPa[29]Equation (6)
Note: ft, splitting tensile; fcu, cube compressive strength; fcy, cylinder compressive strength.
Table 7. Practical Equations for Elastic Modulus of Concrete.
EquationReferenceEquation No.
E c = 0.0017 W c 2 f c u 0.33 [39]Equation (7)
E c = 4730 f c y 0.5 [35]Equation (8)
E c = 0.043 W c 1.5 f c y 0.5 [35]Equation (9)
E c = 9500 f c y 0.33 [40]Equation (10)
E c = 0.03 W c 1.5 f c y 0.5 [36]Equation (11)
E c = 2.1684 f c y 0.535 [37]Equation (12)
E c = ( 0.062 + 0.0297 f c y 0.5 ) W c 1.5 [41]Equation (13)
E c = 22 , 000 f c y 0.033 [38]Equation (14)
Note: Ec, modulus of elasticity; Wc, concrete density; fcu, cube compressive strength; fcy, cylinder compressive strength.
Table 8. RCPT ratings (per ASTM C1202).
Charge Passed (Coulombs)Chloride Ion Penetrability
>4000 HighHigh (H)
2000–4000 ModerateModerate (M)
1000–2000 LowLow (L)
100–1000 Very LowVery Low (V.L)