Article

Grain Refinement and Property Trade-Offs in Laser Cladded Ni60-WC Coating Induced by 2% ZrO2 Addition

1
School of Mechanical Engineering, Guangdong Ocean University, Zhanjiang 524088, China
2
Guangdong Engineering Technology Research Center of Ocean Equipment and Manufacturing, Zhanjiang 524088, China
*
Author to whom correspondence should be addressed.
Coatings 2026, 16(7), 857; https://doi.org/10.3390/coatings16070857
Submission received: 8 June 2026 / Revised: 11 July 2026 / Accepted: 15 July 2026 / Published: 17 July 2026

Abstract

To improve the surface properties of Q235 steel, two types of composite coatings were prepared using laser cladding technology: a 25% WC + 75% Ni60 coating (Group NO) and a 25% WC + 73% Ni60 coating with 2% ZrO2 added (Group 2). Through XRD, SEM, microhardness testing, friction and wear testing, and electrochemical testing, the effects of ZrO2 on the phase composition, microstructure, mechanical properties, and corrosion resistance of the coatings were systematically investigated. The results indicate that upon the addition of ZrO2, Zr atoms solid-solve into the γ-Ni lattice, causing the grain size to refine from 17.36 nm to 10.84 nm, and the carbides to transform from coarse cuboidal particles (average 4.00 μm) into fine, irregularly shaped, dispersed particles (average 2.93 μm); the average hardness of the coating decreased from 901.51 HV0.2 to 576.20 HV0.2, but the uniformity of the hardness distribution improved significantly (standard deviation decreased from 142.75 to 29.74); the coefficient of friction increased from 0.71 to 0.85, and the wear volume increased from 0.04 mm3 to 0.38 mm3, indicating a decline in wear resistance; in a 3.5% NaCl solution, the corrosion potential shifted positively by 38 mV, and the corrosion rate decreased from 0.7234 mm·a−1 to 0.7071 mm·a−1, indicating a slight improvement in corrosion resistance. In summary, the addition of 2% ZrO2 achieves grain refinement, carbide homogenization, and improved corrosion resistance, but reduces hardness and wear resistance. It is suitable for operating conditions where corrosion resistance and microstructural uniformity are the primary considerations.

1. Introduction

Q235 steel is widely used in mechanical manufacturing, marine engineering, and other fields due to its good machinability and low cost. However, it has low surface hardness and poor wear and corrosion resistance, making it prone to premature failure under severe operating conditions. Laser cladding technology, as a high-energy-density surface modification technique, can produce high-performance metal matrix composite coatings on low-cost substrates, significantly extending the service life of components [1].
Nickel-based self-fusing alloy powders (such as Ni60) are commonly used in laser cladding due to their good wettability and excellent corrosion resistance. The addition of WC ceramic particles can significantly improve the hardness and wear resistance of the coating [2]. Studies have shown that WC is prone to partial dissolution under the high-energy laser heat source, forming carbides such as M23C6, and that this dissolution behavior is closely related to the microstructure and properties of the coating [3,4]. However, two major challenges exist in the rapid solidification process of WC/Ni60 composite coatings: first, differences in the thermophysical properties between WC and the Ni matrix lead to defects such as cracks and porosity [1,5]; second, the coarse carbides (e.g., M23C6) formed after WC dissolution act as a cathodic phase, causing galvanic corrosion with the anodic matrix and accelerating coating failure in Cl media [4,6]. Therefore, how to control the dissolution behavior of WC, refine the carbides, and balance mechanical and corrosion properties has become a research focus in this field.
Introducing high-melting-point ceramic particles (such as ZrO2) as a second phase is an effective approach to improving the microstructure of the cladding layer. ZrO2 can inhibit crack propagation through a phase transformation toughening mechanism and refine the grain structure [7,8]. Liang Feilong et al. [9] found that adding ZrO2 to Ni-based/WC coatings enhances the solid solution strengthening effect, improves the stability of the passivation film, and significantly improves corrosion resistance; however, it inhibits the precipitation of hard phases, leading to a decrease in hardness and wear resistance. Zhang Weiping et al. [8] investigated the application of the ZrO2 toughening mechanism in laser cladding, noting that the volume expansion accompanying the martensitic phase transformation can effectively hinder crack propagation. Tong, Z et al. [10] found that adding 2 wt.% nano-ZrO2 reduced the grain size of additively manufactured AZ31 magnesium alloy by 67.5% (190.5 → 62 μm) and achieved a transformation from columnar to equiaxed grains; strength increased by 9.3% (213 MPa), and elongation by 58% (14.7%), overcoming the strength-ductility trade-off in magnesium alloys. Furthermore, the addition of ZrO2 alters the solidification kinetics of the melt pool: unmelted or partially melted ZrO2 particles act as heterogeneous nucleation sites, increasing the nucleation density of γ-Ni; simultaneously, solubilized Zr atoms induce compositional undercooling, thereby suppressing dendrite coarsening [11]. This combined strengthening effect of fine grains and solid solution is expected to compensate for the loss of hardness caused by reduced carbide content. Research by Zhang et al. [12] indicates that the addition of ZrW2O8 can introduce Zr elements during the laser cladding process, improving coating properties through solid solution strengthening and phase transformation control. This further supports the potential of ZrO2 and its derivatives to modify Ni-based/WC coatings.
Laser remelting, as a post-processing technique, can further optimize the microstructural uniformity and mechanical properties of the coating [13]. Yang Yuhang et al. [14] found that when the laser energy density reached 1500 J/mm2, the ceramic particles within the remelted coating had essentially disappeared, with a hardness of 768 HV0.5 and wear resistance 3.75 times that of the substrate. Wu et al. [5] investigated the effect of different power levels during remelting on the corrosion resistance of WC/Ni-based coatings and found that the self-corrosion current density was lowest (2.397 × 10⁻⁵ A/cm2) at 1600 W. Although remelting can improve microstructural uniformity, for ZrO2-modified coatings, remelting may exacerbate the dissolution and re-precipitation behavior of ZrO2 particles; therefore, a systematic study of the direct role of ZrO2 in single-pass cladding is required.
In terms of electrochemical corrosion, the addition of ZrO2 can enhance corrosion resistance by stabilizing the passivation film and reducing the cathodic phase [15,16]. Elahi Haghighi N [16] et al. prepared Ni-ZrO2 nanocomposite foils via electroforming using a nickel chloride solution. When the ZrO2 volume fraction reached 13.65%, the nickel matrix grain size was minimal (516.9 nm), representing a reduction of approximately 46% compared to pure nickel. Compared to pure nickel, this composite material exhibited a significant reduction in the coefficient of friction (maximum reduction of 44%), a 2.5% decrease in corrosion current density, and a 596% increase in charge transfer resistance. In recent years, researchers have begun to explore composite addition strategies combining rare earth oxides (such as CeO2) with ZrO2. Liang Feilong et al. [9] found that the grain refinement effect of CeO2 and the passivation film stabilization effect of ZrO2 can produce a synergistic effect, achieving simultaneous improvements in wear resistance and corrosion resistance in systems with low WC content (15%). However, for systems with high WC content (25%), systematic studies on the quantitative effects of ZrO2 alone on carbide precipitation, grain size, and wear mechanisms are still lacking, particularly quantitative evaluations based on X-ray diffraction microstructure analysis (such as grain size calculations using the Xie-Luo formula).
Based on this, this study used Q235 as the substrate and designed two sets of comparative coatings: Group NO (25% WC + 75% Ni60) and Group 2 (25% WC + 73% Ni60 + 2% ZrO2). Through XRD phase analysis, SEM/EDS microstructural observation, hardness testing, friction and wear testing, and electrochemical polarization curve measurements, this study quantitatively reveals the influence of ZrO2 on the γ-Ni grain size, carbide morphology, hardness distribution, friction and wear mechanisms, and corrosion resistance. The research results provide an experimental basis for the ZrO2 modification design of high-WC-content Ni-based composite coatings, which will help expand the application of laser cladding technology in harsh operating conditions such as marine engineering and petrochemical industries.

2. Test Materials, Methods, and Equipment

2.1. Test Materials

The substrate used in this experiment is Q235 (China Baowu Steel Group Corporation Limited, Shanghai, China) carbon structural steel, which is commonly used in industry. It offers good machinability and cost-effectiveness, making it suitable as a substrate for the preparation of laser cladding coatings.
All powder mixing proportions in this study are weight percentages (wt.%). The full chemical composition of Ni60 (Tsuengyue Metal Materials Co. Santai County, Mianyang, China) self-fluxing powder is listed in Table 1. Particle size distributions of Ni60, WC and morphology of ZrO2 are displayed in Figure 1a–c respectively:Ni60: normal distribution, 49.43–106.27 μm, mean = 81.67 μm; WC (Tsuengyue Metal Materials Co. Santai County, Mianyang, China): normal distribution, 40.51–162.13 μm, mean = 97.60 μm; ZrO2: fine block-shaped granular morphology.
The cladding powder consists of a mixture of two different components, with the specific composition as follows:
Powder 1: 25% WC (tungsten carbide) + 75% Ni60 (nickel-based alloy). Here, WC serves as the hard phase, significantly enhancing the coating’s hardness and wear resistance, while Ni60 acts as the binder phase, ensuring strong adhesion between the coating and the substrate.
Powder 2: 25% WC + 73% Ni60 + 2% ZrO2 (zirconia). A small amount of ZrO2 was added to Powder 1 to improve the coating’s high-temperature resistance and corrosion resistance, as well as to optimize its microstructure.

2.2. Experimental Equipment and Methods

2.2.1. Coating Preparation

In this study, laser cladding technology was employed to prepare the hybrid coatings, with the core equipment being the SM-RF3000 laser cladding workstation manufactured by Anhui Suiming Education Technology Co., Ltd., Wuhu, China. Prior to coating application, the substrate surface underwent rust and oil removal to ensure it was clean and free of impurities, thereby preventing any adverse effects on the bond quality between the coating and the substrate.
Fixed core laser parameters were set as follows: laser output power of 1300 W, linear scanning speed of 9 mm/s, laser spot diameter of 3 mm, zero defocus distance (defocus = 0 mm). The powder was pre-laid on polished Q235 substrate with a uniform thickness of 1.5 mm, and no protective shielding gas was used during the whole cladding process. The single-track center distance was set to 1.75 mm, corresponding to an overlap ratio of 41.67%, and single-pass cladding was adopted for all specimens. Two powder formulations were prepared: Group NO (75 wt.% Ni60 + 25 wt.% WC) and Group 2 (73 wt.% Ni60 + 25 wt.% WC + 2 wt.% ZrO2).

2.2.2. Sample Preparation

After the cladding operation is completed, an AR40-MA precision wire-cut EDM machine manufactured by Beijing Ande Jianqi Digital Equipment Co., Ltd., Beijing, China. is used to cut the clad samples into uniform 10 mm × 10 mm specimens. Cutting accuracy is strictly controlled during the process to prevent specimen deformation. All cut specimens must undergo grinding and polishing: First, the specimens were progressively ground using 400-grit, 800-grit, 1000-grit, 1500-grit, and 2000-grit wet sandpaper to remove scale and cutting marks from the specimen surface; subsequently, a diamond polishing compound was used to achieve a mirror finish until the specimen surface was free of scratches and impurities, meeting the requirements for subsequent microstructural observation and performance testing.

2.2.3. Performance Testing and Characterization

(1) The SFT-2M pin-on-disk friction and wear tester manufactured by Lanzhou Zhongke Kaihua Technology Development Co., Ltd. (Lanzhou, China), was used to measure the friction coefficient and wear volume of the coating. A 1.5 mm diameter GCr steel ball was selected as the mating component for the test; this ball features high hardness and excellent wear resistance, ensuring stable and reliable test data. Test parameters were set as follows: normal load of 20 N, total sliding duration of 30 min, and friction sliding radius of 3 mm. The friction coefficient variation curve was recorded in real time throughout the entire test. One specimen was prepared for the friction test, constituting a single test run. After the test, a probe-type surface profilometer was used to quantitatively characterize the wear volume. For each scratch, parallel scans were performed at three different locations, with a uniform scan length of 8 mm. The average of the three profile measurement results was taken as the final wear volume to minimize measurement errors.
(2) Phase and Crystal Structure Analysis: Shimadzu XRD-6100 X-ray (Tokyo, Japan.) diffractometer was used to analyze the phase composition and crystal structure of the coating. The test utilized Cu Kα radiation with a wavelength of λ = 0.15406 nm, a test voltage of 40 kV, and a current of 30 mA. The scanning range was set to 35–80° (2θ), with a scan step of 0.02° and a scan speed of 4°/min. By analyzing the positions and intensities of diffraction peaks in the XRD patterns, the phase composition and crystal structure characteristics of the coating were determined.
(3) Microstructural Observation: A TM4000Plus thermal field emission scanning electron microscope (SEM) manufactured by Hitachi, Ltd., Tokyo, Japan. was used to observe the microstructure of the coating cross-section, the surface morphology of the wear area, and the condition of the interface between the coating and the substrate. The SEM operating acceleration voltage was set to 15 kV. Through observations at different magnifications, the microstructure of the coating, defect distribution, and wear mechanisms were clearly visualized.
(4) The corrosion resistance of the coatings was evaluated using a CS350H electrochemical workstation from Wuhan Kester Instruments Co., Ltd., Wuhan, China. The tests employed a standard three-electrode system: the prepared coating specimen served as the working electrode, with the effective exposed area strictly controlled at 1 cm2; a highly conductive, chemically stable platinum plate served as the auxiliary electrode; and a saturated calomel electrode (SCE) was used as the reference electrode to stabilize the test potential. A 3.5 wt.% NaCl solution was used as the corrosion electrolyte to simulate marine and industrial corrosion service environments. One coating specimen was prepared for each group, and five parallel electrochemical tests were conducted to minimize testing errors.
Prior to testing the dynamic potential polarization curves, the working electrode was immersed in the electrolyte and left to stand for 30 min at the open-circuit potential until the electrode surface reached a stable state. The scanning range of the polarization curve is set from −1.5 V to +1 V relative to the open-circuit potential, with a scanning rate of 5 mV/s. Parameters such as the corrosion potential and corrosion current density of the coating are analyzed through the polarization curve to evaluate the coating’s corrosion resistance.
(5) Hardness Testing: The MHVD-1000AT microhardness tester, manufactured by Shanghai Jujing Precision Instrument Manufacturing Co., Ltd., Shanghai, China. is used to test the hardness distribution of the coating. Test parameters were strictly set in accordance with relevant standards: load of 200 gf, and hold time of 10 s. Prepare one hardness specimen per group. To ensure the representativeness of the test results, test points were arranged in three columns, with a spacing of 0.2 mm between columns and between points. Each column contained 10 test points, for a total of 30 test points. The average of all test points was taken as the average hardness of the coating.

3. Analysis of Results

3.1. Analysis of XRD Patterns

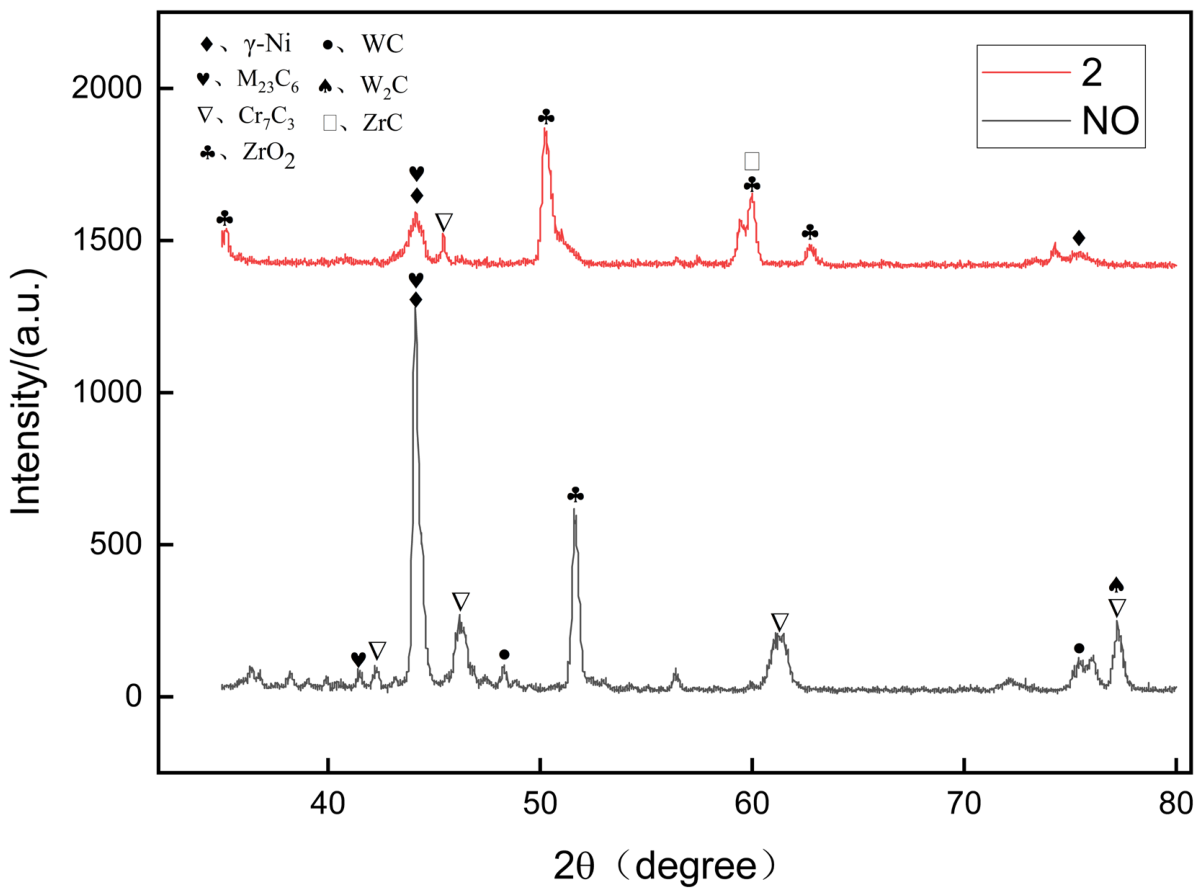
Figure 2 shows the X-ray diffraction patterns of laser-clad coatings from Group NO (25% WC + 75% Ni60) and Group 2 (25% WC + 73% Ni60 + 2% ZrO2). Phase analysis results indicate that the NO group coating consists primarily of a γ-Ni solid solution as the matrix phase, with characteristic peaks of carbide phases such as WC, M23C6, and Cr7C3 also detected. After adding 2% ZrO2 (Group 2), distinct ZrO2 diffraction peaks appeared in the diffraction pattern, indicating the stable presence of ZrO2 in the coating; at the same time, the intensity of the γ-Ni matrix phase diffraction peaks decreased and their peak shapes broadened, with the appearance of ZrC, while the diffraction peaks of the original carbide phase were significantly weakened or even partially disappeared. This suggests that the addition of ZrO2 altered the dissolution and precipitation behavior of carbides during the laser cladding process and may have promoted the refinement of the nickel matrix grains.
Further comparison of the positional changes in the main γ-Ni diffraction peak (111 crystal plane): The measured peak position for the NO group was 44.1°, a shift of 0.41° to the left relative to the pure Ni standard card (PDF#04-0850, 44.51°); The measured peak position for Group 2 was 44.0°, a shift of approximately 0.2° to the left relative to the Cr-containing γ-Ni standard card (PDF#65-0380, approximately 44.2°), and a further shift of 0.1° to the left relative to the NO group. According to Bragg’s law, a decrease in the diffraction angle corresponds to an increase in the interplanar spacing, i.e., an increase in the γ-Ni lattice constant. The lattice expansion in the NO group is primarily attributed to W and Cr atoms (with atomic radii larger than Ni) released from the partial dissolution of WC, which displace and solid-solve into the γ-Ni lattice; The further lattice expansion in Group 2 may be related to the solid solution of Zr atoms (with an atomic radius much larger than that of Ni) generated by the partial decomposition of ZrO2 in the high-energy laser melt pool; simultaneously, the reduced precipitation of carbides also resulted in more of the elements originally used to form carbides, such as Cr and W, being retained in the matrix lattice, collectively exacerbating lattice distortion.
According to the Scherrer Formula (1):
D = Kλ/(βcosθ)
D: the average crystallite size of the γ-Ni phase (unit: nm, nanometer);
K: the Scherrer constant, a dimensionless shape factor, which is taken as 0.9 for spherical crystallites (the default value for most polycrystalline materials in XRD grain size calculation);
λ: the wavelength of the incident X-ray (Cu Kα radiation in this experiment, λ = 0.15406 nm);
β: the full width at half maximum (FWHM) of the main diffraction peak of the γ-Ni phase (unit: rad, radian), corrected for instrumental broadening;
θ: the Bragg diffraction angle of the corresponding γ-Ni diffraction peak (unit: rad, radian), half of the 2θ value obtained from the XRD pattern.
The β value for the NO sample is 0.0086 rad (corresponding to θ = 22.05°), and the β value for the 2% ZrO2 sample is 0.01380 rad (corresponding to θ = 22.00°).
Calculations of the γ-Ni (111) diffraction peak using the Scherrer formula yielded an average grain size of 17.36 nm for the NO group coating and 10.84 nm for the 2% ZrO2 group coating. This indicates that the addition of 2% ZrO2 reduced the γ-Ni grain size by approximately 37.5%, demonstrating a significant grain refinement effect. This grain refinement mechanism can be attributed to the following: ZrO2 particles (high melting point, ~2715 °C) act as heterogeneous nucleation sites in the melt pool, increasing the nucleation density of γ-Ni; simultaneously, the compositional undercooling caused by Zr solid solution and the pinning effect of ZrO2 particles on grain boundaries effectively inhibit grain growth. Furthermore, the reduction in carbide precipitation also altered the distribution of grain boundary pinning agents, favoring the formation of a finer equiaxed grain structure.
It is worth noting that the Scherrer formula provides the size of the coherent diffraction zone (i.e., microcrystal size), rather than the metallographic grain size observed under SEM/TEM. Since XRD is sensitive to lattice distortions and subgrains, this value is typically smaller than the metallographic grain size. However, the significant downward trend observed from the NO group to the 2% group (a 37.5% decrease) still strongly demonstrates that the addition of ZrO2 produces a significant microstructural refinement effect on the γ-Ni matrix, which is highly consistent in trend with the carbide refinement results observed via SEM.
The effect of 2 wt.% ZrO2 addition is attributed to three mechanisms. First, undissolved ZrO2 particles serve as heterogeneous nucleation sites and grain-boundary pinning agents, increasing nucleation density and suppressing grain growth. Second, trace amounts of dissolved Zr species (0.27 at.% in matrix, 0.08 at.% in carbides) may form fine ZrC precipitates, which provide additional nucleation sites and growth inhibitors. Third, the presence of ZrO2 modifies C and Cr diffusion, suppressing coarse M23C6 formation. The cumulative effect of these mechanisms explains the significant refinement observed with only 2 wt.% ZrO2 addition, with the physical effect of undissolved ZrO2 being dominant.

3.2. Microstructural Morphology

After cladding, metallographic measurement shows that the average thickness of the cladding layer of Group NO is 0.93 mm with a dilution rate of 13%; the average cladding thickness of Group 2 is 1.07 mm, and the corresponding dilution rate reaches 20%.
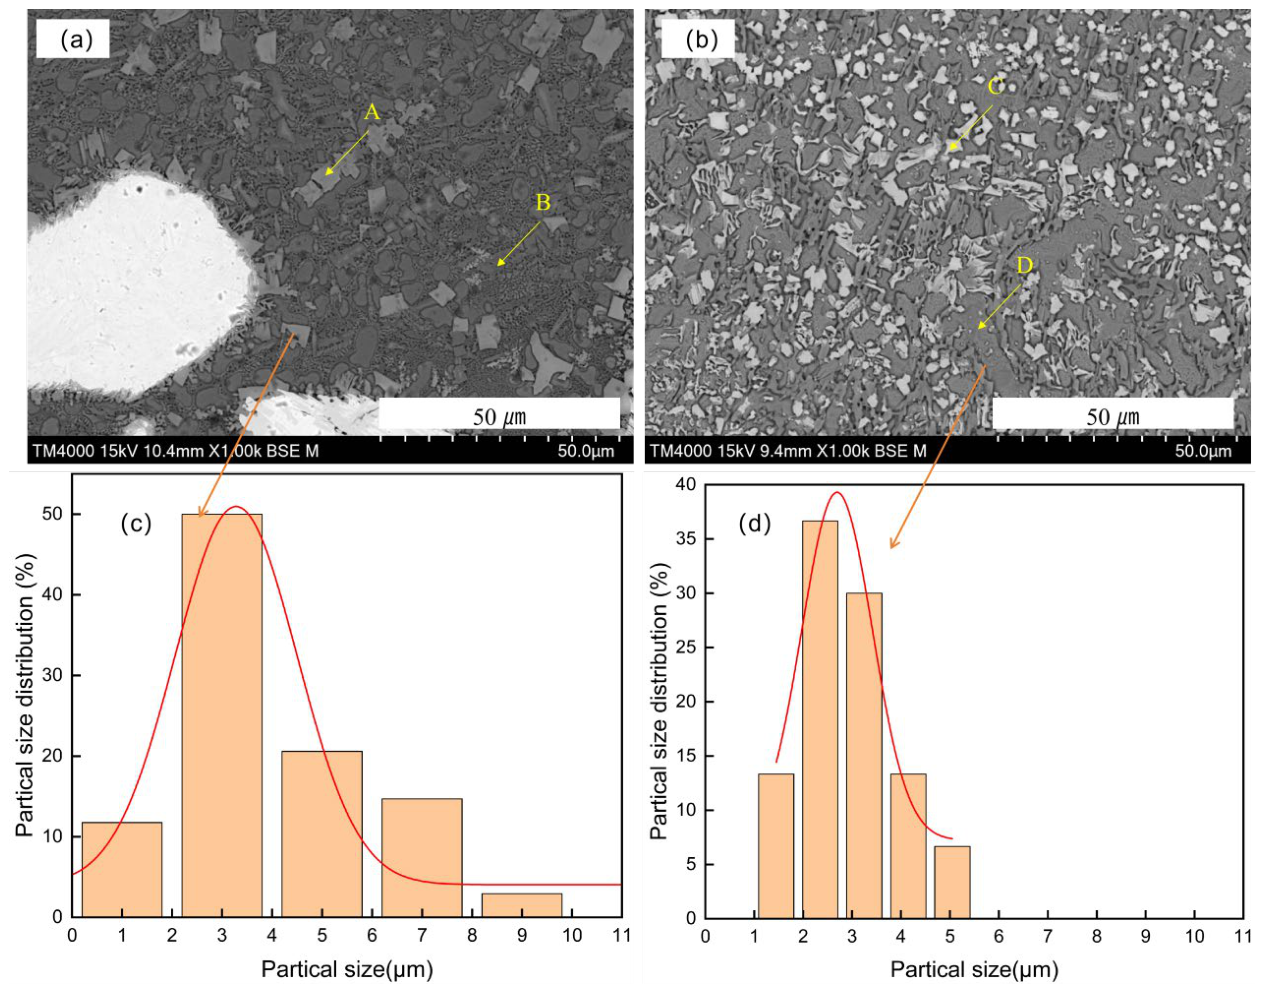
Figure 3a,b show the backscattered electron (BSE) cross-sectional morphologies of the laser cladding coatings for the NO group (25% WC + 75% Ni60) and Group 2 (25% WC + 73% Ni60 + 2% ZrO2), respectively. Combining EDS spectral analysis (see Table 2 for specific elemental compositions), the frequency distribution of carbide particle sizes shown in Figure 3c,d, and the results of normal distribution fitting, a systematic analysis is conducted on the microstructure of the coatings, the evolution patterns of carbides, and the relevant mechanisms involved.
Carbide particle size statistics were quantitatively analyzed based on cross-sectional BSE-SEM micrographs (Figure 3a,b) via ImageJ 1 software. A total of 35 carbide particles were randomly counted for the ZrO2-free NO coating, with measured minimum, maximum and average sizes of 1.63 μm, 8.65 μm and 4.00 μm, respectively; for the 2 wt.% ZrO2-modified coating, 30 carbide particles were statistically analyzed, yielding a minimum size of 1.22 μm, maximum size of 5.36 μm and average size of 2.93 μm. All above dimensional data have been cross-checked and fully matched with the carbide size distribution histograms in Figure 3c,d, showing no inconsistent values between textual description and plotted curves.
In the NO-group coating without ZrO2 (Figure 3a), the matrix region contains a large number of white, cuboid-shaped structures with a relatively uniform morphology. EDS spectroscopy was performed on this white structure (designated as Point A) and the nickel-based matrix (designated as Point B). As shown in Table 2, the elemental composition at Point A is 13.57 at.% C, 36.00 at.% Cr, W content of 11.31 at.%, and Ni content of only 16.86 at.%; at Point B, the Ni content was as high as 47.23 at.%, with C, Cr, and W contents of14.44 at.%, 3.31 at.%, and 0.81 at.%, respectively, and no Zr was detected. Based on the contrast characteristics of the BSE images (where higher atomic numbers correspond to brighter contrast) and the EDS analysis results, it can be determined that this block-like white structure consists of WC and composite carbide phases such as M23C6 and Cr7C3. Studies have shown that under high-energy laser irradiation, WC particles in laser-clad Ni60/WC composite coatings undergo partial dissolution, forming complex precipitate phases with M23C6 (where M represents Cr, W, or Fe) as the core [17,18]. The NO group matrix at point B exhibits a high Ni content, along with detectable amounts of Cr and W. This indicates that WC undergoes dissolution during the cladding process, and the C, Cr, and W elements produced by its decomposition partially solid-solve into the nickel-based matrix, providing the elemental sources for subsequent carbide precipitation.
In the two coating groups treated with 2% ZrO2 (Figure 3b), the microstructure underwent significant changes: the originally regular cubic carbides transformed into fine, irregularly shaped white particles dispersed throughout the matrix. EDS analysis was performed on these fine white carbide particles (designated as Point C) and the corresponding matrix (designated as Point D). As shown in Table 2. Point C also contained a small amount of Zr (0.08 at.%); the Zr content at Point D was 0.27 at.%, both significantly higher than that of the NO group (where Zr was not detected). During the laser cladding process, the ceramic phase undergoes a certain degree of dissolution after absorbing laser energy, and the dissolved ceramic elements recombine with the alloy elements [19]. The above results indicate that ZrO2 partially decomposed during the cladding process; Zr atoms not only solid-solved into the nickel-based matrix but also contributed in small amounts to the formation of the carbide phase. Previous studies have found that the addition of Zr can significantly alter the morphology of carbides in nickel-based alloys: as the Zr content increases, primary MC carbides transform from acicular or lamellar to isolated block-like structures [20]. This conclusion is consistent with the phenomenon observed in this study, where the carbides transformed from cubic to fine, irregular block-like structures following the addition of ZrO2. The above findings corroborate the conclusions from the previous XRD analysis regarding “the stable presence of ZrO2 in the coating and the lattice expansion of γ-Ni,” confirming that ZrO2 has successfully integrated into the coating system and exerted a modifying effect.
The statistical results of carbide particle size (Figure 3c,d) show that the particle size distributions in both groups of coatings follow a normal distribution. In the NO group, the maximum carbide particle size was 8.65 μm, the minimum was 1.63 μm, and the average was 4.00 μm; the overall size was relatively large, with some coarse particles present. This indicates that without ZrO2 addition, C and Cr elements can freely diffuse and fully enrich within the melt pool, providing ample space for carbide growth after nucleation, which facilitates the formation of coarse, block-shaped carbides. After adding 2% ZrO2, the maximum carbide particle size decreased to 5.36 μm, the minimum size to 1.22 μm, and the average size to only 2.93 μm. Compared to the NO group, the average particle size decreased by approximately 26.8%, with the overall carbide size significantly refined and the distribution becoming more uniform. Grain refinement is one of the key strengthening mechanisms for improving the hardness of laser cladding coatings [21]. The carbide refinement and matrix grain refinement resulting from the addition of ZrO2 will jointly contribute to the improvement of the coating’s mechanical properties.
The addition of ZrO2 influences the nucleation and growth of carbides by modulating the diffusion behavior and enrichment of C and Cr within the melt pool. EDS data (Table 2) indicate that Zr is not only solid-solved in the matrix (Point D, 0.87 at.%) but also present in small amounts within the carbide phase (Point C, 0.32 at.%), further confirming the effective incorporation of ZrO2. Under the high-energy laser cladding environment, the introduction of Zr exerts a dual regulatory effect.
A fraction of the ZrO2 undergoes thermal decomposition/dissolution in the melt pool, releasing Zr-containing species that solid-solve into the γ-Ni lattice, while the majority of the ZrO2 remains as stable ceramic particles. The observed lattice expansion is attributed to the dissolution of these Zr-species (Zr4+/Zr) rather than a complete reduction in ZrO2 to pure metallic Zr.
On the one hand, the solid solution of Zr atoms alters the elemental distribution gradient within the melt pool, inhibiting the rapid diffusion and aggregation of C while simultaneously hindering the continuous migration of Cr toward carbide nucleation zones (the Cr content at the two C points in Table 2, 34.12 at.%, is lower than that at point A in the NO group, 36.05 at.%). This reduces the material basis for carbide nucleation and growth. On the other hand, ZrO2 particles themselves act as high-melting-point heterogeneous nucleation sites, increasing the nucleation density of carbides; simultaneously, their pinning effect on grain boundaries further inhibits the growth of carbide particles, causing the originally coarse, block-shaped carbides to decompose and refine, ultimately forming fine, irregular carbide particles. Related studies have shown that during the laser cladding process, ZrO2 ceramic particles undergo internal grain growth under the combined effects of the laser and the high-temperature molten pool; high-energy, large-sized grain boundaries promote the diffusion of elements from the melt into the interior of the ZrO2 ceramic particles [22], which provides evidence for the diffusion of Zr into the matrix and carbide phases in this study. These changes are highly consistent with the experimental results from the XRD tests mentioned earlier, which showed a “weakening of the diffraction peak intensity of the carbide phase.” This confirms that ZrO2 effectively modifies the microstructure of the carbides by regulating the behavior of C and Cr elements, thereby laying the microstructural foundation for the improvement of the coating’s mechanical properties.

3.3. Electrochemical Analysis

3.3.1. Polarization Curve Analysis

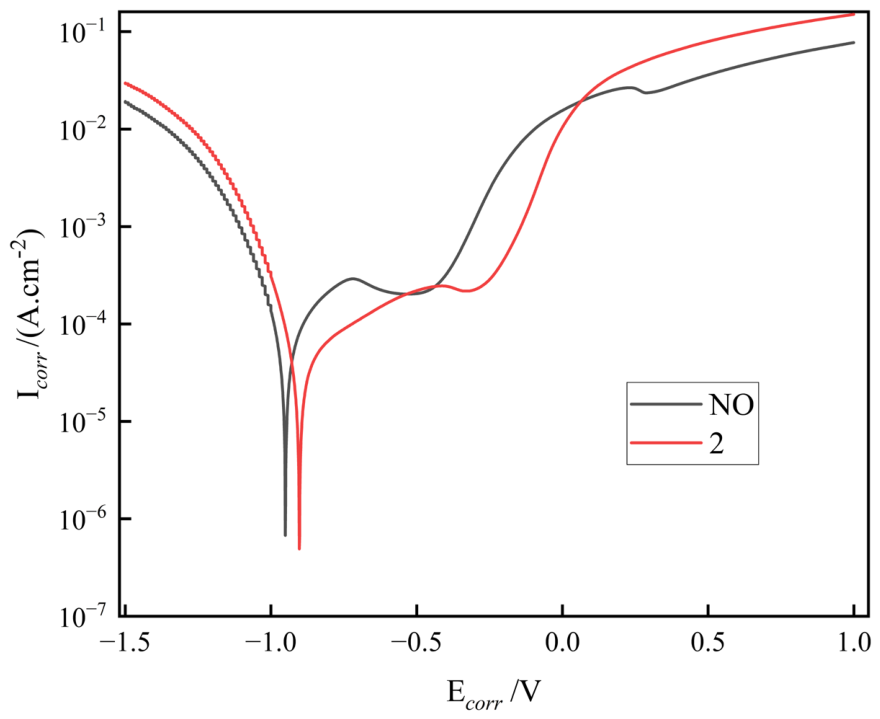
Figure 4 shows the dynamic potential polarization curves of the NO group (25% WC + 75% Ni60) and Group 2 (25% WC + 73% Ni60 + 2% ZrO2) coatings in a 3.5% NaCl solution. By fitting the Tafel region, electrochemical parameters such as the corrosion potential (E0), corrosion current density (i0), anodic Tafel slope (b_a), cathodic Tafel slope (b_c), and corrosion rate were obtained; specific values are shown in Table 3.
In terms of corrosion potential, the E0 value for the NO group was −0.94034 V, while that for Group 2 was −0.90229 V, representing a positive shift of approximately 38 mV. A positive shift in corrosion potential typically indicates a reduced thermodynamic corrosion tendency of the material [23]. The corrosion current densities of the two coating groups are in the same order of magnitude (10−5 A·cm−2), with Group 2 being slightly lower than that of the NO group, indicating a slight decrease in corrosion rate. The corrosion rate data show that the NO group has a rate of 0.7234 mm·a−1, while Group 2 has a rate of 0.7071 mm·a−1. The addition of ZrO2 reduced the corrosion rate by approximately 2.3%, resulting in a slight improvement in corrosion resistance.
The anodic Tafel slope (829.78 mV) of the two ZrO2-coated groups was moderately higher than that of the NO group (308.93 mV), while the cathodic Tafel slope decreased slightly (from 145.97 mV to 130.66 mV). The significant increase in the anodic Tafel slope indicates that the addition of ZrO2 effectively suppressed the anodic dissolution process of the coating. This phenomenon is attributed to the fact that Zr atoms partially released from ZrO2 in the coating dissolve into the γ-Ni matrix (as confirmed by the EDS and XRD results discussed earlier), thereby increasing the electrode potential of the matrix and reducing anodic reactivity [24]; on the other hand, ZrO2 particles themselves possess high chemical stability and act as a physical barrier in the corrosive medium, hindering the penetration of corrosive ions such as Cl into the coating interior [25]. Furthermore, the addition of ZrO2 reduces the size of carbides in the coating and makes their distribution more uniform (see Figure 3 and Table 2), thereby decreasing the number of microgalvanic couples formed between coarse carbides and the substrate, which in turn reduces susceptibility to localized corrosion [26].
The Rp value is calculated by using the Stern–Geary equation:
R p = b a · b c 2.303 · i c o r r · ( b a + b c )
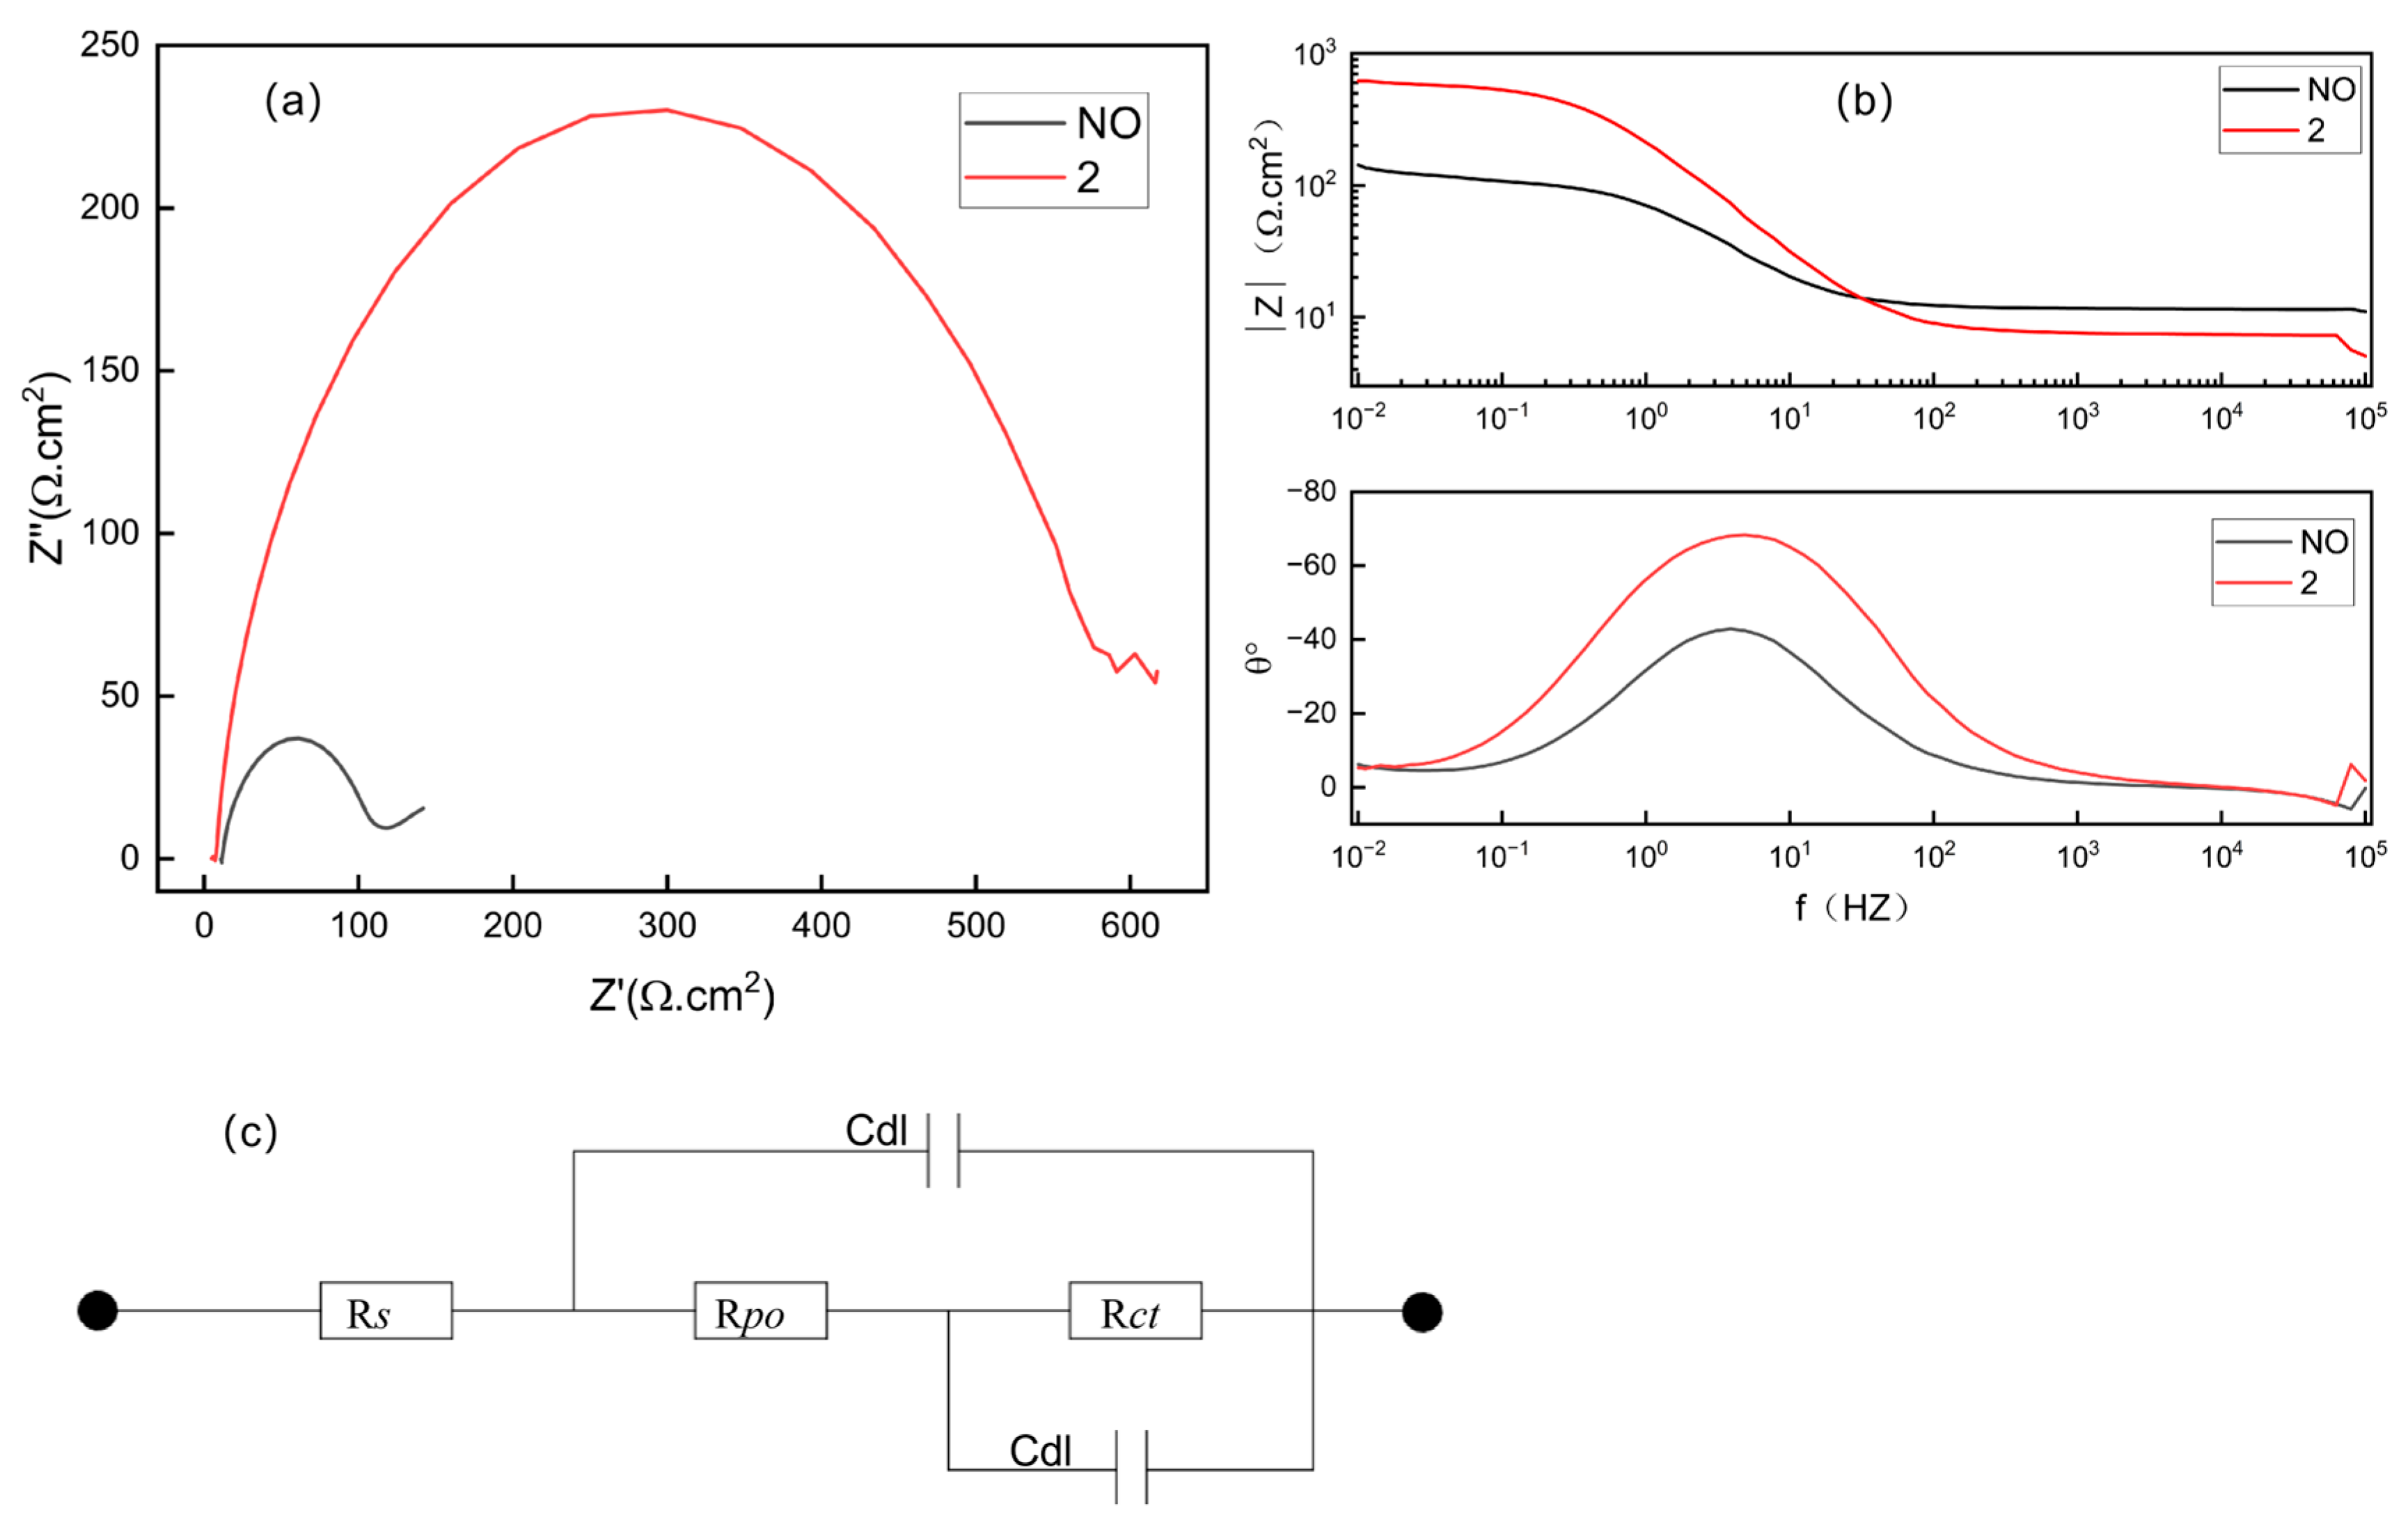
The polarization resistance (Rp) of the NO group was 698.03 Ω·cm2, Group 2 coating polarization resistance Rp = 813.23 Ω·cm2; the Rp value for Group 2 samples was 16.5% higher than that of the NO group, while corresponding to a lower average annual corrosion rate (Group 2: 0.7071 mm·a−1, NO group: 0.7234 mm·a−1). Polarization resistance Rp essentially represents the resistance to electrochemical reactions at the interface under corrosion potential; its magnitude directly reflects the ease with which anodic dissolution and cathodic reduction reactions occur on the metal substrate. This parameter shares the same physical significance as the interfacial charge transfer resistance measured by electrochemical impedance spectroscopy (EIS), and the trends in their changes are strongly correlated. Quantitatively consistent with this, the arc radius of the capacitive reactance for both coating groups in the Nyquist plot is significantly larger than that of the NO sample, indicating a higher overall interfacial impedance in the system; In the Bode plot, the low-frequency limiting impedance modulus |Z| at 0.01 Hz is one order of magnitude higher, while the peak phase angle is closer to −90°, and the capacitive response frequency band is wider, indicating fewer coating defects and a stronger shielding and barrier effect against the corrosive medium. The quantitative differences in Rp values correlate closely with the qualitative morphological features observed in the EIS spectra. These two electrochemical characterization methods mutually corroborate each other, consistently demonstrating that the two modified coating groups can effectively increase the resistance to interfacial corrosion reactions and suppress the penetration of chloride ions into the substrate in a 3.5% NaCl solution, exhibiting superior corrosion resistance compared to the NO coating.
The slight decrease in the cathodic Tafel slope indicates that the inhibitory effect of ZrO2 on the cathodic reaction (reduction in dissolved oxygen) is relatively limited. Overall, the corrosion current density and corrosion rate of the two ZrO2-containing groups were slightly lower than those of the NO group, while the corrosion potential shifted positively and the anodic polarization resistance significantly increased. This indicates that the addition of 2% ZrO2 can improve the corrosion resistance of the WC/Ni60 composite coating in 3.5% NaCl solution to a certain extent. This is consistent with the conclusions in the literature regarding the enhancement of corrosion resistance in nickel-based coatings by ZrO2 [27].

3.3.2. Impedance Analysis

Figure 5 shows the Nyquist impedance spectra (real part Z′ vs. imaginary part −Z″) of the NO group and the two coated groups in a 3.5% NaCl solution. As shown in Figure 5a, the Nyquist plots for both coated groups consist of a single capacitive arc, indicating that their electrochemical behavior is primarily governed by charge transfer processes, with no obvious Warburg diffusion features (no low-frequency linear tail). Notably, the radius of the capacitive arc for the two coated groups is significantly larger than that of the NO group, suggesting that the addition of ZrO2 markedly increases the charge transfer resistance (Rct) of the coatings.
Figure 5c shows the equivalent circuit model used to fit the EIS data. This circuit has a double-time-constant structure: Rs(Cpo/Rpo)(Cdl/Rct). In this model, the parallel combination of Rpo and Cpo in the high-frequency range reflects the diffusion behavior of the corrosive medium within the coating’s pores and microcracks, while the combination of Rct and Cdl in the low-frequency range characterizes the electrochemical charge transfer process at the substrate–coating interface. Cdl is used instead of an ideal capacitance to compensate for the diffusion effects caused by surface inhomogeneities on the electrode.
The results show that the charge transfer resistance of the two coated groups was approximately 4.7 times that of the NO group, indicating that the addition of ZrO2 significantly suppressed the charge transfer process at the coating/electrolyte interface and reduced the corrosion reaction rate.
NO group: Z (high frequency) = 11.000 cm2, Z′ (low frequency) = 141.9602 cm2, resulting in Rct = 141.96 − 11.00 = 130.9602 cm2.
Group 2: Z (high frequency) = 5.062 cm2, Z′ (low frequency) = 617.22 cm2, yielding Rct = 617.22 − 5.06 = 612.16 cm2.
The Bode plot in Figure 5b further supports the above conclusions. For both groups, the modulus of impedance |Z| in the low-frequency region (0.01–1 Hz) was consistently higher than that of the NO group, and the phase angle plateau was wider with a higher peak, indicating the formation of a denser and more stable passivation film on the surface.
The significant increase in the anodic Tafel slope (from 308.93 mV to 829.78 mV) observed in the polarization curves suggests that the addition of ZrO2 has two effects: first, it raises the electrode potential of the γ-Ni matrix through solid solution strengthening; second, unmelted ZrO2 particles act as a physical barrier to hinder Cl penetration; simultaneously, the refinement of carbides reduces the number of microgalvanic couples. The combined effect of these three factors leads to a substantial increase in charge transfer resistance, thereby enhancing the corrosion resistance of the coating [28].
The results of the EIS analysis are highly consistent with the conclusions drawn from the dynamic potential polarization curves, further confirming that the addition of 2% ZrO2 effectively improves the corrosion resistance of the WC/Ni60 composite coating in a 3.5% NaCl solution.

3.4. Hardness Analysis

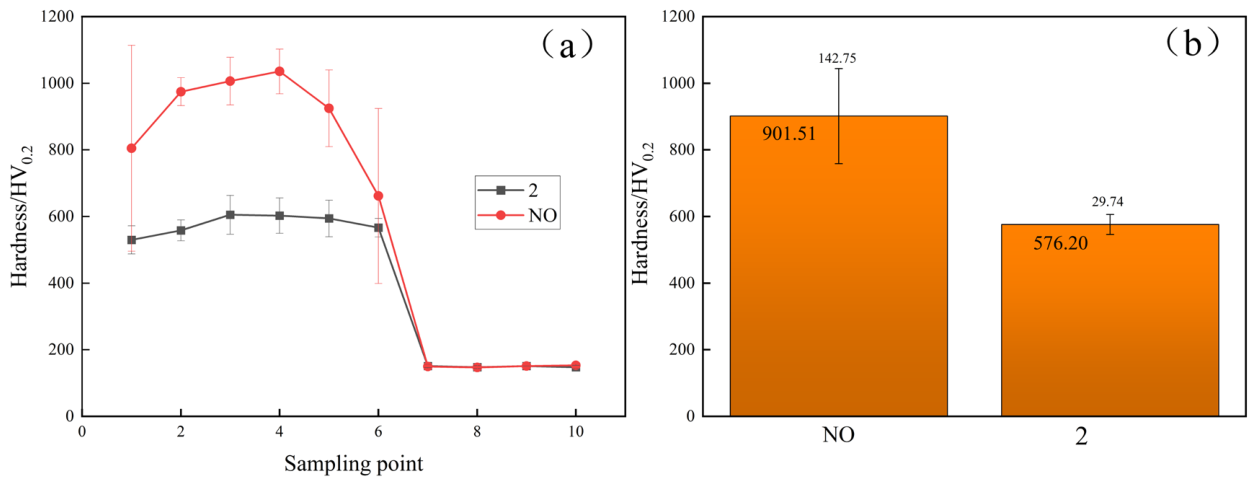
Figure 6a shows the microhardness distribution across the cross-section (from the coating surface to the substrate) for the NO group and Group 2 coatings. Figure 6b compares the average hardness and standard deviation of the two groups of coatings.
As shown in Figure 6b, the NO group (25% WC + 75% Ni60) coating had an average hardness of 901.51 HV0.2 and a standard deviation of 142.75; the average hardness of the Group 2 (25% WC + 73% Ni60 + 2% ZrO2) coating was 576.20 HV0.2, with a standard deviation of 29.74. Both groups of coatings exhibited high hardness (both exceeding 500 HV0.2), far higher than that of the Q235 substrate (approximately 120–160 HV), indicating that laser-clad WC/Ni60 composite coatings can significantly enhance the substrate surface’s resistance to indentation deformation.
In contrast, the NO group’s average hardness was approximately 56.5% higher than that of the 2 group, but the data exhibited extreme dispersion (standard deviation of 142.75, coefficient of variation of 15.8%); whereas the standard deviation of the 2 group’s hardness data was only 29.74, with a coefficient of variation of approximately 5.2%, demonstrating excellent uniformity. This difference is closely related to the microstructural characteristics of the two coating groups.
As can be seen from the cross-sectional hardness distribution in Figure 6a, the hardness values in the NO group fluctuate dramatically within the range of approximately 600–1200 HV0.2, exhibiting a “high-amplitude oscillation” characteristic. Combined with the microstructural analysis in Section 3.2 (Figure 3a and Table 2), the NO group coating contains a large number of coarse, cuboid WC/M23C6/Cr7C3 composite carbides (average size 4.00 μm, maximum 8.65 μm), the microhardness of these carbides is significantly higher than that of the γ-Ni matrix (WC hardness approximately 2200–2400 HV, M23C6 approximately 1200–1500 HV). When the Vickers indenter lands in carbide-rich regions, the measured hardness values are elevated; conversely, when the indenter lands in regions with sparse carbides or the soft γ-Ni phase, the hardness values decrease significantly. The alternating distribution of hard carbides and soft matrix results in significant fluctuations in hardness values [29]. Furthermore, microcracks or pores may exist around the coarse carbides in the NO group (common defects in laser-clad WC/Ni60 coatings), which further exacerbates the instability of the hardness measurements [30].
In sharp contrast to the NO group, the hardness distribution of the two coatings (Figure 6a) remained stable across the entire cross-section, with hardness values primarily concentrated between 550–600 HV0.2 and minimal fluctuations. This uniformity stems from the significant improvement in the microstructure of the coating following the addition of ZrO2: as described in Section 3.2, the carbides in Group 2 transformed from coarse, cuboid particles into fine, irregularly shaped dispersed particles (average size 2.93 μm, maximum 5.36 μm), with a more uniform distribution; simultaneously, the grain size of the γ-Ni matrix was refined from 17.36 nm to 10.84 nm, achieving a grain refinement strengthening effect. The fine carbides are uniformly dispersed within the fine-grained matrix, effectively preventing excessive local aggregation of hard phases and resulting in a consistent hardness distribution [31].
Although the coatings in Group 2 exhibited a more uniform microstructure, their average hardness (576.20 HV0.2) was significantly lower than that of the NO group (901.51 HV0.2). In the NO group, coarse WC and carbides, acting as hard reinforcing phases, directly bear the load during hardness testing, contributing to extremely high local hardness. In Group 2, the addition of ZrO2 suppressed the dissolution of WC and the precipitation of carbides (as evidenced by the weakening of carbide diffraction peaks in XRD and the reduction in C and Cr content in EDS), leading to a decrease in the overall volume fraction of hard carbides in the coating. Although the carbides were refined, their contributions to the indentation response differed in terms of “quantity” and “size”: coarse carbides more effectively resisted indenter penetration, whereas fine carbides may undergo cooperative deformation with the matrix under indenter loading, resulting in relatively lower strengthening efficiency.
XRD analysis indicates that the addition of ZrO2 shifts the γ-Ni peak to the left and increases the lattice constant, confirming that Zr atoms have dissolved into the nickel matrix, producing a solid solution strengthening effect. However, the increase in hardness resulting from solid solution strengthening (typically tens to hundreds of HV) is far insufficient to compensate for the hardness loss caused by the reduction in carbides (approximately 325 HV). Furthermore, although ZrO2 itself has a high hardness (approximately 1200 HV), the addition amount is only 2%, and since some remains unmelted or is distributed as fine particles, its direct contribution to hardness is limited.
In laser-clad WC/Ni60 coatings, high WC content tends to lead to defects such as porosity, unmelted particles, and cracks [32]. Although the NO group exhibited high hardness, the significant fluctuations in hardness values also suggested microstructural inhomogeneity and the possible presence of local defects. In the two groups of coatings, the addition of ZrO2 improved the fluidity of the melt pool, suppressed the formation of coarse carbides, and likely resulted in higher density, thereby reducing the abnormally low hardness values caused by defects. However, the increase in density could not compensate for the hardness loss resulting from the reduction in hard phases. The hardness differences can be attributed to the classic principle that “microstructure determines hardness”: the NO group is characterized by “coarse carbides + relatively coarse γ-Ni grains,” exhibiting high but non-uniform hardness; the Group 2 coatings are characterized by “fine, dispersed carbides + significantly refined γ-Ni grains + Zr solid solution strengthening,” exhibiting lower but extremely uniform hardness. From an engineering application perspective, although the average hardness of Group 2 coatings is lower, they avoid abrupt transitions between local high-hardness and low-hardness regions. This helps reduce stress concentration in the coating under alternating loads or impact conditions, thereby improving resistance to spalling and fatigue [33]. For applications requiring uniform surface wear resistance (such as sliding friction components), the comprehensive performance of Group 2 coatings may be more advantageous; whereas for applications where resistance to abrasive wear is the primary failure mode and hardness fluctuations are permissible, the high hardness of the NO group is more attractive.
Although ZrO2 refines the γ-Ni grains (Hall-Petch strengthening), this effect is dominated by the concurrent reduction in the volume fraction of hard carbide precipitates. The net effect is a substantial decrease in the overall macro-hardness of the composite coating.

3.5. Friction and Wear

3.5.1. Friction Analysis

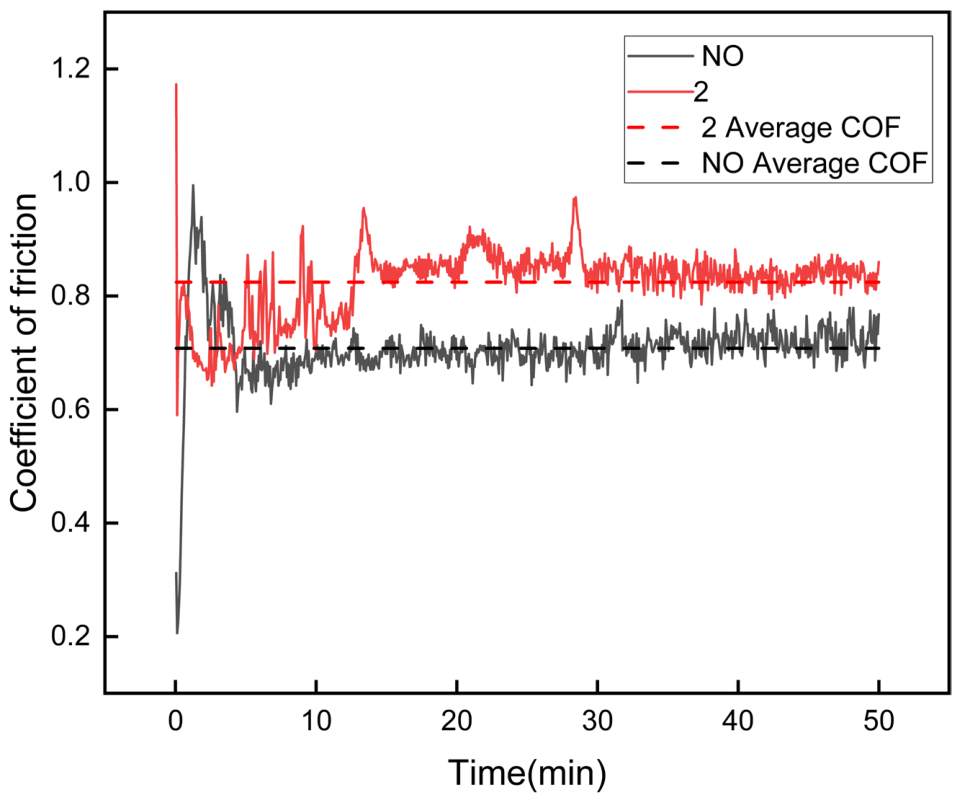
Figure 7 shows the curves of the coefficient of friction versus time for the NO group and Group 2 coatings under dry sliding friction conditions. Figure 7 compares the average coefficients of friction and standard deviations for the two groups of coatings. The average coefficient of friction for the NO group was 0.71, with a standard deviation of 0.025; for Group 2, the average coefficient of friction was 0.85, with a standard deviation of 0.026. The standard deviations for both groups were similar, indicating that the friction process was relatively stable for both; however, the average coefficient of friction for Group 2 was approximately 19.7% higher than that of the NO group.
Based on the evolution of the friction curve, the friction coefficient of the NO-coated group rose rapidly during the initial friction phase (0–5 min), followed by a slight decline, after which it entered a relatively stable friction phase. This initial rise corresponds to the contact adaptation process between the mating pair (GCr15 steel ball) and the coating surface: at the onset of contact, the actual contact area is small and the contact stress is high, causing elastic or plastic deformation of the micro-protrusions, which gradually increases the frictional resistance [34]; As wear progresses, the surface micro-asperities are gradually smoothed out, the contact area increases, and contact stress decreases. Simultaneously, wear debris forms a third-body layer at the friction interface that provides partial lubrication, leading to a slight decrease in the coefficient of friction [35]. Thereafter, the system enters a stable wear phase, with the coefficient of friction maintaining a value between 0.70 and 0.72.
The friction curves of the two coating groups exhibit more complex phased characteristics. During the initial friction stage (0–15 min), the friction coefficient fluctuates significantly, which may be related to the presence of partially unmelted or semi-melted ZrO2 particles on the coating surface. Due to their high hardness (approximately 1200 HV), these ZrO2 particles act as micro-protrusions during the initial friction stage, causing micro-cutting of the mating surface and generating high friction resistance; simultaneously, these particles may peel off the substrate to form hard wear debris, which rolls and embeds within the friction interface, causing significant fluctuations in the friction coefficient [36]. Subsequently, between 15 and 22 min, the friction coefficient tends to stabilize, with reduced fluctuations, indicating that a relatively stable friction layer (composed of oxidation products, wear debris, and partially transferred material) has formed at the wear interface, serving a buffering and lubricating function [37]. Between 22 and 24 min, the friction coefficient rises again before falling back; a distinct peak appears around 27 min. These late-stage fluctuations are typically associated with the accumulation of hard wear particles at the wear interface, as well as the localized rupture and regeneration of the transfer layer [38].
The difference in friction coefficients between the two coating groups can be explained from a microstructural perspective. The NO group coating contains a large number of coarse WC/M23C6/Cr7C3 composite carbides (average size 4.00 μm). These hard phases bear the primary load during friction, effectively resisting micro-cutting of the mating surfaces. At the same time, they are not prone to large-scale spalling, resulting in relatively fine wear particles and a stable third-body layer. Consequently, the friction coefficient is low and stable [39]. Although the carbides in the Group 2 coating are finer and more uniformly distributed, the addition of ZrO2 alters the wear mechanism. The high hardness and chemical inertness of ZrO2 particles allow them to maintain sharp edges at the friction interface, continuously exerting plowing and micro-cutting effects on the mating surface, thereby increasing frictional resistance. At the same time, the interfacial bonding strength between ZrO2 particles and the substrate is limited; under shear stress, delamination may occur, generating additional abrasive wear components that further elevate the coefficient of friction [40]. Furthermore, the two coated groups had lower hardness (average 576.20 HV0.2 vs. 901.51 HV0.2 for the NO group), resulting in a larger actual contact area under the same load, which also led to an increase in the coefficient of friction [41].

3.5.2. Wear Analysis

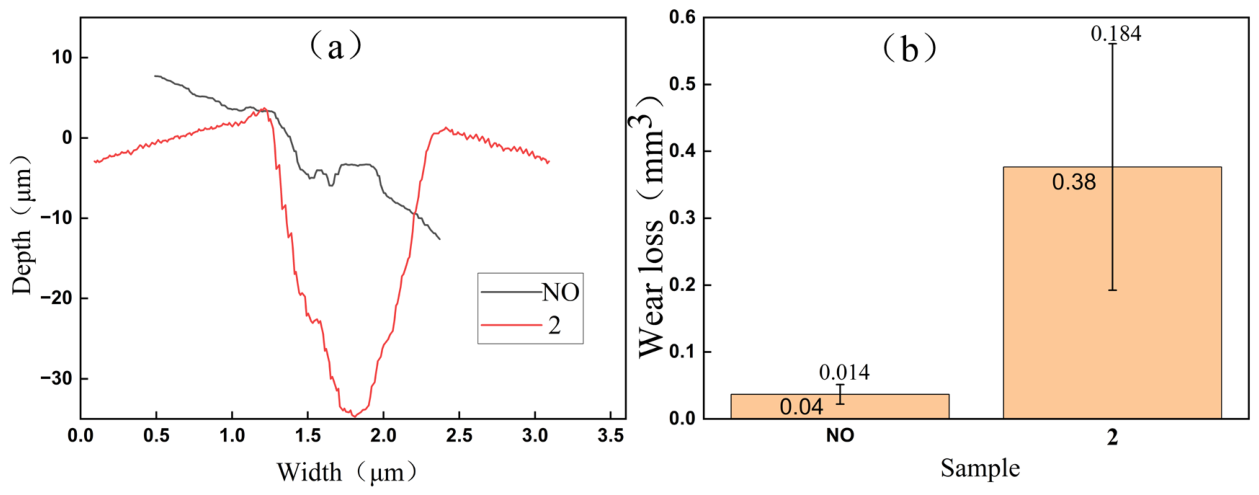
Figure 8a shows the surface profile curves of the two coating groups after wear, and Figure 8b shows the corresponding wear volumes and standard deviations. The wear volume of the NO group coating was 0.04 mm3, with a standard deviation of 0.014; that of the Group 2 coating was 0.38 mm3, with a standard deviation of 0.184. As shown in the profile in Figure 8a, the wear depth of the NO group was approximately 0 μm (with virtually no material loss on the surface), while that of Group 2 reached 3.5 μm, representing a difference in an order of magnitude between the two. The wear volume of Group 2 was approximately 9.5 times that of the NO group, indicating that the addition of 2% ZrO2 significantly reduced the coating’s wear resistance. The standard deviation of the wear volume for Group 2 (0.184) was much larger than that of the NO group (0.014), reflecting that the wear process was more sensitive to local microstructural variations.
According to Archard’s law of wear, the volume loss due to adhesive wear and abrasive wear is inversely proportional to material hardness [42]. The average hardness of the NO group was 901.51 HV0.2, while that of Group 2 was only 576.20 HV0.2, representing a decrease of approximately 36%. The low-hardness coating is more susceptible to plastic extrusion and micro-cutting under the indentation and plowing forces of the GCr15 counterface (hardness approximately 750–850 HV), leading to rapid material removal.
The average coefficient of friction for Group 2 (0.85) was higher than that of the NO group (0.71). Under the same normal load (20 N), the higher tangential force caused the wear interface to accumulate greater shear strain energy, accelerating fatigue spalling and the formation of wear debris [43]. The combined effect of the increased friction coefficient and reduced hardness further elevated the wear rate. Although the addition of ZrO2 refined the carbides, the ZrO2 hard particles (~1200 HV) that were not fully fused or delaminated acted as “micro-abrasives” on the softened surface of Group 2 coatings. Under normal loads, these particles are pressed into the coating and slide along the mating pair, causing severe plowing and micro-cutting; detached ZrO2 wear particles entering the friction interface lead to three-body abrasive wear, further accelerating material removal [44]. In contrast, in the NO group, coarse carbides form an integral load-bearing framework with the hard matrix, providing greater resistance to particle embedding. The standard deviation of wear volume in Group 2 (0.184) was significantly greater than that in the NO group (0.014), indicating that the wear process is sensitive to local microstructural variations. The uneven distribution of ZrO2 particles (local agglomeration or incomplete melting) may lead to exceptionally severe abrasive wear in specific regions, while the reduction in carbide size also results in greater fluctuations in the surface load-bearing capacity. In contrast, the NO group’s coarse but relatively stable carbide network provides a uniform load-bearing platform, resulting in highly predictable wear behavior.
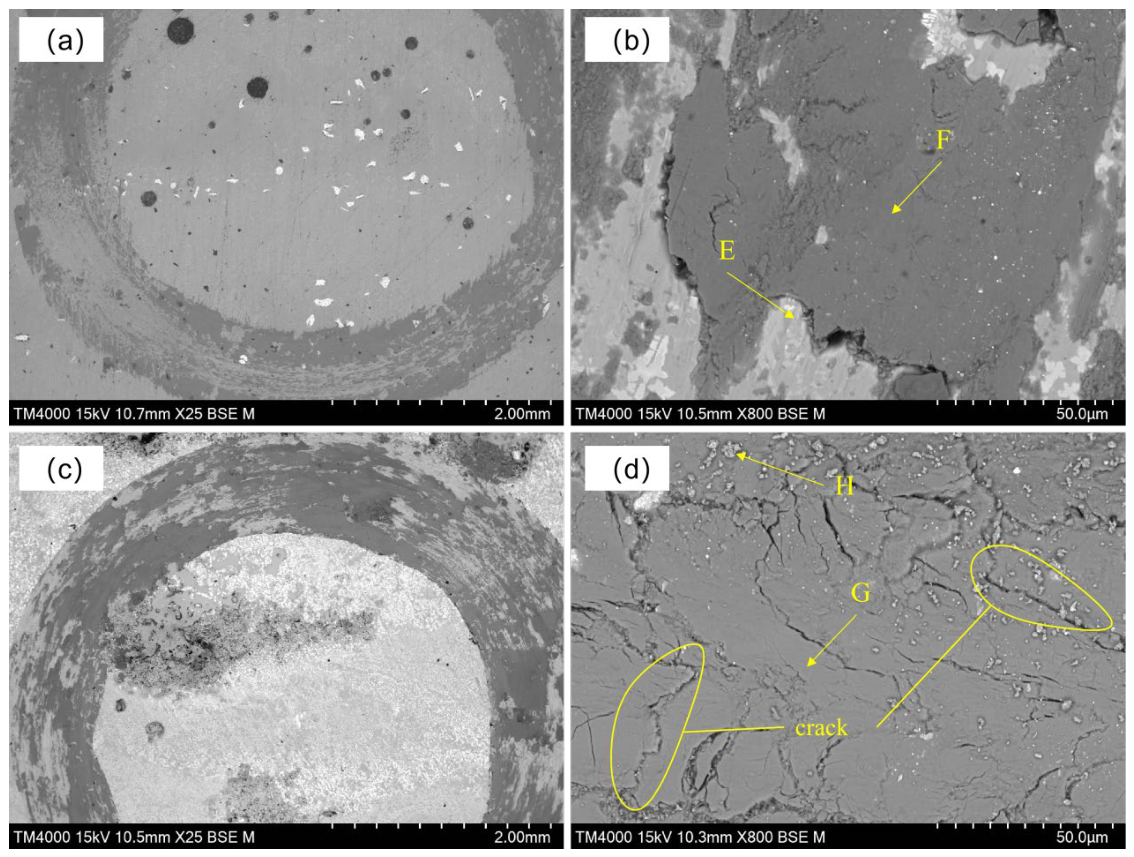
Low-magnification morphology (Figure 9a) shows that the worn surface of the NO group is generally smooth, with shallow and sparse plow marks and only minor scratches in localized areas. High-magnification morphology (Figure 9b) further reveals that the surface is covered by a dense, continuous friction layer, with no obvious spalling pits or signs of large-scale material removal. EDS analysis indicated that point E (the original coating area) was rich in Ni (28.35 at.%), Cr (25.28 at.%), and W (8.76 at.%), while the O content was low (13.13 at.%), representing carbides and a γ-Ni matrix that had not been severely damaged; Point F, on the other hand, exhibits high O (48.63 at.%), high Fe (25.27 at.%), and low Ni/Cr/W content, indicating that these areas are covered by a transfer layer of iron oxide originating from the GCr15 mating pair. Based on a comprehensive analysis, the wear mechanism of the NO group is mild abrasive wear combined with oxidative wear. The coarse WC/M23C6 carbides form a hard matrix that effectively resists plowing by the mating surface. The resulting oxide layer is thin and stable, with no significant spalling observed; consequently, the wear depth is approximately 0 μm, and the wear volume is only 0.04 mm3.
Low-magnification images (Figure 9c) show two sets of coatings; the worn surfaces of both sets are extremely rough, featuring numerous deep grooves parallel to the sliding direction and multiple spalling pits. High-magnification images (Figure 9d and EDS spot analyses) reveal material tearing, microcracks, and accumulations of loose wear debris on the surface.
The EDS elemental composition of the worn surface at points E–H (marked in Figure 9b,d) after the wear test is shown in Table 4. Points G and H were selected for focused EDS analysis. Point G is located in the oxide layer region at the edge of a spalling pit, and its atomic composition is: O 53.52%, Fe 37.49%, Ni 2.65%, Cr 1.74%, W 1.34%, Zr 0.20%. This spot exhibits an extremely high oxygen content, while Ni, Cr, and W are extremely low, indicating that the original coating has been completely destroyed at this location and the surface is covered by a thick iron oxide transfer layer derived from GCr15 steel balls. The Zr content is only 0.20%, far lower than the 0.87% found in the unworn substrate, confirming that ZrO2 particles have detached in this area.
Point H consists of fallen debris (the area of loose particles in Figure 9d), with the following atomic composition: O 36.24%, Fe 33.95%, Ni 15.56%, Cr 3.62%, W 2.50%, Zr 0.29%. The relatively high Ni content at this point (15.56%), along with a certain amount of Cr and W, indicates that this debris originated from a mixture of the coating matrix and carbides; meanwhile, the similarly high O and Fe contents suggest that the debris underwent oxidation during the friction process and became mixed with iron from the mating surface. The Zr content (0.29%) is significantly lower than that of the unworn substrate, indicating that ZrO2 particles in the debris have partially detached. The chemical composition at Point H further confirms that both coating groups underwent severe delamination during the wear process; the detached fragments not only contained the original coating materials (Ni, Cr, W, Zr) but also entrained oxidation products and iron transfer products. These hard debris rolled and embedded themselves at the friction interface, exacerbating three-body abrasive wear.
The EDS data from points G and H collectively reveal that, due to their low hardness (576 HV), the two coating groups were easily indented into the surface of the GCr15 steel balls, triggering severe adhesive transfer (massive Fe deposition), oxidative wear (O content of 36–53%), and delamination (debris from point H). ZrO2 particles in the original coating delaminated under shear stress (Zr content decreased from 0.87% to 0.20–0.29%); the detached hard ZrO2 particles, together with coating debris, acted as abrasive particles, carving deep grooves into the softened coating surface and exacerbating three-body abrasive wear. Carbides (with decreased W content) were also pulled out or fractured, losing their load-bearing capacity. Consequently, the wear depth in Group 2 reached 3.5 μm, with a wear volume of 0.38 mm3—approximately 4.6 times that of the NO group.
Although the addition of 2% ZrO2 refined the grain size and carbides, it led to matrix softening and the detachment of hard phases, shifting the wear mechanism from mild oxidative wear to severe adhesive-abrasive wear, which significantly degraded the coating’s wear resistance.
In this study, the increase in the friction coefficient and the decrease in wear resistance are not causally related, but rather represent parallel manifestations of the same microstructural evolution process in two different physical dimensions: energy dissipation and material removal. The rise in the friction coefficient is mainly controlled by interfacial shear behavior (including adhesive effects and plowing effects), whereas the increase in wear volume is governed by the material’s resistance to plastic deformation and fracture (i.e., the hardness term in Archard’s law). Both are regulated by microstructural changes induced by ZrO2 addition through different physical pathways—the former dominated by real contact area and the morphology of third-body wear particles, and the latter dominated by macroscopic hardness and the integrity of the carbide load-bearing skeleton—thus exhibiting an evolution pattern that appears contradictory but is actually logically consistent.
The wear depth of Group NO was nearly zero, indicating that only slight polishing or oxidation occurred on its surface, with no measurable material loss; this is classified as mild abrasive wear or oxidation-dominated wear. Group 2, however, exhibited a distinct plow-like wear pattern of 3.5 μm, which is attributed to severe abrasive wear combined with a fatigue spalling mechanism. Although the addition of 2% ZrO2 improved the microstructural uniformity and corrosion resistance of the coating, it had a significant negative effect on wear resistance. These results suggest that for operating conditions where wear resistance is the primary objective, ZrO2 should not be added indiscriminately. If both corrosion resistance and a certain level of wear resistance are required, the ZrO2 content should be optimized (e.g., reduced to 1%) or a gradient coating design should be adopted to balance hardness and toughness.
The apparent paradox that the 2% ZrO2 group exhibits finer matrix grains and carbides but lower wear resistance is resolved by recognizing that the volume fraction of hard carbides is more critical for wear resistance than matrix grain size. While grain refinement via Hall–Petch increases hardness modestly (+50–100 HV), the concurrent reduction in carbide volume fraction (evidenced by weakened XRD peaks and reduced Cr/C content in carbides) causes a substantial hardness loss (−300–400 HV). Net result: hardness decreases from 901 HV to 576 HV, increasing wear volume per Archard’s law. Additionally, detached ZrO2 particles act as third-body abrasives, further accelerating material removal. The beneficial effect of grain refinement cannot compensate for the loss of hard carbide reinforcement.

4. Conclusions

(1) Upon the addition of 2% ZrO2, Zr atoms were solid-solved into the γ-Ni lattice, resulting in an increase in the lattice constant. At the same time, the ZrO2 particles suppressed grain growth, reducing the γ-Ni grain size from 17.36 nm to 10.84 nm; the carbide morphology transformed from coarse cuboid shapes (average 4.00 μm) to fine, uniformly dispersed irregular particles (average 2.93 μm), with significantly improved distribution uniformity.
(2) The NO group had an average hardness of 901.51 HV0.2, but hardness fluctuated dramatically (standard deviation 142.75) due to the alternating distribution of coarse carbides and a soft matrix; the Group 2 average hardness decreased to 576.20 HV0.2, with a uniform hardness distribution (standard deviation 29.74). The friction coefficient of Group 2 (0.85) was higher than that of the NO group (0.71), and the wear volume (0.38 mm3) was approximately 9.5 times that of the NO group (0.04 mm3), indicating that ZrO2 sacrificed hardness and wear resistance but improved hardness consistency.
(3) In a 3.5% NaCl solution, the corrosion potential of Group 2 shifted positively by 38 mV, the corrosion rate decreased from 0.7234 mm·a−1 to 0.7071 mm·a−1, and the anodic Tafel slope increased significantly, indicating a slight improvement in corrosion resistance. In summary, the addition of 2% ZrO2 in WC/Ni60 composite coatings achieves grain refinement, carbide homogenization, and improved corrosion resistance, but significantly reduces hardness and wear resistance. It is suitable for operating conditions where corrosion resistance and microstructural uniformity are the primary considerations.

Author Contributions

Conceptualization, X.W.; methodology, J.W.; software, X.W.; validation, X.W.; formal analysis, X.W. and D.C.; investigation, X.W. and D.C.; resources, D.C.; data curation, J.W.; writing—original draft preparation, X.W.; writing—review and editing, X.W. and D.C.; visualization, J.W.; supervision, D.C.; project administration, X.W. and D.C.; funding acquisition, J.W. and D.C. All authors have read and agreed to the published version of the manuscript.

Funding

The Zhanjiang Science and Technology Plan Project (No. 2021A05171), the Laser Processing Team Project of Guangdong Ocean University (No. CCTD201823), Zhanjiang Science and Technology Program (No. 2025B01138), Guangdong Ocean University Education Reform Project (NO.PX-972025125), Zhanjiang Science and Technology Program (No.2024B01107), and Ministry of Education Industry-Academia Cooperation and Collaborative Education Project (NO.231104082170913).

Institutional Review Board Statement

Not applicable.

Informed Consent Statement

Not applicable.

Data Availability Statement

Data are contained within the article.

Conflicts of Interest

The authors declare no conflicts of interest.

References

  1. Wu, X.; Chen, J.; Huang, J.; Shi, W.; Wang, Q.; An, F.; Wu, J. Laser-Melted Wc/Ni-Based Coating Remelting Study on Q235 Steel Surface. Coatings 2024, 14, 1172. [Google Scholar] [CrossRef]
  2. Cao, Y.; Yan, K.; Shi, W.; Zhou, R.; Li, B.; Qin, J. Experimental Study on the Microstructure and Tribological Properties of Laser-Clad Ni60-WC Composite Coatings. Materials 2024, 17, 4638. [Google Scholar] [CrossRef] [PubMed]
  3. Ma, Q.; Li, Y.; Wang, J.; Liu, K. Investigation on cored-eutectic structure in Ni60/WC composite coatings fabricated by wide-band laser cladding. J. Alloys Compd. 2015, 645, 151–157. [Google Scholar] [CrossRef]
  4. Qunshuang, M.; Yajiang, L.; Juan, W.; Kun, L. Microstructure evolution and growth control of ceramic particles in wide-band laser clad Ni60/WC composite coatings. Mater. Des. 2016, 92, 897–905. [Google Scholar] [CrossRef]
  5. Yang, G.R.; Huang, C.P.; Song, W.M.; Li, J.; Lu, J.J.; Ma, Y.; Hao, Y. Microstructure characteristics of Ni/WC composite cladding coatings. Int. J. Miner. Metall. Mater. 2016, 23, 184–192. [Google Scholar] [CrossRef]
  6. Tian, X.; Chen, B.; Yang, X.; Liu, Y.; Wang, K.Q.; Wang, Y.Q. Effect of WC content on microstructure and properties of WC/Ni60 laser cladding layer. China Laser 2025, 2, 0402205. [Google Scholar] [CrossRef]
  7. Wang, J.; Cui, X.; Zhao, Y.; Zhang, Y.; Fan, X.; Jiang, J.; Jin, G. Effect of nano-ZrO2 protective layer on the microstructure and surface property strengthening mechanism of underwater wet laser Fe-based cladding layer. Mater. Charact. 2023, 206, 113392. [Google Scholar] [CrossRef]
  8. Xiao, Y.; Xiao, H.; Mo, T.; Ren, L.; Tian, Y.; Zhu, L. High-temperature and interfacial oxidation of MAX phase-reinforced composite coatings deposited by laser cladding on Zr alloy substrates. Ceram. Int. 2023, 49, 38672–38682. [Google Scholar] [CrossRef]
  9. Liang, F.; Shi, W.; Li, D.; Xue, M. Synergistic regulation of microstructure evolution and wear/corrosion resistance performance of Ni-based/WC coatings by CeO2 and ZrO2. China Laser 2026, 53, 1602602. [Google Scholar]
  10. Tong, Z.; Chen, X.; Peng, K.; Chen, L.; Mao, X.; Lu, A. Influence of ZrO2 Nanoparticles on Microstructure and Properties of Additive Manufactured Magnesium Alloys. J. Alloys Compd. 2025, 1047, 185017. [Google Scholar] [CrossRef]
  11. Anuchkin, S.N.; Kazenas, E.K.; Volchenkova, V.A.; Andreeva, N.A.; Penkina, T.N. Investigation of the zirconium forms in nickel melts containing exogenous refractory oxide nanophases. Inorg. Mater. Appl. Res. 2018, 9, 546–550. [Google Scholar] [CrossRef]
  12. Zhang, P.; Liu, C.; Pang, Y. Effects of ZrW2O8 Content on the Microstructures and Properties of Composite Coatings Produced by Laser Cladding. Coatings 2024, 14, 649. [Google Scholar] [CrossRef]
  13. Wu, J.; Zhang, J.; Chen, D.; Huang, J.; Shi, W.; An, F.; Wu, X. Study on the Effect of CeO2 on the Performance of WC + Ni60 Laser Cladding Coating. Lubricants 2025, 13, 24. [Google Scholar] [CrossRef]
  14. Yang, Y.; Li, J.; Yao, F.; Li, X. Effect of laser remelting on the organization and properties of WC/Ni-based coatings generated in situ by laser cladding. J. Manuf. Process. 2023, 102, 501–512. [Google Scholar] [CrossRef]
  15. Bu, A.; Ji, G.; Liu, Q.; Shi, Z. Effect of different zirconium contents on the corrosion resistance of ZrO2-TiO2 film-coated stainless steel. J. Mater. Eng. Perform. 2018, 27, 5321–5328. [Google Scholar] [CrossRef]
  16. Elahi Haghighi, N.; Hadianfard, M.J. Fabrication of Ni-ZrO2 nanocomposites through a new electroforming bath and Assessment of their morphology, wear, and corrosion resistance. Heliyon 2024, 10, e35779. [Google Scholar] [CrossRef] [PubMed] [PubMed Central]
  17. Liu, H.; Hao, J.; Niu, Q.; Du, Q.; Zheng, X.; Liu, H.; Yang, H. Influence of ultrasonic assistance on the microstructure and friction properties of laser cladded Ni60/WC composite coatings. J. Alloys Compd. 2025, 1010, 177149. [Google Scholar] [CrossRef]
  18. Yan, Z.B.; Li, W.Z.; Lei, S.Y.; Yang, R.X.; Zeng, D.C. Microstructure and Tribological Properties of In Situ-Synthesized WC-Reinforced Ni60 Coatings Prepared by Laser Cladding with Different Scanning Rates. J. Therm. Spray Technol. 2024, 33, 1404–1416. [Google Scholar] [CrossRef]
  19. Li, J.; Yang, Y.; Yao, F.; Zheng, F. Effect of laser remelting on internal defects and properties of Ni-based coatings reinforced by multi-channel WC in situ. Mater. Today Commun. 2024, 38, 108375. [Google Scholar] [CrossRef]
  20. Zhou, P.J.; Yu, J.J.; Sun, X.F.; Guan, H.R.; Hu, Z.Q. Roles of Zr and Y in cast microstructure of M951 nickel-based superalloy. Trans. Nonferrous Met. Soc. China 2012, 22, 1594–1598. [Google Scholar] [CrossRef]
  21. Zhang, B.; Liu, K.; Li, J.; Chen, B.; Huang, C.J.; Soboleva, N. A comprehensive review on the rare earth elements improving microstructure and properties of laser cladded coatings. J. Alloys Compd. 2025, 1036, 181761. [Google Scholar] [CrossRef]
  22. Fu, L.; Li, B.; Xu, G.; Huang, J.; Engqvist, H.; Xia, W. Size-driven phase transformation and microstructure evolution of ZrO2 nanocrystallites associated with thermal treatments. J. Eur. Ceram. Soc. 2021, 41, 5624–5633. [Google Scholar] [CrossRef]
  23. Huang, L.F.; Xie, Y.; Sieradzki, K.; Rondinelli, J.M. Elemental partitioning and corrosion resistance of Ni–Cr alloys revealed by accurate ab-initio thermodynamic and electrochemical calculations. npj Mater. Degrad. 2023, 7, 94. [Google Scholar] [CrossRef]
  24. Li, B.; Mei, T.; Du, S.; Zhang, W. Synthesis of Ni–Fe and Ni–Fe/ZrO2 composite coating and evaluation of its structural and corrosion resistance. Mater. Chem. Phys. 2020, 243, 122595. [Google Scholar] [CrossRef]
  25. Basha, O.A.; Pugazhenthi, I.; Rehan, K.M.; Safiullah, S.M. Electrochemical and structural evaluation of Poly (VTZ-co-GMA)/ZrO2 nanocomposite coatings for corrosion protection of mild steel. Chem. Pap. 2026, 80, 1989–2004. [Google Scholar] [CrossRef]
  26. Hu, Z.; Li, Y.; Lu, B.; Tan, N.; Cai, L.; Yong, Q. Effect of WC content on microstructure and properties of high-speed laser cladding Ni-based coating. Opt. Laser Technol. 2022, 155, 108449. [Google Scholar] [CrossRef]
  27. Aruna, S.T.; Latha, S.; Lakshmi, R.V. Multifunctional Properties of Electrodeposited Nickel Composite Coating Containing Nanosized Monoclinic Zirconia Particles. J. Metall. Mater. Sci. 2020, 62, 63–74. [Google Scholar]
  28. Wang, J.; Liu, X.; Xi, X.; Xu, N.; Lin, J.; Qin, Z.; Hu, J. Improving corrosion resistance associated with martensite in austenitic stainless steel by modulating variant selection. Corros. Sci. 2026, 265, 113792. [Google Scholar] [CrossRef]
  29. Bajwa, R.S.; Khan, Z.; Bakolas, V.; Braun, W. Water-lubricated Ni-based composite (Ni–Al2O3, Ni–SiC and Ni–ZrO2) thin film coatings for industrial applications. Acta Metall. Sin. (Engl. Lett.) 2016, 29, 8–16. [Google Scholar] [CrossRef]
  30. Benea, L. Electrodeposition and tribocorrosion behaviour of ZrO2–Ni composite coatings. J. Appl. Electrochem. 2009, 39, 1671–1681. [Google Scholar] [CrossRef]
  31. Tong, Y.; Liu, Z.; Yang, Z.; Zhang, Y.; He, L.; Wang, X.; Chen, S. Microstructure and wear behavior of Ni alloy/ZrO2/Ni@ MoS2 composite coating produced by laser cladding technology on titanium alloy. J. Manuf. Process. 2025, 155, 337–354. [Google Scholar] [CrossRef]
  32. Chen, C.; Feng, A.; Wei, Y.; Wang, Y.; Pan, X.; Song, X. Effects of WC Particles on Microstructure and Wear Behavior of Laser Cladding Ni60 Composite Coatings. Opt. Laser Technol. 2023, 163, 109425. [Google Scholar] [CrossRef]
  33. Jian, W.; Yinfang, J.; Guoqing, W.; Dejun, K. Laser cladded Ni60WC coatings: Structure evolution, atomic model and electrochemical corrosion. J. Mater. Res. Technol. 2025, 38, 840–852. [Google Scholar] [CrossRef]
  34. Dong, W.; Wang, L.; Han, M.; Wang, W.; Liu, G.; Liu, S.; Liu, X. Effect of large-size micro-convex surface on tribological performance of spherical Ti-6Al-4V/Al-7Si-0.3 Mg composite. Tribol. Int. 2025, 214, 111316. [Google Scholar]
  35. Zheng, W.; Zong, X.; Han, J.; Dang, G.; Chen, L.; Xu, S. Dry Friction Behavior during Plastic Deformation of a 6063 Al Alloy at Micro–mesoscopic Scale. J. Mater. Eng. Perform. 2026, 35, 6011–6021. [Google Scholar]
  36. Huang, X.; Chen, Y.; Jiang, J.; Lian, G.; Chen, C. The Influences of Ultrasonic Vibrations on Laser Cladding Ni60/WC-TiO2+La2O3 Composite Coating. Materials 2023, 16, 6356. [Google Scholar] [CrossRef] [PubMed]
  37. Xiao, Y.; Cheng, Y.; Shen, M.; Yao, P.; Du, J.; Ji, D.; Hua, L. Friction and wear behavior of copper metal matrix composites at temperatures up to 800 C. J. Mater. Res. Technol. 2022, 19, 2050–2062. [Google Scholar] [CrossRef]
  38. Li, Y.; Qiu, Y.; Shi, Y.; Jiang, G.; Bai, P. Microstructure, wear and corrosion resistance of Ni-based composite coating by multi-layer laser cladding. Mater. Today Commun. 2024, 41, 110369. [Google Scholar] [CrossRef]
  39. Pedrizzetti, G.; Paglia, L.; Genova, V.; Cinotti, S.; Bellacci, M.; Marra, F.; Pulci, G. Microstructural, mechanical and corrosion characterization of electroless Ni-P composite coatings modified with ZrO2 reinforcing nanoparticles. Surf. Coat. Technol. 2023, 473, 129981. [Google Scholar] [CrossRef]
  40. Arghavanian, R.; Parvini-Ahmadi, N. The effect of co-electrodeposited ZrO2 particles on the microstructure and corrosion resistance of Ni coatings. J. Solid State Electrochem. 2011, 15, 2199–2204. [Google Scholar]
  41. Weber, B.; Suhina, T.; Junge, T.; Pastewka, L.; Brouwer, A.M.; Bonn, D. Molecular probes reveal deviations from Amontons’ law in multi-asperity frictional contacts. Nat. Commun. 2018, 9, 888. [Google Scholar] [CrossRef] [PubMed]
  42. Zhu, M.H.; Fan, X.Q.; Cai, Z.B.; Peng, J.F.; Sun, Q. Surface engineering design on alleviating fretting wear: A review. Surf. Sci. Technol. 2023, 1, 4. [Google Scholar] [CrossRef]
  43. Obadele, B.A.; Ige, O.O.; Olubambi, P.A. Microstructural Evolution and Tribocorrosion Performance of Novel Laser Clad Ti-Ni-ZrO2 Composite Coatings in 3.5% NaCl Solution. In Processing, Properties, and Design of Advanced Ceramics and Composites II: Ceramic Transactions; Ceramic Transactions Series; Wiley: Hoboken, NJ, USA, 2018; Volume 261, pp. 353–363. [Google Scholar] [CrossRef]
  44. Liu, D.; Yang, X.; Zhao, A.; Cheng, X.; Zhang, Q. Preparation of nickel-based composite coatings by laser cladding technology: A review. Int. J. Adv. Manuf. Technol. 2024, 134, 3107–3137. [Google Scholar] [CrossRef]
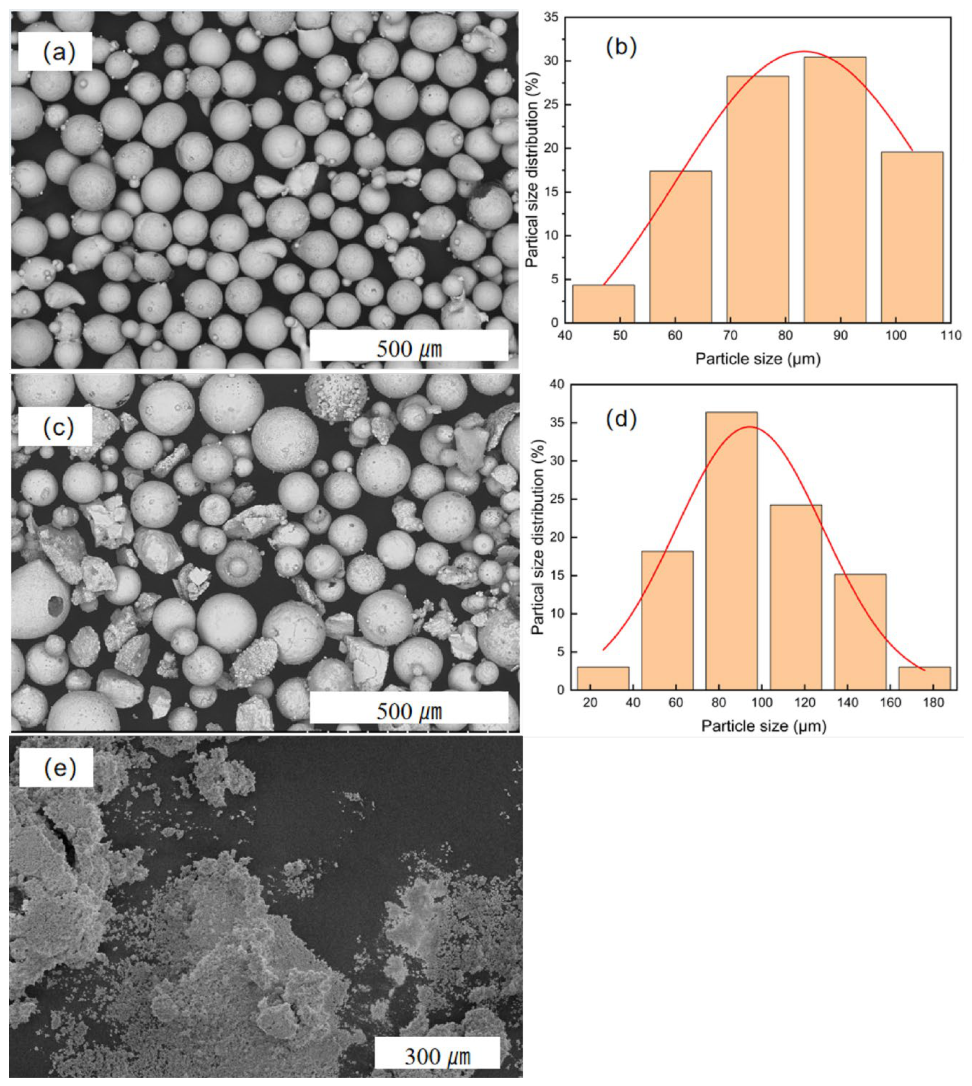
Figure 1. Morphology and particle size distribution of raw powders. (a) Morphology of Ni60 powder; (b) Particle size distribution curve for Ni60; (c) Morphology of WC powder; (d) particle size distribution curve for WC; (e) Micro-morphology of fine block-shaped ZrO2 powder.
Coatings 16 00857 g001
Figure 2. Characterization of Coating Phases.
Coatings 16 00857 g002
Figure 3. Scanning electron microscope images of sample cross-sections. (a) Morphology of the NO sample. (b) Morphology of the 2 sample. (c) Size distribution of carbide particles in the NO sample. (d) Size distribution of carbide particles in the 2 sample.
Coatings 16 00857 g003
Figure 4. Polarization Curve.
Coatings 16 00857 g004
Figure 5. Bode plots of the NO group and Group 2 coatings in a 3.5% NaCl solution. (a) Curve showing the variation in the impedance magnitude |Z| with frequency f; (b) Curve showing the variation in the phase angle θ with frequency f; (c) Equivalent circuit diagram.
Coatings 16 00857 g005
Figure 6. Coating Hardness. (a) Cross-sectional hardness of the coating (b) Average hardness of the coating.
Coatings 16 00857 g006
Figure 7. Friction Coefficient Plot.
Coatings 16 00857 g007
Figure 8. Wear Diagram. (a) Surface profile curves of the two coated samples after wear (b) Wear volume and standard deviation.
Coatings 16 00857 g008
Figure 9. Morphology of the cladding layer after wear. (a) Surface morphology of the worn coating in Group NO at 25× magnification; (b) Group NO after wear at 800× magnification. (c) Surface morphology of Group 2 after wear at 25× magnification; (d) Surface morphology of Group 2 after wear at 800× magnification.
Coatings 16 00857 g009
Table 1. Ni60 powder and Q235 chemical composition (mass fraction, %).
ElementCCrBMnSiFePSNi
Ni600.8–1.214–163–3.5-3.5–4.014–150.020.02Bal
Q2350.22--0.3–0.70.35Bal0.0450.05-
Table 2. Distribution of the main elements of EDS scan points.
EltCOSiPSCrMnFeNiZrW
Spectrum AAtomic %13.5710.652.160.420.1836.000.096.7216.86-11.31
Weight %2.822.951.050.220.1032.390.086.4917.13-35.97
Spectrum BAtomic %14.4414.998.970.060.003.310.076.0347.23-0.81
Weight %4.145.726.010.040.004.110.098.0466.17-3.57
Spectrum CAtomic %8.622.142.820.120.049.620.2035.7630.190.0810.04
Weight %1.630.541.240.060.027.860.1731.3727.840.1129.00
Spectrum DAtomic %14.203.093.700.000.035.780.1435.1534.250.273.01
Weight %3.280.952.000.000.025.780.1537.7838.690.4710.67
Table 3. Fitting parameters for the coating Tafel curve.
Sampleba (mV)bc (mV)i0 (A·cm−2)E0 (V vs. SCE)Corrosion Rate (mm·a−1)
NO308.93145.976.1665 × 10−5−0.940340.7234
2829.78130.666.0274 × 10−5−0.902290.7071
Table 4. EDS results after wear of the cladding layer.
EltCOCrFeNiZrW
Spectrum EAtomic %18.0913.1325.286.4028.3508.76
Weight %4.043.9124.466.6630.97029.96
Spectrum FAtomic %8.6648.624.8125.2710.4600.80
Weight %3.1123.277.4842.2318.3704.38
Spectrum GAtomic %1.8253.521.7437.492.650.201.34
Weight %0.6224.312.5759.444.410.537.01
Spectrum HAtomic %5.3636.243.6233.9515.560.292.50
Weight %1.5313.804.4845.1221.730.6210.94
Disclaimer/Publisher’s Note: The statements, opinions and data contained in all publications are solely those of the individual author(s) and contributor(s) and not of MDPI and/or the editor(s). MDPI and/or the editor(s) disclaim responsibility for any injury to people or property resulting from any ideas, methods, instructions or products referred to in the content.