Article

Additive Manufacturing of (Fe/C)/ABS Composites: Microwave Absorption Performance and Loss Mechanism

1
The Engineering Technology Center, Southwest University of Science and Technology, Mianyang 621000, China
2
The School of Manufacturing Science and Engineering, Southwest University of Science and Technology, Mianyang 621000, China
3
Chongqing Chuanyi Automation Co., Ltd. Crystal Technology Branch, Chongqing 404100, China
*
Authors to whom correspondence should be addressed.
These authors contributed equally to this work.
Coatings 2026, 16(7), 824; https://doi.org/10.3390/coatings16070824
Submission received: 6 June 2026 / Revised: 3 July 2026 / Accepted: 9 July 2026 / Published: 11 July 2026

Abstract

(Fe/C)/ABS resin electromagnetic metamaterials were fabricated via 3D printing, and the effect of iron salt loading (0, 1, 2, and 3 g) in the Fe/C filler on the microwave absorption performance of the resulting composites was systematically investigated. The results demonstrate that, with increasing iron salt content, the microwave absorption bandwidth of the samples exhibits a trend of initial significant broadening followed by saturation. At an iron salt loading of 1 g, the (Fe/C)/ABS resin composite achieves an effective absorption bandwidth (EAB) of 6.2 GHz at a matching thickness of 10 mm, representing an approximately 48% enhancement over that of the pure C/ABS resin composite (4.2 GHz). The incorporation of iron salts not only endows the material with magnetic loss capability but also promotes the formation of an sp2-hybridized carbon framework within the carbon matrix during Fe/C composite preparation, concurrently introducing abundant defect sites that augment the dielectric loss capacity. Under the synergistic magneto-dielectric loss mechanism, the microwave attenuation coefficient of the material is markedly enhanced, and the effective absorption bandwidth is substantially broadened, all at a filler loading of merely 2.5 wt%. This study elucidates the influence of iron salt loading on the microwave absorption performance of (Fe/C)/ABS resin composites, while the 3D printing-based fabrication approach employed herein offers a promising technical pathway for the development of novel microwave-absorbing materials.

1. Introduction

With the rapid development of fifth-generation (5G) and future sixth-generation (6G) communication technologies and high-frequency electronic devices, increasingly severe electromagnetic interference (EMI) and electromagnetic pollution have become critical challenges threatening the reliability of electronic equipment and human health [1,2]. Simultaneously, in the field of national defense science and technology, high-performance electromagnetic wave absorbing materials represent a core technology for achieving radar stealth capabilities of military targets [3,4]. Consequently, the development of advanced electromagnetic wave absorbing materials featuring ‘strong absorption, broad bandwidth, thin thickness, and light weight’ has emerged as a frontier research direction in materials science and electromagnetic functional devices [5,6,7].
Carbon-based materials, by virtue of their low density, high dielectric loss, and chemical stability [8,9], have become preferred candidates for microwave-absorbing matrices. However, their inherent limitation of relying solely on dielectric loss without magnetic loss contributions [10] readily leads to impedance matching imbalance, making it difficult to satisfy the requirements of high-efficiency broadband absorption. By introducing magnetic metals and their oxide components such as Fe, Ni, and Co [11,12], a carbon-based/magnetic composite absorbing system can be constructed, which introduces a magnetic loss mechanism while retaining the excellent dielectric properties of carbon materials, thereby achieving synergistic enhancement of dielectric and magnetic losses. Furthermore, the introduction of metallic heterostructures can modulate the electrical conductivity of the system, increase interfacial polarization and defect polarization sites, and further optimize both electromagnetic wave attenuation capability and impedance matching characteristics. This consequently significantly enhances the absorption intensity, broadens the effective absorption bandwidth, and provides an effective strategy for overcoming the performance limitations of single-component carbon-based absorbing materials.
For instance, Danqiang et al. [13] combined hollow ZnFe2O4 with carbon-based nanomaterials such as rGO and MWCNTs, effectively improving the absorption intensity and effective absorption bandwidth of the composite system, in which ZnFe2O4/rGO achieved a reflection loss of −49.17 dB at a thickness of 3.6 mm. Wang et al. [14] employed fig peel biomass carbon as a carrier to prepare silicon carbide nanocomposites with various morphologies, among which the coral-like structured sample achieved a minimum reflection loss of −51.27 dB at 14.1 GHz and an effective absorption bandwidth of 4.64 GHz. Wang et al. [15] uniformly coated Fe3O4 or Ni onto carbon nanocoils via atomic layer deposition to construct coaxial multilayer structures, significantly enhancing the microwave absorption performance of the materials. Shu et al. [16] prepared Fe-Zn bimetallic MOF-derived porous carbon-based magnetic composites, achieving a minimum reflection loss of −60 dB at a filler loading of 40 wt% with a bandwidth of 4 GHz covering the entire X-band; the bandwidth could be extended to 5.4 GHz at increased thickness. Dai et al. [17] uniformly decorated the surfaces of carbon spheres with Fe3O4 nanoparticles to prepare CS/Fe3O4 composites, achieving reflection losses of −50.932 dB and −49.143 dB at different thicknesses, respectively, along with an effective absorption bandwidth of 4.5 GHz. Zhang et al. [18] employed air/SiO2@Fe/C yolk-shell nanospheres as carriers, constructing dual-scale pore channels and multiple types of polarization interfaces via pyrolysis-etching, which significantly enhanced the low-frequency electromagnetic wave absorption performance of the material. Shu et al. [19] prepared FeCoNi/C-decorated graphene composites, in which tuning the amount of graphene oxide optimized the microwave absorbing performance, achieving strong absorption of −66 dB and a broad bandwidth of 4.8 GHz.
In recent years, studies have demonstrated that the deliberate design of three-dimensional macroscopic structures (e.g., periodic lattices, gradient structures, and biomimetic structures) [20,21,22] can effectively regulate the propagation paths of electromagnetic waves and induce multiple scattering and interference, thereby significantly optimizing impedance matching and enhancing loss capability [23,24]. Unfortunately, conventional manufacturing processes cannot efficiently and precisely fabricate such complex three-dimensional structures, severely constraining breakthroughs in absorption performance based on structural design [25,26]. The rise in additive manufacturing (3D printing) technology offers a revolutionary approach to addressing these structural fabrication challenges [27,28]. This technology features the advantages of mold-free processing, rapid prototyping, and nearly unlimited design freedom, making it particularly suitable for fabricating three-dimensional structures with complex geometries, multi-scale features, and customized porosity [29,30]. In recent years, researchers have begun exploring the use of 3D printing techniques such as stereolithography (SLA), fused deposition modeling (FDM), and selective laser sintering (SLS) [31,32,33] to fabricate carbon-based, ceramic-based, or polymer-based absorbing structures, demonstrating substantial potential for achieving broadband absorption and lightweight design.
In this work, we prepared an Fe/C composite material by combining iron salts with a carbon matrix, incorporated it into ABS resin, and fabricated (Fe/C)/ABS resin samples via 3D printing. The effect of iron salt addition on the microwave absorption performance of the (Fe/C)/ABS resin samples was systematically investigated, providing an effective reference for the forming technology of microwave-absorbing materials.

1.1. Materials

The iron salt is ferric chloride hexahydrate (FeCl3·6H2O), analytical grade, supplied by Chengdu Kelong Chemical Co., Ltd., Chengdu, China; The carbon source was glucose monohydrate (C6H12O6·H2O, analytical grade, provided by Chengdu Kelong Chemical Co., Ltd., Chengdu, China), and carbon nanoparticles were prepared via a hydrothermal reaction (180 °C, 10 h).; deionized water with a resistivity of 18.25 MΩ·cm was used throughout the experiments.

1.2. Sample Preparation

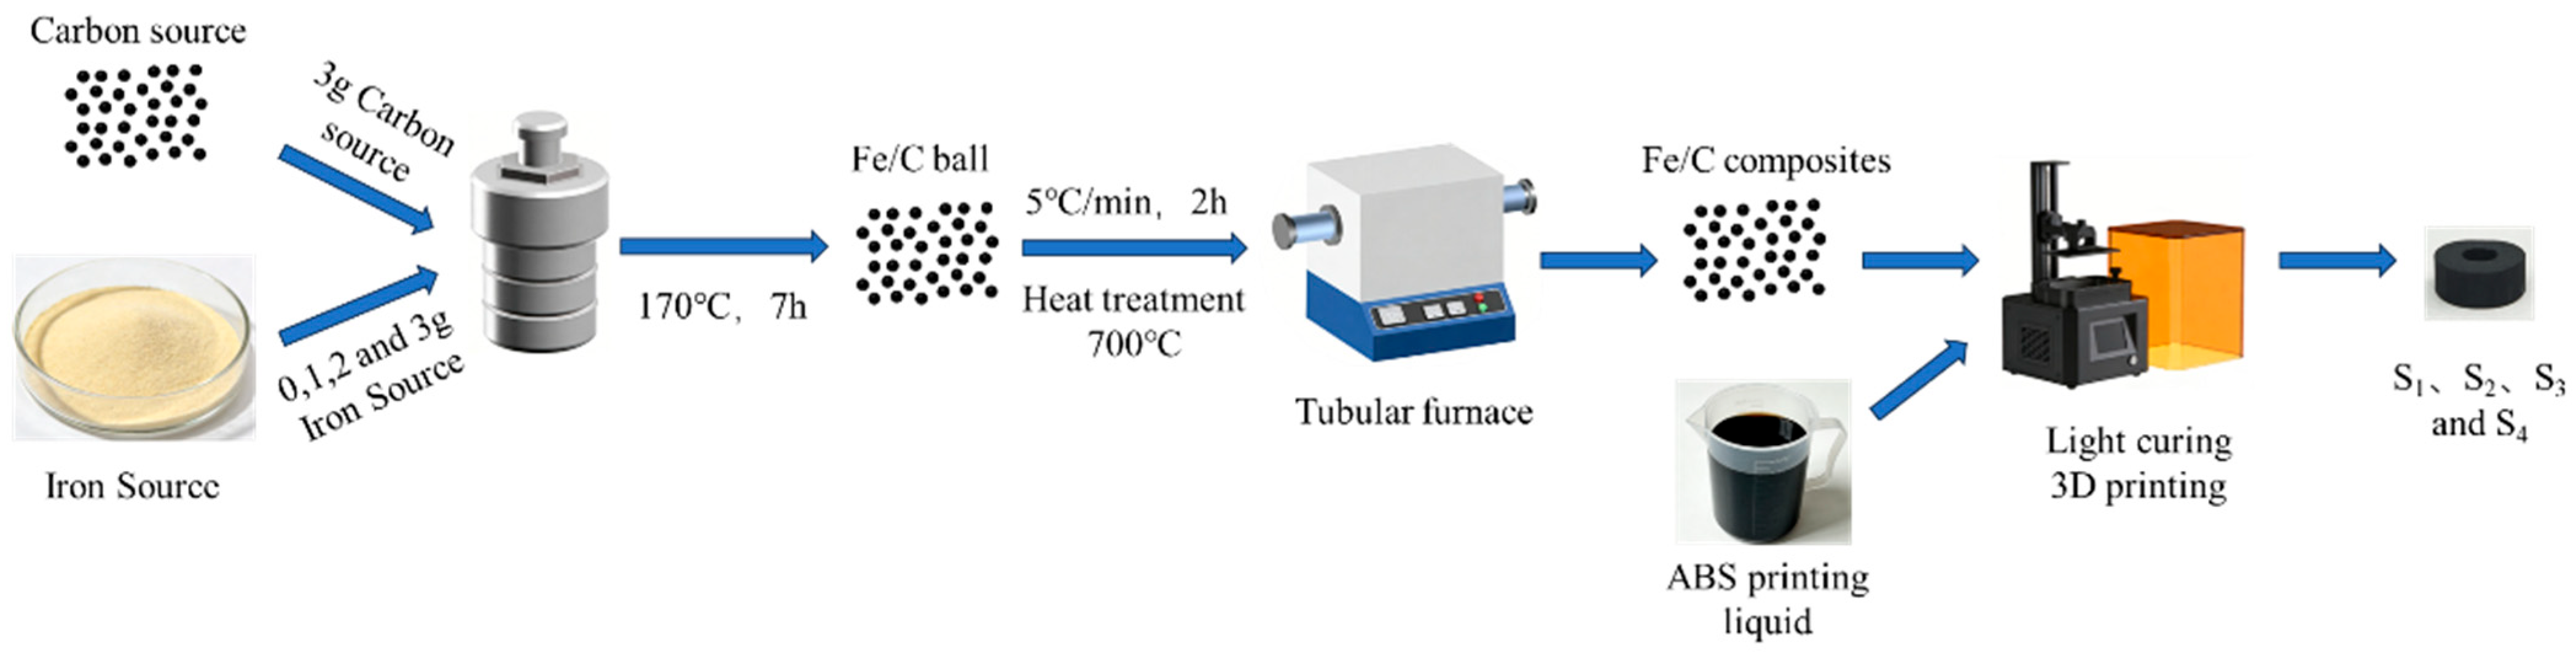
The preparation process of the Fe/C samples is illustrated in Figure 1. The specific procedures include the hydrothermal synthesis of Fe/C spheres, thermal treatment of the samples, and fabrication of (Fe/C)-modified ABS resin specimens via 3D printing.

1.2.1. Preparation of Fe/C Composites

Different amounts of iron salt (0, 1, 2, and 3 g) were separately dissolved in 80 mL of deionized water to obtain iron-containing solutions of varying concentrations. Subsequently, 3 g of carbon spheres was immersed in each iron-containing solution. After ultrasonication for 30 min, the mixtures were transferred to a 100 mL autoclave and reacted at 170 °C for 7 h in an oven to allow sufficient diffusion of iron ions into the carbon spheres. The resulting iron-containing carbon spheres were collected by centrifugal washing and dried in an oven at 50 °C for 7 h. Finally, the dried iron-containing carbon spheres were placed in a vacuum tube furnace and heated to 700 °C at a ramp rate of 5 °C/min, followed by a 2 h holding treatment, yielding the Fe/C composite materials. The Fe/C composites prepared with iron salt additions of 0, 1, 2, and 3 g were designated as Fe/C-0, Fe/C-1, Fe/C-2, and Fe/C-3, respectively.

1.2.2. Preparation of (Fe/C)/ABS Resin Electromagnetic Metamaterials

The as-prepared Fe/C composites were uniformly mixed with ABS resin at a Fe/C composite loading of 2.5 wt%, followed by ultrasonic oscillation for 30 min. The (Fe/C)/ABS resin samples were then fabricated using a 3D printer (Photon Mono 2, rated power: 48 W, wavelength: 405 nm). The ABS resin employed was supplied by Shenzhen Zongwei Cube Technology Co., Ltd., Shenzhen, China, with the model designation ABS-Like Resin Pro 2, whose principal component is ABS resin ((C8H8)x·(C4H6)y·(C3H3N)z). The printing parameters were set as follows: curing layer thickness of 0.01 mm and curing time of 3 s. The (Fe/C)/ABS resin samples were printed into solid annular structures with an inner diameter of 3.0 mm, an outer diameter of 7.0 mm, and a thickness of 4.0 mm. The (Fe/C)/ABS resin samples prepared with Fe/C-0, Fe/C-1, Fe/C-2, and Fe/C-3 as fillers were designated as S1, S2, S3, and S4, respectively.

1.3. Analytical and Testing Instruments

The analytical instruments used in this study are shown in Table 1.
The electromagnetic parameters of the (Fe/C)/ABS resin samples were measured over the frequency range of 2–18 GHz using a vector network analyzer. The microwave absorption performance of the samples can be evaluated by the reflection loss (RL), which is calculated according to the following equations [34,35]:
Z in = Z n μ r ε r tan h j 2 π f d c μ r ε r
R L = 20 lg Z in Z 0 Z in + Z 0
where Z in is the characteristic impedance, Z 0 is the air impedance ( Z 0 = μ 0 / ε 0 = 1 ), μ r is the complex permeability, ε r is the complex permittivity, f is the frequency, d is the coating thickness, and c is the speed of light.

2. Results and Discussion

2.1. Characterization of C and Fe/C

2.1.1. XRD Characterization of C and Fe/C

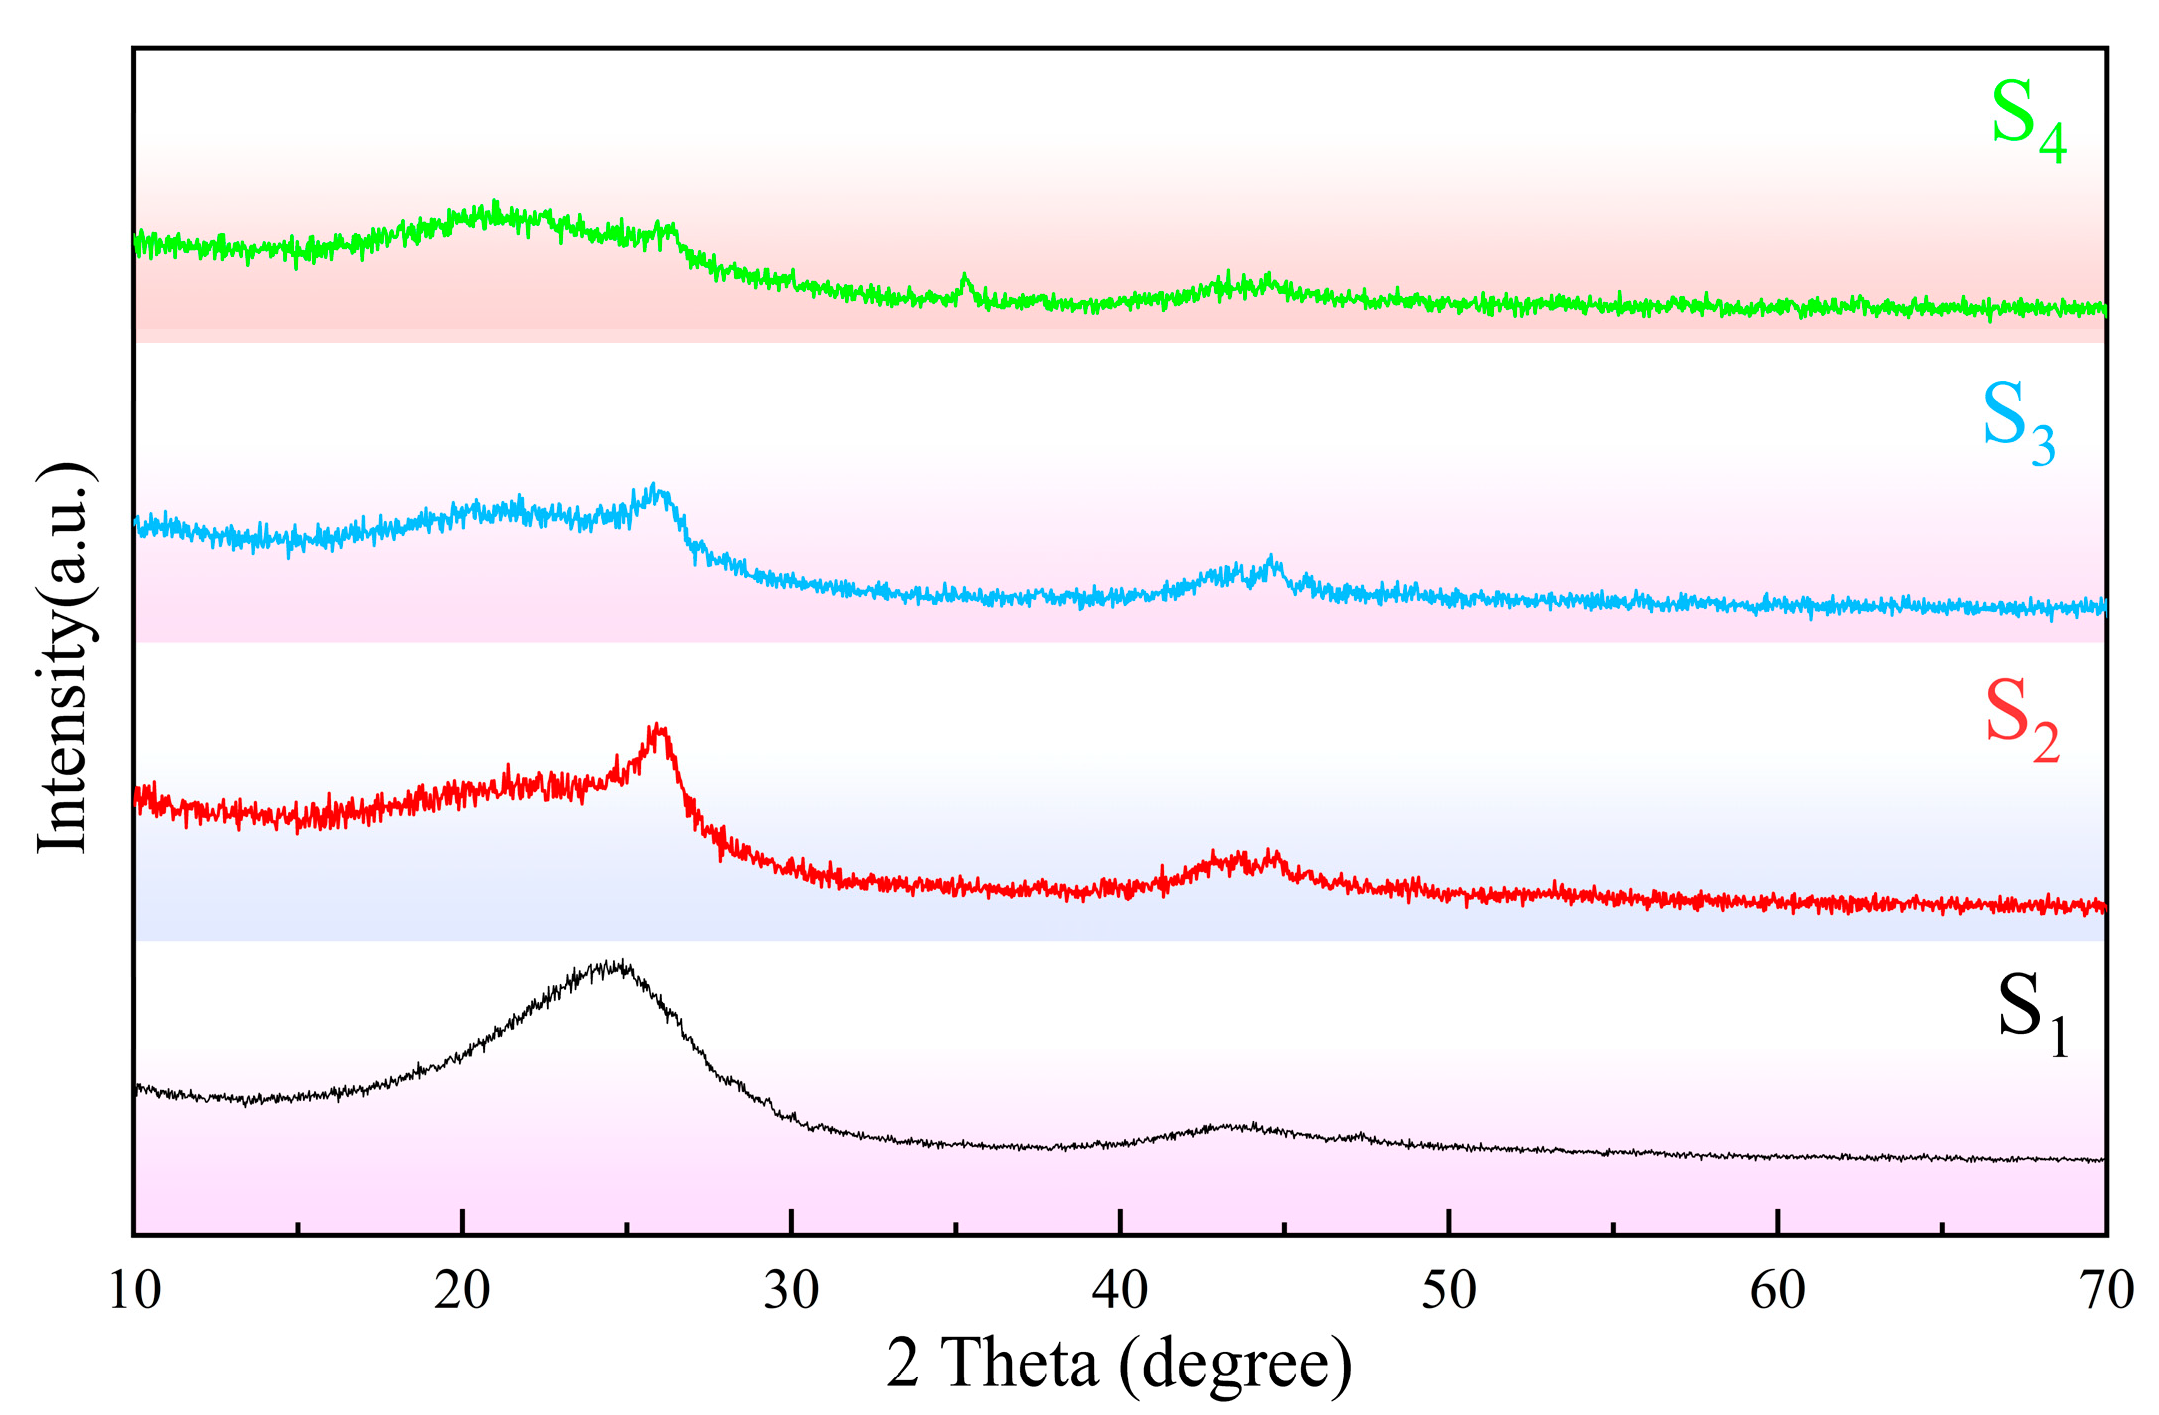
The XRD patterns of C and Fe/C composites are shown in Figure 2. Two broad diffuse diffraction peaks are observed at approximately 2 θ 25 ° and 43°, which are characteristic of amorphous carbon, indicating that all samples possess an amorphous carbon structure. Notably, no sharp diffraction peaks attributable to crystalline phases of iron or its compounds (e.g., α-Fe, Fe3C, Fe3O4, or γ-Fe2O3) are detected in the XRD patterns of any Fe/C sample (S2–S4). This result suggests that the iron species exist in the carbon matrix either in an X-ray amorphous form or as nanocrystallites with domain sizes below the XRD detection limit (<2–3 nm). Upon introduction of the iron salt (S2–S4), these two diffraction peaks become noticeably sharper and more intense, accompanied by a reduction in full width at half maximum. This trend indicates that iron serves as an efficient catalyst for promoting the graphitization of carbon materials. Furthermore, with increasing iron salt loading from 1 g to 3 g (S2 to S4), the peak intensity increases progressively, demonstrating a positive correlation between iron loading and the degree of structural ordering in the carbon matrix. During pyrolysis, the iron species undergo in situ carbothermal reduction to generate metallic Fe or Fe3C nanocrystallites with domain sizes below the XRD detection limit, which subsequently catalyze local graphitization of the carbon matrix via a dissolution–precipitation mechanism. This process introduces abundant microcrystalline boundaries and defect sites into the carbon matrix, which is favorable for high-frequency (10–18 GHz) polarization under electromagnetic wave irradiation.

2.1.2. Scanning Electron Micrograph of Fe/C Composite Material

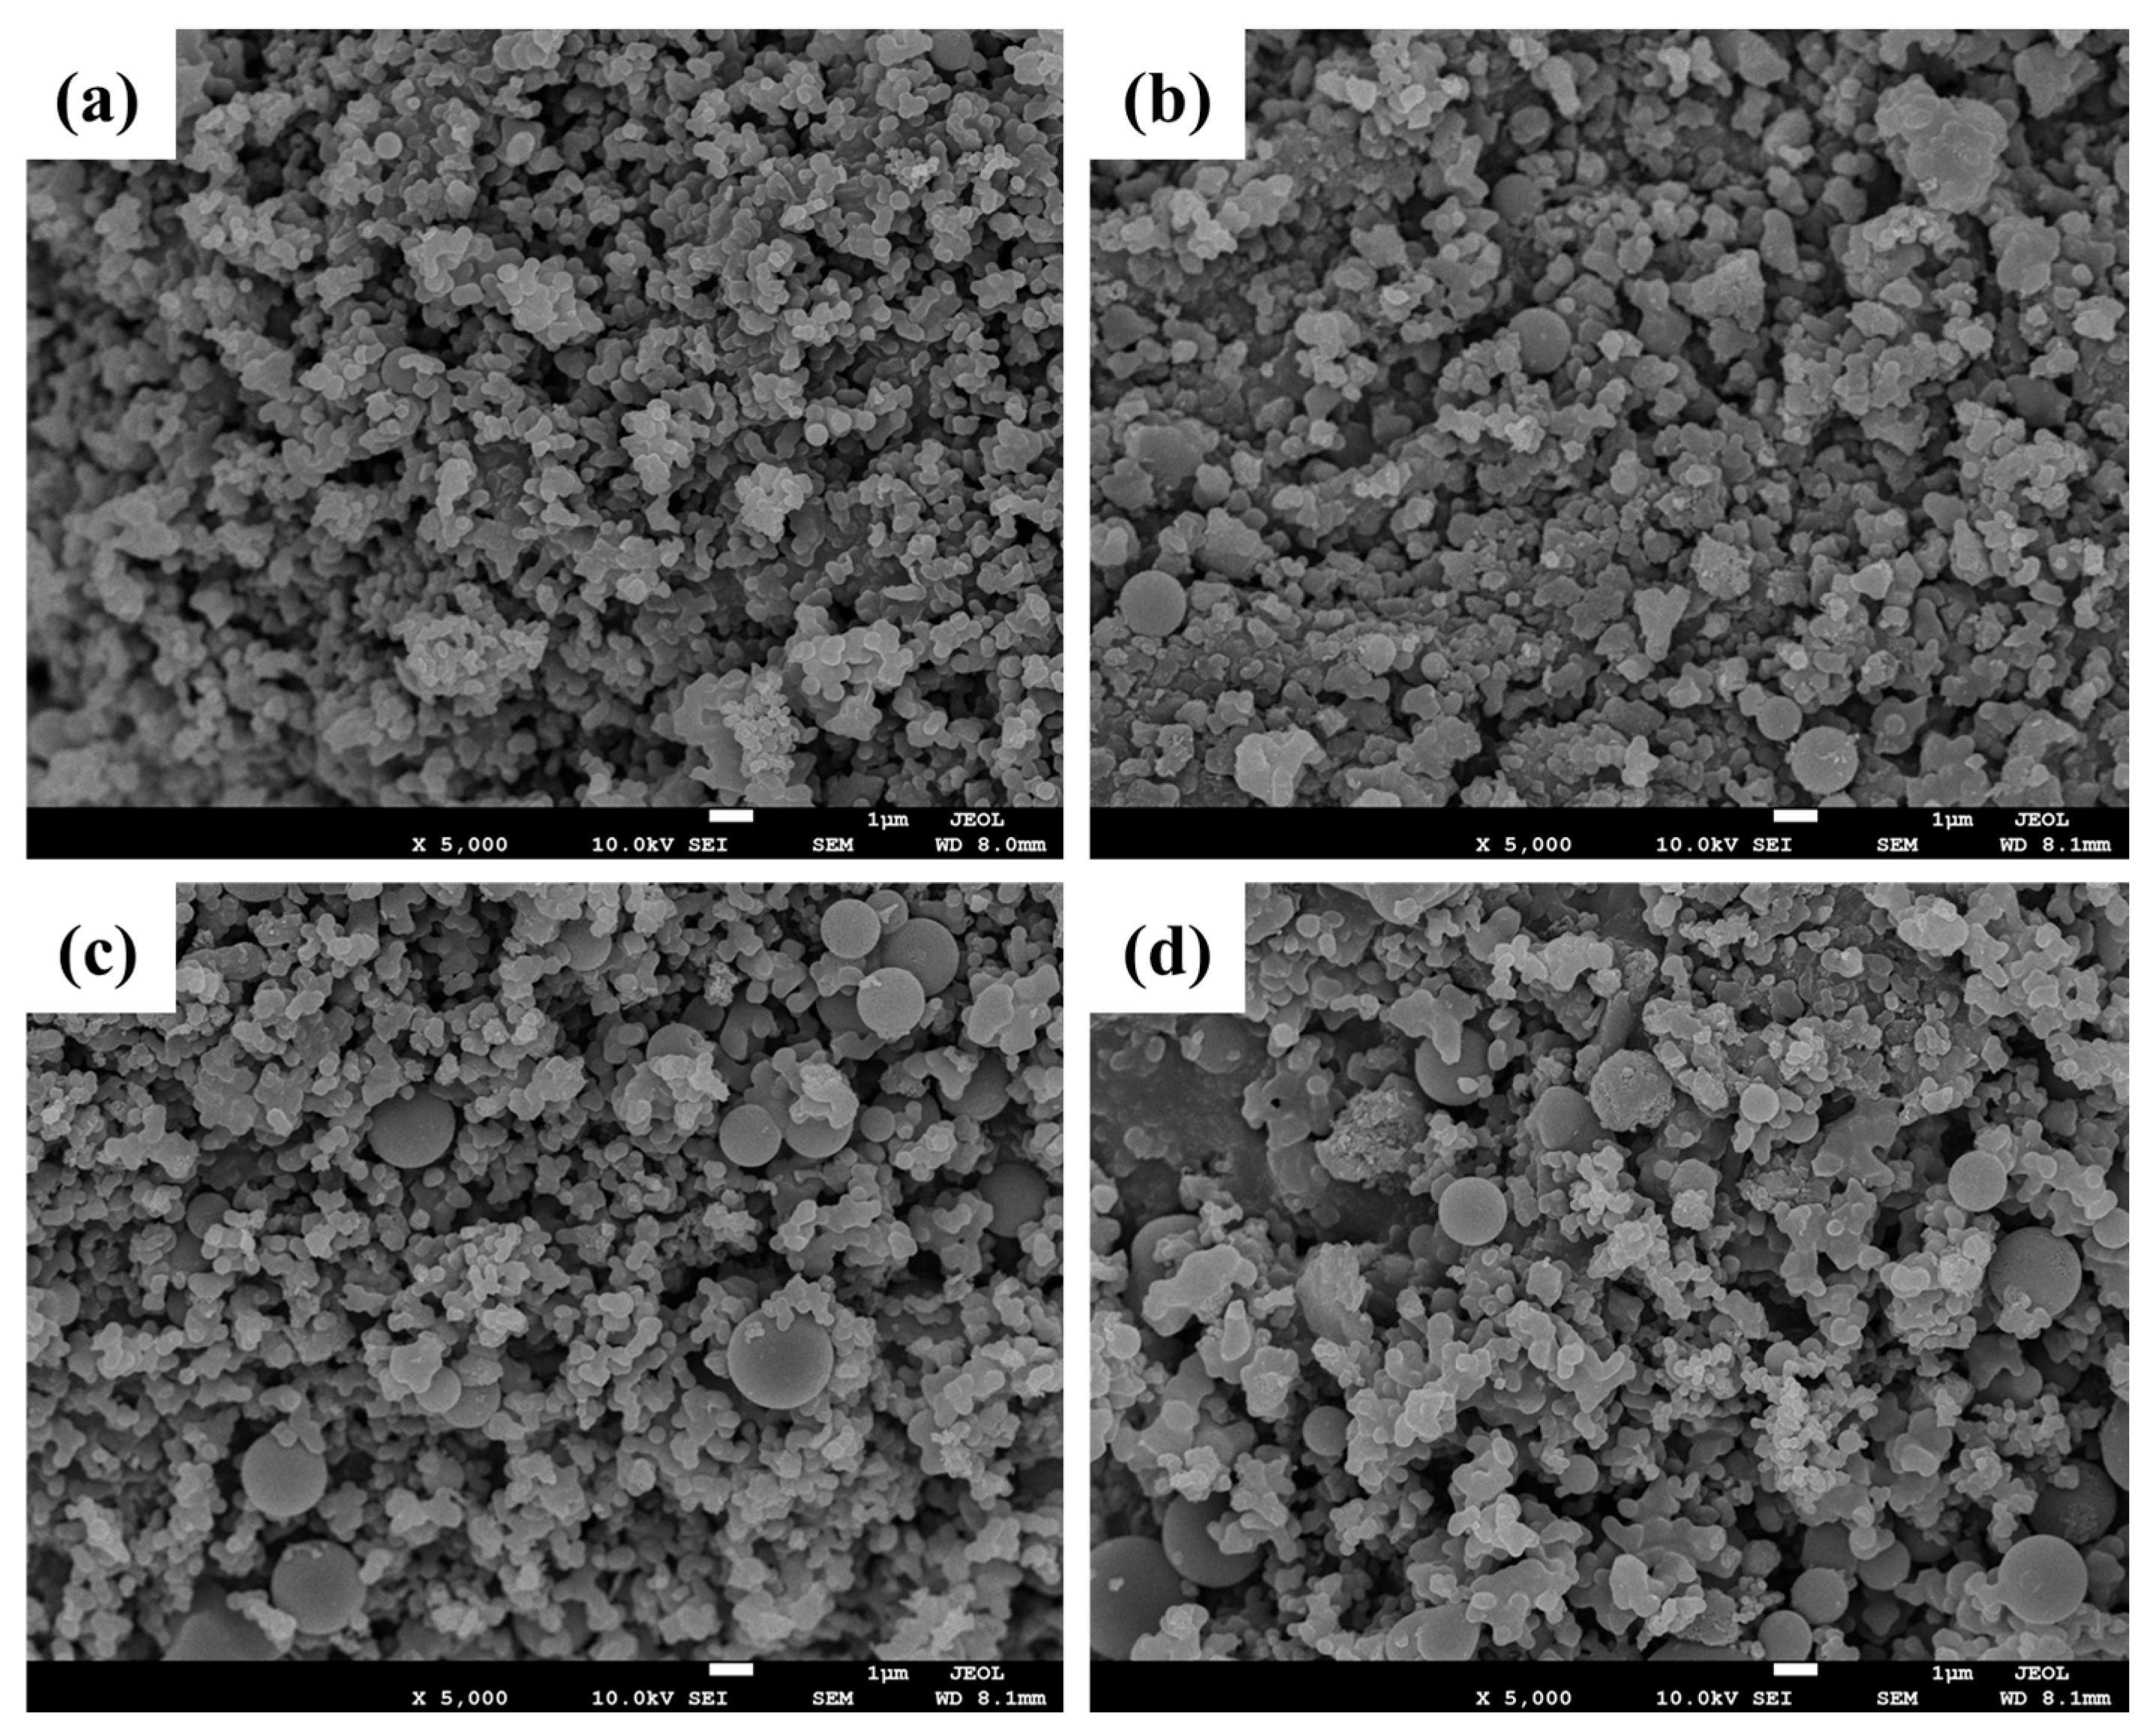
Figure 3 presents the SEM images of Fe/C composites prepared with different iron salt loadings. The pristine carbon sample (Figure 3a, Fe/C-0) exhibits only nanosized carbon particle aggregates without any micron-scale structures. As shown in Figure 3b–d, with increasing iron salt loading, a substantial number of spherical microparticles with a diameter of approximately 1 μm gradually emerge, and their population increases with higher iron salt content. Morphologically, the appearance of these microspheres is clearly correlated with the introduction of the iron salt; however, their specific composition requires further confirmation by compositional analysis techniques such as EDS.

2.1.3. EDS Characterization of C and Fe/C

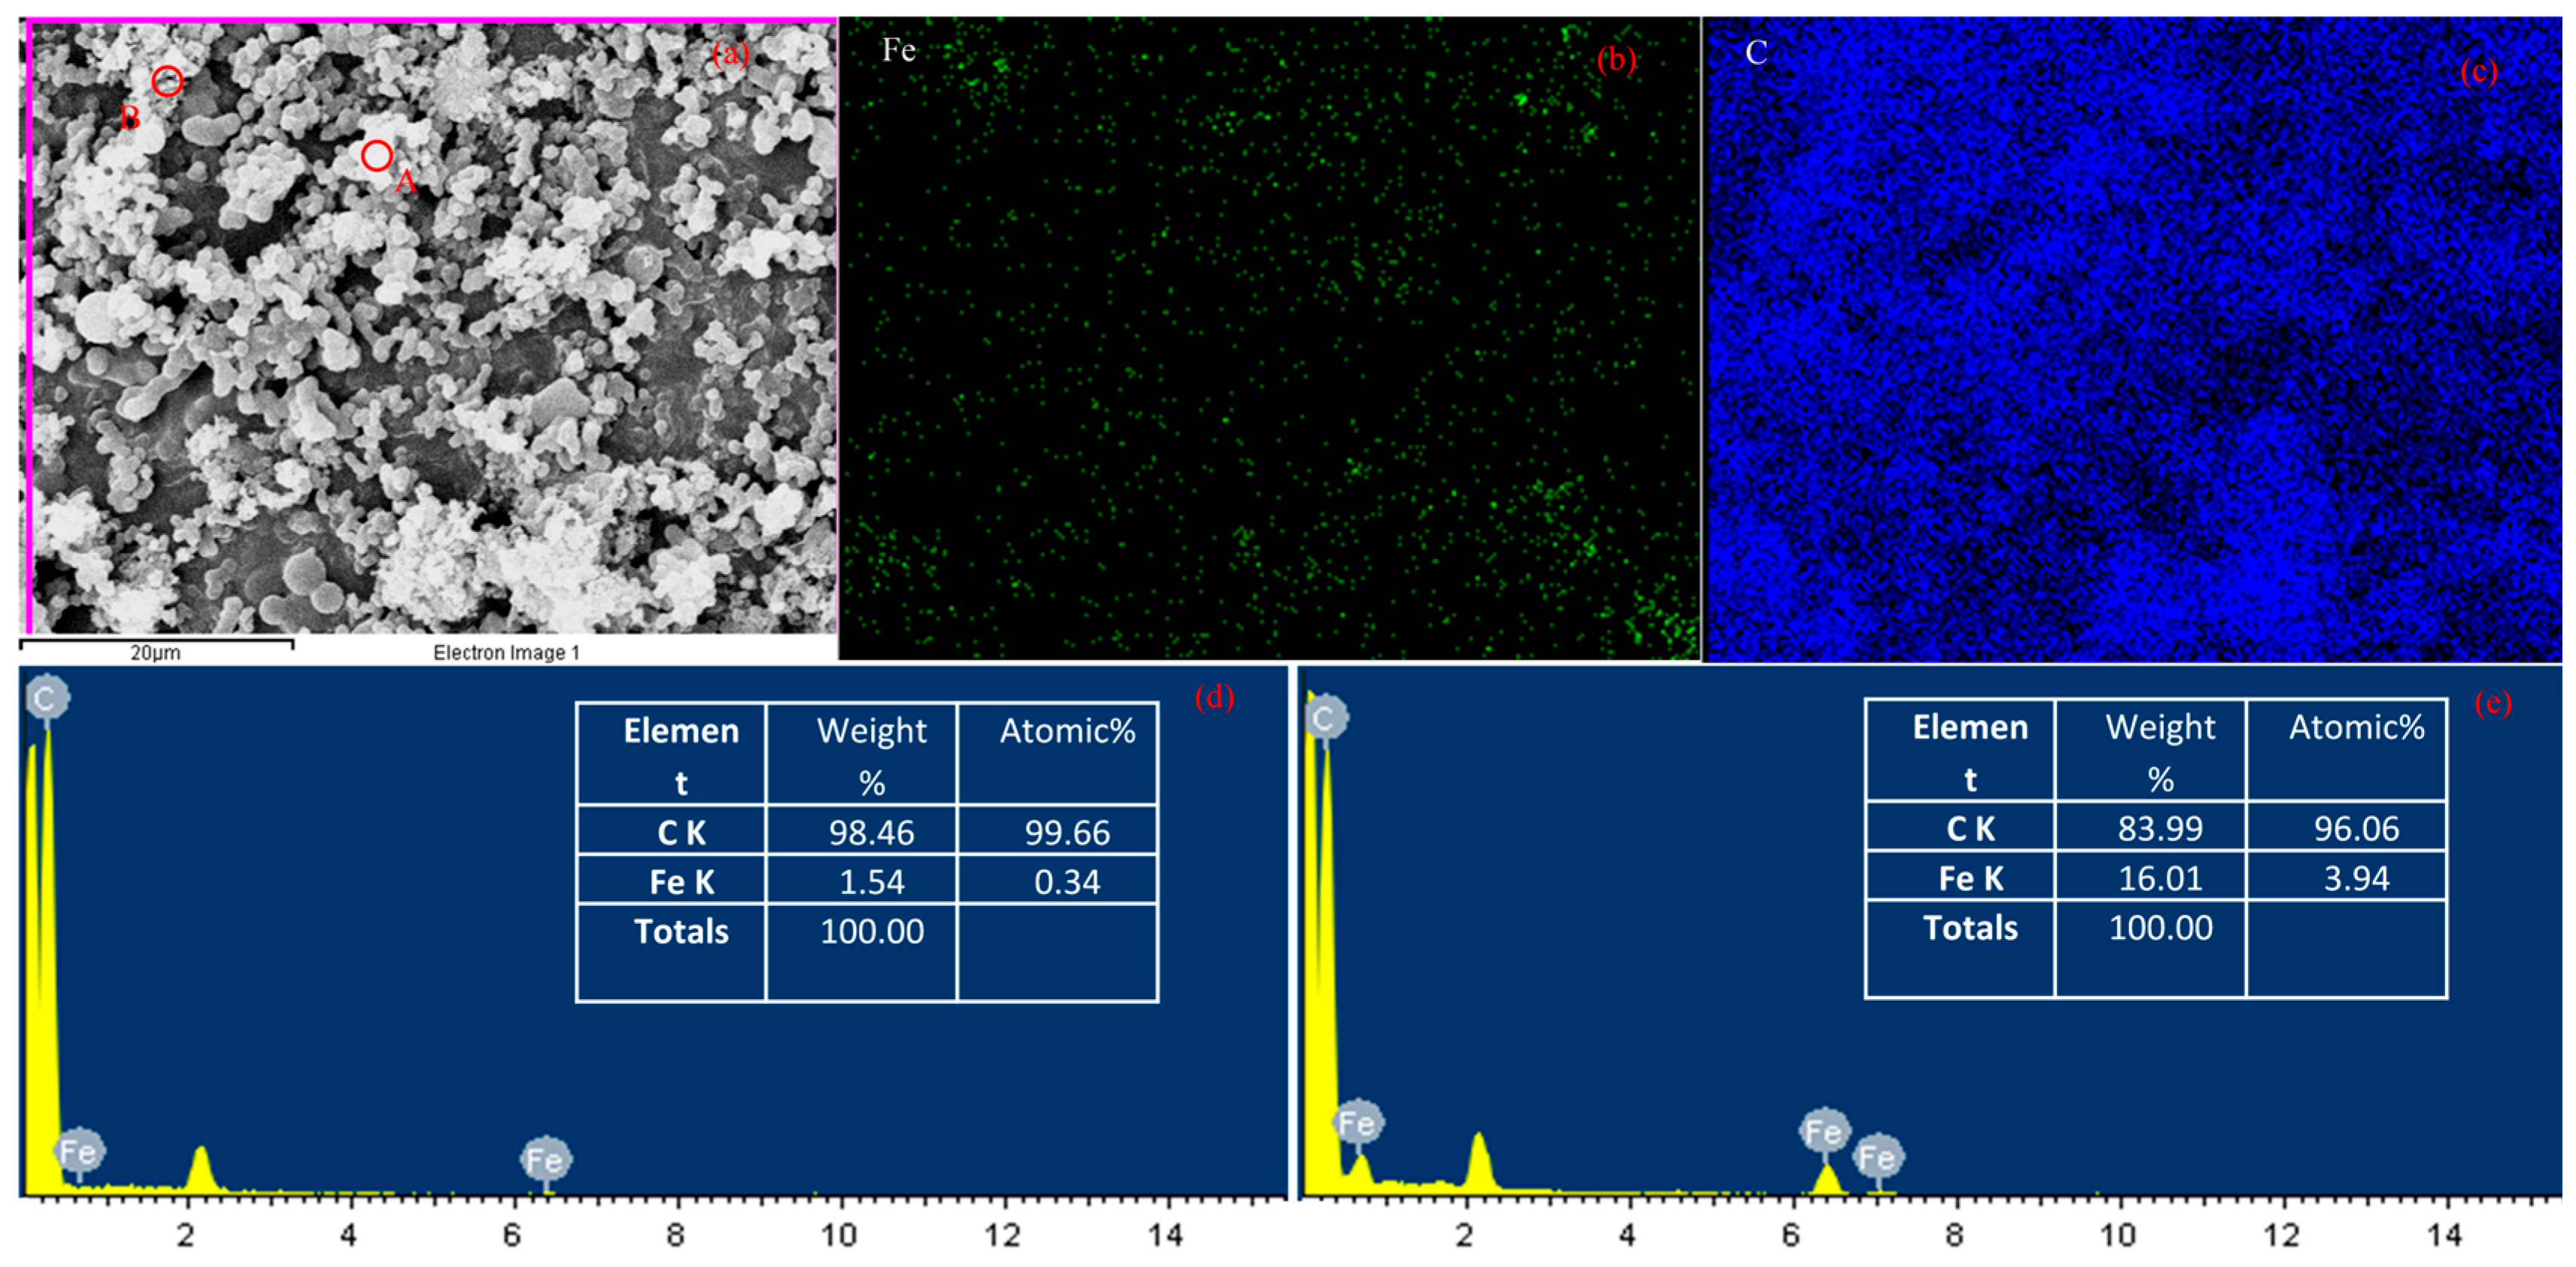
To further elucidate the composition of the microspheres observed by SEM and the spatial distribution of carbon and iron, EDS analysis was performed on the Fe/C-3 sample with the highest iron loading, and the results are presented in Figure 4. Figure 4b,c show the EDS elemental mapping of Fe/C-3. Carbon is continuously and uniformly distributed across the selected region, forming the matrix backbone of the sample. The Fe signal is also relatively homogeneous at the mapping scale, with no evidence of large-scale enrichment or depletion, indicating that the iron species are uniformly dispersed within the carbon matrix at the micron scale.
Figure 4d,e display the EDS point spectra acquired at Points A and B marked in Figure 4a, respectively. At Point A (located on the surface of a microsphere, Figure 4d), the Fe characteristic peaks are weak while the C peak dominates the spectrum, demonstrating that this microsphere is not a pure iron oxide particle but rather a carbon-based microsphere in which iron exists merely as a minor dopant or surface coating. In contrast, at Point B (a nanoparticle aggregation region, Figure 4e), the Fe signal is significantly enhanced and the O peak is synchronously elevated, indicating that iron is predominantly enriched in the nanoscale aggregation regions and exists mainly in the form of iron oxides. Taken together, the EDS results, in conjunction with XRD and SEM observations, establish that the microspheres are carbon-based structures formed during iron-catalyzed pyrolysis, while the iron oxides are dispersed as nanoparticles and locally enriched in the nano-aggregation regions of the carbon matrix.

2.1.4. Raman Characterization of Fe/C

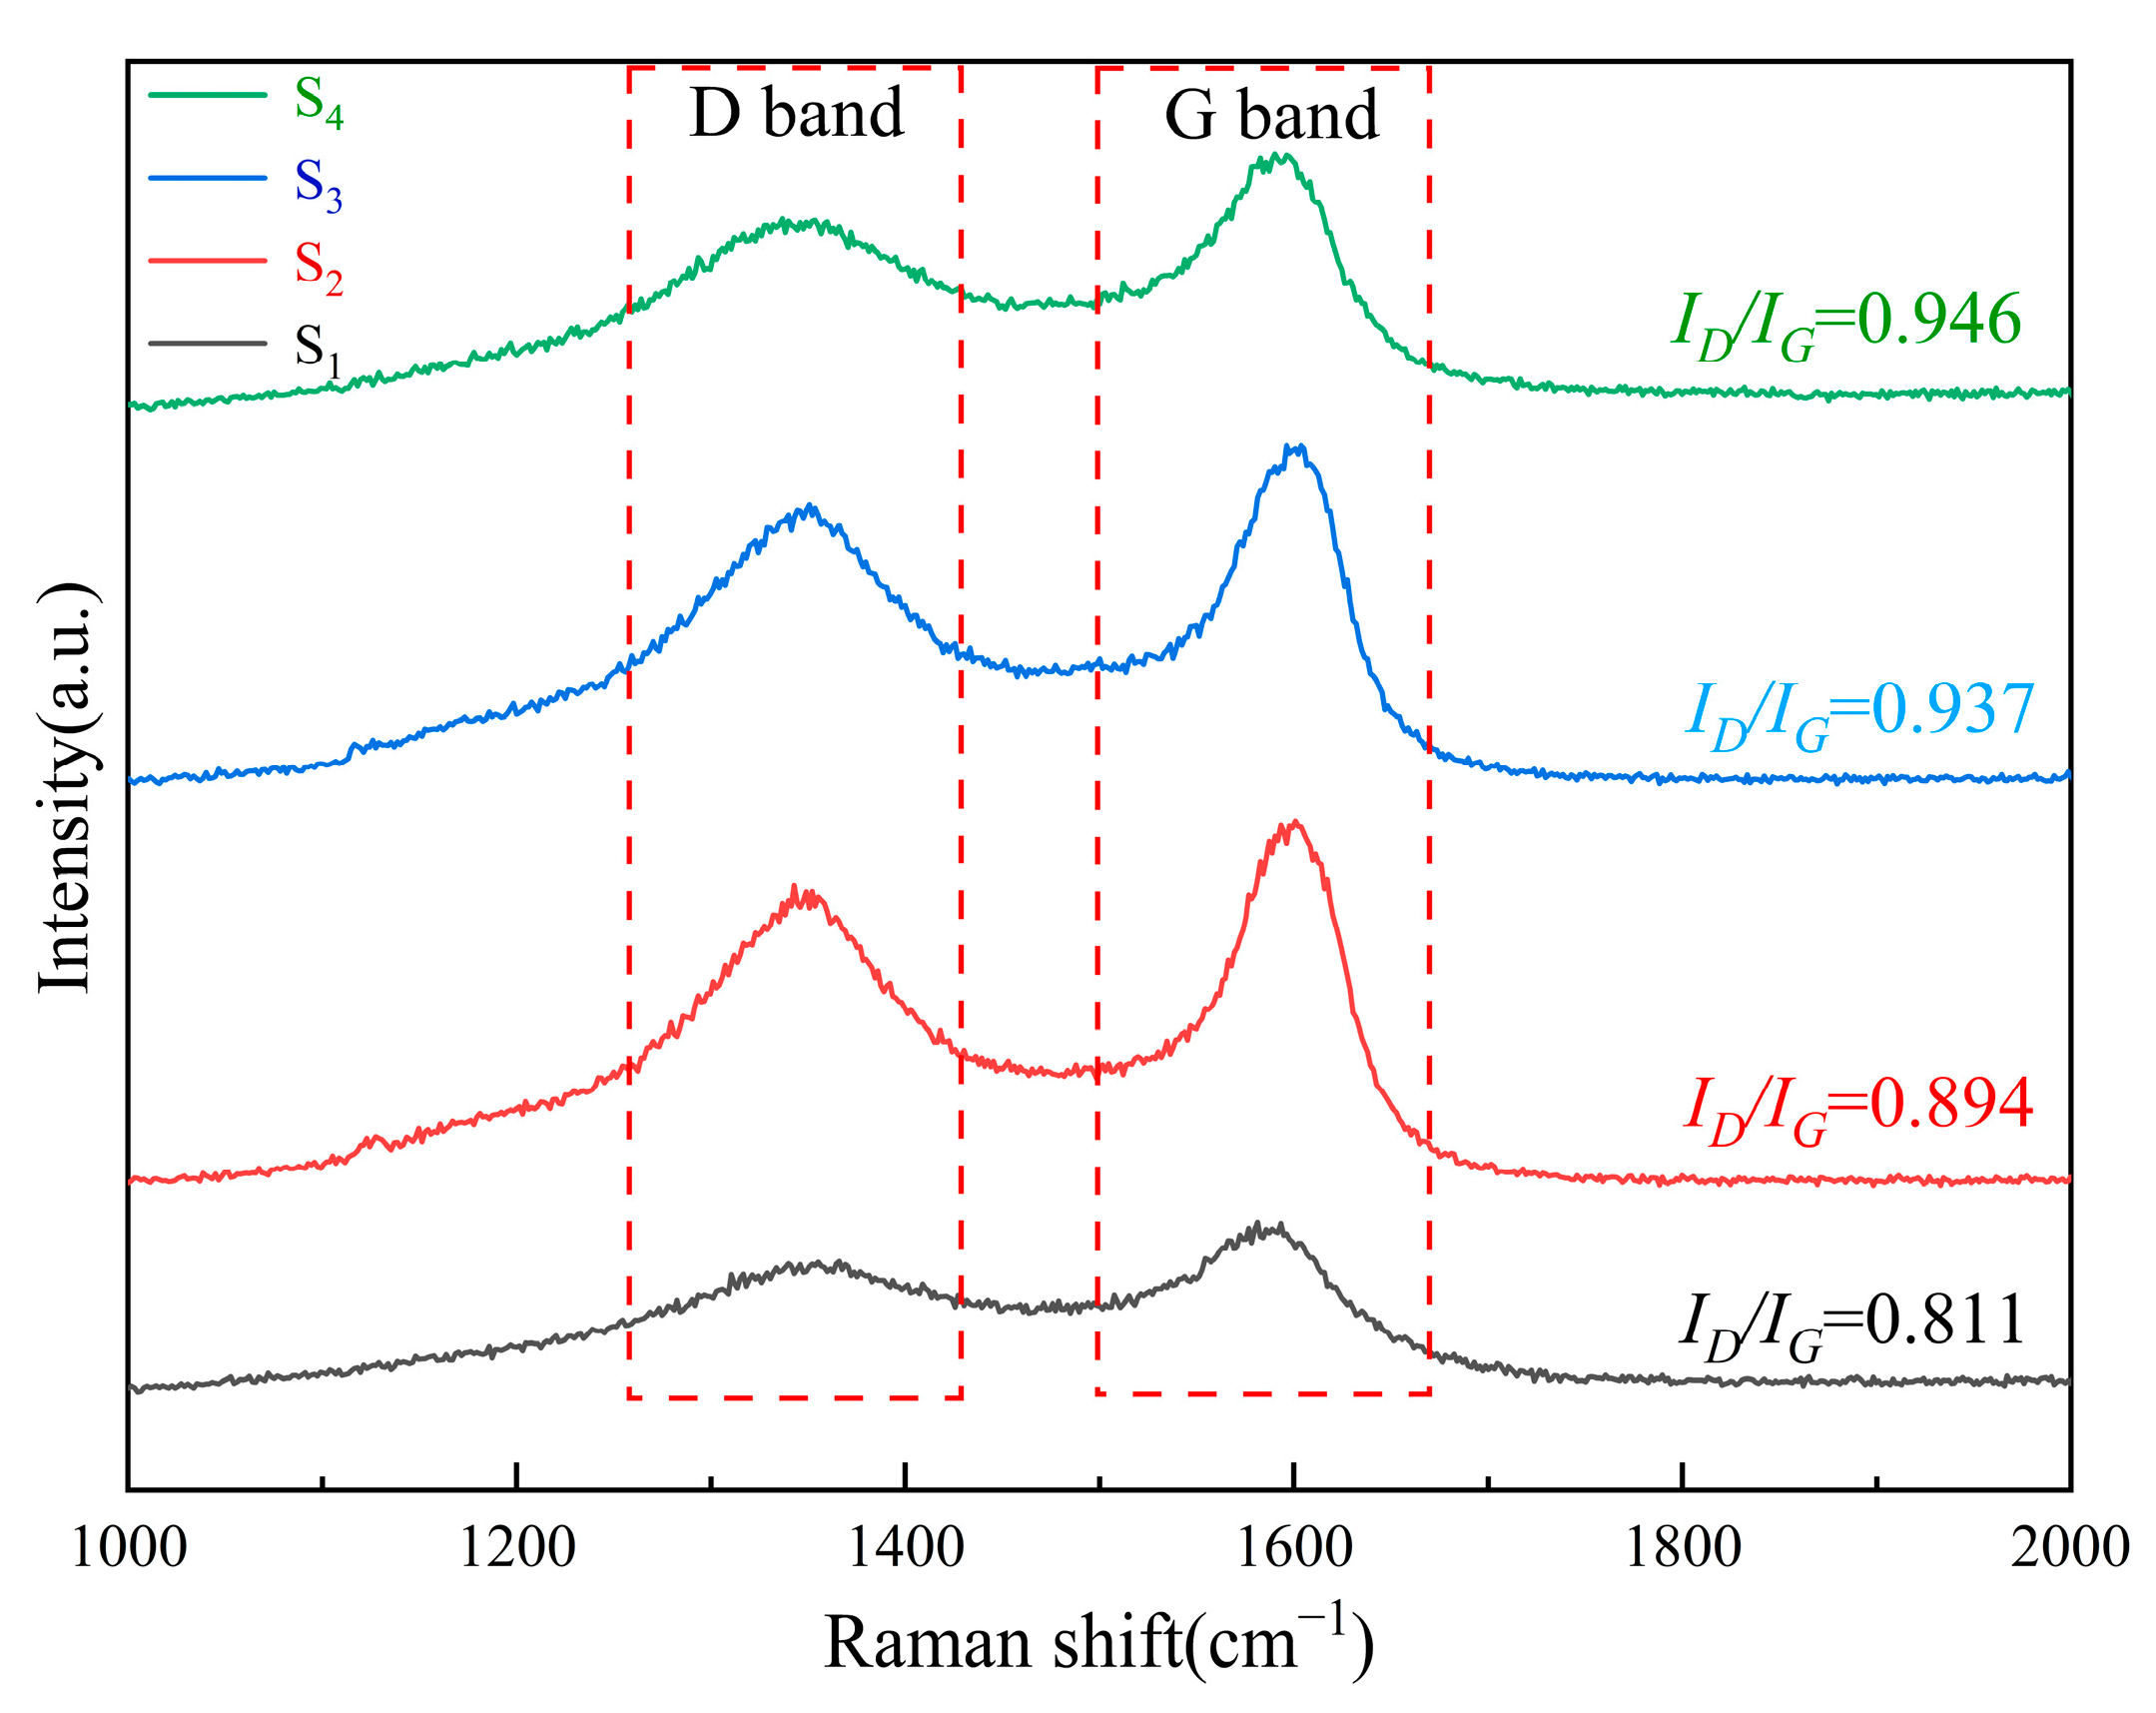
Figure 5 presents the Raman spectra of Fe/C composites prepared at varying iron salt contents. All samples exhibit the characteristic D-band and G-band of carbon materials at approximately 1350 cm−1 and 1580 cm−1, respectively. The D-band originates from lattice defects and disordered structures in the carbon framework, while the G-band corresponds to the in-plane C=C stretching vibration of sp2-hybridized carbon and reflects graphitized, ordered domains. The ID/IG intensity ratio serves as a key quantitative indicator of the degree of disorder and defect concentration in carbon materials, with a higher ratio signifying greater structural disorder and a higher density of defect sites.
The spectral data reveal that as the iron salt addition increases from 0 g (S1) to 3 g (S4), the ID/IG ratio exhibits a monotonic upward trend, albeit with a progressively diminishing increment: S1 (0 g iron salt) yields ID/IG = 0.811, S2 (1 g iron salt) yields 0.894, S3 (2 g iron salt) yields 0.937, and S4 (3 g iron salt) yields 0.946. These results directly corroborate that the incorporation of iron species into the carbon matrix leads to an overall increase in structural disorder, and that a higher iron loading engenders a more pronounced degree of defect formation in the carbon framework, although the rate of increase decelerates at elevated loadings.
Taken together with the SEM and XRD results, the iron oxides are uniformly dispersed as nanoparticles within the carbon matrix. During pyrolysis, iron simultaneously catalyzes the formation of carbon-based microspheres and the local graphitization of the carbon matrix, ultimately yielding a composite architecture in which iron oxide nanoparticles are supported on carbon-based microspheres. This structural configuration provides abundant active sites and mass transport channels for subsequent applications such as catalysis, energy storage, and adsorption.

2.1.5. XPS Characterization of Fe/C

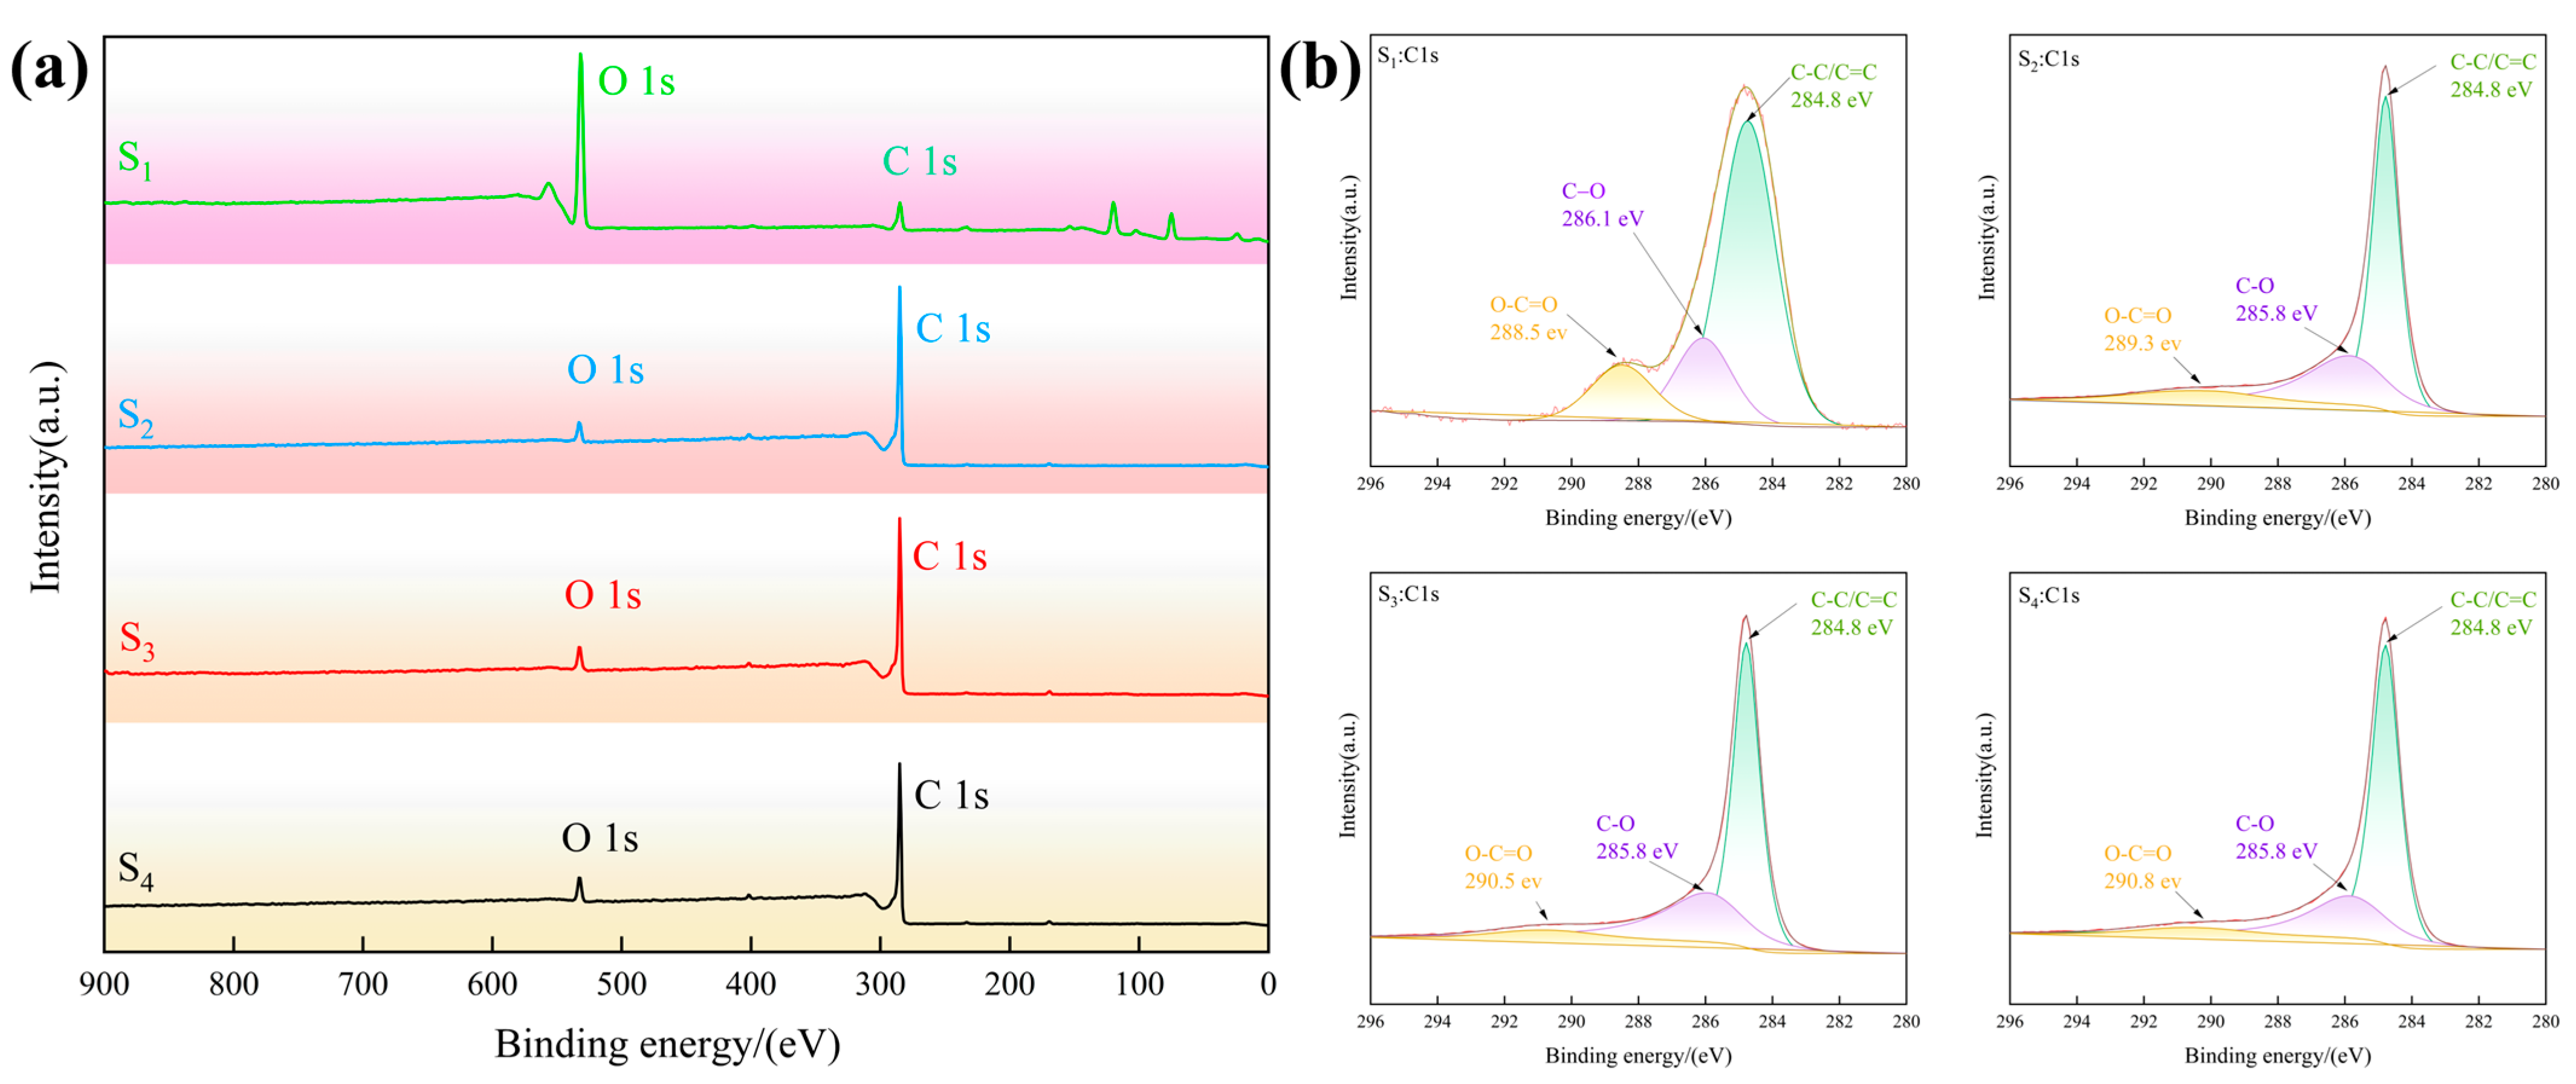
Figure 6 presents the XPS spectra of the Fe/C composites. As shown in Figure 6a, the Fe/C composites are predominantly composed of carbon and oxygen, with no discernible iron signal detected on the surface. This can be attributed to the relatively low iron salt loading, and the iron species may exist in a highly dispersed state or be completely encapsulated by carbon layers. As revealed in Figure 6b, with increasing iron salt content, the fraction of sp2-hybridized carbon (C-C/C=C, 284.8 eV) increases substantially, while the abundance of oxygen-containing functional groups (C-O and O-C=O) gradually declines. These observations indicate that iron serves as an effective catalyst in promoting the graphitization of the carbon framework and facilitating the removal of surface oxygenated functionalities. Critically, however, the sp2 carbon network generated during this graphitization process retains a high density of defect sites, which is complementary to and corroborated by the Raman spectroscopic evidence—namely, the monotonic increase in the I_D/I_G ratio with increasing iron content, signifying a concomitant rise in the degree of structural disorder and defect density within the carbon matrix.

2.2. Performance Analysis of the Sample

2.2.1. Dielectric Property Analysis of the (Fe/C)/ABS Resin Sample

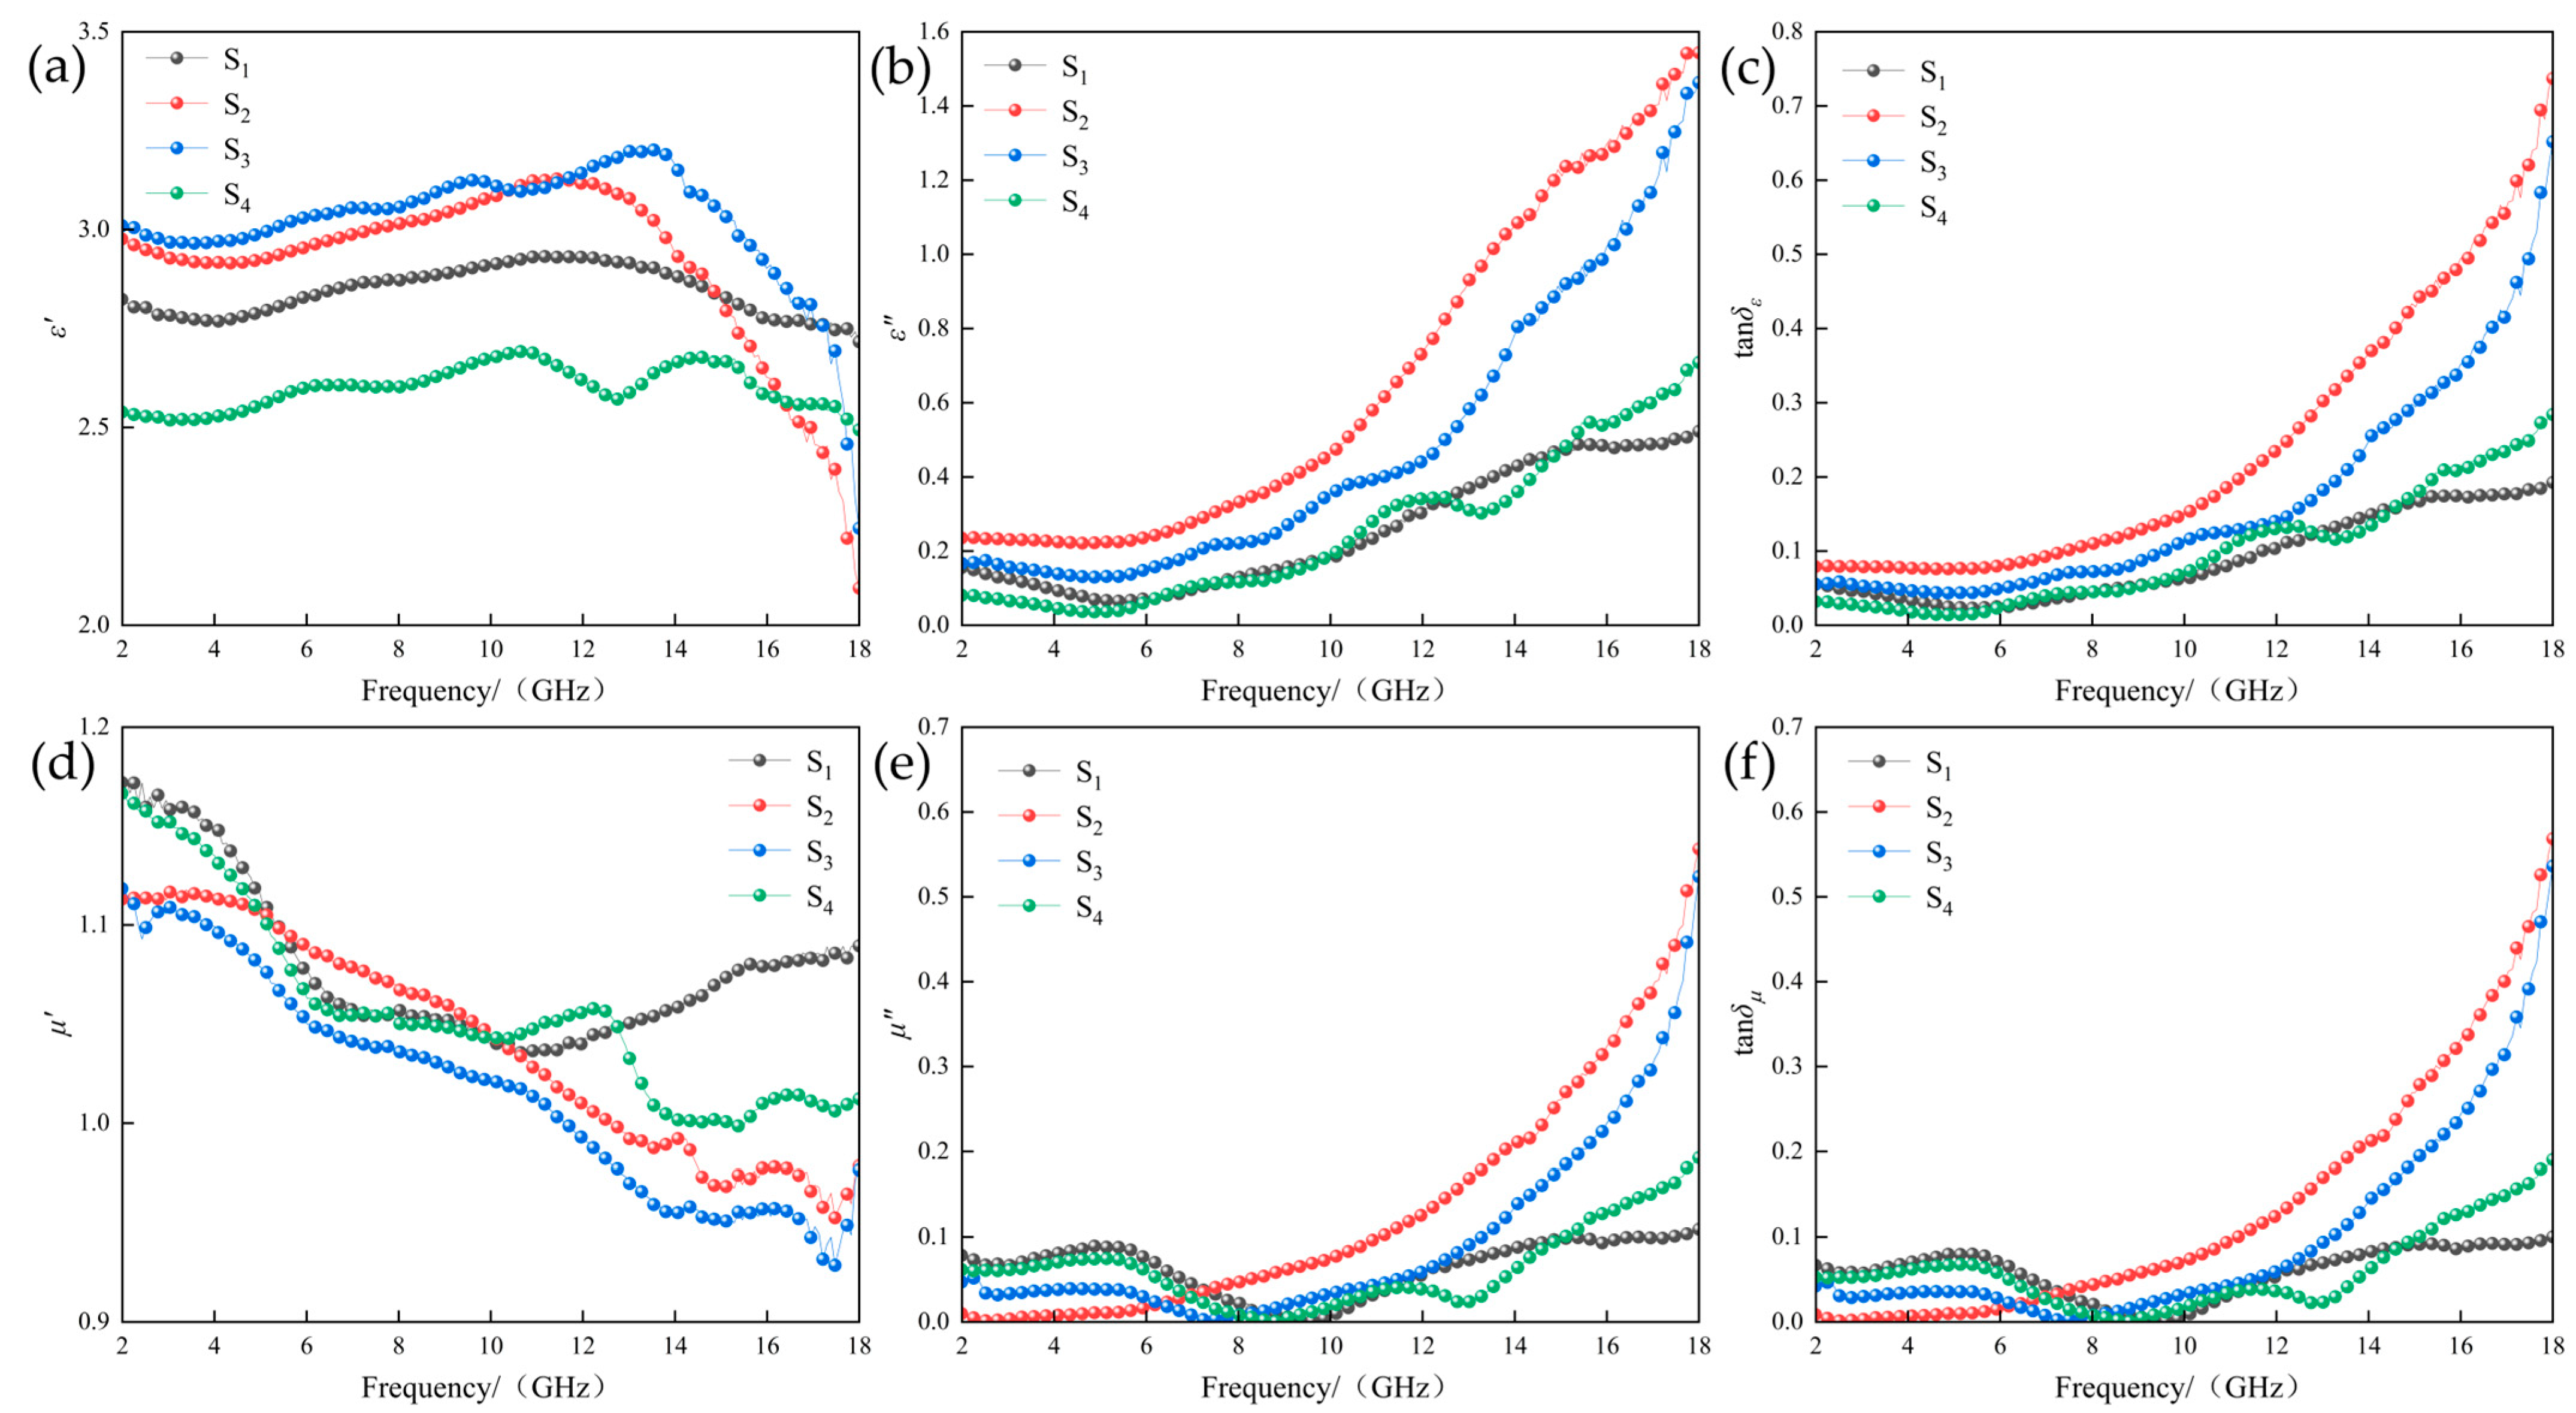
Figure 7 presents the electromagnetic parameters of the (Fe/C)/ABS resin composites. The real part of the complex permittivity, ε′ (Figure 7a), represents the capacity of the material to store electromagnetic energy, while the imaginary part, ε″ (Figure 7b), quantifies its ability to dissipate electromagnetic energy through conversion into heat. The dielectric loss tangent, tan δε (Figure 7c), directly reflects the dielectric loss efficiency of the material. As shown in Figure 7a, the ε′ curves of S1, S2, and S3 exhibit similar trends, indicating comparable electromagnetic energy storage capabilities, whereas S4 displays the poorest storage capacity. All samples show a gradual increase in ε′ over the low-frequency range of 2–12 GHz, suggesting that polarization can effectively follow the alternating electric field. In the high-frequency range of 12–18 GHz, however, ε′ undergoes a pronounced decline, characteristic of the typical high-frequency polarization relaxation phenomenon: as the electric field alternates at an excessively high rate, dipolar and interfacial polarizations cannot fully respond, leading to diminished energy storage capacity.
As shown in Figure 7 for high (b), the ε″ values of all four samples exhibit a monotonic increase with frequency across the entire measured range, with the overall hierarchy following S2 > S3 > S4 > S1. Among them, S2 demonstrates the strongest energy dissipation capacity, whereas S1 exhibits the weakest. All four samples display a marked increase in ε″ in the high-frequency range of 10–18 GHz, confirming the occurrence of intense polarization relaxation processes. These processes are primarily attributed to the combined action of dipolar polarization induced by defects within the carbon matrix and interfacial polarization at the Fe/C hetero-interfaces (Maxwell-Wagner-Sillars effect). The variation trend of tan δε is entirely consistent with that of ε″, indicating that S2 possesses the highest dielectric loss efficiency and substantially outperforms the other samples in terms of energy dissipation in the high-frequency range (12–18 GHz). Although S1 exhibits high ε′ and strong energy storage capacity, its low ε″ ultimately results in the poorest dielectric loss efficiency.
Figure 7d–f present the magnetic properties of the samples. The real part of the complex permeability, μ′ (Figure 7d), represents the capacity for magnetic energy storage; the imaginary part, μ″ (Figure 7e), represents the magnetic loss capability; and the magnetic loss tangent, tan δμ (Figure 7f), reflects the magnetic loss efficiency. From Figure 7d–f, it can be concluded that S2 exhibits the optimal magnetic loss efficiency, whereas the magnetic loss of S1 is negligible.
A comparison of the dielectric loss tangent (tan δε) and magnetic loss tangent (tan δμ) of the four samples (Figure 7c,f) reveals the following: S1, being a pure carbon-based sample, has a microwave loss mechanism dominated exclusively by dielectric loss, with a negligible magnetic loss contribution. For S2, S3, and S4, the values of tan δε and tan δμ in the high-frequency range are comparable and exhibit synergistic enhancement. This indicates that the introduction of Fe successfully transforms the loss mechanism from the purely dielectric loss of S1 to a synergistic combination of dielectric and magnetic losses. Such a magneto-dielectric synergistic loss mechanism simultaneously optimizes the impedance matching and energy dissipation capacity of the material: the dielectric loss is responsible for attenuating high-frequency electromagnetic waves, while the magnetic loss compensates for the loss deficiency in the low-frequency range, ultimately achieving broadband and enhanced microwave absorption performance.

2.2.2. Microwave Absorption Performance Analysis of the (Fe/C)/ABS Resin Sample

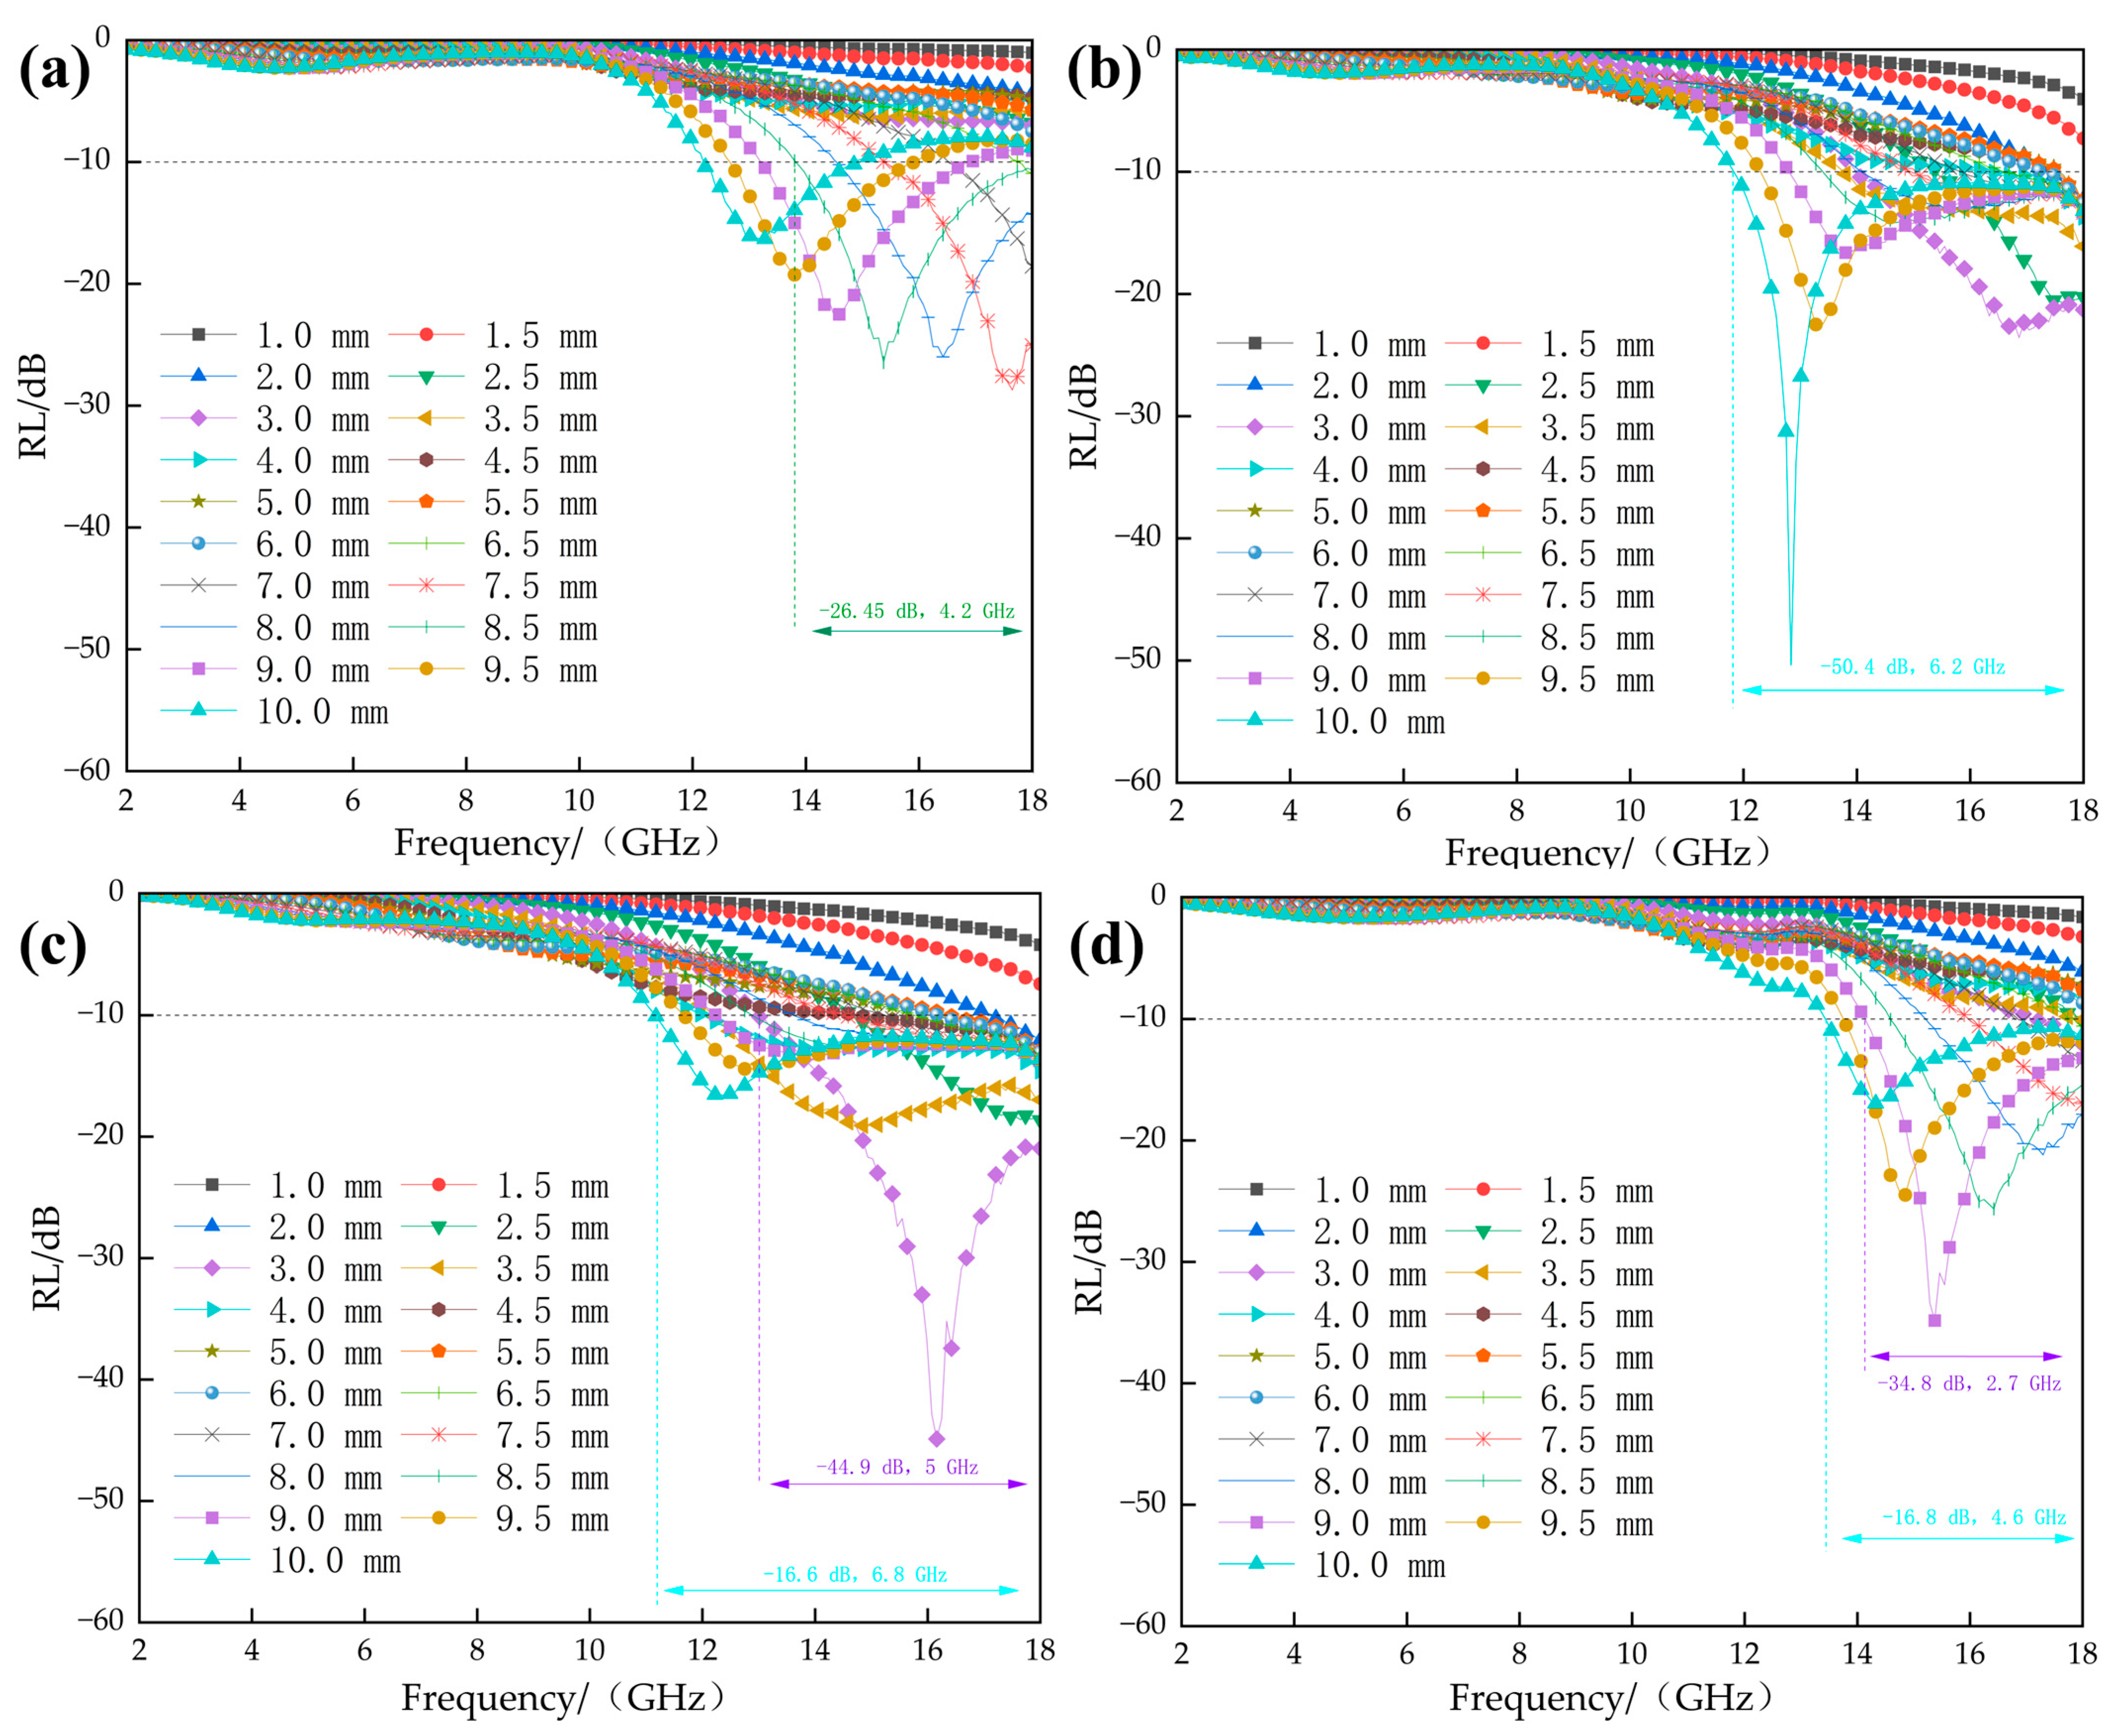
The reflection loss (RL) curves of the (Fe/C)/ABS resin composites are presented in Figure 8. As shown in Figure 8a, effective absorption (RL < −10 dB) is achieved only at thicknesses exceeding 7.0 mm, with an optimal RLmin of −26.45 dB and an effective absorption bandwidth (EAB) of 4.2 GHz. This suboptimal performance is attributable to the purely dielectric loss mechanism of the pure carbon-based material, which results in poor impedance matching and impedes electromagnetic wave penetration into the interior of the material, thereby precluding broadband microwave absorption and rendering it difficult to meet the application requirements across the 2–18 GHz range.
As revealed in Figure 8b, S2 achieves the optimal absorption performance among all samples: at a thickness of 10 mm, the RLmin reaches −50.4 dB with an EAB of 6.2 GHz. As shown in Figure 8c,d, S3 still maintains a strong absorption of −44.9 dB (located at 5 GHz) at a thickness of 8.0 mm, and the absorption band extends toward the mid-to-high frequency region; however, its overall performance has declined relative to that of S2. Further analysis of Figure 8b reveals that the absorption intensity of S2 far exceeds that of S1 (8.5 mm), and its EAB is expanded by 2 GHz. This remarkable enhancement stems from the optimal synergy between dielectric loss mechanisms (Fe/C interfacial polarization and carbon-defect-induced dipolar polarization) and magnetic loss mechanisms (natural resonance and exchange resonance), leading to superior impedance matching and establishing S2 as the best overall performer among the four samples.
With further increases in iron salt loading (S3, S4), the absorption performance declines rather than improves. This can be rationalized as follows: (1) excessive conductive iron species elevate the electrical conductivity, reducing the skin depth and causing more incident waves to be reflected at the surface; (2) the elevated permittivitymismatch shifts |Zin/Z0| away from unity, as evidenced by the lowest ε′ of S4 (Figure 7a); (3) Iron nanoparticles tend to agglomerate at high loadings., reducing effective Fe/C interfacial area and weakening interfacial polarization, consistent with the ε″ hierarchy S2 > S3 > S4 > S1 (Figure 7b); (4) the defect introduction rate saturates, with ID/IG increasing only marginally from S3 (0.937) to S4 (0.946) versus the marked rise from S1 (0.811) to S2 (0.894) (Figure 7). Collectively, enhanced skin effect, degraded impedance matching, diminished interfacial polarization, and saturated defect contribution cause the absorption performance to peak at 1 g (S2) and deteriorate thereafter.
The dissipation capability of the samples was further analyzed using the attenuation coefficient (α) curves and impedance matching (Z_in) plots. A larger α value indicates a stronger capacity of the material to attenuate electromagnetic waves, while a Z_in value closer to the free-space impedance Z0 (a complex quantity with a real part of 1 and an imaginary part of 0) signifies better impedance matching. The relevant formulas are as follows [36]:
α = 2 π f c μ ε + μ ε 2 + ( μ ε μ ε ) 2 ( μ ε + μ ε )
In the formula, c is the speed of light; f is the frequency; μ′ and μ″ are the real and imaginary parts of complex permeability, respectively; ε′ and ε″ are the real and imaginary parts of complex permittivity, respectively.
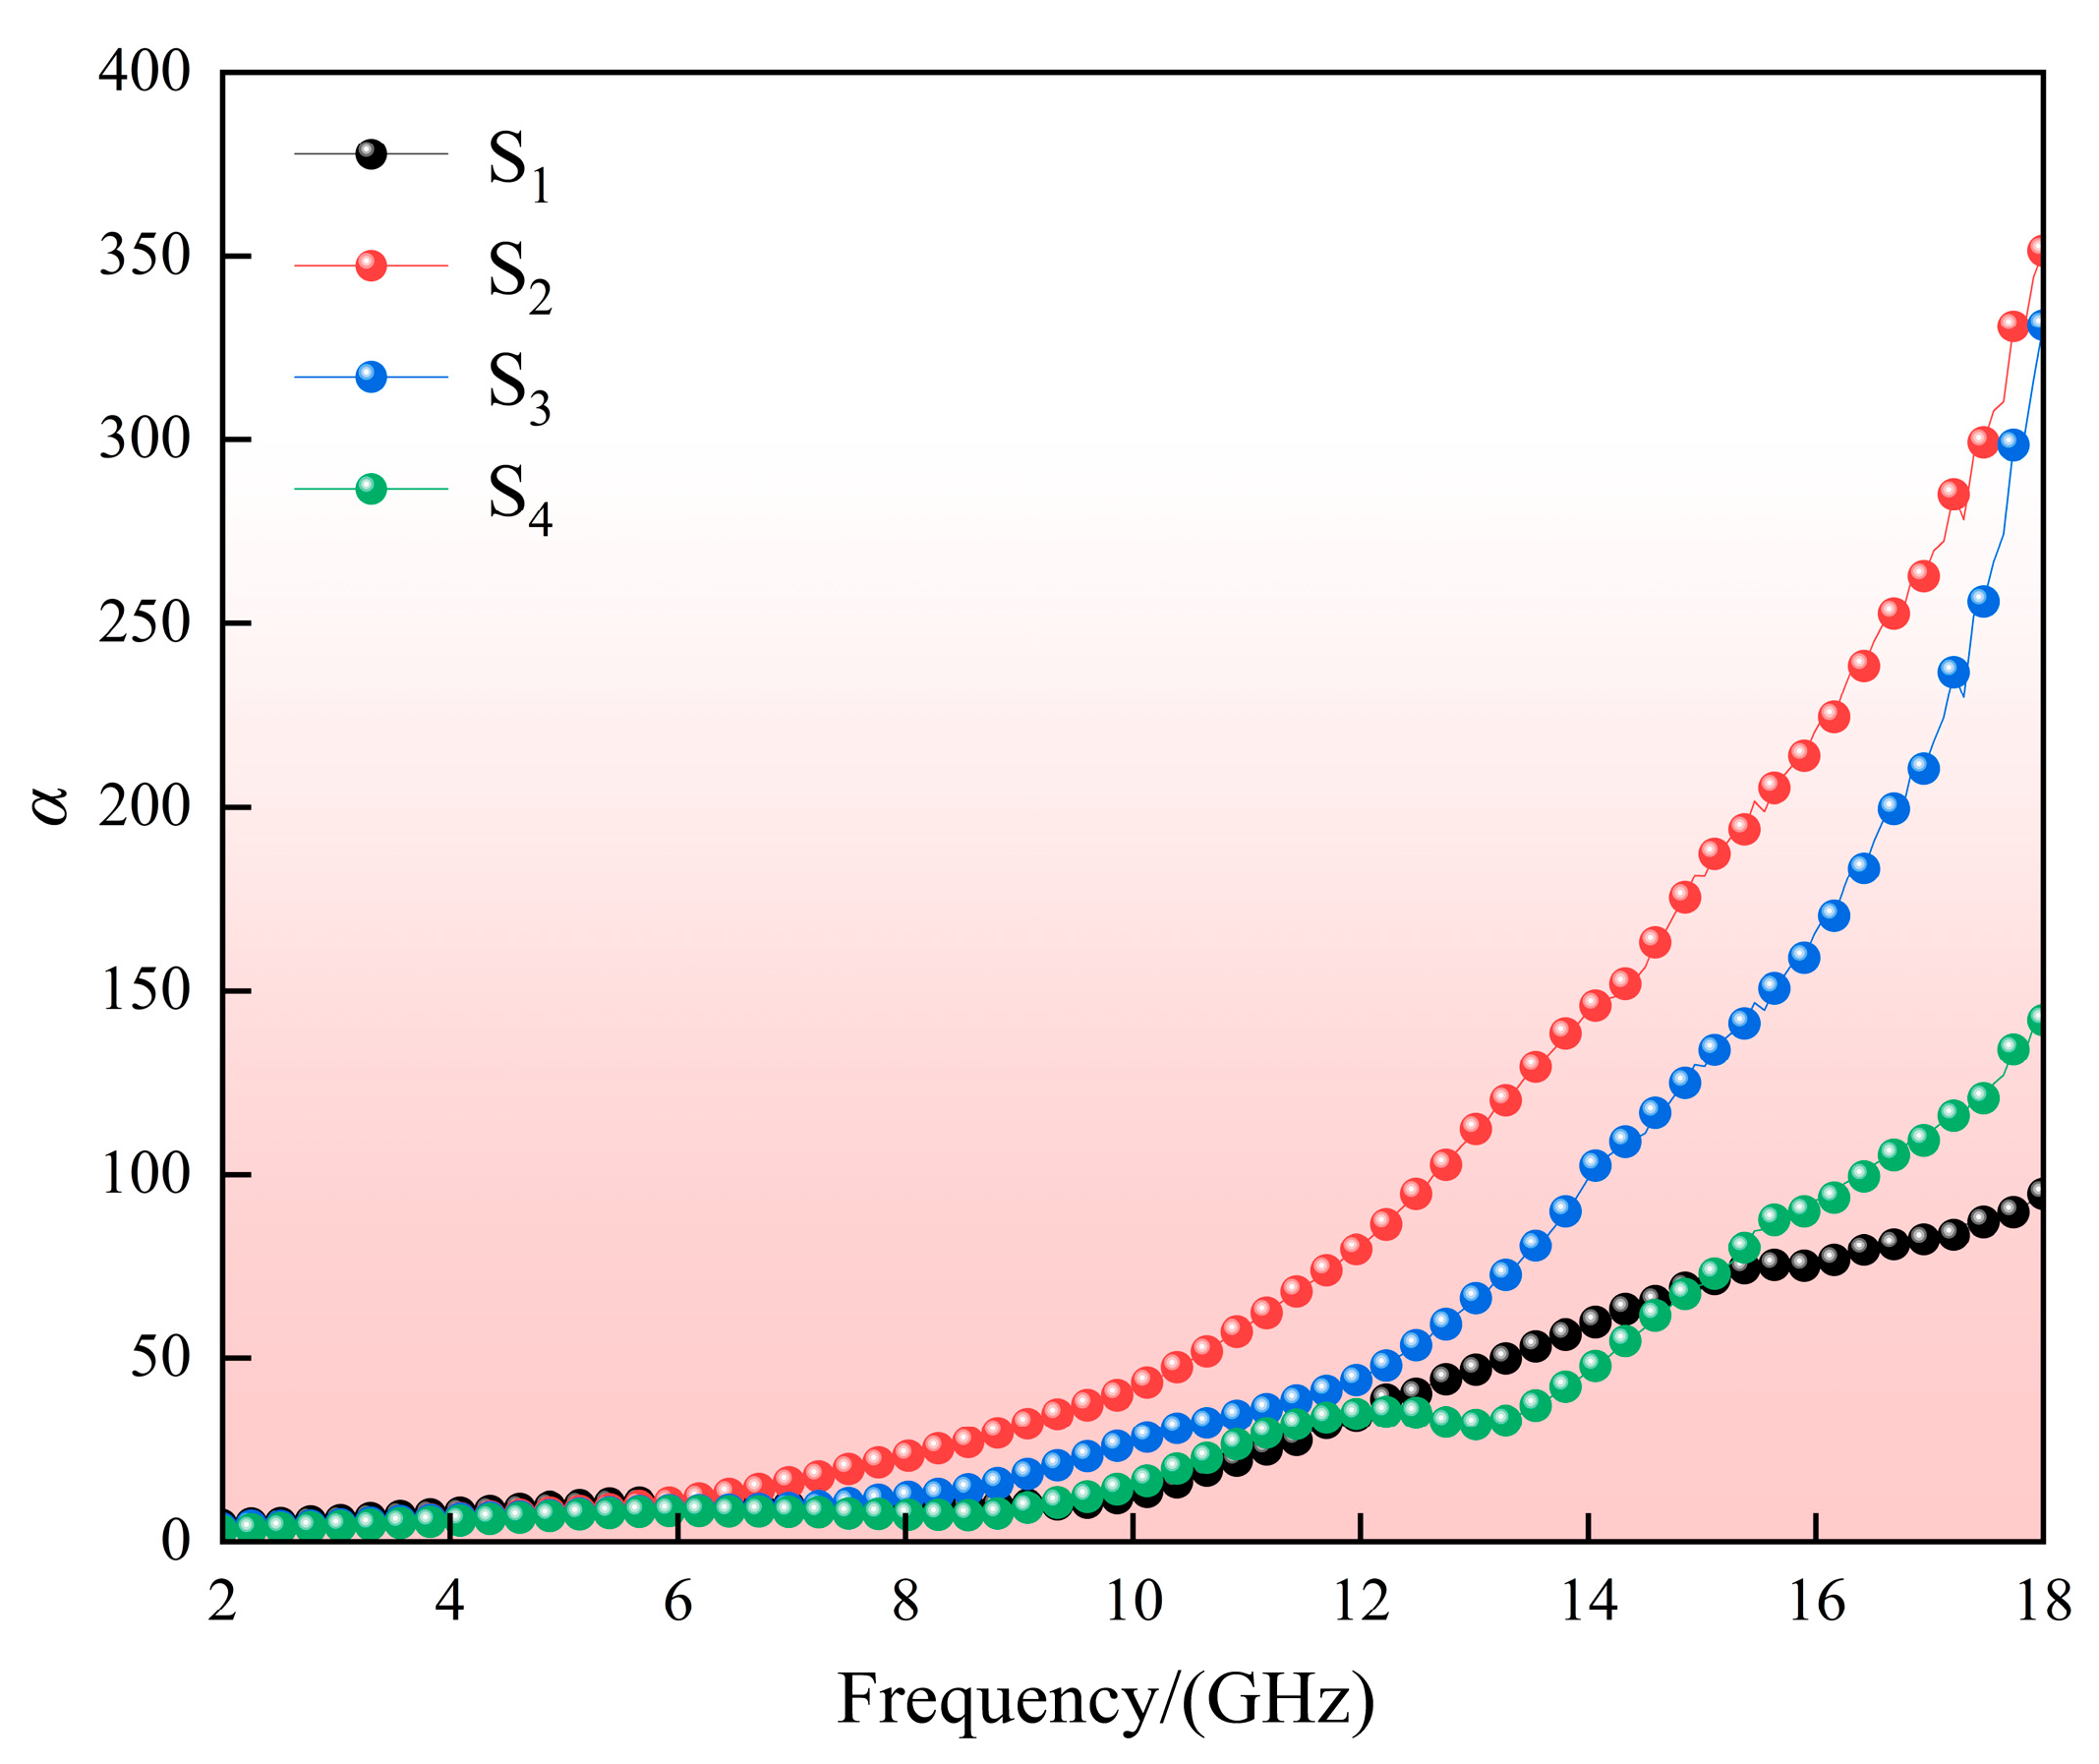
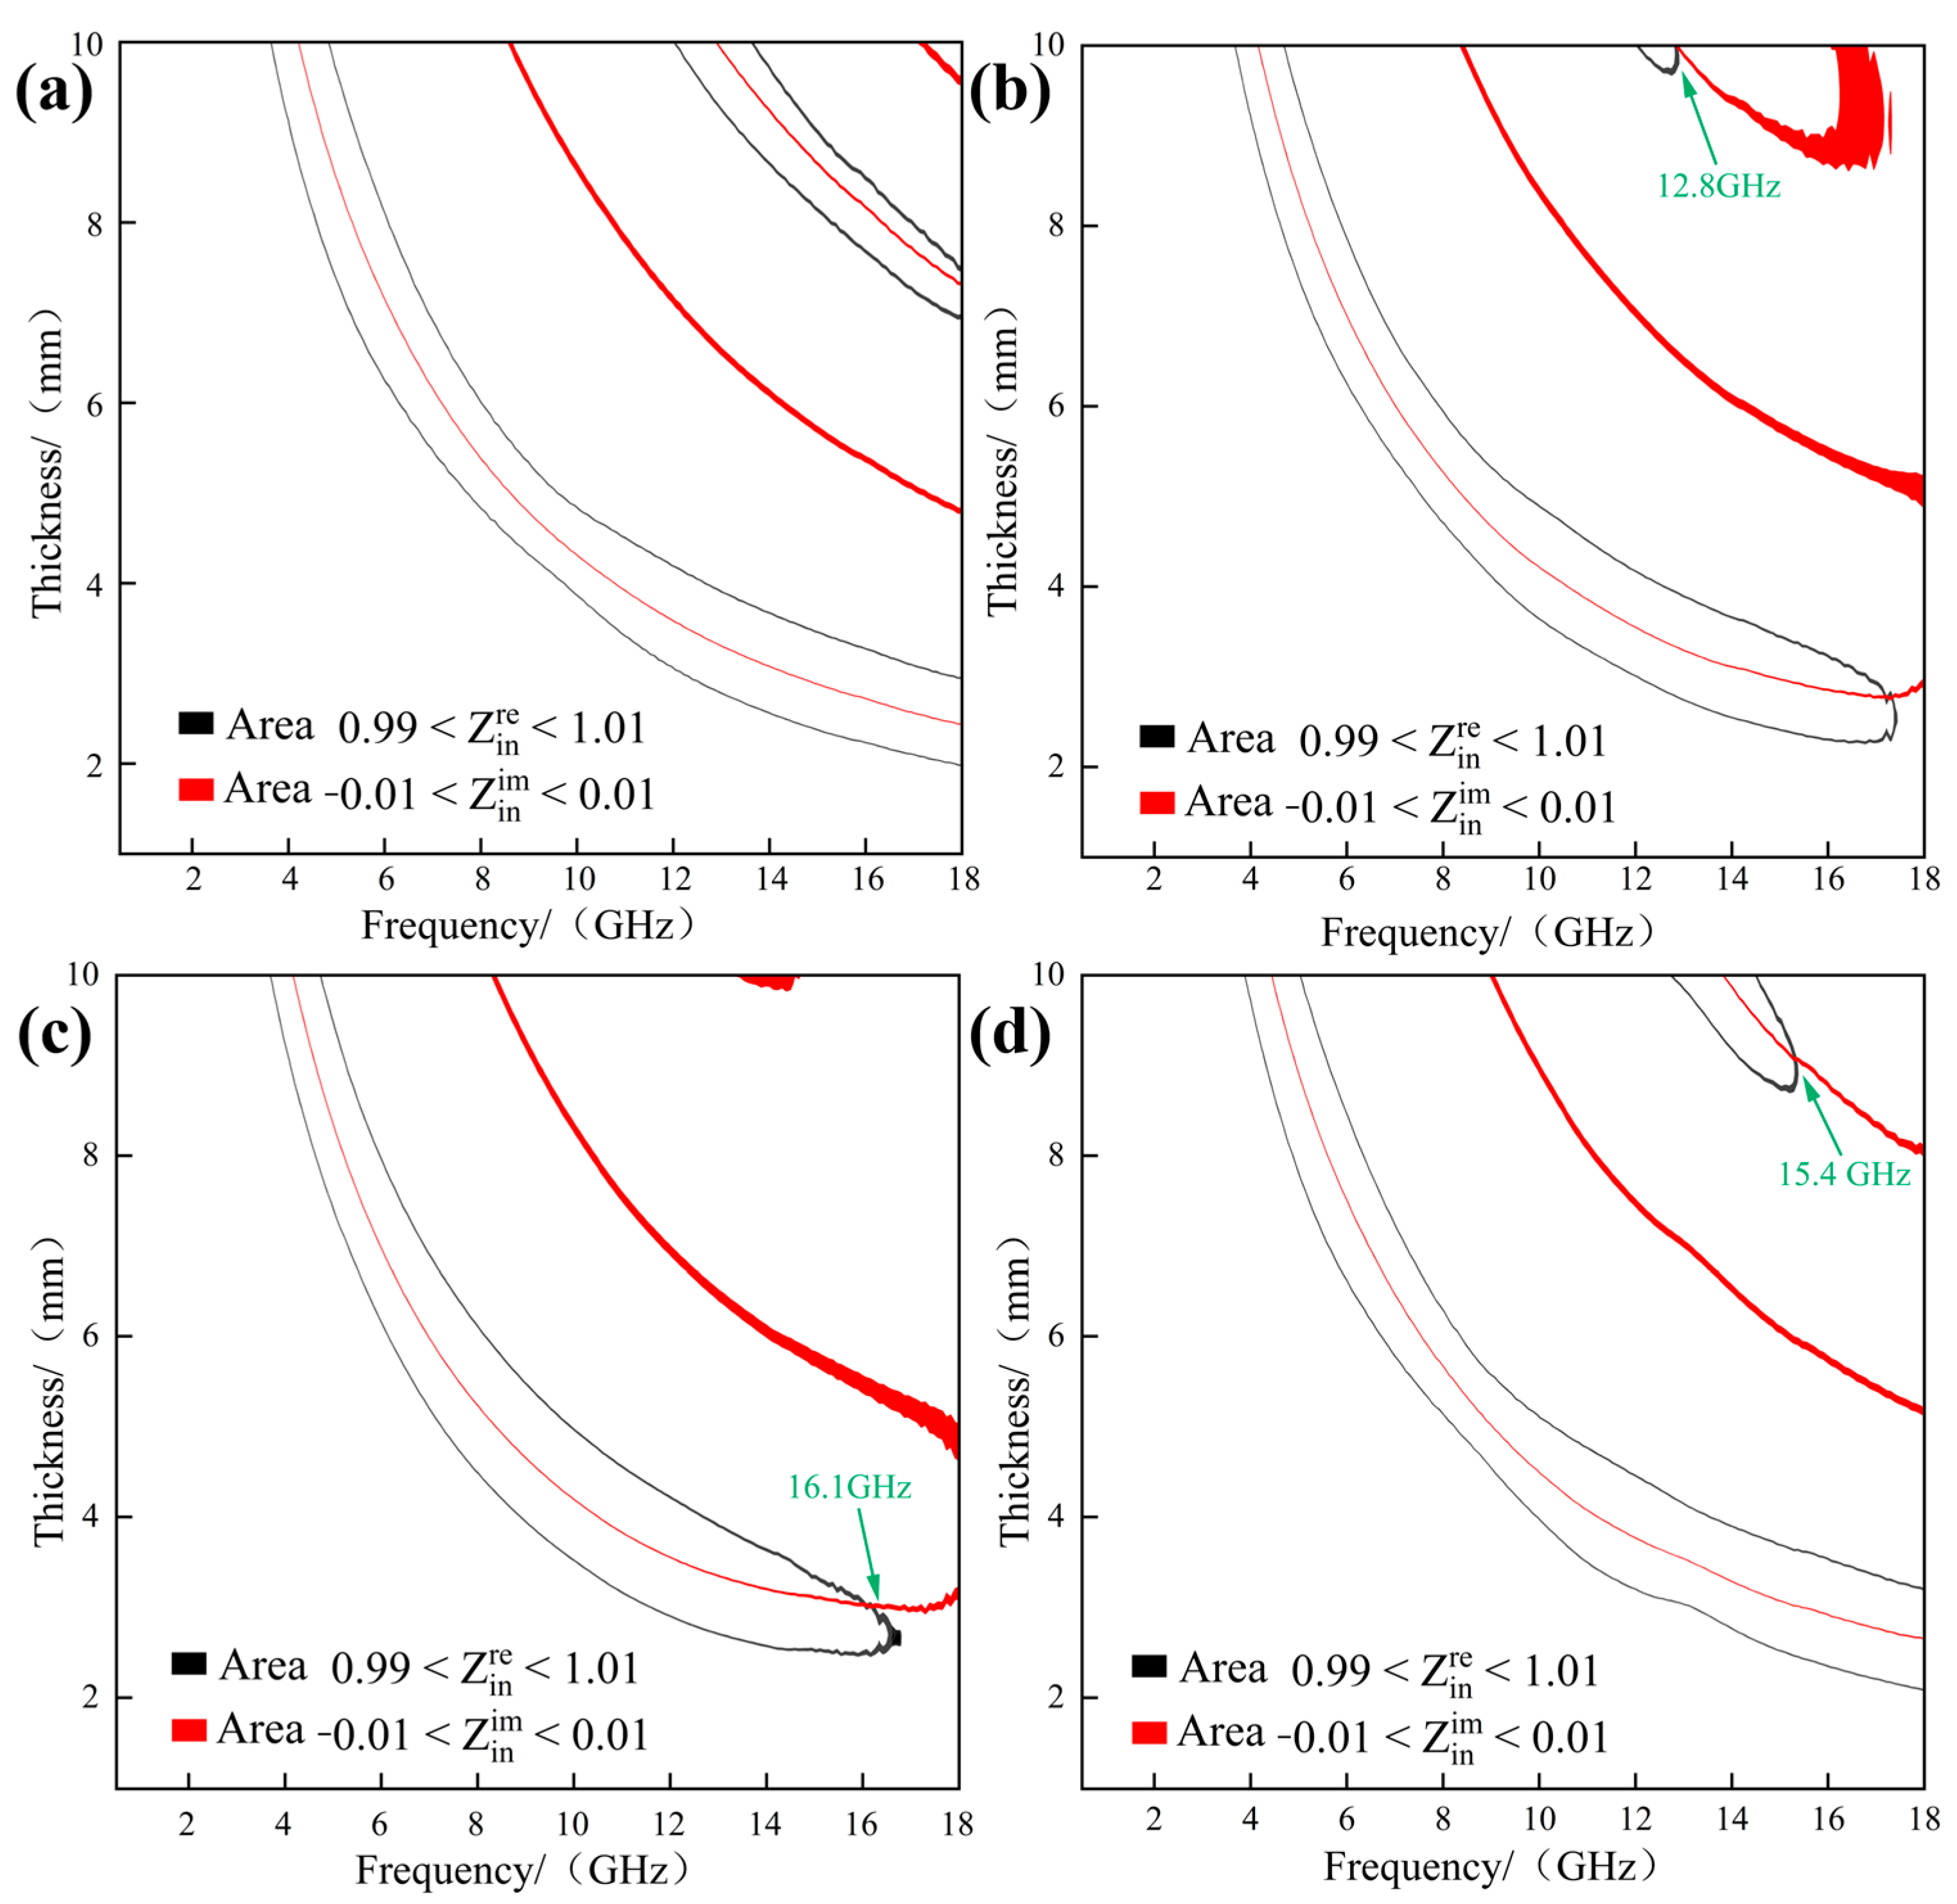
As shown in the attenuation coefficient (α) curves in Figure 9, S2 and S3 exhibit relatively strong attenuation coefficients in the high-frequency range, whereas S1 displays the lowest α values. In Figure 10, the black regions correspond to areas where the real part of Z_in approaches 1, and the red regions correspond to areas where the imaginary part of Z_in approaches 0; the intersection of these two regions represents the impedance matching zone between the material and free space. Within the impedance matching zone, electromagnetic waves can effectively penetrate into the interior of the material without being reflected at the surface. As revealed in Figure 10a, S1 exhibits virtually no well-defined impedance matching zone, confirming that its poor absorption performance originates from impedance mismatch. For S2, S3, and S4, the impedance matching zones are located in the 12–18 GHz range, which coincides with the frequency range of their strongest reflection loss peaks, further substantiating that their absorption performance is also governed by impedance matching.
The performance of the as-prepared S2 sample is benchmarked against recently reported carbon-based iron-containing composite microwave-absorbing materials, as summarized in Table 2. It is evident that S2 exhibits competitive performance in terms of filler loading and effective absorption bandwidth, rendering it more suitable for broadband microwave absorption applications. Nevertheless, its matching thickness remains relatively large, and its minimum reflection loss still leaves room for further improvement.
The performance of the as-prepared S2 sample is benchmarked against recently reported carbon-based iron-containing composite microwave-absorbing materials, as summarized in Table 2. To enable a comprehensive and fair comparison that simultaneously accounts for effective absorption bandwidth (EAB), matching thickness (d), and filler loading, the figure of merit (FOM = EAB/(d × filler loading)) was calculated for each material. Remarkably, S2 achieves a FOM value of 24.8, which is on par with that of the best-performing benchmark, FeNi3/MoS2@NSAPC (FOM = 24.7), and substantially outperforms all other listed materials. More importantly, S2 attains the highest EAB (6.2 GHz) among all compared materials, covering a broader frequency range and thereby offering a distinct practical advantage in broadband microwave absorption applications. Nevertheless, its matching thickness remains a limiting factor, and its minimum reflection loss still leaves room for further improvement.
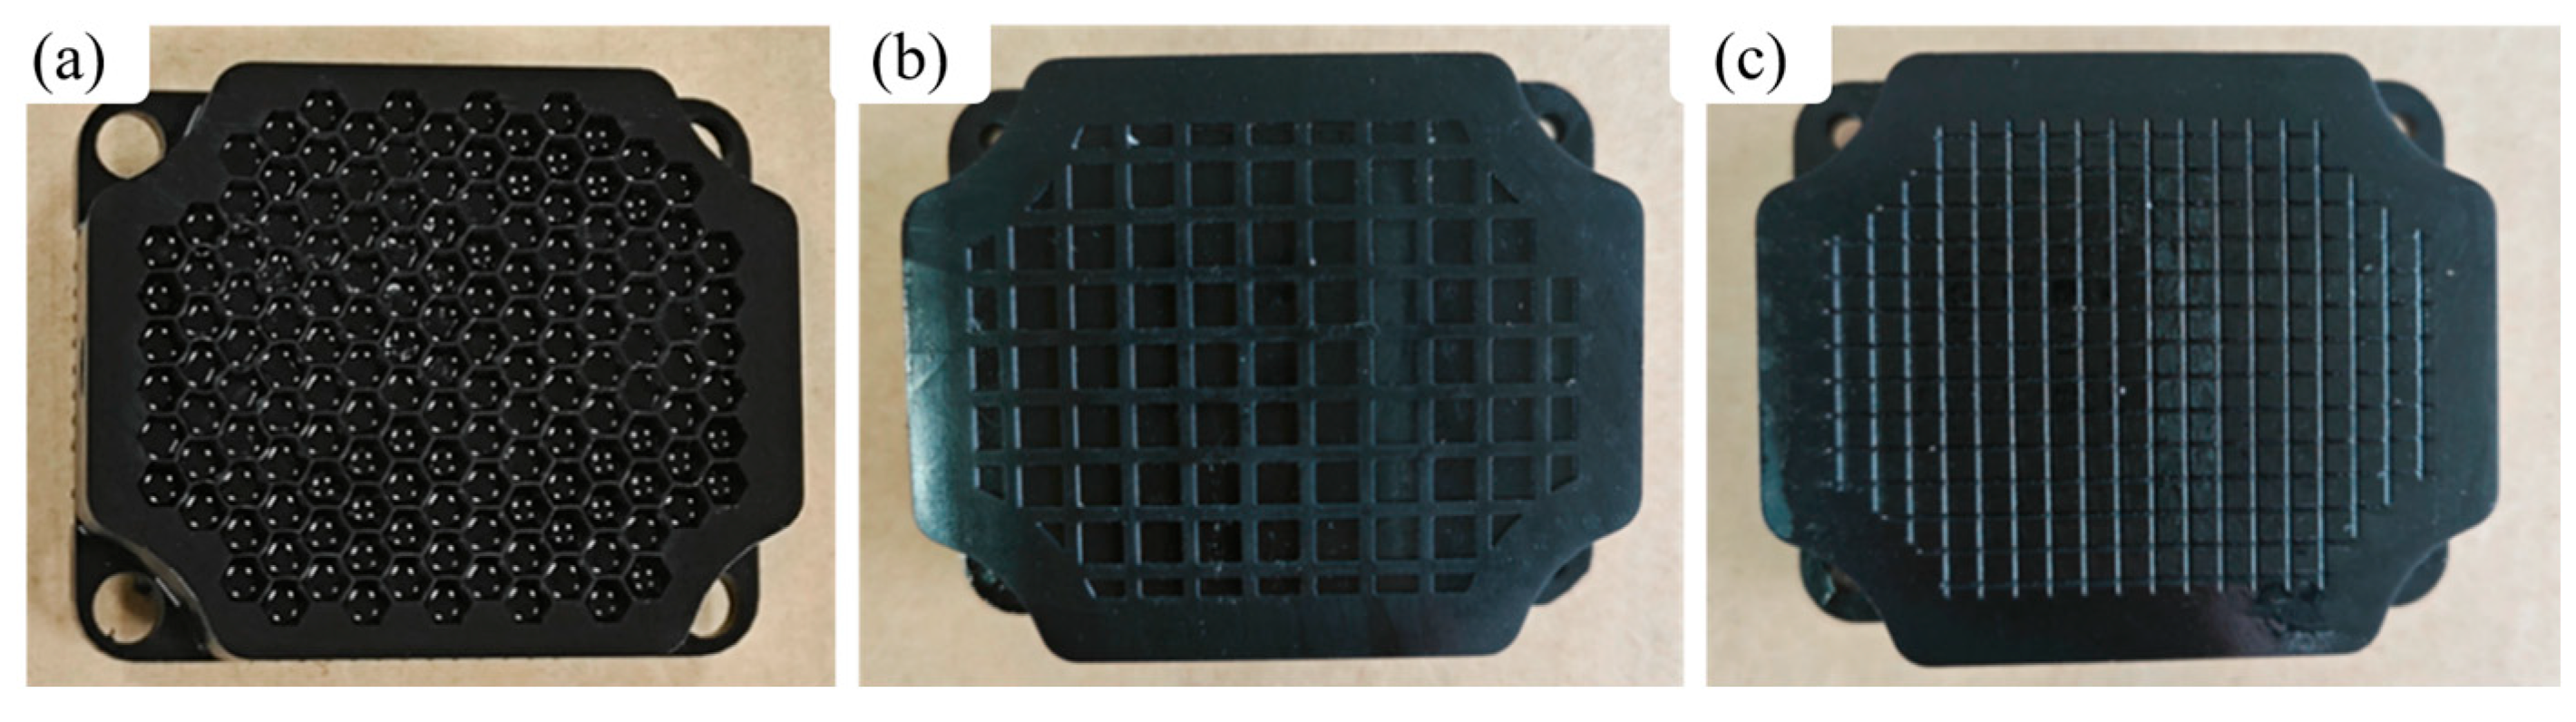
To further demonstrate the geometric design flexibility afforded by the 3D printing approach, a tilt sensor housing was fabricated from the (Fe/C)/ABS composite (Figure 11). The top sectional view reveals that the housing surface integrates multiple functional structural motifs—including honeycomb, cubic, and pyramidal patterns—while the interior maintains a closed hollow architecture. Such complex multi-featured geometries are difficult to achieve via conventional compression molding, yet can be readily realized through the SLA-based printing route employed in this work. This demonstration highlights the potential of (Fe/C)/ABS composites for the direct fabrication of structurally intricate, application-specific microwave-absorbing components.

3. Conclusions

(1)
XRD, SEM, DES, Raman, and XPS analyses collectively demonstrate that, with increasing iron salt content, the iron species are incorporated into the carbon matrix in an X-ray amorphous or nanocrystalline form. Although the sp2-hybridized carbon fraction in the carbon matrix increases, this process is accompanied by the generation of abundant defect sites, rendering the carbon matrix overall highly defective in nature.
(2)
(Fe/C)/ABS resin metamaterials were successfully fabricated via 3D printing. The analyses reveal that the incorporation of iron salts markedly broadens the microwave absorption bandwidth of the C/ABS resin metamaterials. At an iron salt loading of 1 g (S2), the (Fe/C)/ABS resin metamaterial achieves an effective absorption bandwidth (EAB) of 6.2 GHz at a matching thickness of 10 mm.
(3)
Benchmarking against comparable carbon-based iron-containing composite microwave-absorbing materials reported in the literature, the as-prepared (Fe/C)/ABS resin metamaterial exhibits a broader effective absorption bandwidth at a lower filler loading. However, its matching thickness remains relatively large and requires further optimization.
(4)
This study provides a new strategy for the fabrication of electromagnetic metamaterials. The as-prepared (Fe/C)/ABS resin composites can be molded into structurally complex microwave-absorbing components via 3D printing, demonstrating considerable application potential.

Author Contributions

Conceptualization, methodology, writing—original draft preparation and data curation, L.L. and X.D.; software and validation, Q.X. and X.Z.; formal analysis and investigation, W.Z. and K.C.; visualization, S.L.; supervision and funding acquisition, L.Z., Z.Y. and J.D.; resources, writing—review and editing, project administration, S.L., L.Z. and Z.Y. All authors have read and agreed to the published version of the manuscript.

Funding

This work was supported by the Science and Technology Department of Sichuan Province, China [grant number 20ZS2112]; the Research Foundation of Southwest University of Science and Technology, China [grant number 19zx7165]; the Research Foundation of Southwest University of Science and Technology, China [grant number 23zx7128].

Institutional Review Board Statement

Not applicable.

Informed Consent Statement

Not applicable.

Data Availability Statement

The data presented in this study are available on request from the corresponding author.

Conflicts of Interest

Author Qi Xu was employed by the company Chongqing Chuanyi Automation Co., Ltd. Crystal Technology Branch, Chongqing China. The remaining authors declare that the research was conducted in the absence of any commercial or financial relationships that could be construed as a potential conflict of interest

References

  1. Han, Y.; Guo, H.; Qiu, H.; Hu, J.; He, M.; Shi, X.; Zhang, Y.; Kong, J.; Gu, J. Multimechanism Decoupling for Low-Frequency Microwave Absorption Hierarchical Fe-Doped Co Magnetic Microchains. Adv. Funct. Mater. 2025, 35, 2506803. [Google Scholar] [CrossRef]
  2. Yan, Y.; Qin, G.; Zhang, K.; Gao, B.; Ma, G.; Huang, X.; Zhou, Y. Enhancing Microwave Absorption Performance of MoS2 by Synergistic Effect of Fe Doping. J. Adv. Ceram. 2025, 14, 9221039. [Google Scholar] [CrossRef]
  3. Cai, Y.; Cheng, Y.; Wang, Z.; Fei, G.; Lavorgna, M.; Xia, H. Facile and Scalable Preparation of Ultralight Cobalt@graphene Aerogel Microspheres with Strong and Wide Bandwidth Microwave Absorption. Chem. Eng. J. 2023, 457, 141102. [Google Scholar] [CrossRef]
  4. Ha, J.-H.; Lee, S.; Park, B.; Lee, J.; Song, I.-H. Feasibility of As-Prepared Reticulated Porous Barium Titanate without Additional Radar-Absorbing Material Coating in Potential Military Applications. J. Aust. Ceram. Soc. 2020, 56, 1481–1491. [Google Scholar] [CrossRef]
  5. Li, W.; Yu, Z.; Wen, Q.; Feng, Y.; Fan, B.; Zhang, R.; Riedel, R. Ceramic-Based Electromagnetic Wave Absorbing Materials and Concepts towards Lightweight, Flexibility and Thermal Resistance. Int. Mater. Rev. 2023, 68, 487–520. [Google Scholar] [CrossRef]
  6. Wang, W.; Zhang, H.; Zhao, Y.; Wang, J.; Zhao, H.; Li, P.; Yun, J.; Deng, Z.; Zhang, Z.; Tian, J.; et al. A Novel MOF-Drived Self-Decomposition Strategy for CoO@N/C-Co/Ni-NiCo2O4 Multi-Heterostructure Composite as High-Performance Electromagnetic Wave Absorbing Materials. Chem. Eng. J. 2021, 426, 131667. [Google Scholar] [CrossRef]
  7. He, J.; Li, J.; Zhang, J.; Yi, P.; Sun, X.; Han, G.; Li, X.; Zhang, R.; Liu, X.; Yu, R. Metal Ions-Assisted Construction of SiO2/MXene/Fe3O4 Aerogel as Multifunctional Electromagnetic Wave Absorbing Material. Carbon. 2023, 214, 118266. [Google Scholar] [CrossRef]
  8. Wang, X.; Qin, J.; Cui, J.; Huang, L.; Yuan, Y.; Li, Y. Reduced Graphene Oxide/Carbon Nanofiber Based Composite Fabrics with Spider Web-like Structure for Microwave Absorbing Applications. Adv. Fiber Mater. 2022, 4, 1164–1176. [Google Scholar] [CrossRef]
  9. Zhang, N.; Gu, W.; Zhao, Y.; Zheng, J.; Pei, C.; Fan, F.; Ji, G. The Enhanced Microwave Broadband Absorbing Ability of Carbon Microspheres via Electromagnetic Simulating Honeycomb Design. J. Mater. Sci. Mater. Electron. 2021, 32, 25809–25819. [Google Scholar] [CrossRef]
  10. Gao, N.; Li, W.-P.; Wang, W.-S.; Liu, D.-P.; Cui, Y.-M.; Guo, L.; Wang, G.-S. Balancing Dielectric Loss and Magnetic Loss in Fe-NiS2/NiS/PVDF Composites toward Strong Microwave Reflection Loss. ACS Appl. Mater. Interfaces 2020, 12, 14416–14424. [Google Scholar] [CrossRef] [PubMed]
  11. Liang, X.; Wang, C.; Yao, Z.; Zhang, Y.; Liu, S.; Liu, J.; Yu, M. A Facile Synthesis of Fe/C Composite Derived from Fe-Metal Organic Frameworks: Electromagnetic Wave Absorption with Thin Thickness. J. Alloys Compd. 2022, 922, 166299. [Google Scholar] [CrossRef]
  12. Xu, Q.; Cui, K.; Zhong, L.; Yin, H.; Dai, J. 3D Printing Preparation and Microwave Absorption Performance Analysis of (Ni/C)/UV Resin Electromagnetic Metamaterials. J. Funct. Mater. 2026, 57, 123–131. [Google Scholar] [CrossRef]
  13. Huang, D.; Dai, J.; Li, Z.; Wen, X.; Feng, W.; Liu, H. Effect of Carbon-Based Nanomaterials on the Wave Absorption Properties of Hollow ZnFe2O4. Mater. Sci. Eng. B 2023, 293, 116462. [Google Scholar] [CrossRef]
  14. Wang, Y.; Han, H.; Zhang, M.; Wu, S.; Zhao, J.; Zhang, X.; Zhao, Z.; Zhang, M.; Miao, C.; Wang, X.; et al. Biomass-Derived Carbon-Based SiC Coral-like Nanostructures for Electromagnetic Wave Absorption. Nano Res. 2025, 18, 94907790. [Google Scholar] [CrossRef]
  15. Wang, G.; Gao, Z.; Tang, S.; Chen, C.; Duan, F.; Zhao, S.; Lin, S.; Feng, Y.; Zhou, L.; Qin, Y. Microwave Absorption Properties of Carbon Nanocoils Coated with Highly Controlled Magnetic Materials by Atomic Layer Deposition. ACS Nano 2012, 6, 11009–11017. [Google Scholar] [CrossRef] [PubMed]
  16. Shu, R.; Li, X.; Shi, J. Construction of Porous Carbon-Based Magnetic Composites Derived from Iron Zinc Bimetallic Metal-Organic Framework as Broadband and High-Efficiency Electromagnetic Wave Absorbers. J. Colloid Interface Sci. 2023, 633, 43–52. [Google Scholar] [CrossRef] [PubMed]
  17. Dai, B.; Qi, T.; Song, M.; Geng, M.; Dai, Y.; Qi, Y. Lightweight Electromagnetic Wave Absorbent Composites with Fe3O4 Nanocrystals Uniformly Decorated on the Surface of Carbon Spheres. Nanoscale 2022, 14, 10456–10468. [Google Scholar] [CrossRef] [PubMed]
  18. Zhang, X.; Wang, J.; Wang, W.; Wu, C.; Liu, C.; Deng, H.; Wei, L.; Gu, W.; Du, W.; Chen, Y.; et al. Construction of Air/SiO2@Fe/C Yolk-Shell Nanospheres for Boosted Low Frequency Electromagnetic Wave Absorption. J. Alloys Compd. 2025, 1037, 182309. [Google Scholar] [CrossRef]
  19. Shu, R.; Li, X.; Ge, C.; Wang, L. Synthesis of FeCoNi/C Decorated Graphene Composites Derived from Trimetallic Metal-Organic Framework as Ultrathin and High-Performance Electromagnetic Wave Absorbers. J. Colloid Interface Sci. 2023, 630, 754–762. [Google Scholar] [CrossRef] [PubMed]
  20. Ding, C.; Wu, T.; Hu, X.; Shao, C.; Xu, Z.; Fu, H.; Wu, S.; Wen, G.; Huang, X. Pomegranate Micro/Nano Hierarchical Plasma Structure for Superior Microwave Absorption. Nano Res. 2022, 15, 8688–8696. [Google Scholar] [CrossRef]
  21. Hou, S.; Wang, Y.; Gao, F.; Jin, F.; Zhu, B.; Wu, Q.; Ge, H.; Cao, Z.; Yang, H. Biomimetic Leaf Structures for Ultra-Thin Electromagnetic Wave Absorption. Nano Res. 2024, 17, 4507–4516. [Google Scholar] [CrossRef]
  22. Liu, Z.; Luo, Z.; Zhang, W.; Liu, Z.; Tang, C.; Chong, P.; Zhao, K.; Tang, Y. Construction of Biomimetic Sea Urchin-like (BNf/BNNS)@C Hierarchical Porous Aerogels for Synergistic Enhancement of Electromagnetic Wave Absorption Performance. Surf. Interfaces 2025, 73, 107613. [Google Scholar] [CrossRef]
  23. Duan, Y.; Gu, S.; Ma, B.; Wang, M.; Chen, W.; Shi, Y.; Liu, J. Metamaterial Absorbers with Archimedean Tiling Structures: Toward Response and Absorption of Multiband Electromagnetic Waves. ACS Appl. Mater. Interfaces 2024, 16, 21255–21263. [Google Scholar] [CrossRef] [PubMed]
  24. Feng, J.; Kang, Y.; Qiao, J.; Xu, Q.; Zhang, G.; Li, L. Ultrathin Multifunctional Labyrinth Metamaterial with Efficient Dual Absorption of Sound and Electromagnetic Waves. Compos. Part B Eng. 2026, 316, 113541. [Google Scholar] [CrossRef]
  25. Yang, D.; Mei, H.; Yao, L.; Yang, W.; Yao, Y.; Cheng, L.; Zhang, L.; Dassios, K.G. 3D/4D Printed Tunable Electrical Metamaterials with More Sophisticated Structures. J. Mater. Chem. C 2021, 9, 12010–12036. [Google Scholar] [CrossRef]
  26. Huang, Q.; Wang, G.; Zhou, M.; Zheng, J.; Tang, S.; Ji, G. Metamaterial Electromagnetic Wave Absorbers and Devices: Design and 3D Microarchitecture. J. Mater. Sci. Technol. 2022, 108, 90–101. [Google Scholar] [CrossRef]
  27. Mao, K.; Liu, C.; Sun, H.; Hu, Q.; Chang, Z.; Gong, H.; Zhu, H.; Colombo, P.; Feng, Y.; Guo, X. Fabrication of Lightweight and Broadband Absorbing Polymer-Derived SiCN Tunable Honeycomb Ceramics by Vat Photopolymerization 3D Printing. Chem. Eng. J. 2026, 530, 173443. [Google Scholar] [CrossRef]
  28. Xiao, W.; Peng, G.; Zhang, H.; Zhang, X.; Tian, Z.; Xu, G.; Zhang, H.; Liu, F. Constructing a Two-Layer Oblique Honeycomb Sandwich Structure by LCD 3D Printing for Efficient Electromagnetic Wave Absorbing. Compos. Struct. 2023, 305, 116449. [Google Scholar] [CrossRef]
  29. Li, B.; Qi, W.; Wu, Q. Research Progress of Carbon Materials in the Field of Three-Dimensional Printing Polymer Nanocomposites. Nanotechnol. Rev. 2022, 11, 1193–1208. [Google Scholar] [CrossRef]
  30. Fei, J.; Rong, Y.; Zhu, L.; Li, H.; Zhang, X.; Lu, Y.; An, J.; Bao, Q.; Huang, X. Progress in Photocurable 3D Printing of Photosensitive Polyurethane: A Review. Macromol. Rapid Commun. 2023, 44, 2300211. [Google Scholar] [CrossRef] [PubMed]
  31. Guo, Y.; Zhao, X.; Guan, J. Construction of Hydroxyapatite Bioceramics with Biomimetic Structures by Weak Magnetic Field-Assisted 3D Printing. J. Adv. Ceram. 2025, 14, 9221144. [Google Scholar] [CrossRef]
  32. Zhang, X.; Yuan, B.; Wei, X.; Lu, W. Photopolymerization 3D Printing of Structural Electromagnetic Wave Absorbing Materials: Progress, Challenges, and Prospects. Mater. Today Chem. 2026, 52, 103341. [Google Scholar] [CrossRef]
  33. Zhou, S.; Zhang, G.; Nie, Z.; Liu, H.; Yu, H.; Liu, Y.; Bi, K.; Geng, W.; Duan, H.; Chou, X. Recent Advances in 3D Printed Structures for Electromagnetic Wave Absorbing and Shielding. Mater. Chem. Front. 2022, 6, 1736–1751. [Google Scholar] [CrossRef]
  34. Zhao, B.; Shao, G.; Fan, B.; Chen, Y.; Zhang, R. Effect of the TiO2 Amounts on Microwave Absorption Properties of Ni/TiO2 Heterostructure Composites. Phys. B Condens. Matter 2014, 454, 120–125. [Google Scholar] [CrossRef]
  35. Qin, F.; Brosseau, C. A Review and Analysis of Microwave Absorption in Polymer Composites Filled with Carbonaceous Particles. J. Appl. Phys. 2012, 111, 061301–061324. [Google Scholar] [CrossRef]
  36. Zhou, M.; Lu, F.; Chen, B.; Zhu, X.; Shen, X.; Xia, W.; He, H.; Zeng, X. Thickness Dependent Complex Permittivity and Microwave Absorption of NiCo2O4 Nanoflakes. Mater. Lett. 2015, 159, 498–501. [Google Scholar] [CrossRef]
  37. Fan, G.; Song, X.; Zhang, X.; Wang, Q.; Tang, Y.; Liu, Y. Biomass-Derived Ferrous Magnetic Carbon-Based Nanocomposites from Loofah Collaterals for Excellent Electromagnetic Wave-Absorbing Materials. J. Alloys Compd. 2023, 969, 172384. [Google Scholar] [CrossRef]
  38. Teng, Z.; Zeng, S.; Feng, W.; Zhu, L.; Tan, Y.; Han, X.; Chen, C.; Zhang, H. Facile Synthesis and Enhanced Microwave Absorption Properties of Fe-Fe3C@C Composites. J. Mater. Sci. Mater. Electron. 2019, 30, 14573–14579. [Google Scholar] [CrossRef]
  39. Guo, X.; Wu, Z.; Chang, J.; Niu, D.; Ren, A.; Xu, Y.; Li, P.; Zhou, H. Boosting of Electromagnetic Wave Absorption Properties by Multiple Reinforcement Mechanisms of Metals in FeNi3/MoS2@NSAPC Composites. Mater. Sci. Eng. B 2023, 298, 116826. [Google Scholar] [CrossRef]
  40. Sun, D.; Zou, Q.; Wang, Y.; Wang, Y.; Jiang, W.; Li, F. Controllable Synthesis of Porous Fe3O4@ZnO Sphere Decorated Graphene for Extraordinary Electromagnetic Wave Absorption. Nanoscale 2014, 6, 6557–6562. [Google Scholar] [CrossRef] [PubMed]
  41. Liu, X.; Cui, X.; Chen, Y.; Zhang, X.-J.; Yu, R.; Wang, G.-S.; Ma, H. Modulation of Electromagnetic Wave Absorption by Carbon Shell Thickness in Carbon Encapsulated Magnetite Nanospindles-Poly(Vinylidene Fluoride) Composites. Carbon 2015, 95, 870–878. [Google Scholar] [CrossRef]
Figure 1. Flow chart for the preparation of Fe/C samples.
Coatings 16 00824 g001
Figure 2. XRD patterns of C and Fe/C.
Coatings 16 00824 g002
Figure 3. Scanning Electron Micrograph of Fe/C Composite Material: (a) Fe/C-0; (b) Fe/C-1; (c) Fe/C-2; (d) Fe/C-3.
Coatings 16 00824 g003
Figure 4. EDS of Fe/C: (a) SEM image of Fe/C-3; (b) Fe elemental mapping; (c) C elemental mapping; (d) EDS spectrum of point A; (e) EDS spectrum of point B.
Coatings 16 00824 g004
Figure 5. Raman spectra of Fe/C.
Coatings 16 00824 g005
Figure 6. XPS spectra of Fe/C composites: (a) XPS survey spectra of S1–S4 samples; (b) C1s high-resolution spectra of S1–S4 samples.
Coatings 16 00824 g006
Figure 7. Dielectric parameters of the (Fe/C)/ABS resin sample: (a) real part of complex permittivity ε′; (b) imaginary part of complex permittivity ε″; (c) real part of complex permeability μ′; (d) imaginary part of complex permeability μ″; (e) dielectric loss tangent curve tanδε; (f) magnetic loss tangent curve tanδμ.
Coatings 16 00824 g007
Figure 8. Reflection loss curves of the (Fe/C)/ABS resin sample: (a) S1; (b) S2; (c) S3; (d) S4.
Coatings 16 00824 g008
Figure 9. α curve of the (Fe/C)/ABS resin sample.
Coatings 16 00824 g009
Figure 10. Zin curves of the (Fe/C)/ABS resin sample: (a) S1; (b) S2; (c) S3; (d) S4.
Coatings 16 00824 g010
Figure 11. 3D-printed samples: (a) honeycomb structure; (b) square structure; (c) truncated pyramid structure.
Coatings 16 00824 g011
Table 1. Analysis and testing instruments.
InstrumentModelManufacturer
Analytical instrumentsScanning electron microscopy (SEM)JSM-typeNippon Electronics
X-ray diffractometer (XRD)G′PetprotypePanalytical, The Netherlands
X-ray Photoelectron Spectrometer(XPS)ESCALABXi+typeThermoFisher
Raman spectroscopy (Raman)InViatypeRenishaw, UK
Test InstrumentsVectornetwork analyzerNtypeAgilentTechnologies
Table 2. Comparison of microwave absorption performance of various iron-containing composite materials.
MaterialsRLmin (dB)EABmax (GHz) d (mm) Fill Ratio (%)FOM
Fe@Fe3C/C nanocomposites [37]−42.775.01.493011.2
Fe-Fe3C@C composites [38]−35.54.02.0504.0
FeNi3/MoS2@NSAPC [39]−60.665.191.41524.7
GN-Fe3O4@ZnO [40]−401.65301.1
Fe3O4@C [41]−38.82.72.1602.1
(Fe/C)/ABS (This work)−50.46.2102.524.8
Define FOM = EAB/(d × Fill ratio), where this value reflects the microwave absorption bandwidth achievable per unit thickness and per unit filler loading.
Disclaimer/Publisher’s Note: The statements, opinions and data contained in all publications are solely those of the individual author(s) and contributor(s) and not of MDPI and/or the editor(s). MDPI and/or the editor(s) disclaim responsibility for any injury to people or property resulting from any ideas, methods, instructions or products referred to in the content.