Article

Crystal Plasticity Finite Element Simulation and Quasi-In-Situ Experimental Study of Tensile Strain Partitioning in Multiphase High-Strength Steel

1
College of Mechanical Engineering, North China University of Science and Technology, Tangshan 063210, China
2
College of Metallurgy and Energy, North China University of Science and Technology, Tangshan 063210, China
3
State Key Laboratory of Metastable Materials Science and Technology, Yanshan University, Qinhuangdao 066004, China
4
Yanzhao Iron and Steel Laboratory, North China University of Science and Technology, Tangshan 063210, China
*
Authors to whom correspondence should be addressed.
Coatings 2026, 16(6), 735; https://doi.org/10.3390/coatings16060735
Submission received: 17 May 2026 / Revised: 12 June 2026 / Accepted: 15 June 2026 / Published: 20 June 2026
(This article belongs to the Section Surface Characterization, Deposition and Modification)

Abstract

A multiphase high-strength steel austempered at 260 °C for 24 h was investigated by quasi-in-situ tensile characterization and EBSD-based crystal plasticity finite element modeling. The experimental observations reveal that local plastic deformation is strongly heterogeneous: von Mises strain concentrates preferentially near bainitic-ferrite packets, phase boundaries, and retained-austenite/martensite–austenite regions, whereas blocky retained austenite contributes to strain accommodation at the early deformation stage. To quantify the underlying stress–strain partitioning, a quasi-two-dimensional representative volume element was reconstructed from EBSD data and implemented in ABAQUS through a user-defined material subroutine. The model contained the real grain morphology, phase distribution, and crystal orientation information of the 24 h austempered specimen. A rate-dependent crystal plasticity constitutive framework with BCC matrix, FCC retained austenite, and transformed martensite branches was calibrated against the macroscopic tensile curve. The simulated tensile response agrees well with the experimental curve before macroscopic instability, and the predicted local fields are consistent with the quasi-in-situ strain maps. The results show that local plastic strain first accumulates in M/A-related regions and phase-boundary-neighboring zones, while high Mises stress migrates dynamically with slip activity and stress-induced martensitic transformation. Retained-austenite transformation increases the local load-bearing capacity, modifies interphase load transfer, and delays the direct linkage of strain-localization bands. The present work clarifies the coupling among retained-austenite stability, TRIP-assisted load redistribution, and microstructural strain partitioning in multiphase high-strength steel, providing a mesoscale basis for microstructure-guided strength–ductility optimization.

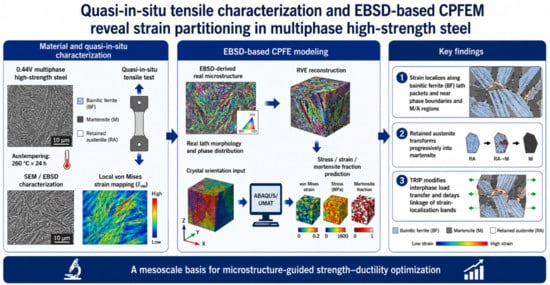
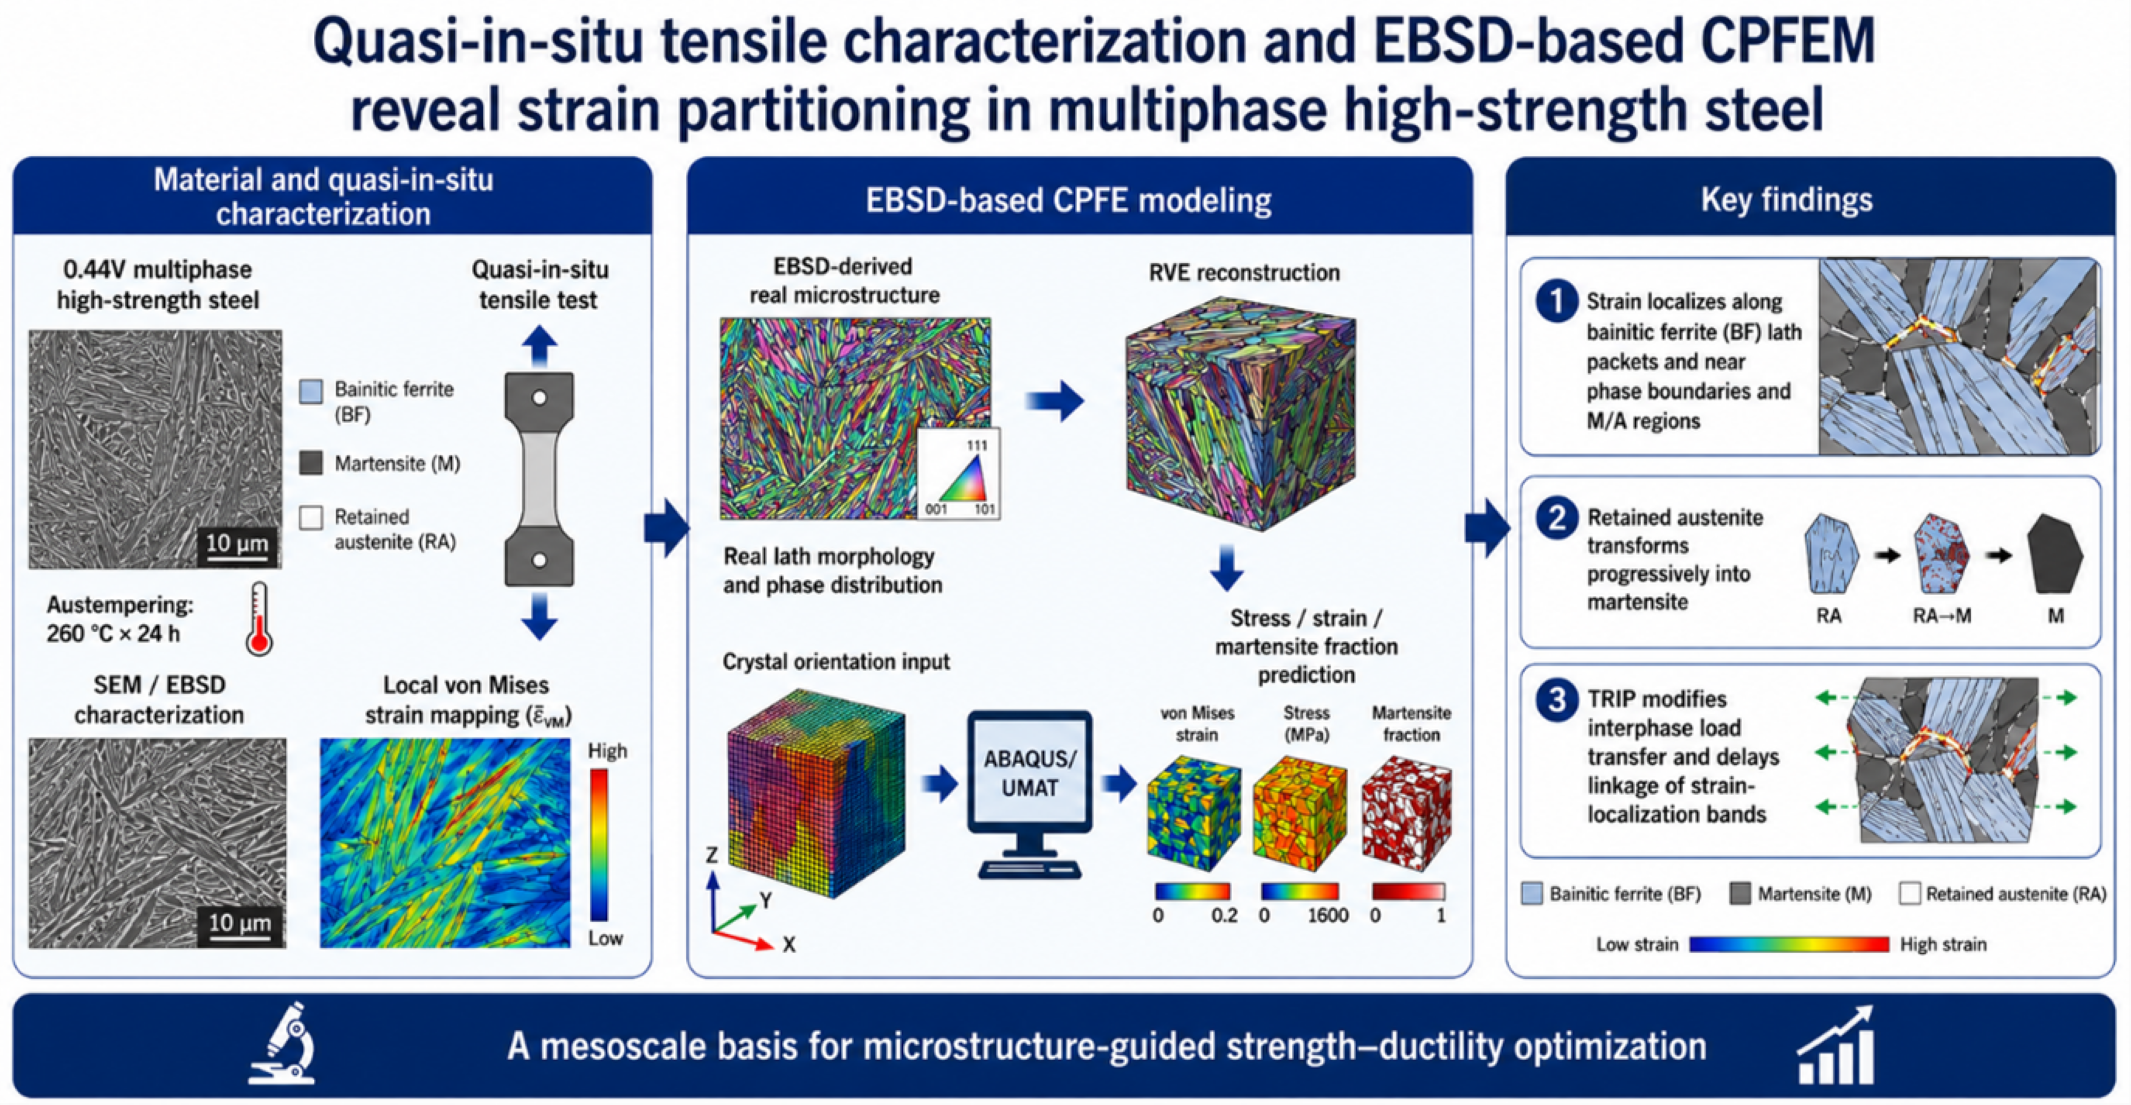
Graphical Abstract

1. Introduction

Retained austenite is a key constituent in TRIP-assisted and carbide-free bainitic steels. Previous studies have shown that a suitable amount and stability of retained austenite can improve the strength–ductility balance by progressive strain-induced transformation, which enhances work hardening, delays necking, and redistributes local stress during plastic deformation [1,2,3,4,5]. These results provide a clear basis for discussing retained austenite as an active deformation constituent in the present multiphase steel.
Multiphase high-strength steels have attracted considerable attention for load-bearing components because they can combine high strength with improved ductility and toughness through the cooperative deformation of bainitic ferrite, retained austenite, martensite, and martensite–austenite (M/A) constituents. In carbide-free bainitic and TRIP-assisted steels, retained austenite plays a key role in strain accommodation and work hardening. Its mechanical stability is controlled by size, morphology, carbon enrichment, surrounding constraint, and crystallographic orientation, and these factors determine whether transformation-induced plasticity (TRIP) occurs gradually or prematurely during tensile loading [6,7,8].
Although macroscopic tensile curves provide a direct evaluation of strength and ductility, they cannot reveal where local plastic strain starts, how different phases share load, or why damage tends to initiate near specific phase-boundary regions. In situ and quasi-in-situ deformation experiments have demonstrated that local strain in multiphase steels is highly heterogeneous; the soft/hard phase contrast, retained-austenite transformation, and crystal orientation gradients jointly control the evolution of strain localization and early damage [7,9]. However, experimental observations alone are still limited in resolving the full-field stress state and the time-dependent redistribution of phase-specific plasticity.
Crystal plasticity finite element modeling (CPFEM) provides an effective mesoscale framework for linking crystallographic slip, phase topology, and local mechanical response [10,11,12,13,14]. By explicitly incorporating grain orientation, slip-system activity, and phase-dependent constitutive parameters, CPFEM can predict heterogeneous stress and strain distributions in a way that conventional isotropic plasticity models cannot. Recent developments have further coupled crystal plasticity with retained-austenite transformation to describe TRIP-assisted steels and Q&P steels, enabling quantitative analyses of load transfer and martensitic-transformation-induced hardening [15,16,17,18]. Nevertheless, for bainitic high-strength steels with real EBSD-derived phase morphology, further work is still needed to validate local-field predictions against quasi-in-situ strain measurements.
The present work does not simply repeat the combination of quasi-in-situ characterization and CPFEM. Its main contribution is to correlate a real EBSD-derived bainitic-ferrite/retained-austenite topology with measured local strain maps and UMAT-based transformation variables, thereby clarifying where strain localization initiates and how TRIP-assisted load redistribution evolves in a 260 °C × 24 h austempered high-strength steel. The model output is validated by both the macroscopic tensile curve and local deformation features, providing a mesoscale link between experiment and crystal plasticity variables. Recent data-driven alloy-design studies further suggest that interpretable descriptors can assist microstructure–property optimization [19]; therefore, this mechanism-based framework may provide useful physical information for the future data-assisted design of TRIP-assisted multiphase steels.
In the present study, the tensile deformation of a 260 °C × 24 h austempered high-strength steel is investigated by combining quasi-in-situ microstructural characterization with EBSD-based CPFEM. A real-microstructure representative volume element (RVE) is reconstructed from EBSD data and implemented through an ABAQUS/UMAT framework. The objectives are to (i) identify the experimental features of retained-austenite transformation and local strain partitioning; (ii) establish and quantitatively validate a mesoscale CPFE model against the macroscopic tensile response; and (iii) clarify the evolution of Mises stress, equivalent plastic strain, and martensite fraction during uniaxial tension.

2. Experimental and Modeling Procedures

2.1. Material and Heat Treatment

The investigated material was the 0.44 V high-strength steel, selected from the hot-working and microstructure-regulation study because it exhibited a stable processing window and a strong response to multiphase microstructural control. Its chemical composition is listed in Table 1. The steel was austenitized at 900 °C for 30 min, rapidly transferred into a 260 °C salt bath, held for 24 h, and then air-cooled to room temperature. This treatment promoted the formation of a bainitic-ferrite/retained-austenite multiphase microstructure with reduced coarse M/A constituents and improved strain-accommodation capability.

2.2. Quasi-In-Situ Tensile Characterization

Quasi-in situ tensile observations were performed on the 24 h austempered specimen using an SEM equipped with a tensile stage. The tensile rate was 1 mm/min. SEM images, phase maps, local misorientation/KAM maps, and strain-field information were compared at different engineering strains to reveal the evolution of retained austenite, local strain partitioning, and deformation-induced microstructural heterogeneity. The quasi-in-situ strain maps were used as an experimental benchmark for evaluating the local-field predictions of the CPFE model.

2.3. EBSD-Based RVE Construction and Boundary Conditions

To preserve the realistic topology of the multiphase microstructure, a representative volume element was reconstructed directly from EBSD data rather than generated from an idealized Voronoi tessellation. The selected central EBSD region was extruded into a thin three-dimensional finite element model, thereby retaining the experimentally measured in-plane grain morphology, phase distribution, crystallographic orientation, and interphase-boundary geometry while maintaining computational efficiency. The RVE contained 168 grain/phase regions and had dimensions of approximately 10.496 μm × 10.166 μm × 0.0939 μm. The finite element mesh consisted of 35,936 C3D6 wedge elements and 36,411 nodes.
The EBSD step size used for the selected RVE region was 0.0939 μm. The EBSD-derived phase and orientation map was converted into an ABAQUS input model and extruded through a single C3D6 wedge-element layer in the thickness direction. Such an EBSD-based quasi-two-dimensional or 2.5D RVE has clear advantages for the present study: it preserves the real bainitic-ferrite lath morphology, blocky/film-like retained-austenite distribution, and complex phase-boundary topology observed on the same polished surface used for SEM/EBSD/DIC analysis. Therefore, the 2.5D model enables a direct one-to-one correlation between experimentally measured surface strain localization and simulated mesoscale stress/strain fields. Through this quasi-two-dimensional model, the in-plane relationship among retained-austenite morphology, phase-boundary geometry, local strain concentration paths, and transformation-assisted load redistribution can be determined effectively. Similar EBSD-based two-dimensional or thin-extruded RVEs have been widely used in crystal plasticity simulations to connect measured microstructures with local deformation fields [17,20]. The thickness direction is retained in the finite element mesh to maintain displacement compatibility and avoid a purely plane-stress description. Accordingly, this modeling strategy is appropriate for evaluating the relative evolution of interphase stress concentration, local strain partitioning, and TRIP-assisted load transfer on the experimentally characterized EBSD plane.
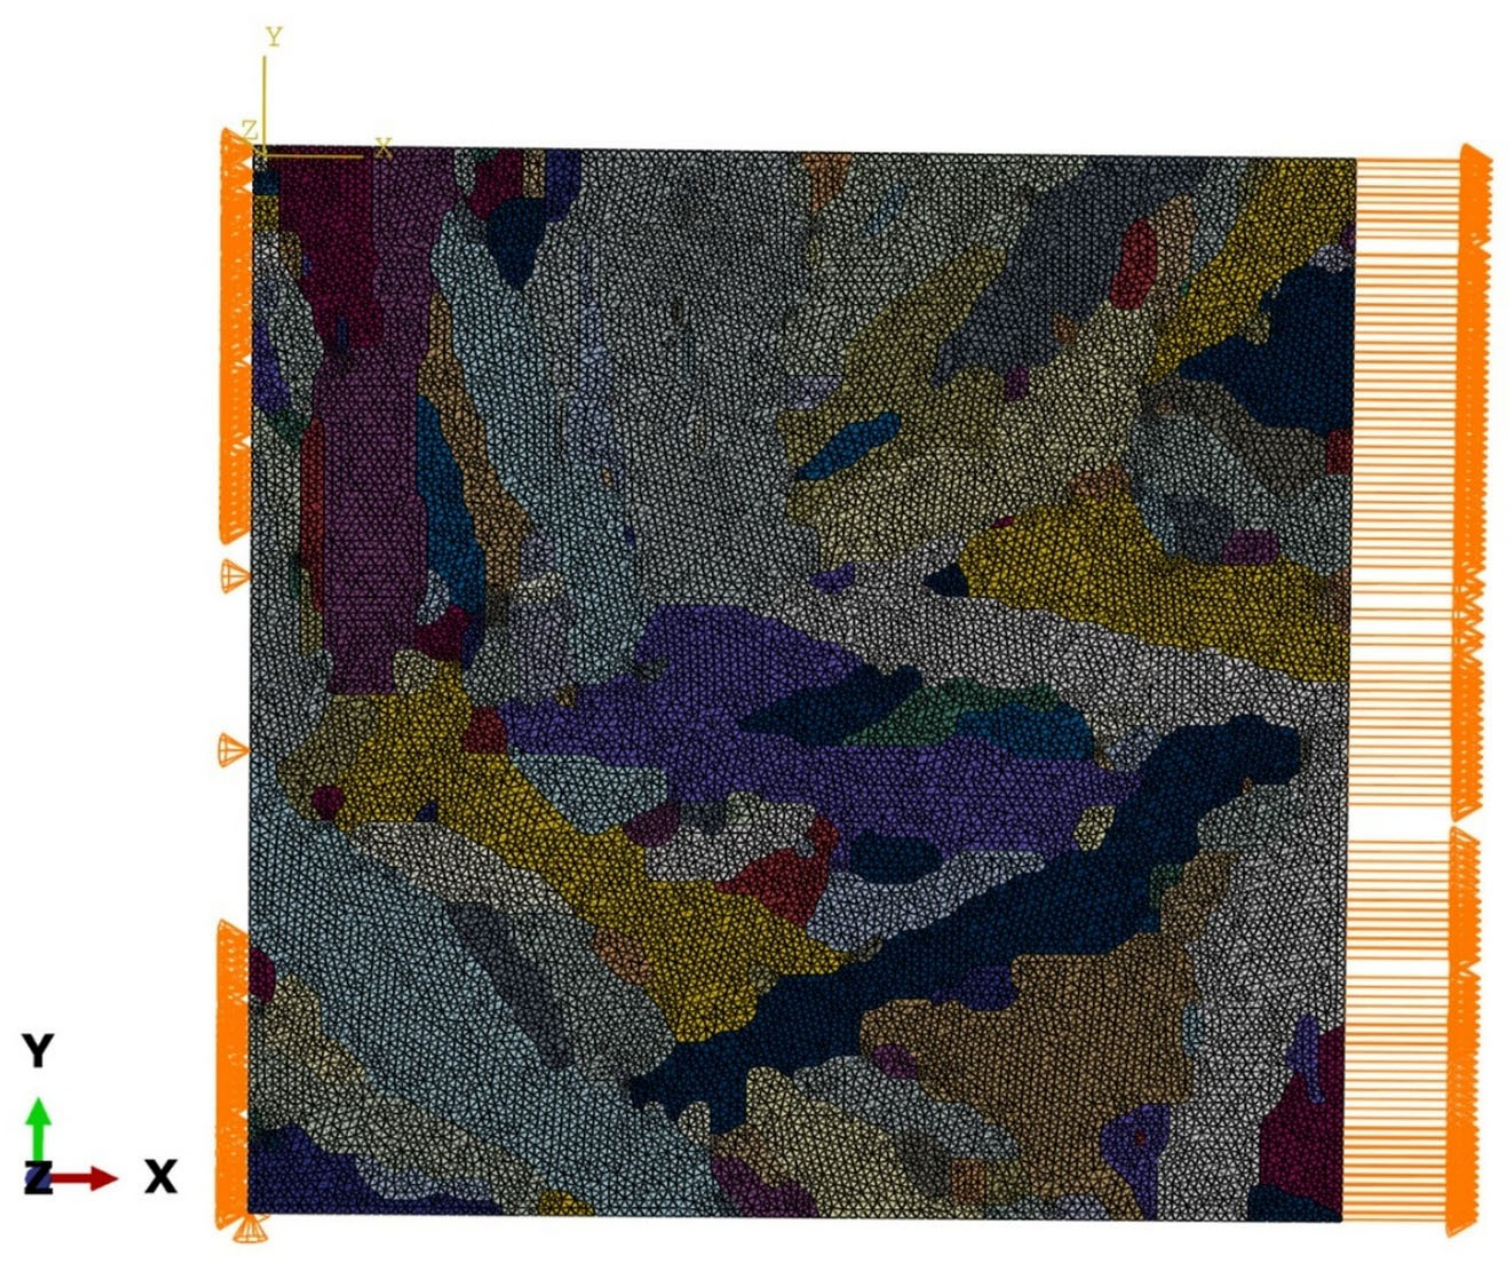
The right face was coupled to a reference point and subjected to displacement loading in the tensile direction. The final displacement applied in the input file was 1.784 μm, corresponding to a macroscopic engineering strain of approximately 0.17.

2.4. Crystal Plasticity Constitutive Framework

The crystal plasticity formulation was based on finite-deformation kinematics. The total deformation gradient was multiplicatively decomposed as
F = FeFp
where Fe and Fp denote the elastic and plastic parts of the deformation gradient, respectively.
The plastic velocity gradient was obtained from the shear rates of all activated slip systems:
L p = F . p ( F p ) 1 = α γ . α S α m α
where γ . α is the shear rate of slip system α, and sα and mα are the slip direction and slip-plane normal, respectively.
The rate-dependent slip law was expressed as
γ . α = γ . 0   | τ α / g α | n   sign ( τ α )
where γ . 0 is the reference shear rate, τα is the resolved shear stress, gα is the current slip resistance, and n is the rate-sensitivity exponent. In the UMAT, FCC retained austenite activates the {111}<110> slip family with 12 slip systems, whereas the BCC bainitic-ferrite matrix activates the {110}<111> slip family with 12 slip systems. The transformed martensite branches M1 and M2 are introduced as transformation-related plasticity branches and use the {110}<111> slip family.
The evolution of slip resistance was described using the following self/latent-hardening law:
g . α = β   h α β   | γ . β |
h α β = q α β h β
hβ = h0 sech2[h0Γ/(τs − τ0)]
Γ = α   | γ . α | dt
where g . α is the evolution rate of slip resistance, hαβ is the hardening interaction matrix, Γ is the accumulated shear strain, h0 is the initial hardening modulus, τ0 is the initial critical resolved shear stress, τs is the saturation slip resistance, and qαβ is the self/latent-hardening interaction coefficient. The coefficient q describes the interaction within the same slip family, whereas q1 describes the interaction between different branch families.
The retained-austenite-to-martensite transformation was implemented through a phenomenological stress-assisted transformation branch. For each of the 24 transformation variants, the transformation driving force was defined as
Di = |τiir| − λ(T − θ_T)/θ_T
where Di is the transformation driving force of variant i, τiir is the resolved transformation stress, λ is a transformation parameter, T is the deformation temperature, and θ_T is the characteristic transformation temperature.
When Di exceeds the critical driving force F_c and the accumulated martensite fraction has not reached its upper bound, the transformation rate is calculated as
V . i = V max tanh [ ( D i F _ c ) / ( V _ eF _ c ) ]
f_M = ∑i Vi
where V . i is the transformation rate of variant i, Vi is the martensite fraction contributed by variant i, f_M is the total martensite volume fraction, Vmax is the maximum transformation-rate parameter, and V_e controls the smoothness of the transformation kinetics. The parameters used in the UMAT were λ = 546, T = 293 K, θ_T = 246 K, F_c = 26, Vmax = 4.0 × 10⁻⁵, and V_e = 0.17.
The martensite volume fraction was stored in SDV2376, while SDV2380, SDV2382, and SDV2384 were used to analyze the austenite slip contribution, martensite slip contribution, and PEEQ-like equivalent plastic strain, respectively.
The parameters in Table 2 were taken from the actual UMAT and ABAQUS input file used in this work. The parameters τ0, h0, and τs were calibrated by a physically constrained trial-and-error procedure rather than by a global inverse-optimization algorithm. In this procedure, τ0 was adjusted to reproduce the onset of slip and the macroscopic yield transition, h0 was adjusted to match the early post-yield hardening slope, and τs was calibrated to reproduce the high-strain flow stress and ultimate tensile-strength region. Thus, the calibrated parameter set is a physically reasonable set for reproducing the tensile response and analyzing mesoscale stress–strain partitioning, rather than a mathematically unique solution.
Several state-dependent variables (SDVs) were used to extract local deformation and transformation information from the UMAT results. The variables used for the present analysis are summarized in Table 3.

3. Results and Discussion

3.1. Quasi-In-Situ Deformation and Strain Partitioning

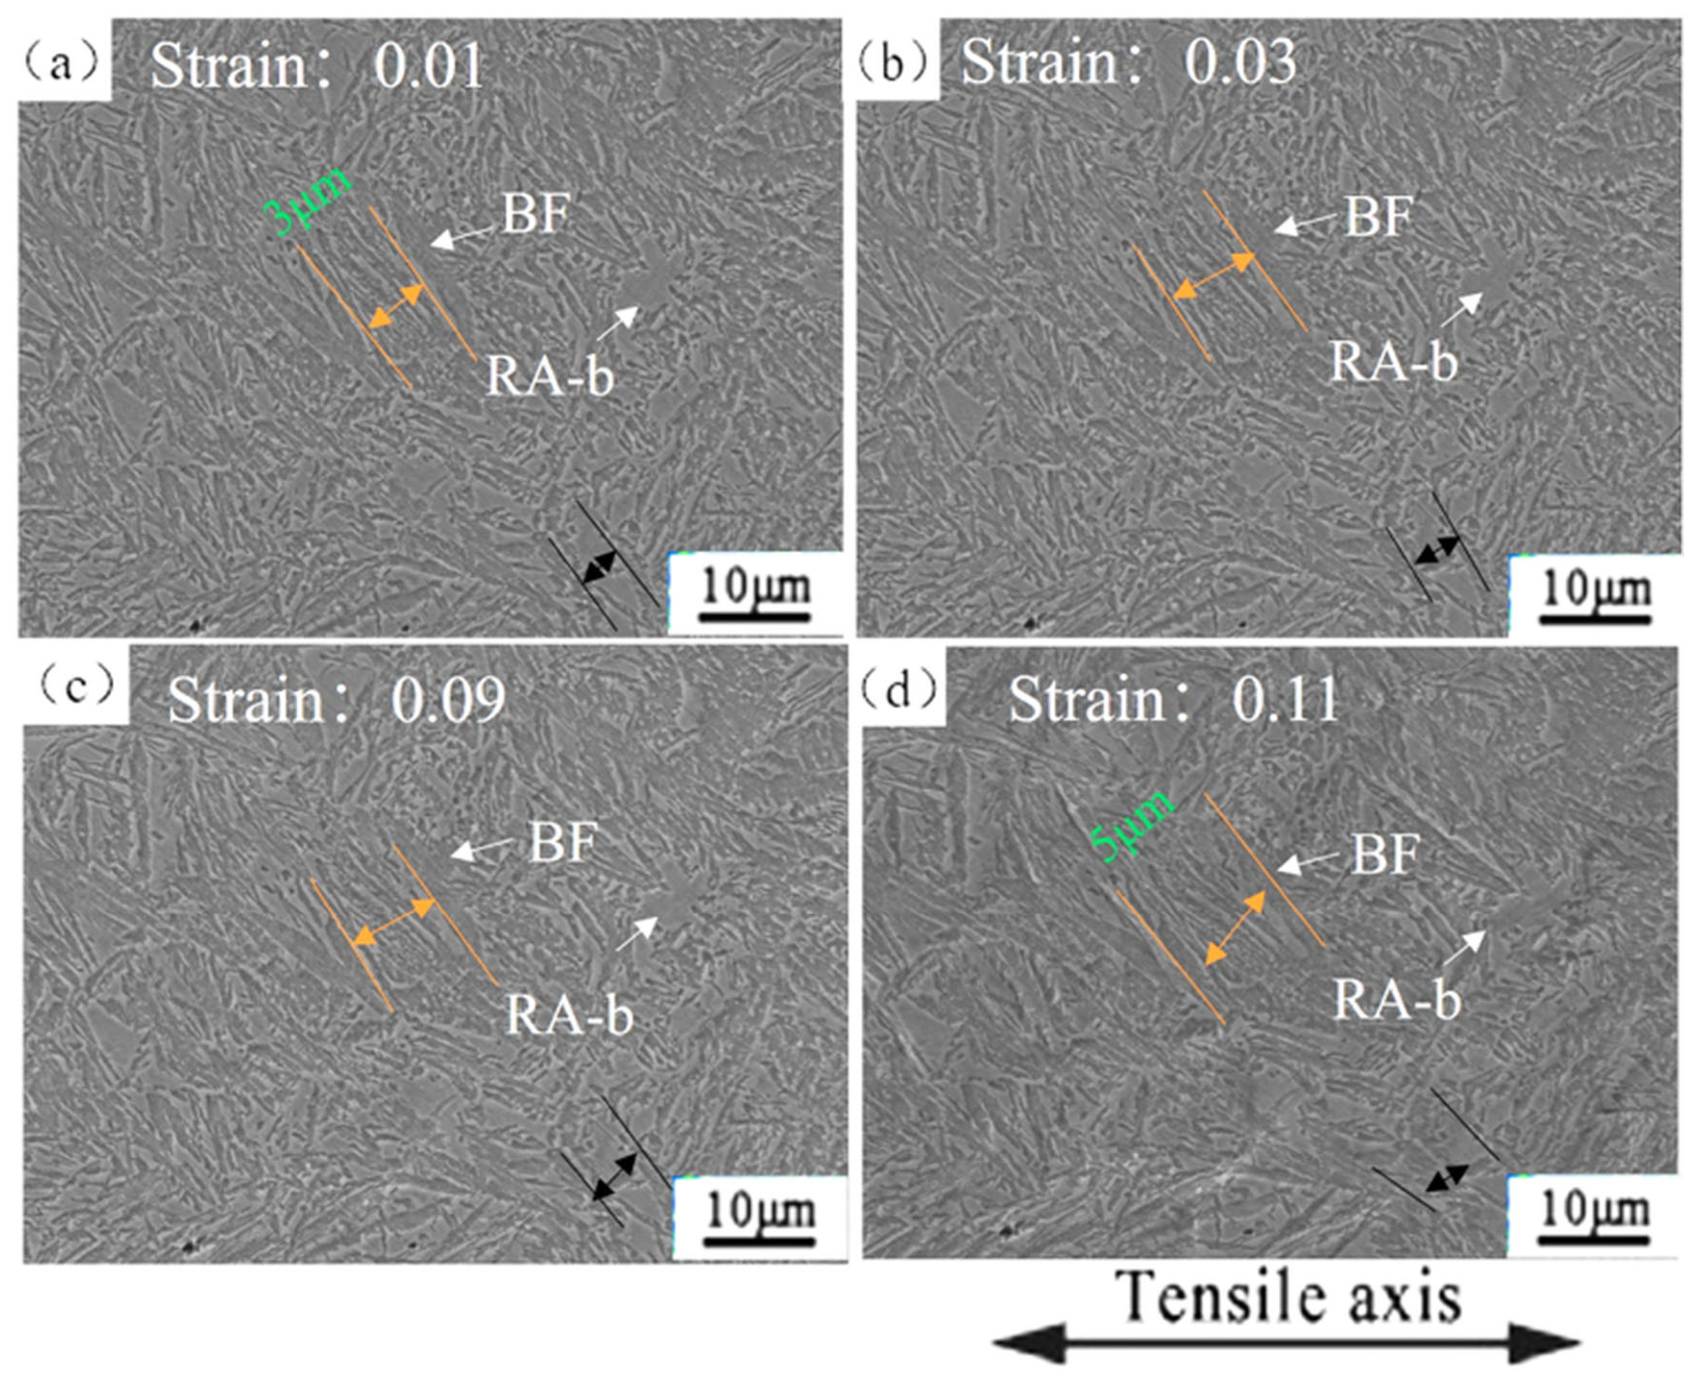
Figure 1 shows the quasi-in-situ observations obtained during tensile deformation. The microstructure consists of bainitic ferrite and retained-austenite-related regions with different morphologies. During tensile loading, retained austenite is progressively consumed rather than transformed completely, which is further supported by the EBSD phase-fraction statistics below.
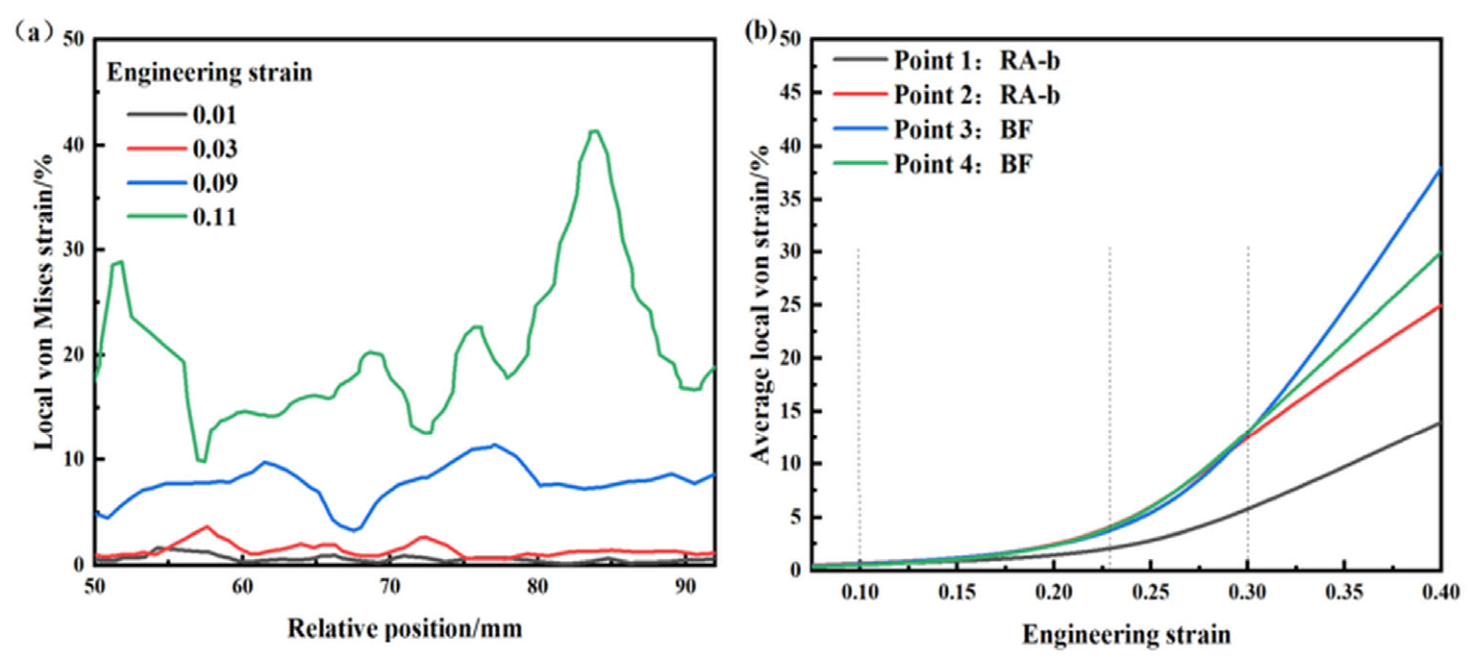
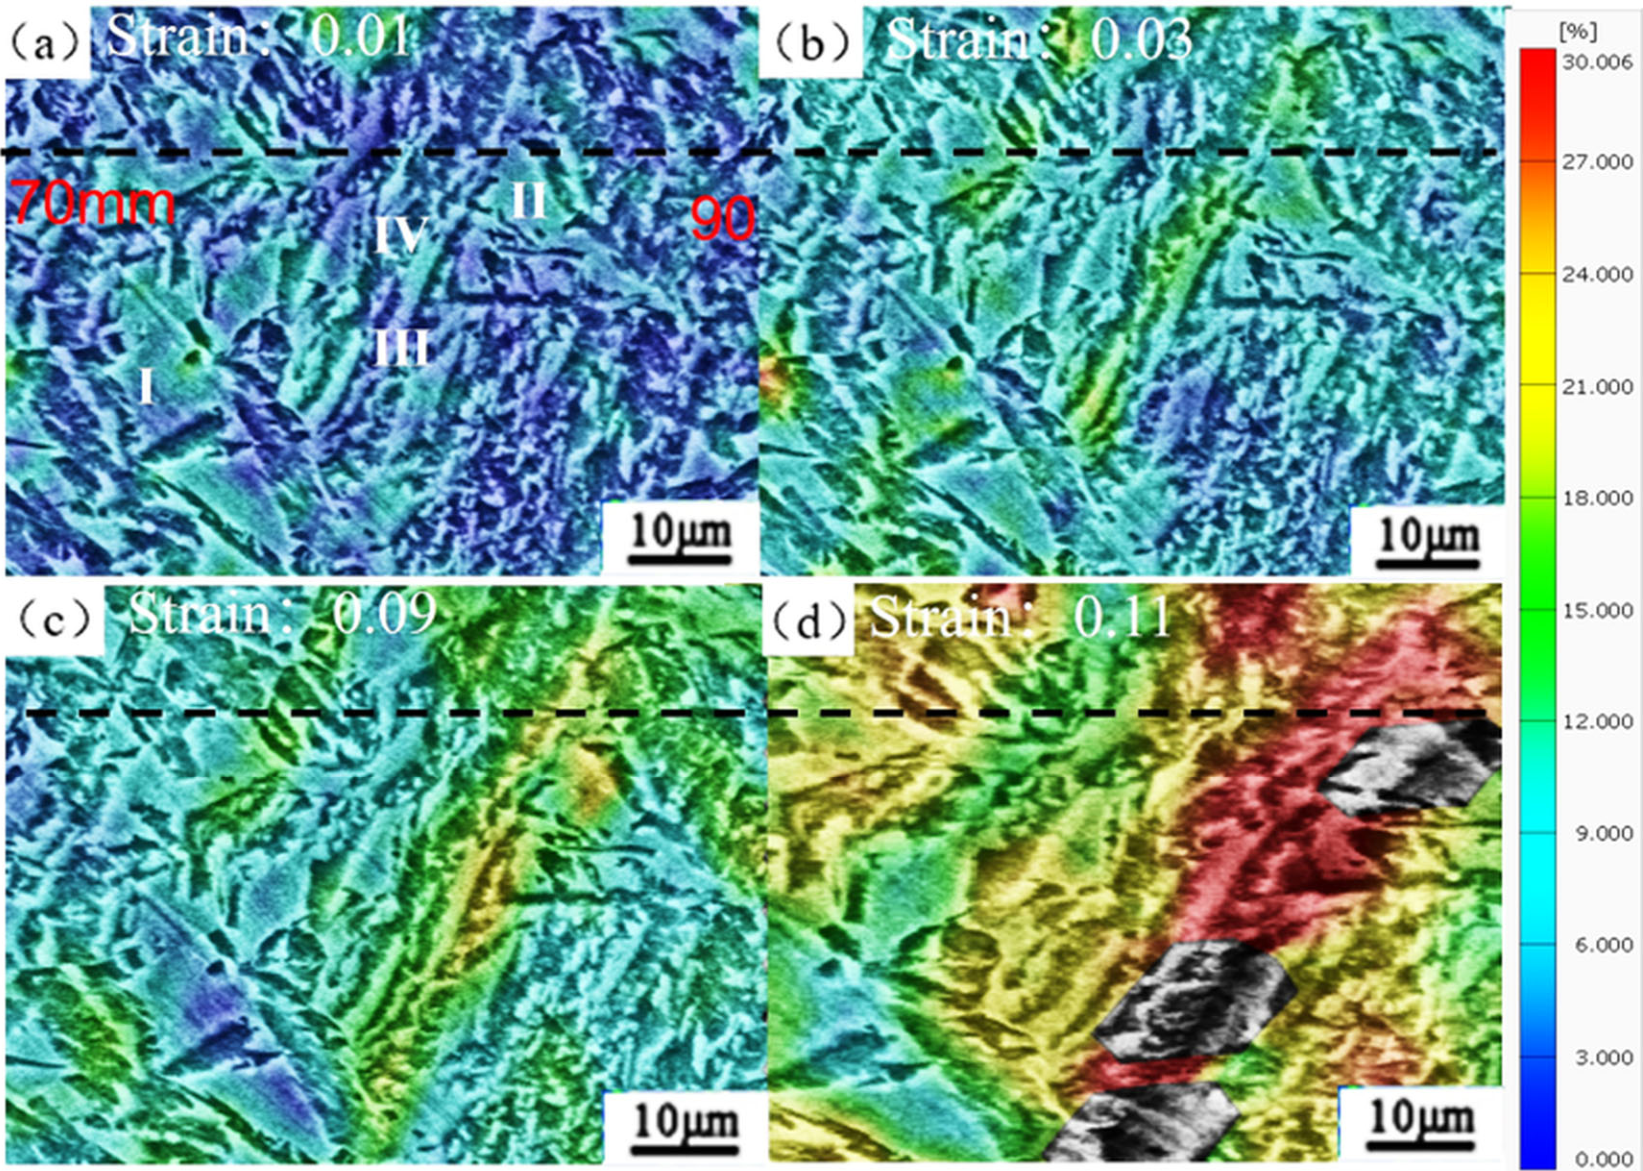
The von Mises strain maps and the local strain evolution curves in Figure 2 and Figure 3 further reveal the heterogeneous deformation behavior. As the applied engineering strain increases from 0.01 to 0.11, the local strain is not distributed uniformly throughout the field of view, but concentrates near bainitic-ferrite packet intersections and phase-boundary-neighboring regions. The local strain in blocky retained-austenite regions is lower than that in bainitic-ferrite regions at the early stage, indicating that retained austenite can accommodate and redistribute strain before extensive transformation. These experimental features provide direct evidence for validating the local deformation patterns predicted by CPFEM.
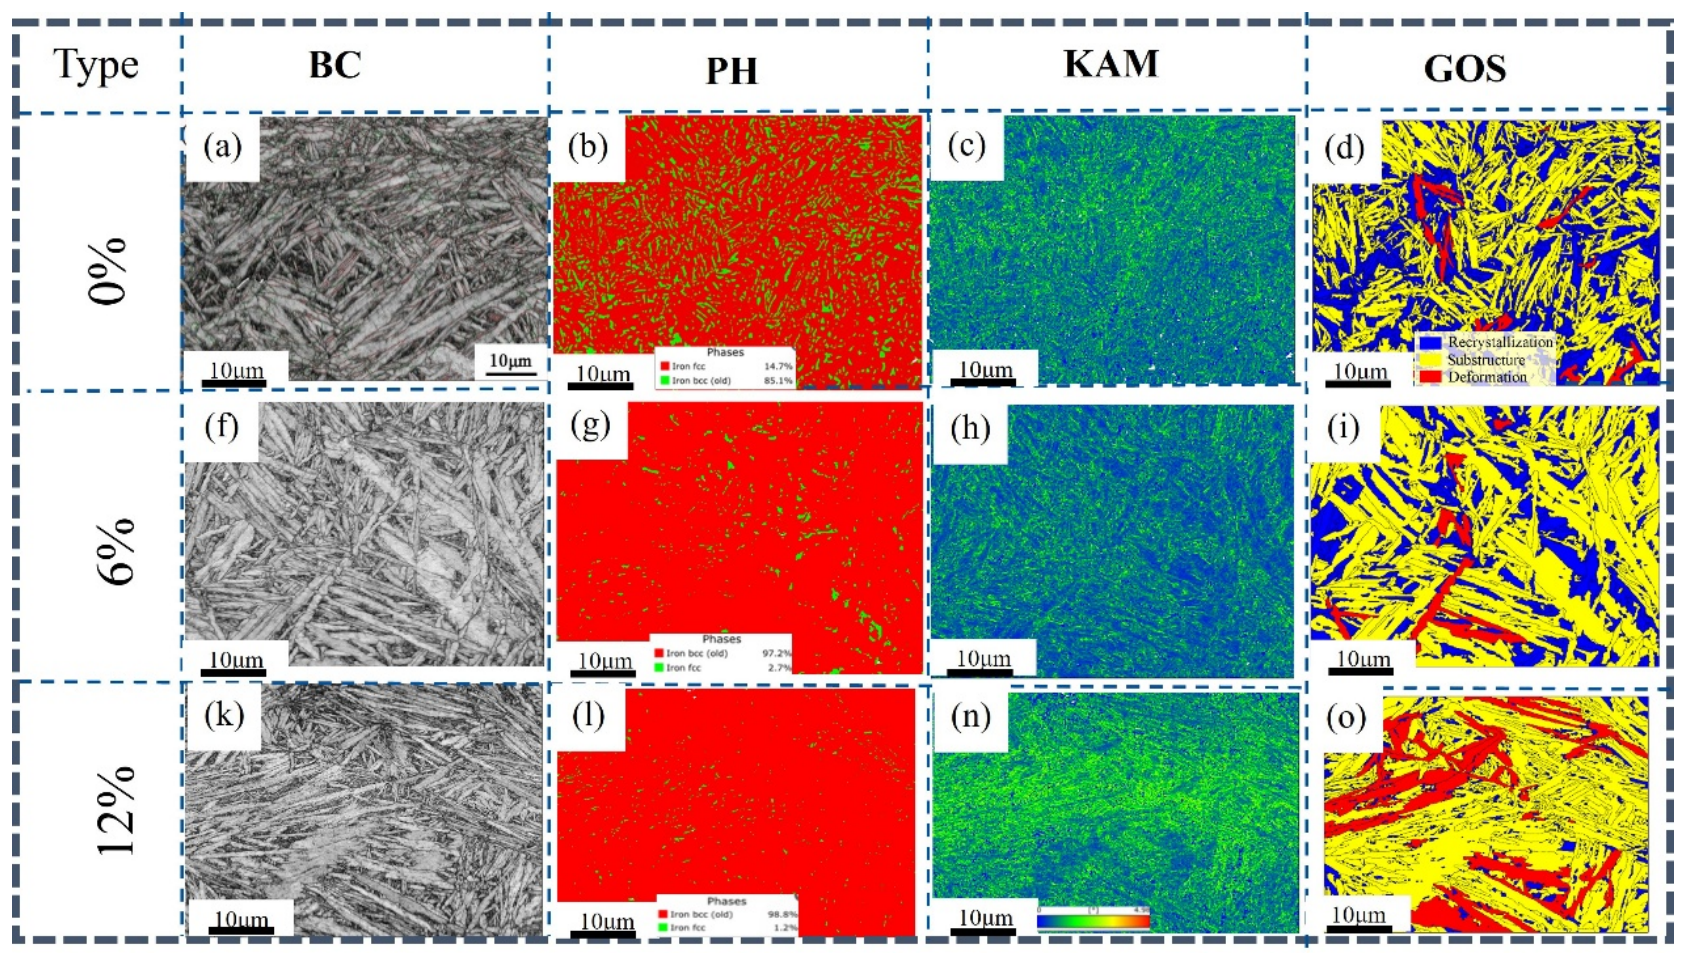
EBSD phase-map statistics further quantify the evolution of retained austenite during tensile deformation. As shown in Table 4, the retained-austenite fraction decreases from 14.7% in the undeformed specimen to 2.7% and 1.2% at engineering strains of 6% and 12%, respectively. This marked reduction indicates that retained austenite is progressively consumed during tensile loading, mainly through strain-induced martensitic transformation. Previous studies have shown that the amount, morphology, carbon enrichment, and surrounding constraint of retained austenite strongly affect its mechanical stability and transformation behavior [21]. In TRIP-assisted steels, the gradual transformation of retained austenite can enhance work-hardening capacity, redistribute local stress/strain, and delay premature strain localization, whereas excessively unstable retained austenite may transform too early and contribute less to sustained deformation [22]. Therefore, the sharp decrease in retained-austenite fraction at the early tensile stage suggests that part of the retained austenite has relatively low mechanical stability and transforms preferentially during deformation. Meanwhile, the residual retained austenite detected at 12% strain indicates that a small fraction of retained austenite remains mechanically stable under the present bainitic-ferrite constraint. This result supports the interpretation that retained-austenite stability in the investigated steel is not uniform, but depends on local morphology, chemical stability, and surrounding microstructural constraint. The corresponding BC, PH, KAM, and GOS maps at the undeformed, 6%, and 12% tensile states are shown in Figure 4.

3.2. EBSD-Based RVE and Model Validation

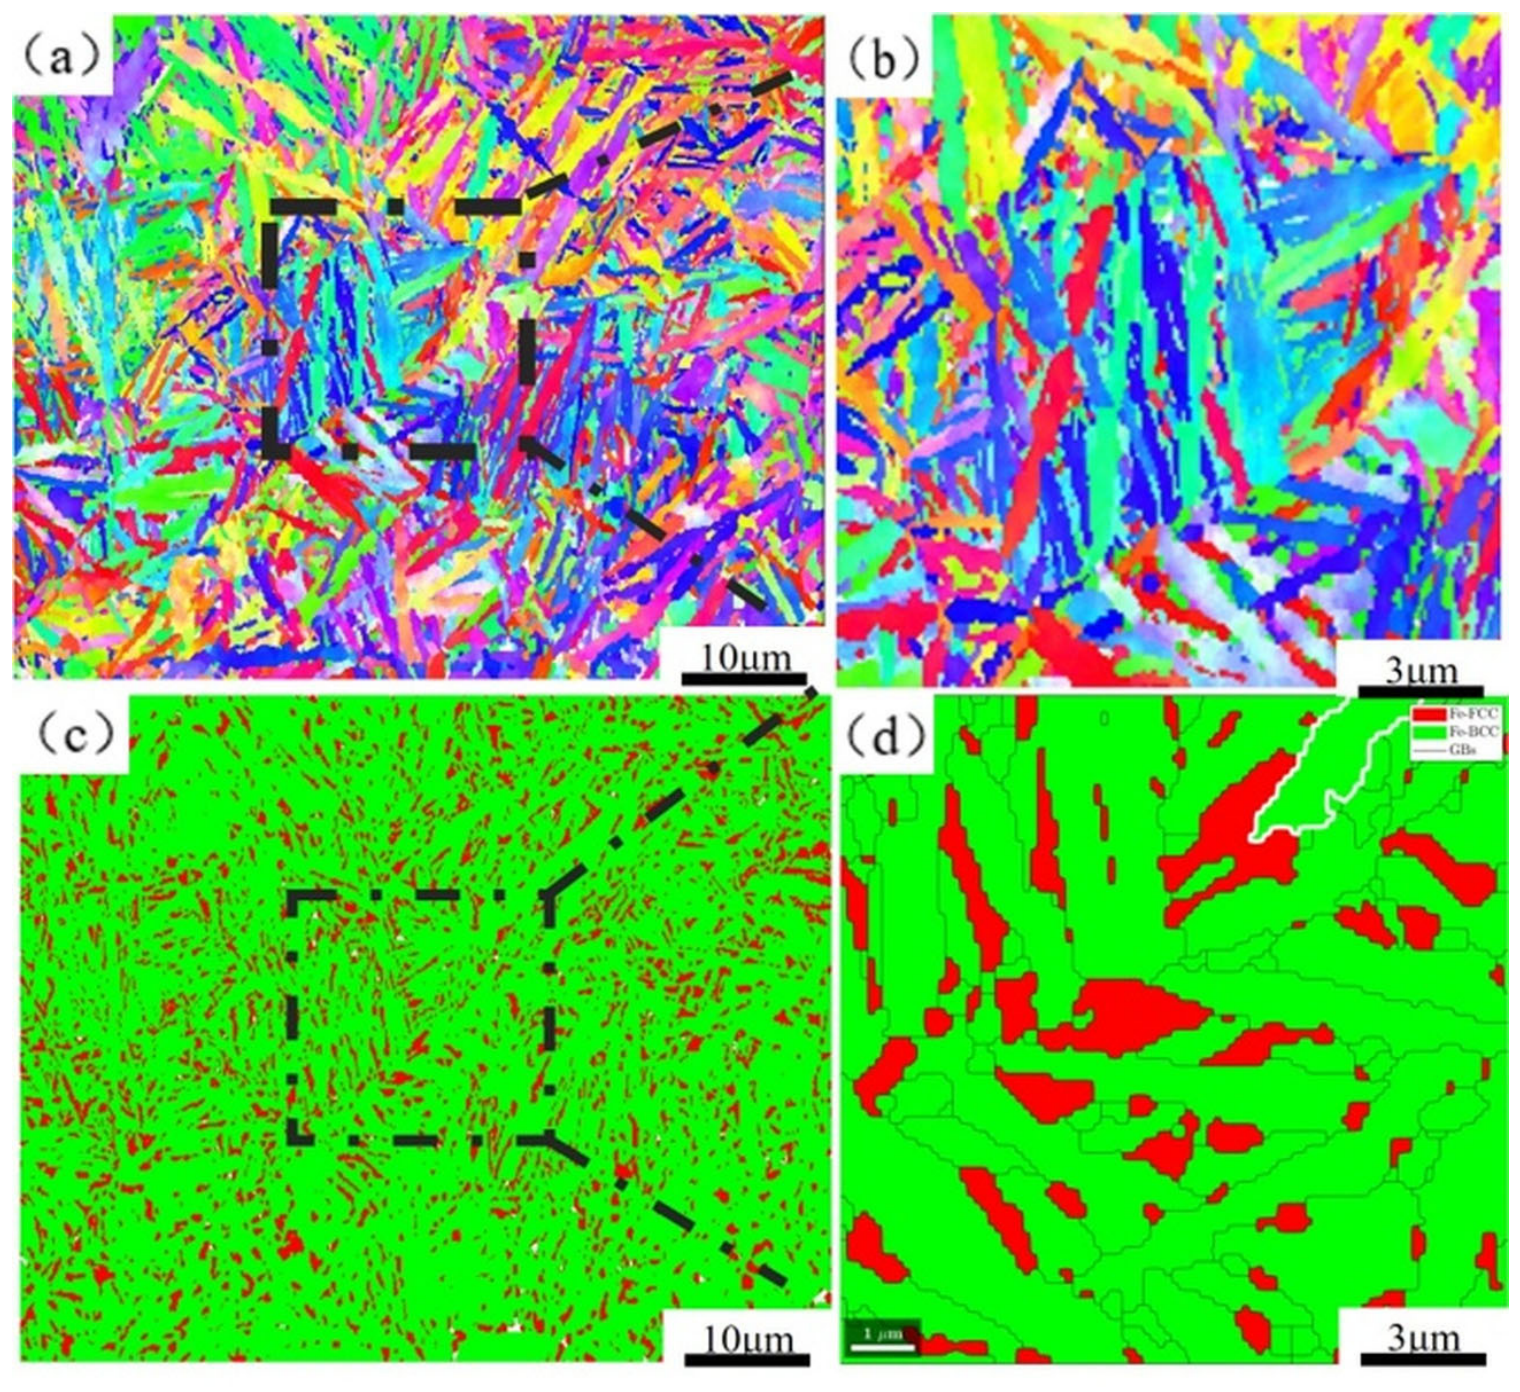
Figure 5 compares the EBSD characterization results with the reconstructed RVE. The RVE retains the main features of the experimental microstructure, including lath-like and blocky phase morphology, crystallographic orientation differences, and the spatial distribution of retained-austenite-related regions. Compared with a purely statistical Voronoi model, this EBSD-based approach is more suitable for analyzing local stress concentration, interphase load transfer, and transformation-induced strain redistribution in the present multiphase steel.
The finite element model and its boundary conditions are shown in Figure 6. The displacement-controlled tensile loading along the X direction reproduces the uniaxial tensile condition while allowing transverse and out-of-plane deformation compatibility. Such boundary conditions remove rigid-body motion without imposing excessive artificial constraint on lateral contraction, which is essential for capturing phase-boundary stress redistribution and grain-level plasticity [23,24,25].
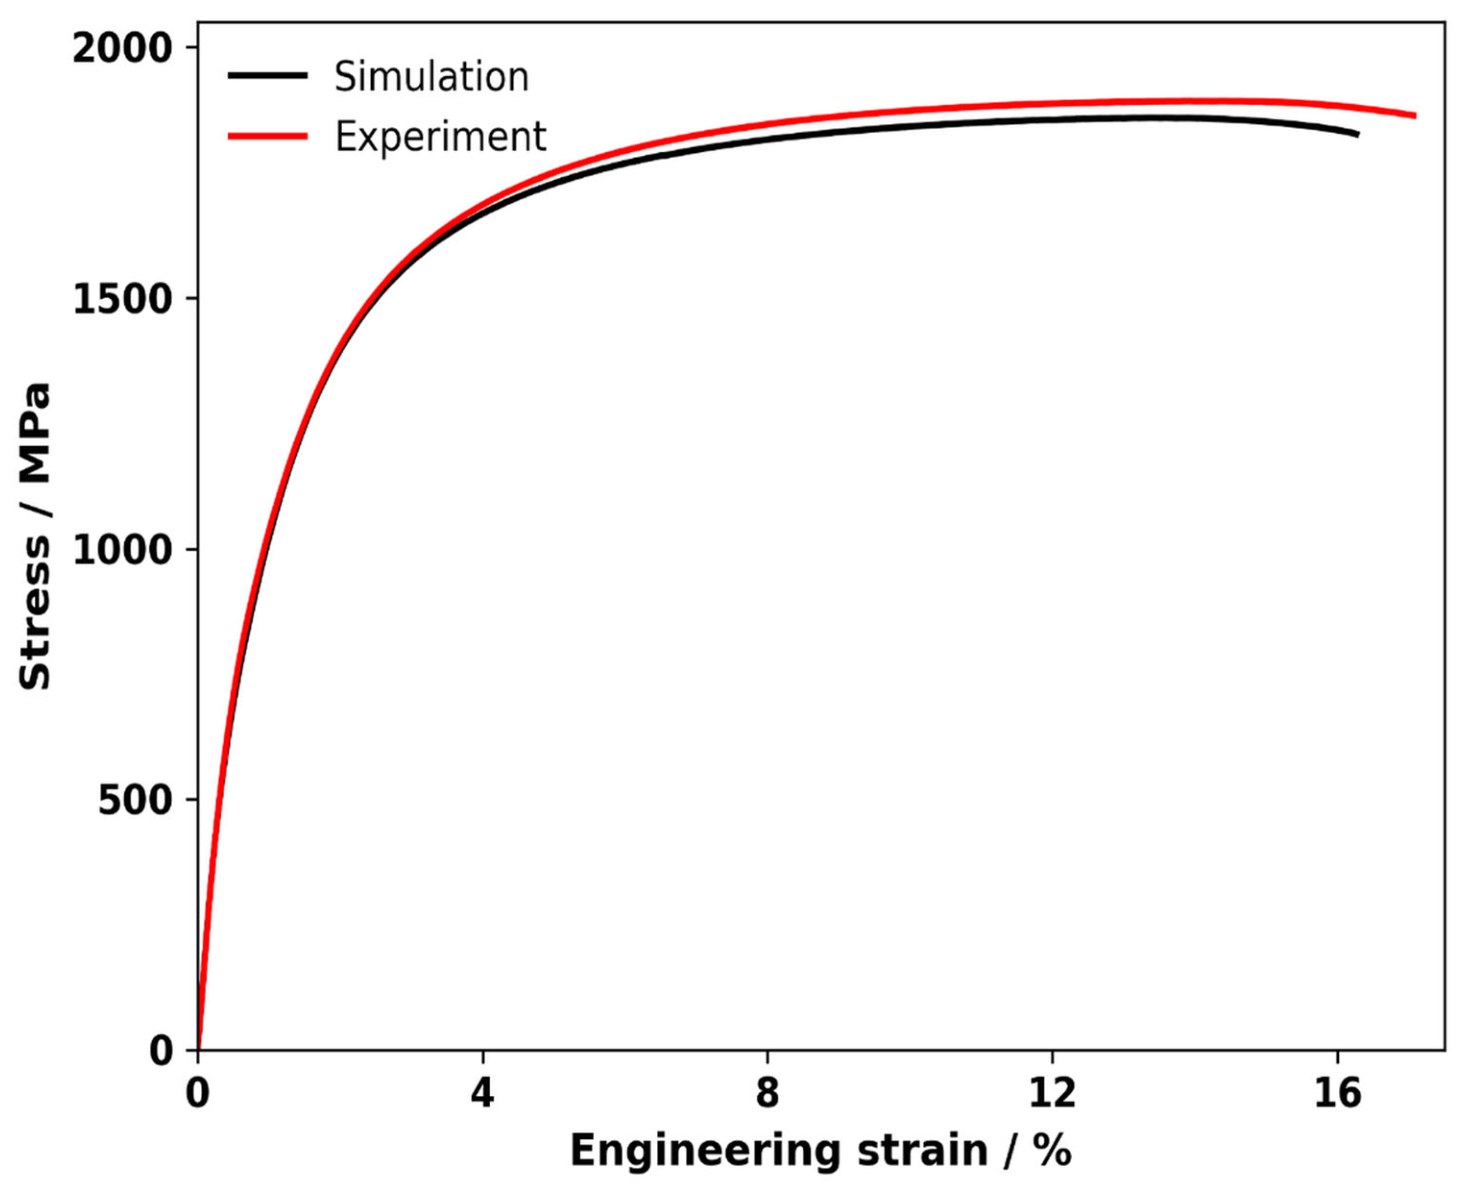
Figure 7 compares the experimental tensile curve with the CPFE-predicted response. Quantitative validation was performed using the stored experimental and simulated stress–strain data, and the main error indices are summarized in Table 5. Over the 0.2–16% strain range, the RMSE, MAE, MAPE, and R2 are 28.21 MPa, 26.37 MPa, 1.51%, and 0.9906, respectively.
Although the overall agreement is good, the simulated curve is slightly lower than the experimental curve in the maximum-load and high-uniform-deformation region. This deviation should not be simply attributed to the absence of damage evolution, because neglecting damage usually tends to delay softening or overestimate the late-stage stress response. In the present UMAT, the hardening behavior is governed by the saturation-type slip-resistance evolution involving τ0, h0, and τs, and no independent dynamic-softening coefficient was introduced. Therefore, the slight underestimation is more reasonably associated with the conservative trial-and-error calibration of τ0, h0, and τs, together with the phenomenological treatment of transformation-induced hardening. In particular, if τs or h0 is calibrated conservatively to maintain a good match in the yield and early-hardening stages, the additional hardening contribution from the progressive retained-austenite-to-martensite transformation and interphase load redistribution at larger strains can be slightly underestimated. In addition, M1 and M2 are implemented as transformation-related plasticity branches embedded in the retained-austenite material point, rather than as fully independent phases with separately calibrated elastic stiffness tensors. These treatments explain why the simulation remains close to the experiment but is slightly lower in the peak-stress region. Thus, the present parameter set is suitable for the mesoscale analysis of stress, equivalent plastic strain, and transformation fields before macroscopic instability.

3.3. Evolution of Local Mises Stress

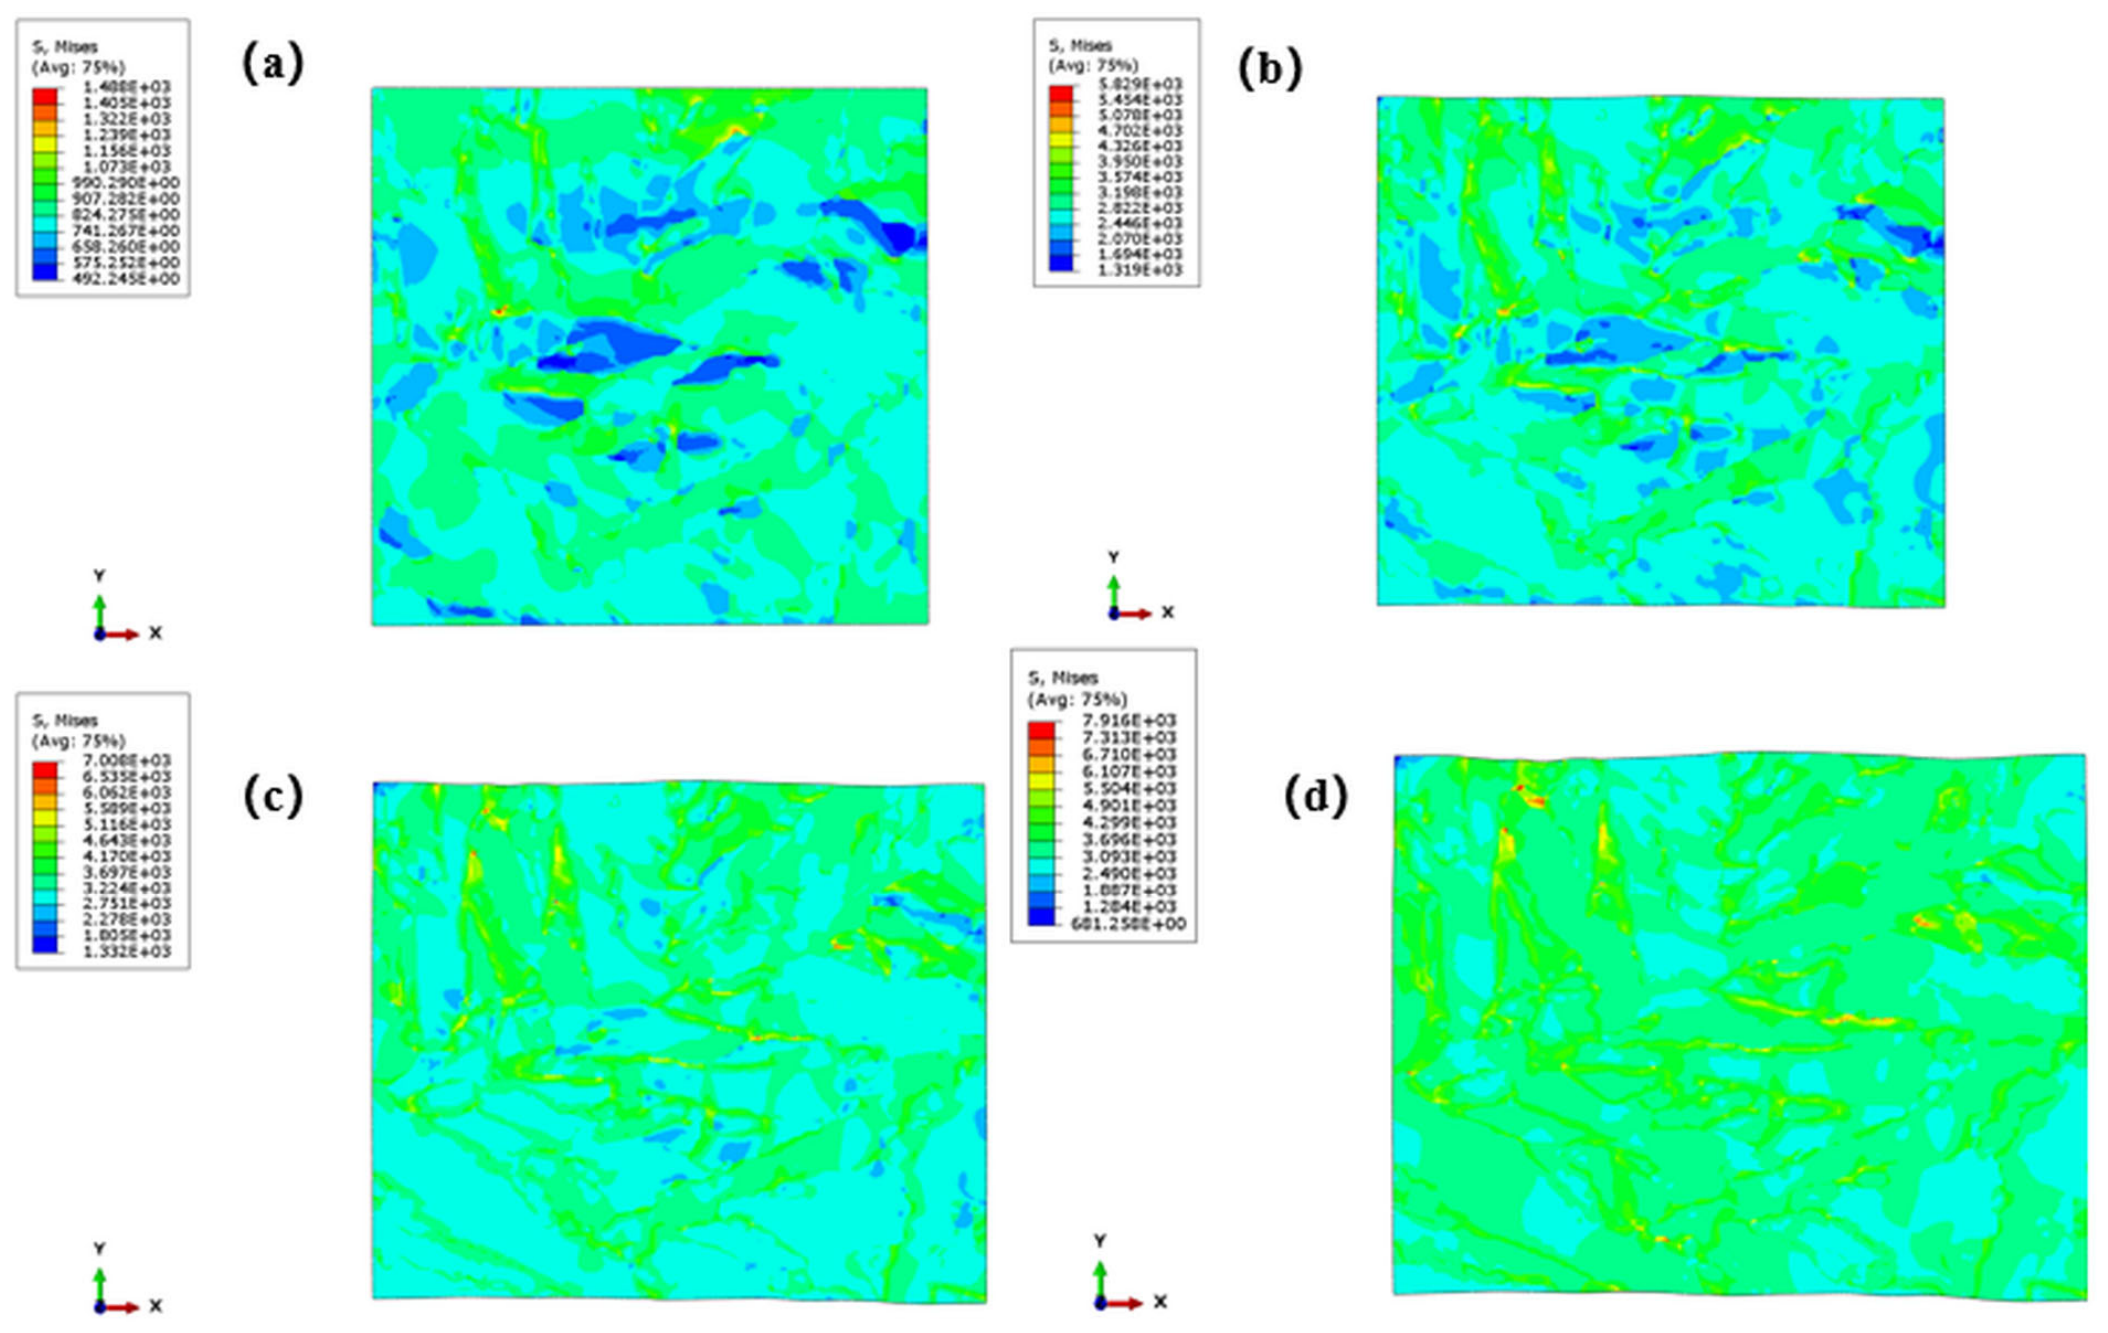
Figure 8 shows the Mises stress distributions at macroscopic engineering strains of 0.01, 0.03, 0.09, and 0.11. The stress field is strongly heterogeneous throughout the tensile process. High-stress regions first appear in part of the BCC matrix and near phase boundaries, rather than spreading uniformly across the RVE. With increasing strain, the high-stress zones expand toward retained-austenite-related regions and gradually form interconnected paths. This behavior indicates that the RVE undergoes continuous local load transfer among grains and phases.
The location of high stress is not fixed during deformation. When plastically favorable grains or relatively soft local regions deform first, their local stiffness decreases and adjacent grains begin to carry higher loads. Once retained austenite transforms into martensite in these local regions, the load-bearing capacity increases again and the high-stress zone migrates to neighboring regions that have not yet fully deformed. Therefore, the stress-field evolution can be described as a repeated process of transfer, redistribution, and reconcentration. This mechanism explains why the macroscopic tensile curve retains a sustained work-hardening trend even under strong local heterogeneity.

3.4. Equivalent Plastic Strain and Transformation-Assisted Load Redistribution

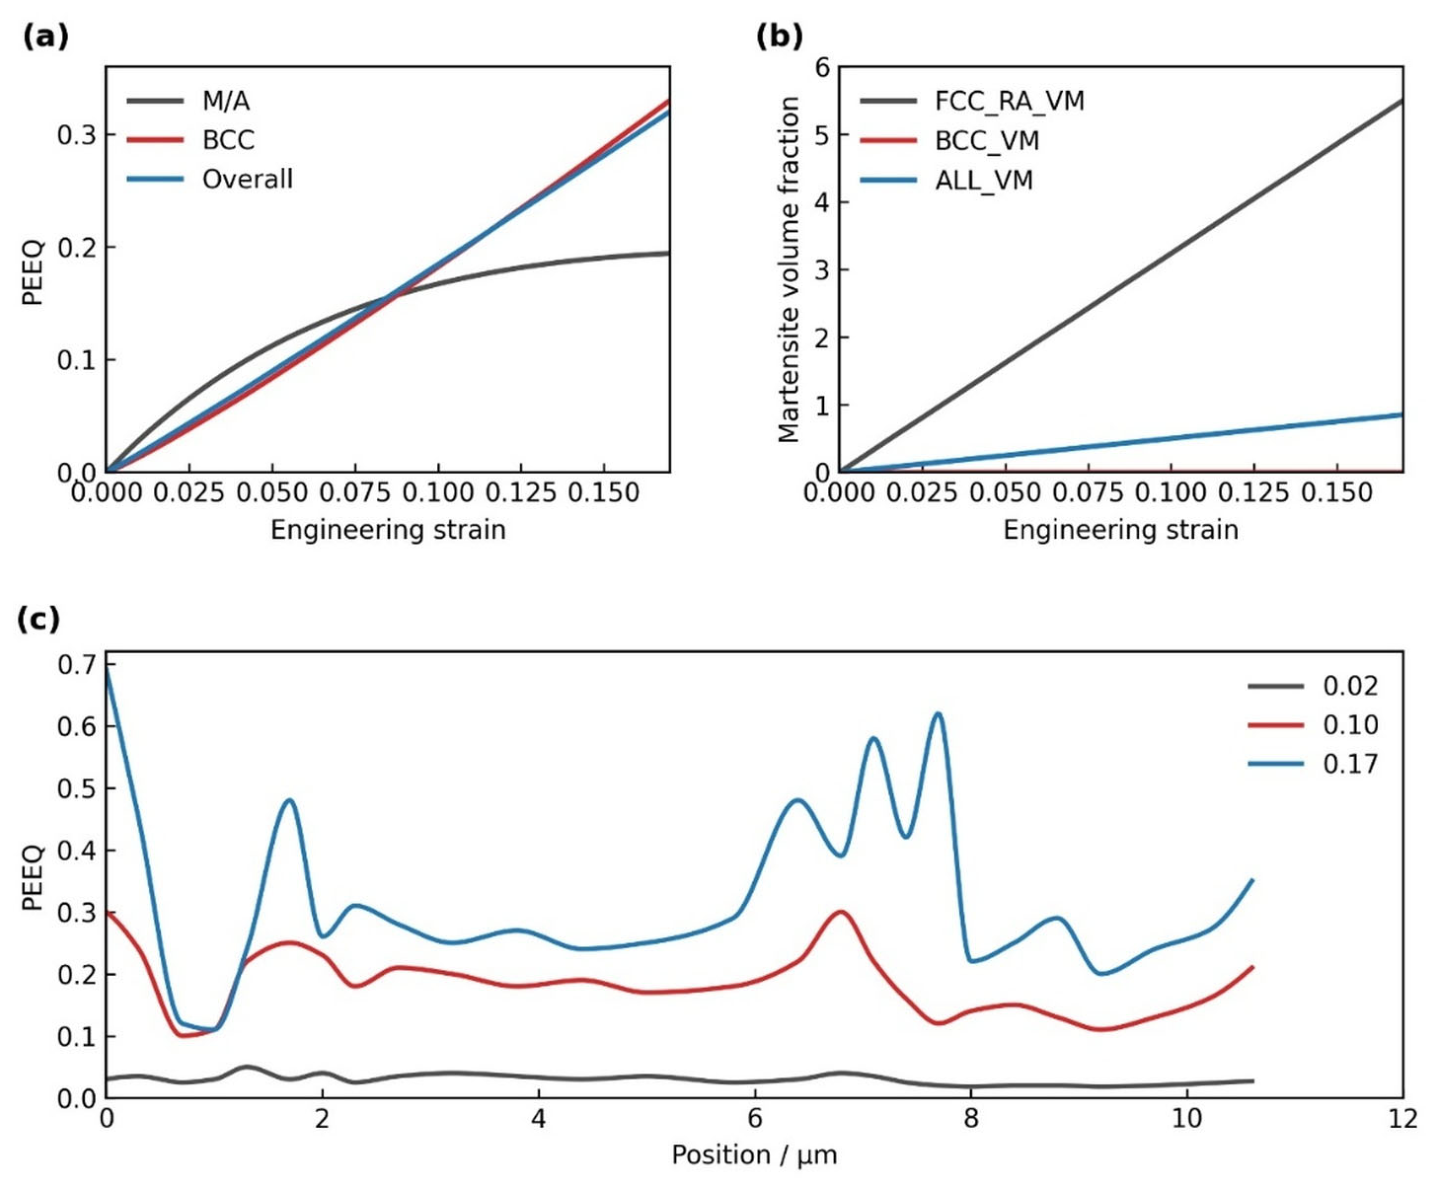
Figure 9 presents the evolution of the PEEQ-like variable and martensite volume fraction. The path-wise PEEQ distribution is not smooth; instead, several pronounced peaks appear at fixed positions and are amplified rapidly with increasing macroscopic strain. These peaks correspond to phase-boundary-neighboring locations and geometrically constrained regions, where plastic incompatibility is more likely to accumulate. The regional average PEEQ indicates that the M/A-related region carries more plastic strain than the BCC matrix at the early tensile stage, revealing its important role in local strain accommodation.
As the applied strain increases, SDV2376 rises significantly, indicating progressive activation of the retained-austenite-to-martensite transformation. After transformation, the local load-bearing capacity increases because newly formed martensite strengthens the transformed region. Consequently, the growth rate of the average PEEQ in the M/A-related region changes, whereas the overall average PEEQ continues to increase more steadily. The TRIP effect therefore plays a dual role: at the early stage, it contributes to strain dispersion and delays local instability; at higher strains, the newly formed martensite increases local constraint and promotes the extension of stress/strain-concentration paths.
The simulated local-field features are consistent with the quasi-in-situ observations in Figure 1, Figure 2 and Figure 3. Experimentally, the von Mises strain is concentrated near bainitic-ferrite intersections and phase boundaries, and blocky retained-austenite regions exhibit lower local strain than bainitic-ferrite regions in the early deformation stage. Numerically, PEEQ peaks are also concentrated along localized paths, and the high-stress regions migrate along grain and phase boundaries. This agreement indicates that the CPFE model not only fits the macroscopic tensile curve but also captures the essential mesoscale mechanisms of local strain concentration and transformation-induced load redistribution.

3.5. Mesoscale Deformation Mechanism

Combining the experimental and simulation results, the tensile deformation of the 24 h austempered high-strength steel can be divided into three characteristic stages. In the early stage, local plasticity is initiated preferentially in M/A-related and phase-boundary-neighboring regions due to their lower stability and stronger local constraint. In the intermediate stage, retained austenite starts to transform into martensite, leading to enhanced local load-bearing capacity and a redistribution of stress from the initially deforming regions to adjacent grains. In the late stage, high-stress and high-PEEQ zones gradually interconnect, providing potential paths for damage initiation and crack propagation.
The retained austenite in this steel should therefore not be regarded simply as a soft phase, nor should the newly transformed martensite be treated as an ideally rigid phase. Instead, the local response is governed by a dynamic competition among crystallographic slip, transformation-induced hardening, and interphase constraint. The BCC matrix accommodates continuous plasticity, while retained-austenite transformation modifies the load-transfer route and temporarily interrupts the direct linkage of strain-localization bands. Because this study does not include a non-TRIP reference condition, the strength–ductility balance is discussed mechanistically from the measured tensile response and the simulated strain-redistribution process, rather than as a direct quantitative comparison with a retained-austenite-free steel.

4. Conclusions

(1) An EBSD-based quasi-two-dimensional RVE model was established for the 260 °C × 24 h austempered high-strength steel. The model retained real grain morphology, phase distribution, and crystal orientation information, and contained 168 grain/phase regions with 35,936 C3D6 elements and 36,411 nodes.
(2) The CPFE model reproduced the main features of the experimental tensile curve, including the elastic response, post-yield hardening, and sustained hardening before macroscopic instability. Quantitative comparison gives an RMSE of 28.21 MPa, a mean absolute percentage error of 1.51%, and R2 = 0.9906 over the 0.2–16% engineering-strain range, indicating that the calibrated phase-dependent parameters are suitable for mesoscale stress–strain-partitioning analysis.
(3) Local Mises stress and PEEQ were strongly heterogeneous during uniaxial tension. High-stress regions preferentially formed near grain boundaries, phase boundaries, and regions with pronounced orientation differences, while PEEQ peaks developed along localized paths associated with phase-boundary constraint and transformation-induced incompatibility.
(4) Retained austenite transformed progressively into martensite during tensile loading. EBSD phase-fraction statistics show that the retained-austenite area fraction decreases from 14.7% in the undeformed specimen to 2.7% and 1.2% at 6% and 12% strain, respectively. This confirms retained-austenite consumption during tensile deformation, while the residual retained austenite at 12% strain indicates that part of the retained austenite remains mechanically stable.
(5) The predicted local-field evolution agrees with quasi-in-situstrain observations, demonstrating that the present EBSD-based CPFEM framework can capture both macroscopic tensile behavior and mesoscale strain-partitioning mechanisms in multiphase high-strength steel.

Author Contributions

Conceptualization: X.S. and L.Z.; methodology: Q.J.; software and calculation: L.Z.; formal analysis: Q.J. and B.W.; investigation: Q.J., B.W., Y.X. and Y.S.; resources: D.S., X.F. and F.Z.; data curation: D.S. and S.Y.; writing—original draft: Q.J. and L.Z.; writing—review and editing: B.W., S.Y., D.S., P.Z., X.S., X.F. and F.Z.; visualization: Q.J., D.S. and S.Y.; supervision: X.S., P.Z. and F.Z.; funding acquisition: X.S., S.Y., F.Z. and D.S. All authors have read and agreed to the published version of the manuscript.

Funding

This work was supported by the National Key R&D Program of China (Nos. 2024YFB3713900 and 2024YFB3713904), the National Natural Science Foundation of China (Nos. 52404402 and U24A20105), the S&T Program of Hebei (No. 25361003D), the Yanzhao Iron and Steel Laboratory Regional Innovation Ability Promotion Project (No. YZISL2024045), the Science Research Project of Hebei Education Department (No. BJ2025150), and the Youth Scholars Promotion Plan of North China University of Science and Technology (No. QNTJ202404).

Data Availability Statement

The data supporting the findings of this study are available from the corresponding author upon reasonable request.

Conflicts of Interest

The authors declare that they have no known competing financial interests or personal relationships that could have appeared to influence the work reported in this paper.

References

  1. Jacques, P.J. Transformation-induced plasticity for high strength formable steels. Curr. Opin. Solid State Mater. Sci. 2004, 8, 259–265. [Google Scholar] [CrossRef]
  2. Sugimoto, K.; Usui, N.; Kobayashi, M.; Hashimoto, S. Effects of volume fraction and stability of retained austenite on ductility of TRIP-aided dual-phase steels. ISIJ Int. 1992, 32, 1311–1318. [Google Scholar] [CrossRef]
  3. De Cooman, B.C. Structure-properties relationship in TRIP steels containing carbide-free bainite. Curr. Opin. Solid State Mater. Sci. 2004, 8, 285–303. [Google Scholar] [CrossRef]
  4. Zhang, S.; Findley, K.O. Quantitative assessment of the effects of microstructure on the stability of retained austenite in TRIP steels. Acta Mater. 2013, 61, 1895–1903. [Google Scholar] [CrossRef]
  5. Ebrahimi, T.; Ayati, H.; Razavi, H.S. Retained austenite stability in third-generation advanced high-strength steels: Thermodynamic, mechanical, and kinetic frameworks for forming and crash performance. J. Mater. Res. Technol. 2026, 42, 1184–1205. [Google Scholar] [CrossRef]
  6. Su, R.; Zheng, X.W.; Kang, J.; Wu, D.-Y.; Ma, H.-K.; Zhang, F.-C.; Yang, Z.-N.; Li, Q. Microstructure-property correlation and strain partitioning behavior in medium-carbon carbide-free bainitic steel. J. Iron Steel Res. Int. 2025, 32, 2039–2053. [Google Scholar]
  7. Hajizad, O.; Kumar, A.; Petrov, R.H.; Sietsma, J.; Dollevoet, R.; Li, Z. Strain partitioning and damage initiation in a continuously cooled carbide-free bainitic steel. Comput. Mater. Sci. 2022, 202, 110965. [Google Scholar] [CrossRef]
  8. Huang, X.D.; Huang, Q.Y.; Jang, Y.H.; Li, Z.; Shan, Q. Retained austenite stability in cementite-free bainitic steels processed by different isothermal heat treatments: Insights from quasi-in-situ strain partition analysis. Mater. Charact. 2025, 229, 115474. [Google Scholar] [CrossRef]
  9. Kim, K.I.; Oh, Y.; Kim, D.U.; Kang, J.-H.; Cho, N.I.; Oh, K.H.; Kang, J.-Y.; Han, H.N. Strain analysis of multi-phase steel using in-situ EBSD tensile testing and digital image correlation. Met. Mater. Int. 2022, 28, 1094–1104. [Google Scholar]
  10. Asaro, R.J. Crystal plasticity. J. Appl. Mech. 1983, 50, 921–934. [Google Scholar] [CrossRef]
  11. Roters, F.; Eisenlohr, P.; Hantcherli, L.; Tjahjanto, D.D.; Bieler, T.R.; Raabe, D. Overview of constitutive laws, kinematics, homogenization and multiscale methods in crystal plasticity finite-element modeling. Acta Mater. 2010, 58, 1152–1211. [Google Scholar] [CrossRef]
  12. Asaro, R.J.; Needleman, A. Overview no. 42: Texture development and strain hardening in rate-dependent polycrystals. Acta Metall. 1985, 33, 923–953. [Google Scholar] [CrossRef]
  13. Hill, R.; Rice, J.R. Constitutive analysis of elastic-plastic crystals at arbitrary strain. J. Mech. Phys. Solids 1972, 20, 401–413. [Google Scholar] [CrossRef]
  14. Peirce, D.; Asaro, R.J.; Needleman, A. Material rate dependence and localized deformation in crystalline solids. Acta Metall. 1983, 31, 1951–1976. [Google Scholar] [CrossRef]
  15. Roters, F.; Diehl, M.; Shanthraj, P.; Eisenlohr, P.; Reuber, C.; Wong, S.L.; Maiti, T.; Ebrahimi, A.; Hochrainer, T.; Fabritius, H.O.; et al. DAMASK-The Düsseldorf Advanced Material Simulation Kit for modeling multi-physics crystal plasticity, thermal, and damage phenomena from the single crystal up to the component scale. Comput. Mater. Sci. 2019, 158, 420–478. [Google Scholar] [CrossRef]
  16. Shen, P.F.; Liu, Y.; Zhang, X. Crystal plasticity finite element modeling of the influences of ultrafine-grained austenite on the mechanical response of a medium-Mn steel. Crystals 2024, 14, 405. [Google Scholar] [CrossRef]
  17. Cheng, J.; Lin, B.K.; Pottore, N.S.; Sadagopan, S.; Zhu, H.; Hu, X. A mesoscale crystal plasticity model to predict room-temperature deformation and martensitic transformation of high-strength quenching and partitioning steels and validation with synchrotron X-ray diffraction. Int. J. Plast. 2024, 172, 103833. [Google Scholar] [CrossRef]
  18. Kong, L.; Pan, B.; Henrich, M.; Stebner, S.; Münstermann, S. A novel genetic algorithm-based calibration framework for crystal plasticity parameters in DP780 steels using multiscale mechanical testing. Comput. Mater. Sci. 2025, 258, 114088. [Google Scholar] [CrossRef]
  19. Nachnani, A.; Li-Caldwell, K.K.; Biswas, S.; Sharma, P.; Ouyang, G.; Singh, P. Interpretable machine learning-guided design of Fe-based soft magnetic alloys. Phys. Rev. Mater. 2025, 9, 084411. [Google Scholar] [CrossRef]
  20. Azhari, F.; Davids, W.; Chen, H.; Ringer, S.P.; Wallbrink, C.; Sterjovski, Z.; Crawford, B.R.; Agius, D.; Wang, C.H.; Schaffer, G. A comparison of statistically equivalent and realistic microstructural representative volume elements for crystal plasticity models. Integr. Mater. Manuf. Innov. 2022, 11, 329–346. [Google Scholar] [CrossRef]
  21. He, B. On the factors governing austenite stability: Intrinsic versus extrinsic effects. Materials 2020, 13, 3440. [Google Scholar] [CrossRef] [PubMed]
  22. Zhou, W.; Hou, T.P.; Zhang, C.; Zhong, L.; Wu, K.M. Effect of carbon content in retained austenite on the dynamic tensile behavior of nanostructured bainitic steel. Metals 2018, 8, 907. [Google Scholar] [CrossRef]
  23. Zhou, S.B.; Hu, F.; Zhou, W.; Cheng, L.; Hu, C.; Wu, K. Effect of retained austenite on impact toughness and fracture behavior of medium carbon submicron-structured bainitic steel. J. Mater. Res. Technol. 2021, 14, 1021–1034. [Google Scholar] [CrossRef]
  24. Zhang, Y.; Liu, W.; Long, X.Y.; Liu, Z.; Li, Y.; Yang, Z.; Zhang, Y. Combining in-situ technology to study the influence of bainite morphology on the strength and toughness properties of medium-carbon bainitic steel. J. Mater. Res. Technol. 2025, 36, 34–44. [Google Scholar] [CrossRef]
  25. Wang, L.; Hu, F.; Chen, K.Y.; Zhou, W.; Zhang, Z.C.; Wu, K.M. Transformation and stability of retained austenite in high-strength steel under tensile strain. J. Iron Steel Res. 2022, 34, 1267–1277. [Google Scholar]
Figure 1. Quasi-in situ SEM observations of the 24 h austempered specimen during tensile deformation: (a) ε = 0.01; (b) ε = 0.03; (c) ε = 0.09; and (d) ε = 0.11. BF denotes bainitic ferrite and RA-b denotes blocky retained austenite. White arrows indicate the characteristic BF/RA-b regions, orange double arrows mark the local lath/blocky feature width, and black arrows indicate the tensile-related local feature orientation. The tensile axis is shown at the bottom.
Coatings 16 00735 g001
Figure 2. Local von Mises strain maps of the 24 h austempered specimen at different engineering strains: (a) ε = 0.01; (b) ε = 0.03; (c) ε = 0.09; and (d) ε = 0.11. The black dotted line indicates the selected path used for extracting the local strain distribution in Figure 3.
Coatings 16 00735 g002
Figure 3. Quantitative evolution of local von Mises strain: (a) strain distribution along the selected path at different engineering strains and (b) average local strain at different characteristic positions.
Coatings 16 00735 g003
Figure 4. Microstructural evolution of the 24 h austempered specimen at different tensile strains: (ad) undeformed state; (fi) 6% strain; and (ko) 12% strain. BC: band contrast image; PH: phase map; KAM: kernel average misorientation; GOS: grain orientation spread. In the PH maps, red and green denote the BCC matrix and FCC retained austenite, respectively; in the GOS maps, blue, yellow, and red denote recrystallized, substructured, and deformed grains, respectively.
Coatings 16 00735 g004
Figure 5. EBSD characterization and reconstructed RVE of the 24 h austempered specimen: (a) EBSD inverse-pole-figure map; (b) enlarged orientation map; (c) EBSD phase map; and (d) reconstructed RVE phase map. The phase colors are consistent with Figure 4, where red and green represent the BCC matrix and FCC retained austenite, respectively.
Coatings 16 00735 g005
Figure 6. Finite element model and boundary conditions for the EBSD-based RVE under uniaxial tension. The orange arrows/boundary marks indicate the displacement-controlled loading and constrained boundary condition used in the simulation.
Coatings 16 00735 g006
Figure 7. Comparison between the experimental tensile curve and the CPFE-simulated curve of the 24 h austempered high-strength steel.
Coatings 16 00735 g007
Figure 8. Mises stress distributions predicted by the RVE model at different macroscopic engineering strains: (a) ε = 0.01; (b) ε = 0.03; (c) ε = 0.09; and (d) ε = 0.11. The color contour represents the local Mises stress level.
Coatings 16 00735 g008
Figure 9. Evolution of local plasticity and transformation-related variables: (a) regional average PEEQ in M/A, BCC, and overall regions; (b) martensite volume fraction in selected phase regions; and (c) PEEQ distribution along a selected path at different macroscopic engineering strains. The line colors identify different regions or strain levels as shown in the legends.
Coatings 16 00735 g009
Table 1. Chemical composition of the investigated steel (wt.%).
CSiMnCrNiMoVCoNbFe
0.512.322.051.452.030.390.440.480.043Bal.
Table 2. Crystal plasticity material parameters used in the RVE model.
ParameterFCC Retained AusteniteBCC MatrixTransformed Martensite M1Transformed Martensite M2
C11/GPa290.4259.0290.4 *290.4 *
C12/GPa175.8111.0175.8 *175.8 *
C44/GPa134.474.0134.4 *134.4 *
γ . 0 /s−10.0010.0010.0010.001
n20202020
h0/MPa541.5300300563
τs/MPa450550550873
τ0/MPa208.8300300406
q1.01.01.01.0
q11.41.41.41.4
Note: The asterisk indicates that M1 and M2 are transformation-related plasticity branches embedded in the retained-austenite UMAT. Their elastic response inherits the parent FCC stiffness, while their slip-resistance and hardening parameters are updated separately.
Table 3. State-dependent variables used for post-processing.
SDVPhysical MeaningUse in This Work
SDV2376Martensite volume fractionTRIP evolution and phase-transformation tracking
SDV2380Dislocation slip contribution in austeniteMechanism analysis and path distribution
SDV2382Dislocation slip contribution in martensiteMartensite slip contribution and mechanism analysis
SDV2384PEEQ-like equivalent plastic strainRegional average PEEQ and path distribution
Table 4. EBSD-determined retained-austenite fraction at selected tensile states.
Engineering Strain (%)Retained Austenite (%)
0 (undeformed)14.7
62.7
121.2
Table 5. Quantitative validation of the CPFE tensile response.
Evaluation ItemExperimental/MPaSimulation/MPaIndex
ε < 0.08RMSE = 20.18 MPa; MAPE = 1.20%; R2 = 0.9964
ε = 0.081845.61815.31.64%
ε = 0.121886.91854.51.72%
ε = 0.161882.81834.22.58%
UTS1892.21858.61.77%
Disclaimer/Publisher’s Note: The statements, opinions and data contained in all publications are solely those of the individual author(s) and contributor(s) and not of MDPI and/or the editor(s). MDPI and/or the editor(s) disclaim responsibility for any injury to people or property resulting from any ideas, methods, instructions or products referred to in the content.