Article

Effect of Powder Reuse on the Corrosion Behavior of Anodized and Flash-Plasma Electrolytic Oxidation-Treated Laser-Powder Bed Fusion Ti-6Al-4V ELI

by
Marlon H. Guerra-Mutis
1,*,
Raul Arrabal
1,
Marta Mohedano
1,
María Isabel Barrena
1,
Jesus M. Vega
1,
Javier Díaz Gutiérrez
2 and
Endzhe Matykina
1,3
1
Departamento de Ingeniería Química y de Materiales, Facultad de Ciencias Químicas, Universidad Complutense de Madrid (UCM), 28040 Madrid, Spain
2
Madit Metal S.L., Parque Industrial Torrelarragoiti 5A-2, 48170 Zamudio, Bizkaia, Spain
3
Unidad Asociada al ICTP, IQM (CSIC), Grupo de Síntesis Orgánica y Bioevaluación, Instituto Pluridisciplinar (UCM), Paseo de Juan XXIII 1, 28040 Madrid, Spain
*
Author to whom correspondence should be addressed.
Coatings 2026, 16(6), 655; https://doi.org/10.3390/coatings16060655 (registering DOI)
Submission received: 30 April 2026 / Revised: 22 May 2026 / Accepted: 26 May 2026 / Published: 28 May 2026
(This article belongs to the Special Issue Plasma Electrolytic Oxidation (PEO) Coatings—3rd Edition)

Highlights

L-PBF Ti-6Al-4V ELI is susceptible to localized corrosion in physiological medium.
Reused powder samples show higher passivity than virgin powder samples.
Up to 34 powder reuse cycles do not substantially affect the substrate’s response to surface treatments.
Flash-PEO suppresses localized corrosion up to 2.6 V in Hanks’ solution.
Anodizing and Flash-PEO protect L-PBF Ti-6Al-4V ELI in both Harrison’s and Hanks’ solutions, respectively.

Abstract

The present work compares the corrosion performance of additively manufactured (AM) Ti-6Al-4V ELI (Extra-Low Interstitials) alloy manufactured by Laser-Powder Bed Fusion (L-PBF) using virgin powder (Cycle 1/C1 sample) and reused powder feedstock after up to 34 cycles (Cycle 34/C34 sample) of manufacturing. The effect of powder reuse is also evaluated for anodizing and Flash-PEO-coated specimens in Harrison’s (25 °C) and Hanks’ solutions (37 °C), representing simulated atmospheric precipitation and physiological conditions, respectively. Specimens were characterized using common metallographic techniques, X-ray diffraction, scanning electron microscopy and optical profilometry. Corrosion resistance was evaluated using cyclic potentiodynamic polarization (PDP) tests. The oxygen content in the Ti-6Al-4V reaches 0.14 wt.% after 34 cycles (C34) of powder reuse, enhancing its passivity in both Harrison’s and Hanks’ solutions. Both virgin and reused powder builds are susceptible to localized corrosion in Hanks’ solution at potentials above 1.75 V. Melt pool borders are thought to be the preferential sites for localized corrosion, as indicated by Volta potential measurements (ΔV = 100 mV). The number of cycles does not significantly affect the current–voltage responses for anodizing and flash-Plasma Electrolytic Oxidation (Flash-PEO) treatments, although anodizing is slightly more responsive to variations in surface roughness (i.e., real specimen area). Anodizing and Flash-PEO reduce the passive current density by nearly two orders of magnitude. Even after surface treatment, the alloy printed with reused powder revealed better passivity. Flash-PEO coatings yielded significant protection against localized corrosion. This unlocks Flash-PEO processing as a successful protection approach for AM biomedical components.

1. Introduction

Additive manufacturing (AM) of Ti-6Al-4V has been studied for more than two decades, with early studies demonstrating the feasibility of laser-based processes for this alloy [1]. The growing competition with conventional manufacturing techniques has driven the development of supporting technologies aimed at broadening applications, refining process parameters, and reducing production costs. Recent reviews [2,3] have shown that L-PBF has become a robust route for producing complex Ti-6Al-4V components with reduced waste and shorter lead times.
A major advantage of L-PBF lies in its capacity to produce intricate structures from computer-aided design files, which are now widely accessible through user-friendly software. However, such freedom in design can introduce risks related to structural integrity and safety if not properly controlled. Since the publication of ASTM F2924-14 (2021) and ASTM F3001-14 (2021) [4,5], formal specification frameworks have been available for AM Ti-6Al-4V and Ti-6Al-4V ELI. These standards define chemical composition limits, including oxygen content, as well as mechanical property requirements and component classification according to application criticality [4]. In the aerospace sector, complementary standards and certification guidance have also supported the adoption of AM by defining process-control parameters for repeatable production and airworthiness compliance [5,6,7,8].
A critical step toward improving the economic and environmental viability of L-PBF is the reuse of Ti-6Al-4V powder, since virgin feedstock remains one of the most expensive inputs and repeated use can reduce material cost and the environmental burden associated with Ti extraction and powder production [9,10]. Although powder reuse has long been considered in powder-based AM, systematic studies for Ti-6Al-4V began to appear in the literature in the mid-2010s, including the work of Tang et al. on 21 reuse cycles in Electron Beam Melting (EBM) [11]. Beyond the obvious economic savings, powder reuse supports the transition toward a circular manufacturing model, decreases overall waste generation, and enhances process sustainability, key factors that make AM increasingly competitive with traditional subtractive manufacturing methods [12].
Recent publications [9,13,14] review in detail various powder reuse methods [15] and their implications on the properties of the resulting components. Although powder reuse has been extensively studied, corrosion performance has received comparatively less attention. Powder reuse in L-PBF of Ti-6Al-4V offers clear advantages in cost reduction and sustainability but may compromise surface integrity and corrosion resistance relative to virgin powder.
L-PBF Ti-6Al-4V has been reported to undergo localized corrosion in chloride-containing media such as Phosphate-Buffered Saline (PBS), Hanks’ solution, and NaCl solutions, compared with wrought counterparts [16,17,18]. To mitigate these effects, surface modification techniques, including anodizing and Flash-PEO, have been shown to enhance electrochemical performance and surface durability in aggressive or physiological environments [17,18,19].
The present study assesses the corrosion performance of AM Ti-6Al-4V samples subjected to anodizing and Flash-PEO treatments, using both virgin powder (C1) and powder reuse after 34 manufacturing cycles (C34). Samples produced from both virgin and reused powder exhibited improved corrosion resistance after surface treatment when immersed in Harrison’s and Hanks’ solutions.

2. Materials and Methods

2.1. Materials

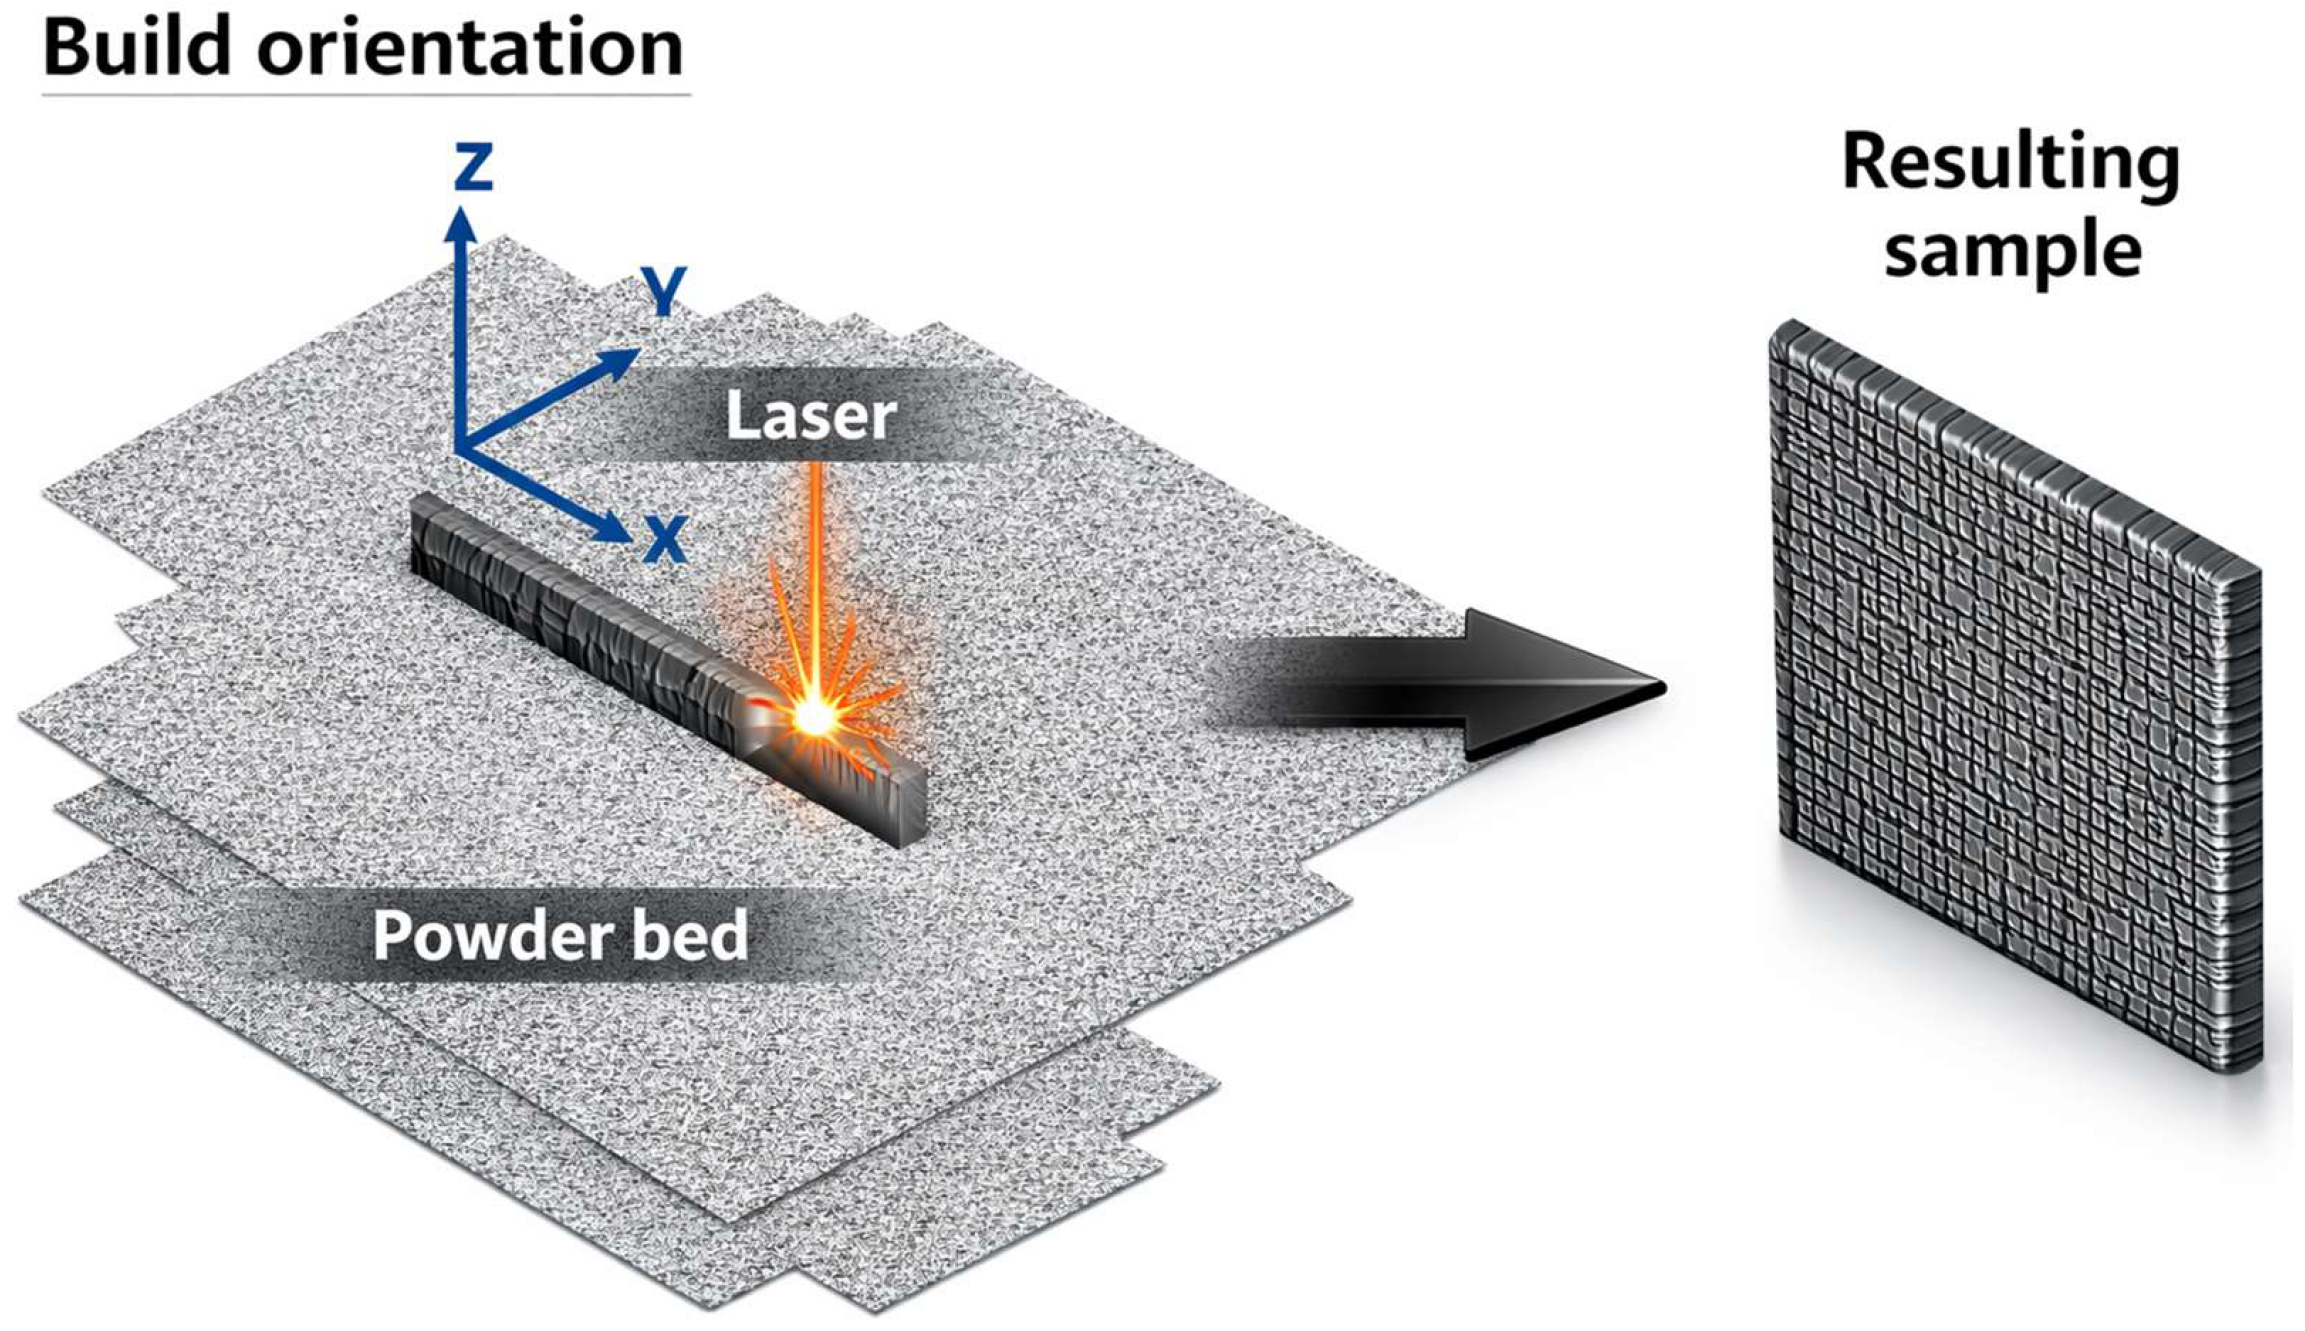
The tested AM Ti-6Al-4V ELI samples were provided by Madit Metal S.L. (Zamudio, Spain) and were built by means of the L-PBF technique in an x-z orientation as shown in Figure 1.
The dimensions of the manufactured samples were set to 40 mm length × 40 mm width and 2 mm thickness, and were subsequently cut into 10 mm × 10 mm or 20 mm × 20 mm specimens, depending on the specific assay. The tested AM Ti-6Al-4V samples correspond to Cycle 1 (virgin powder) and Cycle 34 (used powder) from a manufacturing process employing a continuous powder-refreshing strategy according to a proprietary routine. The samples were manufactured using a Renishaw RenAM 500Q system (Gloucestershire, UK), which incorporates a fully automated, closed-loop powder-handling system. During recycling, sieving, and transport stages, the powder remains confined within the machine under a continuous argon (Ar) atmosphere, with oxygen (O2) levels maintained below 1000 ppm, preventing any contact with the surrounding environment. An integrated ultrasonic sieve with a 63 µm mesh was employed, which retained reusable powder while filtering out oversized particles, agglomerates, and spatter. Virgin powder was stored in sealed original containers to avoid pre-oxidation or moisture absorption prior to use. Given that the specimens were produced alongside industrial customer parts, a fixed powder refresh ratio was not applied. Instead, the amount of virgin powder added at each build cycle was determined by the geometric requirements of the scheduled parts, following a demand-based refreshment strategy (see Supplementary Information, Table S1). The elemental composition of the powder for the initial (C1), intermediate (C22) and final cycle (C34) remained within the limits specified by ASTM F3001-14 (2021) (Table 1, courtesy of Aubert & Duval, S.A.).
The samples received proprietary stress-relief heat treatment performed above 720 °C to achieve phase transformation from the metastable martensitic α’ phase into the stable α + β microstructure, relieving the high internal stresses generated by the rapid cyclic heating and cooling inherent to the L-PBF process. To minimize oxidation, the entire thermal cycle was carried out under a controlled Ar atmosphere.
Additionally, sandblasting was performed manually using alumina (Al2O3) particles projected under pressure from a distance of approximately 10 cm onto the sample surface, reducing the roughness associated with the staircase effect and adhered powder particles [20].

2.2. Methods

2.2.1. Surface Preparation

Samples used for roughness, water contact angle (WCA), optical microscopy (OM), electrochemical testing and scanning electron microscopy (SEM) were cleaned with isopropanol and subsequently sonicated for 5 min.
Samples used for metallography, including cross-sections, were prepared using silicon carbide abrasive papers (P120–P4000) and then polished with colloidal silica. Subsequently, the polished surfaces were etched for 3 min using Keller’s reagent consisting of 0.5 mL HF, 1.5 mL HCl, and 2 mL HNO3 diluted in 95 mL H2O.
The surfaces of the samples used for surface treatments (anodizing and Flash-PEO) were prepared using an etching solution composed of 3 mL HF, 20 mL HNO3 and 77 mL H2O, under gentle stirring with the processing time determined by the onset of gas evolution on the surface of the sample (usually less than 30 s).
A cross-sectional sample for transmission electron microscopy (TEM) was reduced to a thickness of ~10 μm, mounted on a copper ring (2.5 mm diameter and 80 μm thickness), and subsequently holed using a Precision Ion Polishing System (PIPS), GATAN Model 695 (Leicester, UK).

2.2.2. Surface Treatments

Anodizing
AM Ti-6Al-4V samples were anodized in an H2SO4 (50 g·L−1) solution following the procedure described in EN 2808:1997 [21], under direct current (DC) conditions with a current density of 10 mA·cm−2, using a SM400-AR-8 Delta Elektronika power supply (Wokingham, UK). The process was conducted under galvanostatic conditions, and the treatment was stopped when the voltage reached the predefined threshold of 20 V.
Flash-PEO
Flash-PEO of AM Ti-6Al-4V ELI surfaces was performed for 45 s under continuous stirring, in a neutral electrolyte (pH 7.1), composed of C6H10CaO·5H2O (15.4 g·L−1), NaH2PO4·2H2O (3.9 g·L−1), NaOH (6 g·L−1) and Na2EDTA·2H2O (20.5 g·L−1) [17]. The process was conducted under an alternating current (AC) regime with a nominal current density of 300 mA·cm−2 using a power supply ET Systems electronic 2 kW EAC-S2000 (Altlussheim, Germany). The positive and negative voltage amplitudes were set to 490 V and −30 V, respectively, using a 300 Hz square signal (50% duty cycle) over a 45 s ramp. These conditions were developed in [17] to (i) ensure stable and uniform sparking, (ii) provide a sufficiently negative pulse to promote cation incorporation into the coating, and (iii) maximize coating thickness in the minimum processing time.

2.2.3. Surface Characterization

The surfaces of the AM Ti-6Al-4V samples were inspected by OM, using an inverted microscope (Leica DMi8 M, Wetzlar, Germany) controlled by Leica Application Suite (LAX, version 3.0.14.23224). Surface roughness was evaluated using an optical profilometer with focus variation (InfiniteFocusSL, Alicona GmbH, Graz, Austria) equipped with a x10 objective. The IFMeasure Suite 5.3 was used to calculate roughness parameters, including Sa (arithmetical mean height), Sq (quadratic average height), S10z (ten-point height), Vmc (core material volume) and Vvc (core void volume). WCA measurements were performed using an FTA1000 B Class instrument (First Ten Angstroms, Inc., Newark, CA, USA) with an Edmund Optics 5582 high-speed camera (Barrington, NJ, USA), operated through the FTA32 video 2.1 software interface. At least three measurements were performed for each sample.
SEM micrographs were acquired using a JEOL JSM-6400 microscope (Tokyo, Japan) equipped with X-ray Energy Dispersive Spectroscopy (EDS, Abingdon, UK) and a backscattered electron (BSE, Abingdon, UK) detector. The Flash-PEO coating thickness was obtained by averaging ten measurements per sample using an eddy current probe (Fischer ISOSCOPE-FMP10, Sindelfingen, Germany) and verified by using cross-sectional SEM micrographs. Transmission electron microscopy (TEM) micrographs were acquired using a JEOL JEM-3000F (S)TEM instrument (Tokyo, Japan), operated at an accelerating voltage of 300 kV and equipped with EDS. The wall thickness of the anodized samples was measured from TEM images.
Bragg–Brentano X-ray diffraction (XRD) patterns were acquired using an X-ray diffractometer with Cu Kα radiation (λ = 1.54060 Å), Panalytical X’Pert MRD (Almelo, The Netherlands). Diffraction signals were recorded in the 2θ range of 10° to 90° at a step size of 0.05° and a counting time of 1 s per step. The analysis of the XRD spectra was performed using Panalytical Xpert High Score Plus software (version 3.0).
Volta potential measurements were conducted using a Nanoscope IIIa MultiMode atomic force microscope (Bruker, Santa Barbara, CA, USA) operating in Scanning Kelvin Probe Force Microscopy (SKPFM) mode. Volta potential maps were obtained over areas of 400 µm2 and 1600 µm2 (as needed, according to the size of microstructural features of interest in the samples) on 10 mm × 10 mm samples prepared and etched to reveal the grain structure. SKPFM data were analyzed using GWYDDION (v 2.70, Brno, Czech Republic), free scanning probe microscopy data and analysis software.
Electron Probe Microanalysis (EPMA) to generate compositional maps was carried out using the JXA-iHP200F instrument (Tokyo, Japan), which was equipped with a 20 keV EDS and a backscatter detector with a secondary resolution of 2.5 nm and an acceleration voltage of 30 kV. This instrument was used to perform compositional mapping in the areas where the surface potential was evaluated using SKPFM.

2.2.4. Electrochemical Assessment

Cyclic potentiodynamic polarization (PDP) tests were performed on both coated and uncoated 20 mm × 20 mm samples using two corrosive media: Hanks’ solution (8 g·L−1 NaCl, 0.1396 g·L−1 CaCl2, 0.04788 g·L−1 Na2HPO4, 0.09767 g·L−1 MgSO4, 0.4 g·L−1 KCl, 0.06 g·L−1 KH2PO4, 0.35 g·L−1 NaHCO3 with pH 7.2–7.4) and Harrison’s solution (0.5 g·L−1 NaCl, 3.5 g·L−1 (NH4)2SO4 with pH 6.2–6.5). Anodized samples were tested in Harrison’s solution which represents typical service conditions for aerospace applications. Flash-PEO samples were tested in Hanks’ solution as these kinds of coatings are of interest for biomedical prosthetic components. The exposed area was fixed at 1.5 cm2 in a conventional three-electrode cell configuration, where a silver–silver chloride electrode (Ag/AgCl in 3 M KCl) served as the reference electrode, a graphite rod as the counter electrode, and the sample under test as the working electrode. Measurements were conducted using a GAMRY 1010E potentiostat (Warminster, PA, USA) controlled by GAMRY Framework software (version 7.10.4). Cyclic PDP curves were acquired in naturally aerated conditions, without iR compensation at a scan rate of 0.5 mV·s−1 from −0.2 V (initial potential) to 3.2 V (reverse potential) with respect to OCP on at least two different samples. The OCP was stabilized for 60 min.

3. Results and Discussion

3.1. Surface Treatments

3.1.1. Evolution of Voltage and Current During Anodizing

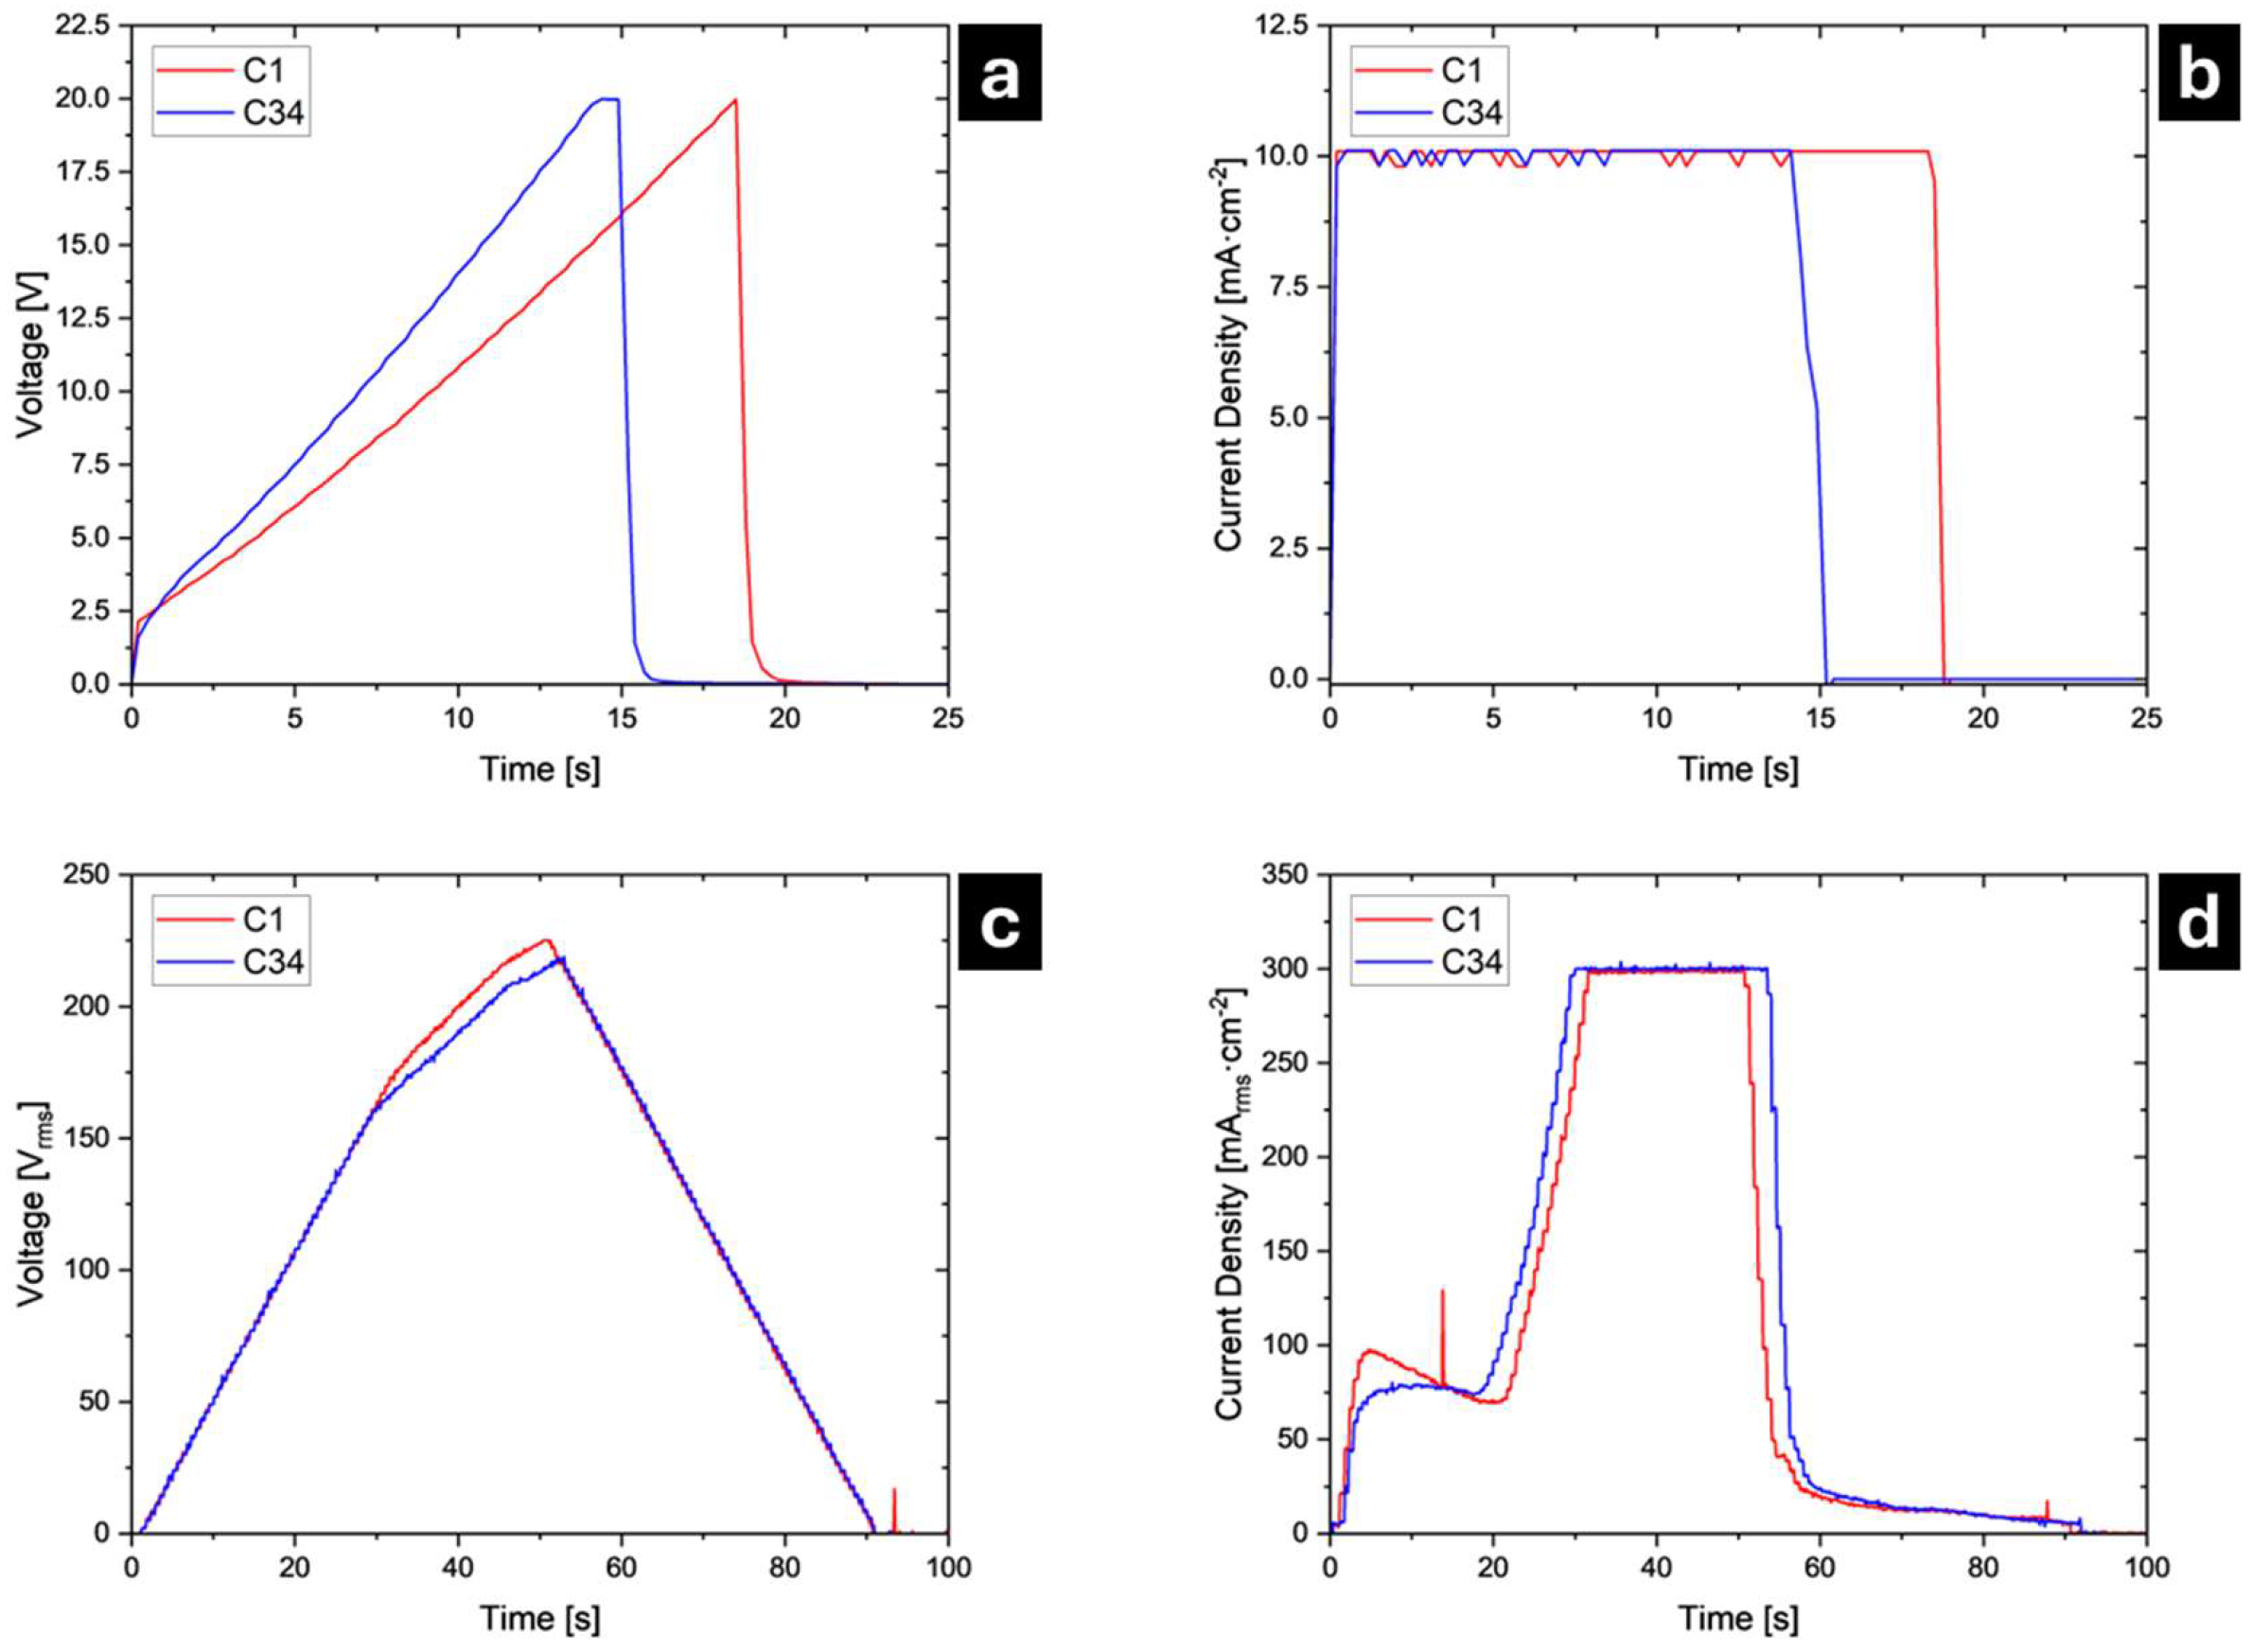
Figure 2a,b shows the evolution of voltage and current density responses recorded during galvanostatic anodizing of AM Ti-6Al-4V ELI samples C1 and C34, respectively. The anodizing process was performed until a predefined maximum voltage of 20 V was reached to produce a blue-violet barrier oxide film (this surface finish is used in aeronautic applications to facilitate lubricant uptake and prevent galling).
In both samples, the applied current density rapidly reached the limiting value within the first few seconds and remained constant thereafter. The voltage increased linearly, controlling the progressive rise in total system resistance, which is dominated by the growing anodic oxide layer [22]. This voltage ramp is consistent with the oxide-growth behavior expected under galvanostatic anodizing, where the increasing thickness and resistance of the TiO2 film requires a higher applied voltage to sustain ionic transport [22].
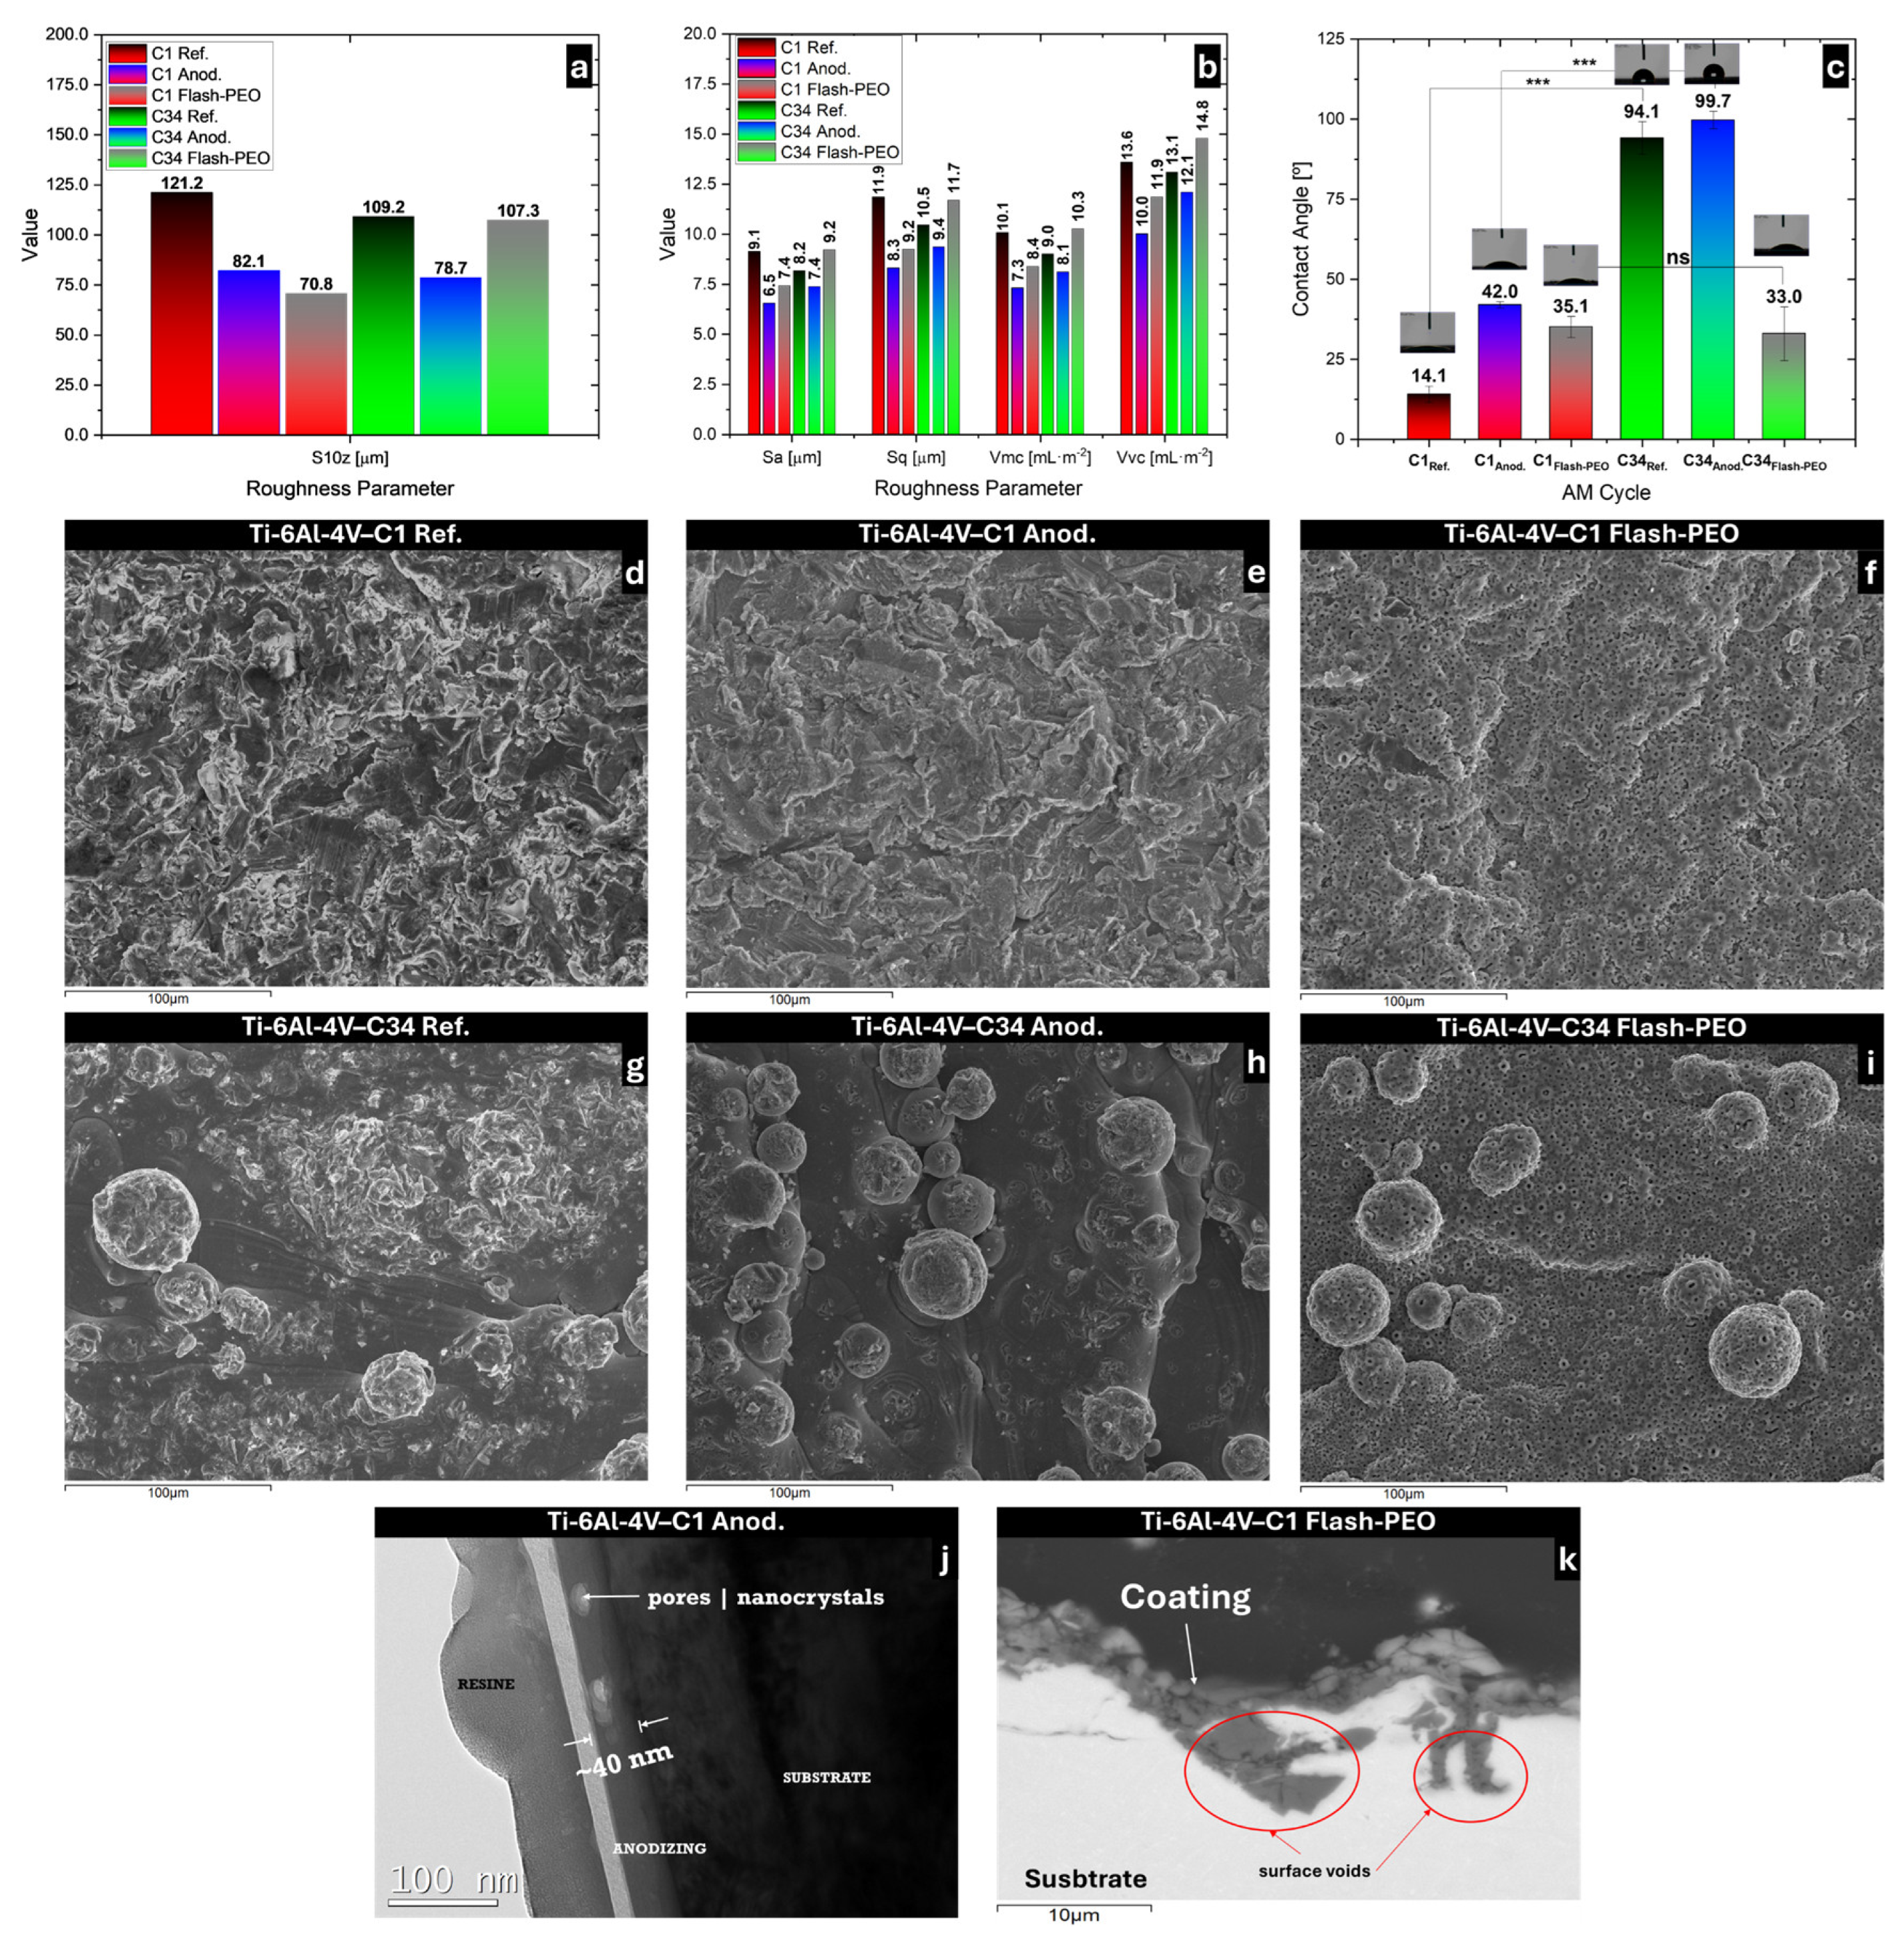
The C34 sample reached the predefined maximum voltage limit faster than C1. This accelerated voltage rise suggests increased surface resistance in C34 and a faster development of the oxide layer. The phenomenon is consistent with a lower initial surface roughness in C34 relative to the markedly rougher C1 sample as seen in Figure 3a,b. Smoother substrate surfaces entail lower real surface area for a given nominal surface area exposed to the electrolyte. As a result, the real anodic current density is higher, leading to a more rapid development of the oxide layer.

3.1.2. Evolution of Voltage and Current Density During Flash-PEO

Figure 2c,d shows the evolution of voltage and current density during the Flash-PEO process. In the initial stage, approximately between 0 s and 20 s, the current density rises almost instantaneously and stabilizes, with minor fluctuations, at ~75 mA·cm−2, while the voltage increases linearly. This response is consistent with the expected behavior of Flash-PEO, in which oxide nucleation, dielectric thickening, gas evolution, and the onset of microdischarges progressively modify the electrical response. The slight current drop observed around 20 s may reflect a transient adjustment prior to the onset of microdischarges, which is preceded by copious gas evolution that affects the active surface area [17,18].
In a second stage, approximately between 20 and 45 s, a new increase in current density is observed up to the predefined value of 300 mA·cm−2, accompanied by a slower increase in voltage. The observed behavior is consistent with the transition to dielectric breakdown and the onset of microdischarges at ~170 V, marked by the voltage slope change at 30 s. The energy-efficient and short-duration Flash-PEO leads to the incorporation of electrolyte species into the coating at a relatively low root mean square (RMS) voltage [18], operating in a current-controlled regime while minimizing excessive sparking or thermal damage.
In this process, the voltage and current density transients are similar between samples C1 and C34, indicating that Flash-PEO developed homogeneously on AM Ti-6Al-4V, regardless of the surface topography.

3.2. Substrate and Coatings Characterization

3.2.1. Surface Analysis

Figure 3 shows the characterization of the surface topography and morphology of as-received AM Ti-6Al-4V samples, as well as after conventional anodizing and Flash-PEO treatments. Anodizing consistently reduced all roughness parameters of samples from the C1 and C34 builds. Flash-PEO reduced all the roughness parameters of C1 but resulted in higher Vmc and Vvc for C34. This difference is most likely related to variability introduced by the manufacturer’s sandblasting step, which may leave spherical non-melted Ti6Al4V powder particles (Figure 3g–i) and Al2O3 particles used for sandblasting (see Supplementary Information Figure S1 and Table S2).
SEM micrographs of the surface morphologies for all the samples under study are presented in Figure 3d–i. The surface of the C1 build features a relatively uniform morphology with moderate roughness. Build C34 reveals the presence of adhered spherical non-melted particles with an average diameter of 20 µm (Figure 3g). This is interpreted as an artifact of post-manufacturing sandblasting for this specific set of samples. For that reason, the area-scan EDS analysis (Table 2) detected lower Al and O contents in build C34 compared to C1, corresponding to the Al2O3 used for sandblasting. WCA measurement indicated changes in surface wettability: C34 was slightly hydrophobic compared to the highly hydrophilic C1, which is attributed to the incomplete elimination of non-consolidated powder particles during sandblasting (Figure 3c). Statistical differences in contact angle measurements between samples C1 and C34 were assessed using Welch’s two-sample t-test [23,24], for sample size n = 3. Significance thresholds were set at p ≥ 0.05 (ns—not significant), 0.01 ≤ p < 0.05 (*—significant), 0.001 ≤ p < 0.01 (**—very significant), and p < 0.001 (***—highly significant).
Conventional anodizing produces a 40 nm thick, compact TiO2 oxide layer (Figure 3j) without eliminating the spheroidal non-melted particles that were present in sample C34, due to its low thickness (Figure 3h). Conventional anodizing in general increased the WCA, rendering C1 less hydrophilic and C34 more hydrophobic. Flash-PEO, a short-duration variant of conventional PEO, induces a rapid transition to plasma microdischarge activity, generating a porous coating featuring craters [18] (Figure 3f,i) and high incorporation of electrolyte species (Table 2), Ca and P in this specific case. A 5.5 µm thick, porous ceramic coating (Figure 3k) also transforms the surface of the spherical particles (Figure 3i), but is unable to engulf them. Regarding the wettability, Flash-PEO yielded a WCA of ~33–35° in both builds without a statistically significant difference, despite the significant differences in WCA of the non-treated substrates (highly hydrophilic C1 and slightly hydrophobic C34; Figure 3c), which can be attributed to the absorption of water in the Flash-PEO pores. It can be inferred that the increased effective area in the Flash-PEO oxide with ~8% of porosity (determined from image analysis) favors wettability.

3.2.2. Phase Analysis

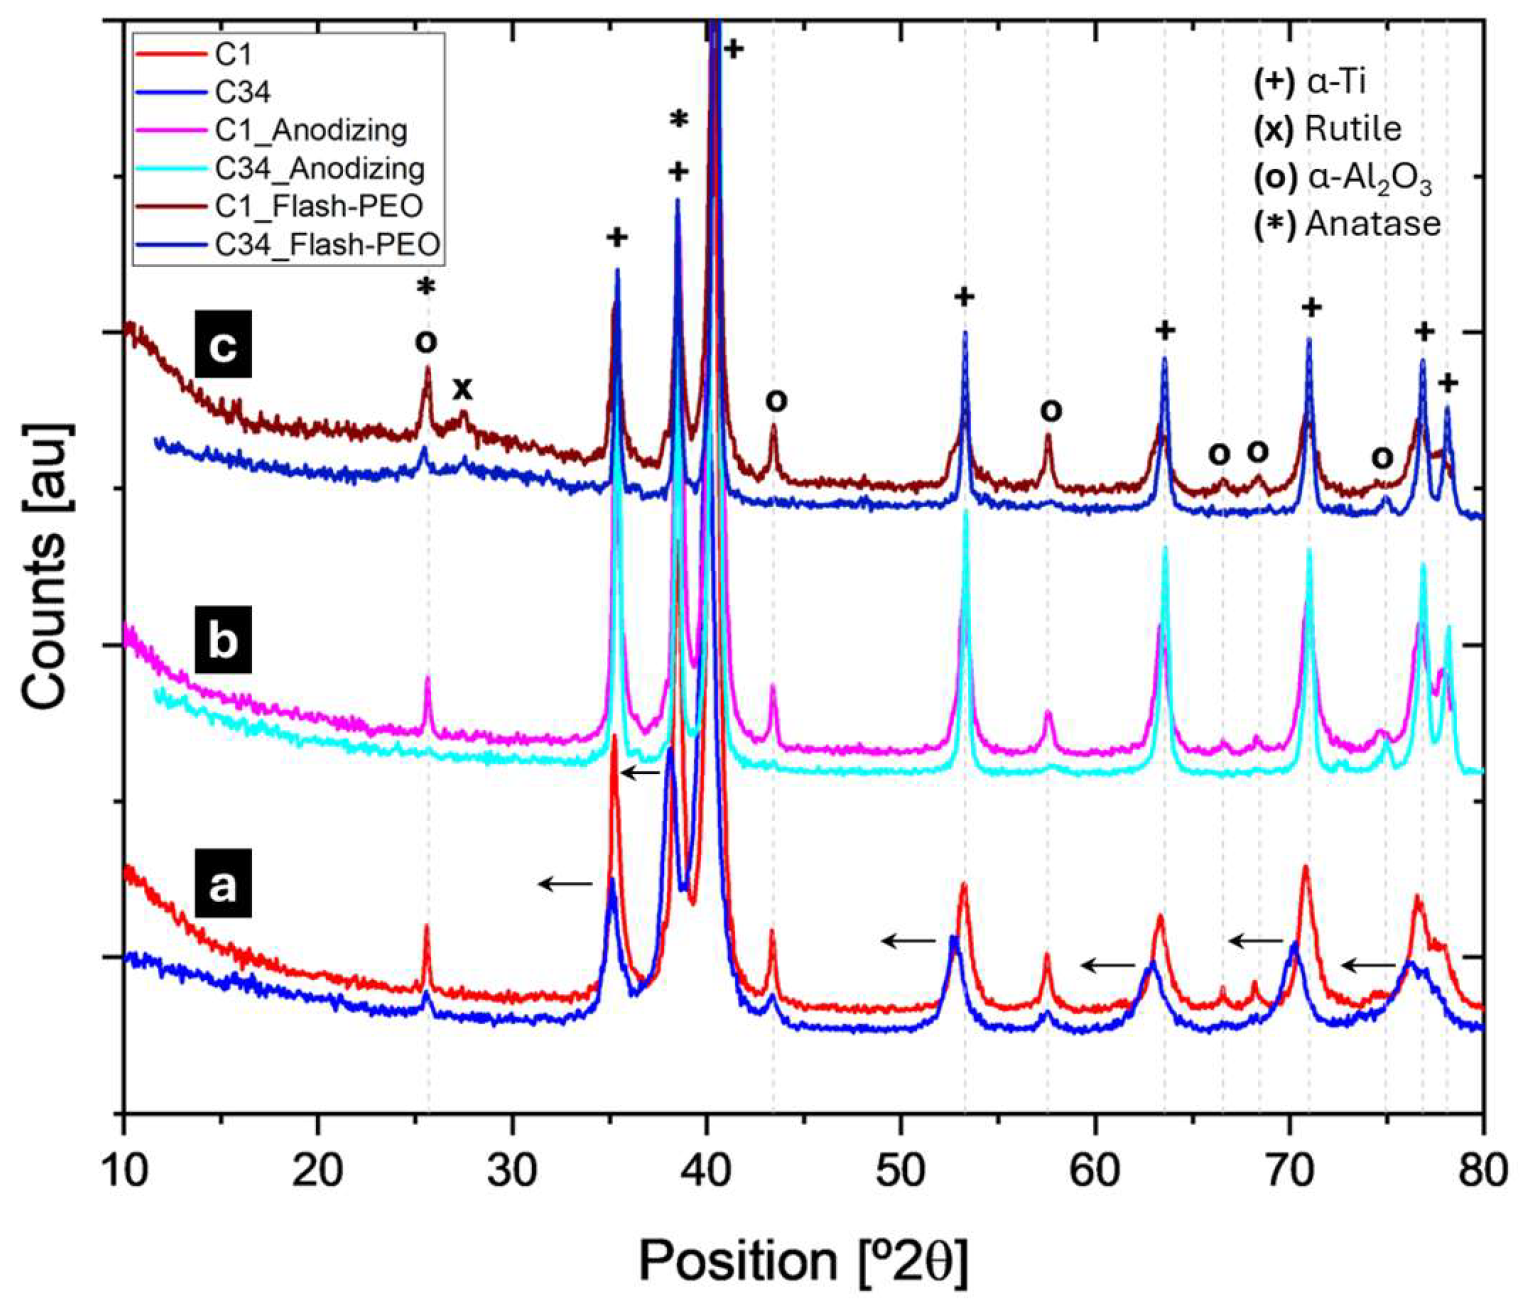
The X-ray diffraction patterns for AM Ti-6Al-4V in as-received (a), anodized (b) and Flash-PEO (c) conditions are shown in Figure 4. In general, the diffractograms are similar; however, the diffraction pattern corresponding to the C34 build shows a slight shift (arrows) of the maxima to the left (smaller 2θ angles), which is associated with an increase in the unit cell dimension, possibly linked to the effect of O and N uptake (Table 1). The main maxima are assigned to the α-Ti crystalline phase, while the maxima identified as α-Al2O3 are associated with the sandblasting process.
In the diffraction pattern corresponding to the Flash-PEO-processed samples (Figure 4c), no maxima associated with crystalline P or Ca phases were identified, even though area-scan EDS analysis (Table 2) confirms the incorporation of these elements into the coating from the electrolyte. This suggests that P and Ca may be present either in amorphous reaction products or as species incorporated into the TiO2-based coating structure. Furthermore, anatase (ICCD card 00-021-1272) and rutile (ICCD card 00-021-1276) are observed in both C1 and C34 Flash-PEO specimens. The presence of rutile is commonly associated with the high local temperatures generated at microdischarge sites during Flash-PEO processing.

3.2.3. Microgalvanic Coupling Analysis

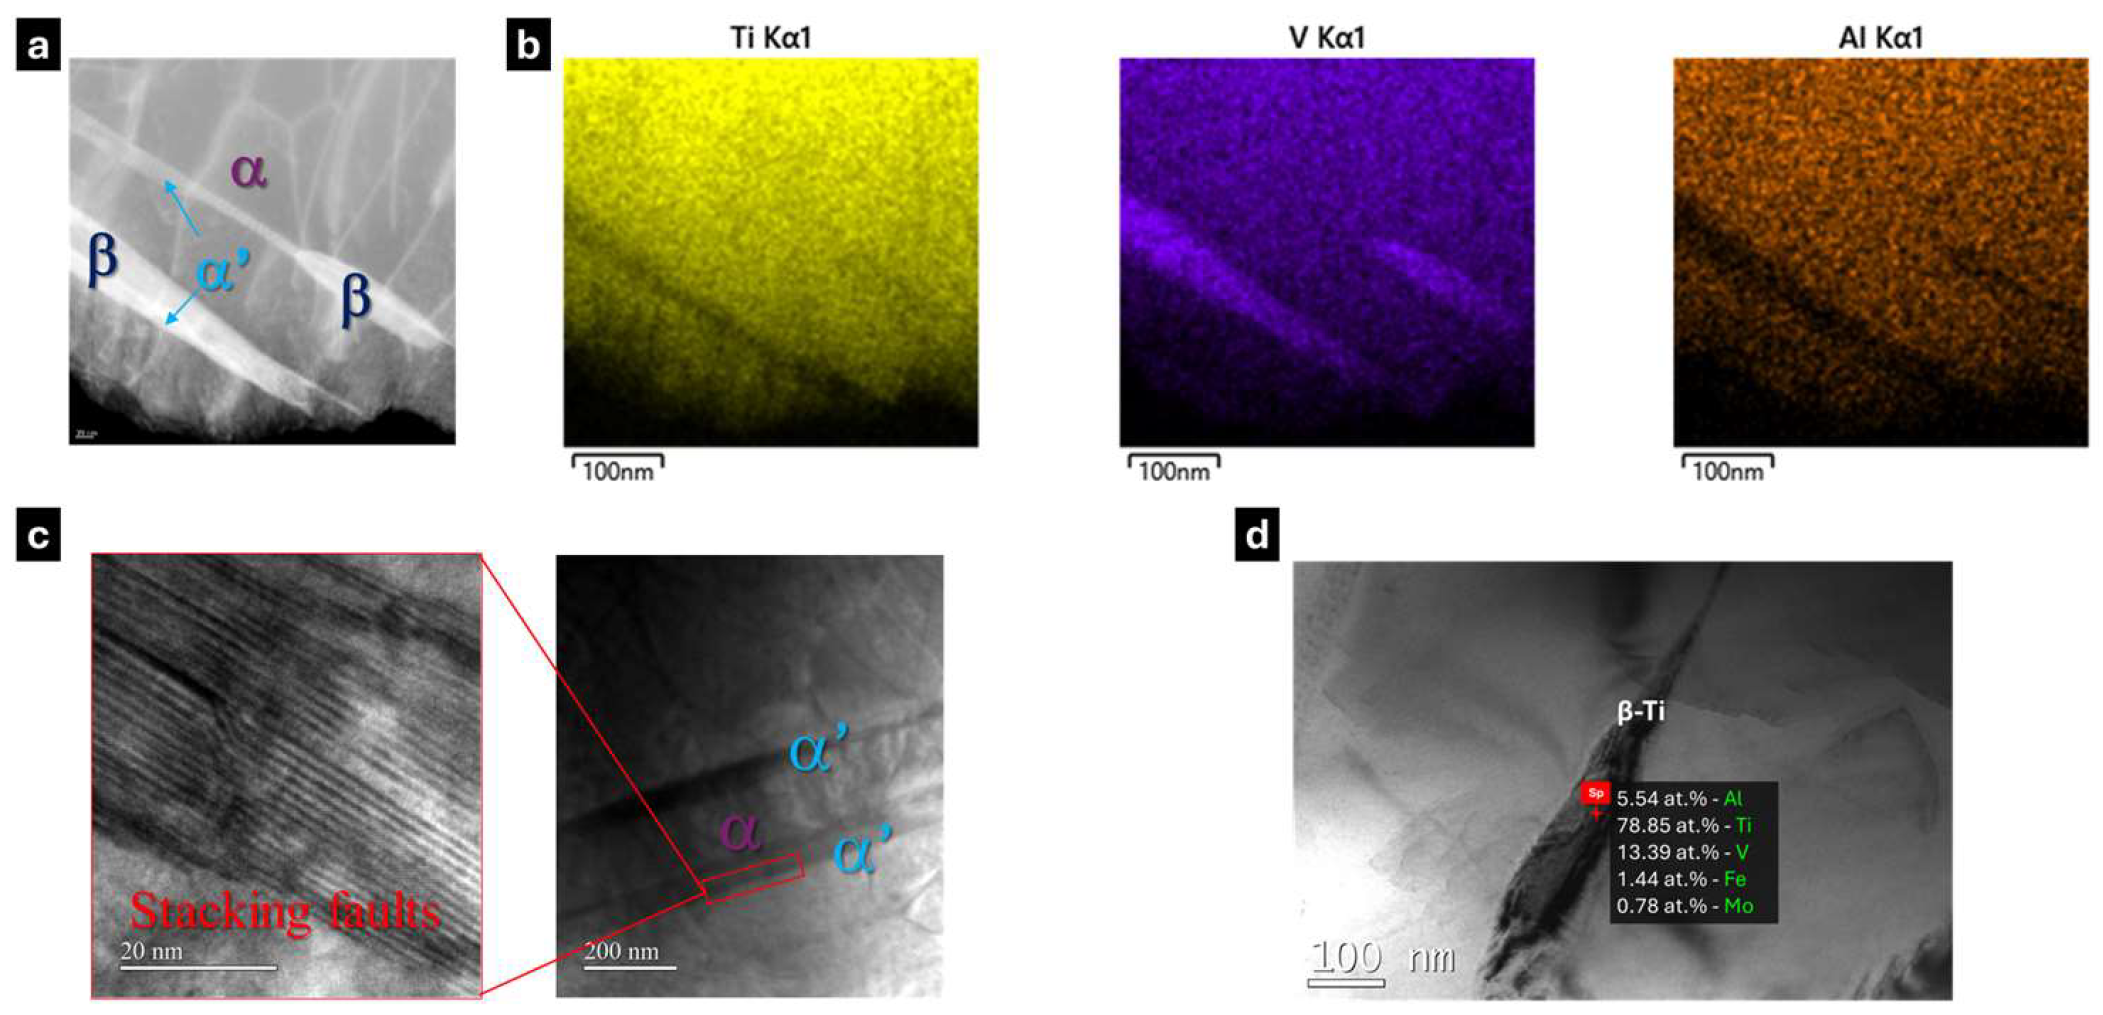
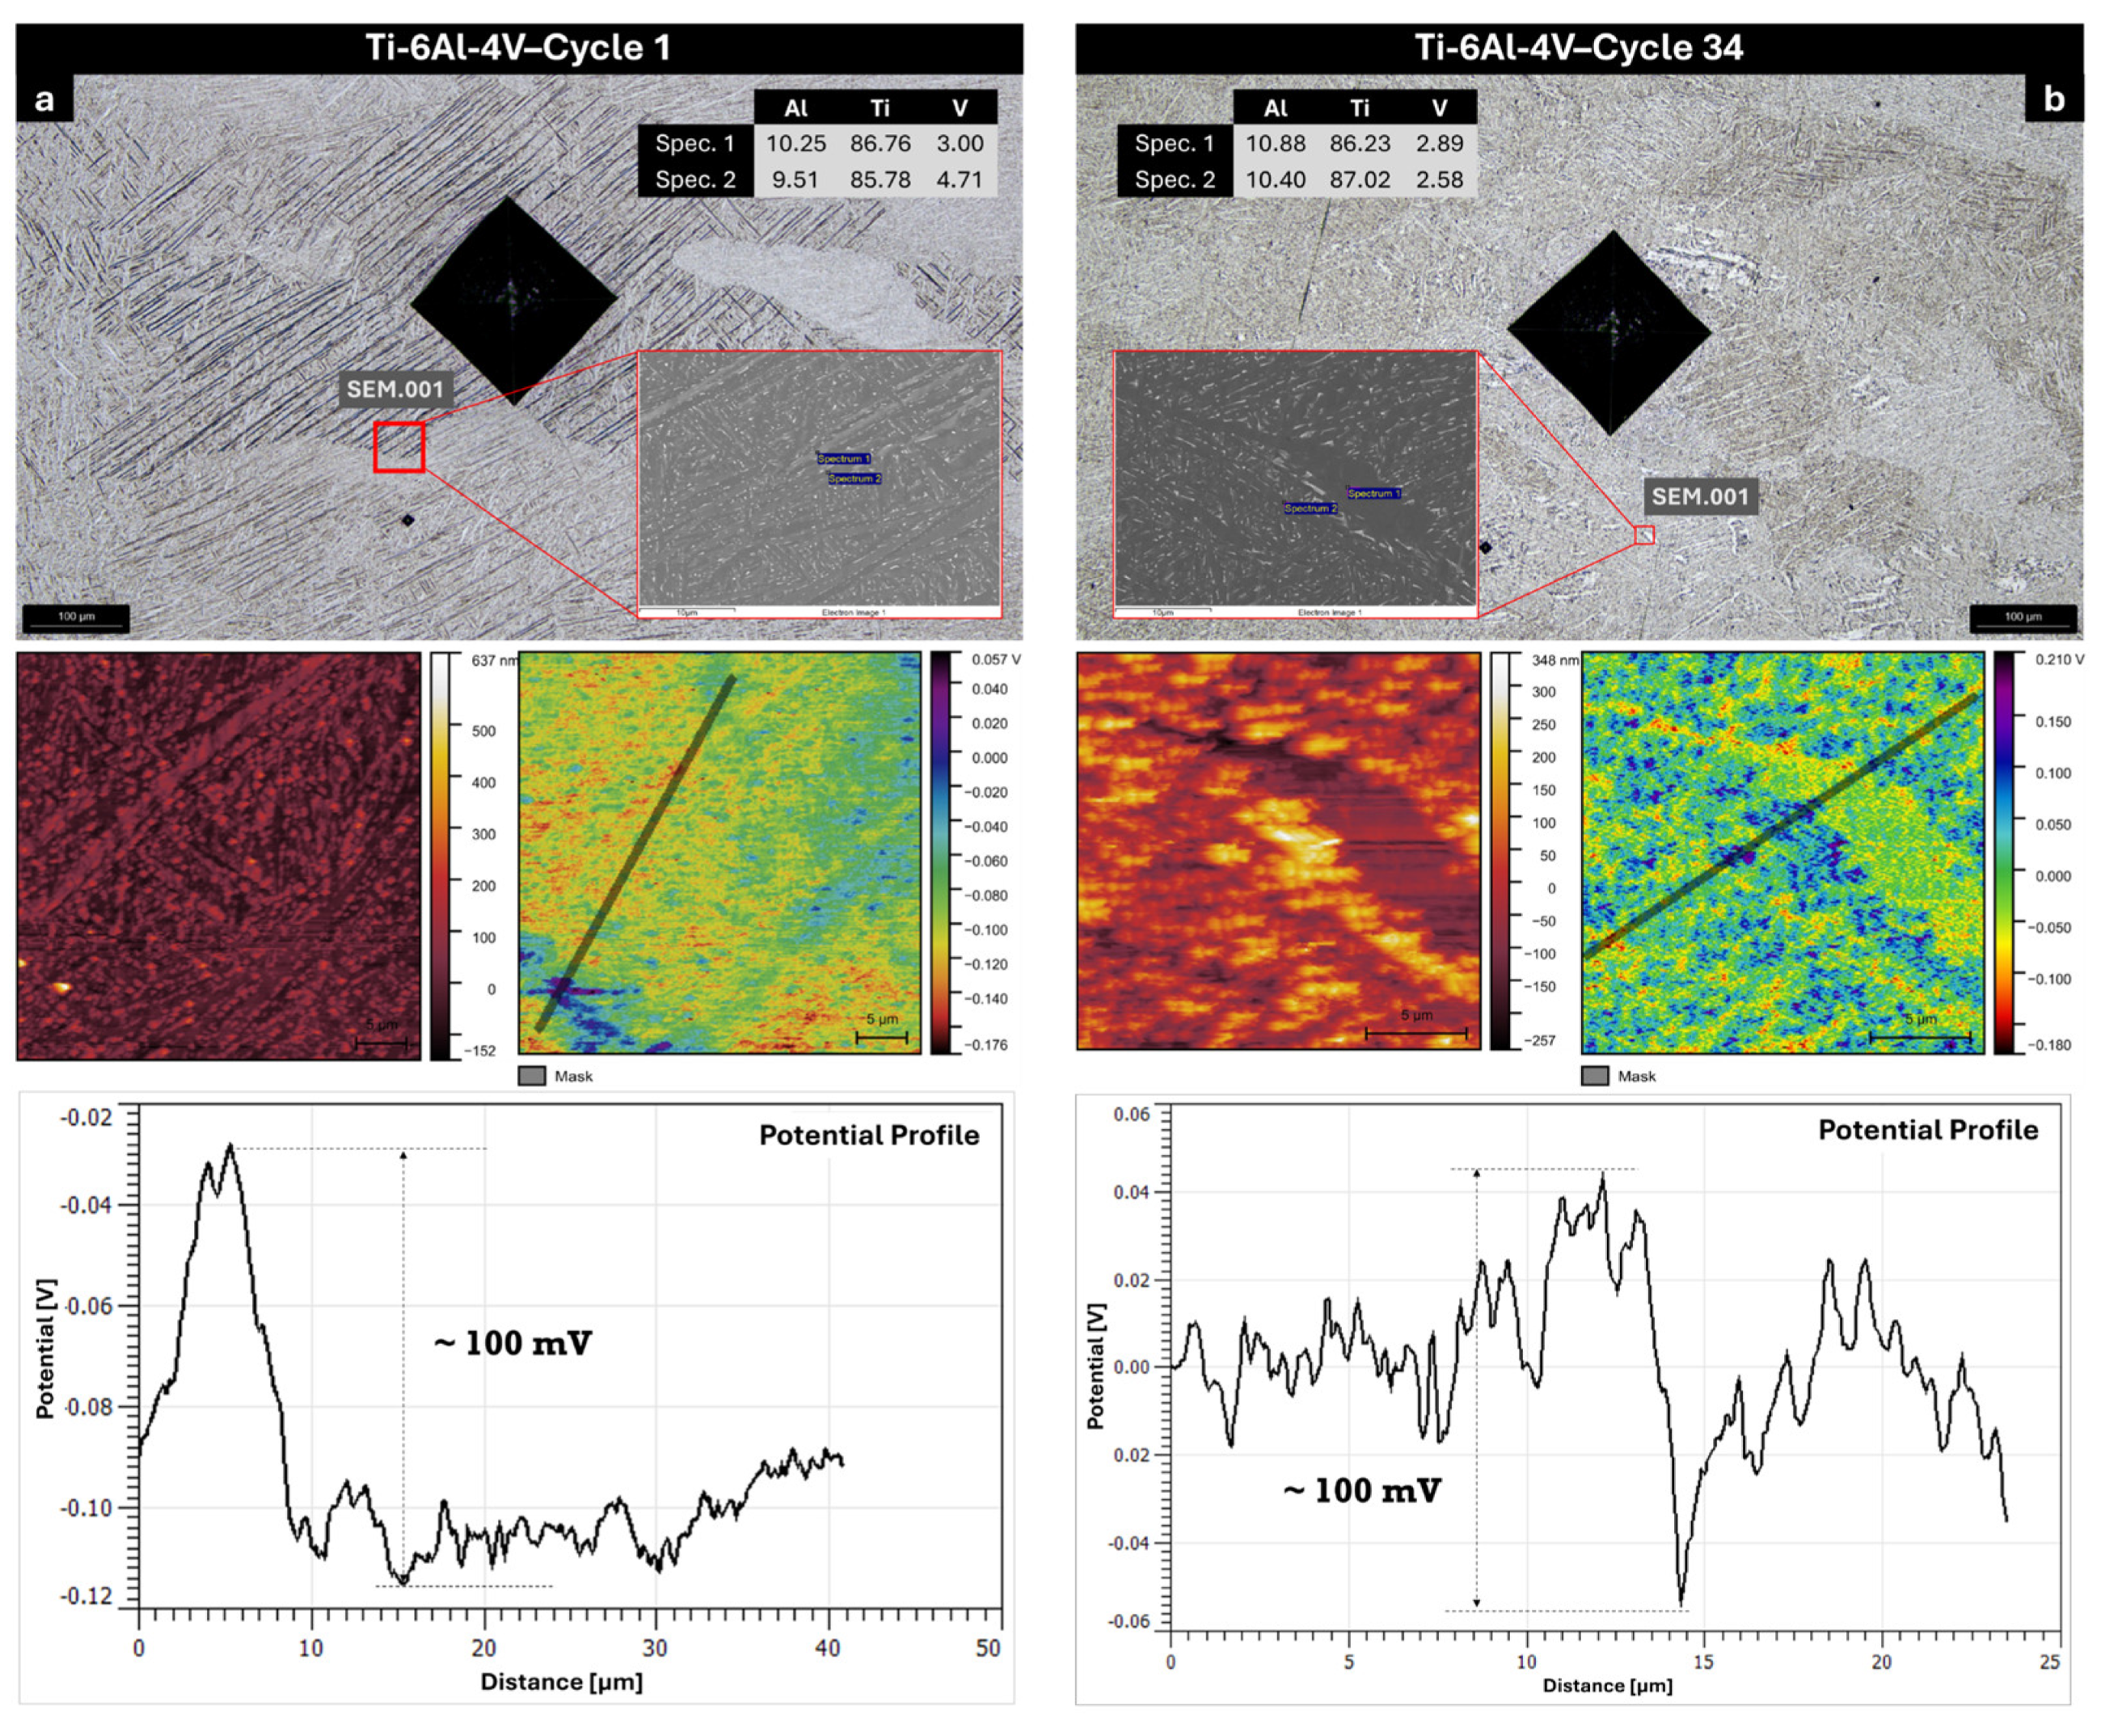
STEM analysis of the C1 build (Figure 5), accompanied by mapping and spot EDS analysis, indicates that beta grains also contain 1.4% Fe and 0.8% Mo. Additionally, the α’ martensitic phase containing stacking faults is adjacent to the beta grains. These areas may exhibit different electrochemical activity compared to Ti- and Al-rich α grains; therefore, it is of interest to establish the substrate’s surface susceptibility to localized corrosion attack. To achieve this aim, SKPFM analysis was performed at the melt pool borders to map the Volta potential of builds C1 and C34 (Figure 6a,b). Note the areas marked as SEM 001, where Volta potential mapping was performed.
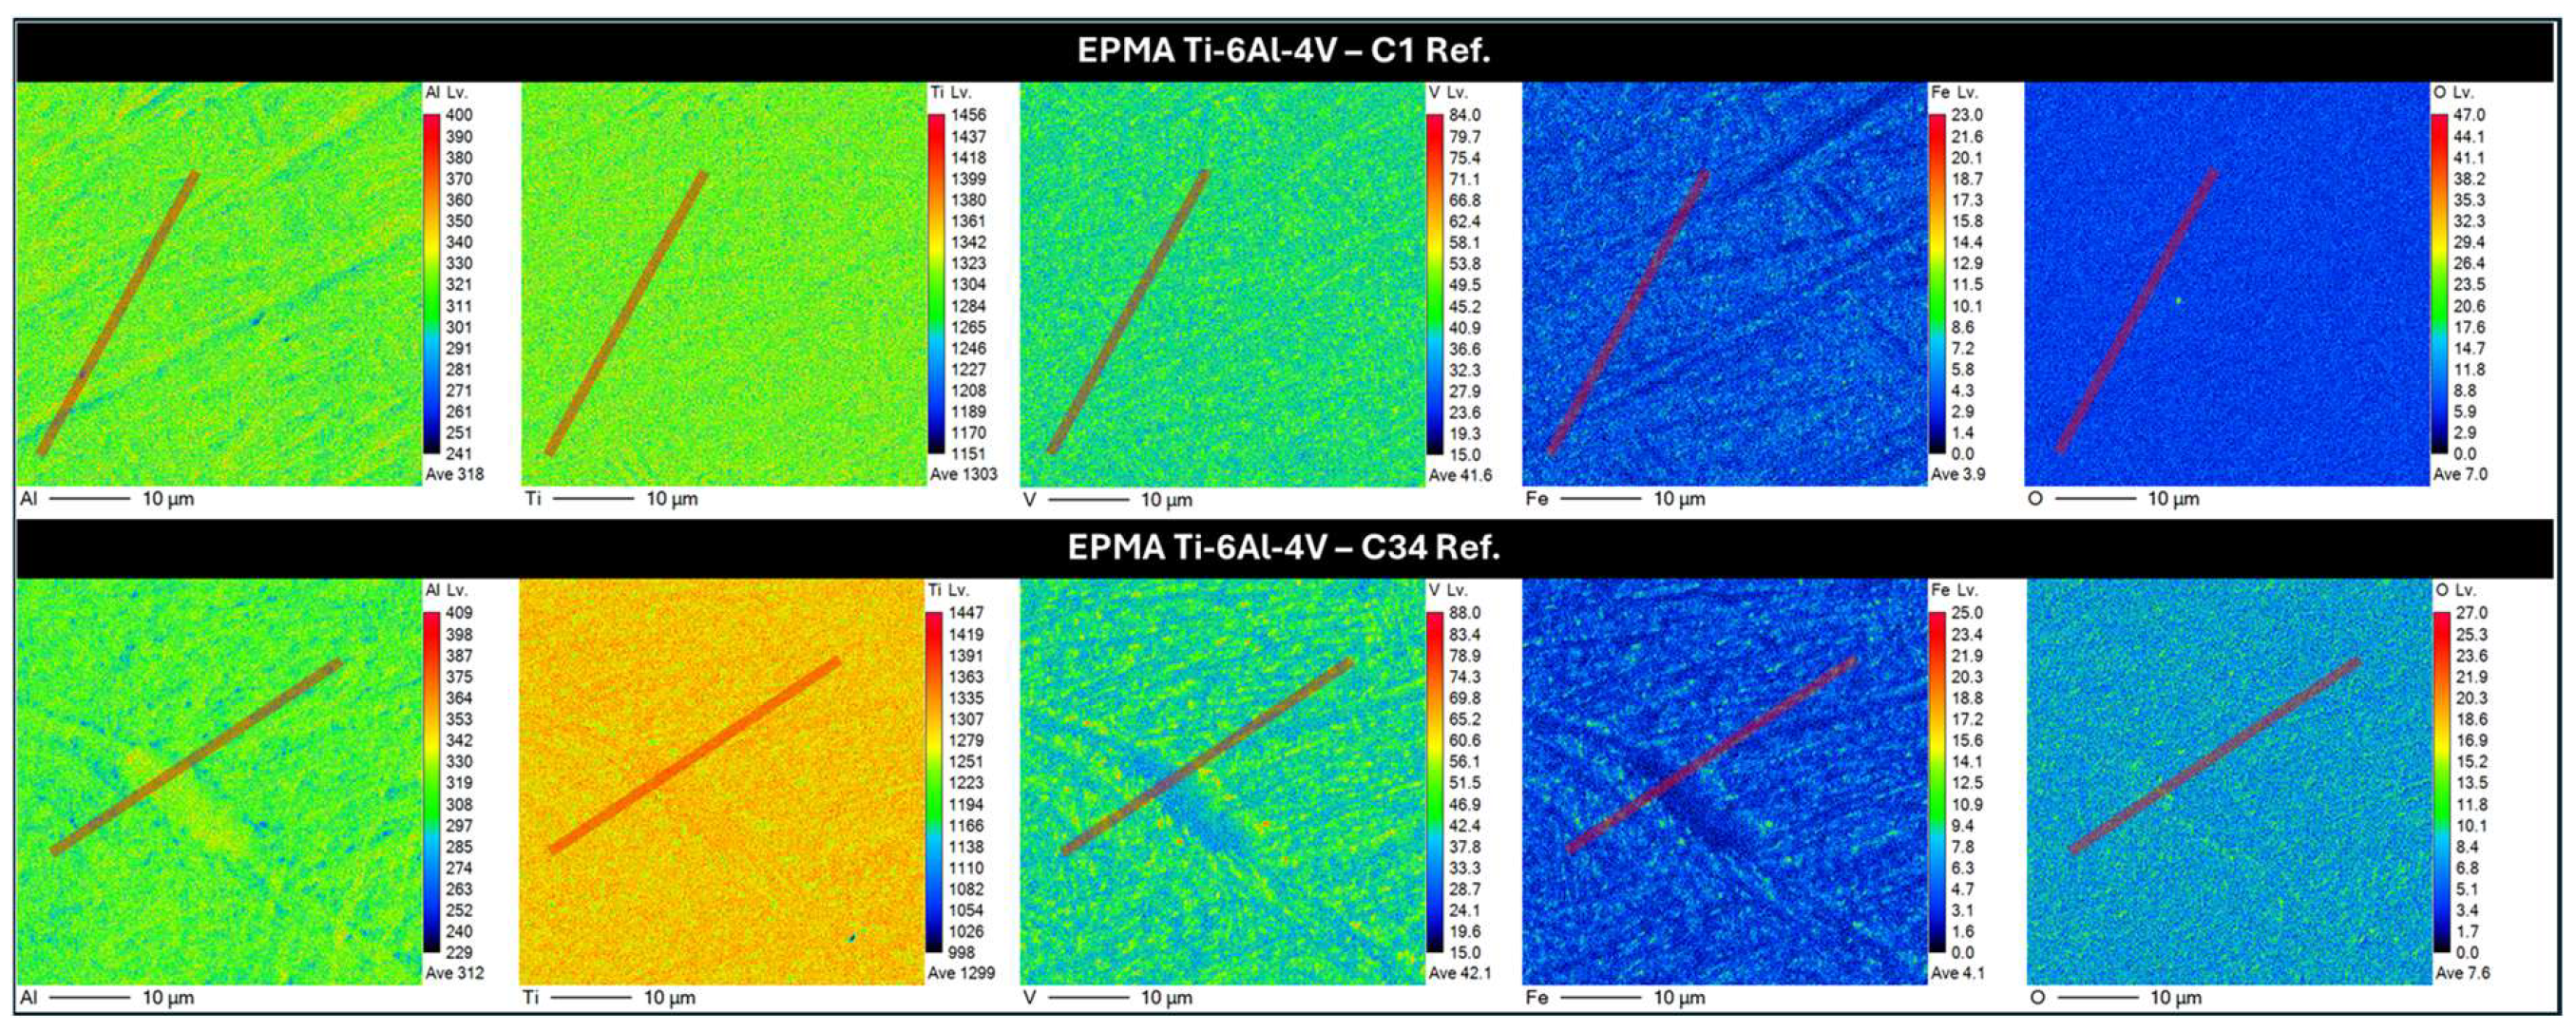
The areas selected for SKPFM mapping were also analyzed by EPMA (Figure 7). Volta potential profiles revealed differences of up to 100 mV across the melt pool border in the C1 specimen and across a large α-grain in C34, which was also located at a melt pool border. This indicates that both locations are more susceptible to localized corrosion, even though these differences are below typically reported limiting values for microgalvanic corrosion (e.g., >150–200 mV) [25].
For both C1 and C34 builds, the EPMA elemental maps at the melt pool borders (Figure 7) confirmed that the interior of the α-grains is rich in Al (which correlates with the EDS analysis in Figure 6a,b insets), while the sub-micron-size β-grains surrounding the α-grains are rich in V and Fe. The affinity of Fe with β-Ti is due to both exhibiting the body-centered cubic structure, whereas α-Ti is hexagonal close-packed. It can also be seen that relatively large α-grains (~5 µm-wide) appear in the C34 build (Figure 6b), but not in C1 (Figure 6a). The borders of such grains appear to accommodate bigger and more numerous β-phase grains.
As shown in Figure 6b, the Volta potential of the large α-grain is lower than the surrounding matrix, indicating its anodic behavior. The β-Ti-phase particles tend to exhibit even stronger anodic behavior, which could be associated with Fe enrichment, as indicated by EPMA and TEM analyses. This is opposite to what is normally observed in conventional Ti-6Al-4V alloy (i.e., cathodic behavior of the β-phase [26]). Further studies of polished and non-etched specimens are needed in the future to elucidate the electrochemical activity of the β-phase.

3.3. Corrosion Evaluation

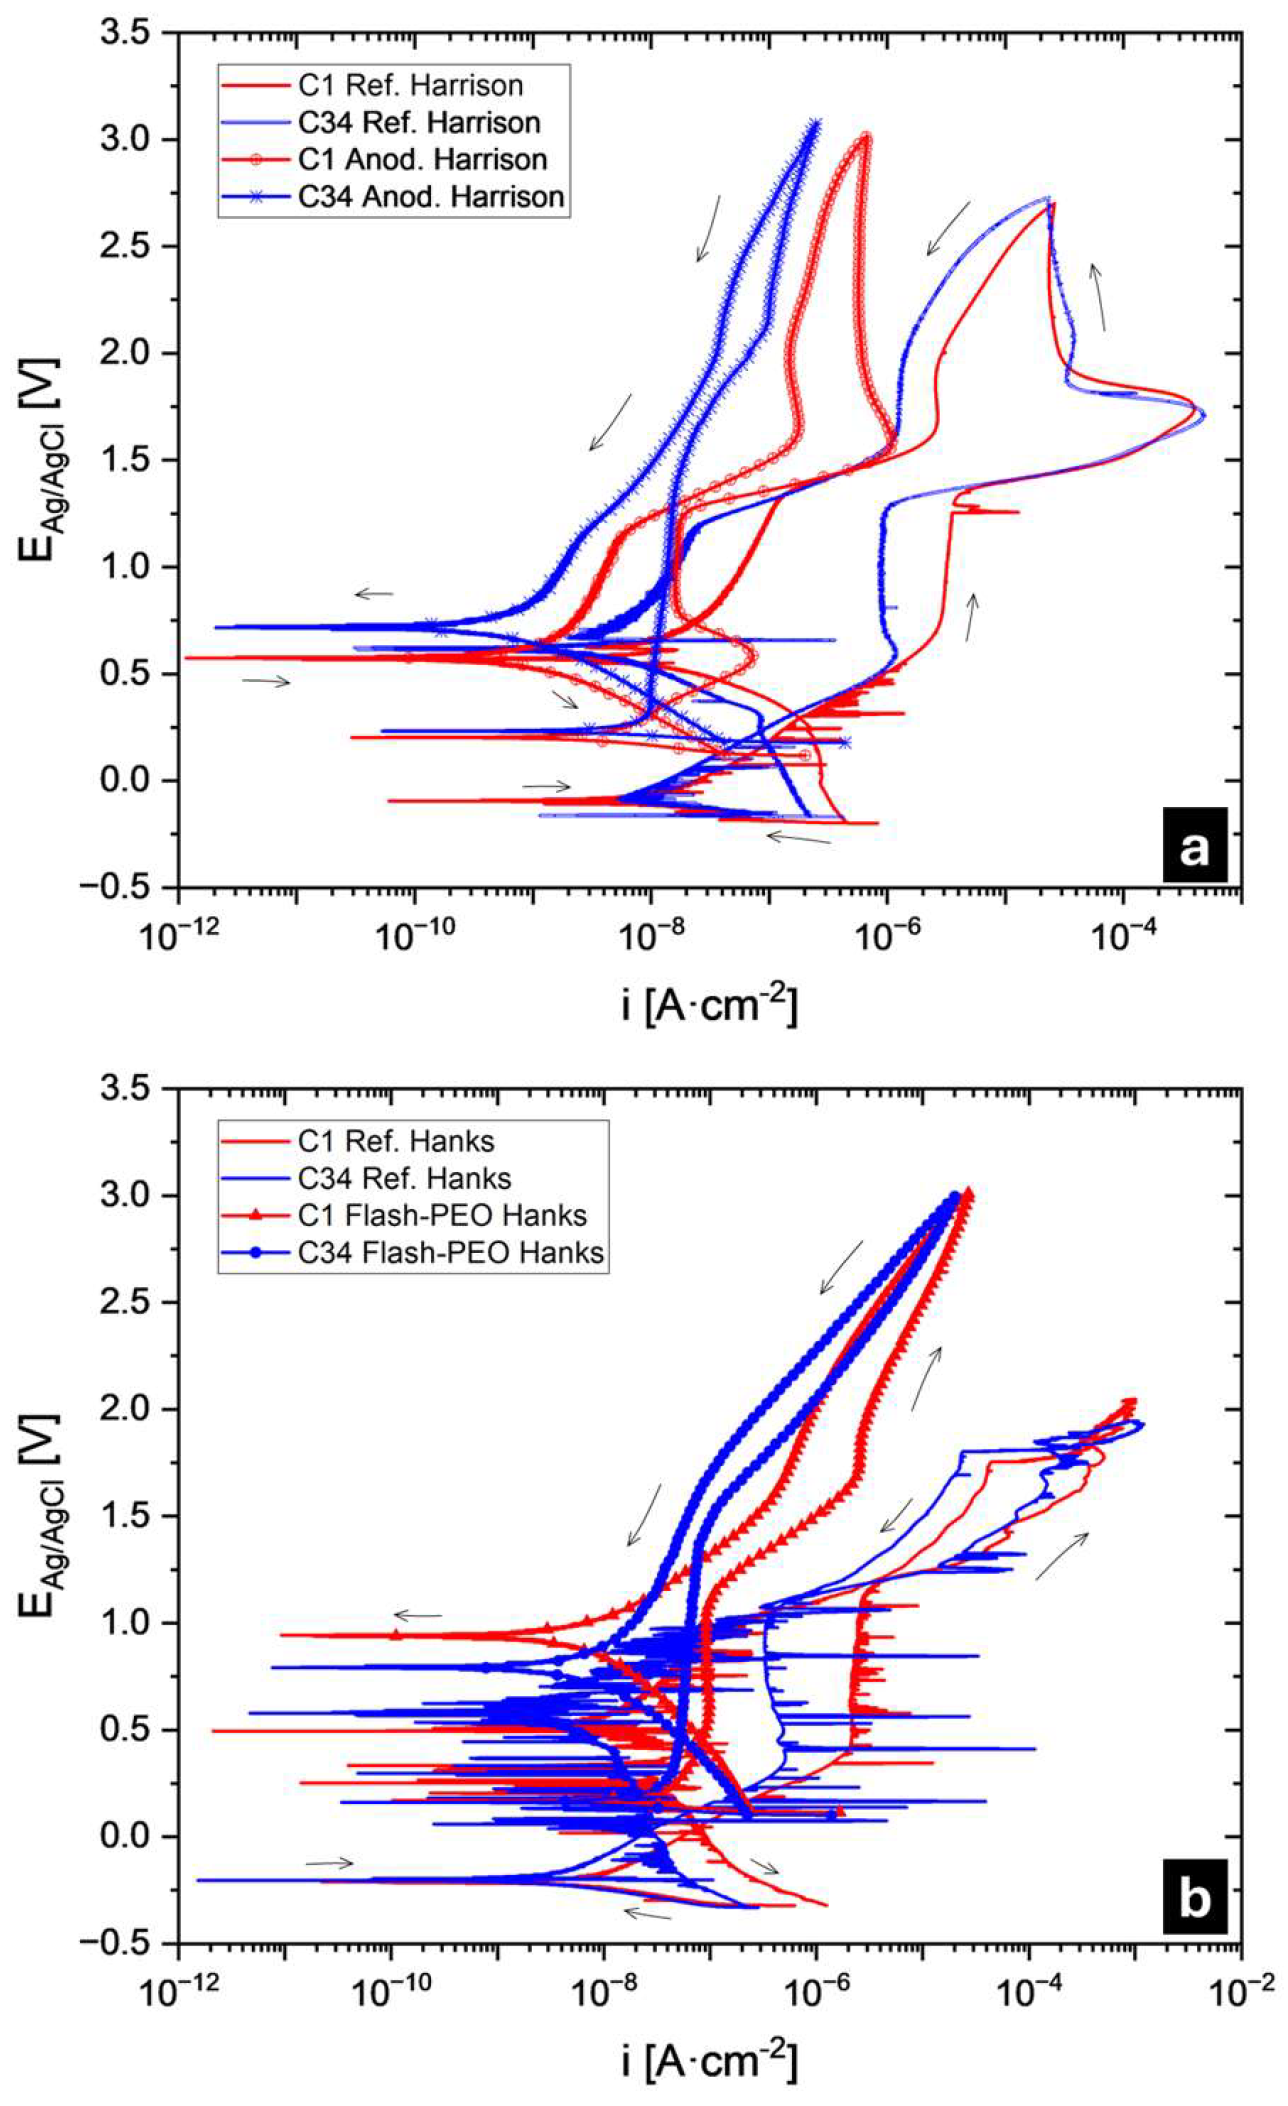
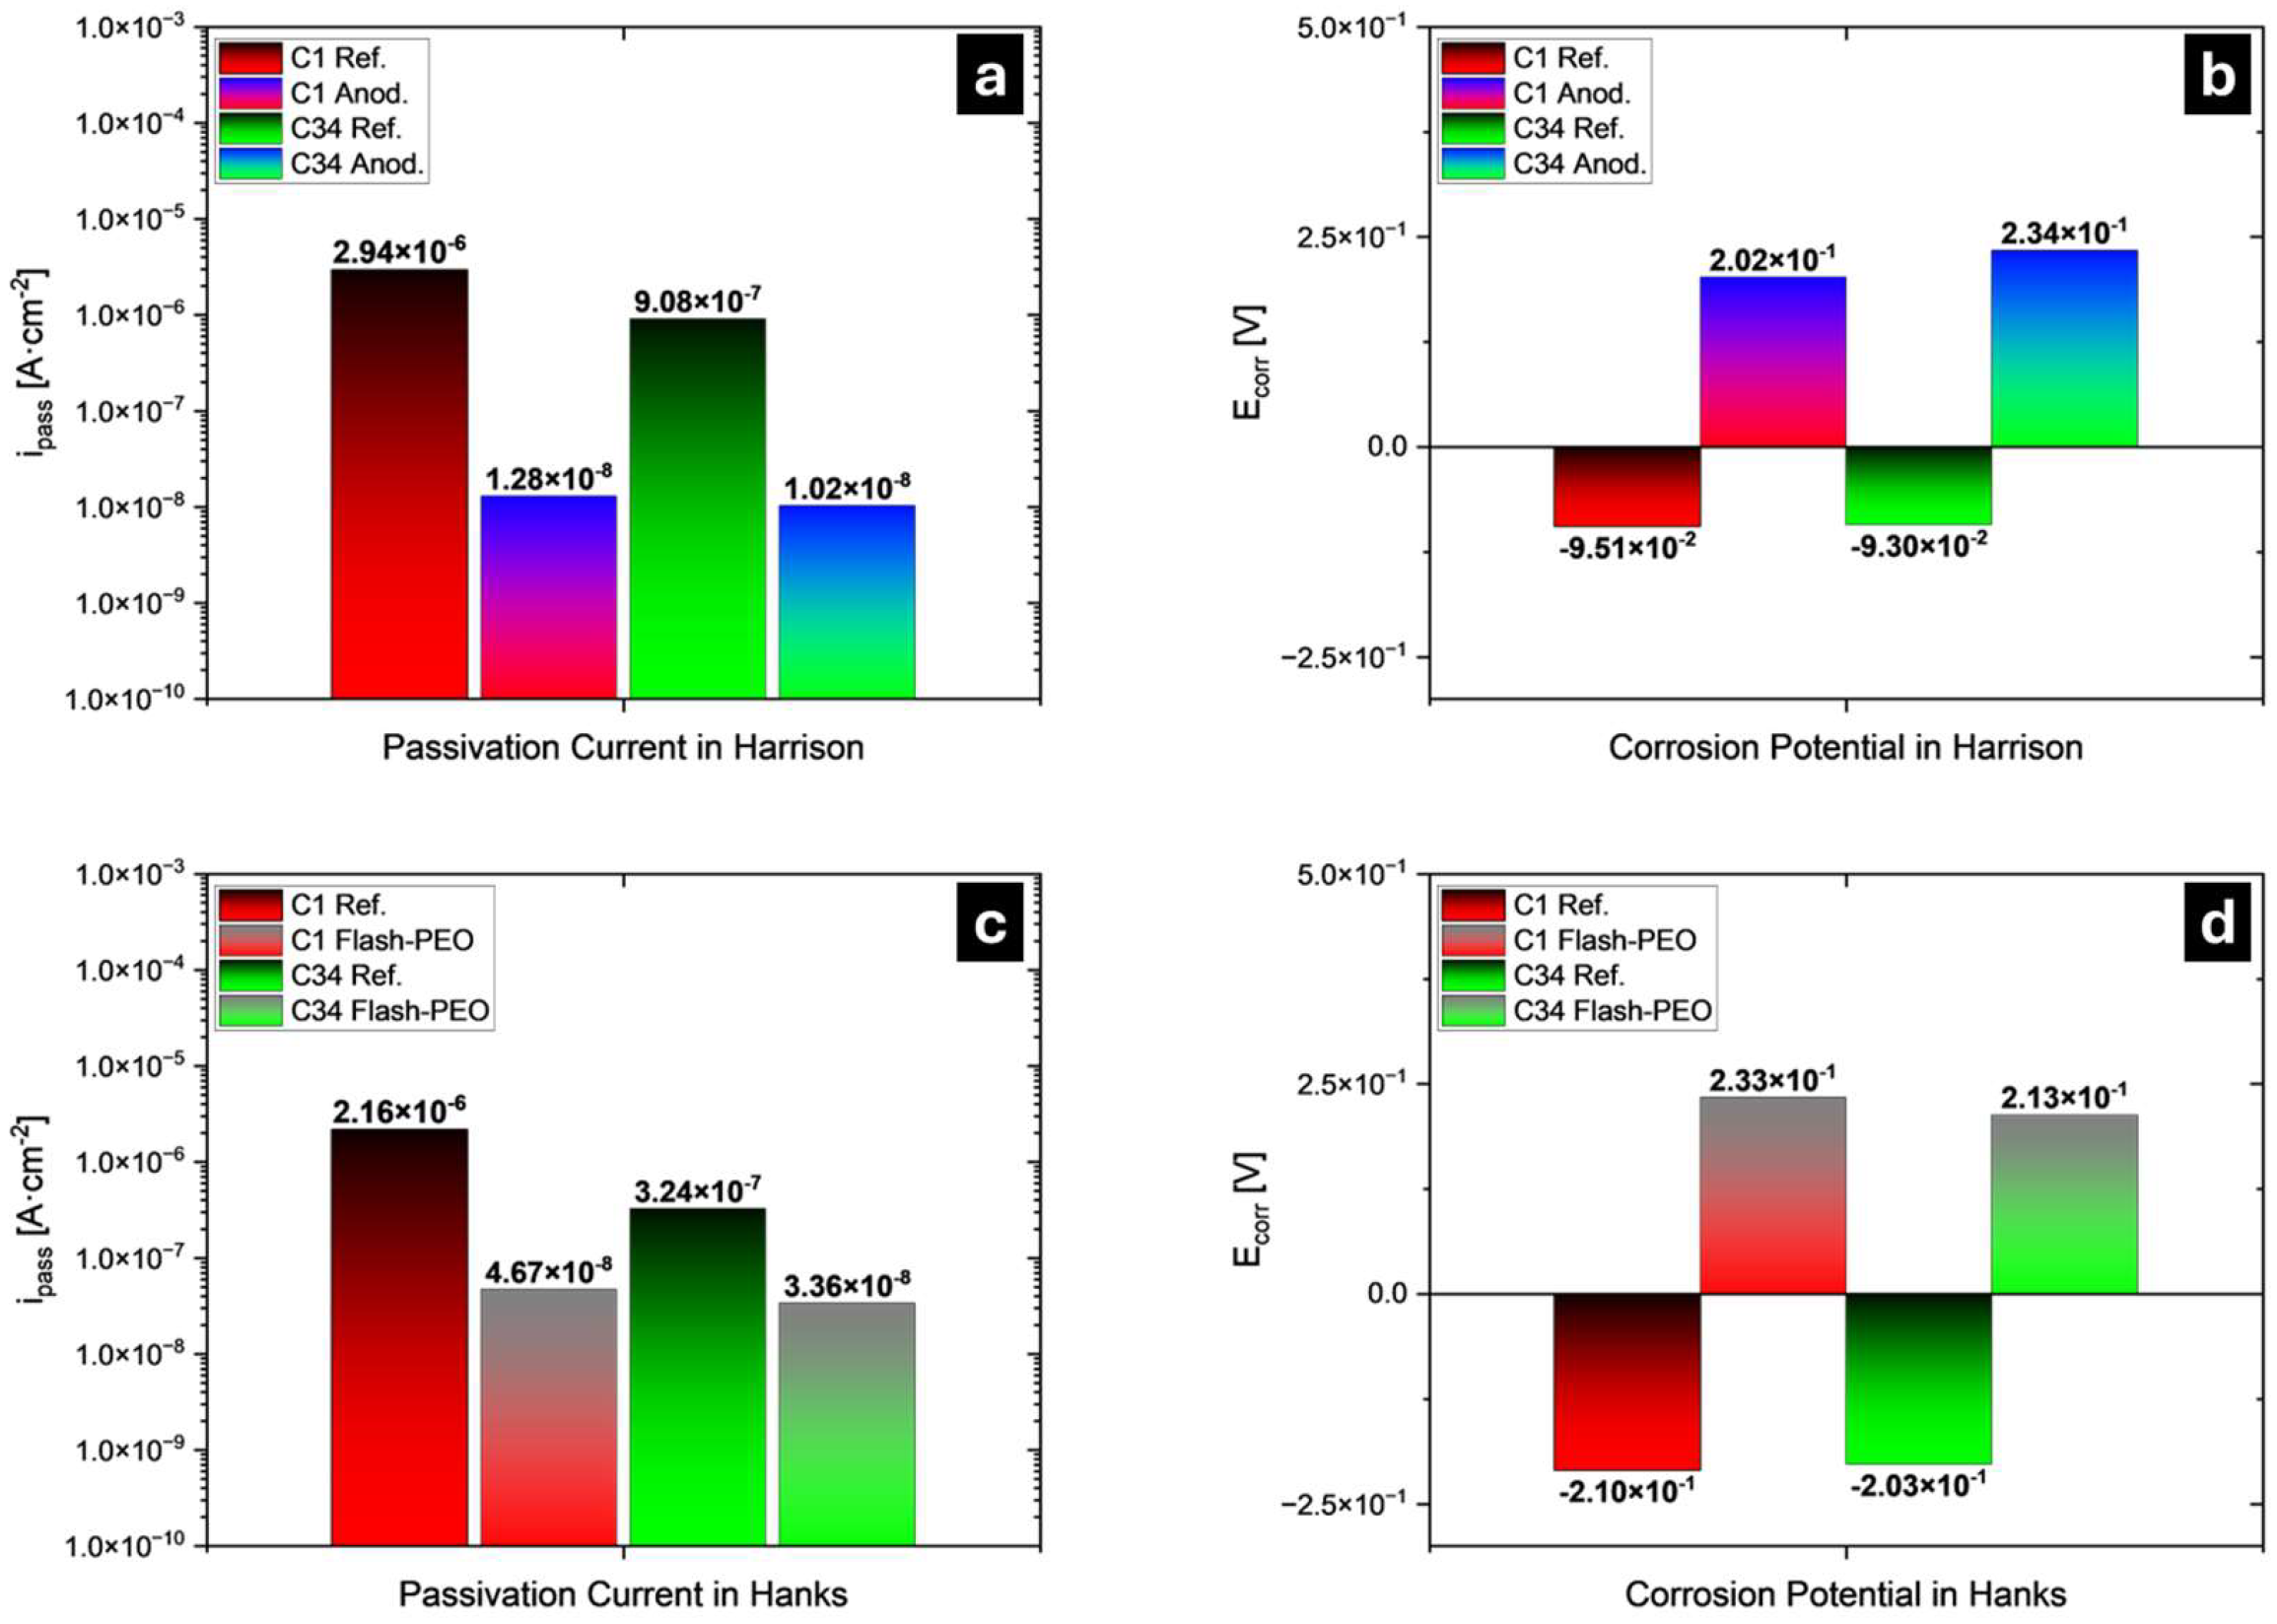
Figure 8 shows the cyclic PDP curves for non-coated and coated AM Ti-6Al-4V ELI samples obtained in Harrison’s solution (a) and Hanks’ solution (b) after 1 h of OCP stabilization, to illustrate the powder reuse and surface treatment effects on surface passivity. The corrosion potential (Ecorr) and passive current density (ipass) values obtained from cyclic PDP curves analysis can be seen in Figure 9a–d.
In Harrison’s solution, build C34 exhibits approximately one order of magnitude lower passive current density (at 0.75–1.25 VAg/AgCl potential range) than build C1 (Figure 9a). In the anodized state, the passive current is reduced by two orders of magnitude and shows lower values for build C34 than for build C1. Additionally, the passive potential range is much wider for build C34. As expected, the corrosion potential for both anodized samples (Figure 9b) becomes positive compared with the untreated samples.
The increased passivity is probably related to the oxygen uptake by the powder after 34 cycles of reuse (0.14 vs. 0.11 wt.% O), improving the anticorrosion properties of the surface passive film. The uptake occurred because no powder refreshment was done between cycles C28 and C34 (Supplementary Materials, Table S1). Additionally, a higher α/β ratio would be expected in the microstructure, since oxygen is an α stabilizer. Indeed, Figure 6 suggests an increased proportion of large α plates in C34 (further studies are needed to confirm this hypothesis). An increased amount of α-phase is known to improve the corrosion resistance of α-β titanium alloys.
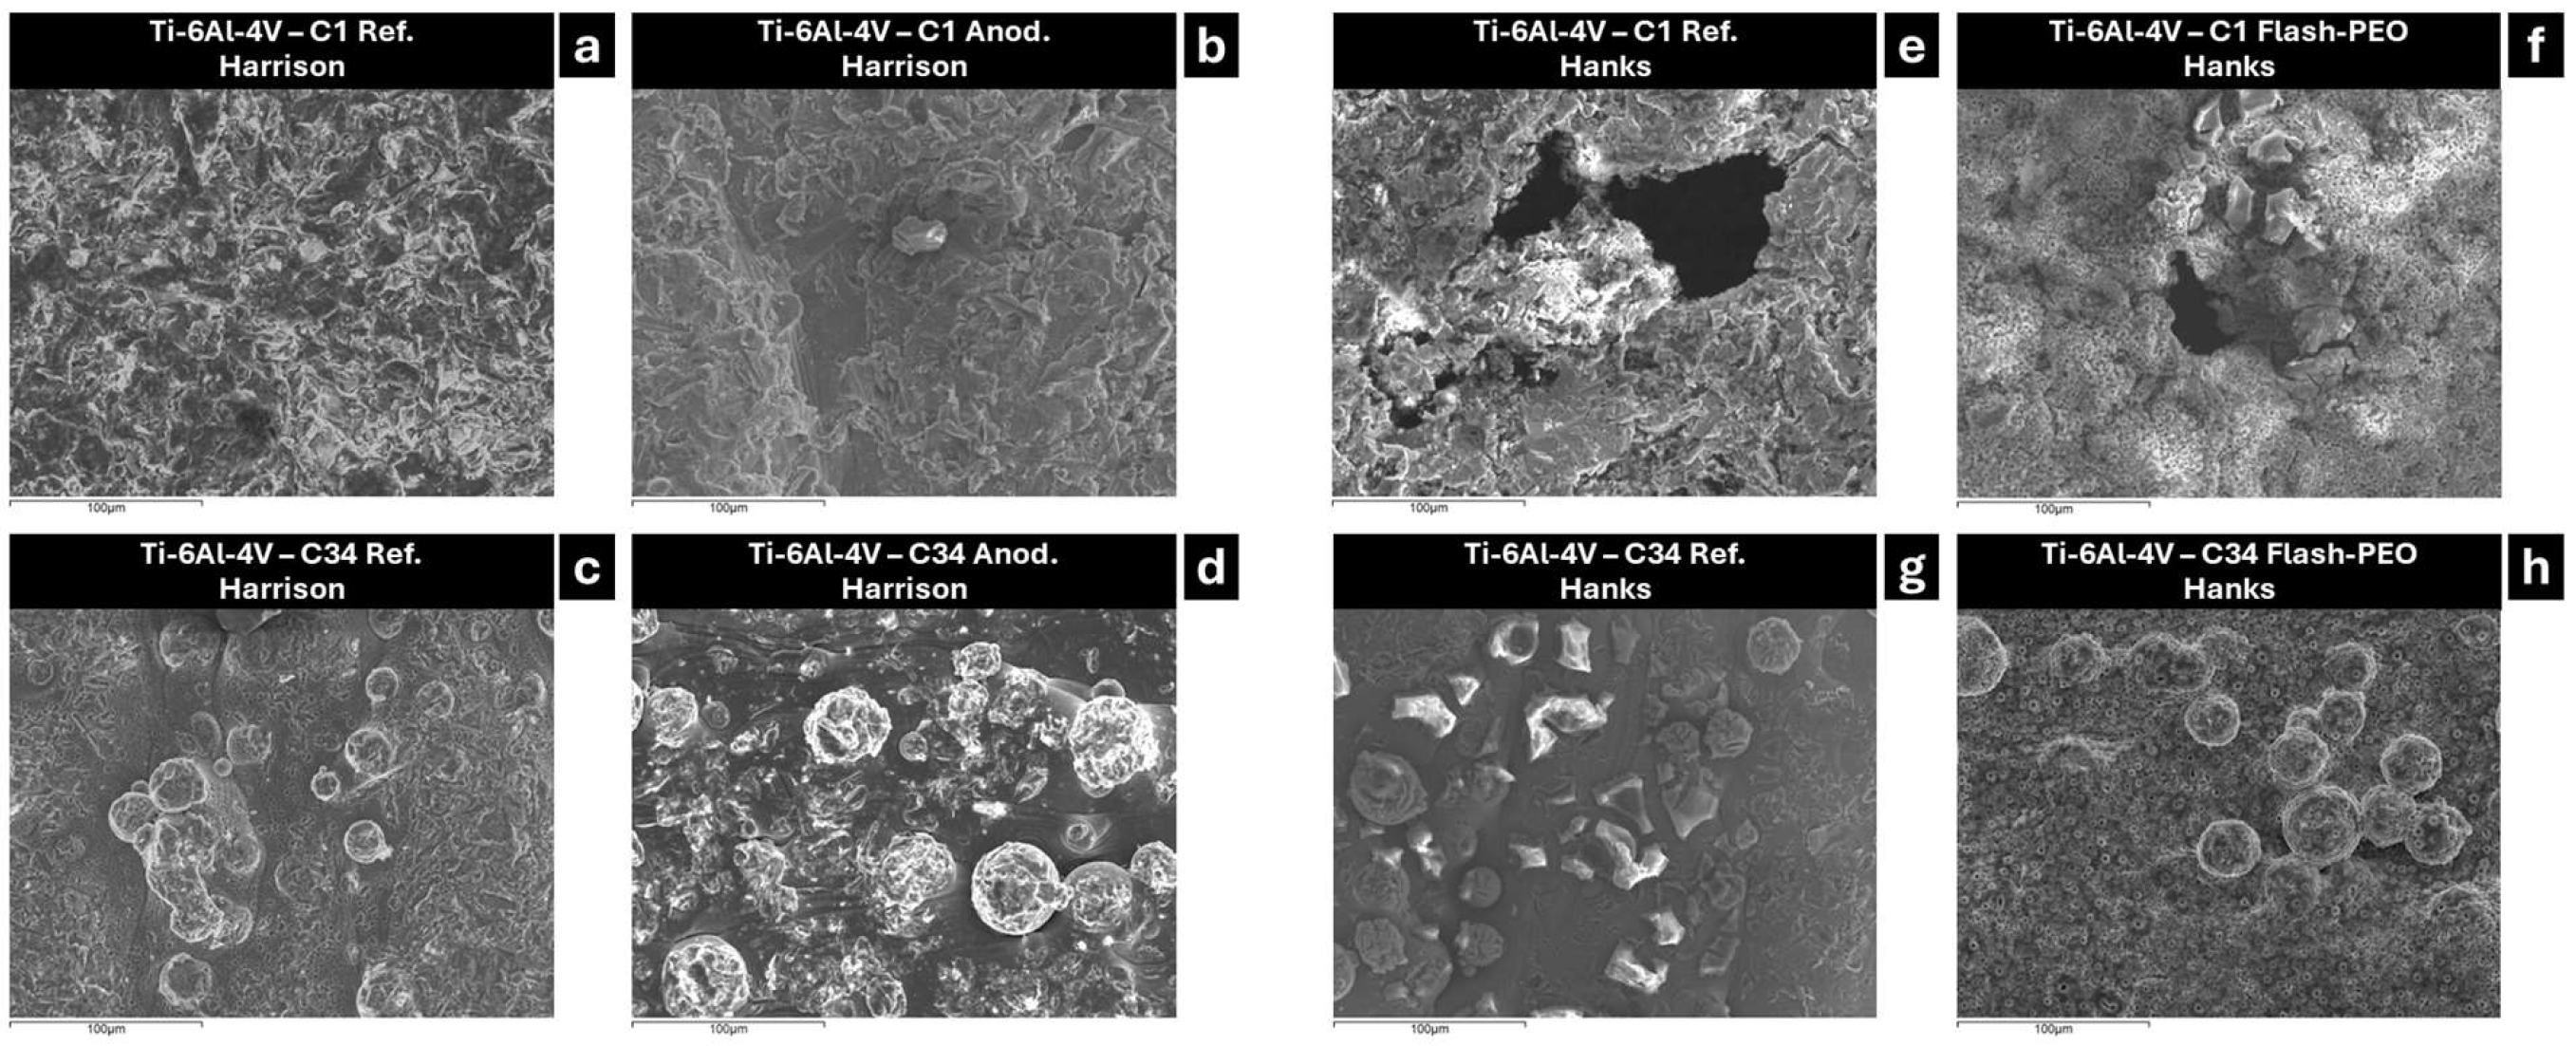
Both untreated and anodized systems exhibit brief transpassive behavior above ~1.25 V due to the onset of the O2 evolution reaction (4OH → O2 + 2H2O + 4e for neutral medium). This is followed by a second passive region related to a thickening of the oxide film that makes the electron transfer difficult and effectively suppresses the hydroxyl oxidation. It is evident that the transpassive region is much less pronounced for the anodized C34 build. The current densities are overall lower than for C1, which is indicative of the formation of a thicker oxide film that acts as an effective barrier against charge transfer. No pitting potential was observed in Harrison’s solution for any of the systems, which is corroborated by postcorrosion SEM examination of the surface (Figure 10a–d, Table 3).
The cyclic PDP curves in Hanks’ solution for untreated samples were noisy across a wide potential range (Figure 8b), which may reflect metastable oxide dissolution and concurrent precipitation of Ca-P species from the corrosive environment [16,17,18]. As evidenced by small hysteresis loops in the PDPs, C1 and C34 builds undergo pitting at >1.75 V and quickly repassivate as the polarization is reversed (see the lower current densities during the reversed scan). Pitting was confirmed by SEM examination (Figure 10e,g). The affected areas feature typical Ca-P precipitates and NaCl residue (Table 3).
Cyclic PDP curves for Flash-PEO-treated C1 and C34 builds exhibit ~1 and ~2 orders of magnitude lower passive current densities than the untreated samples, respectively (Figure 9c). Similarly to anodized samples, the corrosion potential for both Flash-PEO systems (Figure 9d) is positive and more noble than that of untreated ones. Additionally, the passivity region in the C34 sample is approximately 500 mV wider.
As seen in micrographs shown in Figure 10f,h, C34 Flash-PEO is practically unaffected by localized damage in Hanks’ solution compared with C1 Flash-PEO. In the case of C1, one of the measurements manifested crevice corrosion near the rubber seal of the electrochemical cell (Figure 10f) that initiated above 2.6 V (Supplementary Figure S2).
Table 3 shows the elemental composition from area-scan EDS analysis of the samples after polarization in both Harrison’s and Hanks’ solutions. In general terms, the compositions remained essentially unchanged compared to the area-scan EDS analysis before corrosion (Table 2). In particular, the untreated and anodized samples were unaffected by Harrison’s solution, indicating excellent corrosion resistance. In contrast, the C1 Flash-PEO exhibited compositional changes in Hanks’ solution, which may indicate partial leaching of P and Ca from the coating with consequent exposure of the Al present in the substrate. The C34 Flash-PEO coating remained compositionally stable (Δ ≤ 0.3 wt.% for main elements).
In summary, the C34 build exhibits enhanced passivity in comparison to C1 both in Harrison’s and Hanks’ solutions, which may be related to increased interstitial O and/or differences in surface condition, but further work is required to isolate the powder reuse effect. Regardless of the number of powder reuse cycles, Ti-6Al-4V ELI is susceptible to localized corrosion at high polarization in Hanks’ solution, but not in Harrison’s. The alloy can be effectively protected by Flash-PEO against localized corrosion in Hanks’ medium under the selected test conditions, warranting further biological investigations of this treatment.

4. Conclusions

Powder composition analysis revealed a progressive increase in the O and N content, reaching 0.14 and 0.014 wt.% after 34 cycles of demand-based continuous powder refreshment. The detected levels are within acceptable limits for the ASTM F3001-14 (2021) standard. The distribution of interstitial and other alloying elements across the melt pool borders did not show significant variations, although Volta potential differences reached ~100 mV at these locations in both the C1 and C34 builds, which could facilitate localized corrosion.
The C34 condition showed lower passive current densities both in Harrison’s and Hanks’ solutions. Enhanced passivity was also observed following anodizing and Flash-PEO treatments. Regardless of the number of powder reuse cycles, the alloy remained passive in Harrison’s solution but was susceptible to localized corrosion in Hanks’ solution.
Both the C1 and C34 conditions investigated here can be reliably anodized according to EN 2808:1997 to form a blue-violet anodic film in <20 s, resulting in passive current densities on the order of 10 nA·cm−2 in the acid-rain-like medium used in this study. However, small changes in surface roughness with increasing number of cycles of powder reuse slightly influenced the voltage–current responses.
Flash-PEO effectively modifies the as-built and sandblasted AM surface topography, producing a ~5.5 µm thick hydrophilic (WCA 33–35°) oxide layer comprising a Ca- and P-enriched anatase/rutile matrix in 45 s. Neither the electrical response of the process nor the chemical composition of the coating is affected by the powder reuse cycles. The coating effectively protects the AM alloy against crevice corrosion in Hanks’ solution at potentials below 2.6 VAg/AgCl.

Supplementary Materials

The following supporting information can be downloaded at https://www.mdpi.com/article/10.3390/coatings16060655/s1: Figure S1: Estimated Al2O3 surface area occupancy on samples C1 and C34, obtained from SEM images using ImageJ software (version 1.54p). Scale bars represent 100 µm; Figure S2: PDP curve for the failed sample of Flash-PEO coated C1 condition; Table S1: Demand-based powder refreshment strategy; Table S2: Al2O3 particle size and area occupancy estimation from three randomly selected SEM image sectors per sample.

Author Contributions

Conceptualization, R.A. and E.M.; methodology, R.A. and E.M.; validation, R.A., E.M. and M.H.G.-M.; formal analysis, M.H.G.-M. and E.M.; investigation, M.H.G.-M.; resources, E.M.; data curation, M.H.G.-M. and E.M.; writing—original draft preparation, M.H.G.-M.; writing—review and editing, M.H.G.-M., E.M., R.A., M.M., M.I.B., J.D.G. and J.M.V.; supervision, E.M., R.A. and J.D.G.; project administration, R.A. and E.M.; funding acquisition, R.A., E.M. and J.M.V. All authors have read and agreed to the published version of the manuscript.

Funding

This work was funded by PLEC2023-010346 (MICIU/AEI/10.13039/501100011033), Spain. J.M. Vega also acknowledges the grant RYC2021-034384-I, funded by MICIU/AEI/10.13039/501100011033 and the European Union NextGenerationEU/PRTR.

Institutional Review Board Statement

Not applicable.

Informed Consent Statement

Not applicable.

Data Availability Statement

All data presented in this work will be made available through the Docta Complutense repository: https://docta.ucm.es/handle/20.500.14352/16.

Acknowledgments

The collaboration of Sara Sendino Mouliet (MADIT) in L-PBF process parameters and Miren Sarasola Inguez (Aubert & Duval) in powder analysis is gratefully acknowledged.

Conflicts of Interest

Author Javier Díaz-Gutiérrez is the CEO of Madit Metal S.L. The remaining authors declare that the research was conducted in the absence of any commercial or financial relationships that could be construed as a potential conflict of interest.

Abbreviations

The following abbreviations are used in this manuscript:
AFMAtomic Force Microscopy
AMAdditive Manufacturing/3D Printing
ASTMAmerican Society for Testing and Materials
EBMElectron Beam Melting
ECEddy-Current
EDSEnergy Dispersion Spectrometer
EDTAEthylenediaminetetraacetic Acid
EDXEnergy Dispersive X-Ray Analysis
ELIExtra-Low Interstitials
ENEuropean Norm
EPMAElectron Probe MicroAnalysis
Flash-PEOFlash-Plasma Electrolytic Oxidation
ICCDInternational Centre for Diffraction Data
ICPInductively Coupled Plasma
KPFMKelvin Probe Force Microscopy
LECOLaboratory Equipment Corporation (Light Elements Comp.)
L-PBFLaser-Powder Bed Fusion
OCPOpen-Circuit Potential
PBSPhosphate-Buffered Saline
PDPPotentiodynamic Polarization
PEOPlasma Electrolytic Oxidation
pHHydrogen Potential
PIPSPrecision Ion Polishing System
S10zTen-Point Height
SaArithmetical Mean Height
SEMScanning Electron Microscopy
SKPFMScanning Kelvin Probe Force Microscopy
SqQuadratic Average Height
STEMScanning Transmission Electron Microscopy
TEMTransmission Electron Microscopy
VmcCore Material Volume
VvcCore Void Volume
WCAWater Contact Angle
XRDX-Ray Diffraction

References

  1. Kobryn, P.A.; Semiatin, S.L. The laser additive manufacture of Ti-6Al-4V. JOM 2001, 53, 40–42. [Google Scholar] [CrossRef]
  2. Nguyen, H.D.; Pramanik, A.; Basak, A.K.; Dong, Y.; Prakash, C.; Debnath, S.; Shankar, S.; Jawahir, I.S.; Dixit, S.; Buddhi, D. A critical review on additive manufacturing of Ti-6Al-4V alloy: Microstructure and mechanical properties. J. Mater. Res. Technol. 2022, 18, 4641–4661. [Google Scholar] [CrossRef]
  3. Ni, C.; Zhu, J.; Zhang, B.; An, K.; Wang, Y.; Liu, D.; Lu, W.; Zhu, L.; Liu, C. Recent advance in laser powder bed fusion of Ti–6Al–4V alloys: Microstructure, mechanical properties and machinability. Virtual Phys. Prototyp. 2025, 20, e2446952. [Google Scholar] [CrossRef]
  4. ASTM F2924-14(2021); Standard Specification for Additive Manufacturing Titanium-6 Aluminum-4 Vanadium with Powder Bed Fusion. ASTM International: West Conshohocken, PA, USA, 2021. [CrossRef]
  5. ASTM F3001-14(2021); Standard Specification for Additive Manufacturing Titanium-6 Aluminum-4 Vanadium ELI (Extra Low Interstitial) with Powder Bed Fusion. ASTM International: West Conshohocken, PA, USA, 2021. [CrossRef]
  6. European Union Aviation Safety Agency. Certification Memorandum: Additive Manufacturing; European Union Aviation Safety Agency: Cologne, Germany, 2025; Available online: https://www.easa.europa.eu/en/document-library/product-certification-consultations/additive-manufacturing#group-easa-downloads (accessed on 25 May 2026).
  7. U.S. Department of Transportation/Federal Aviation Administration. Advisory Circular 33.15-3: Powder Bed Fusion Additive Manufacturing Process for Aircraft Engine Parts; U.S. Department of Transportation/Federal Aviation Administration: Washington, DC, USA, 2023. [Google Scholar]
  8. AMS7003A; Laser Powder Bed Fusion Process; SAE International: Warrendale, PA, USA, 2022. [CrossRef]
  9. Meier, B.; Warchomicka, F.; Ehgartner, D.; Schuetz, D.; Angerer, P.; Wosik, J.; Belei, C.; Petrusa, J.; Kaindl, R.; Waldhauser, W.; et al. Toward a sustainable laser powder bed fusion of Ti 6Al 4V: Powder reuse and its effects on material properties during a single batch regime. Sustain. Mater. Technol. 2023, 36, e00626. [Google Scholar] [CrossRef]
  10. Yánez, A.; Fiorucci, M.P.; Martel, O.; Cuadrado, A. The Influence of Dimensions and Powder Recycling on the Roughness and Mechanical Properties of Ti-6Al-4V Parts Fabricated by Laser Powder Bed Fusion. Materials 2022, 15, 5787. [Google Scholar] [CrossRef] [PubMed]
  11. Tang, H.P.; Qian, M.; Liu, N.; Zhang, X.Z.; Yang, G.Y.; Wang, J. Effect of Powder Reuse Times on Additive Manufacturing of Ti-6Al-4V by Selective Electron Beam Melting. JOM 2015, 67, 555–563. [Google Scholar] [CrossRef]
  12. Shah, H.H.; Tregambi, C.; Bareschino, P.; Pepe, F. Environmental and economic sustainability of additive manufacturing: A systematic literature review. Sustain. Prod. Consum. 2024, 51, 628–643. [Google Scholar] [CrossRef]
  13. Soltani-Tehrani, A.; Isaac, J.P.; Tippur, H.V.; Silva, D.F.; Shao, S.; Shamsaei, N. Ti-6Al-4V powder reuse in laser powder bed fusion (L-PBF): The effect on porosity, microstructure, and mechanical behavior. Int. J. Fatigue 2023, 167, 107343. [Google Scholar] [CrossRef]
  14. Sun, X.; Chen, M.; Liu, T.; Zhang, K.; Wei, H.; Zhu, Z.; Liao, W. Characterization, preparation, and reuse of metallic powders for laser powder bed fusion: A review. Int. J. Extrem. Manuf. 2024, 6, 012003. [Google Scholar] [CrossRef]
  15. Warner, J.H.; Ringer, S.P.; Proust, G. Strategies for metallic powder reuse in powder bed fusion: A review. J. Manuf. Process. 2024, 110, 263–290. [Google Scholar] [CrossRef]
  16. de Damborenea, J.J.; Arenas, M.A.; Larosa, M.A.; Jardini, A.L.; de Carvalho Zavaglia, C.A.; Conde, A. Corrosion of Ti6Al4V pins produced by direct metal laser sintering. Appl. Surf. Sci. 2017, 393, 340–347. [Google Scholar] [CrossRef]
  17. Mora-Sanchez, H.; Pixner, F.; Buzolin, R.; Mohedano, M.; Arrabal, R.; Warchomicka, F.; Matykina, E. Combination of Electron Beam Surface Structuring and Plasma Electrolytic Oxidation for Advanced Surface Modification of Ti6Al4V Alloy. Coatings 2022, 12, 1573. [Google Scholar] [CrossRef]
  18. Mora-Sanchez, H.; Ramos, C.; Mohedano, M.; Torres, B.; Arrabal, R.; Matykina, E. Flash plasma electrolytic oxidation and electrochemical behaviour in physiological media of additive manufacturing Ti6Al4V alloy. Trans. Nonferrous Met. Soc. China 2024, 34, 1150–1166. [Google Scholar] [CrossRef]
  19. Cely-González, A.; Pineda-Triana, Y.; Gómez-Puentes, O. Anodization of Ti6Al4V alloy manufactured by 3D printing and evaluation of corrosion and wear properties. DYNA 2022, 89, 76–83. [Google Scholar] [CrossRef]
  20. Carolo, L.C.B.; Cooper O, R.E. A review on the influence of process variables on the surface roughness of Ti-6Al-4V by electron beam powder bed fusion. Addit. Manuf. 2022, 59, 103103. [Google Scholar] [CrossRef]
  21. EN 2808:1997; Aerospace Series—Anodizing of Titanium and Titanium Alloys. European Committee for Standardization: Brussels, Belgium, 1997. [CrossRef]
  22. Sul, Y.-T.; Johansson, C.B.; Jeong, Y.; Albrektsson, T. The electrochemical oxide growth behaviour on titanium in acid and alkaline electrolytes. Med. Eng. Phys. 2001, 23, 329. [Google Scholar] [CrossRef]
  23. Welch, B.L. The generalization of ‘student’s’ problem when several different population variances are involved. Biometrika 1947, 34, 28–35. [Google Scholar] [CrossRef] [PubMed]
  24. Liu, Y.-M.; Wu, Z.-Q.; Bao, S.; Guo, W.-H.; Li, D.-W.; He, J.; Zeng, X.-B.; Huang, L.-J.; Lu, Q.-Q.; Guo, Y.-Z.; et al. The Possibility of Changing the Wettability of Material Surface by Adjusting Gravity. Research 2020, 2020, 2640834. [Google Scholar] [CrossRef] [PubMed]
  25. Benzing, J.T.; Maryon, O.O.; Hrabe, N.; Davis, P.H.; Hurley, M.F.; DelRio, F.W. Impact of grain orientation and phase on Volta potential differences in an additively manufactured titanium alloy. AIP Adv. 2021, 11, 025219. [Google Scholar] [CrossRef] [PubMed]
  26. Lorenzi, S.; Nani, L.; Persico, T.; Lombardi, M.; Sarasini, F.; Sergi, C.; Cabrini, M. A comparative study on the corrosion resistance of Ti-6Al-4V produced via material extrusion and other additive manufacturing technologies. npj Mater. Degrad. 2026, 10, 32. [Google Scholar] [CrossRef]
Figure 1. Ti-6Al-4V ELI L-PBF additive manufacturing process sketch.
Coatings 16 00655 g001
Figure 2. Electrical response for anodizing (a,b) and Flash-PEO (c,d).
Coatings 16 00655 g002
Figure 3. Roughness parameters (a,b); water contact angle including statistical significance *** → p < 0.001 and ns → p ~ 0.78 (c); and surface morphology for C1 (df) and for C34 (gi) without and with coating, respectively; cross-sectional TEM micrograph of the anodic film (j); cross-sectional backscattered electron micrograph of Flash-PEO coating (k), featuring embedded Al2O3 sandblast particles. Numbers above columns in a, b and c correspond to the measured values for each parameter.
Coatings 16 00655 g003
Figure 4. XRD diffractograms for reference samples C1 and C34 (a), anodizing samples (b) and Flash-PEO samples (c).
Coatings 16 00655 g004
Figure 5. STEM micrographs for C1 sample: Detail of Ti phases (a); EDS maps (b) corresponding to (a); detail of stacking faults in α’-Ti phase (c); EDS characterization of β-Ti phase in at.% (d).
Coatings 16 00655 g005
Figure 6. Optical micrographs (top row) showing the locations of the SKPFM measurements, and corresponding topographic and Volta potential maps (middle row) and profiles (bottom row) for Ti-6Al-4V Cycle 1 (a) and Cycle 34 (b). EDS (Spec. 1|Spec. 2) characterization in at.%. The indentation was used as a reference to locate the area of interest.
Coatings 16 00655 g006
Figure 7. EPMA compositional maps for C1 and C34 reference samples.
Coatings 16 00655 g007
Figure 8. Cyclic PDP curves for samples immersed in Harrison’s solution (a) and Hanks’ solution (b). Arrows show cycle orientation.
Coatings 16 00655 g008
Figure 9. Corrosion parameters for reference and anodized samples immersed in Harrison’s corrosive medium (a,b) and for reference and Flash-PEO samples immersed in Hanks’ solution (c,d).
Coatings 16 00655 g009
Figure 10. Morphology after Harrison’s corrosive medium immersion for C1 and C34 reference (a,c) and anodized (b,d) samples and after Hanks’ solution C1 and C34 reference (e,g) and Flash-PEO (f,h) samples.
Coatings 16 00655 g010
Table 1. AM Ti-6Al-4V ELI powder characterization for Cycle 1 and Cycle 34 (wt.%).
ElementsTiAlVONCHFeYS
MethodICPICPICPLECOLECOLECOLECOICPICPLECO
Cycle 189.16.54.10.11<0.0080.0110.00320.15<0.005<0.005
Cycle 2288.86.64.30.09<0.0080.008 0.0032 0.13 <0.0050.009 
Cycle 3489.06.64.10.140.0140.0080.00590.15<0.0050.007
* Max. Allow.------0.13 ± 0.020.03 ± 0.020.08 ± 0.020.0125 ± 0.0020.25 ± 0.10----
* ASTM F3001-14 (2021).
Table 2. Area-scan EDS analysis elemental composition in at.% for samples under study.
ElementsONaAlPCaTiV
C1 Ref.60.2--12.2----26.61.0
C1 Anod.60.6--10.5----27.71.2
C1 Flash-PEO65.60.73.46.76.915.90.7
C34 Ref.46.4--7.7----44.31.6
C34 Anod.50.5--5.9----41.91.7
C34 Flash-PEO67.90.61.86.85.616.60.7
Table 3. Area-scan elemental composition in at.% after immersion in corrosive media for C1 and C34 samples.
ElementsONaAlPClKCaTiV
C1 Ref. Harrison60.6--12.9--------25.41.1
C1 Anod. Harrison62.3--10.4--------26.11.2
C1 Ref. Hanks61.60.611.80.7----0.224.60.9
C1 Flash-PEO Hanks69.81.413.12.70.90.42.611.20.4
C34 Ref. Harrison41.4--8.3--------48.32.0
C34 Anod. Harrison50.4--6.0--------42.01.6
C34 Ref. Hanks64.62.40.70.40.30.30.331.11.2
C34 Flash-PEO Hanks69.60.71.96.7----5.615.00.5
Disclaimer/Publisher’s Note: The statements, opinions and data contained in all publications are solely those of the individual author(s) and contributor(s) and not of MDPI and/or the editor(s). MDPI and/or the editor(s) disclaim responsibility for any injury to people or property resulting from any ideas, methods, instructions or products referred to in the content.