Article

High-Temperature Fretting Fatigue Mechanisms and Microstructure-Sensitive Life Modeling of Laser-Clad IN718/WC Composite Coatings

1
College of Aviation Engineering, Civil Aviation Flight University of China, Guanghan 618307, China
2
Sichuan Flight Engineering Technology Research Center, Civil Aviation Flight University of China, Guanghan 618307, China
3
School of Aeronautics and Astronautics, Sichuan University, Chengdu 610065, China
*
Authors to whom correspondence should be addressed.
Coatings 2026, 16(2), 181; https://doi.org/10.3390/coatings16020181
Submission received: 27 December 2025 / Revised: 23 January 2026 / Accepted: 26 January 2026 / Published: 31 January 2026

Highlights

  • VHCFF tests show reduced fatigue strength with higher clamping force.
  • Cracks initiate in grains with a high Schmid factor, a large size, and a low elastic modulus.
  • Multi-variable FIP quantifies damage evolution linearly with cycles.

Abstract

Very-high-cycle fretting fatigue (VHCFF) behavior at elevated temperatures is critical for the safety and longevity of aerospace components. This study investigates the VHCFF mechanisms of laser-clad IN718/20%WC composite coatings at 650 °C. Fatigue tests were conducted to generate S-N data, and the resulting wear and fracture morphologies were characterized. Crack initiation was found to preferentially occur in grains exhibiting higher Schmid factors, lower elastic moduli, and larger equivalent sizes. To simulate fretting fatigue, a crystal plasticity finite element model (CPFEM) incorporating the actual microstructure was developed. An improved fatigue indicator parameter (FIP) was proposed, which integrates multiple physically significant factors including plastic strain, dislocation density, elastic modulus, and grain size. Life predictions based on a critical FIP value demonstrated high accuracy, with 97.6% of the results falling within a ±3.5 scatter band of the experimental data, confirming the model’s effectiveness in predicting crack initiation life.

1. Introduction

Fretting refers to the micro-scale movement that takes place between two surfaces in contact when subjected to cyclic loading [1]. This fretting contact can lead to high stress concentrations, significant accumulation of plastic strain, and extensive plastic deformation at the edges of the contact zone—all of which are factors that can trigger crack initiation [2]. The term “fretting fatigue” describes the entire process from crack initiation to eventual material failure [3]. Statistics from the U.S. Air Force show that more than one-sixth of fatigue-related failures in aero-engines are caused by fretting fatigue [4].
The aerospace industry frequently utilizes the Inconel 718 (IN718) alloy because of its remarkable mechanical characteristics [5], which include excellent fatigue resistance, structural integrity, and resistance to corrosion, even at high temperatures [6]. As a result, the fretting fatigue performance of IN718 has become a major focus of research for both academic institutions and industrial sectors [7].
In the early stages of fretting fatigue research, a primary approach to analyzing fretting fatigue behavior involved acquiring the morphological features of surface wear and the characteristics of fatigue fractures through experimental tests [8,9]. In recent years, with the advancement of material microstructure characterization technologies and the expansion of available characterization methods, microstructure analysis has been increasingly applied to explain the mechanisms of crack initiation in fretting fatigue [10,11,12,13]. For instance, Zhai et al. [13,14] and Zhu et al. [15] identified the Schmid factor, geometric compatibility factor, and twist angle between adjacent grains as the main factors influencing crack initiation. According to Han et al. [16], in nickel-based single-crystal superalloys the orientation of crystals influences the arrangement of geometrically necessary dislocations caused by the fretting loads. Their findings indicated that the direction of slip exhibiting the highest dislocation density aligned with the direction in which cracks were observed to initiate. Additionally, Villechaise et al. [17] effectively anticipated the activated slip systems by utilizing the axis of rotation related to plastic deformation and quantitatively assessed plastic strain at the microstructural level through lattice rotation data.
Various methods have been proposed for predicting fretting fatigue life, including empirical formulas for multiaxial fatigue [18], the theory of critical distance (TCD) [19], the critical plane method [20,21], and parameters for fretting damage [22]. In recent years, the crystal plasticity finite element method (CPFEM) has become increasingly favored owing to advancements in computational power. This technique is extensively utilized to investigate the microstructural mechanisms of fatigue in materials and to estimate their fatigue life [23,24]. For instance, Li et al. employed CPFEM to illustrate the macroscopic cyclic deformation of materials, uncover grain-level failure mechanisms [25], and assess the initiation life of creep-fatigue cracks in the IN718 alloy by considering accumulated energy dissipation as a fatigue damage parameter [26]. Additionally, Fan et al. [27] introduced a dislocation density parameter into the kinematic hardening rule to characterize the developmental traits of hysteresis loops and created creep-fatigue damage models for life expectancy predictions.
Given the high cost of replacing aero-engine components that fail due to fretting wear, laser cladding (LC) surface modification technology has emerged as a cost-effective solution for repairing and enhancing the performance of such components. Laser-clad layers offer advantages such as flexible coating thickness, dense microstructures, and strong metallurgical bonding with the matrix [28], making LC widely used in maintenance and repair applications [29].
The expected outcome of this study is to establish a microstructure-sensitive life prediction framework for laser-clad IN718/WC composite coatings under very-high-cycle fretting fatigue (VHCFF) at 650 °C. The scientific rationale for integrating laser cladding, microstructure characterization, and crystal plasticity finite element modeling (CPFEM) is to bridge the gap between process-induced microstructure and fatigue performance: laser cladding enables the fabrication of coatings with strong metallurgical bonding and tailored WC distribution; advanced characterization (SEM, EBSD) quantifies critical microstructural features (grain size, Schmid factor, elastic anisotropy); and CPFEM simulates the local stress–strain response and identifies crack initiation sites using a proposed fatigue indicator parameter (FIP). This combined approach allows us to uncover the underlying mechanisms of fretting fatigue crack initiation and achieve accurate life prediction, which provides a scientific basis for optimizing coating design and predicting the service life of critical high-temperature components.

2. Materials and Methods

2.1. VHCFF Experimental Setup

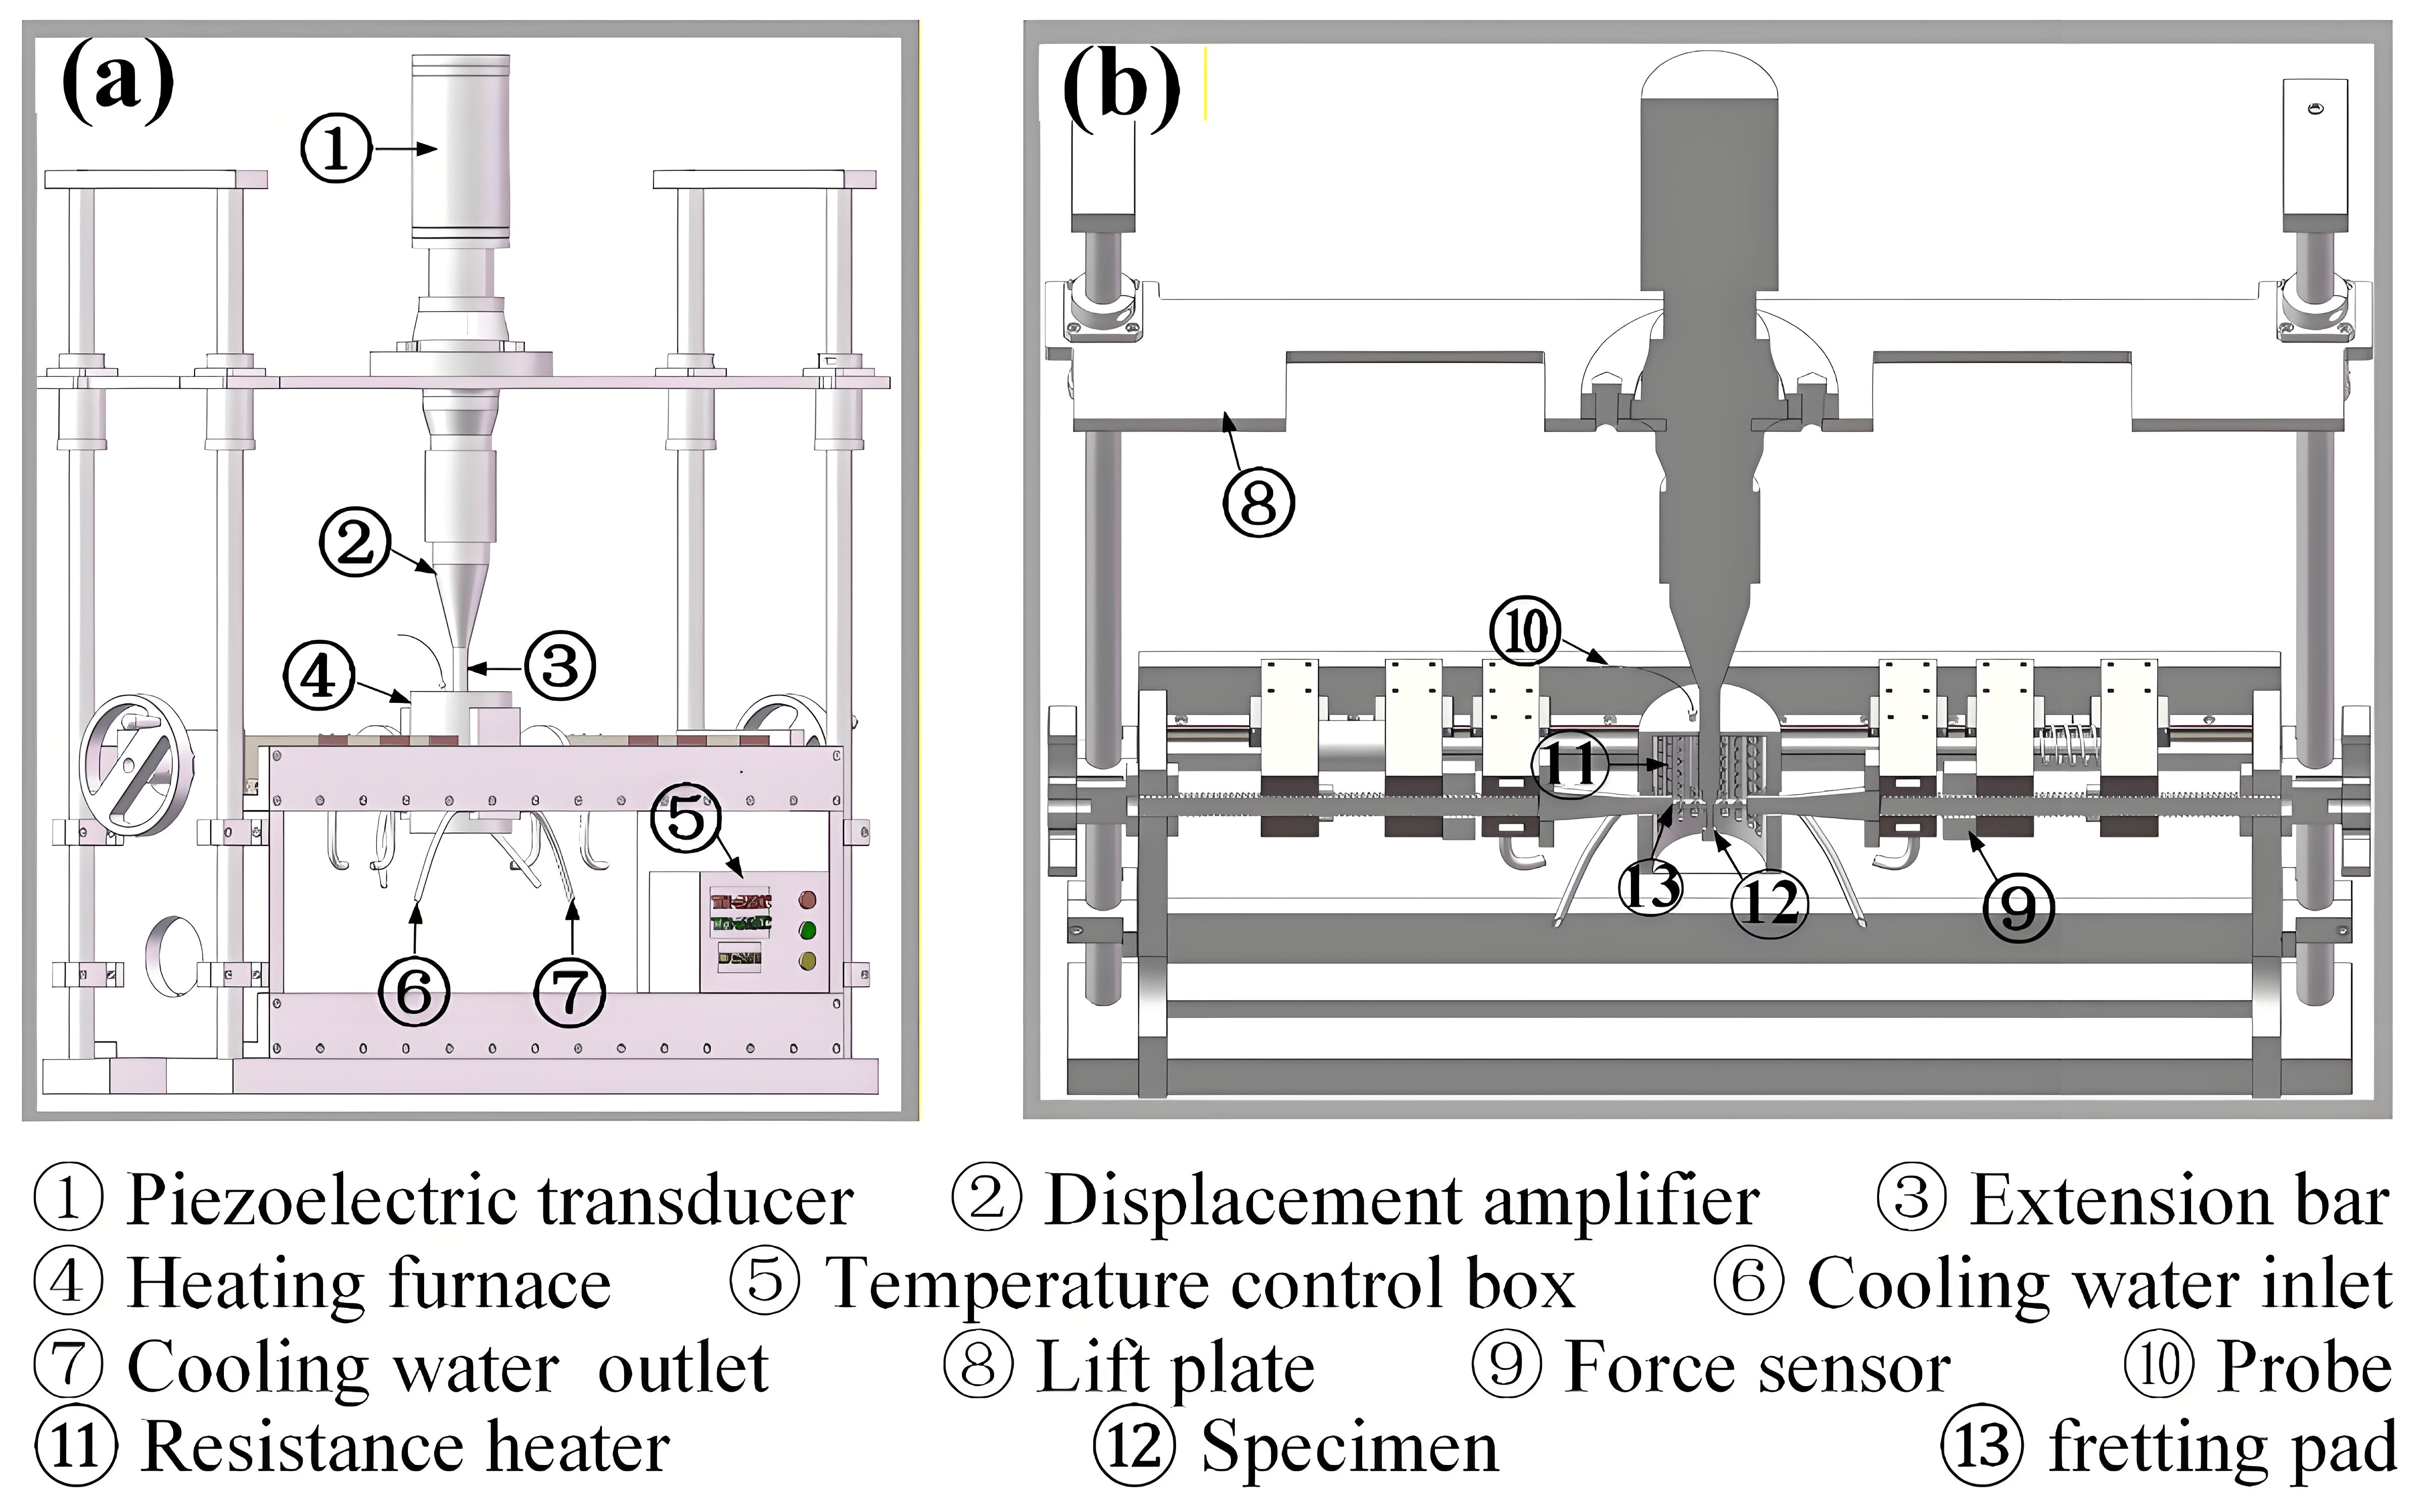
The VHCFF test setup was designed and implemented in strict accordance with the Chinese national standard GB/T 43896-2024 [30] “Metals and Alloys—Fatigue Testing—Ultrasonic Fatigue Testing Method”. It mainly consists of a computer control system, a piezoelectric transducer, an ultrasonic generator, a displacement amplifier, a high-temperature heating unit, a fretting clamping device (Figure 1), and auxiliary equipment (e.g., an air cooling system). The computer control system includes control software and data acquisition tools. The data acquisition device acts as a bridge between the system control software, ultrasonic fatigue power supply, and actuators (ultrasonic generator and piezoelectric transducer), and it comprises digital-to-analog (D/A) and analog-to-digital (A/D) converters.
The ultrasonic generator provides an excitation power source, converting standard 50 Hz AC signals into high-frequency electrical signals (20 ± 0.5 kHz) that are then transmitted to the piezoelectric transducer. The piezoelectric transducer converts these high-frequency electrical signals into mechanical vibration waves of the same frequency through the piezoelectric effect. A two-stage displacement amplifier is used to achieve a large range of vibration displacement; its amplification factor depends on the material and geometric dimensions of the amplifier. Notably, the first-stage amplifier also functions as a fixed actuator.
The fretting fixture and contact configuration were developed based on well-documented designs from prior fretting fatigue studies [31] to ensure the setup’s relevance to actual service conditions. The device for fretting clamping exerts a transverse force that is orthogonal to the specimen’s axis, which is tracked by a force sensor capable of measuring up to 2 kN. For high-temperature loading, a resistance wire furnace designed for high temperatures was installed on the fretting clamping apparatus. This furnace can achieve a peak temperature of 800 °C and incorporates a closed-loop system for temperature control with a variation margin of ±2 °C. To safeguard the piezoelectric transducer from elevated temperatures, compressed air was utilized to minimize heat transfer during tests conducted at high temperatures. Furthermore, a circulating water system was employed to cool the fretting clamping devices on both sides, thereby protecting the force sensor.
The test temperature of 650 °C was chosen because it represents a critical service temperature for IN718-based components in aero-engine applications, where the material maintains optimal mechanical performance while experiencing significant thermal–mechanical loads. This temperature corresponds to the operational conditions of high-pressure turbine sections and other hot-end components, ensuring the experimental relevance and practical significance of our findings. The clamping force range of 300–500 N was selected to cover a representative spectrum of contact pressures encountered in practical fretting-critical interfaces, such as blade–disk connections and spline couplings. This range allows for the systematic investigation of clamping force effects on fretting fatigue behavior while ensuring experimental stability and repeatability.
Before the test, the required experimental parameters were set in the control software. During the test, the computer control system sent analog signals to the actuators while collecting real-time experimental data (e.g., output voltage, vibration frequency, and cycle count) via the data acquisition device.
The testing procedure involved the following steps: (1) mounting the specimen and fretting pads in the clamping device; (2) heating the assembly to 650 °C and stabilizing for 30 min; (3) applying a constant transverse clamping force (300 N, 400 N, or 500 N) via a calibrated load cell; (4) initiating cyclic axial loading at 20 kHz frequency under displacement control; (5) monitoring real-time parameters (frequency, displacement, cycle count) until failure, defined as a 5% load drop or resonance frequency deviation beyond 20 ± 0.5 kHz; (6) the computer control system then automatically stops the test.

2.2. Laser Cladding

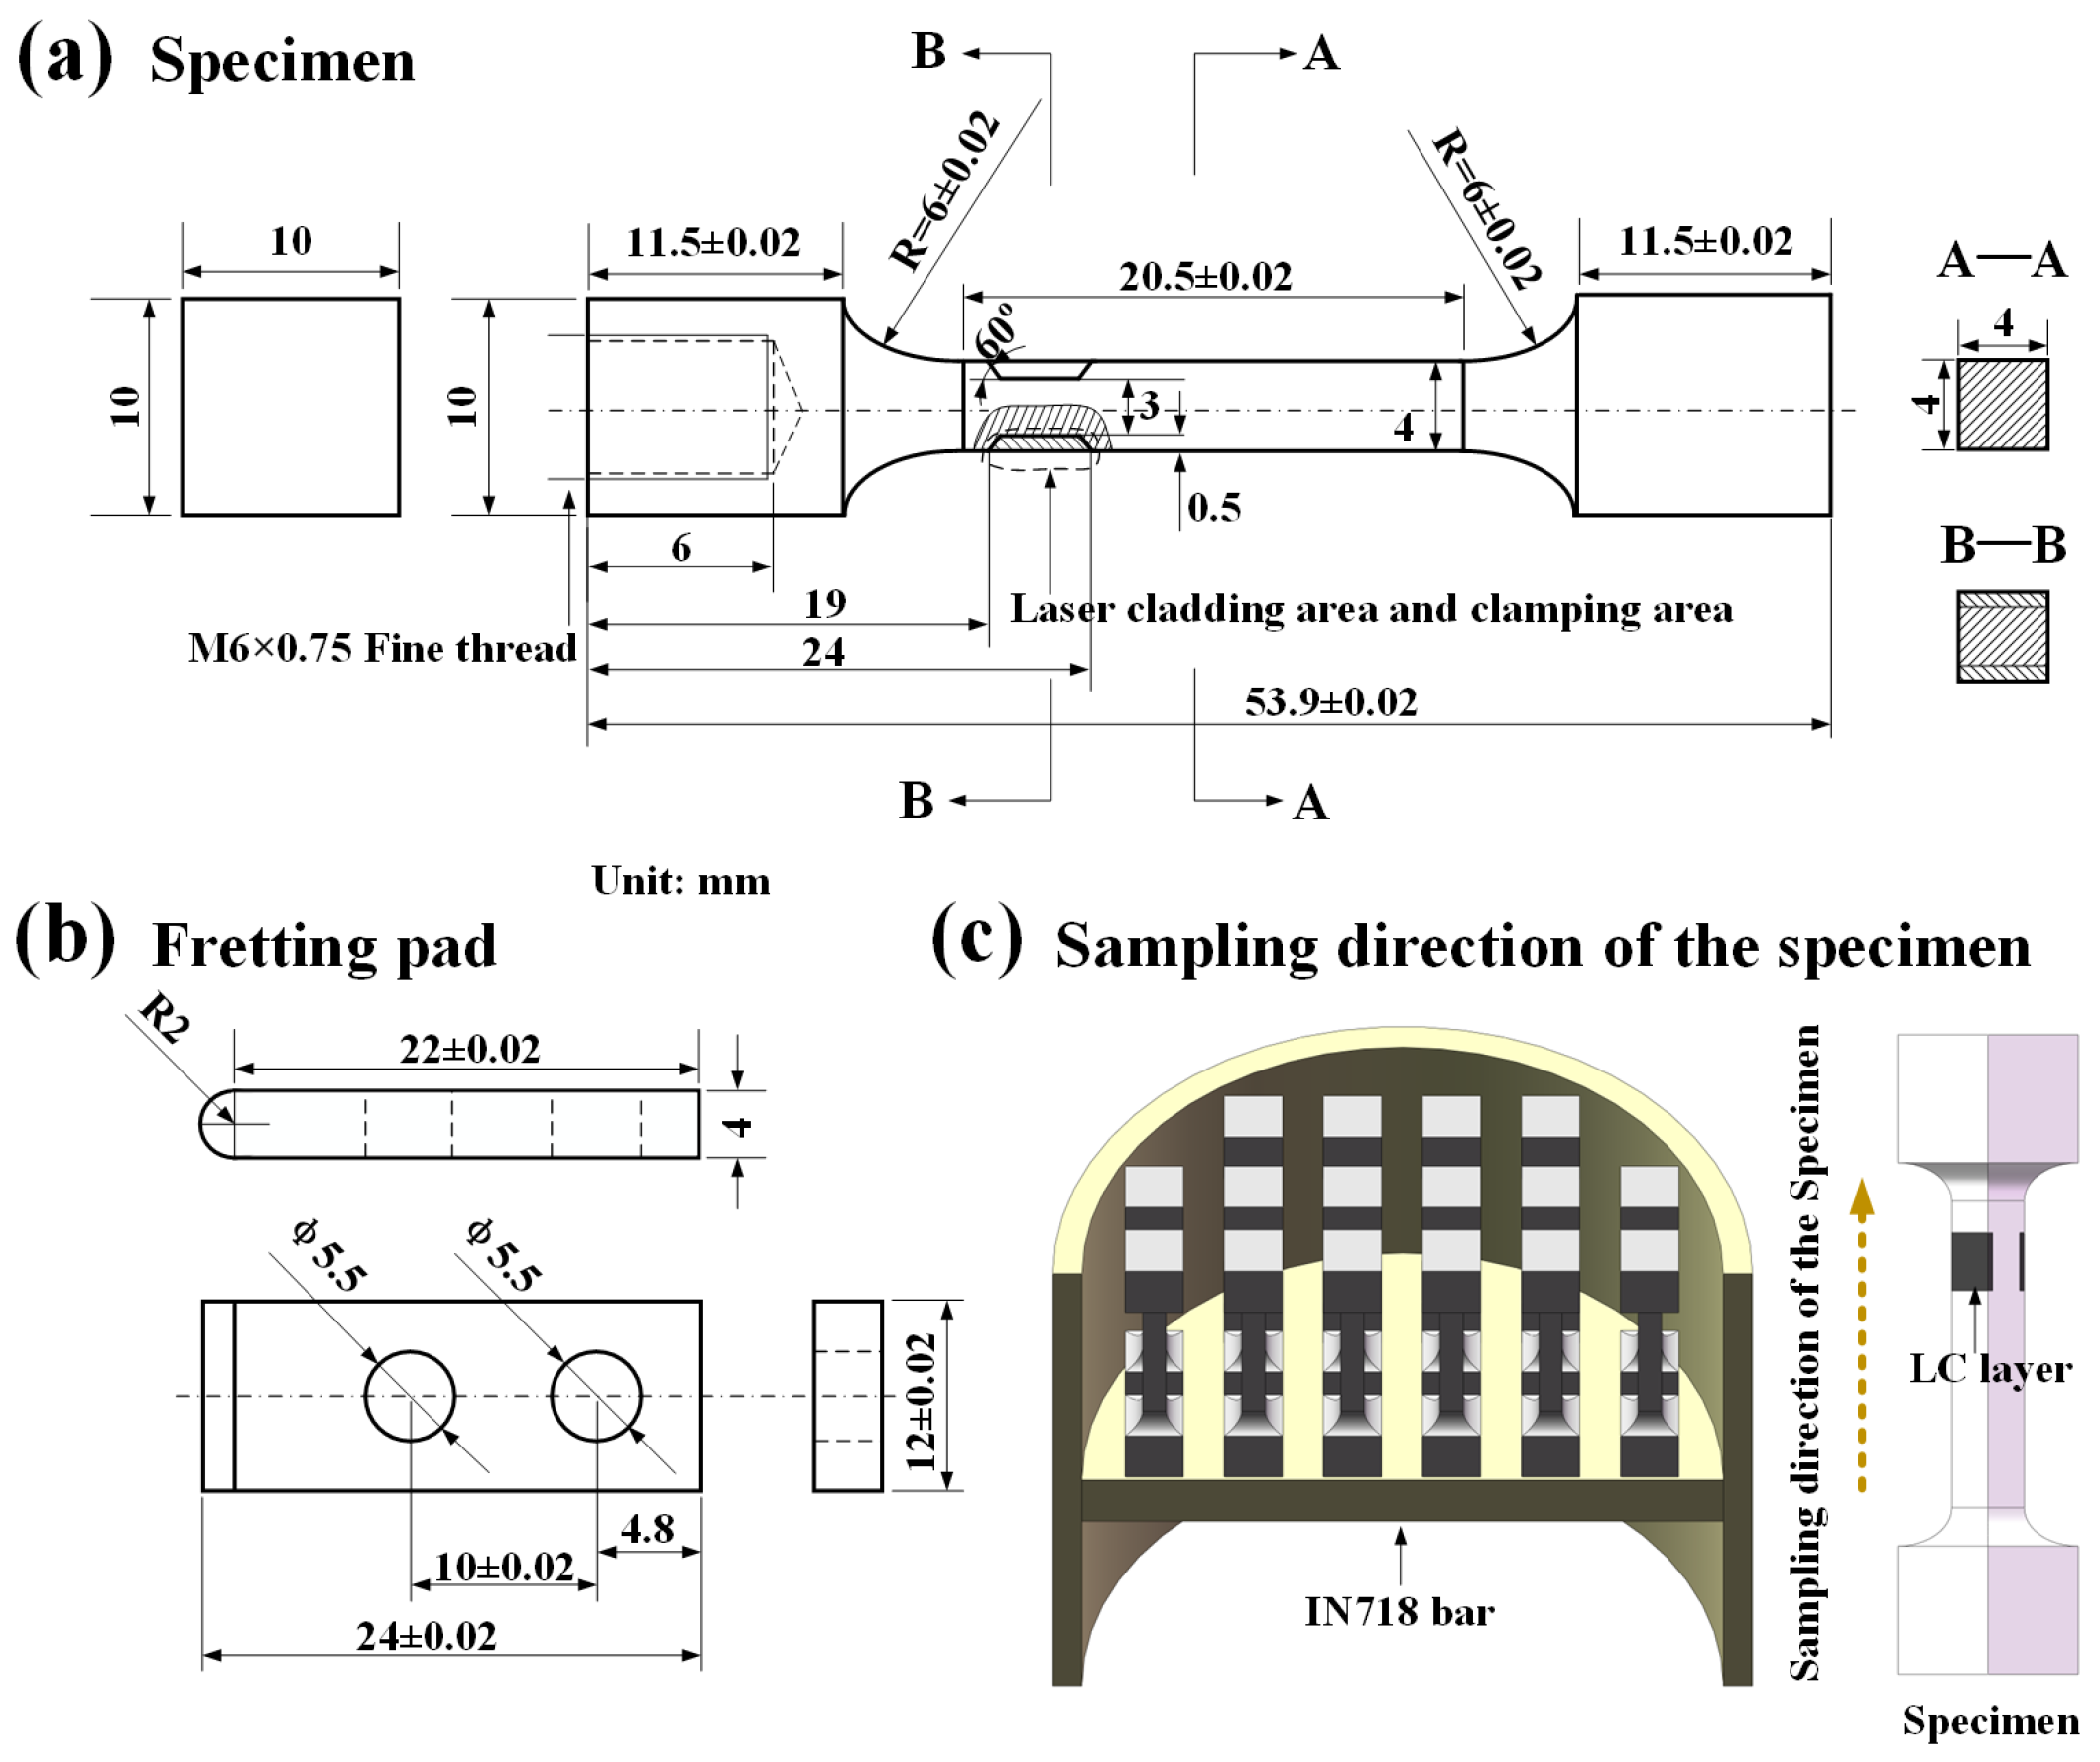
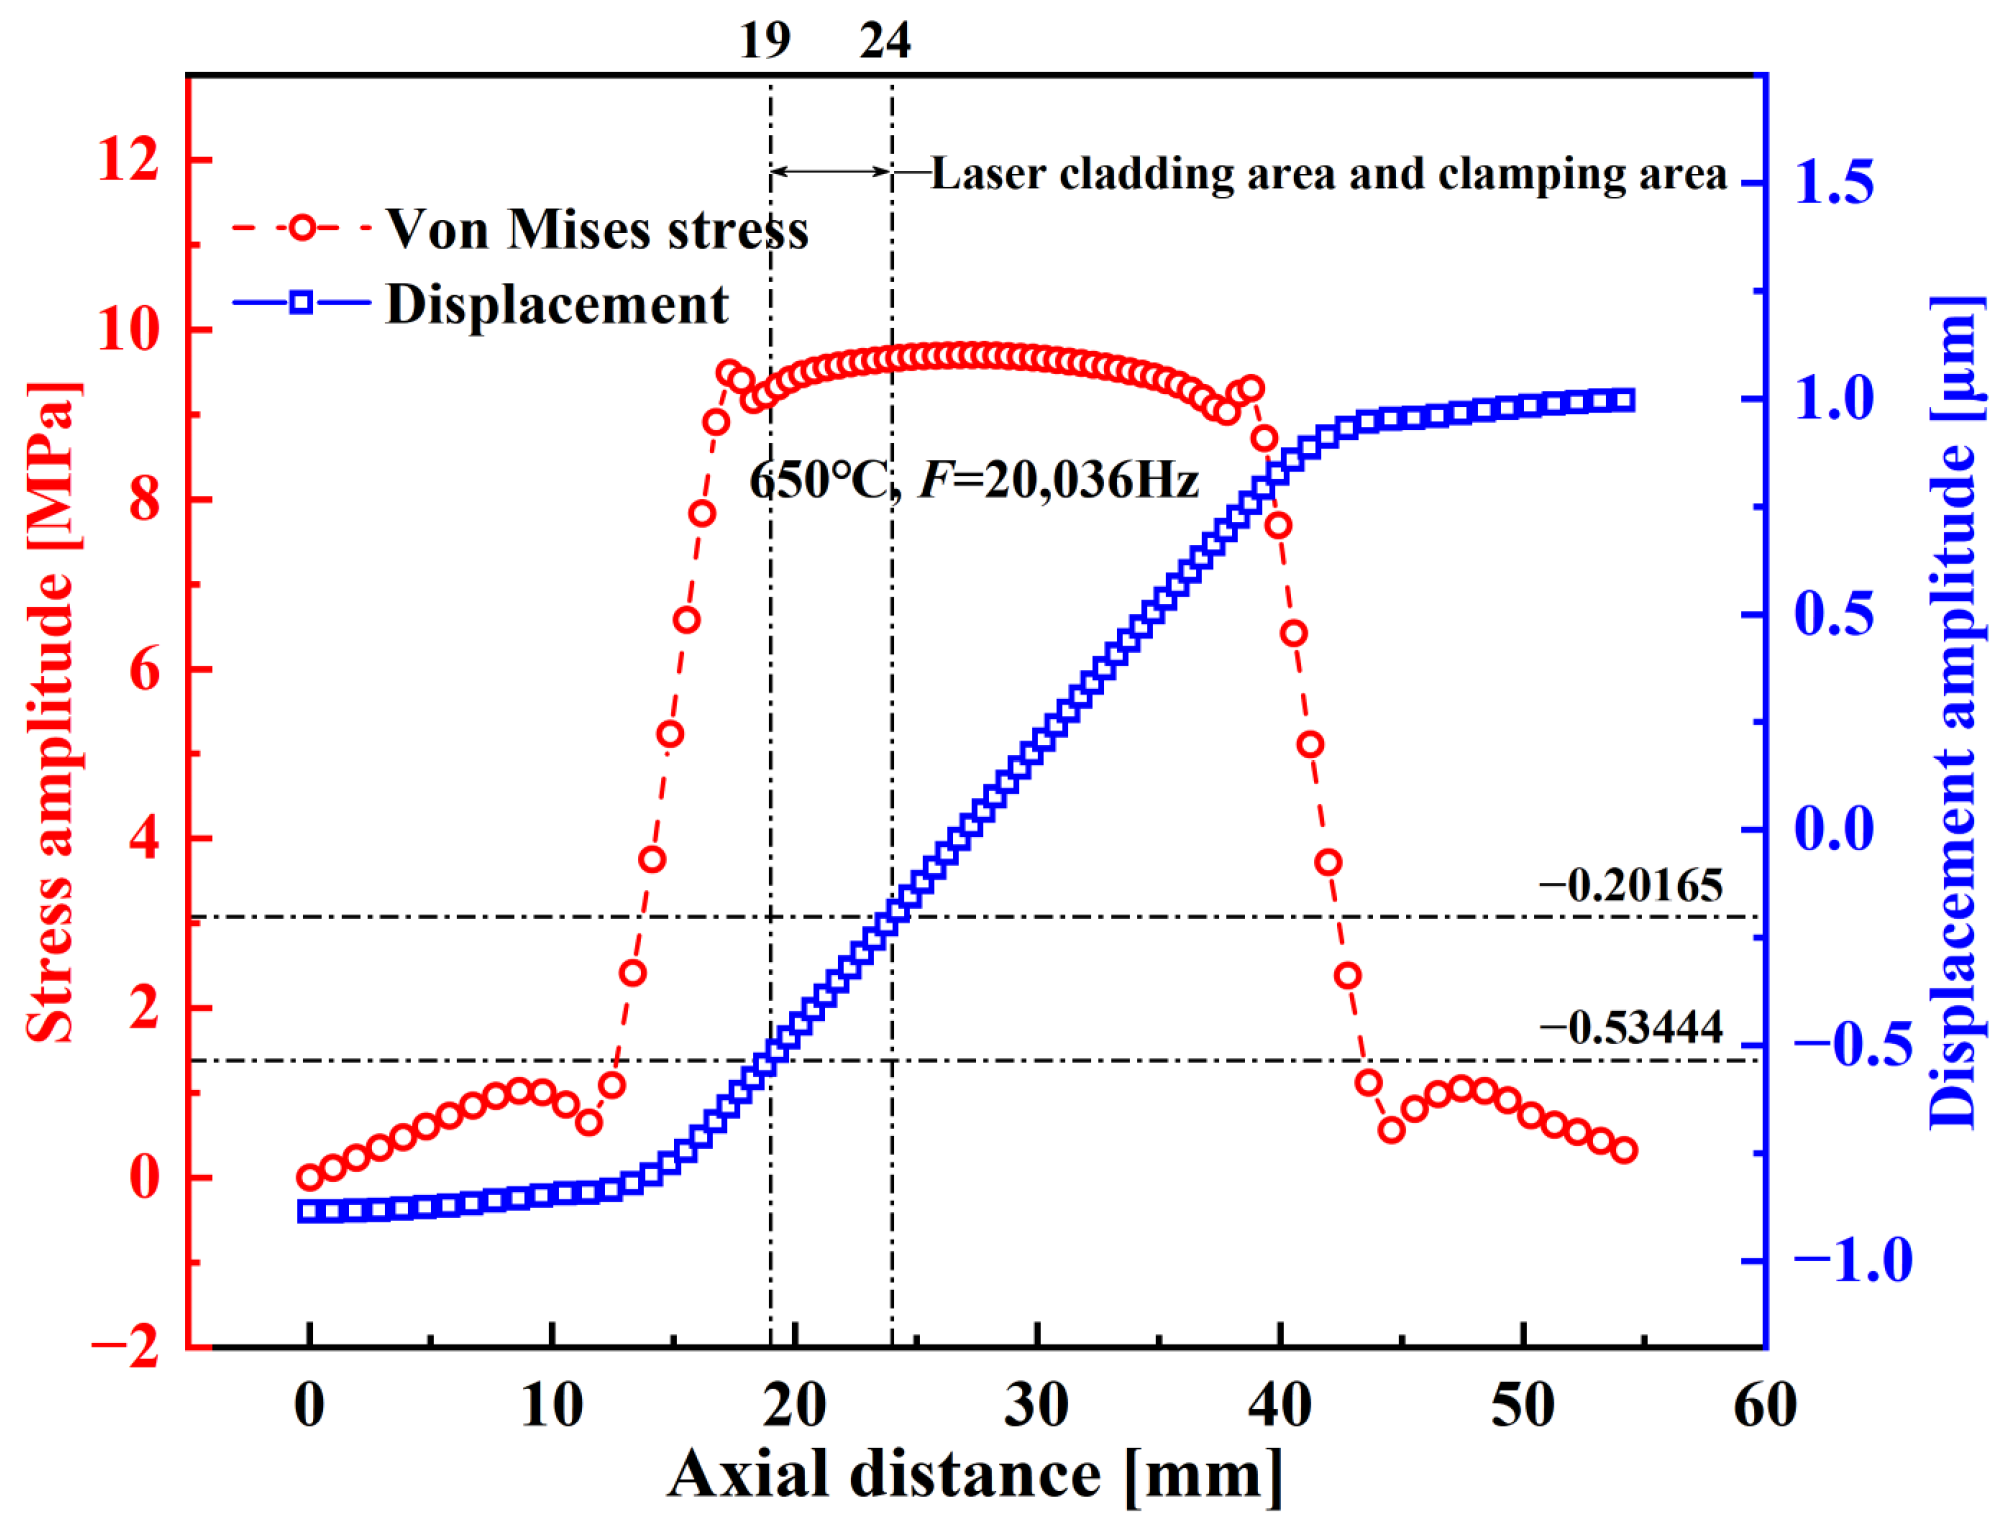
The geometric measurements of the fretting specimen and pad are illustrated in Figure 2a and Figure 2b), respectively, and the method for sampling from the IN718 alloy bar is illustrated in Figure 2c. The displacement and Von Mises stress of the specimen was calculated (harmonic response analysis) based on the material parameters provided in Table 1 (these mechanical performance parameters were determined through standardized high-temperature tensile tests conducted in strict compliance with the Chinese national standard GB/T 228.2-2015 [32], “Metallic materials—Tensile testing—Part 2: Method of test at elevated temperature”) and the resulting displacement and stress distributions are shown in Figure 3. The analysis showed that the region approximately 19–20 μm from the specimen apex exhibited the highest stress and displacement concentrations; thus, this region was designated as both the fretting contact area and the laser cladding area.
Figure 2. Geometric measurements: (a) specimen, (b) fretting pad, (c) sampling direction.
Coatings 16 00181 g002
Figure 3. Axial distributions of displacement (blue) and Von Mises stress (red) across the specimen at 650 °C under oscillatory loading (F = 20,036 Hz).
Coatings 16 00181 g003
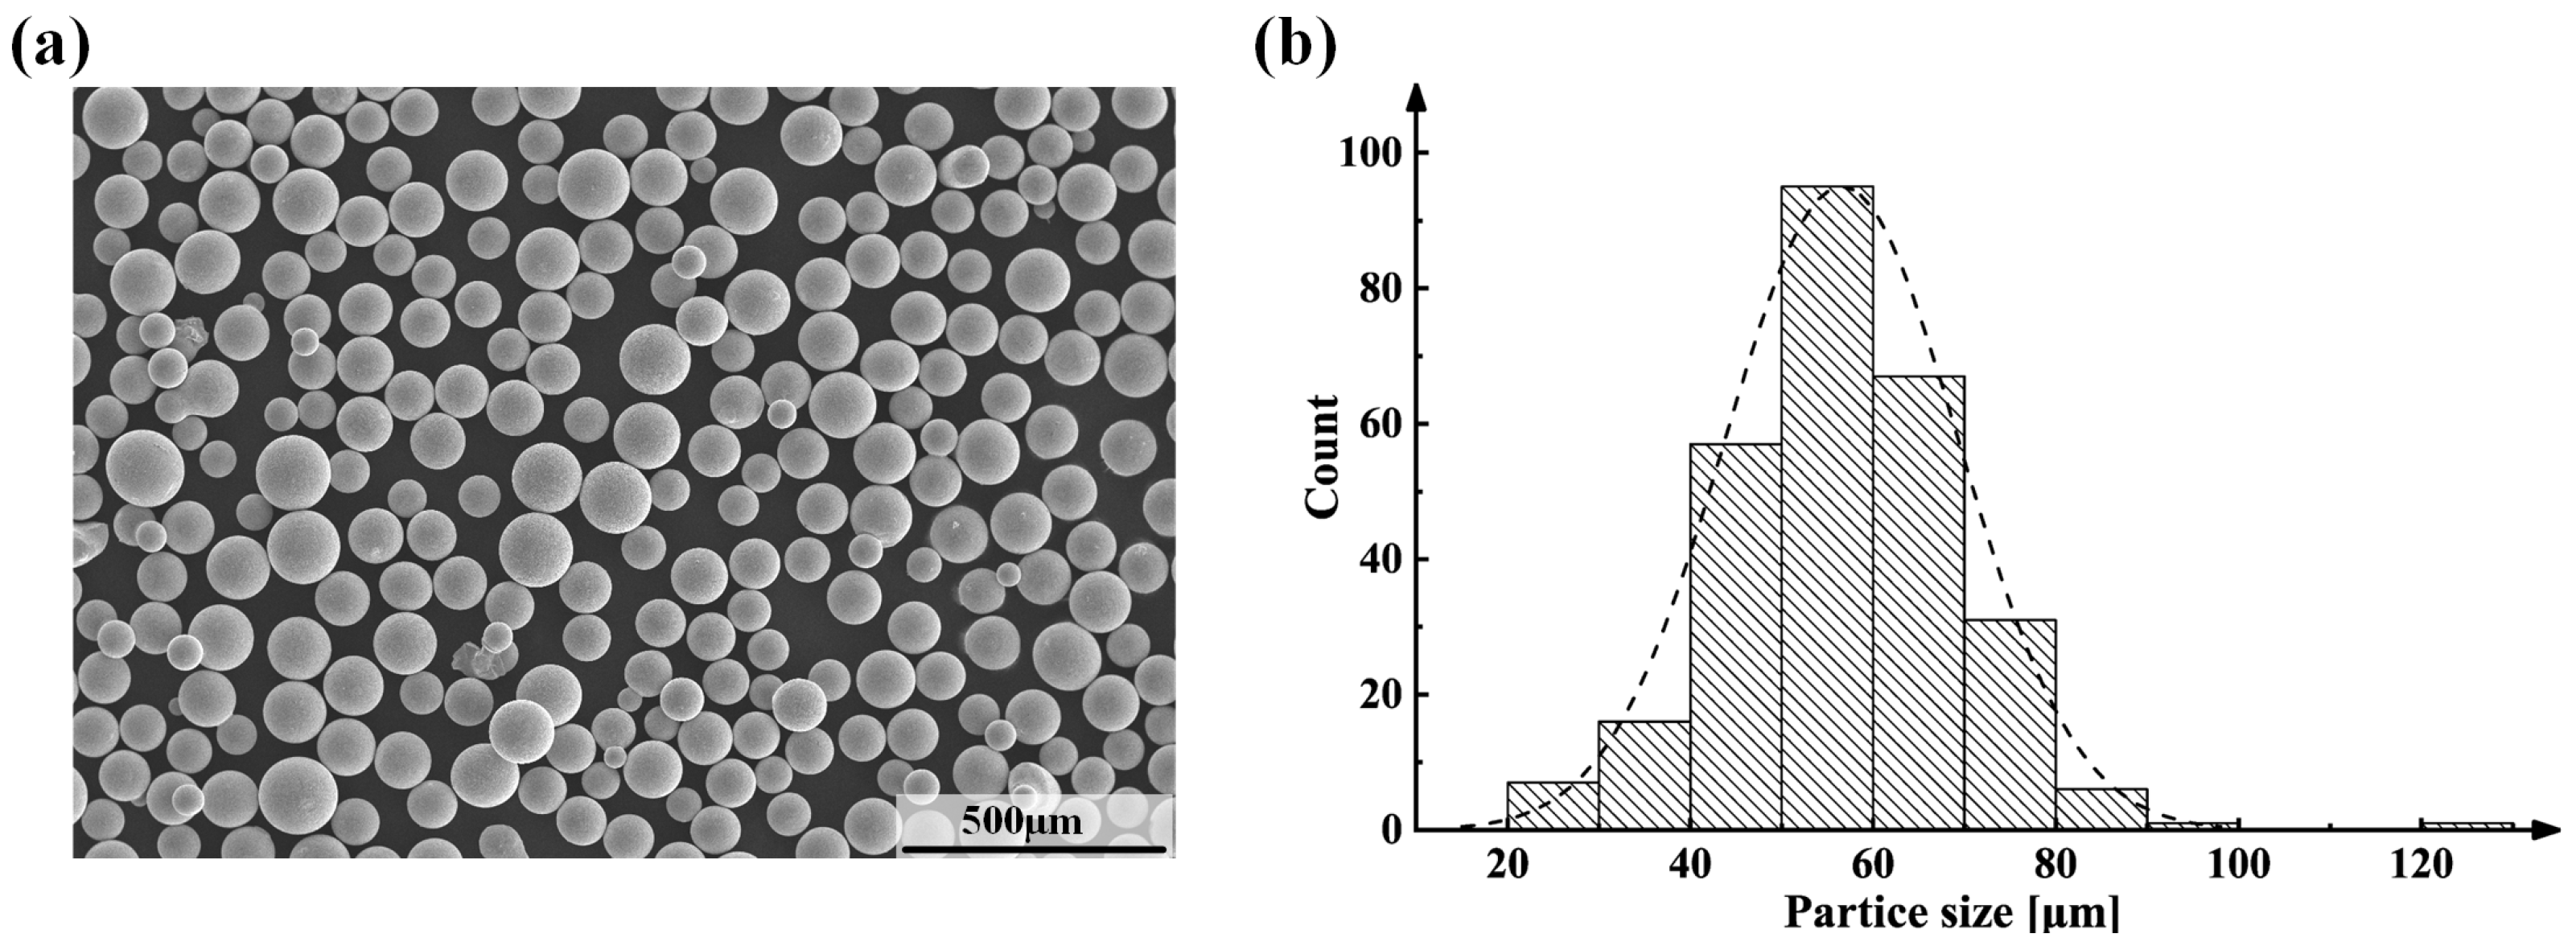
The laser cladding powder is composed of 80 wt.% IN718 alloy powder and 20 wt.% WC powder. Xu et al. [33] demonstrated that 20 wt.% WC content in IN718/WC composite coatings achieves an optimal balance of tribological properties while maintaining good coating quality. In addition, most WC particles had a diameter in the range of 20–45 μm: 40.2% of the particles were 20–38 μm in diameter and 52.2% were 38–45 μm. The laser cladding equipment included a Staubli TX2-90 (Stäubli International AG, Pfäffikon, Switzerland) precision six-axis industrial robot, a control system, an automatic powder feeder, a water cooling system, and a 4 kW high-energy-density fiber laser. The particle shape, morphology, and size distribution of the IN718 alloy powder is shown in Figure 4. The IN718 and WC powders were thoroughly blended using a low-energy tubular mixer (tumbling method) to ensure uniform distribution while minimizing premature deformation or segregation of the constituent powders. The mixing process was conducted for a duration of 4 h at a rotational speed of 50 rpm to achieve a homogeneous composite powder feedstock.
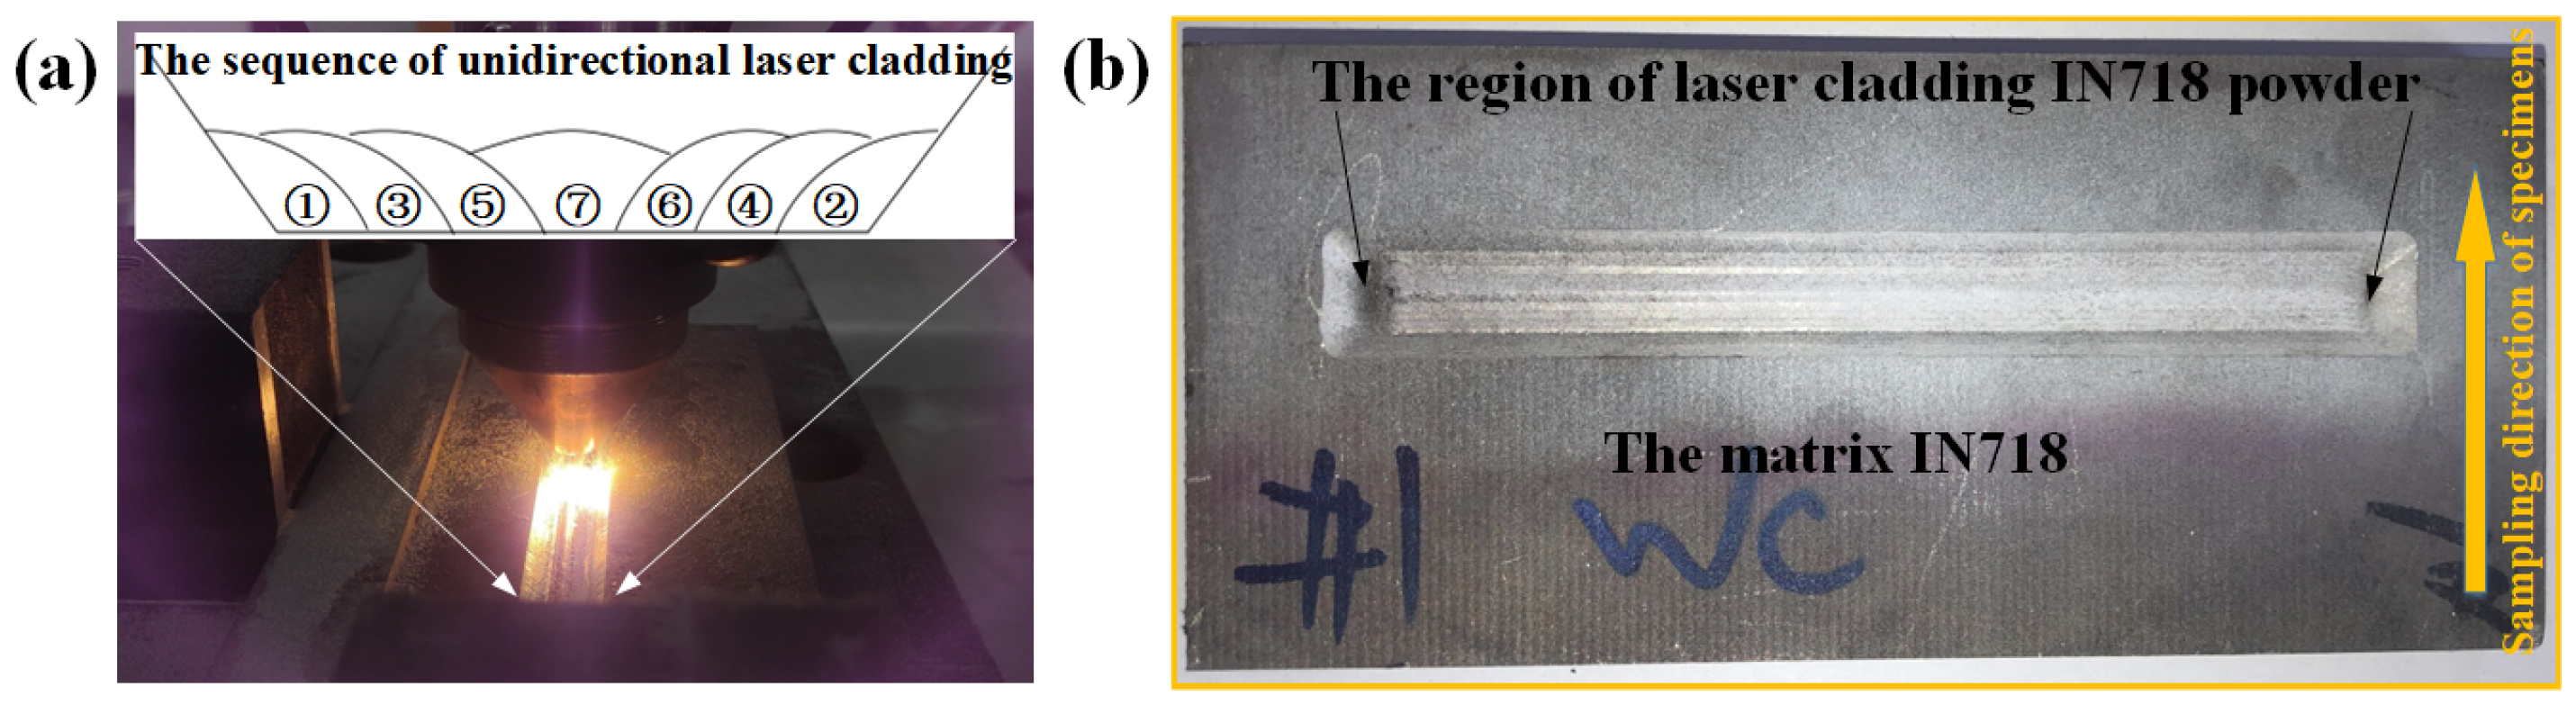
The laser cladding process employs a laser beam with a high energy density ( 45   J / mm 2 ) as its heat source. By utilizing synchronous powder feeding technology, this laser beam targets the surface of the matrix, melting the powder along with the matrix surface; the rapid cooling that follows results in the formation of a metallurgical bond between the clad layer and the matrix. This laser beam possesses a considerable energy density, and the pool of molten material cools at a rate of 10 6   / s . The optimization procedure involved the following: (1) initially setting the parameters based on the literature and the equipment specifications; (2) conducting single-track cladding trials with systematic variation of one parameter at a time while holding the others constant; (3) evaluating each trial coating first by visual inspection for surface defects (e.g., cracks, unevenness), then by dye penetrant testing to detect surface/subsurface cracks, and finally by metallographic examination using optical microscopy to assess internal quality (e.g., porosity, lack of fusion, dilution rate); (4) iteratively adjusting parameters until the optimal combination was identified—yielding a dense, crack-free coating with strong metallurgical bonding. The final cladding parameters were set as follows: power ( P = 820   W ), scanning velocity ( V = 10   mm / s ), powder feeding rate ( PFR = 2   g / min ), spot diameter ( D = 1   mm ), powder carrier gas ( PCG = 2   L / min ), and protective airflow—high-purity argon ( PA = 11   L / min ). A unidirectional laser path was used to coat both sides of the IN718 matrix, with the cladding direction alternating toward the center (Figure 5a). For Figure 5b, detailed geometric information for the IN718 substrate is as follows: the substrate had an overall rectangular geometry with a length, height, and thickness of 128 mm, 80 mm, and 10 mm, respectively, as illustrated in the provided schematic. A 100 mm long section along the center of the top surface (128 mm length) was designated and prepared for the laser cladding deposition of the IN718/WC composite coating. To ensure strong interfacial bonding, a 60° groove was machined along this 100 mm cladding region on the substrate surface prior to deposition. The combination of these dimensions and the groove design provided a well-defined and consistent bonding area for the coating process.

3. Results

3.1. Analysis of VHCFF Strength

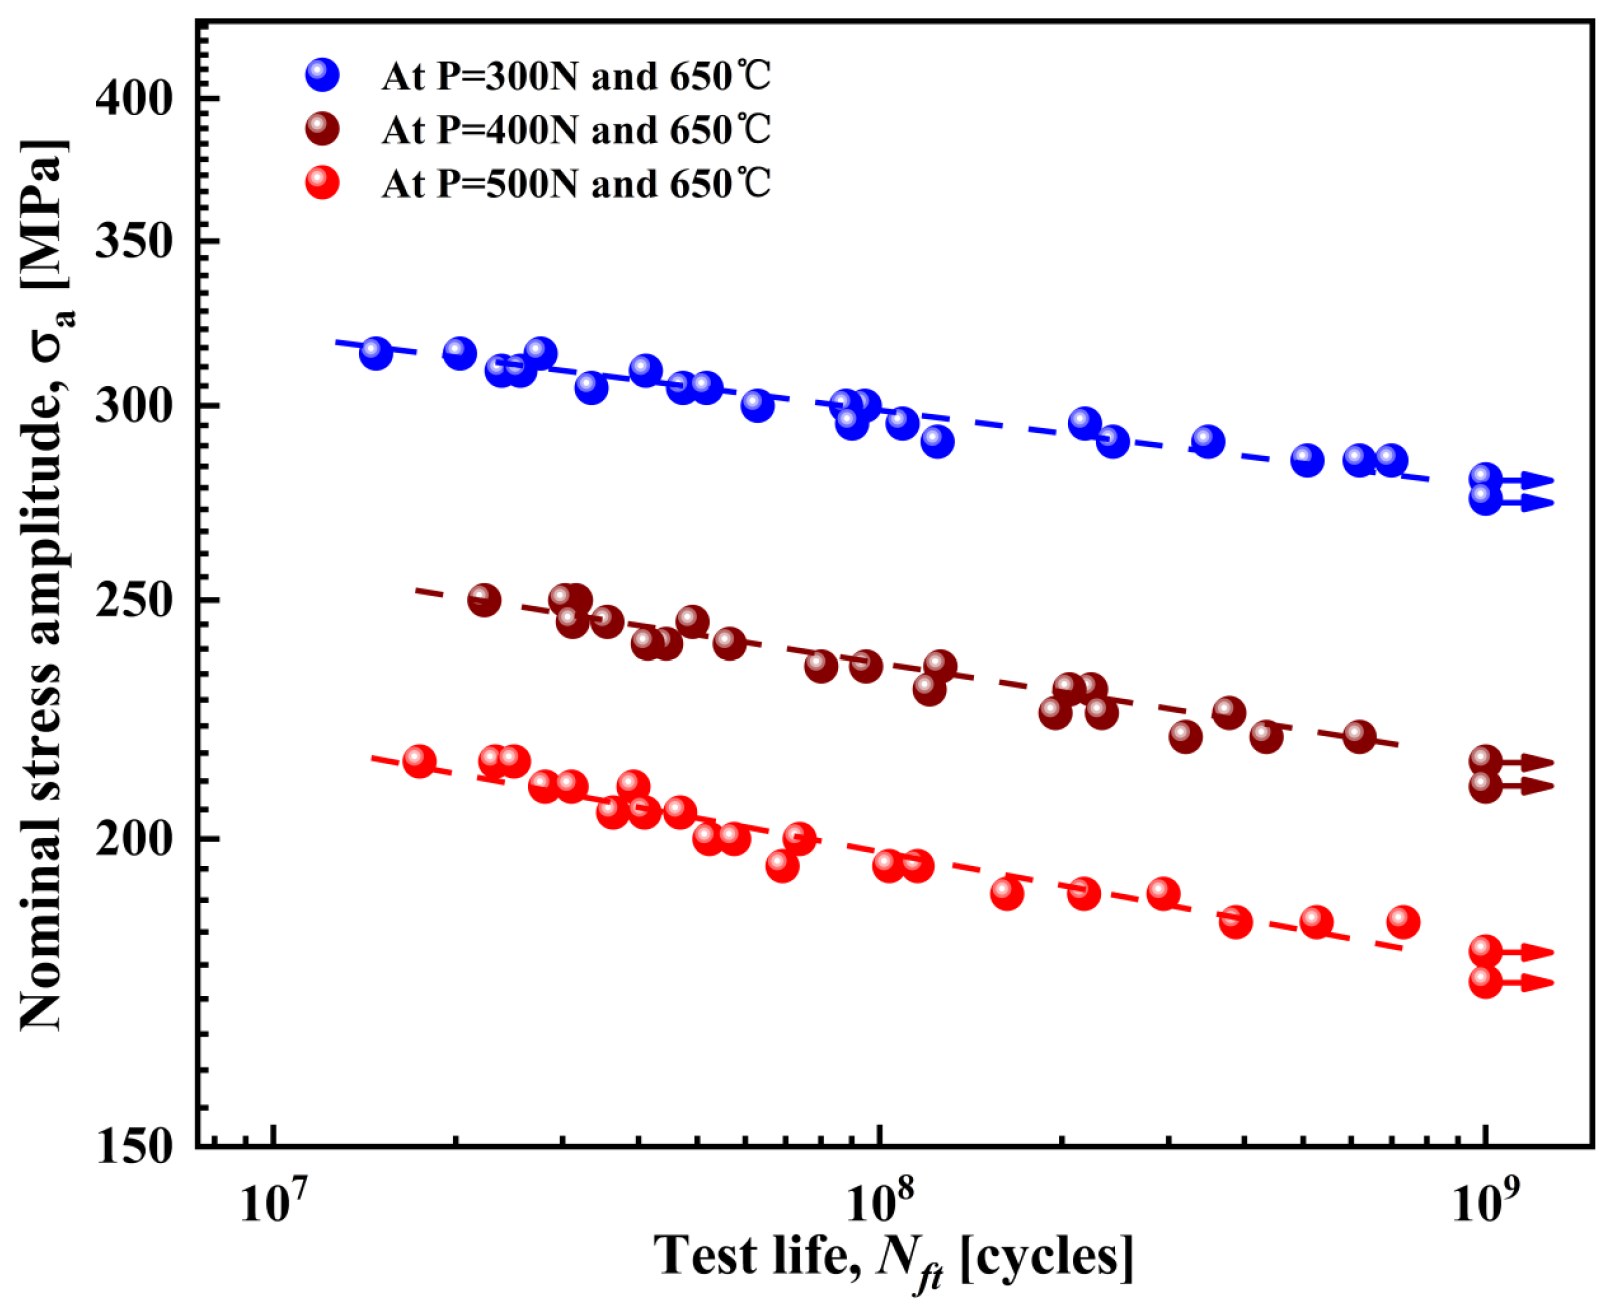
The fatigue performance of the specimens was evaluated under different transverse clamping forces at 650 °C using VHCFF tests (Figure 6). In the tests, 109 cycles were considered the threshold for “unlimited life”; the arrows in Figure 6 indicate that the specimens did not fail even after reaching 109 cycles. In the very-high-cycle regime (107 cycles), the fatigue strengths corresponding to transverse clamping forces of 300 N, 400 N, and 500 N were 320 MPa, 257 MPa, and 219 MPa, respectively. These results clearly show that the fatigue strength of the specimens decreases gradually as the clamping force increases. This is primarily attributed to the intensified stress concentration and accelerated fretting damage mechanisms under higher contact loads. Specifically, a larger clamping force (e.g., rising from 300 N to 500 N) amplifies the localized stress field at the fretting interface, promoting earlier crack initiation through enhanced frictional shear stresses and plastic strain accumulation. This trend aligns with fundamental fretting fatigue principles where elevated normal loads reduce fatigue resistance by exacerbating surface slip and subsurface shear deformation. The data in Figure 6 explicitly show that at 107 cycles, the fatigue strength drops from 320 MPa (300 N) to 257 MPa (400 N) and further to 219 MPa (500 N), directly correlating the clamping force increase with degraded fatigue performance due to progressive microstructural damage accumulation.

3.2. Analysis of VHCFF Behavior

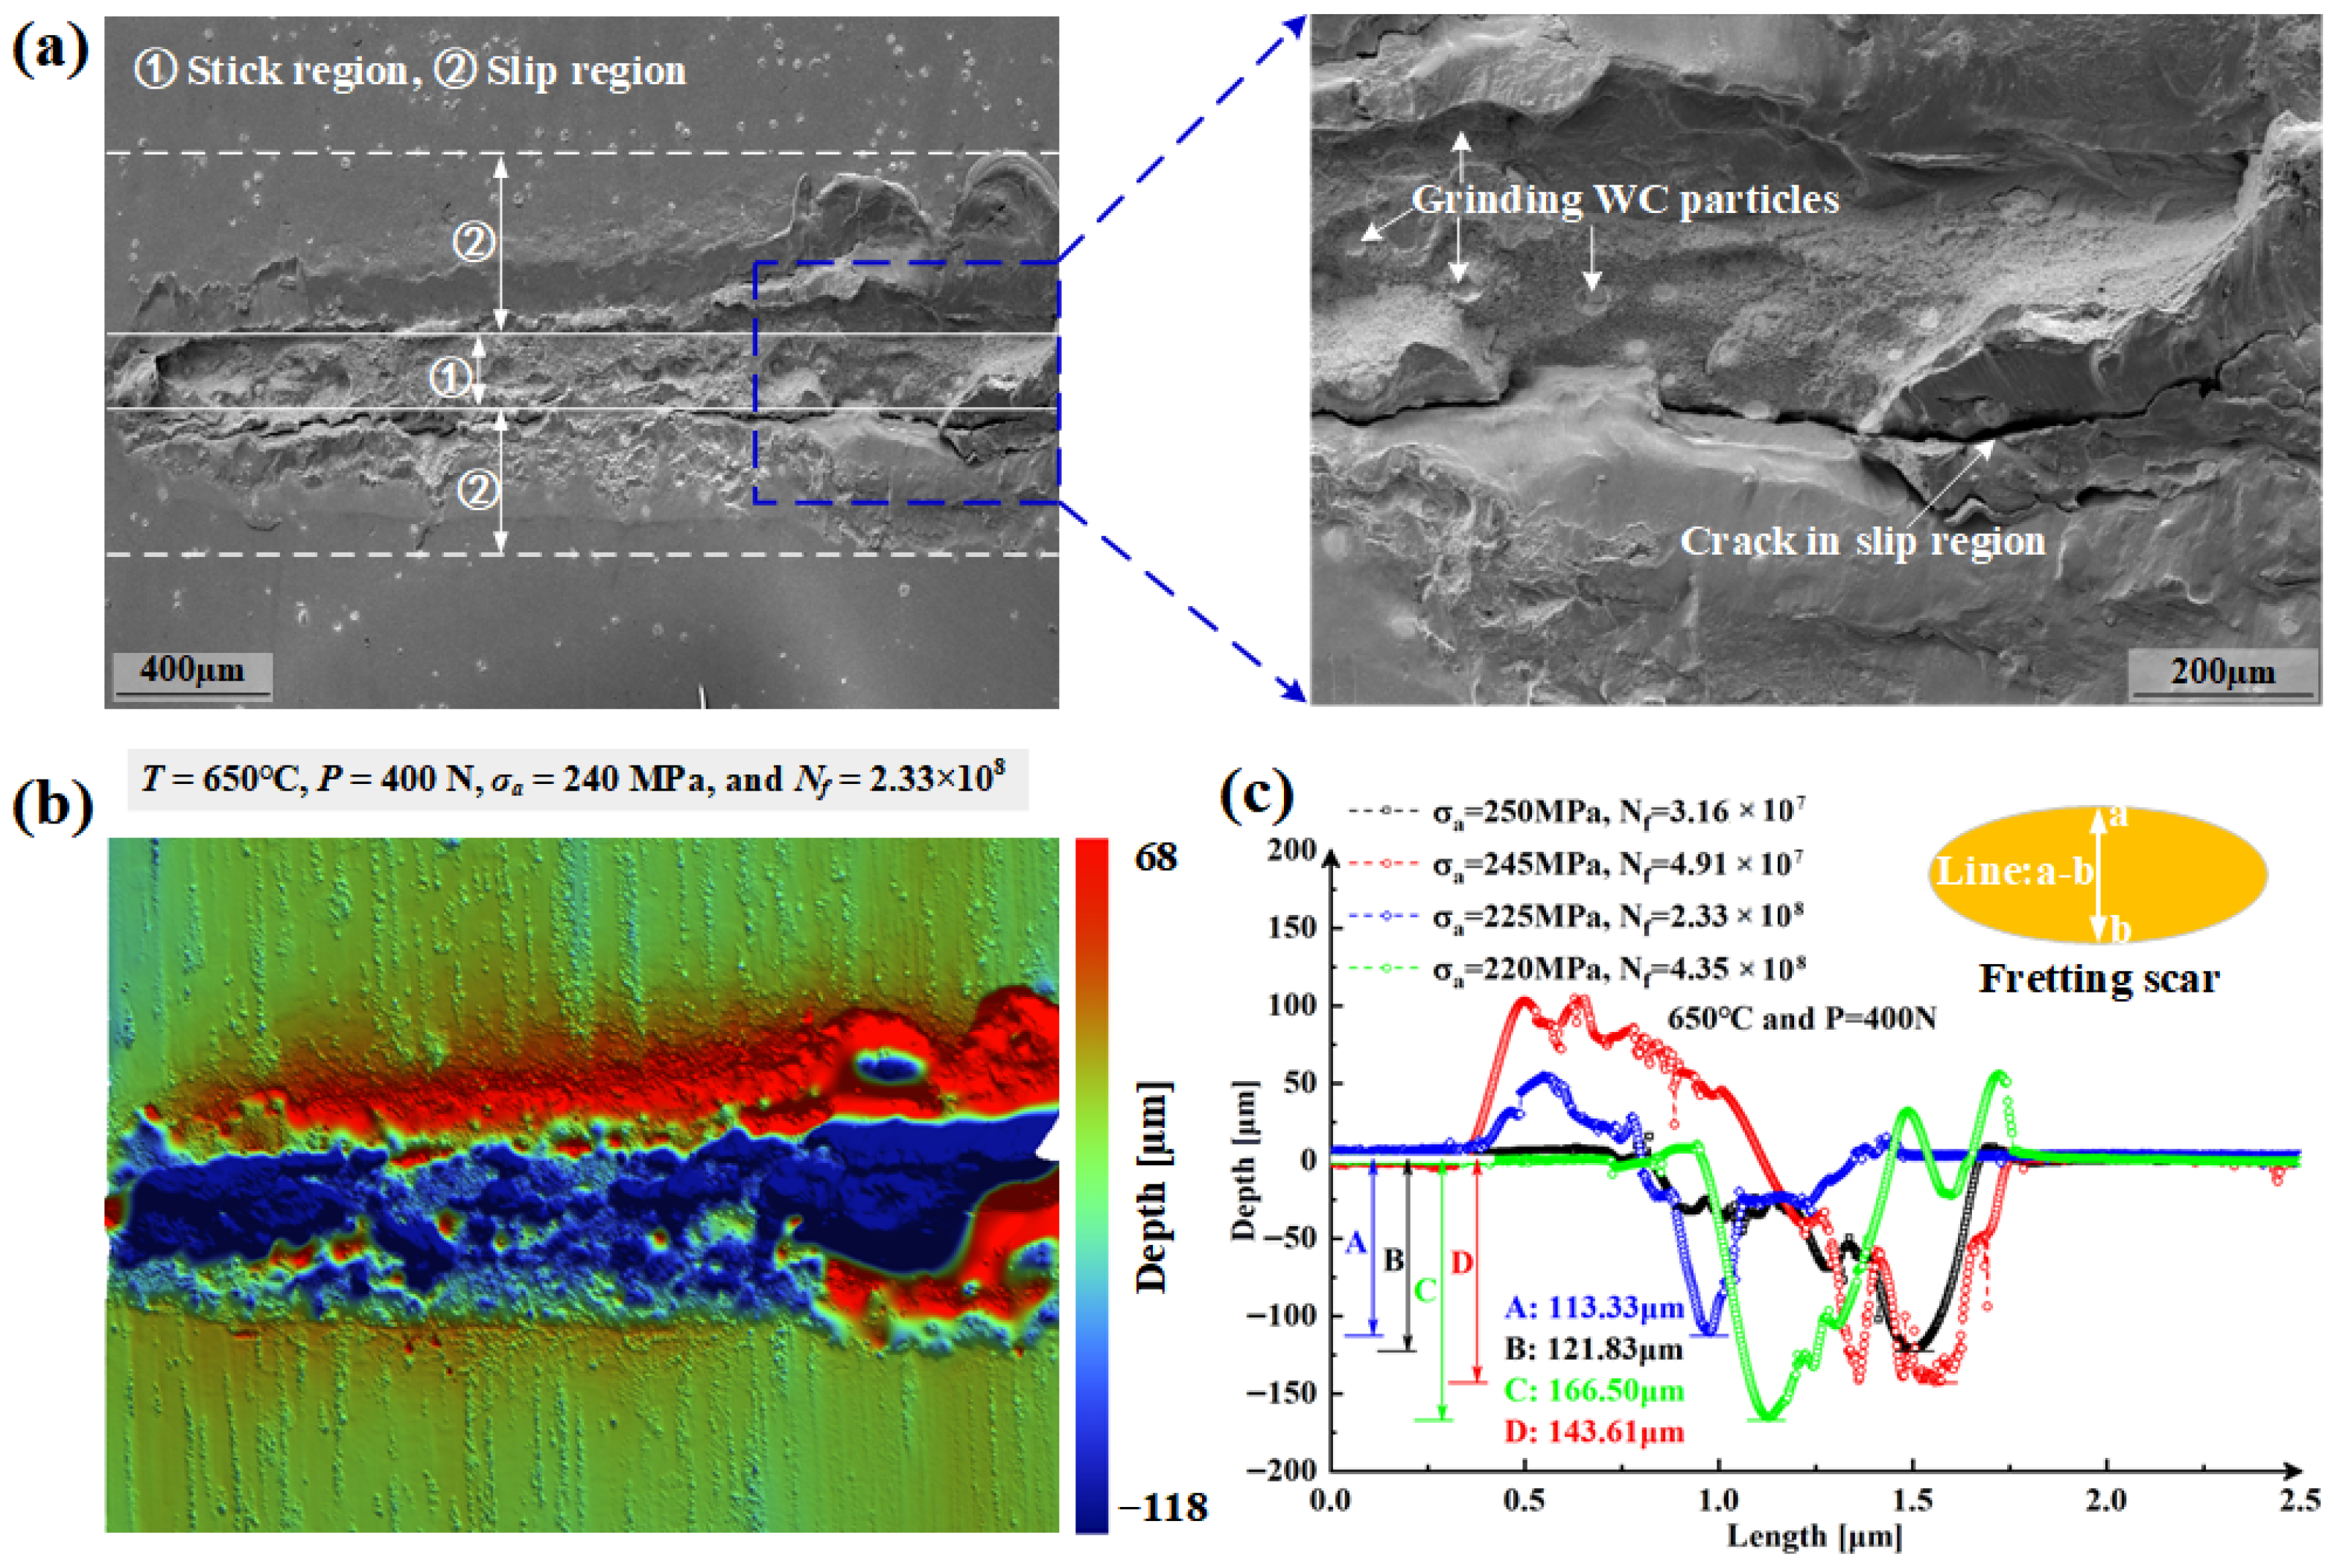
Figure 7a shows the SEM images of the wear surface resulting from fretting, measured under conditions of T = 650 °C, P = 400 N, σa = 240 MPa, and Nf = 2.33 × 10⁸ cycles. The examination indicates that the fretting wear scars consist primarily of stick and slip regions, with surface cracks observed in the slip region. In the stick region, numerous WC particles were compressed, ground, or fractured by the fretting pad but did not peel off directly from the clad layer—indicating strong metallurgical bonding between the WC particles and the clad layer material after laser cladding.
Compared with the clad layer, WC particles exhibit higher strength and wear resistance. Under the same load conditions, the volume of material peeled off from the clad layer was larger, while the volume of material peeled off from WC particles and their surrounding areas was relatively small. As a result, numerous pits formed on the fretting wear scars, leading to high surface roughness.
To explore how load influences the depth of fretting wear, a white light interferometer (WLI) was employed to capture the three-dimensional morphology of the fretting scars (refer to Figure 7b). The analysis revealed a distinct debris accumulation mechanism: the material detached in the central stick region (where high shear stresses cause adhesive wear) was systematically transported and accumulated within the slip regions along both sides of the scar. This transport occurs through two primary mechanisms: (1) the cyclic rocking motion of the contact interface pushes debris outward from the high-pressure stick zone, and (2) the small-amplitude oscillatory sliding gradually transports particles to the scar periphery. The accumulated debris formed characteristic ridges, with a maximum wear depth of 160.5 μm recorded in the stick region and a peak debris accumulation height of 68 μm in the slip zones. Quantitative data on wear depth distribution was extracted along the central line (designated as line a–b in Figure 7c) under various load conditions, as systematically illustrated in Figure 7c.
It is noteworthy that when the fatigue cycle count rose from 3.16 × 10⁷ to 4.91 × 10⁷ cycles, the wear depth experienced an increase of 21.78 μm. A similar pattern was observed, with a 53.17 μm rise in wear depth as the cycle count escalated from 2.33 × 10⁸ to 4.35 × 10⁸ cycles—demonstrating that wear depth is directly related to the number of fatigue cycles applied under consistent load conditions. Conversely, when the cycle count surged from 4.91 × 10⁷ to 2.33 × 10⁸ cycles, coupled with a reduction in axial stress from 245 MPa to 225 MPa, the fretting wear depth saw a decline of 30.28 μm. This decrease in fretting wear can be linked to the diminished stress concentration effect within the contact zone attributed to the reduced axial stress. These findings indicate that the axial stress amplitude is a significant factor affecting the extent of fretting wear during varying fatigue cycles.
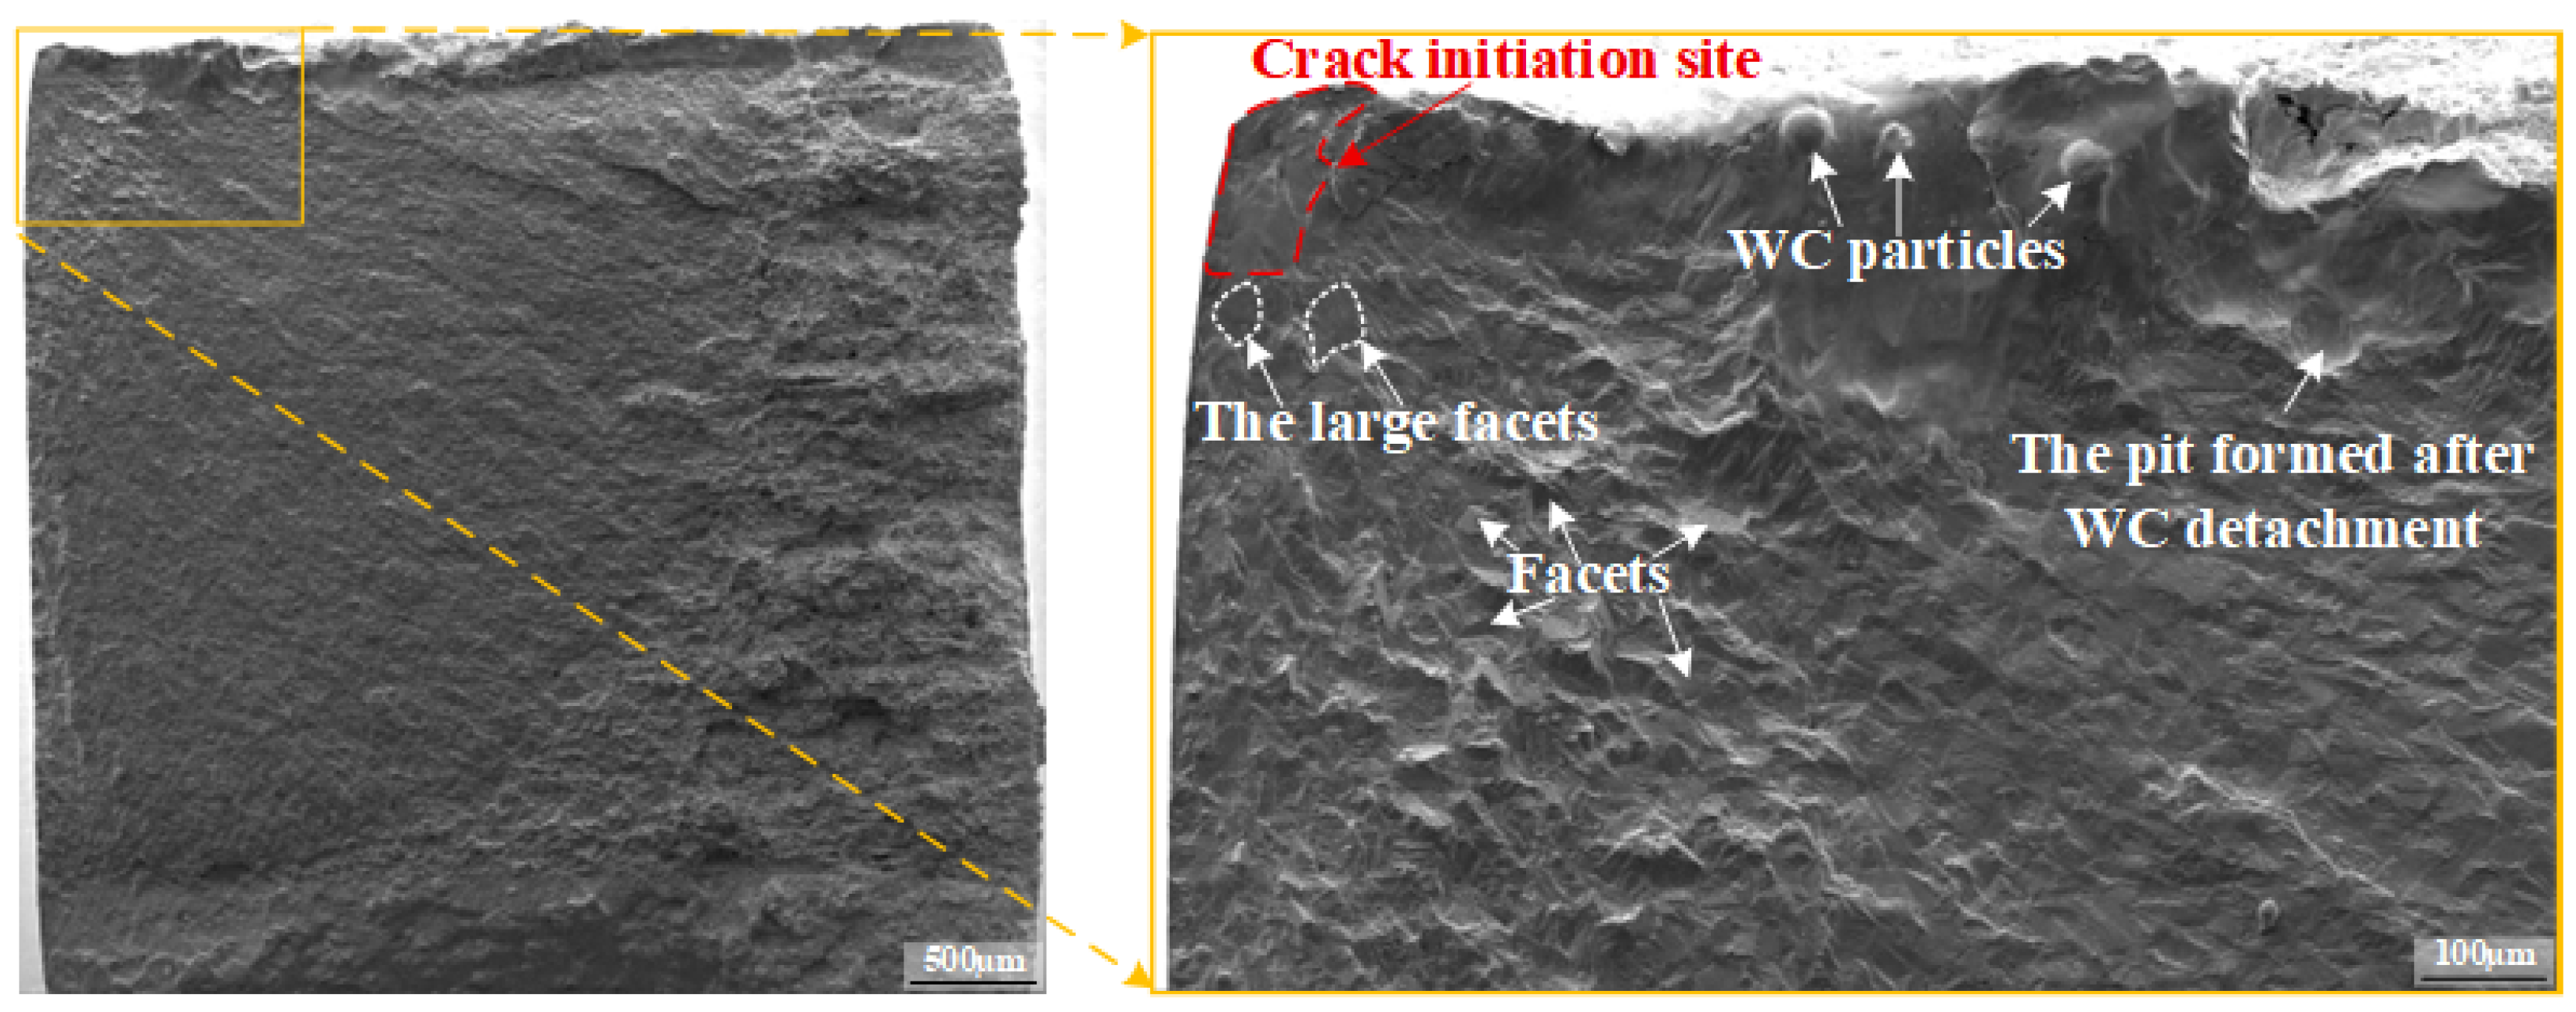
Analysis of the fracture surface (Figure 8) reveals that the primary feature of crack initiation on the fretting contact surface is the cleavage facet exhibited by large grains. Fretting wear led to the formation of numerous pits on the contact surface; however, no obvious pits were observed in areas where WC particles were present—attributable to the high strength and excellent wear resistance of WC. Additionally, during crack propagation away from the fretting contact surface, WC particles hindered the transfer of dislocation slip, causing the crack to propagate along the boundaries of WC particles and eventually leading to the detachment of WC particles (Figure 8).
Additionally, VHCFF can induce stress concentration, plastic slip, and dislocation accumulation at the contact interface of two components—all of which are detrimental to fatigue performance. The microstructural characteristics of the material can effectively explain the mechanisms of crack initiation at the micro-scale. It is well known that the Schmid factor directly reflects the potential for slip system activation [34]. According to the Hall–Petch law, grain size is an indicator of the yield strength of a material. Fretting contact involves severe friction and wear, which are closely related to the strength and stiffness of the material. Therefore, the Schmid factor, grain elastic modulus, and equivalent grain size were selected as parameters to evaluate the effect of the microstructure on the crack initiation behavior.
Nye and Lindsay [35] found that the elastic modulus of metallic materials depends on their crystal orientation—a relationship that has been widely applied in subsequent studies [36,37]. For cubic crystalline materials, the elastic modulus along any orientation can be expressed by Equation (1):
1 E ϕ 1 , ψ , ϕ 2 = S 11 sin 4 k 2 + cos 4 k 2 + 2 S 12 + S 66 sin 2 k 2 cos 2 k 2 sin 4 k 1 + 2 S 13 + S 44 sin 2 k 1 + S 33 cos 4 k 1
C = C 11 C 12 C 12 0 0 0 C 11 C 12 0 0 0 C 11 0 0 0 C 44 0 0 C 44 0 C 44           &         S = C 1 = S 11 S 12 S 13 S 12 S 11 S 13 S 13 S 13 S 33 S 44 S 44 S 66
S 11 = S 33 = C 11 + C 12 C 11 + 2 C 12 C 11 C 12 S 12 = S 13 = C 12 C 11 + 2 C 12 C 11 C 12 S 44 = S 66 = 1 C 44
where
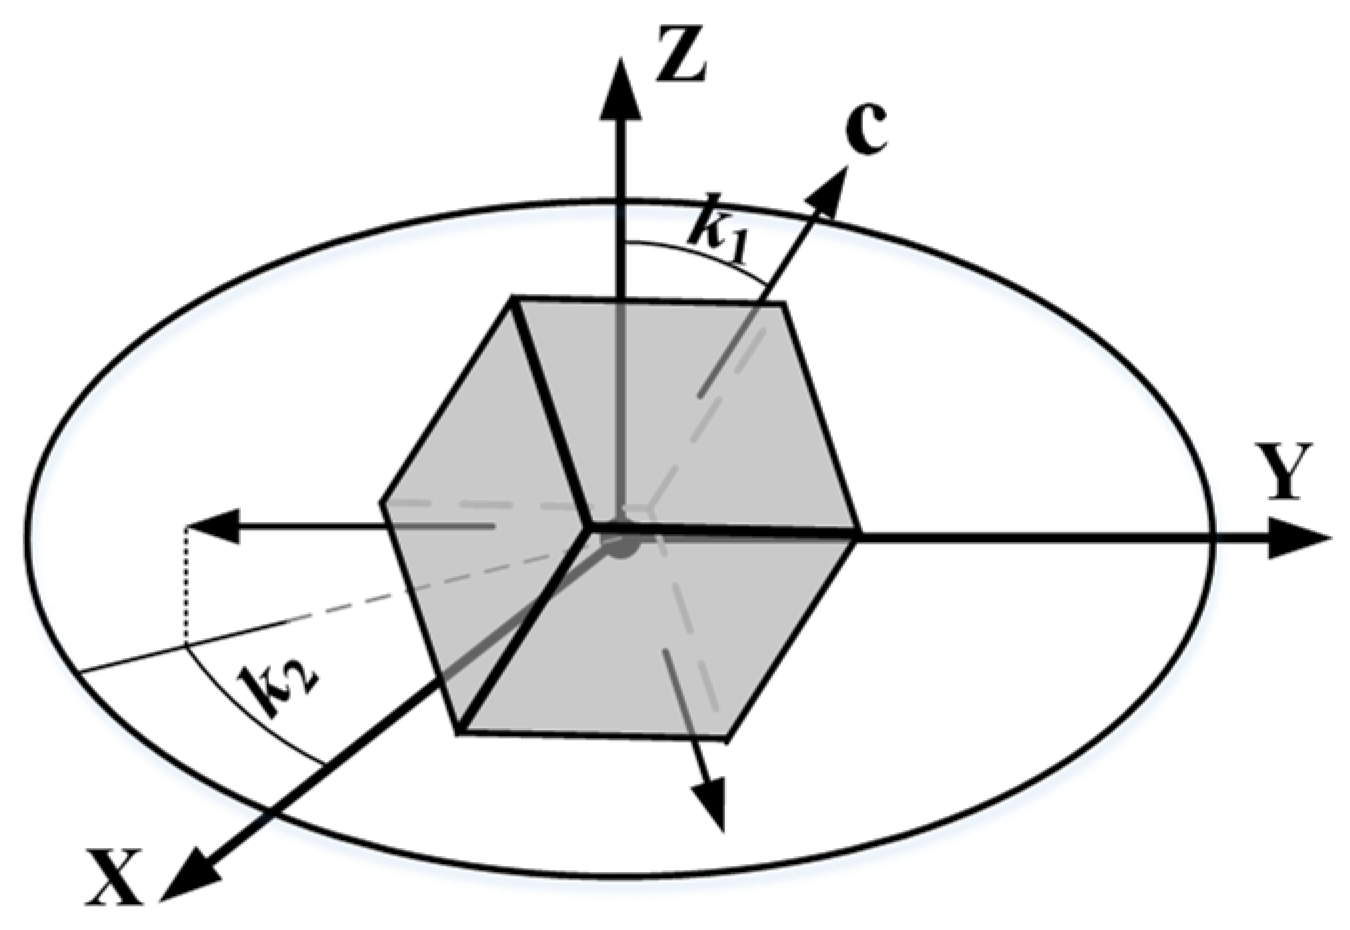
E ϕ 1 , ψ , ϕ 2 is the elastic modulus corresponding to different Euler angles ( ϕ 1 , ψ , ϕ 2 ); k 1 and k 2 are the tilt angle from the [001] axis and the rotation angle from the [100] direction to the [010] direction around the c-axis of the crystal, respectively. As shown in Figure 9, k 1 is equivalent to ψ and k 2 is equivalent to ϕ 1 [37,38]. By determining the elastic modulus for different Euler angles, the stiffness tensor can be derived.
IN718 exhibits a face-centered cubic (FCC) crystallographic structure with orthogonal symmetry, which results in three independent elastic constants. The stiffness matrix C of IN718 can be simplified to Equation (2), and the compliance tensor S —the inverse of the stiffness matrix—can also be expressed by Equation (2). Due to the orthogonal symmetry of the FCC structure, only three independent elastic constants ( S 11 , S 12 , and S 44 ) exist. Using Equation (2), the compliance calculation formula (Equation (3)) can be derived. In this study, the elastic constants ( C 11 = 180   GPa , C 12 = 155.4   GPa , and C 44 = 143.5   GPa ) were determined through low-cycle tensile–compressive tests and simulation fitting.
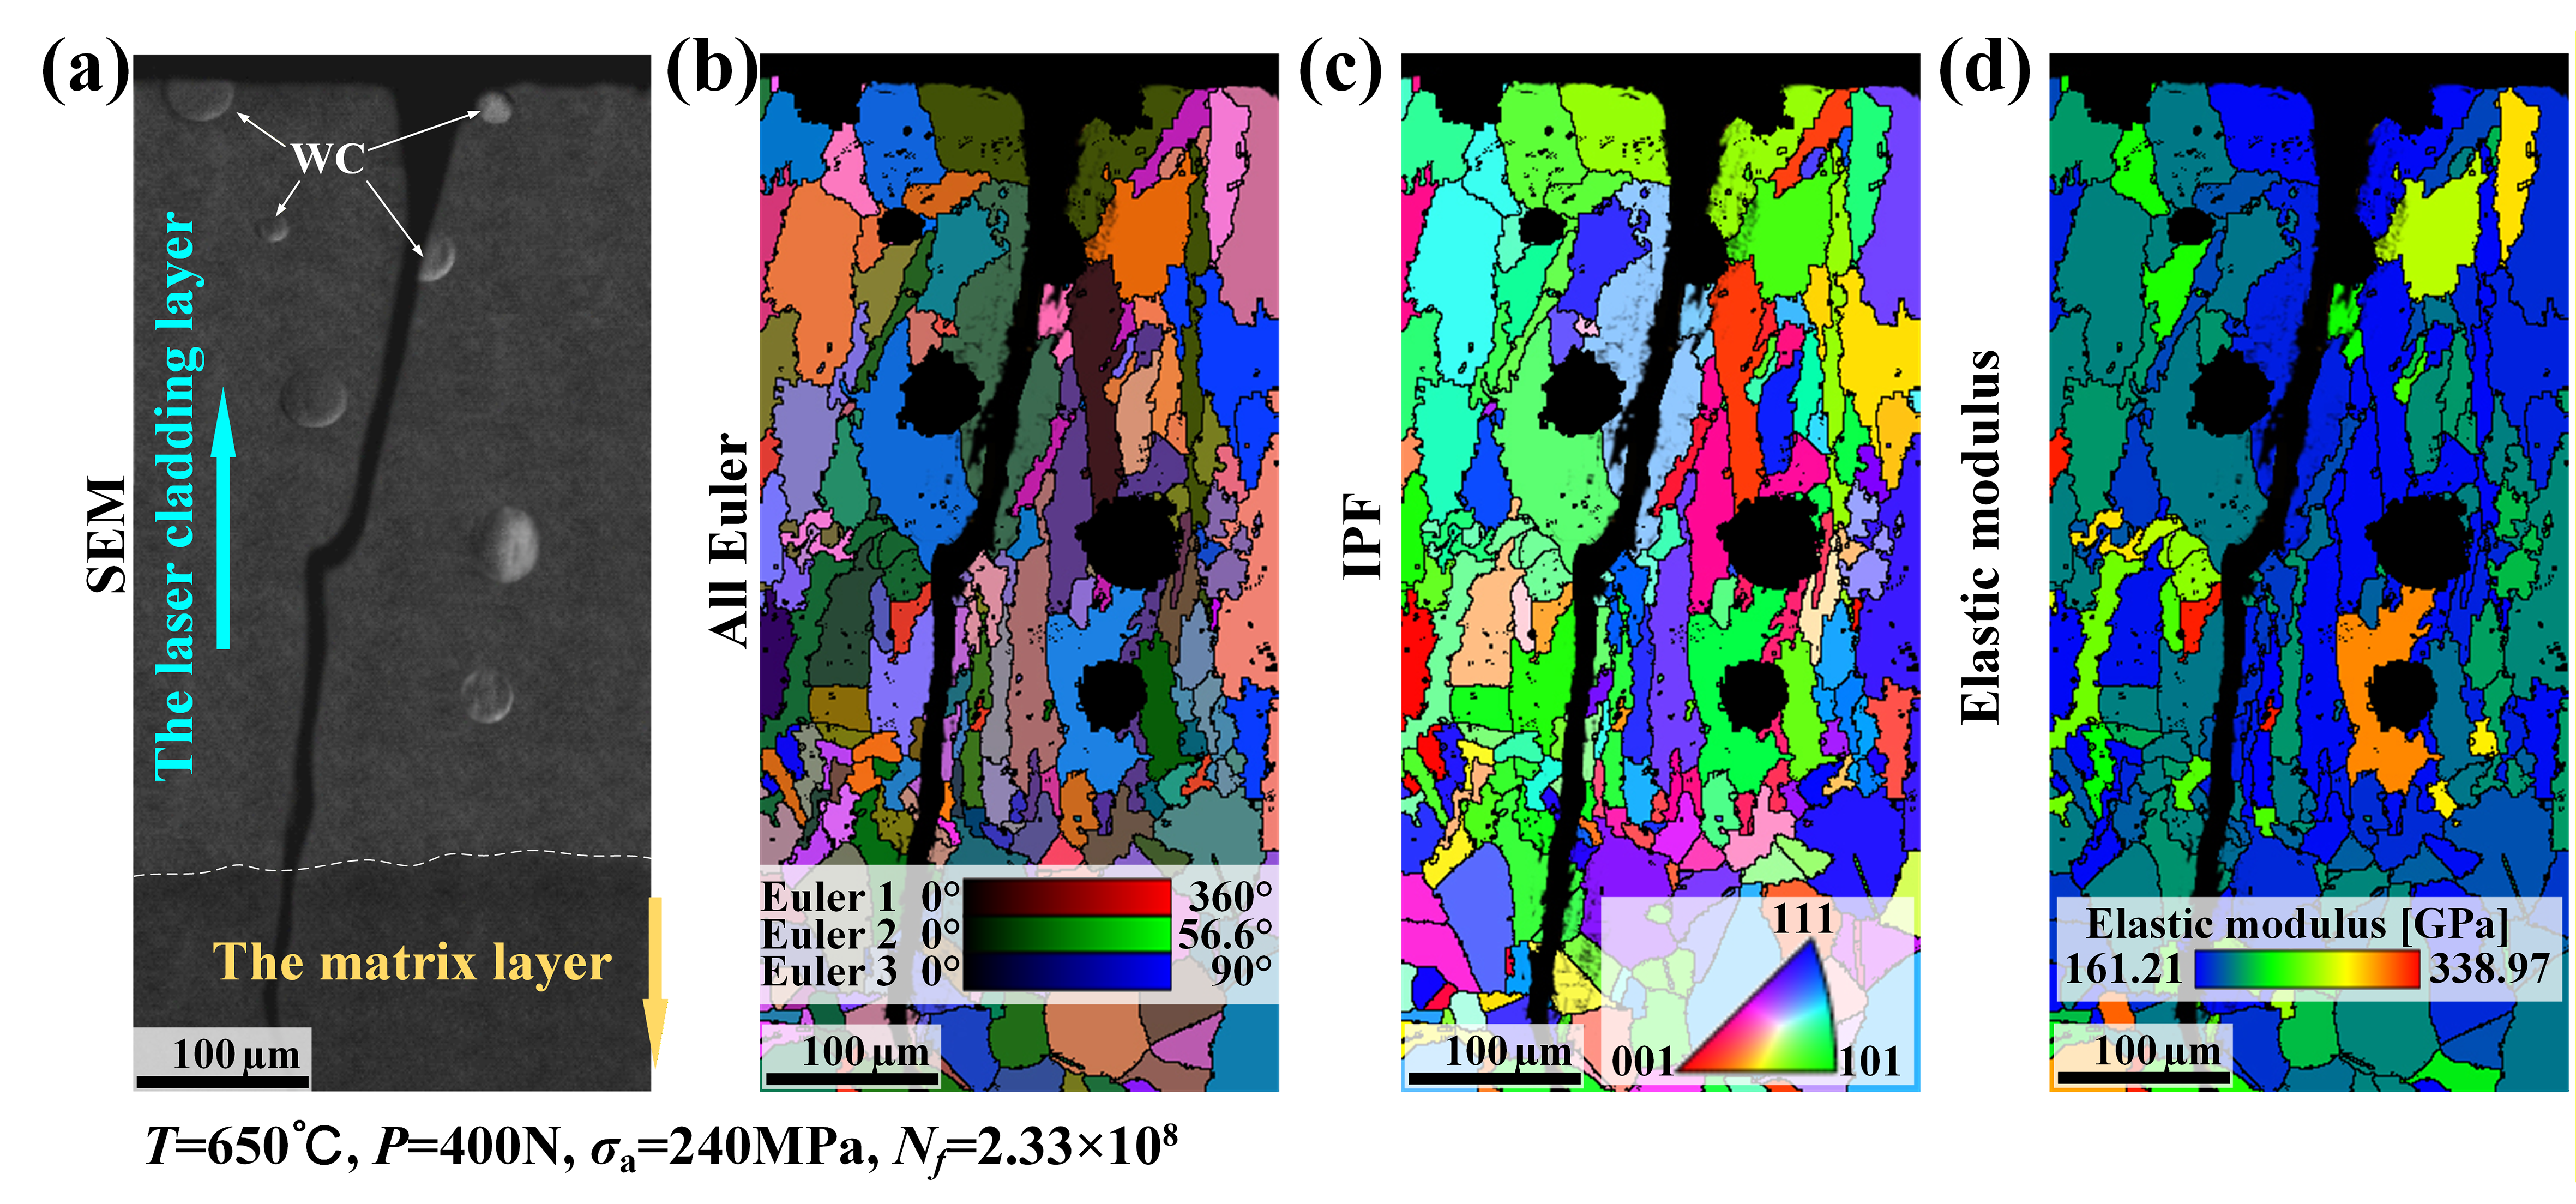
EBSD was used to examine the microstructure of grains along the crack propagation path under the conditions of T = 650   , P = 400   N , σ a = 240   MPa , and N f = 2.33 × 10 8 cycles (Figure 10). A clear distinction between the clad layer and the matrix can be observed: the matrix appears dark gray, while the clad layer appears light gray. Additionally, WC particles are uniformly distributed in the clad layer (Figure 10a). In laser cladding, at the bottom region near the coating–substrate interface, the high thermal gradient combined with rapid heat extraction into the substrate creates conditions conducive to the formation of finer grains. Conversely, in the top region of the coating, the reduced thermal gradient and slower cooling rates allow for more extensive grain growth before complete solidification. The lower heat dissipation rate to the environment compared to the substrate enables grains to grow larger. Therefore, the grain size in the clad layer is significantly larger than that in the matrix; grains closer to the matrix-coating layer interface are smaller, while those farther away are larger. Small-sized grains are also scattered throughout the clad layer (Figure 10b). No concentrated texture was observed in the clad layer (Figure 10c) and the grain elastic modulus in the selected area ranges from 161.21 GPa to 338.97 GPa (Figure 10d).
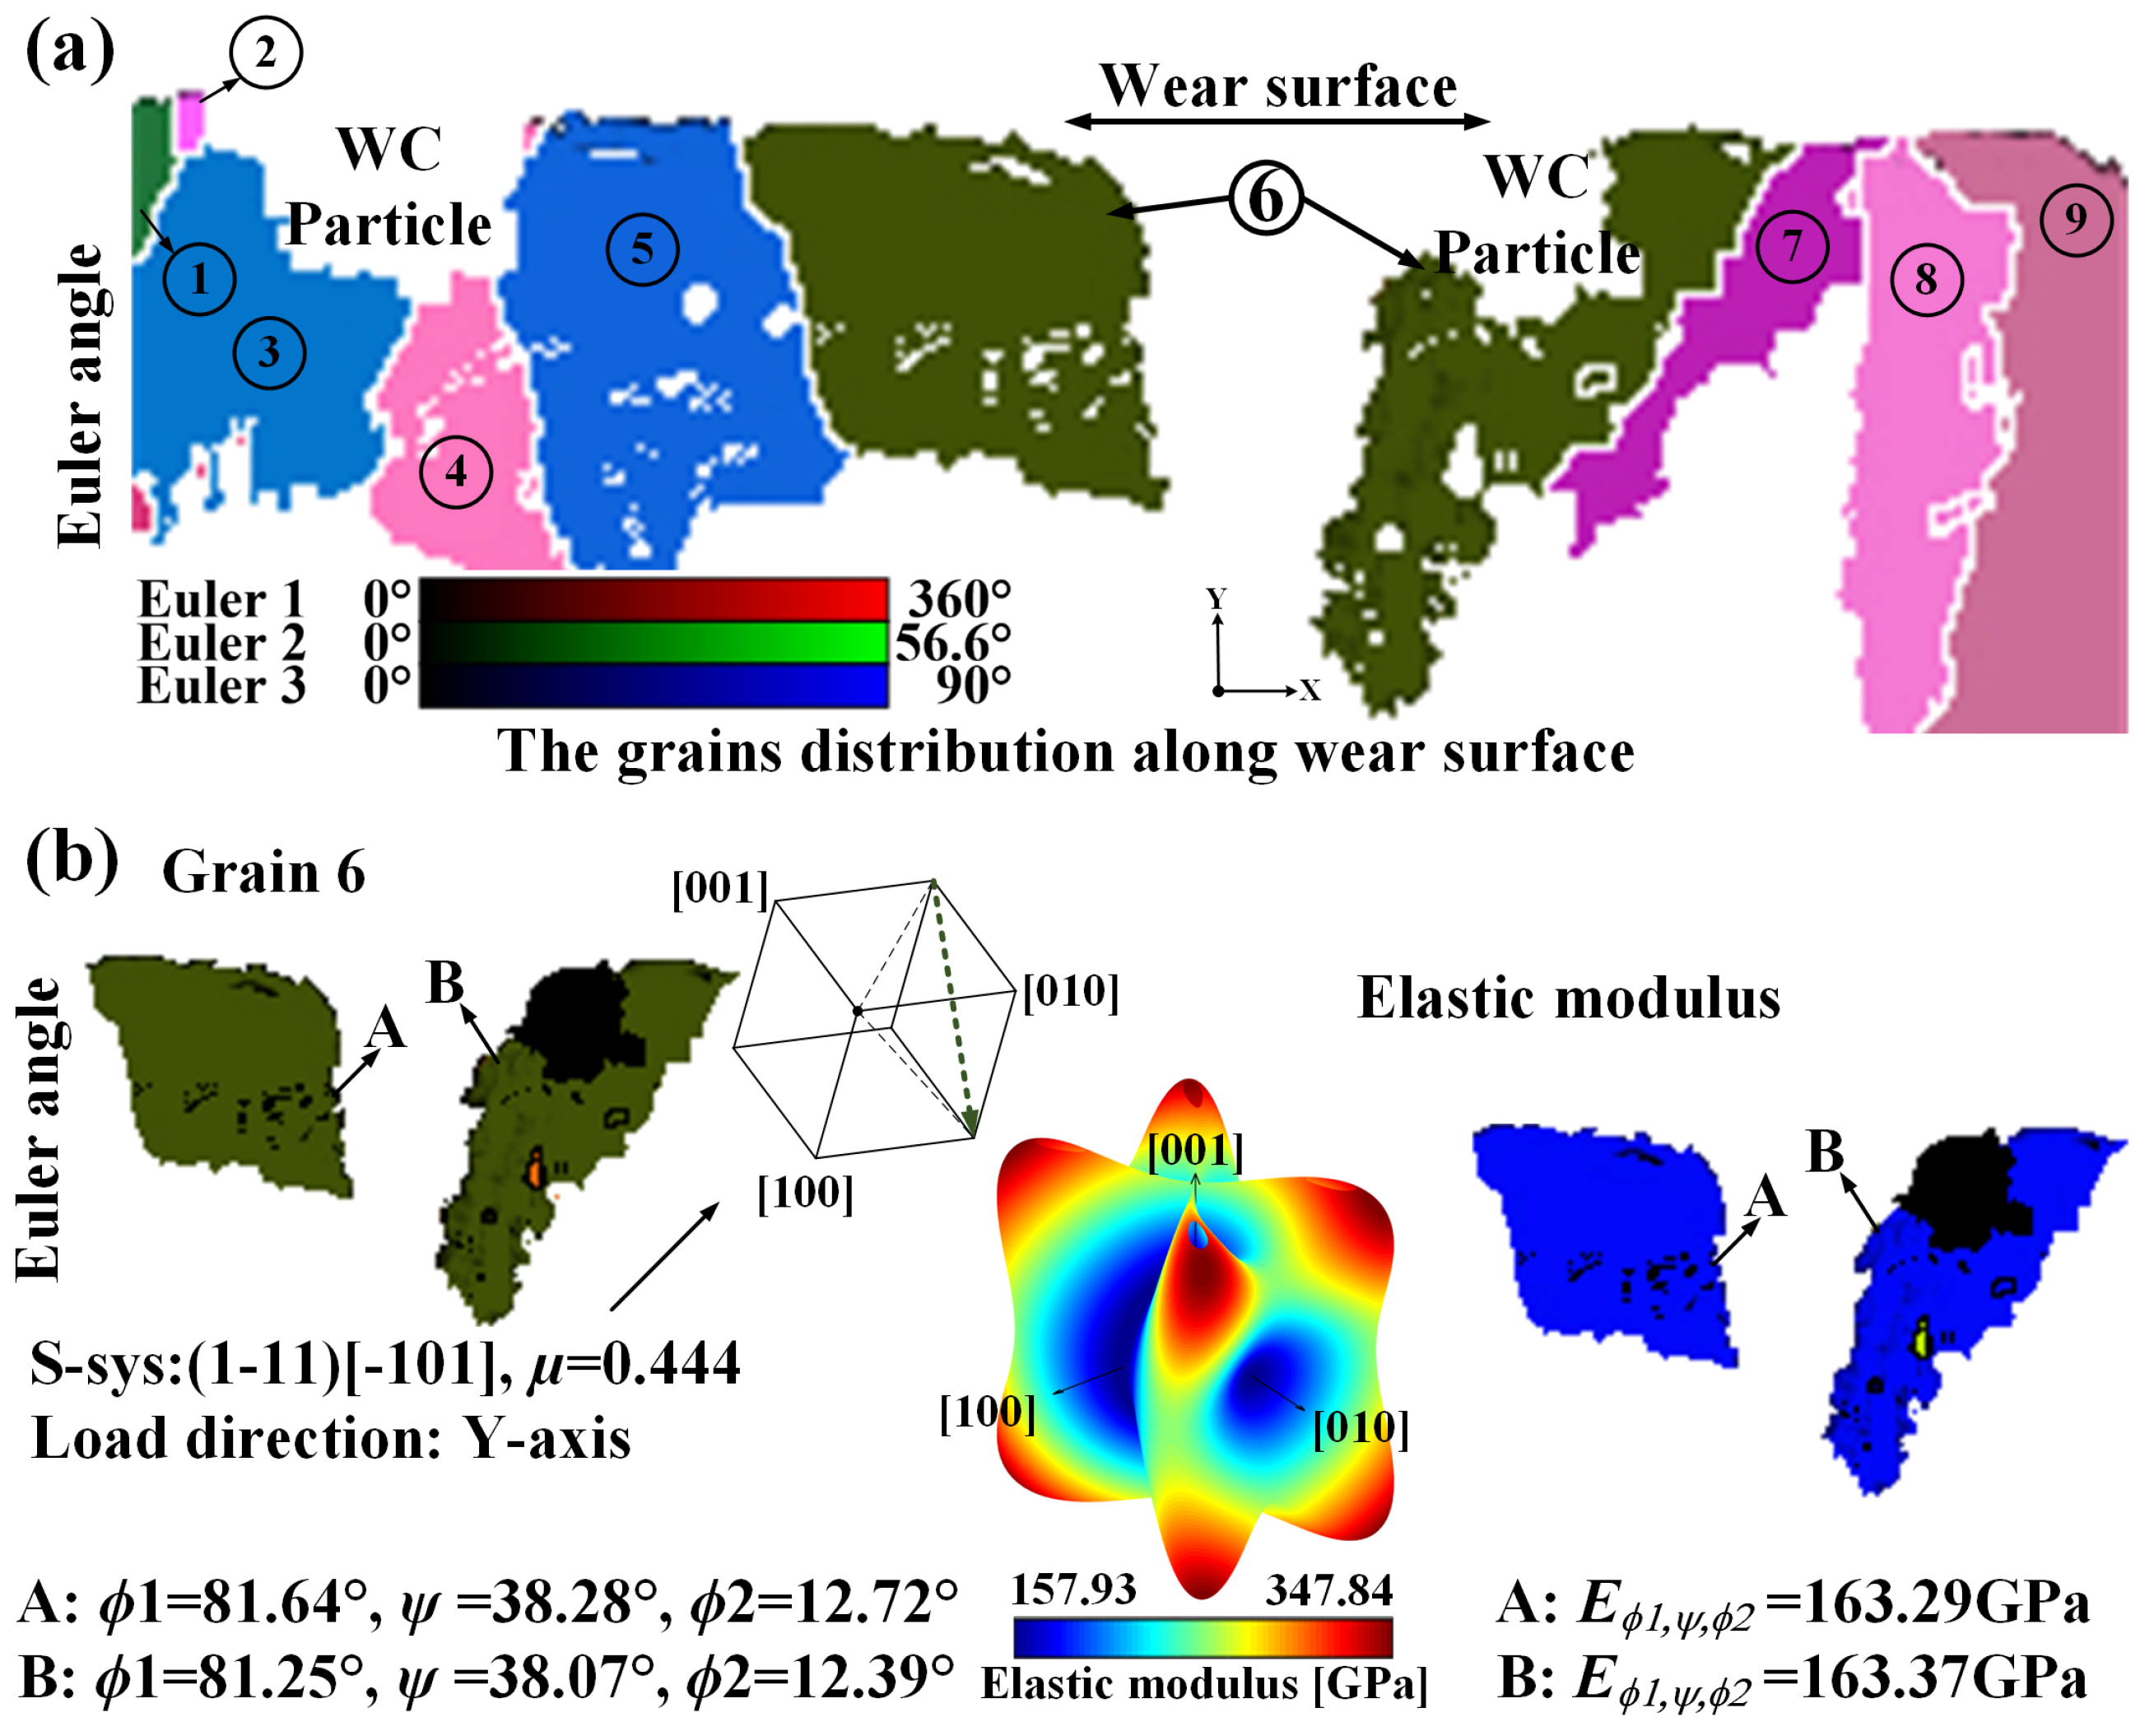
In fretting fatigue, crack initiation typically occurs on the fretting contact surface (Figure 8 and Figure 10); thus, the microstructural characteristics of grains present on this contact surface were examined in detail (refer to Figure 11). Grain A has Euler angles of ϕ 1   =   81.64 ° , ψ   =   38.28 ° , ϕ 2   =   12.72 ° , while grain B has Euler angles of ϕ 1   =   81.25 ° , ψ   =   38.07 ° , ψ   =   12.39 ° . These results indicate that both grain A and grain B are classified within the same group of grains (grain 6 in Figure 11b), which has an elastic modulus of 163.29 GPa. Since crack initiation is observed to take place on the fretting contact surface, grain 6 has been recognized as the site where cracks begin.
Observations reveal that the slip system activated in grain 6, the grain where the crack originates, is denoted as (1-11) [-101]. This indicates a substantial likelihood of slip occurring (μ = 0.444). The slip direction aligns with the pattern of accumulation and transfer of slips, running parallel to the crack path associated with grain A.
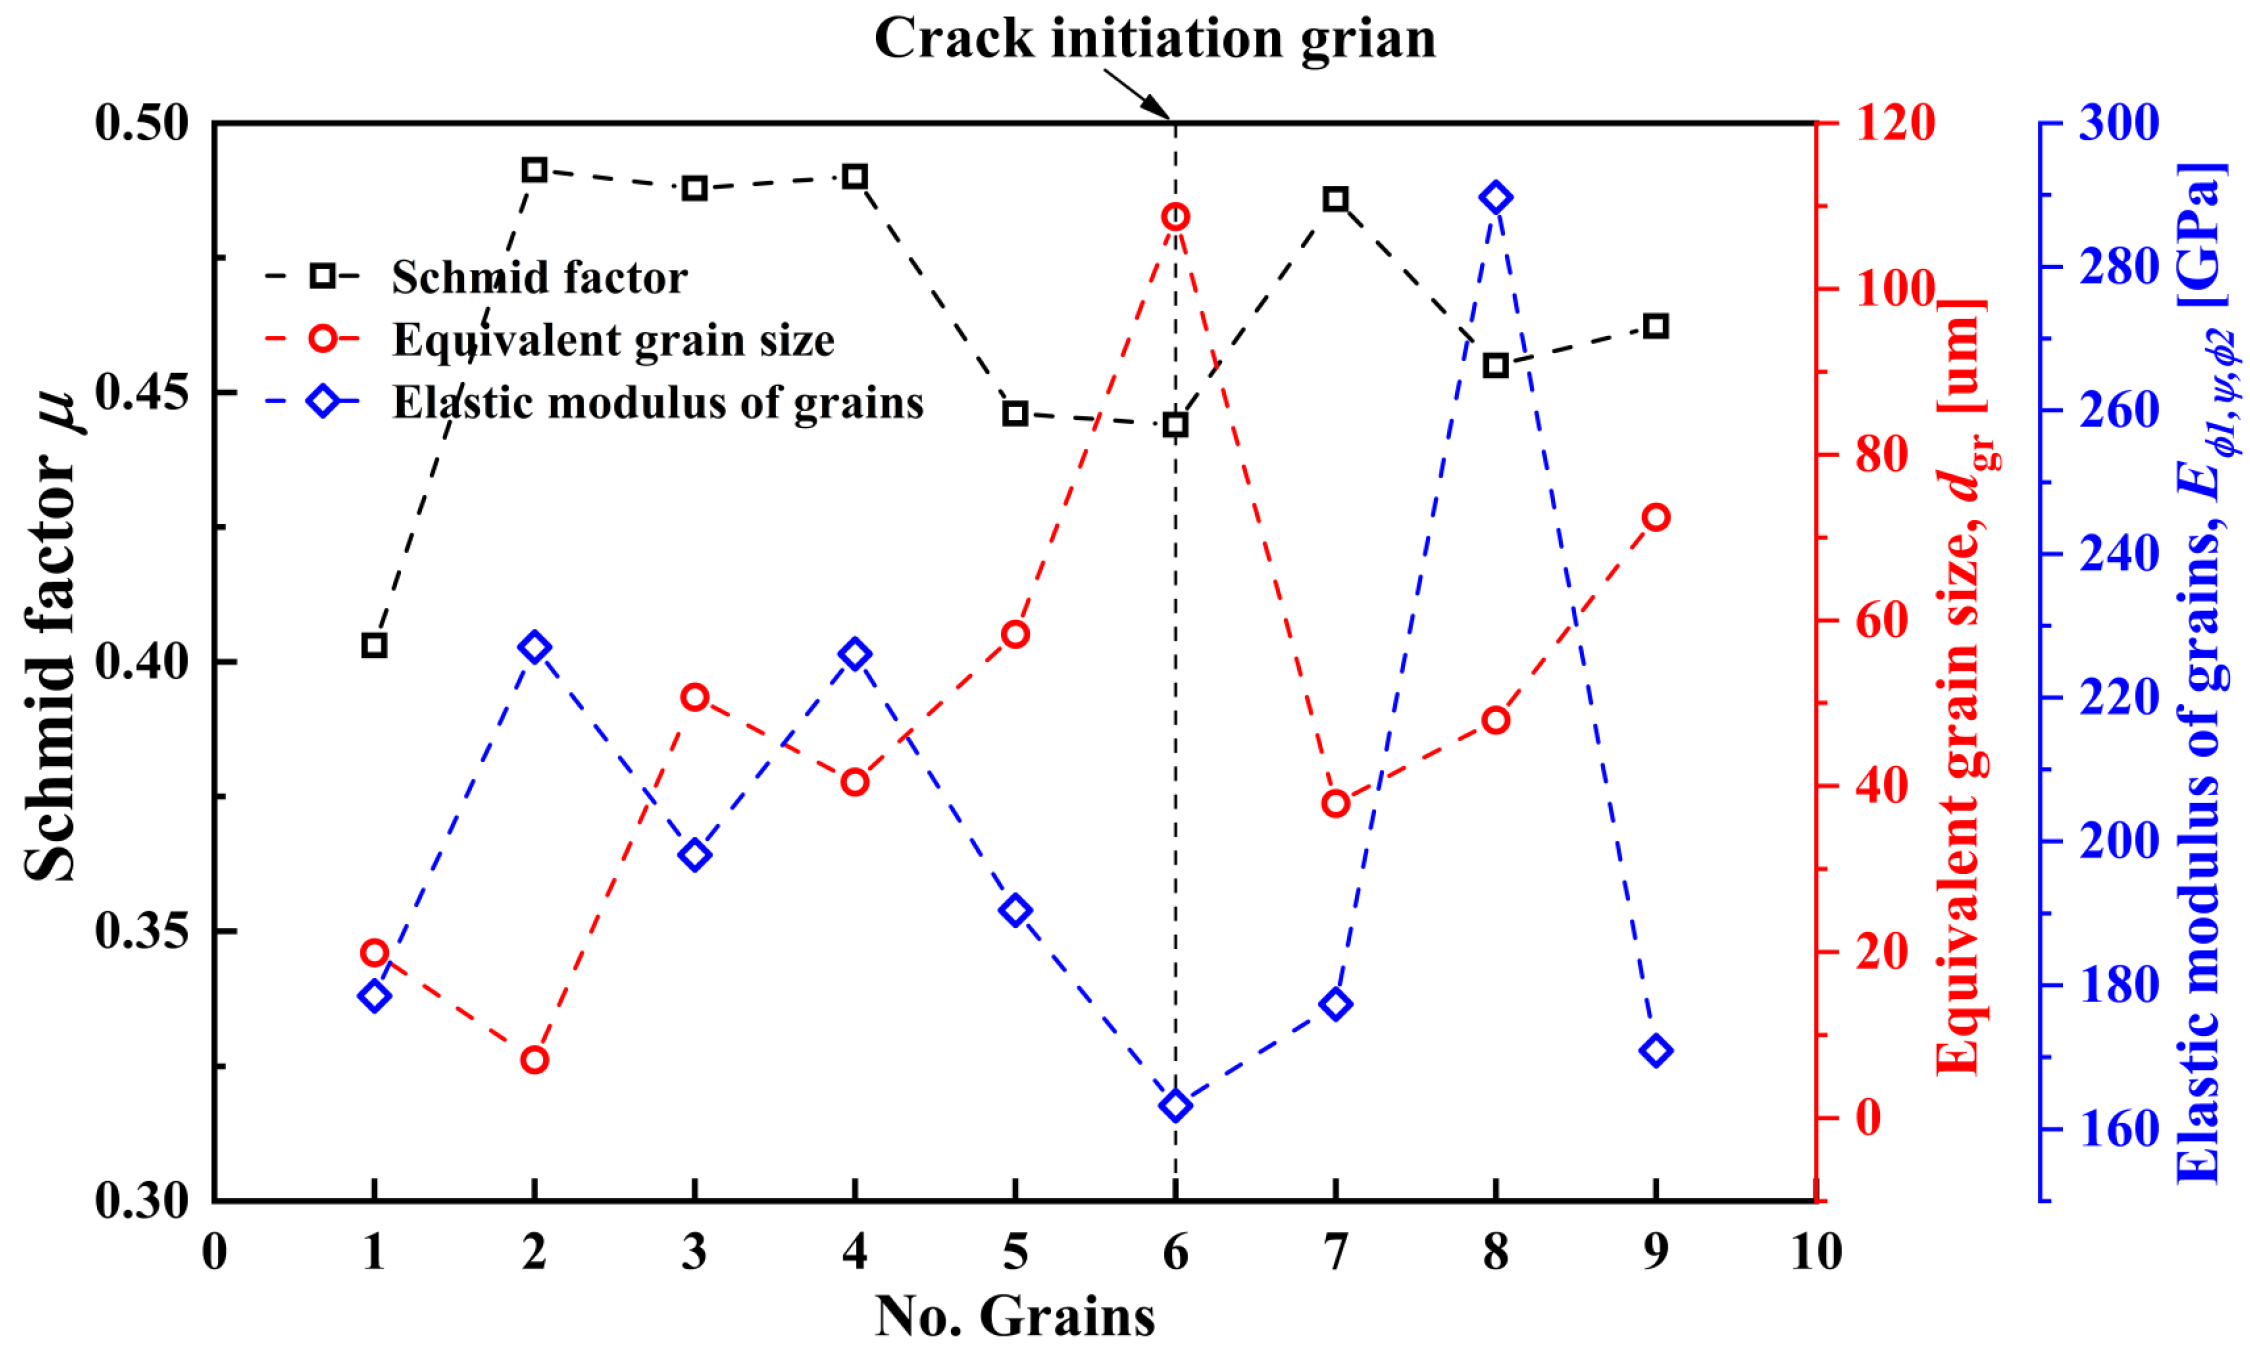
A statistical analysis was conducted on the microstructural characteristics of grains at the contact interface, focusing on the grain elastic modulus, Schmid factor, and equivalent grain size (Figure 12). The findings reveal that cracks tend to initiate more frequently in grains that exhibit reduced elastic modulus and elevated Schmid factors and larger sizes. An increased Schmid factor suggests a higher likelihood of slip system activation. According to the Hall–Petch law, larger grain sizes lead to lower grain yield strength—causing the material to yield under low loads and enter the plastic stage, which accelerates the transfer of plastic deformation or plastic slip. The elastic modulus of a grain reflects the stiffness of the material; grains with higher elastic moduli in the fretting contact zone exhibit stronger deformation resistance, so cracks tend to initiate in grains with lower elastic moduli (weaker stiffness).
Although the Schmid factor is a crucial metric for evaluating how microstructure influences crack initiation (as it directly reflects the potential for slip system activation), it is worth noting that the Schmid factor for the activated slip system within grain 6 is not the maximum compared to other contact grains. This suggests that predicting crack initiation sites based solely on the Schmid factor is inadequate. Instead, the synergistic effects of the equivalent grain size, grain elastic modulus, and Schmid factor, must be considered.

4. Simulation and Analysis of Fretting Fatigue

4.1. Crystal Plasticity Constitutive Model

A deterministic, physics-based crystal plasticity constitutive model was used to describe the crystal plastic behavior of IN718 at the grain scale; this model is described in detail in previous studies [38,39]. A rate-dependent constitutive model was employed to capture slip activation on the 12 FCC slip systems (<110>{111}). The slip rate can be expressed as
γ ˙ α = γ ˙ 0 τ α χ α g α m s g n τ α χ α
where
γ ˙ 0 is the initial slip rate, m is the rate-sensitive exponent, and τ α , g α , and χ α are the resolved shear stress, slip resistance, and back stress on the slip system α , respectively. Prithivirajan and Sangid [38,40] noted that the evolution of slip resistance and back stress during cyclic deformation follows the criteria below:
g ˙ α = H β = 1 12 q α β γ ˙ β H d g α β = 1 12 γ ˙ β
χ ˙ α = A γ ˙ α A d χ α γ ˙ α
where
H d and H are the dynamic recovery and direct hardening coefficients for back stress; A d and A are the dynamic recovery and direct hardening coefficients for slip resistance; and q α β represents the interaction between slip systems.

4.2. Fatigue Indicator Parameter

VHCFF is a multiaxial fatigue problem. To better reflect the influence of material microstructure on fretting fatigue crack initiation, it is essential to establish a directional fatigue damage parameter (FIP) for predicting where cracks might begin. Brown and Miller et al. [41] emphasized the role of both cyclic shear strain and normal strain in promoting crack initiation; they proposed that the critical plane, which is where the maximum amplitude of shear strain occurs, is vital for comprehending multiaxial fatigue behavior. Consequently, a FIP that combines the maximum shear strain amplitude with normal strain along the critical plane has been suggested, and this multiaxial fatigue criterion has been extensively applied in later research [42].
Brown et al. [41] and Smith et al. [42] used a linear combination of the maximum shear strain amplitude ΔΓmax and the normal strain ΔEn on the critical plane as a damage parameter to analyze multiaxial fatigue failure behavior, achieving good results in fatigue damage analysis. However, since the damage parameters they constructed are based on macroscopic responses, they do not consider the driving effect of dislocation slip in the material crack nucleation process, making it difficult to accurately explain the multiaxial fatigue failure mechanism of the material at the microscopic scale. Therefore, in this study, the cumulative plastic strain, total dislocation density, grain elastic modulus, and equivalent grain size of the material during fatigue cycles were integrated into the linear combination of normal strain and shear strain. The fatigue damage parameters of the activated slip system were calculated and defined as the fatigue indicator parameter, expressed as follows:
F I P = Δ γ p a 2 + d g r ρ G N D + ρ S S D k σ n a E n ,   ϕ 1 , ψ , ϕ 2 a
ρ G N D = η P b
ρ S S D = 3 ε ¯ P b l
where
Δ γ p a is cyclic plastic shear strain range on the activated slip system, d g r = A g r is the grain size, A g r is the grain area, σ n a is the peak normal stress on the activated slip system, and k is a material constant. The total dislocation density is assumed to be the sum of the geometrically necessary dislocation (GND) density ( ρ G N D ) and the statistically stored dislocation (SSD) density ( ρ S S D ) [43]. ρ G N D accommodates plastic strain gradients, while ρ S S D corresponds to homogeneous plastic deformation [43]. η P is the equivalent plastic strain gradient [44], b is the Burgers vector magnitude (0.257 nm for IN718 [45]), ε ¯ P is the equivalent plastic strain, and l is a material length scale (on the order of b G / σ y i e l d 2 [46]; set to 0.608 μm at 650 °C in this study).
The proposed FIP improves upon existing models by integrating multiple microstructure-sensitive physical factors into a unified linear framework, specifically tailored for fretting fatigue under very-high-cycle conditions. The key distinction lies in its ability to simultaneously account for local plastic deformation, dislocation accumulation, grain-scale stiffness heterogeneity, and grain size effects—factors that are often treated in isolation or omitted in conventional FIPs, as listed in Table 2.
As shown in Table 2, while prior models emphasize macroscopic strain or energy metrics, they do not explicitly incorporate grain-specific elastic anisotropy or grain size effects—both of which are critical in fretting fatigue where stress concentration and slip localization are highly microstructure-dependent.
Existing FIPs (e.g., Brown–Miller [39], Fatemi–Socie [47]) are effective in characterizing macroscopic fatigue damage but exhibit limitations in predicting crack initiation sites in heterogeneous microstructures under fretting conditions. The specifics are as follows:
(1)
They assume homogeneous material properties, neglecting the fact that grains with lower elastic moduli experience higher strain concentrations under the same stress, accelerating crack initiation.
(2)
They do not account for the Hall–Petch effect, wherein larger grains yield more readily under cyclic loading, promoting slip transfer and crack nucleation.
(3)
By incorporating grain-level elastic modulus (Eϕ1,ψ,ϕ2) and equivalent grain size (dgr), our FIP addresses two key physical mechanisms. Elastic anisotropy: The inclusion of the grain-specific elastic modulus (E) introduces the effect of elastic anisotropy, giving higher damage weight to softer grains (with lower E) that experience higher local strains under the same stress, as consistently observed in our EBSD analysis (Figure 12). Grain size effect: The equivalent grain size (dgr) accounts for the Hall–Petch effect, recognizing that larger grains yield more readily, promoting slip localization and crack initiation.
These additions enable the model to predict crack initiation sites with higher accuracy in laser-clad IN718/WC coatings, where microstructure heterogeneity is significant (Figure 10). In addition, The cyclic plastic shear strain ( Δ γ p a ) serves as the fundamental driver of fatigue damage, identifying regions of high plastic activity. The total dislocation density ( ρ G N D + ρ S S D ) incorporates the accumulation of micro-scale defects, crucial for capturing damage under VHCFF conditions.

4.3. CPFEM Simulation Model

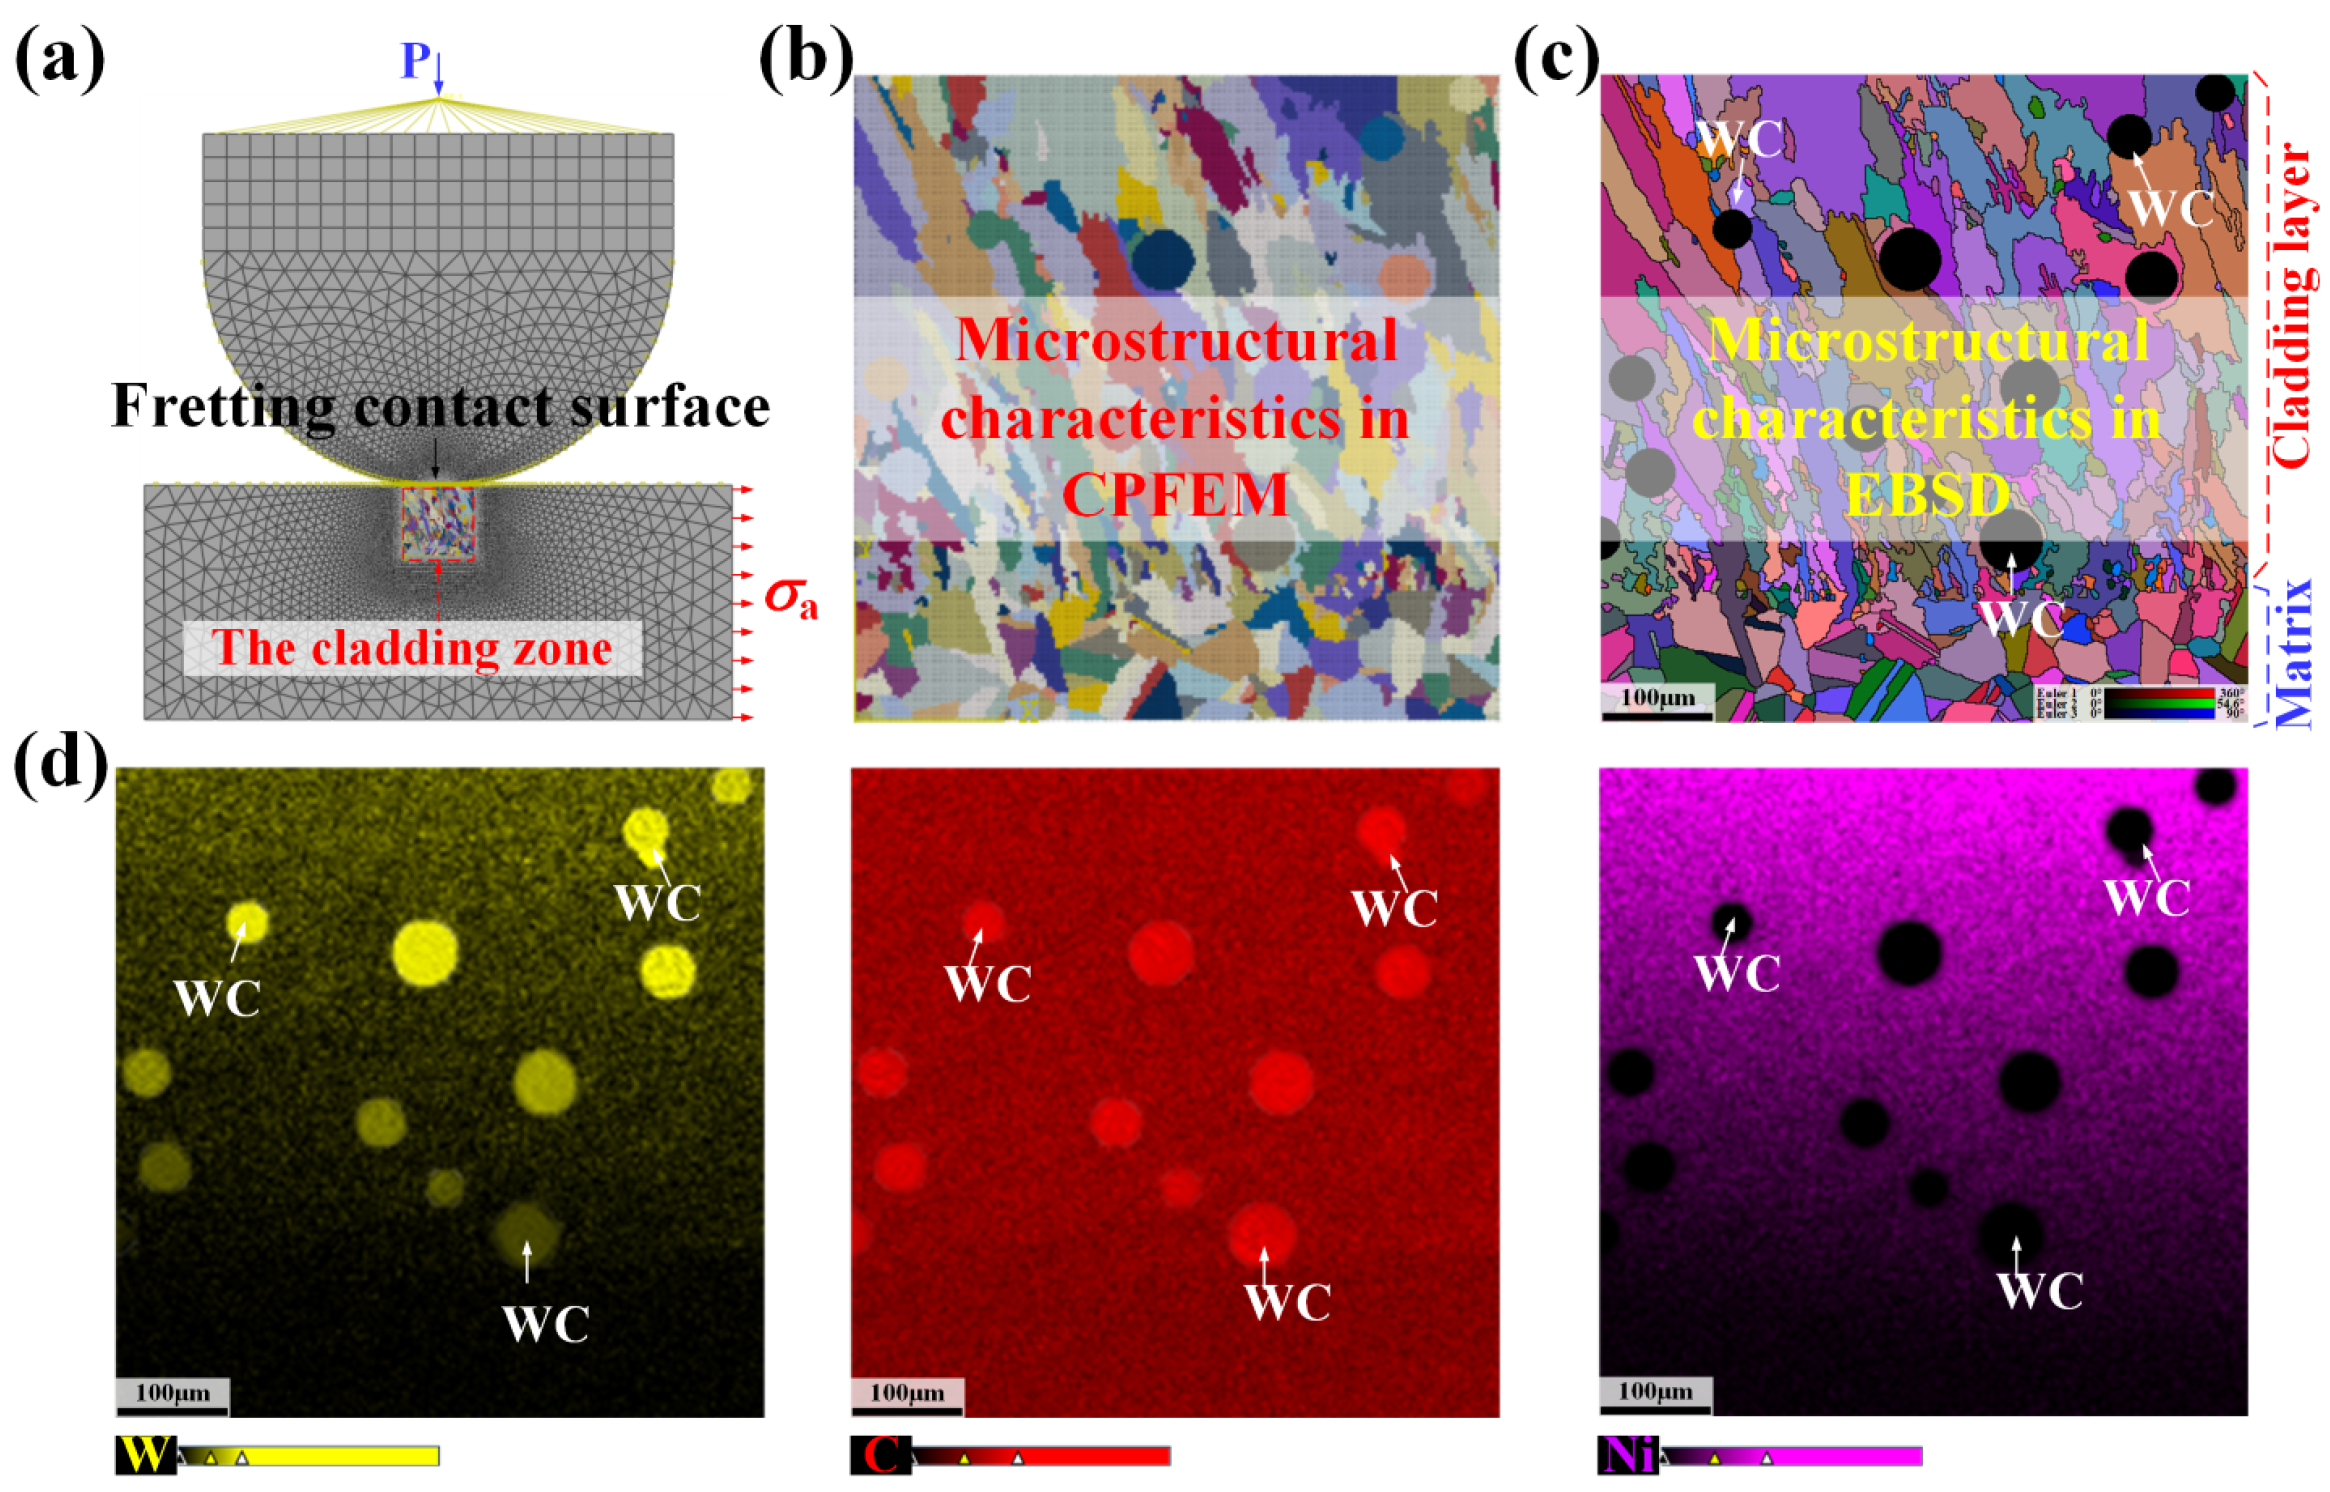
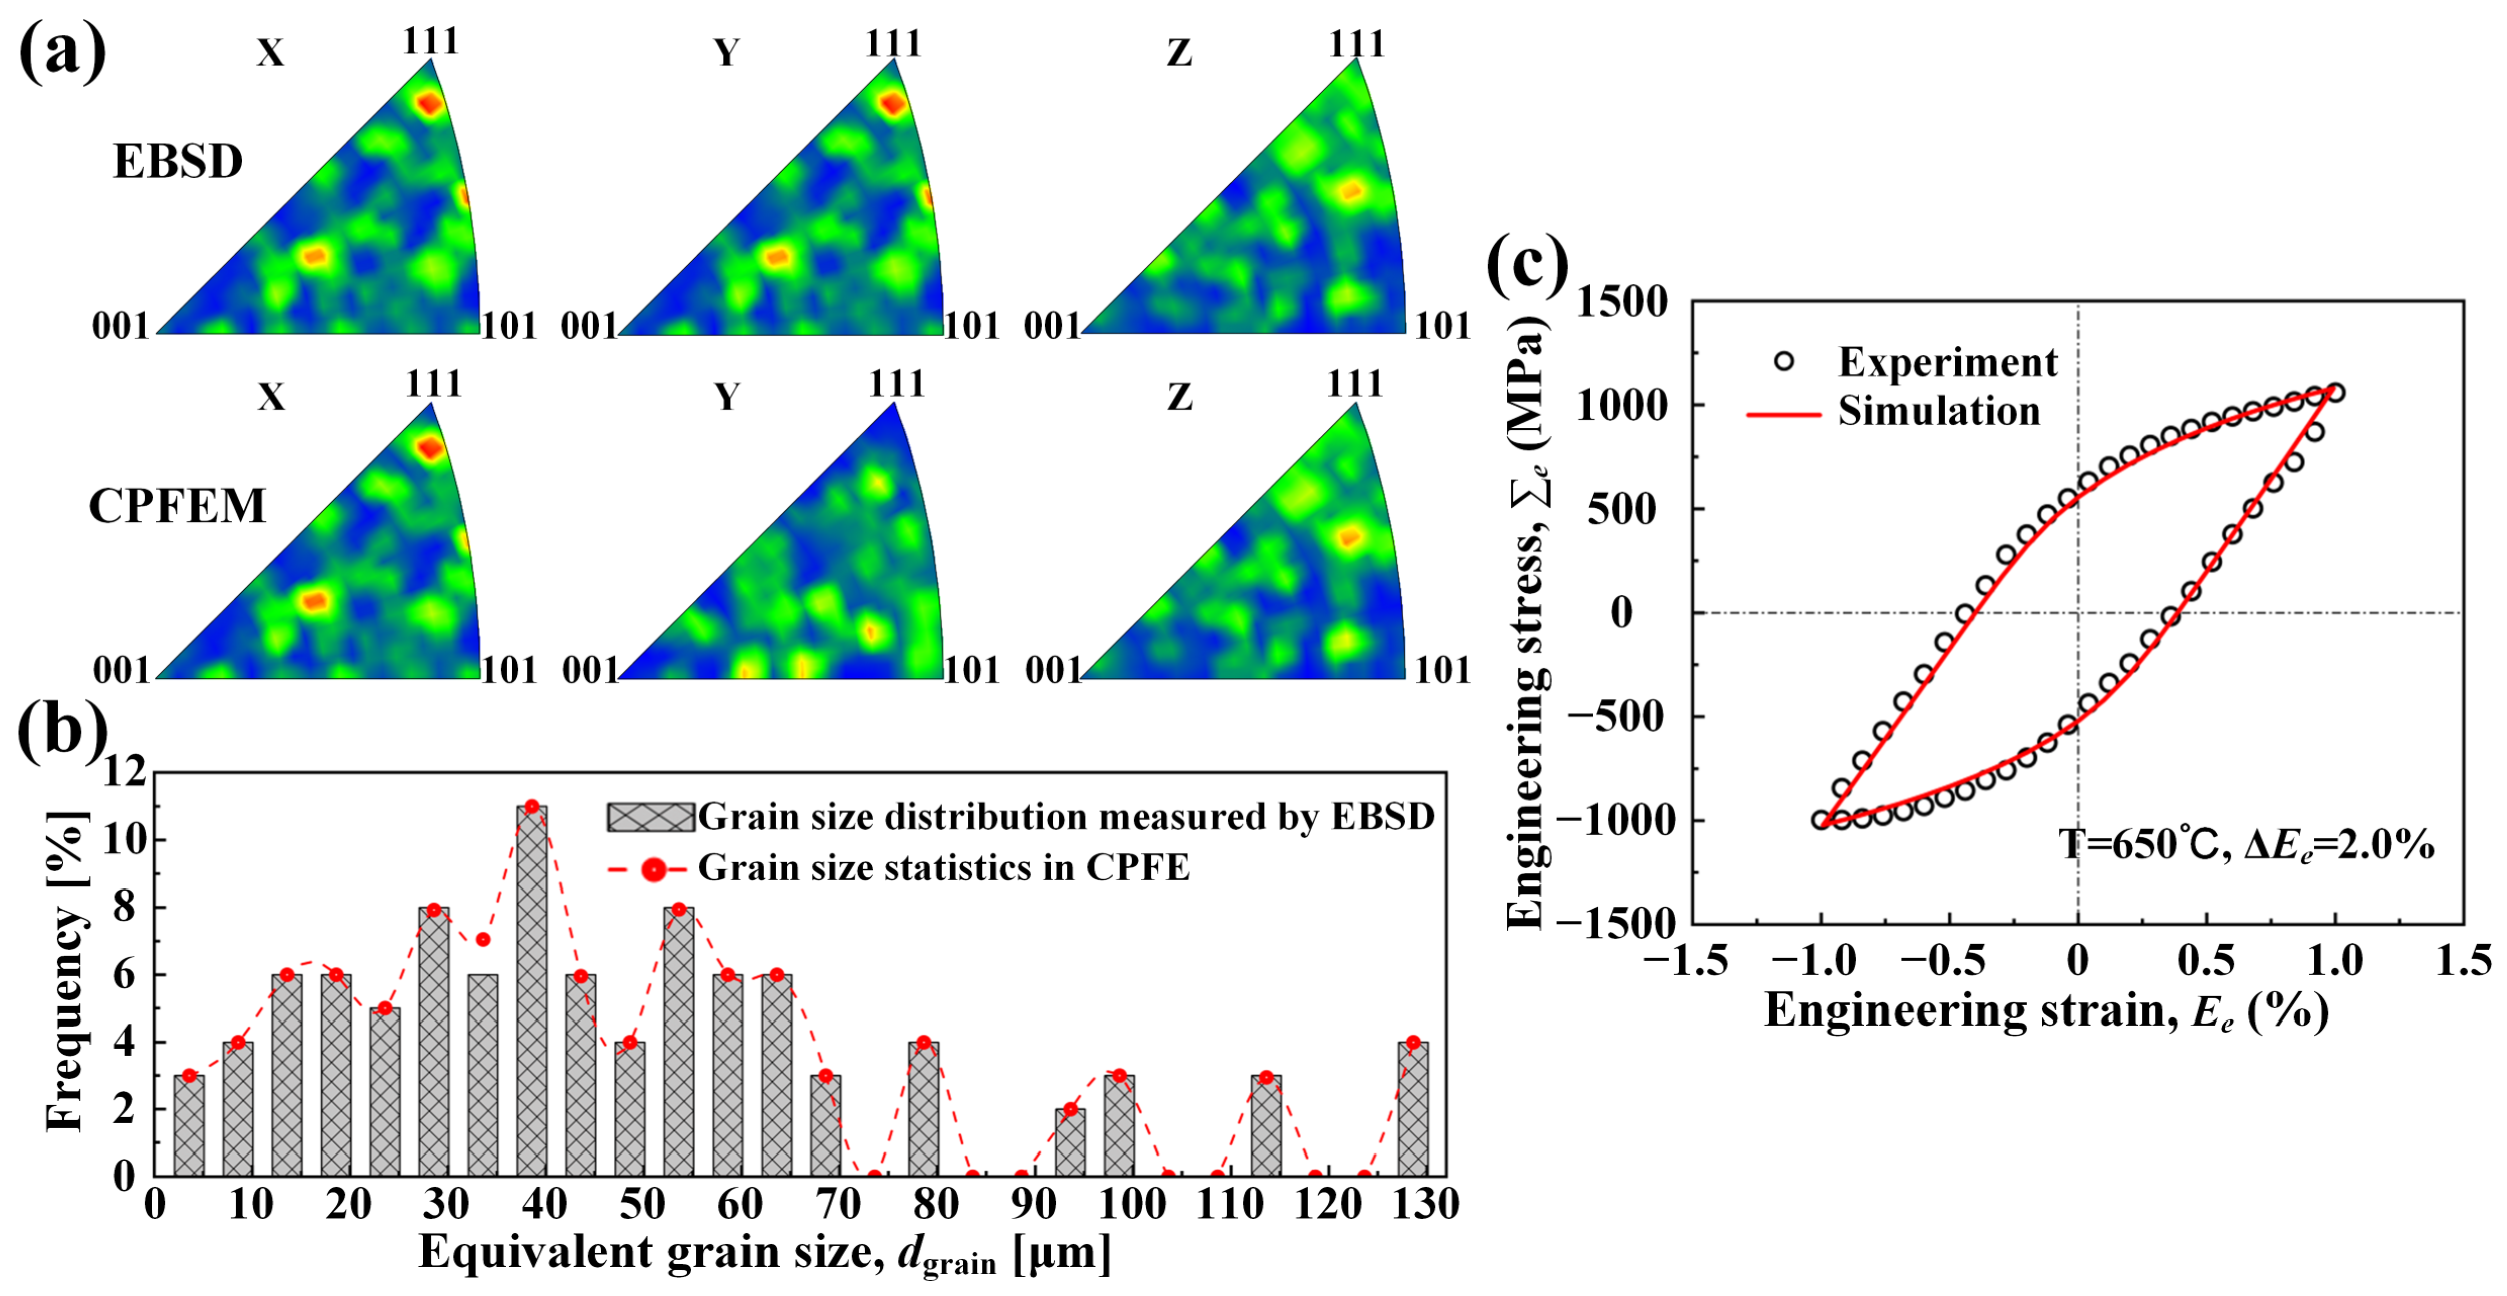
Figure 13a presents the finite element model with fretting contact, incorporating the original IN718/20% WC EBSD test data to accurately capture the microstructural information. The CPFEM is developed based on the Euler angles and test points. The calculation model effectively corresponds to the EBSD-measured data regarding grain morphology and size, as depicted in Figure 13b,c. Figure 13d presents the elemental distribution within the CPFE region. Distinct enrichment of W and C elements is observed at locations corresponding to the WC particles. Crucially, the regions enriched in W and C coincide exactly with the WC particle positions defined in the CPFE model, validating the accuracy of the CPFE modeling approach. Moreover, Figure 14a,b indicate that the grain size distribution and orientation information from the calculation model correlate well with the EBSD-observed data. Hence, the use of the calculation model is suitable for simulating the fretting damage behavior of IN718/20% WC. The determination of the crystal plasticity constitutive model parameters, as discussed in Section 4.1, was carried out through a systematic and iterative calibration procedure. This process was primarily driven by the objective of achieving a high-fidelity match between the simulated cyclic mechanical response and the experimental stress–strain data obtained for the IN718/20% WC composite coating at 650 °C. The core fitting target was the accurate reproduction of the cyclic stress–strain loop shape, including its characteristic stress amplitude, loop width, and the transition behavior between elastic and plastic deformation regimes, as captured in the experimental hysteresis curves. Parameters were not treated as isolated entities but were calibrated as an interdependent set to ensure physical consistency. The calibration involved continuously fine-tuning their values until a satisfactory correlation was achieved between the simulated and experimental stress–strain curves. The close alignment demonstrated serves as validation for the parameter set compiled in Table 3. While initial values were informed by established material behavior, all parameters were ultimately optimized against the specific experimental data of this study.
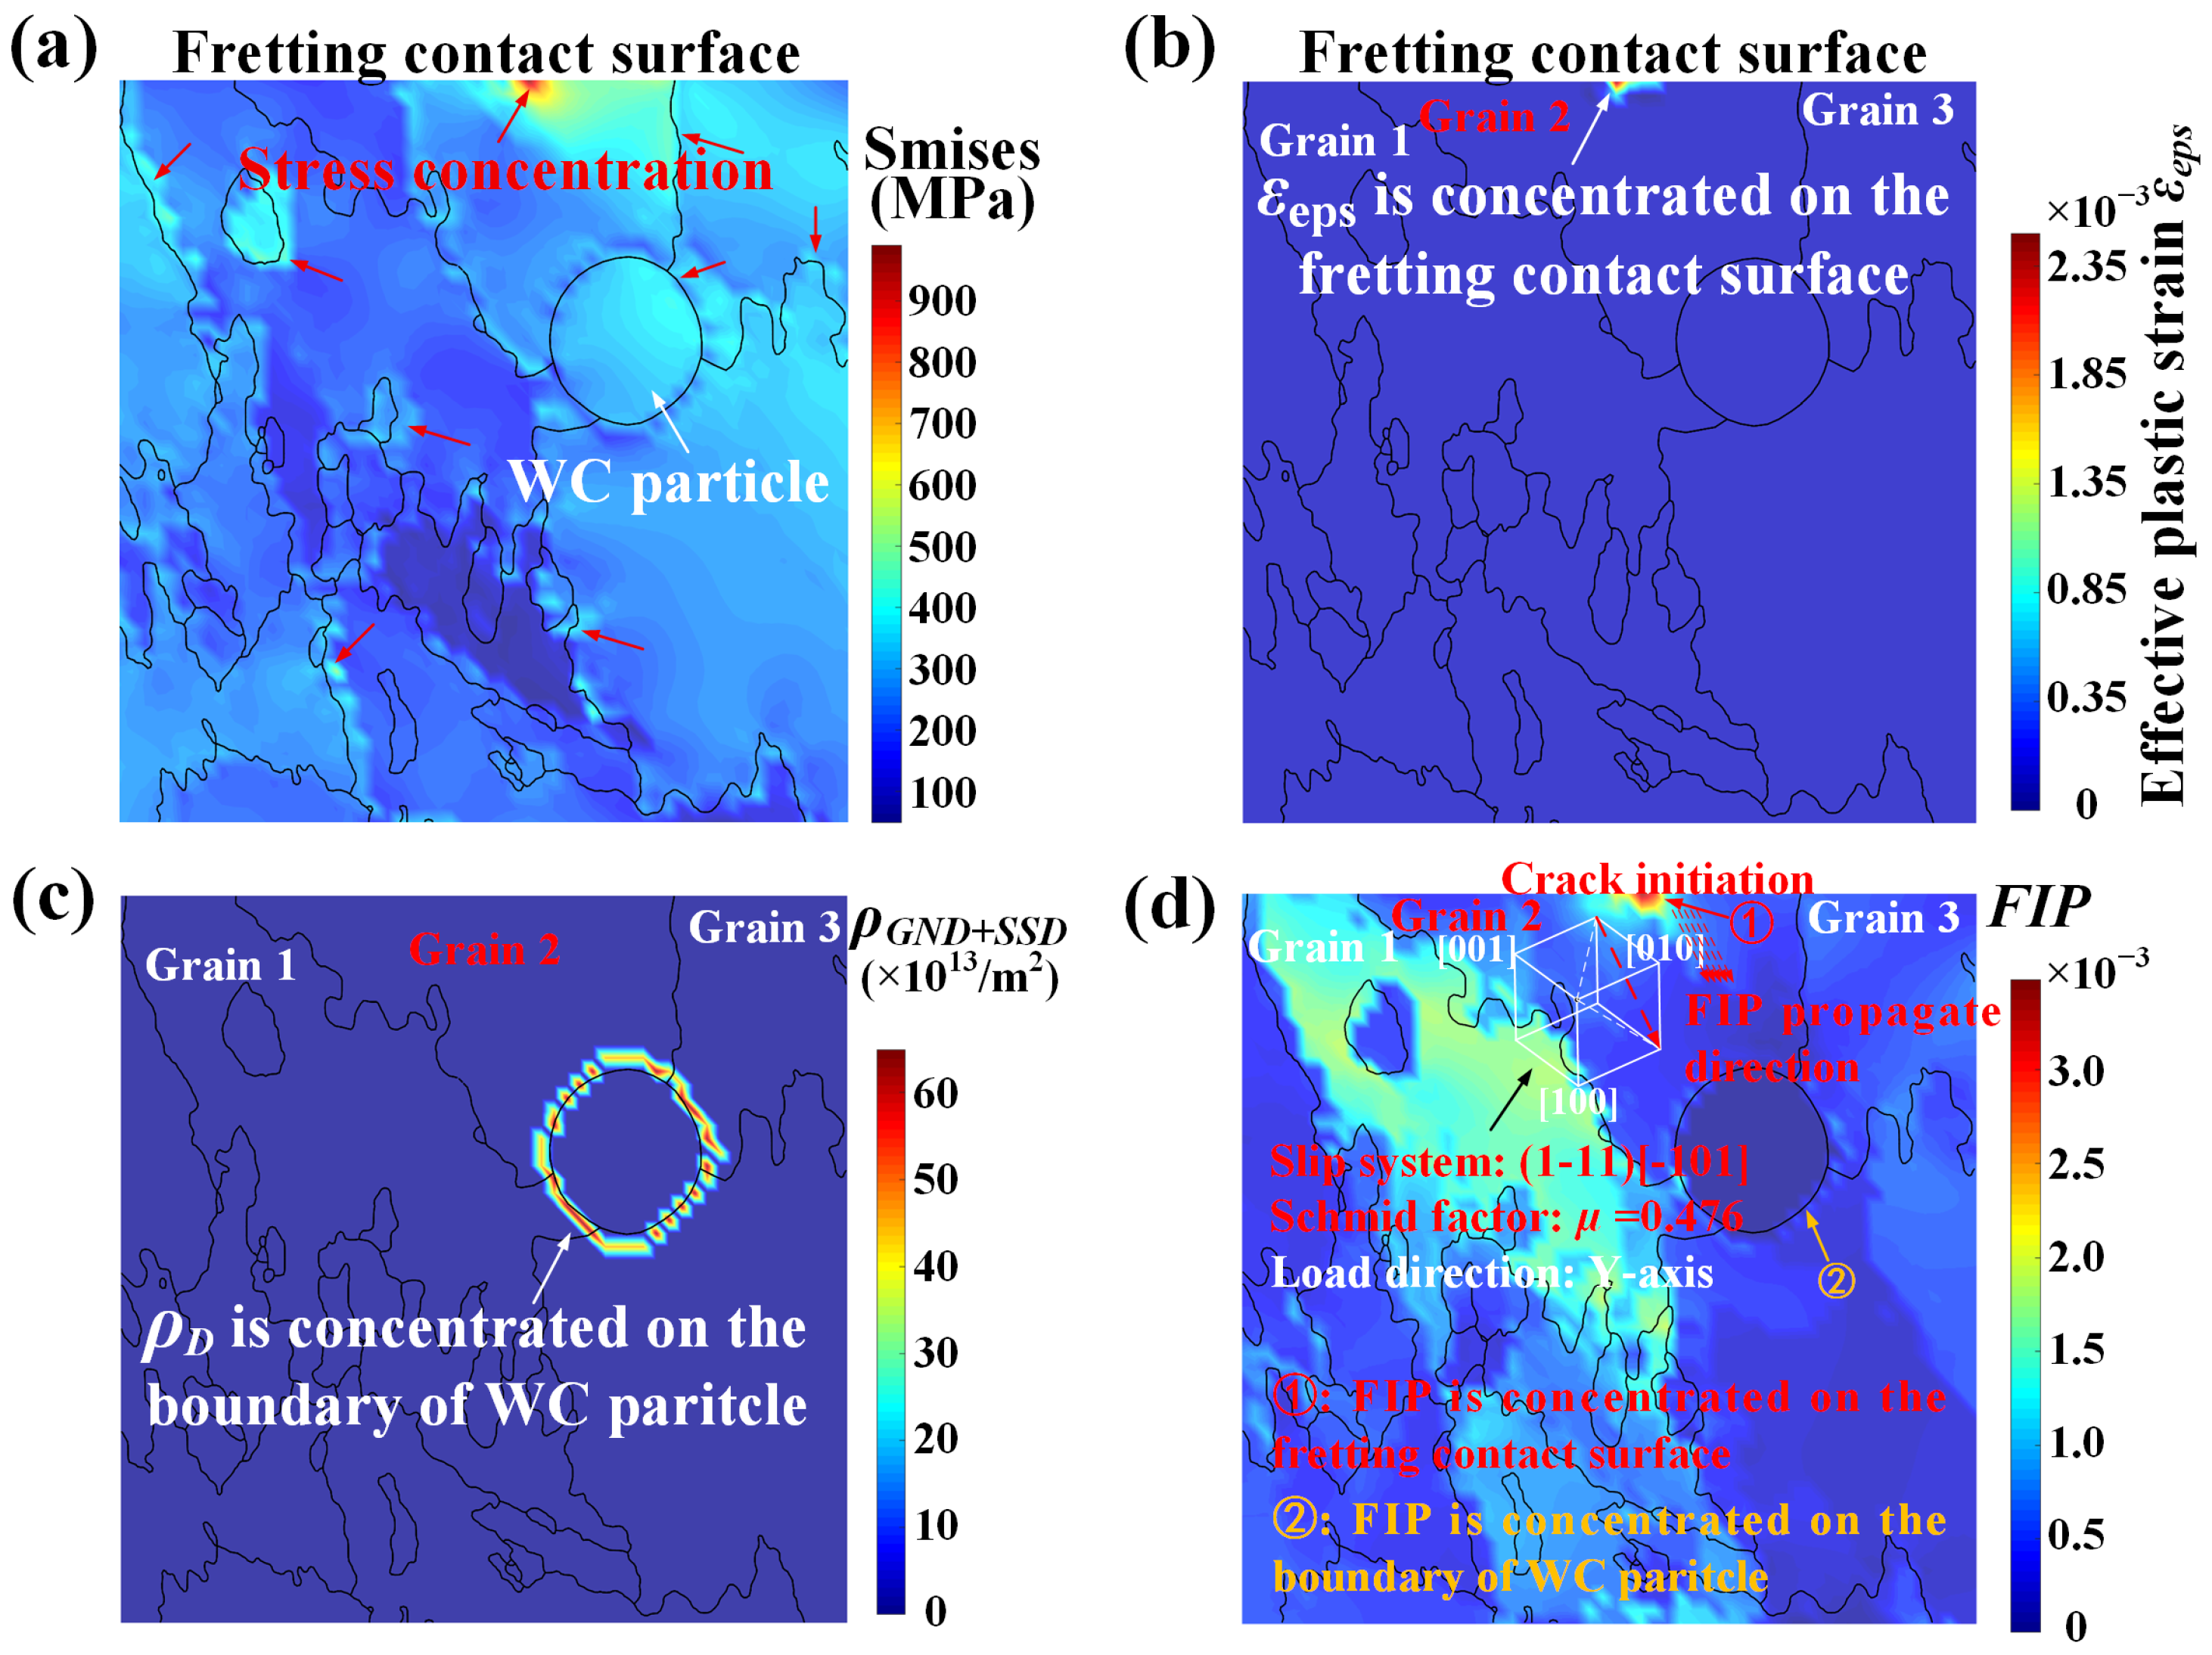
Figure 15a demonstrates that the fretting contact surface experiences the most severe stress concentration, which can be attributed to the transverse clamping force loading. Additionally, it can be observed that the presence of GBs hinders slip and leads to significant stress concentration near these GBs. The plastic strain exhibits a substantial gradient difference between the local contact position and other areas, indicating a higher stress concentration at the local contact position. As a result, the cloud map of plastic strain distribution (Figure 15b) displays the local response of the contact position. Similarly, the higher hardness of WC particles (typically exceeding 2000 HV) compared to the cladding layer material impedes slip under fatigue cyclic loading, resulting in an increased number of dislocations around the boundaries of WC particles. Consequently, the cloud map of dislocation density (Figure 15c) represents the local response around WC particles. The inconsistent distribution of these parameters suggests that relying solely on plastic strain or dislocation slip to characterize fatigue damage and determine crack initiation location is unreliable. However, the FIP cloud map, which incorporates both the cloud map features exhibited by plastic strain and the dislocations (Figure 15d), proves to be a reliable fatigue damage parameter for predicting crack initiation location. Figure 15d highlights that the maximum value of FIP occurs in region ① of grain 2, which corresponds to the fretting contact surface. It can be inferred that grain 2 serves as the grain responsible for crack initiation, specifically in region ①. Grain 2 has an activated slip system of (1-11) [-101] with a Schmid factor of μ   =   0.476 . The slip direction [-101] remains parallel to the FIP propagation direction. Additionally, the measurements indicate that grain 2 has an equivalent grain size of d gr = 57.62   μ m and an elastic modulus of E ϕ 1 , ψ , ϕ 2 = 166.85   GPa at 650 °C. Other grains on the fretting contact surface, such as grain 1, exhibit microstructure characteristics of μ   =   0.451 , d gr = 58.46   μ m , and E ϕ 1 , ψ , ϕ 2 = 210.06   GPa , while grain 3 exhibits characteristics of μ   =   0.432 , d gr = 56.93   μ m , and E ϕ 1 , ψ , ϕ 2 = 176.38   GPa . A comparison reveals that grain 2 has a higher Schmid factor, lower grain elastic modulus, and larger equivalent grain size, which aligns with the findings in Section 3.2.

4.4. Life Prediction

In the very-high-cycle fatigue regime, it is widely accepted that the initiation stage of fatigue cracks consumes a significant portion of fatigue life [49], even up to 99% [50]. To some extent, the test life of IN718/20% WC specimens can be reasonably used as a substitute for fatigue crack initiation life. When fatigue fracture occurs, the F I P is defined as
F I P cri ,   i = Δ F I P sta ,   i N exp ,   i
F I P cri = F cri ,   i ¯
N pre = F I P cri / Δ F I P sta
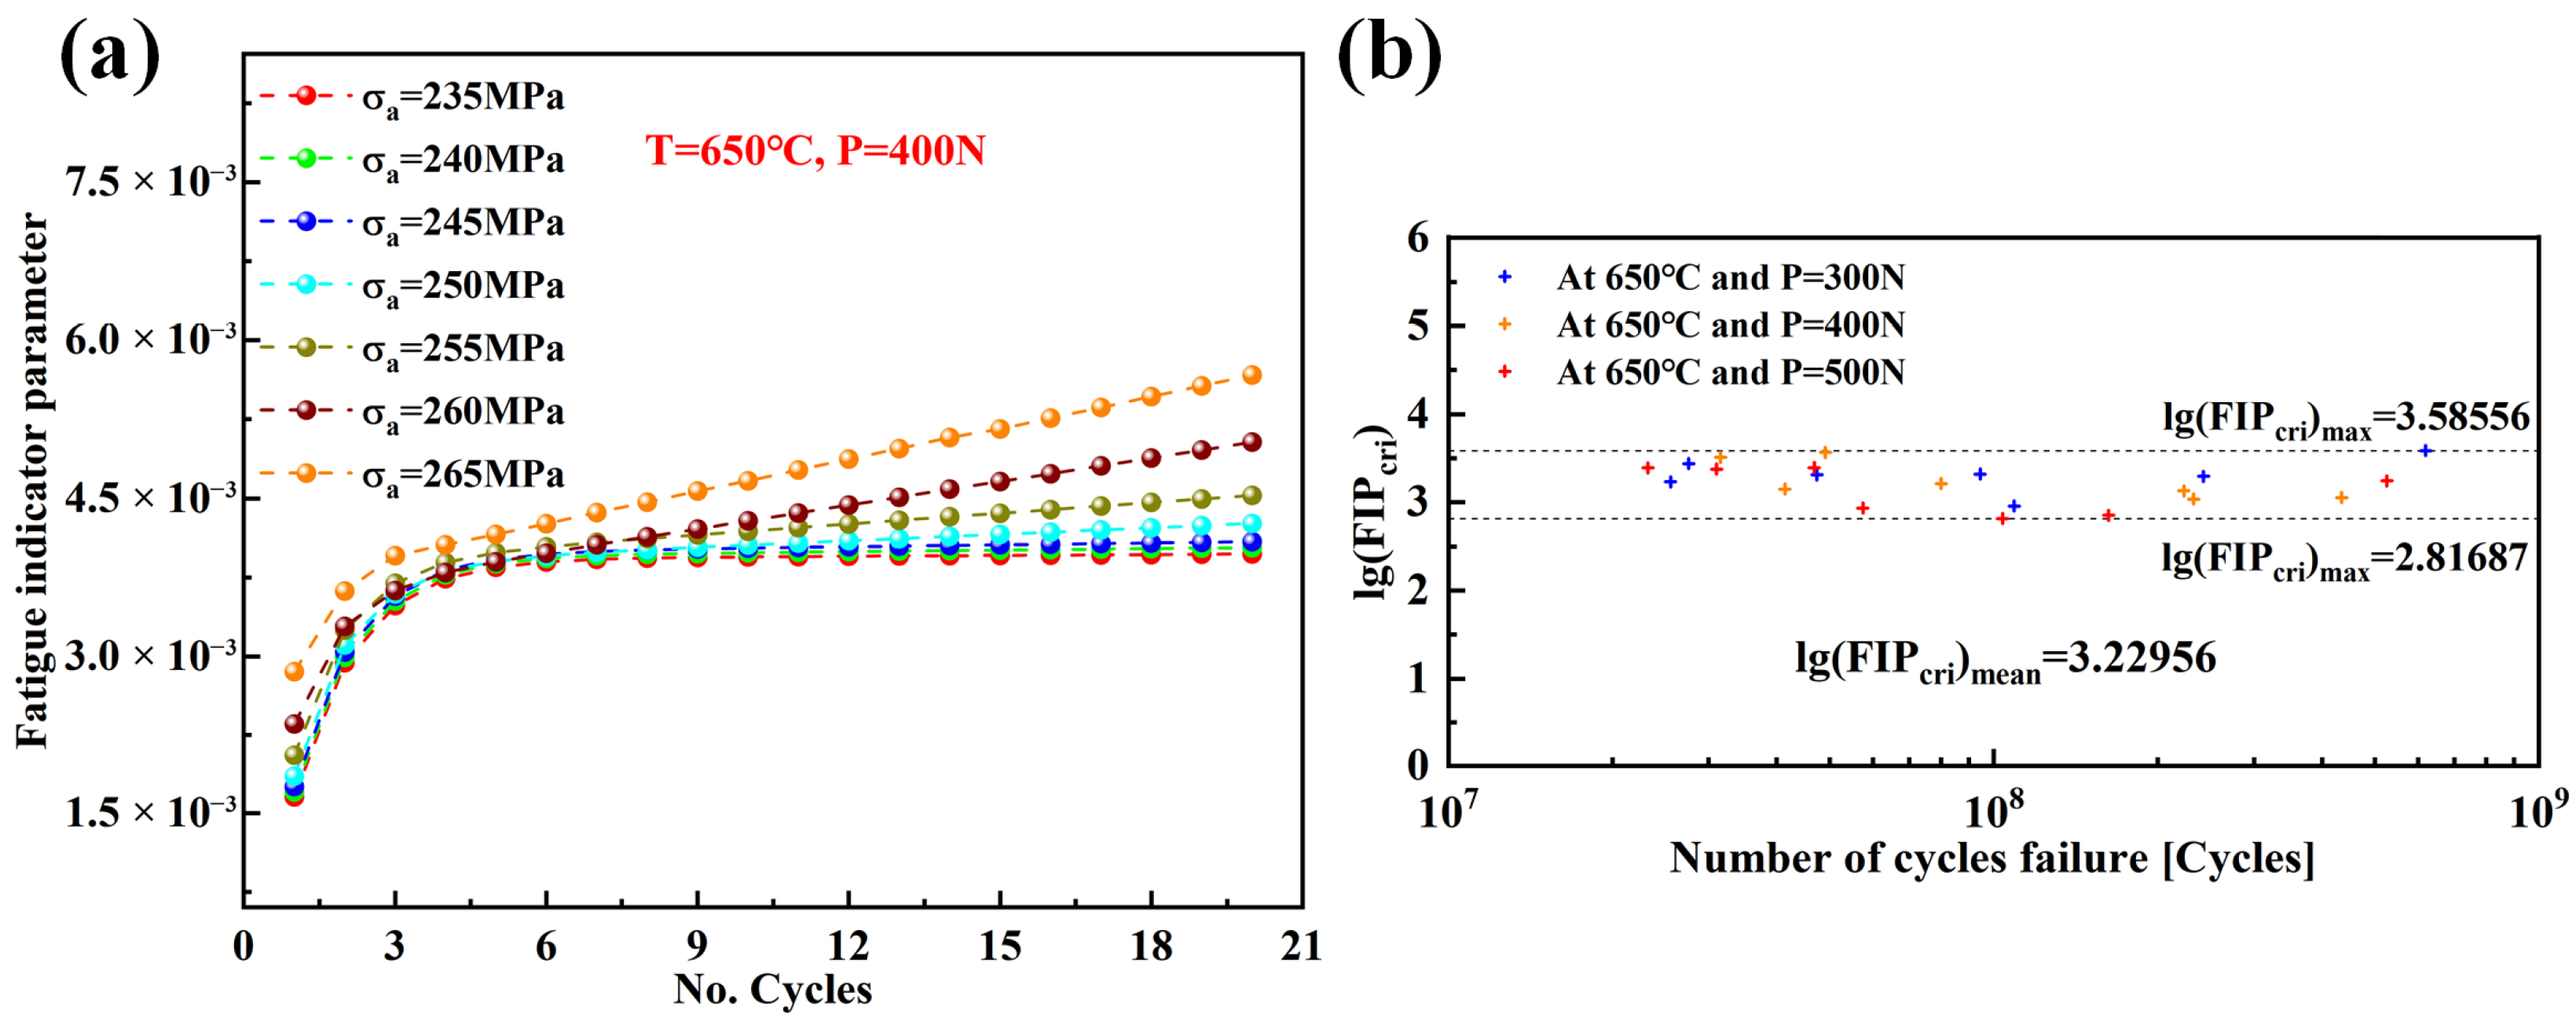
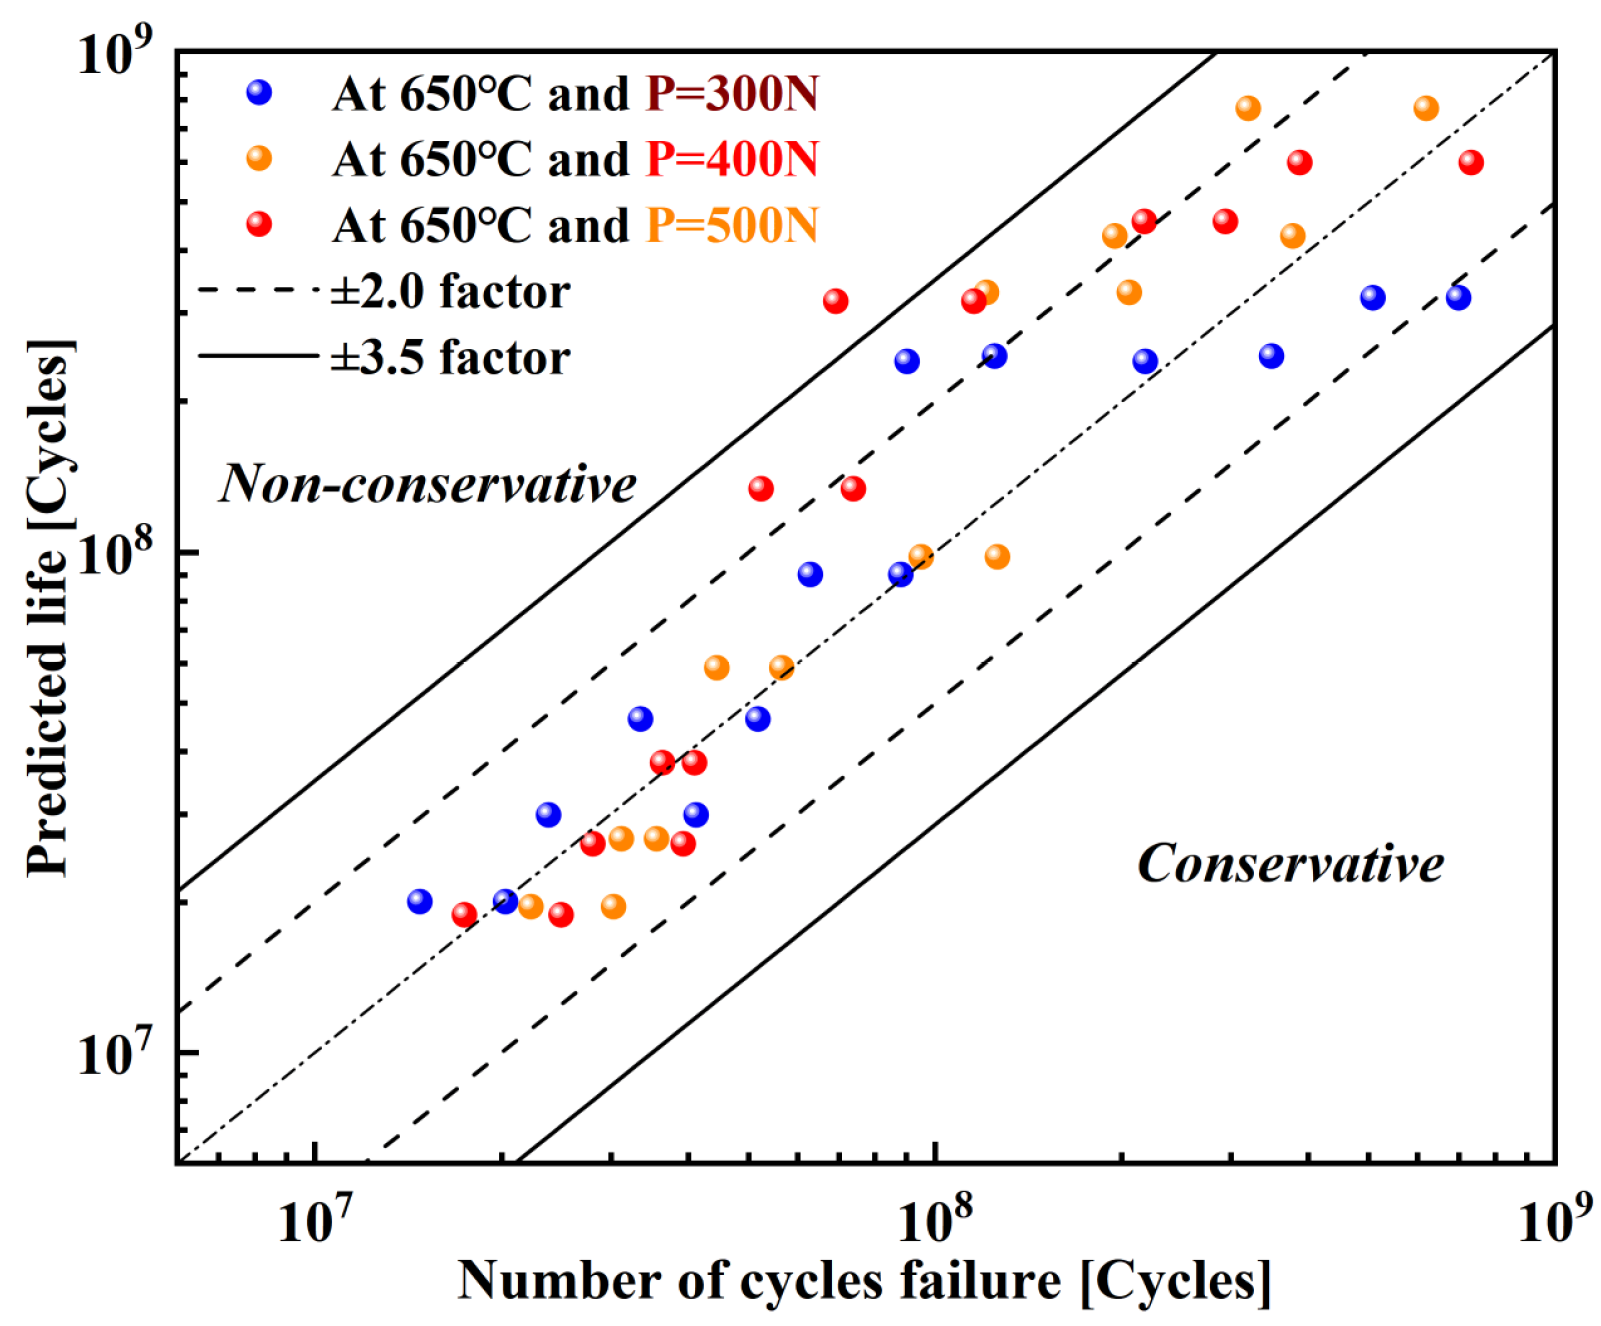
Among them, F I P cri ,   i , Δ F I P sta ,   i , and N test ,   i represent the F I P critical values, stable increments, and experiment life under the i-th load condition, respectively. F I P cri is the critical fatigue damage value of the material, which is determined as the mean of F I P cri ,   i under various load conditions. N pre represents the predicted life value. In Figure 16a, it can be observed that F I P increases almost linearly with an increase in fatigue cycle number under different load conditions, and F I P starts to steadily increase after the 6th cycle. As a result, the critical fatigue damage values under different load conditions are further calculated (Figure 16b). It reveals the range of fatigue damage values in lg ( F I P cri )   >   2.82 and lg ( F I P cri )   <   3.59 . Finally, the average critical fatigue damage value ( lg ( F I P cri ) mean   =   3.23 ) under different load conditions is used as the final critical fatigue damage value for predicting fatigue life. After excluding the experiment life used to calculate the critical fatigue damage value, the experiment life of specimens under transverse clamping forces of P = 300   N , P = 400   N , P = 500   N , and different axial loads is predicted (Figure 17). The results showed that under different loads, 72% and 97.6% of the predicted life are, respectively, located in the ±2 and ±3.5 scatter bands of the experiment life, indicating a high level of prediction accuracy. Additionally, when the fatigue cyclic load is in the range of 10 7 10 8 , 88% of the predicted life falls within the ±2 scatter bands. When the fatigue cyclic load is in the range of 10 8 10 9 , 64.7% of the predicted life is located in the ±2 scatter bands. This can be attributed to the dispersion of data points in VHCFF experiments.

5. Conclusions

IN718/20% WC powder was selected to coat the surface of the matrix IN718 alloy by LC. VHCFF experiments are conducted at 650 °C to obtain S_N data. It discusses the characteristics of crack initiation behavior by combining microscopic characterization methods and the CPFEM. Additionally, the experiment life under different loads is predicted based on FIPcri. The conclusions are as follows:
The results of high-temperature VHCFF experiments indicate that the fatigue strengths at 107 fatigue cycles are σa = 320 MPa, σa = 257 MPa, and σa = 219 MPa, respectively, for transverse clamping force loads of P = 300 N, P = 400 N, and P = 500 N. The wear depth is influenced by a combination of various operating parameters, such as the magnitude of the lateral clamping force, variations in axial stress amplitude, and the accumulation of fatigue cycles. Specifically, the depth increased with the cycle count under constant load, but a reduction in axial stress amplitude effectively mitigated wear by lessening the stress concentration effect. Fractographic examinations consistently identified the slip region of the fretting scar as the primary site for crack initiation. The fracture surfaces were characterized by cleavage facets associated with large grains, indicating a microstructure-sensitive initiation process.
Grains with higher Schmid factors (μ > 0.44) show greater slip system activation potential. The larger grain size leads to a decrease in grain yield strength, forcing the material to yield under low load conditions and enter the plastic stage. The elastic modulus of grains is manifested by the stiffness characteristics of materials and those grains with higher elastic modulus in the fretting contact area have strong resistance to deformation, causing cracks to preferentially initiate on grains with higher Schmid factors, lower elastic moduli, and larger grain sizes. Additionally, the critical fatigue indicator parameter indicates that 72% of the predicted life fell within the ±2 scatter bands, and 97.6% within the ±3.5 scatter bands, which demonstrates the effectiveness of the FIP for describing the evolutionary behavior of fretting fatigue damage, as well as for predicting the site of crack initiation and the behavior of microstructural features.

Author Contributions

Conceptualization, J.W., B.L., and Z.H.; Methodology, H.Y.; Software, J.C.; Validation, H.Y. and B.L.; Formal analysis, S.Y. and H.Y.; Investigation, J.W. and S.Y.; Resources, Z.H.; Data curation, J.W.; Writing—original draft preparation, J.W.; Writing—review and editing, S.Y.; Supervision, Z.H.; Project administration, J.W. and Z.H. All authors have read and agreed to the published version of the manuscript.

Funding

This research was funded by Fundamental Research Funds for the Central Universities, grant number 25CAFUC04026, Project of Sichuan Flight Engineering Technology Research Center, grant number GY2024-47E, and the National Natural Science Foundation of China, grant number 12472076. The APC was funded by Fundamental Research Funds for the Central Universities, grant number 25CAFUC04026.

Institutional Review Board Statement

Not applicable.

Informed Consent Statement

Not applicable.

Data Availability Statement

The original contributions presented in this study are included in the article material. Further inquiries can be directed to the corresponding author(s).

Conflicts of Interest

The authors declare no conflicts of interest. The funders had no role in the design of the study; in the collection, analyses, or interpretation of data; in the writing of the manuscript; or in the decision to publish the results.

Abbreviations

The following abbreviations are used in this manuscript:
LCLaser cladding
VHCFVery-high-cycle fretting fatigue
CPFEMCrystal plasticity finite element model
FIPFatigue indicator parameter
FCCFace-centered cubic
GNDGeometrically necessary dislocation
SSDStatistically stored dislocation
EBSDElectron back scatter diffraction
SEMScanning electron microscope
WLIWhite light interferometer

References

  1. De Pannemaecker, A.; Fouvry, S.; Buffiere, J.Y.; Brochu, M. Modelling the Fretting Fatigue Crack Growth: From Short Crack Correction Strategies to Microstructural Approaches. Int. J. Fatigue 2018, 117, 75–89. [Google Scholar] [CrossRef] [Scilit]
  2. Basu, B.; Vitchev, R.G.; Vleugels, J.; Celis, J.P.; Van Der Biest, O. Influence of Humidity on the Fretting Wear of Self-Mated Tetragonal Zirconia Ceramics. Acta Mater. 2000, 48, 2461–2471. [Google Scholar] [CrossRef] [Scilit]
  3. Neu, R.W. Progress in Standardization of Fretting Fatigue Terminology and Testing. Tribol. Int. 2011, 44, 1371–1377. [Google Scholar] [CrossRef] [Scilit]
  4. Ciavarella, M.; Demelio, G. A Review of Analytical Aspects of Fretting Fatigue, with Extension to Damage Parameters, and Application to Dovetail Joints. Int. J. Solids Struct. 2001, 38, 1791–1811. [Google Scholar] [CrossRef] [Scilit]
  5. Mandal, V.; Tripathi, P.; Kumar, A.; Singh, S.S.; Ramkumar, J. A Study on Selective Laser Melting (SLM) of TiC and B4C Reinforced IN718 Metal Matrix Composites (MMCs). J. Alloys Compd. 2022, 901, 163527. [Google Scholar] [CrossRef] [Scilit]
  6. Günen, A. Properties and High Temperature Dry Sliding Wear Behavior of Boronized Inconel 718. Metall. Mater. Trans. A 2020, 51, 927–939. [Google Scholar] [CrossRef] [Scilit]
  7. He, Z.; Zhang, Y.; Qiu, W.; Shi, H.-J.; Gu, J. Temperature Effect on the Low Cycle Fatigue Behavior of a Directionally Solidified Nickel-Base Superalloy. Mater. Sci. Eng. A 2016, 676, 246–252. [Google Scholar] [CrossRef] [Scilit]
  8. Wang, Z.; Zheng, Y.; Wang, Z.; Niu, F.; Wang, W.; Gong, X.; Fang, X.; Cai, Z. Investigation of Fretting Fatigue Behavior of Shot Peening–Treated Ti-6Al-4V Dovetail Joints. Fatigue Fract. Eng. Mater. Struct. 2025, 48, 3318–3337. [Google Scholar] [CrossRef] [Scilit]
  9. Golden, P.J.; Hutson, A.; Sundaram, V.; Arps, J.H. Effect of Surface Treatments on Fretting Fatigue of Ti–6Al–4V. Int. J. Fatigue 2007, 29, 1302–1310. [Google Scholar] [CrossRef] [Scilit]
  10. Salehi, E.; Polycarpou, A.A. Fretting Fatigue Life Model under Combined Loading. Fatigue Fract. Eng. Mater. Struct. 2025, 48, 16–30. [Google Scholar] [CrossRef] [Scilit]
  11. Niu, F.; Chen, T.-L.; Wang, Z.-G.; Wang, W.; Gong, X.-F.; Fang, X.-Y.; Ni, J.; Cai, Z.-B. Fretting Fatigue Fracture Behavior of Ti6Al4V Dovetail Joint Specimens at 500 °C Treated with Nanosecond Stacked Femtosecond Laser Impact Strengthening. Fatigue Fract. Eng. Mater. Struct. 2024, 47, 4478–4497. [Google Scholar] [CrossRef] [Scilit]
  12. Zhang, X.; Wei, D.; Yang, S. Experimental and Numerical Investigations on Fretting Fatigue in a Bridge-Flat Component Using a Stress Life Prediction Model. Fatigue Fract. Eng. Mater. Struct. 2024, 47, 3489–3509. [Google Scholar] [CrossRef] [Scilit]
  13. Zhai, T.; Jiang, X.; Li, J.; Garratt, M.; Bray, G. The Grain Boundary Geometry for Optimum Resistance to Growth of Short Fatigue Cracks in High Strength Al-Alloys. Int. J. Fatigue 2005, 27, 1202–1209. [Google Scholar] [CrossRef] [Scilit]
  14. Zhai, T.; Wilkinson, A.J.; Martin, J.W. A Crystallographic Mechanism for Fatigue Crack Propagation through Grain Boundaries. Acta Mater. 2000, 48, 4917–4927. [Google Scholar] [CrossRef] [Scilit]
  15. Zeng, X.; Zhang, C.; Zhu, W.; Zhu, M.; Wang, Y.; Zhang, X. Quantitative Characterization of Short Fatigue Crack and Grain Boundary Interaction Behavior in Zirconium. Int. J. Fatigue 2022, 161, 106894. [Google Scholar] [CrossRef] [Scilit]
  16. Han, Q.-N.; Rui, S.-S.; Qiu, W.; Ma, X.; Su, Y.; Cui, H.; Zhang, H.; Shi, H. Crystal Orientation Effect on Fretting Fatigue Induced Geometrically Necessary Dislocation Distribution in Ni-Based Single-Crystal Superalloys. Acta Mater. 2019, 179, 129–141. [Google Scholar] [CrossRef] [Scilit]
  17. Hémery, S.; Villechaise, P. In Situ EBSD Investigation of Deformation Processes and Strain Partitioning in Bi-Modal Ti-6Al-4V Using Lattice Rotations. Acta Mater. 2019, 171, 261–274. [Google Scholar] [CrossRef] [Scilit]
  18. Pinto, A.L.; Almeida, G.M.J.; Talemi, R.; Araújo, J.A. Fretting Fatigue under Variable Amplitude Shear Loading Blocks Considering Partial Slip Regime: Experimental/Numerical Analysis. Tribol. Int. 2023, 182, 108367. [Google Scholar] [CrossRef] [Scilit]
  19. Matos, I.M.; Araújo, J.A.; Castro, F.C. Life Prediction of 6201-T81 Aluminum Alloy Wires under Fretting Fatigue and Variable Amplitude Loading. Tribol. Int. 2023, 183, 108407. [Google Scholar] [CrossRef] [Scilit]
  20. Zanichelli, A.; Vantadori, S. Shot-Peened Fretting Fatigue Components: Endurance Strength and Fatigue Life Assessment. Mater. Des. Process. Commun. 2021, 3, e196. [Google Scholar] [CrossRef] [Scilit]
  21. Vantadori, S.; Abbasi, F.; Zanichelli, A.; Leonetti, D.; Pio Pucillo, G.; Hossein Majzoobi, G. Influence of Normal Load Frequency on Fretting Fatigue Behaviour by a Critical Plane-Based Approach. Int. J. Fatigue 2022, 158, 106724. [Google Scholar] [CrossRef] [Scilit]
  22. Hu, C.; Wei, D.; Wang, Y.; Shi, L. Experimental and Numerical Study of Fretting Fatigue in Dovetail Assembly Using a Total Life Prediction Model. Eng. Fract. Mech. 2019, 205, 301–318. [Google Scholar] [CrossRef] [Scilit]
  23. Zhang, Y.; Zhang, X.; Wang, J.; Ren, X.; Wang, X.; Chen, R.; Yue, Z. High Cycle Fatigue Life Prediction Model Based on Crystal Plasticity and Continuum Damage Mechanics for Ni-Based Single Crystal Superalloys under a Multiaxial Stress State. Int. J. Plast. 2023, 162, 103526. [Google Scholar] [CrossRef] [Scilit]
  24. Li, Y.; Zhan, M.; Jiang, X.; Lei, Y.; Gao, P. Low-Cycle Fatigue Behavior and Life Prediction of TA15 Titanium Alloy by Crystal Plasticity-Based Modelling. J. Mater. Res. Technol. 2023, 23, 954–966. [Google Scholar] [CrossRef] [Scilit]
  25. Li, K.-S.; Wang, R.-Z.; Yuan, G.-J.; Zhu, S.-P.; Zhang, X.-C.; Tu, S.-T.; Miura, H. A Crystal Plasticity-Based Approach for Creep-Fatigue Life Prediction and Damage Evaluation in a Nickel-Based Superalloy. Int. J. Fatigue 2021, 143, 106031. [Google Scholar] [CrossRef] [Scilit]
  26. Li, K.-S.; Wang, R.-Z.; Zhang, X.-C.; Tu, S.-T. Creep-Fatigue Damage Mechanisms and Life Prediction Based on Crystal Plasticity Combined with Grain Boundary Cavity Model in a Nickel-Based Superalloy at 650 °C. Int. J. Plast. 2023, 165, 103601. [Google Scholar] [CrossRef] [Scilit]
  27. Lu, P.; Jin, X.; Li, P.; Sun, Y.; Fan, X. Crystal Plasticity Constitutive Model and Thermodynamics Informed Creep-Fatigue Life Prediction Model for Ni-Based Single Crystal Superalloy. Int. J. Fatigue 2023, 176, 107829. [Google Scholar] [CrossRef] [Scilit]
  28. Zhang, F.; Qiu, Y.; Hu, T.; Clare, A.T.; Li, Y.; Zhang, L.-C. Microstructures and Mechanical Behavior of Beta-Type Ti-25V-15Cr-0.2Si Titanium Alloy Coating by Laser Cladding. Mater. Sci. Eng. A 2020, 796, 140063. [Google Scholar] [CrossRef] [Scilit]
  29. Li, Z.; Chai, L.; Tang, Y.; Zhang, C.; Qi, L.; Zhang, K.; Peng, C.; Huang, C. 316L Stainless Steel Repaired Layers by Weld Surfacing and Laser Cladding on a 27SiMn Steel: A Comparative Study of Microstructures, Corrosion, Hardness and Wear Performances. J. Mater. Res. Technol. 2023, 23, 2043–2053. [Google Scholar] [CrossRef] [Scilit]
  30. GB/T 43896-2024; Metallic Materials—Ultra-High Cycle Fatigue—Ultrasonic Fatigue Test Method. Standards Press of China: Beijing, China, 2024.
  31. Wang, J.; Huang, Z.; Jia, Z.; Bian, M.; Yang, Z.; He, H. Investigation on Fretting Fatigue Crack Initiation of IN718 Alloy in Very High Cycle Regime. Wear 2025, 572–573, 206059. [Google Scholar] [CrossRef] [Scilit]
  32. GB/T 228.2-2015; Metallic Materials—Tensile Testing—Part 2: Method of Test at Elevated Temperature. Standards Press of China: Beijing, China, 2015.
  33. Xu, P.; Zhu, L.; Xue, P.; Yang, Z.; Wang, S.; Ning, J.; Meng, G.; Lan, Q.; Qin, S. Microstructure and Properties of IN718/WC-12Co Composite Coating by Laser Cladding. Ceram. Int. 2022, 48, 9218–9228. [Google Scholar] [CrossRef] [Scilit]
  34. Wan, W.; Dunne, F.P.E. Microstructure-Interacting Short Crack Growth in Blocky Alpha Zircaloy-4. Int. J. Plast. 2020, 130, 102711. [Google Scholar] [CrossRef] [Scilit]
  35. Nye, J.F.; Lindsay, R.B. Physical Properties of Crystals: Their Representation by Tensors and Matrices. Phys. Today 1957, 10, 26. [Google Scholar] [CrossRef] [Scilit]
  36. Csanádi, T.; Grasso, S.; Kovalčíková, A.; Dusza, J.; Reece, M. Nanohardness and Elastic Anisotropy of ZrB2 Crystals. J. Eur. Ceram. Soc. 2016, 36, 239–242. [Google Scholar] [CrossRef] [Scilit]
  37. Chen, Q.; Gao, F.; Csanádi, T.; Xu, J.; Fu, M.; Wang, M.; Dusza, J. Investigation of Anisotropic Mechanical Properties of Textured KSr2Nb5O15 Ceramics via Ab-Initio Calculation and Nanoindentation. J. Am. Ceram. Soc. 2018, 101, 5138–5150. [Google Scholar] [CrossRef] [Scilit]
  38. Prithivirajan, V.; Sangid, M.D. The Role of Defects and Critical Pore Size Analysis in the Fatigue Response of Additively Manufactured IN718 via Crystal Plasticity. Mater. Des. 2018, 150, 139–153. [Google Scholar] [CrossRef] [Scilit]
  39. Agaram, S.; Kanjarla, A.K.; Bhuvaraghan, B.; Srinivasan, S.M. Dislocation Density Based Crystal Plasticity Model Incorporating the Effect of Precipitates in IN718 under Monotonic and Cyclic Deformation. Int. J. Plast. 2021, 141, 102990. [Google Scholar] [CrossRef] [Scilit]
  40. Prithivirajan, V.; Sangid, M.D. Examining Metrics for Fatigue Life Predictions of Additively Manufactured IN718 via Crystal Plasticity Modeling Including the Role of Simulation Volume and Microstructural Constraints. Mater. Sci. Eng. A 2020, 783, 139312. [Google Scholar] [CrossRef] [Scilit]
  41. Wang, C.H.; Brown, M.W. A Path-Independent Parameter for Fatigue under Proportional and Non-Proportional Loading. Fatigue Fract. Eng. Mater. Struct. 1993, 16, 1285–1297. [Google Scholar] [CrossRef] [Scilit]
  42. Shatil, G.; Smith, D.J. Life Prediction of Notched Specimens Using Multiaxial Surface and Subsurface Strain Analyses. J. Eng. Mater. Technol. 1996, 118, 529–534. [Google Scholar] [CrossRef] [Scilit]
  43. Huang, Y.; Qu, S.; Hwang, K.C.; Li, M.; Gao, H. A Conventional Theory of Mechanism-Based Strain Gradient Plasticity. Int. J. Plast. 2004, 20, 753–782. [Google Scholar] [CrossRef] [Scilit]
  44. Han, C.-S.; Gao, H.; Huang, Y.; Nix, W.D. Mechanism-Based Strain Gradient Crystal Plasticity—I. Theory. J. Mech. Phys. Solids 2005, 53, 1188–1203. [Google Scholar] [CrossRef] [Scilit]
  45. Charpagne, M.A.; Hestroffer, J.M.; Polonsky, A.T.; Echlin, M.P.; Texier, D.; Valle, V.; Beyerlein, I.J.; Pollock, T.M.; Stinville, J.C. Slip Localization in Inconel 718: A Three-Dimensional and Statistical Perspective. Acta Mater. 2021, 215, 117037. [Google Scholar] [CrossRef] [Scilit]
  46. Fleck, N.A.; Hutchinson, J.W. A Phenomenological Theory for Strain Gradient Effects in Plasticity. J. Mech. Phys. Solids 1993, 41, 1825–1857. [Google Scholar] [CrossRef] [Scilit]
  47. Fatemi, A.; Socie, D.F. A Critical Plane Approach to Multiaxial Fatigue Damage Including Out-of-Phase Loading. Fatigue Fract. Eng. Mater. Struct. 1988, 11, 149–165. [Google Scholar] [CrossRef] [Scilit]
  48. Shen, J.; Fan, H.; Wang, J.; Zhang, G.; Pan, R.; Huang, Z. Stored Energy Density Research on the Fatigue Crack Initiation at Twin Boundary and Life Prediction of Inconel718 Superalloy. Int. J. Fatigue 2023, 171, 107590. [Google Scholar] [CrossRef] [Scilit]
  49. Wang, Q.Y.; Berard, J.Y.; Rathery, S.; Bathias, C. Technical Note High-Cycle Fatigue Crack Initiation and Propagation Behaviour of High-Strength Sprin Steel Wires. Fatigue Fract. Eng. Mater. Struct. 1999, 22, 673–677. [Google Scholar] [CrossRef] [Scilit]
  50. Li, Y.-D.; Zhang, L.-L.; Fei, Y.-H.; Liu, X.-Y.; Li, M.-X. On the Formation Mechanisms of Fine Granular Area (FGA) on the Fracture Surface for High Strength Steels in the VHCF Regime. Int. J. Fatigue 2016, 82, 402–410. [Google Scholar] [CrossRef] [Scilit]
Figure 1. Schematic of VHCFF experiment setup. (a) three-dimensional overall view; (b) detailed cross-sectional side view.
Coatings 16 00181 g001
Figure 4. IN718 alloy powder: (a) morphology, (b) size distribution..
Coatings 16 00181 g004
Figure 5. Information of laser cladding, (a) laser cladding sequence, (b) the plate of IN718 matrix.
Coatings 16 00181 g005
Figure 6. Test life of the IN718/20% WC specimens.
Coatings 16 00181 g006
Figure 7. Fretting wear morphological characteristics, (a) fretting scar, (b) depth-informed 3D morphology, (c) depth profiles.
Coatings 16 00181 g007
Figure 8. Specimen fracture surfaces at T = 650 °C, σa = 240 MPa, P = 400 N, and Nf = 2.33 × 10⁸.
Coatings 16 00181 g008
Figure 9. Schematic diagram of grain orientation.
Coatings 16 00181 g009
Figure 10. The EBSD maps, panel (a) displays the SEM image, while (b) shows Euler angle. Additionally, panel (c) presents the inverse pole figure, and (d) depicts the grain elastic modulus.
Coatings 16 00181 g010
Figure 11. The grain distribution from contact surface: (a) grain number, (b) microstructural details of grain 6.
Coatings 16 00181 g011
Figure 12. Statistics of grain microstructural information from contact surfaces.
Coatings 16 00181 g012
Figure 13. CPFEM simulation model, (a) contact model, (b) grain characteristics in simulation, (c) grain characteristics in characterization, (d) element distributions.
Coatings 16 00181 g013
Figure 14. Comparisons of IPF, grain size, and stress–strain relationship between EBSD and CPFEM, (a) IPF, (b) grain size, (c) stress–strain curve.
Coatings 16 00181 g014
Figure 15. Distributions of FIP at T = 650 °C, P = 400 N, σa = 240 MPa, (a) Mises stress, (b) plastic strain, (c) total dislocation density, (d) FIP.
Coatings 16 00181 g015
Figure 16. Calculated FIP and FIPcri, (a) the relationship between FIP and fatigue cycle, (b) the critical value distribution of FIP under different loads.
Coatings 16 00181 g016
Figure 17. Predicted life and experimental life.
Coatings 16 00181 g017
Table 1. The mechanical performance parameters of the IN718 alloy at 650 °C.
Tensile Strength
σb (MPa)
Yield Strength
σ0.2 (MPa)
Elastic Modulus
E (GPa)
Density
ρ (g/cm3)
Poisson’s Ratio
v
1208 ± 3.51030 ± 3.5146.3 ± 4.28.240.325
Table 2. The comparison between typical FIPs and our proposed model.
FIP ModelPlastic StrainDislocation DensityElastic ModulusGrain SizeMultiaxial Fatigue ConsiderationMicrostructure Sensitivity
Brown–Miller [41]Shear strain---Critical plane-
Fatemi–Socie [47]Shear strain + normal stress---Critical plane-
Energy-based CPFEM [48]-Via hardening laws--Energy dissipationPartial (slip-based)
Proposed FIPΔγₚ on active slip systemρGND + ρSSDEφ1,ψ,φ2dgrCritical plane + microstructureFull grain-level integration
Table 3. The parameters used in the simulation.
ParametersC11
[GPa]
C12
[GPa]
C44
[GPa]
ha
[MPa]
g0
[MPa]
γ ˙ 0
[s−1]
χ0
[MPa]
hc
[MPa]
mhbhd
T = 650 °C180155.4143.514,0003400.0004107800388428
Disclaimer/Publisher’s Note: The statements, opinions and data contained in all publications are solely those of the individual author(s) and contributor(s) and not of MDPI and/or the editor(s). MDPI and/or the editor(s) disclaim responsibility for any injury to people or property resulting from any ideas, methods, instructions or products referred to in the content.