Article

Effect of Plasma Cloud Shielding on Heat and Mass Transfer Mechanism During Laser Cladding

1
College of Arts & Information Engineering, Dalian Polytechnic University, Dalian 116400, China
2
School of Art and Information Engineering, Dalian University of Technology, Dalian 116033, China
3
Ansteel Co., Ltd. Ironmaking Plant, Anshan 114021, China
*
Author to whom correspondence should be addressed.
These authors contributed equally to this work.
Coatings 2025, 15(9), 991; https://doi.org/10.3390/coatings15090991
Submission received: 1 August 2025 / Revised: 15 August 2025 / Accepted: 20 August 2025 / Published: 26 August 2025

Abstract

During the laser cladding process, the temperature, flow velocity, and element concentration of the molten pool will be affected by the plasma. Quantitative analysis of the mechanism by which the plasma affects heat and mass transfer during the laser cladding process is of great significance for improving the quality of the cladding layer. In this paper, a multi-field coupled numerical model of the laser cladding process of Fe60 using an ASTM 1045 disk laser was established. In the modeling, the interaction between the plasma cloud and the laser beam (the ionization process of metal vapor absorbing photon energy and the absorption and shielding effect of the plasma on laser energy), as well as the influence of surface tension, buoyancy, and shock waves generated by the expansion of the plasma cloud on the Marangoni flow of the liquid metal, was considered. A comparative analysis was performed on the transient evolution of the temperature field, flow field, and concentration field during the laser cladding process in the presence of the plasma cloud. The results show that the ionization process of metal vapor and the shielding effect of the plasma cloud cause a decrease in laser energy and the temperature of the cladding layer. The Marangoni flow is affected by the shock waves generated by the expansion of the plasma cloud, resulting in a decrease in the flow velocity of the melt. A slight decrease in the concentration of Fe, Cr, and Ni elements and a slight increase in the concentration of C element in the cladding layer are caused by melt evaporation.

1. Introduction

Laser cladding is an emerging surface additive manufacturing technology. The cladding material and the matrix achieve metallurgical bonding through the irradiation of a high-energy laser beam [1,2,3,4]. The cladding materials include powders and wire materials. Powders are usually subjected to synchronous laser cladding (with three beams sent in a coaxial manner) [5]. This schematic is shown in Figure 1a. Wire materials are usually subjected to preset laser cladding [6]. In this method, the cladding material needs to be placed on the scanning path in advance. The schematic is shown in Figure 1b.
In 2018, Tan Sheng established a hyperbolic heat conduction model based on the dual phase-lag model originally developed by Tzou (1995). This model was used to analyze the femtosecond laser ablation process. The results show that the plasma cloud shielding has a shielding effect on the laser; particularly when the laser energy density is high, the effect is more obvious, which verifies that plasma does indeed have a shielding effect on the laser [7]. In 2024, the Chang Li team verified for the first time through numerical simulation that plasma has a shielding effect on the laser energy during the cladding process, laying the foundation for subsequent research [8].
During the cladding process, the temperature of the molten pool is caused to decrease by the plasma, and the flow state of the molten metal in the molten pool is affected. In 2019, researchers from Sichuan University studied the damage characteristics of laser-induced plasma shock waves on quartz glass and obtained the factors affecting the propagation process of the shock wave on quartz glass [9]. In 2022, Xingzu Ming established the pressure equation for the propagation of plasma shock waves and the wave front temperature model of the fine processing material for the plasma shock wave effect caused by the face gear material 18Cr2Ni4WA during laser processing. Finally, the accuracy of the plasma shock wave effect was verified [10]. In 2023, Xingzu Ming established an ablation model and studied the ablation characteristics of femtosecond laser on the face gear. Finally, the effect of the dynamic recoil pressure of the plasma shock wave on the crater morphology of the ablation and the changes in the scanning trace and ablation plane morphology was obtained [11]. Many research results have shown that during the laser cladding process, when the temperature reaches a certain value, a plasma cloud will be generated, and the expansion process of the plasma cloud will generate shock waves around the molten pool [12]. Shock pressure is produced by the expansion process of the generated plasma cloud. When the pressure acts on the molten pool, the Marangoni flow of the liquid metal is affected (the Marangoni effect is caused by the difference in surface tension at the interface of the melt; the molten material in the melt pool will spontaneously flow from the area with lower surface tension to the area with higher surface tension), thereby affecting the flow velocity of the molten pool. The flow velocity of the molten pool is also closely related to the distribution and diffusion of elements in the cladding layer; thus, the concentration field is indirectly affected.
In conclusion, the temperature, flow velocity, and element concentration during the laser cladding process are affected by plasma. Quantitative research to reveal the mechanism that plasma affects heat and mass transfer during the cladding process is of great significance. Laser cladding is characterized by rapid cooling and heating; the formed molten pool has the characteristics of high-temperature and small shape. Real-time measurement and tracking of the changes in the molten pool are difficult to conduct through experimental research. To reveal the effect of the generation, shielding, and expansion process of the plasma cloud on the transient evolution law of the molten pool, an effective approach is provided by numerical simulation. Based on the above background, a three-dimensional numerical model of multi-field coupling during the laser cladding process was established in this study. Quantitative analysis was conducted on the temperature field, flow field, and concentration field considering and without considering plasma cloud shielding for the transient evolution law. Moreover, the effect of the existence of the plasma cloud on the temperature, flow velocity, Marangoni convection, element distribution, and diffusion of the molten pool were revealed.

2. Equations and Parameter Settings During Laser Cladding

2.1. The Control Equations of Temperature Field

2.1.1. Without Considering the Shielding Effect of the Plasma Cloud

Energy conservation is followed during the laser cladding process, and the equation is as follows [13]:
ρ 45 , 60 C p 45 , 60 T t + ρ 45 , 60 C p 45 , 60 u 45 , 60 T = k 45 , 60 T Δ H 45 , 60 t ρ 45 , 60 u 45 , 60 Δ H 45 , 60
where ρ45,60 is the average thermal fusion of the cladding material (CM), CM is a mixture of ASTM 1045 and Fe60, Cp45,60 is the specific heat capacity of the CM, k45,60 is the thermal conductivity of the CM, u45,60 is the melt flow velocity. ΔH45,60 is specific enthalpy of the CM, and the equation is as follows:
Δ H 45 , 60 = L 45 , 60 f 45 , 60
where L45,60 is the latent heat of CM, f45,60 is the liquid phase mass fraction.
f 45 , 60 = 1   ,   T l < T T T s T l T s   ,   T s T T l 0   ,   T < T s
where Tl is the liquid phase temperature, and Ts is the solid phase temperature.
The interaction of light and powder during the cladding process will result in the loss of some laser energy. Based on this reason, the following Gaussian heat source formula is established [14].
Q 45 , 60 = 2 ( 1 η l ) P l π r l 2 exp 2 x v l t 2 + y 2 r l 2 h c 45 T T 0 + σ ε 45 T 4 T 0 4
where ηl is the energy loss rate, Pl is the laser power (1200 W), rl is the laser radius (2.5 mm), vl is the laser scanning speed (6 mm/s), hc45 is the heat transfer coefficient of the matrix (60 W/m2·K), ε45 is emissivity of the matrix to the environment, σ is Stefan-Boltzmann constant (5.67 × 10⁻⁸ W/(m2·K4)), T0 is the environmental temperature (293.15 K).

2.1.2. Considering the Shielding Effect of the Plasma Cloud

When the absorption of laser energy by the plasma cloud is considered, due to the relatively weak effect of longer wavelengths on laser absorption [15], only the inverse bremsstrahlung (IB) absorption mechanism is considered. The formula is as follows [16]:
η p = 3.69 × 10 8 Z e 3 n i 2 T p 0.5 ω l 3 1 exp h ω l k T p
where Ze is the average charge, ni is the ion density in the plasma cloud, k is the Boltzmann constant (1.38 × 10⁻²³ J/K), Tp is the plasma temperature. ωl is the laser frequency, the equation is as follows:
ω l 2 = ω p 2 + c 2 k w 2
where c represents the speed of light (3 × 10⁸ m/s), kw is wavenumber, and ωp is the plasma cloud frequency, the equation is as follows:
ω p = N p e 2 ε 0 m a
where Np is the electron density of the plasma cloud, ε0 is the vacuum dielectric constant (8.85 × 10⁻¹² F/m), e is the electron charge (1.602 × 10⁻¹⁹ C), and ma is the atomic mass.
The ion density changes with temperature, and it can be expressed by the Saha equation as follows [17]:
n i 2 n 0 2.4 × 10 21 T p 1.5 exp I P 1 k T p
where IP1 is the first ionization energy (7.72638 eV), and n0 is the number density of neutral particles.
Assuming that neutral particles are uniformly distributed within the plasma cloud [7], the equation is as follows:
n 0 = ρ S p m a H p
where Sp is the evaporation thickness of the molten metal on the cladding surface, Hp is the distance at which the plasma cloud obscures the laser beam, the equation is as follows:
H p = S p + t 0 t υ p d t
where t0 is the time when the temperature reaches the evaporation point of the molten metal. During the cladding process, the plasma continuously generates and spreads outward. This process is called the plasma cloud expansion process, and its speed can be expressed as υp.
During the expansion process of the plasma cloud, the shielding range is variable, and its dynamic equation is expressed as
x p ( t ) 1 t d x p ( t ) d t + d 2 x p ( t ) d t 2 = k T p m a
where xp(t) is the expansion distance of the plasma cloud.
During the expansion process of the plasma cloud, the expansion speed varies with factors such as temperature and plasma concentration, and its equation is as follows:
υ p = d x p ( t ) d t
The initial equation for the plasma expansion speed can be taken as the average velocity of particles in the Maxwell-Boltzmann distribution [18].
υ p 0 = 8 k T p π m a
When the plasma cloud exists, a portion of the laser energy will be lost. Combining Equations (4) and (5), the laser cladding equation after energy loss is
Q p 45 , 60 = Q 45 , 60 exp ( 0 H p n p d x )

2.2. Flow Field Equations

During the laser cladding process, the principles of mass and momentum conservation apply [19,20].
ρ 45 , 60 t + ρ 45 , 60 u 45 , 60 = 0
ρ 45 , 60 u 45 , 60 t + ( u 45 , 60 ) u 45 , 60 = p I + μ 45 , 60 ( u 45 , 60 + ( u 45 , 60 ) T ) 2 μ 45 , 60 3 ( u 45 , 60 ) I + ρ 45 , 60 g β 45 , 60 ( T T m ) K p ( 1 f 45 , 60 ) 2 f 45 , 60 3 + B u 45 , 60
where p is pressure, μ45,60 is the dynamic viscosity of the melt, g is the gravitational acceleration, β45,60 is the thermal expansion coefficient of CM, Tm is the melting temperature, Kp is a constant, and B is an extremely small number to prevent the denominator from being zero [21].

2.3. Heat and Mass Transfer Equations

During the laser cladding process, diffusion occurs among various components in the molten pool. The equation is as follows:
ρ 45 , 60 C i 45 , 60 t + ρ 45 , 60 ( u 45 , 60 ) C i 45 , 60 = ( ρ 45 , 60 D i n C i 45 , 60 + ρ 45 , 60 C i 45 , 60 ( ρ 45 , 60 D i n C i 45 , 60 + ρ d C i 45 , 60 D i n M 45 , 60 M 45 , 60 ) M 45 , 60 M 45 , 60 ) + ( ρ 45 , 60 D i n ( C l 45 , 60 C i 45 , 60 ) ) ( ρ 45 , 60 f 45 , 60 ( C l 45 , 60 C s 45 , 60 ) u 45 , 60 )
where Ci45,60 is the concentration of elements (i represents Fe, C, Cr, and Ni, the same notation applies hereinafter.), Cs45,60 and Cl45,60 are the concentrations of the solid and liquid phases during the diffusion process, respectively. Din and M45,60 are the element diffusion coefficients [22] and the average molar mass after mixing [23], respectively. The equations are as follows:
D i n = 1 f i 45 , 60 n i χ n D i 45 , 60
M 45 , 60 = ( i f i 45 , 60 M i 45 , 60 ) 1
where fi45,60 is the element mass fraction, χn is the mole percentage, Di45,60 is the Maxwell-Stefan diffusion coefficient, and Mi is the molar mass.
The boundary condition of the mass transfer equation at the gas/liquid interface is
c i = 2 m 60 ( 1 η 60 ) M i 45 , 60 π r l 2 exp ( 2 x v l t 2 + y 2 r m 2 )
where ci is the concentration flow, m60 is the powder flow rate (8.2 g/min), η45,60 is the powder loss rate, and rm is the radius of the powder flow (2.5 mm).

2.4. Boundary Conditions and Source Terms

During the cladding process, three coaxial powder feeding systems are used. The boundary is established based on the Arbitrary Lagrangian-Eulerian (ALE) dynamic mesh method, and the equation is as follows [24]:
v L / G 60 = u 60 n + v 60 n
where u60 is the liquid/gas interface flow velocity, v60 is the powder accumulation velocity. The equations are as follows:
v 60 = 2 m 60 ( 1 η 60 ) ρ 45 , 60 π r l 2 exp ( 2 x v l t 2 + y 2 r l r ) z
u 60 ( x , y , z , t 0 ) = 0
where ρ60 is the powder density, and z is the unit vector in the z direction.

3. Numerical Modeling and Material Selection

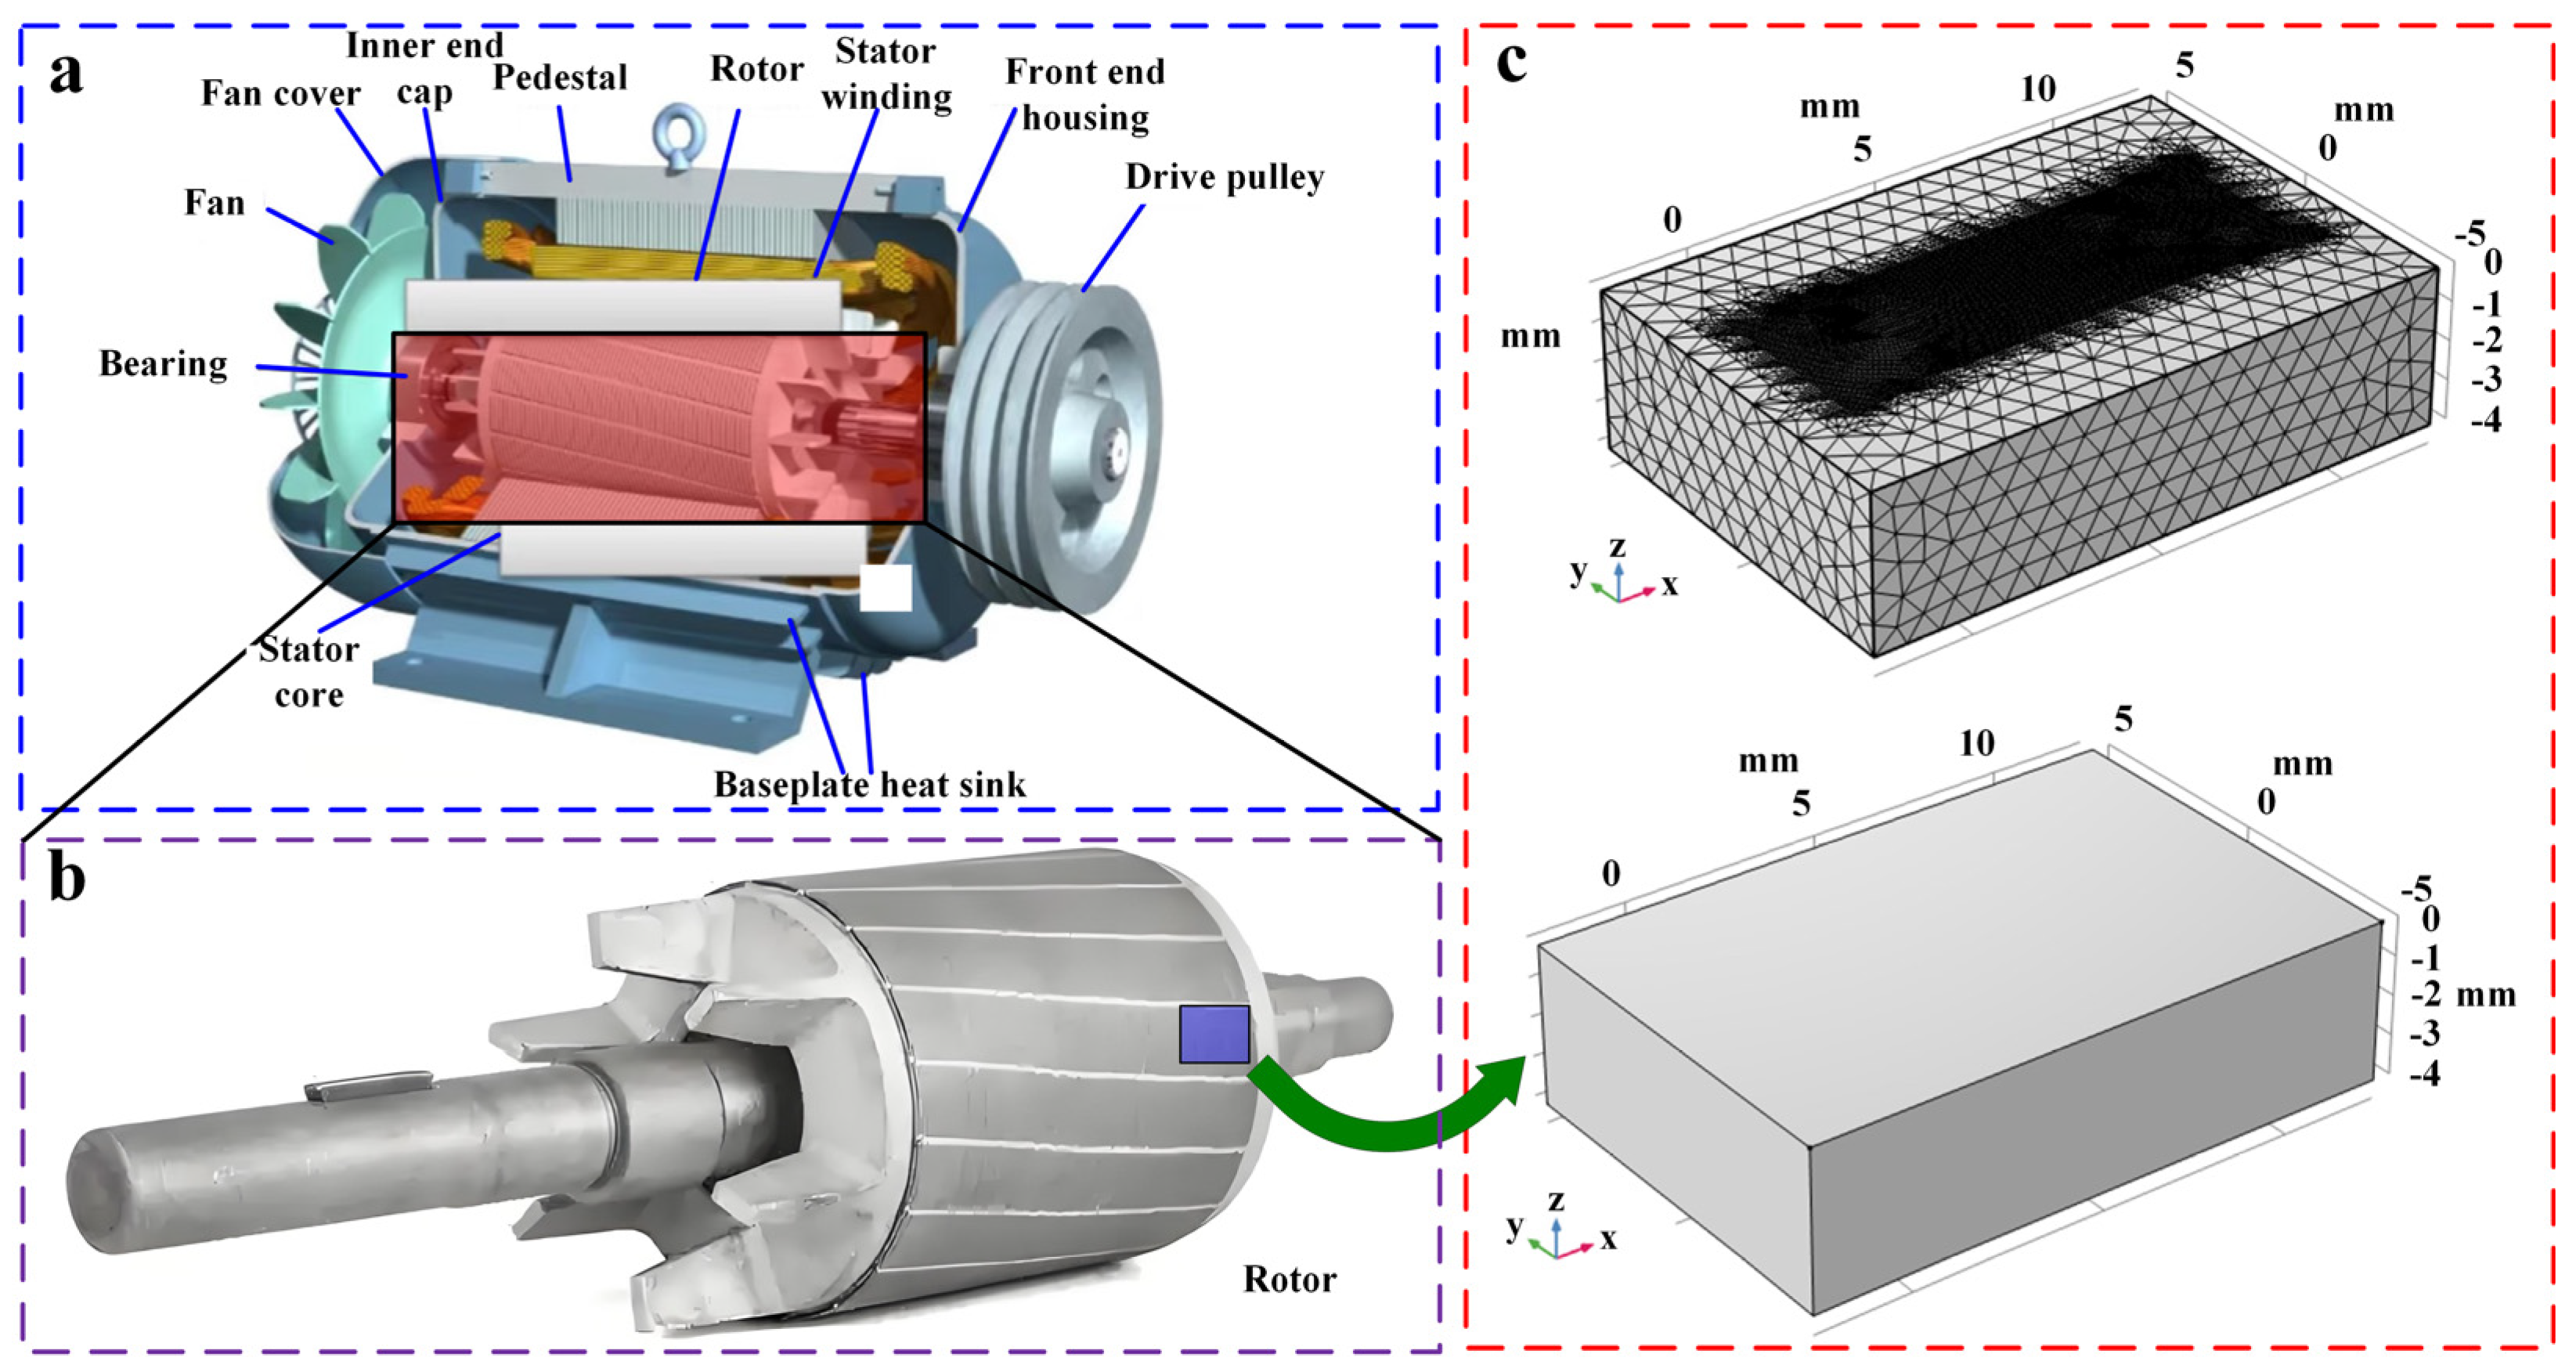
“Mouse dragon motor” is one of the most common types of AC induction motors and is widely used in industrial and household appliances, as shown in Figure 2a. It is advantaged with a simple structure, reliable operation, high efficiency, energy-saving, and low cost. However, during long-term operations or under abnormal conditions, the rotor may be subjected to failures such as broken bars, cracking, rusting, or corrosion. Therefore, it is significant that the rotor surface be maintained and repaired. In this paper, laser cladding technology was taken as an example to strengthen the rotor surface, and the cladding process was studied. Due to the large size of motors in heavy machinery (diameters greater than 500 mm and lengths greater than 1000 mm), conducting an overall study would be costly in terms of both time and resources. Therefore, only a part of a motor was calculated and analyzed in this study, as shown in Figure 2b. Based on the COMSOL 6.1 multi-physics coupling calculation platform and the characteristics of laser cladding, a rectangular prism with dimensions of 15 mm × 10 mm × 4 mm was established as the matrix, as shown in Figure 2c. To obtain a clear cladding layer, the cladding layer area was refined. The entire structure was divided into a free tetrahedral mesh. The model contains 168,111 domain elements, 5146 boundary elements and 140 edge elements. Under this grid, the calculation time of the model is 37 h, 28 min and 14 s. The rotor material is usually aluminum or copper. However, in cases with performance requirements such as wear resistance, high temperature resistance and low hysteresis loss, steel is usually used. Therefore, the matrix (rotor) material of this study was selected as ASTM 1045 [25], and the cladding material (powder) was selected as Fe60. The element types and contents are shown in Table 1 and Table 2.

4. Analysis of Numerical Simulation Results

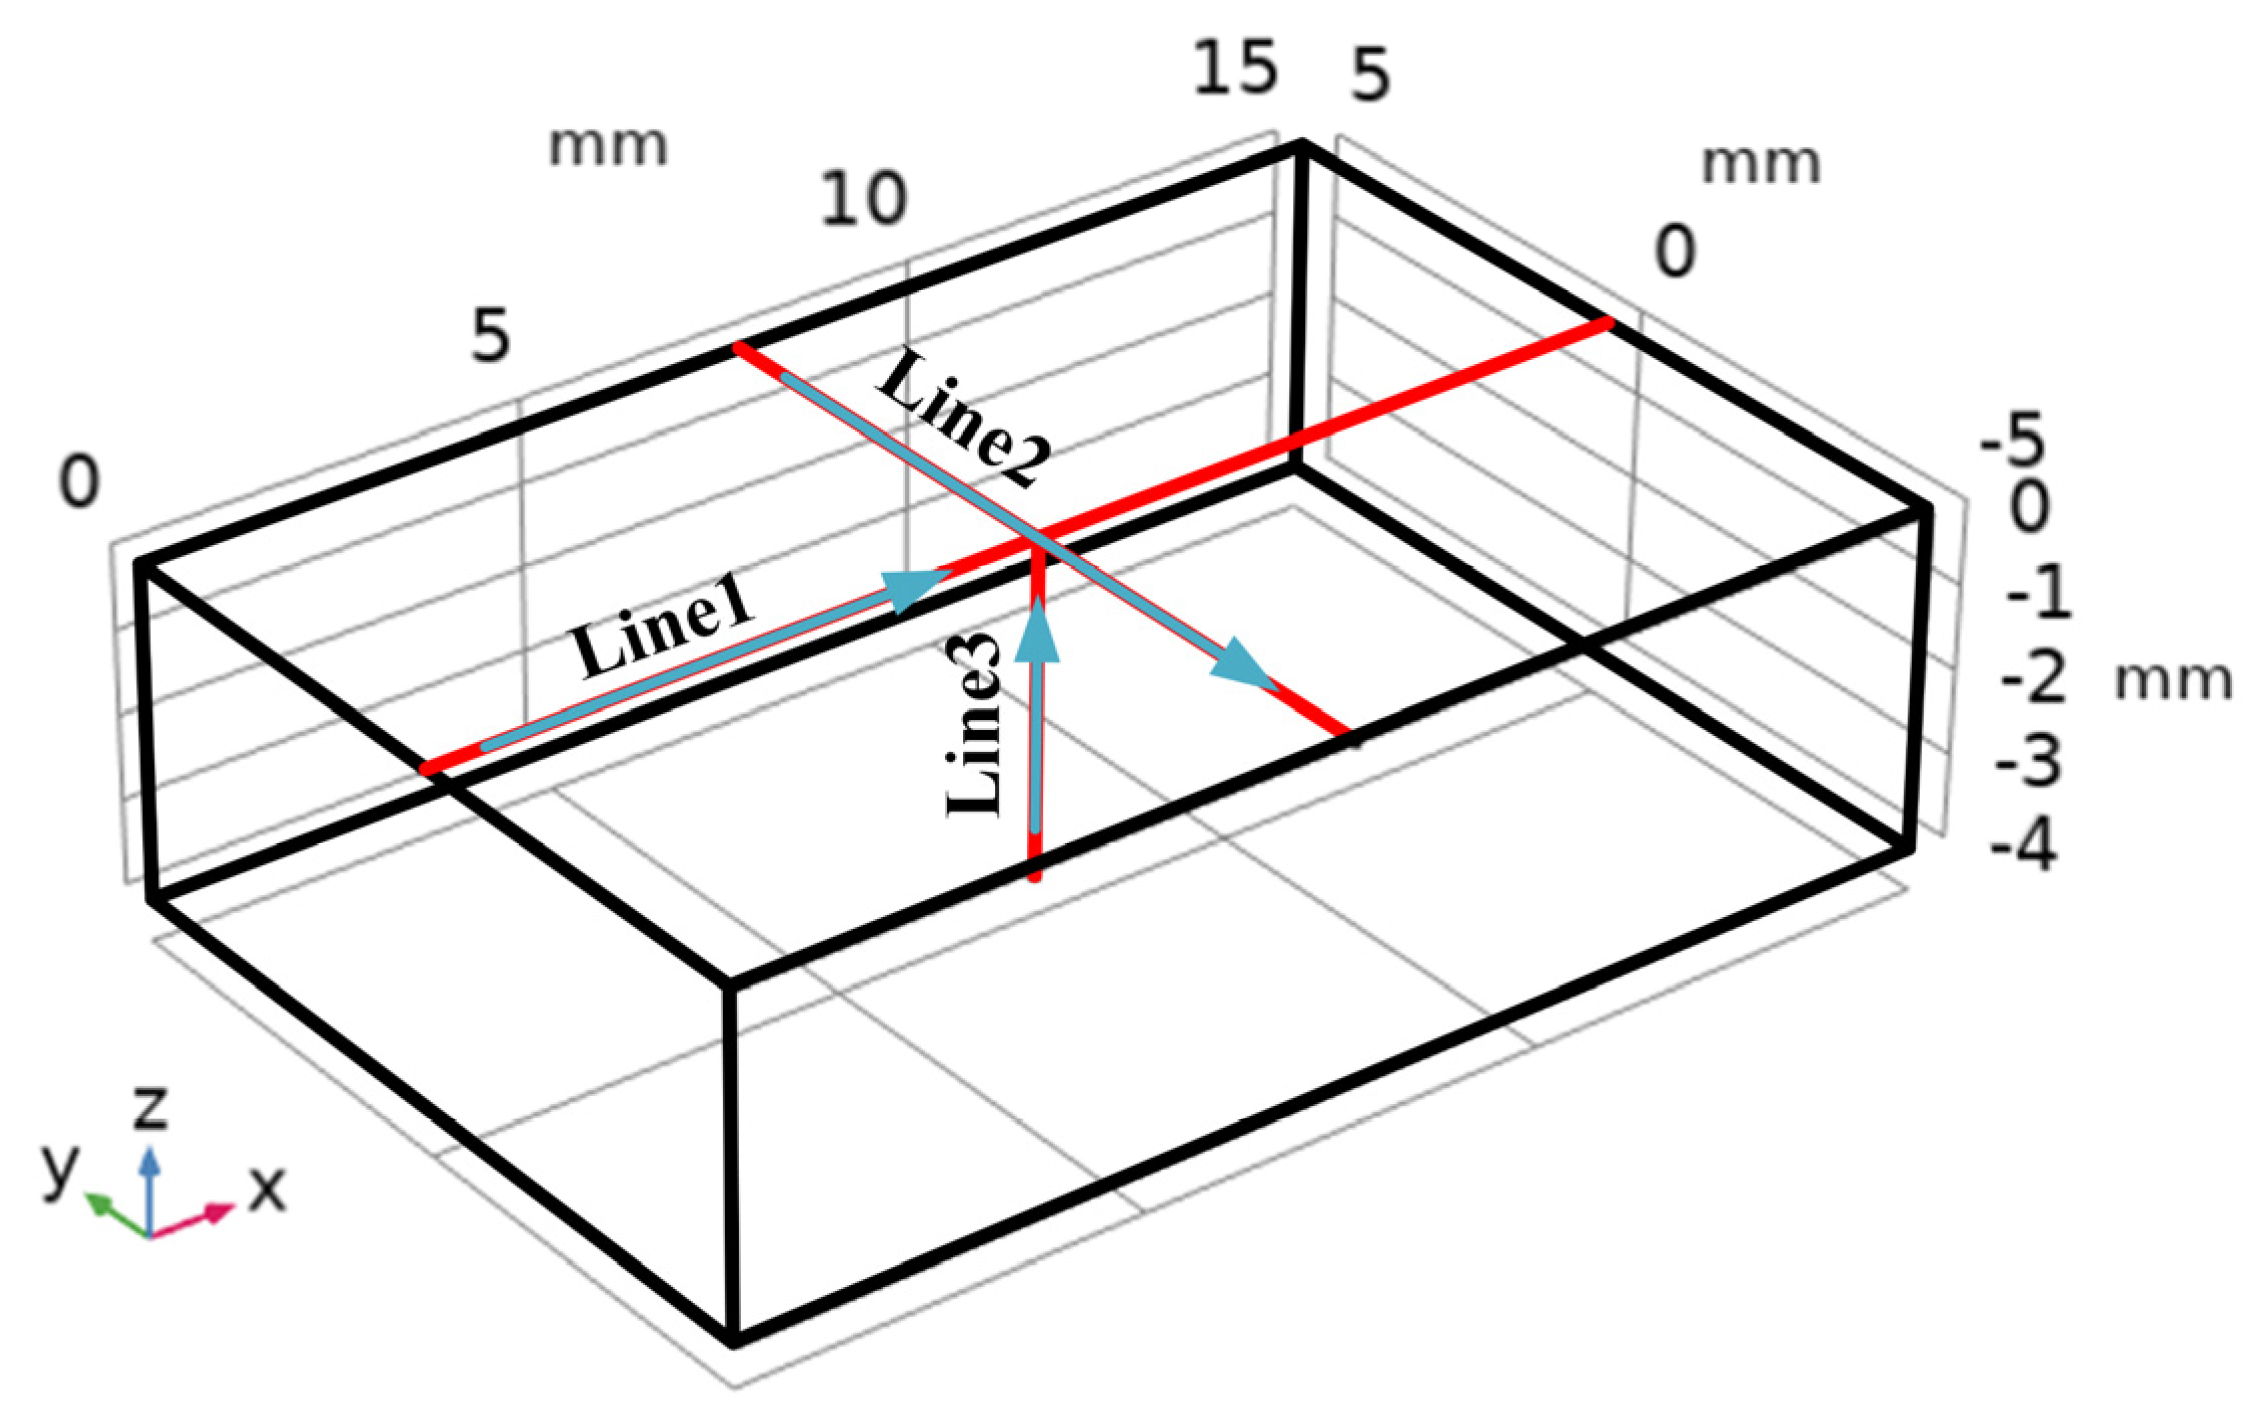
To effectively reveal the effect of plasma cloud shielding on laser cladding, the transient changes in the temperature field, flow field and concentration field during the laser cladding process from 0 to 2000 ms were extracted and analyzed. The collection lines of multi-field coupling information are shown in Figure 3. Lines 1, 2 and 3 were selected for data collection. The same boundary conditions and input parameters are used in the numerical models with and without considering plasma cloud shielding.

4.1. Temperature Field Results

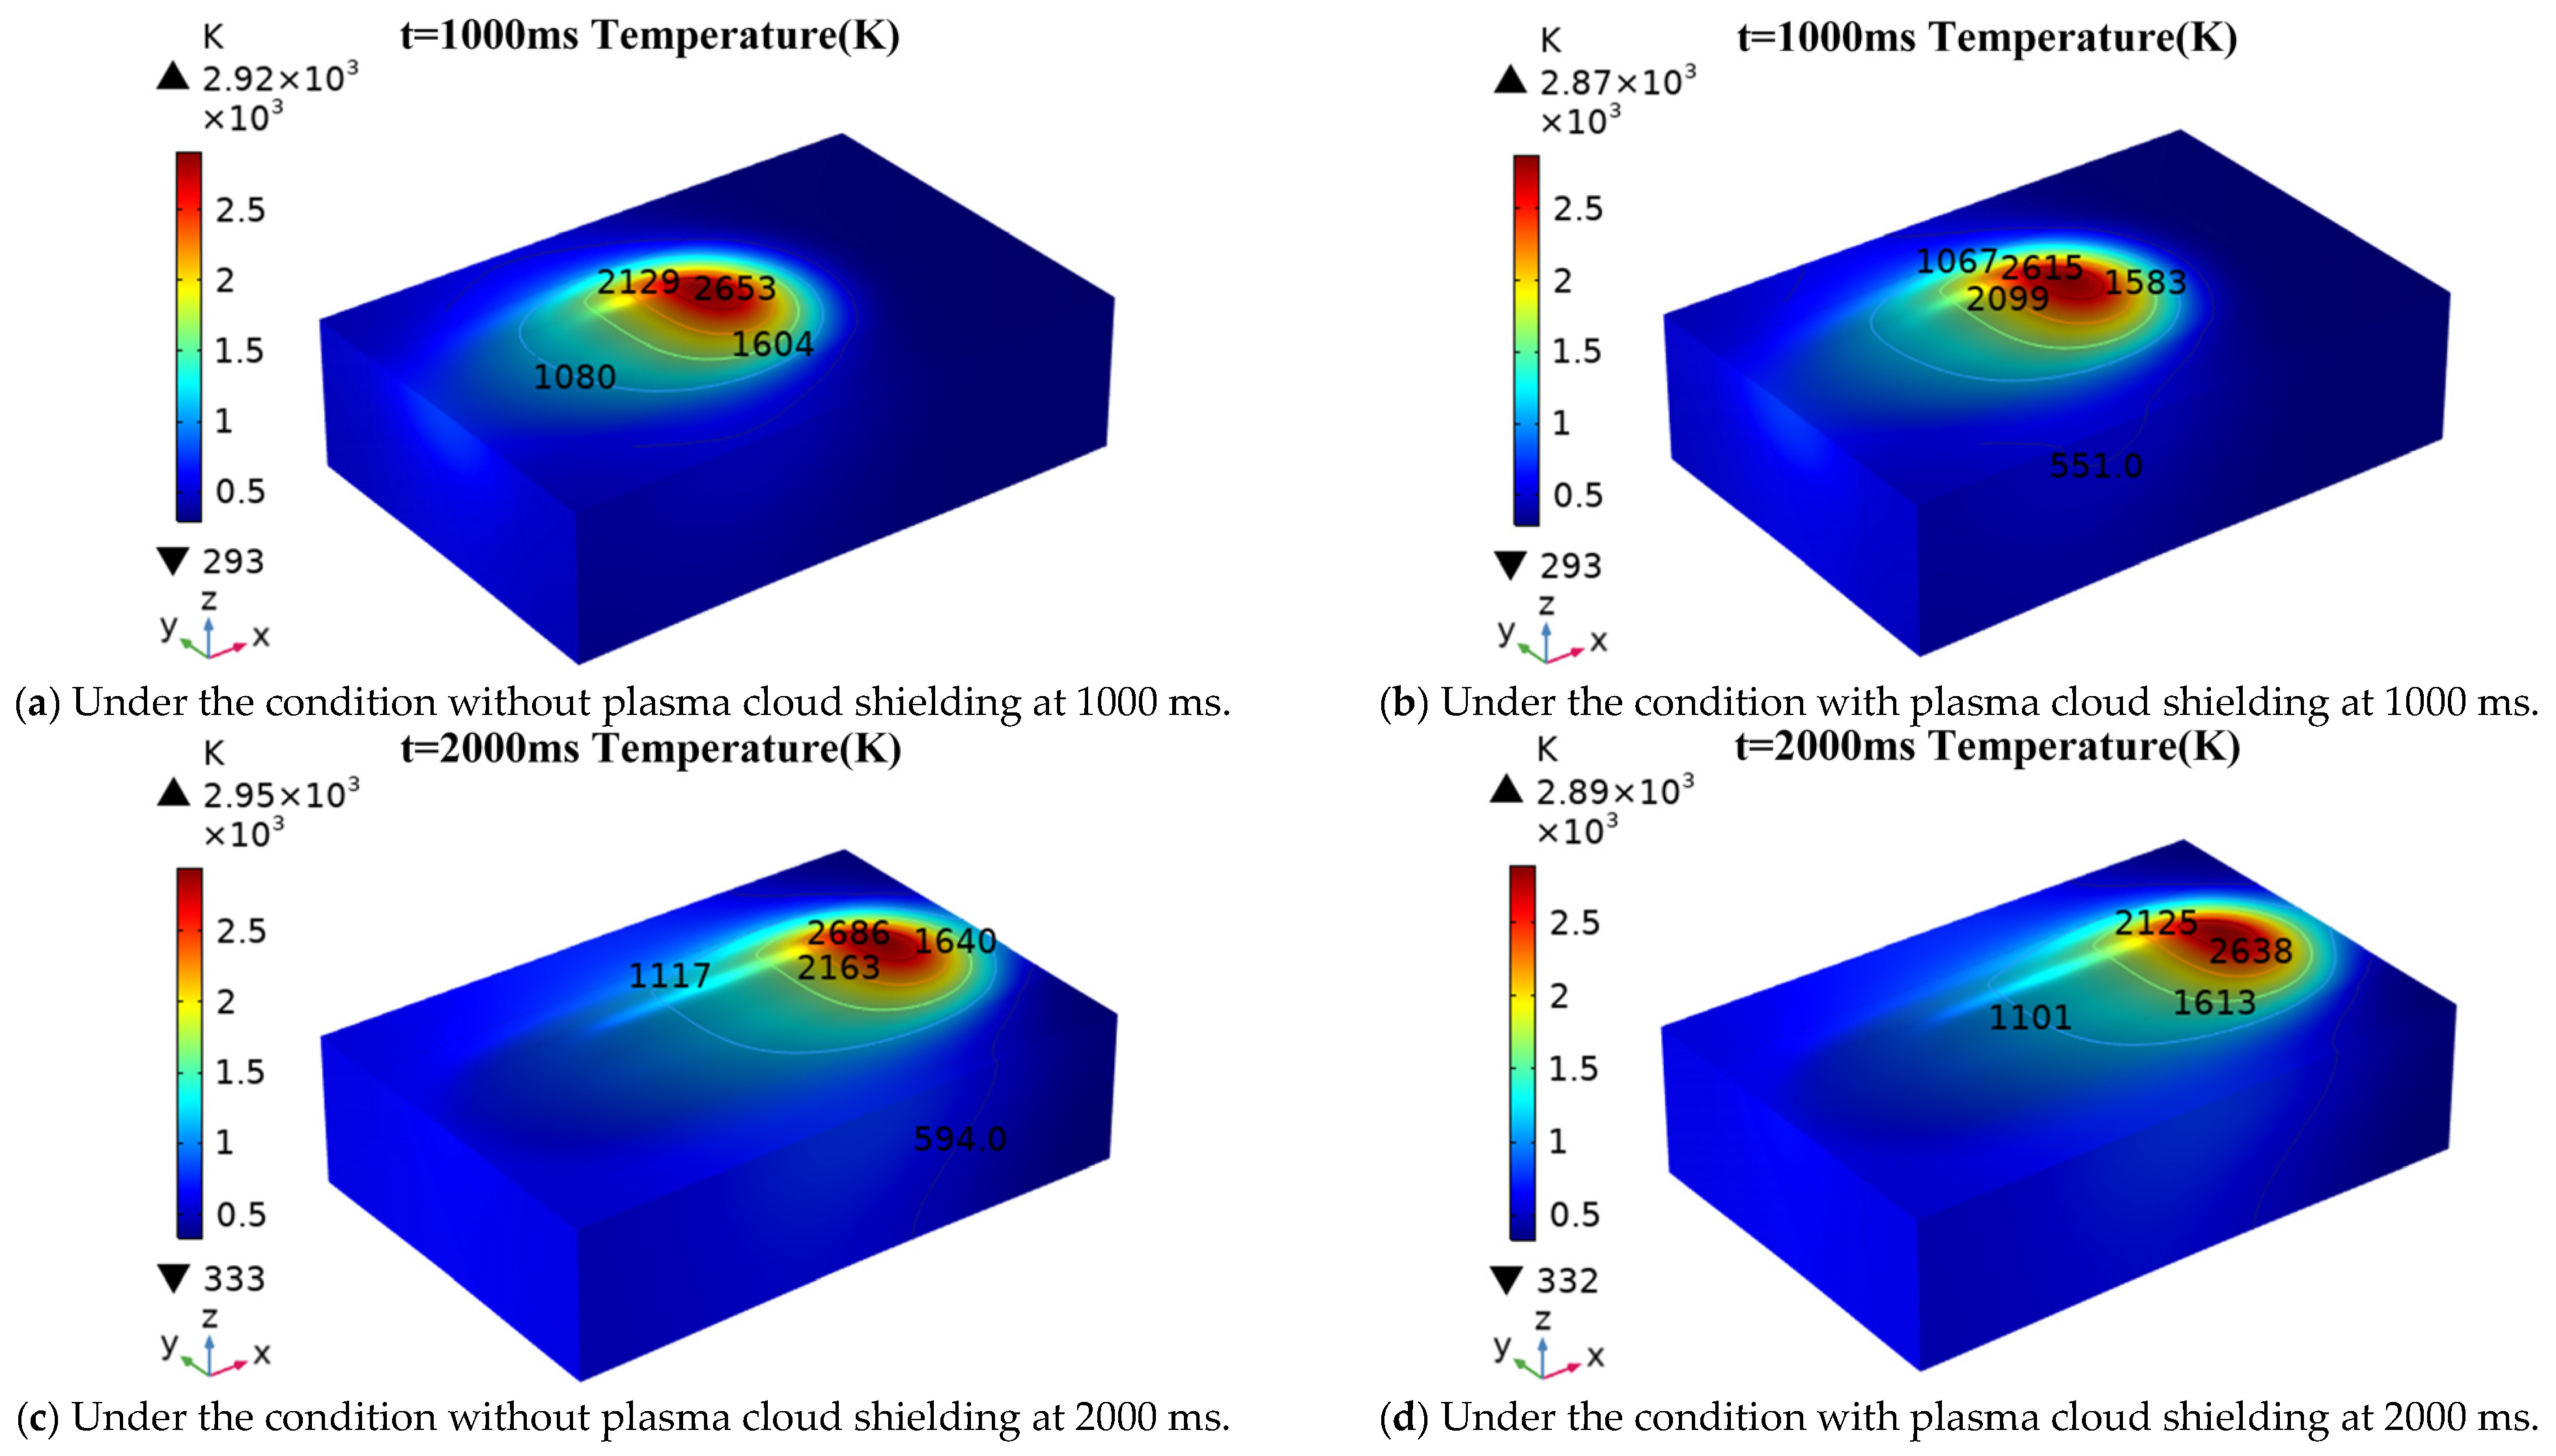
The temperature field results under different conditions (with and without plasma cloud shielding effect) are compared, as shown in Figure 4, and Figure 4a–c are obtained by Equation (4), while Figure 4b–d are obtained from Equation (14). The results show that at 1000 ms, the maximum temperatures of the cladding with and without plasma cloud shielding are 2870 K and 2920 K, respectively, with a temperature difference of 50 K, as shown in Figure 4a,b. At 2000 ms, the maximum temperatures of the cladding with and without plasma cloud shielding are 2890 K and 2950 K, respectively, with a temperature difference of 50 K, as shown in Figure 4c,d. Therefore, the temperature of the cladding with plasma cloud shielding is slightly lower than that without plasma cloud shielding.
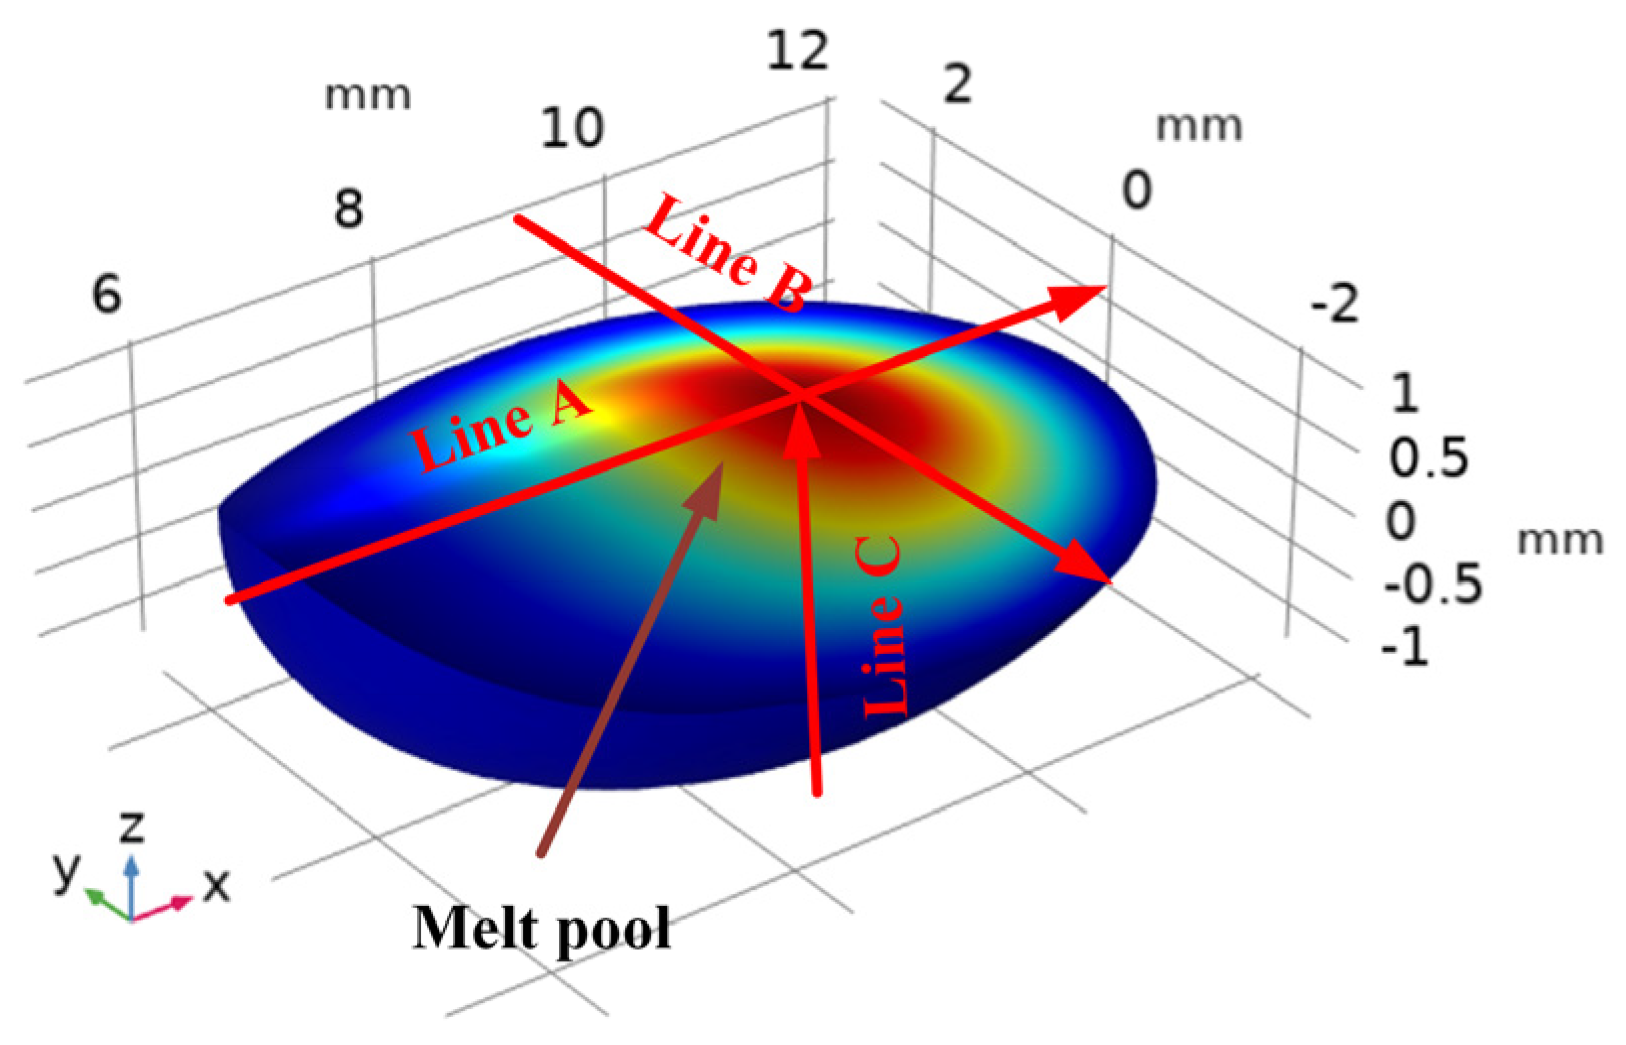
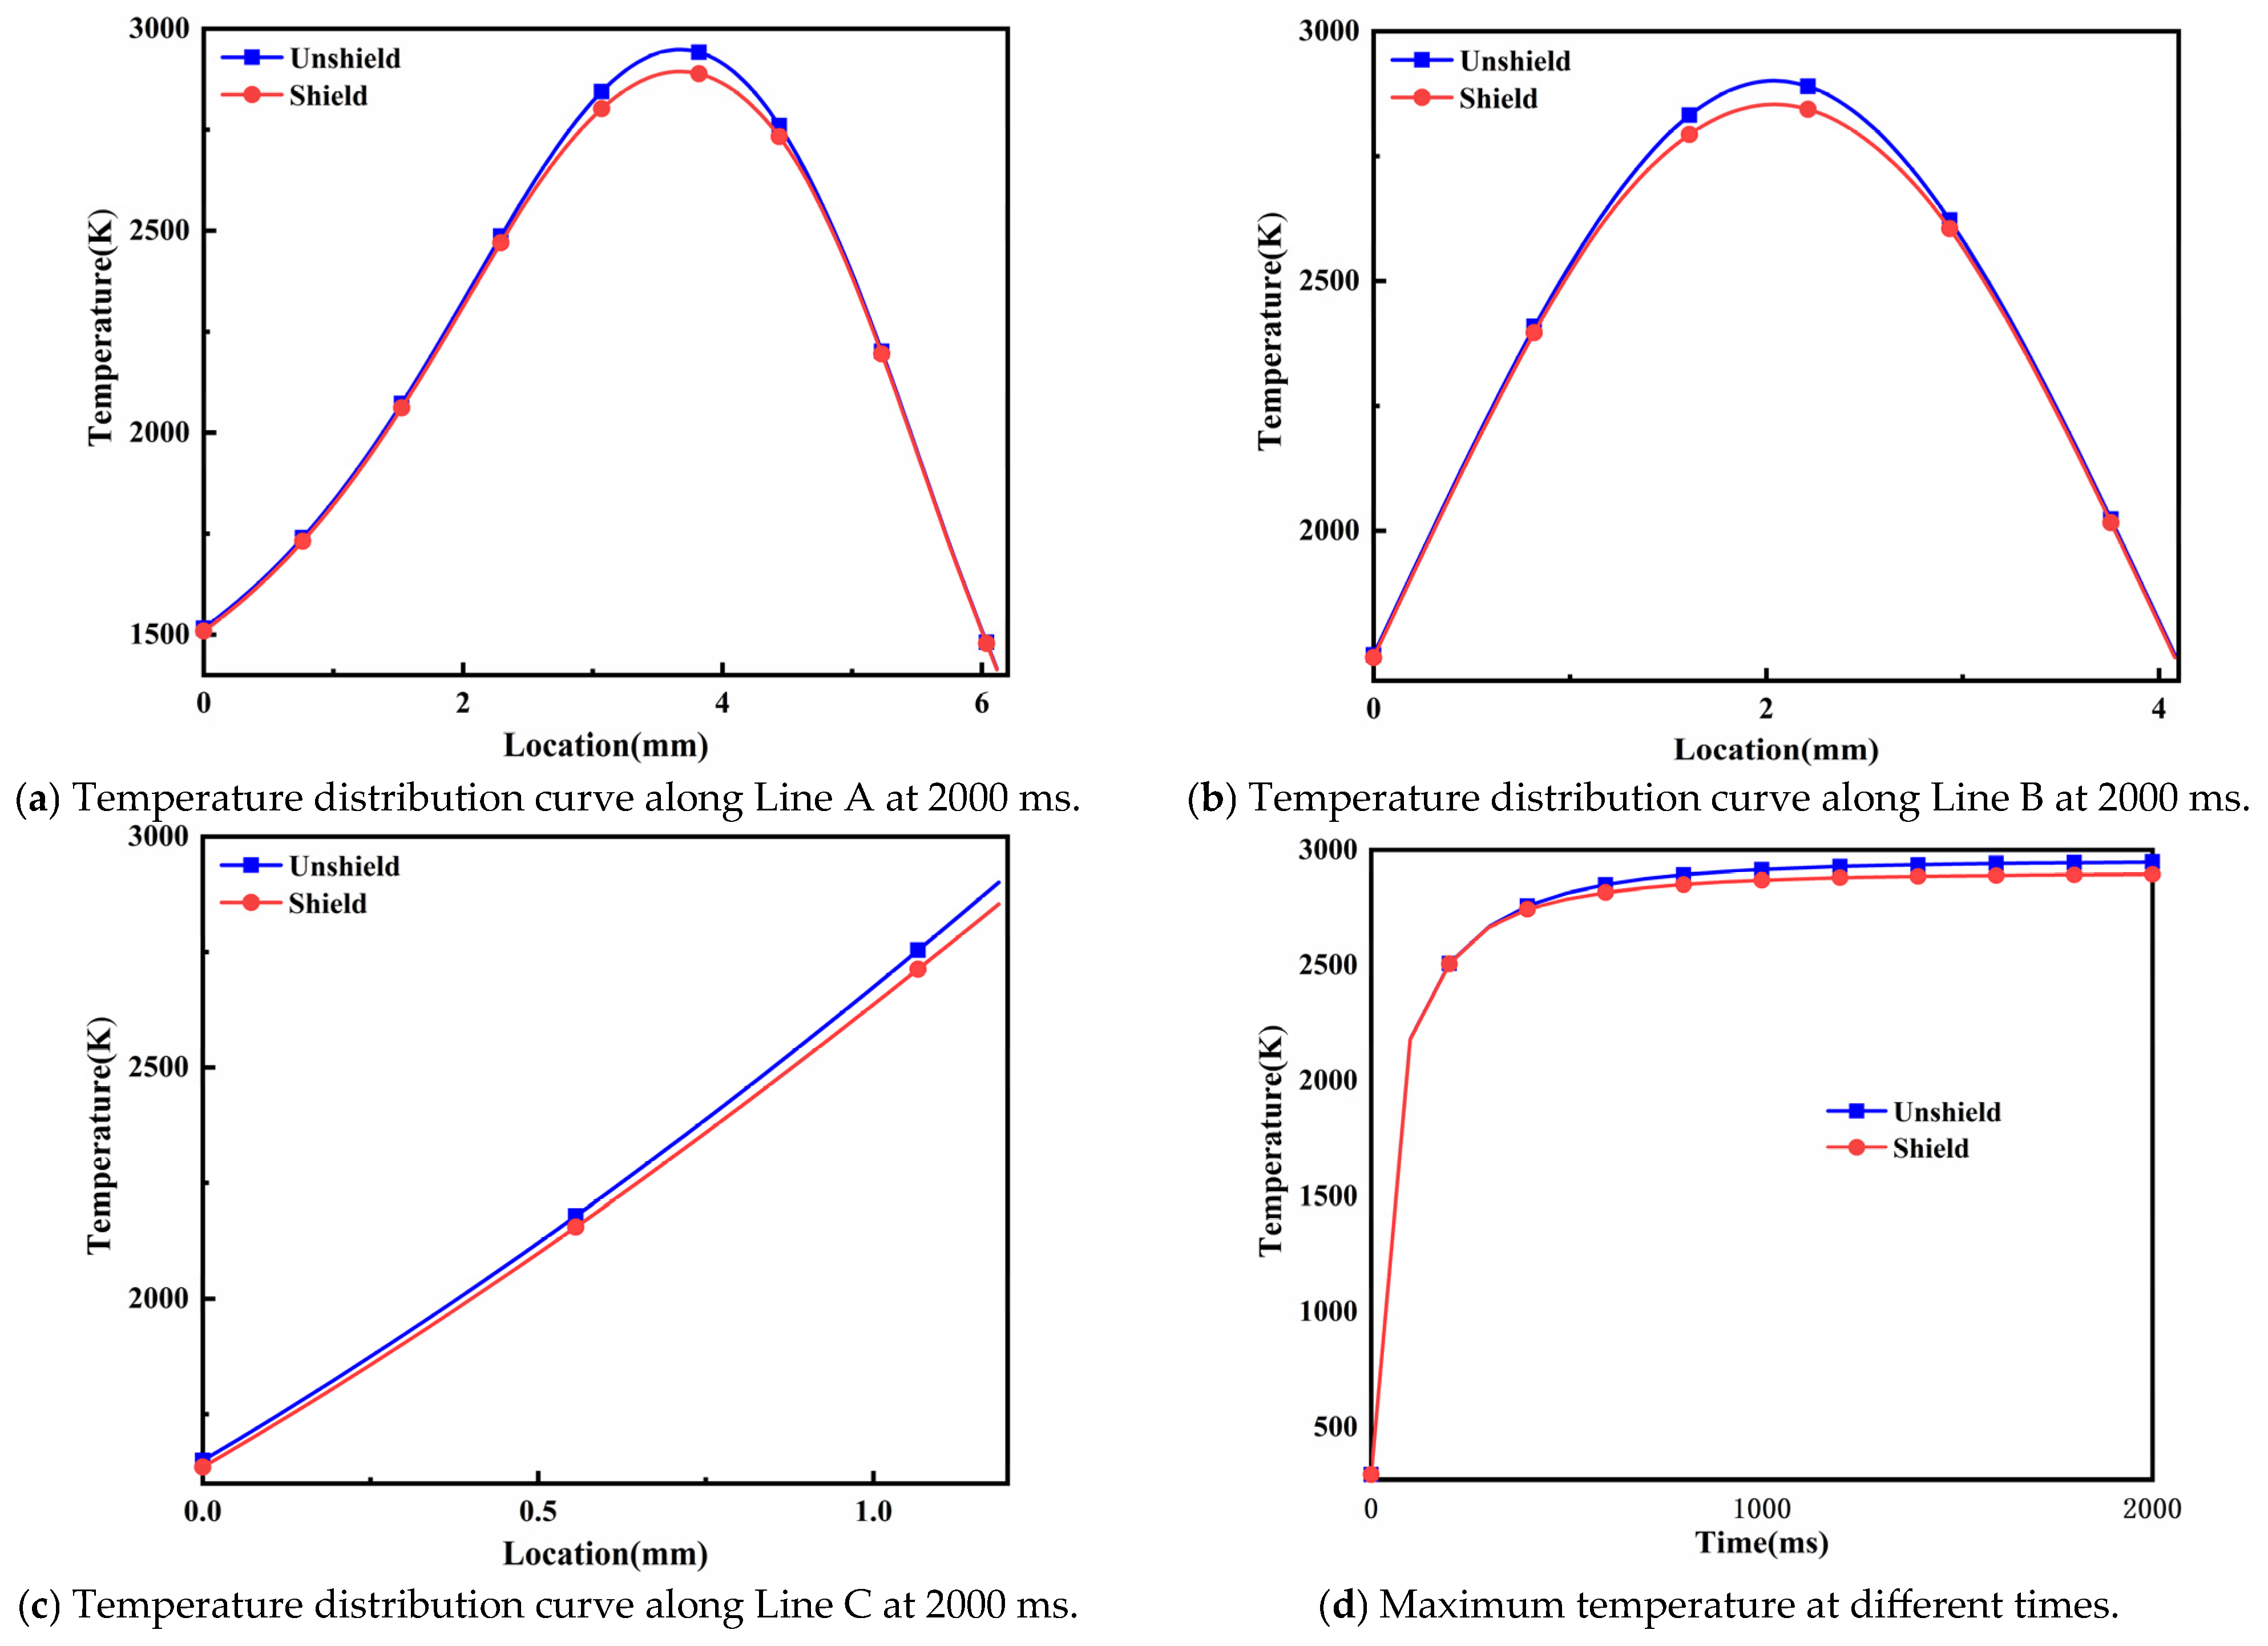
To quantitatively reveal the effect of plasma cloud shielding on the temperature during the laser cladding process, the data are collected from the molten pool along the x, y, and z directions in Figure 5, as shown in Figure 6a–c, respectively. The results show that the temperature of the molten pool with plasma cloud shielding is lower than that without plasma cloud shielding. This is attributed to the fact that when the welding temperature is high, the molten metal evaporates, and a large amount of metal vapor appears above the molten pool. The laser energy is absorbed by the metal vapor, which then transforms from molecules to atoms. These atoms then absorb photons and become ionized to form plasma. The melting metal needs to absorb laser energy for evaporation. The metal vapor molecules need to absorb laser energy to transform into atoms. The metal atoms ionization to form plasma requires absorbing photons. Due to the successive transformations of the molten metal and the absorption and shielding of the laser by the plasma, the temperature of the molten pool decreases. The maximum temperature of the overlay at different times is shown in Figure 6d, and the above analysis is verified once again.

4.2. Analysis of Flow Field Results

To facilitate the observation of the flow in the molten pool, the flow field is calculated using a half model. The flow of the melt in the molten pool is mainly affected by Marangoni effect [26], and the equation is as follows:
M α = d σ d T L c Δ T μ 45 , 60 α c
where /dT is the surface tension temperature coefficient, ΔT is the maximum temperature difference within the molten pool, αc is the thermal diffusivity of the alloy, and Lc is the characteristic length, representing the length of the molten pool [27].
When the surface of the material is heated by laser to the boiling point of the cladding material, the molten material will be vaporized and form steam. The metal vapor at high temperature will be ionized and absorb laser energy. This process is called plasma shielding. When the energy absorbed by the metal vapor reaches a certain level, an impact wave will form around the molten pool. The shock wave exerts pressure on the melt and affects its flow. Fabbro obtained through simulation calculations that in a closed environment, the impact force of the evaporation point can be determined by the laser intensity, and the equation is as follows [28]:
P M = 10 α z 2 α z + 3 Z c I c
where αz is the ratio of pulse energy to heat energy conversion, Zc is the acoustic impedance function (the acoustic impedance value is set at 4.53 × 10⁶ g/cm2 [29]), and Ic is the laser intensity.
The flow fields with and without plasma cloud shielding effects at different times were compared, as shown in Figure 7. The results show that at 1000 ms, the maximum flow velocity of the molten pool without plasma cloud shielding is 0.206 m/s, while the maximum flow velocity with plasma cloud shielding is 0.198 m/s. The difference in flow velocities between the two is 0.008 m/s, as shown in Figure 7a,b. At 2000 ms, the maximum flow velocity of the molten pool without plasma cloud shielding is 0.226 m/s, while the maximum flow velocity with plasma cloud shielding is 0.222 m/s. The difference in flow velocities between the two is 0.004 m/s, as shown in Figure 7c,d. In conclusion, the flow velocity of the molten pool with plasma cloud shielding is slightly lower than that without plasma cloud shielding.
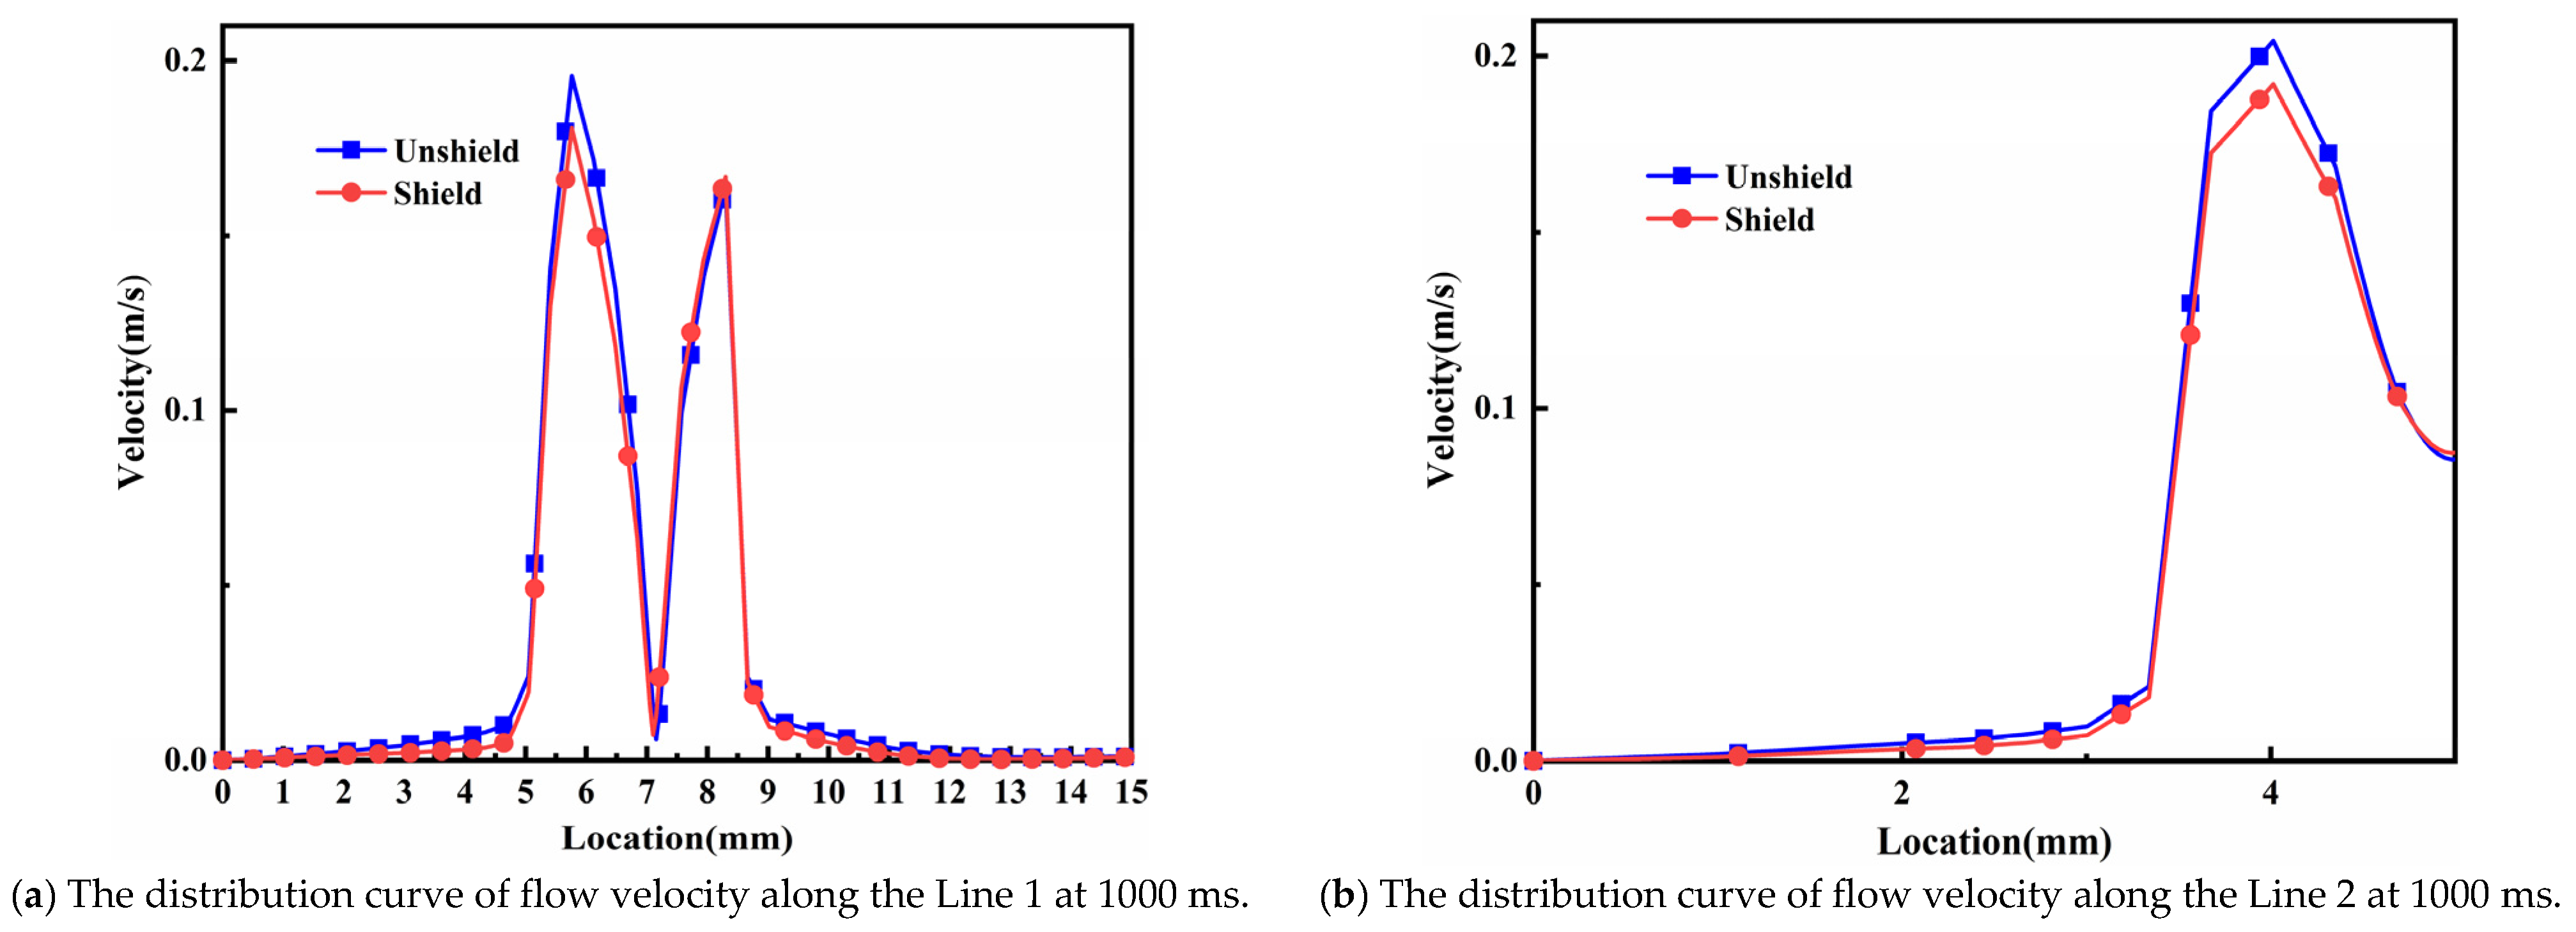
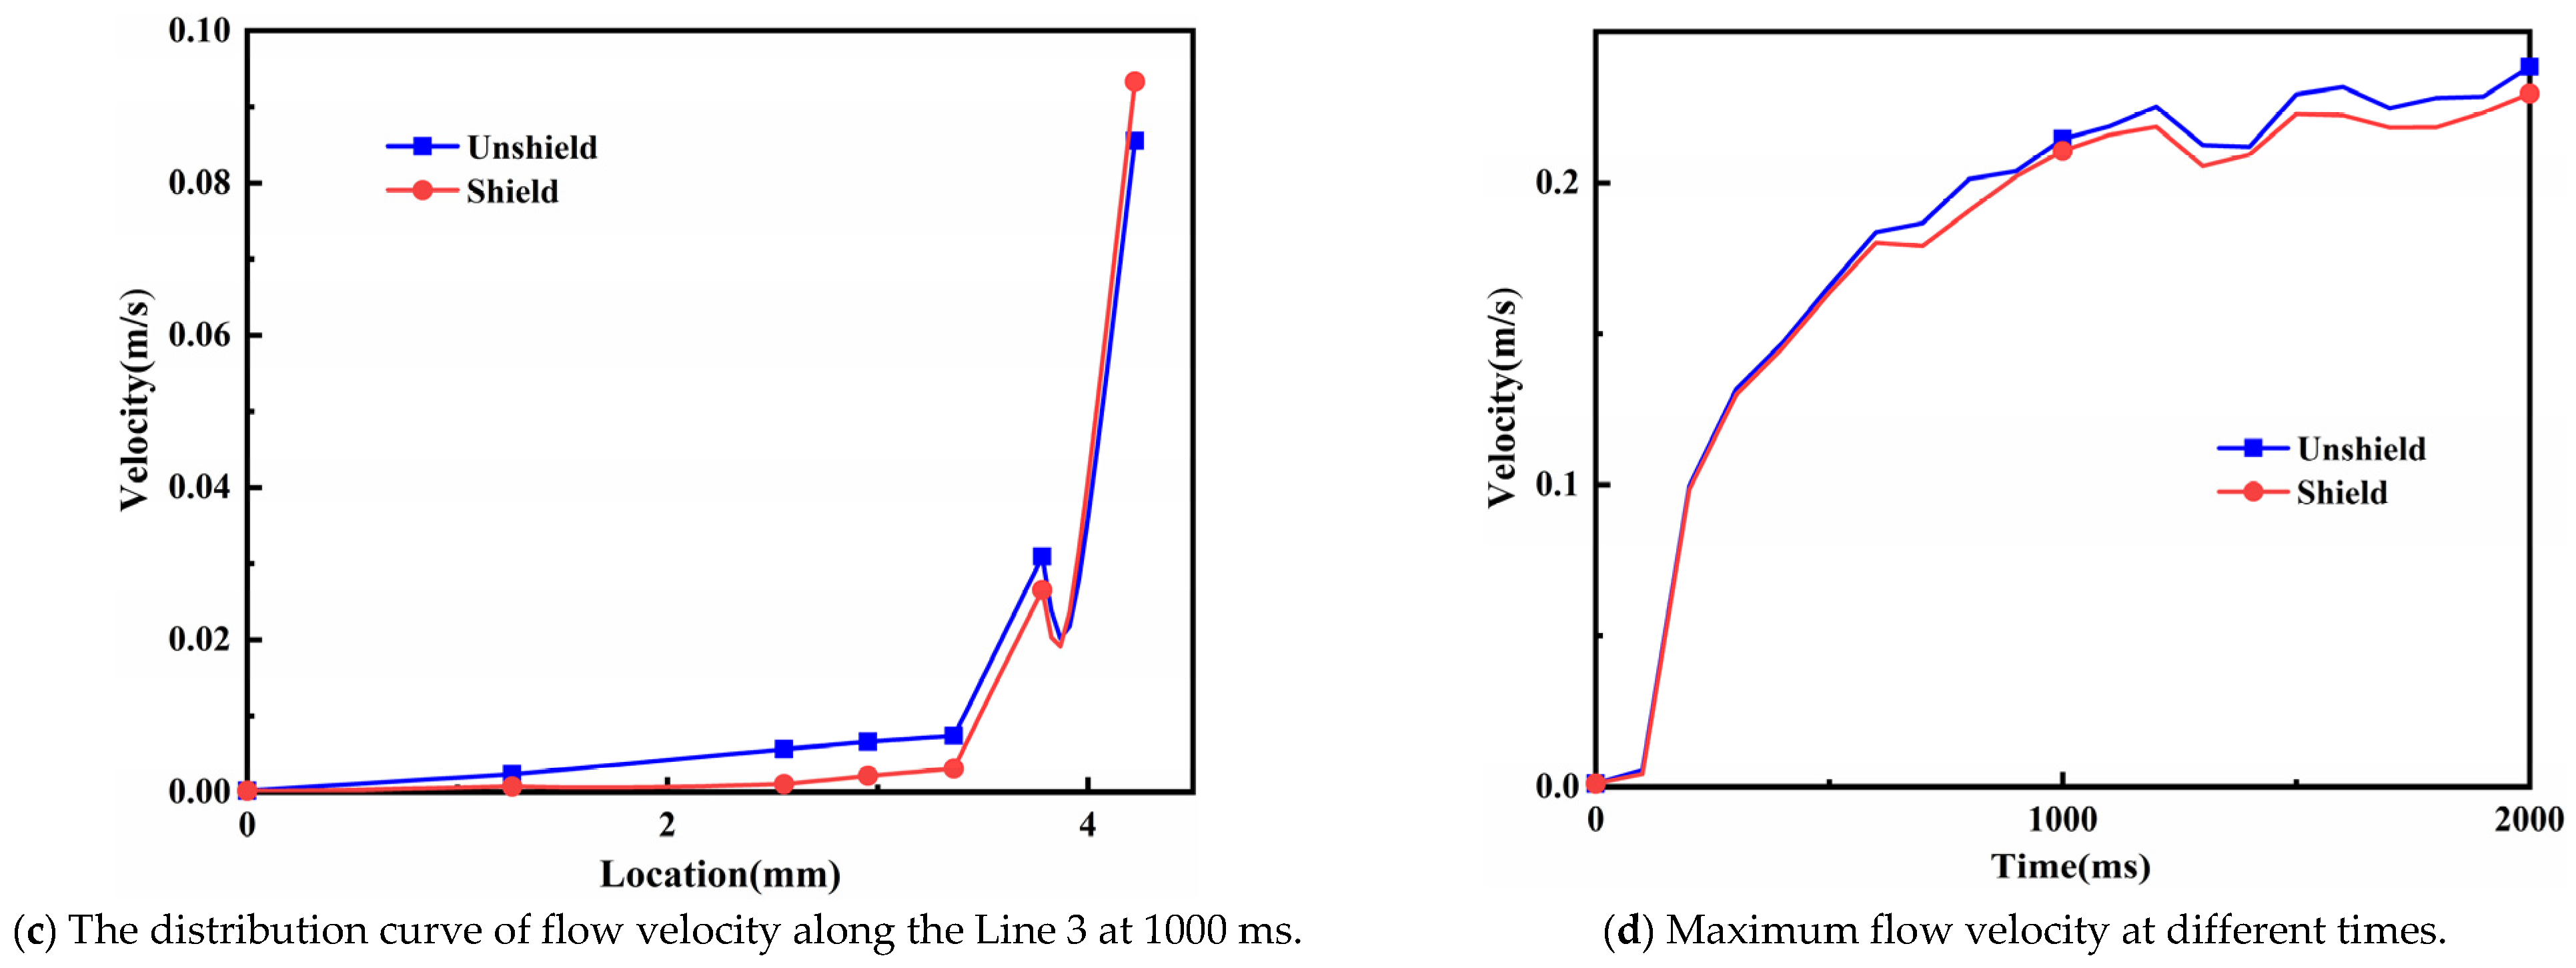
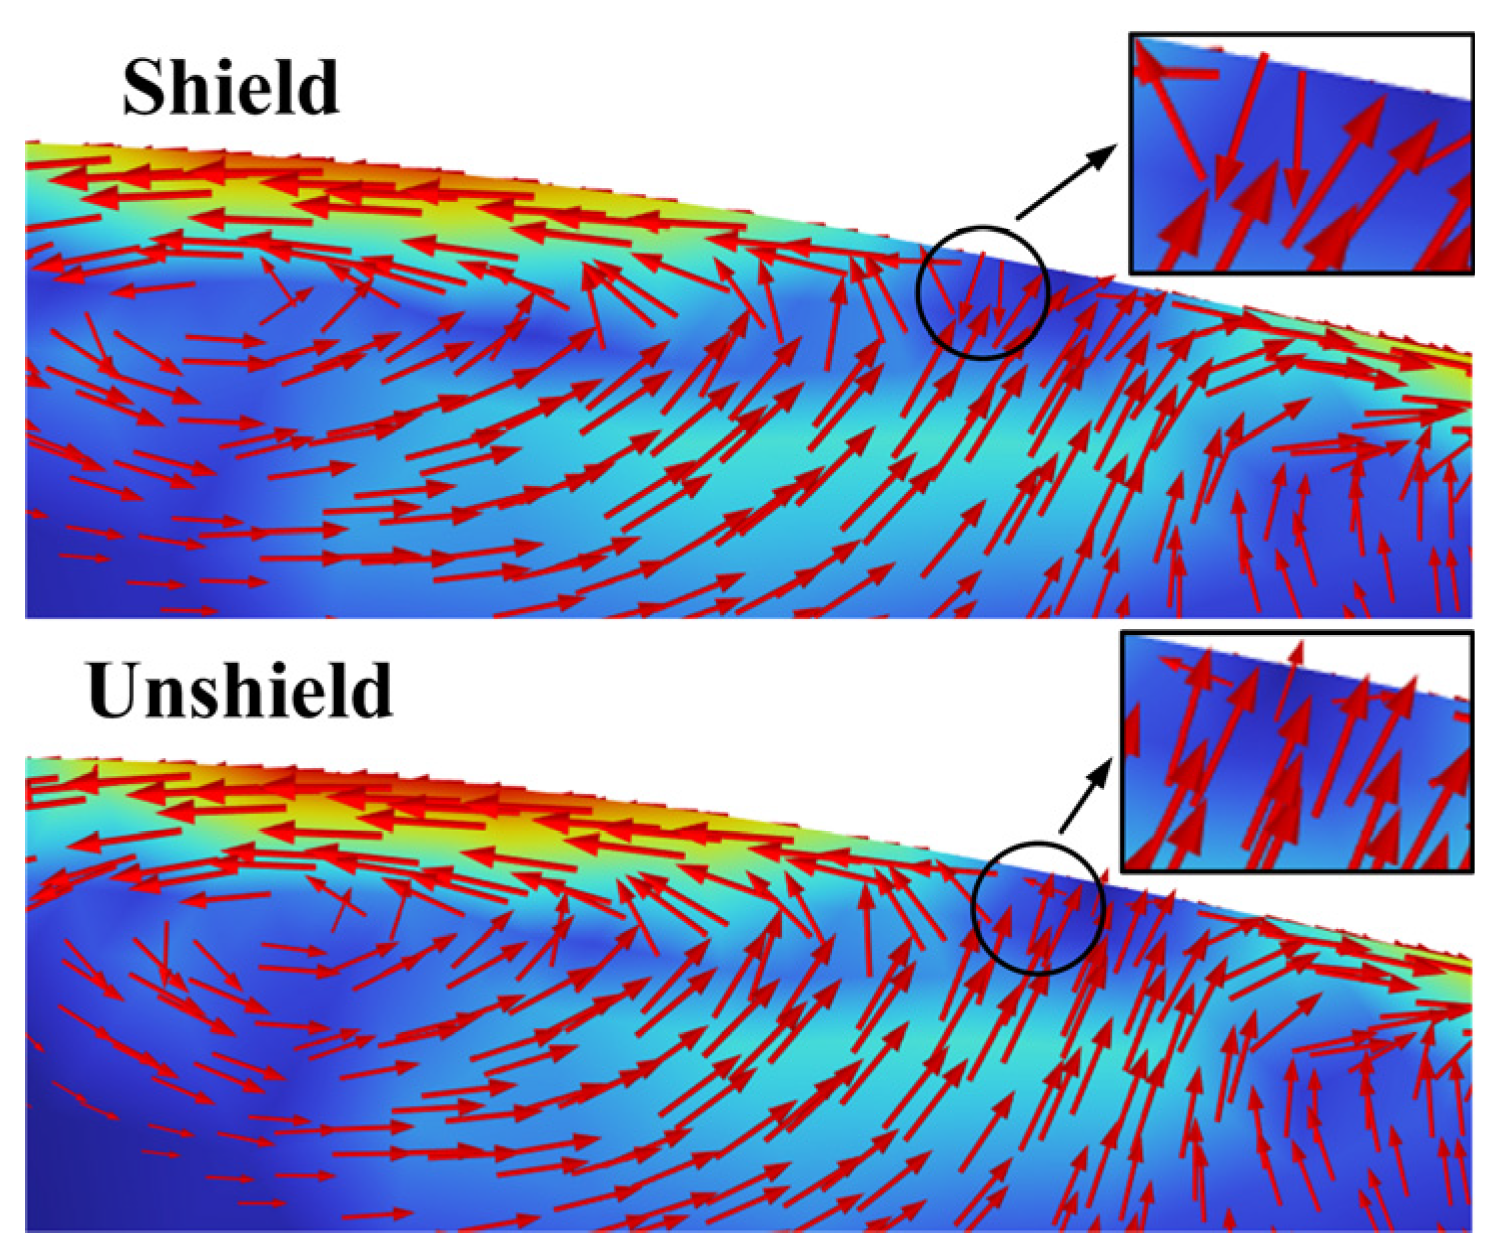
To quantitatively reveal the effect of plasma cloud shielding on the flow velocity of the molten pool, the flow velocity curves of the molten pool at 1000 ms are obtained along Lines 1, 2, and 3, as shown in Figure 8a–c, respectively. The results show that the shielding of the plasma cloud will cause a decrease in the flow velocity of the molten pool. The existence of the plasma cloud shields a portion of the laser energy, causing a decrease in the temperature of the molten pool (consistent with the results of the temperature field analysis). The decrease in temperature leads to a reduction in surface tension and buoyancy, and a decrease in flow velocity. During the expansion of the plasma cloud, the shock waves formed around the molten pool cause a reduction in the Marangoni flow of the molten metal, and the flow velocity is further reduced. The maximum flow velocity of the molten pool at different times is shown in Figure 8d, and the above conclusion is once again verified. Near the center of the molten pool, the shielding of the plasma cloud will cause a slight increase in the flow velocity of the molten pool, as shown in Figure 8c. This is attributed to the fact that in the extremely small range near the center of the molten pool, the evaporation of molten metal is the greatest, the ionized plasma is the most, and the impact force is the largest. At this position, the flow velocity of the molten pool is the smallest without the impact force, and under the action of the impact force, the flow direction of the molten metal changes. Therefore, in the molten pool with plasma cloud shielding at the center, the reverse flow velocity is greater than the forward flow velocity without plasma cloud shielding, as shown in Figure 9.

4.3. Analysis of Concentration Field Results

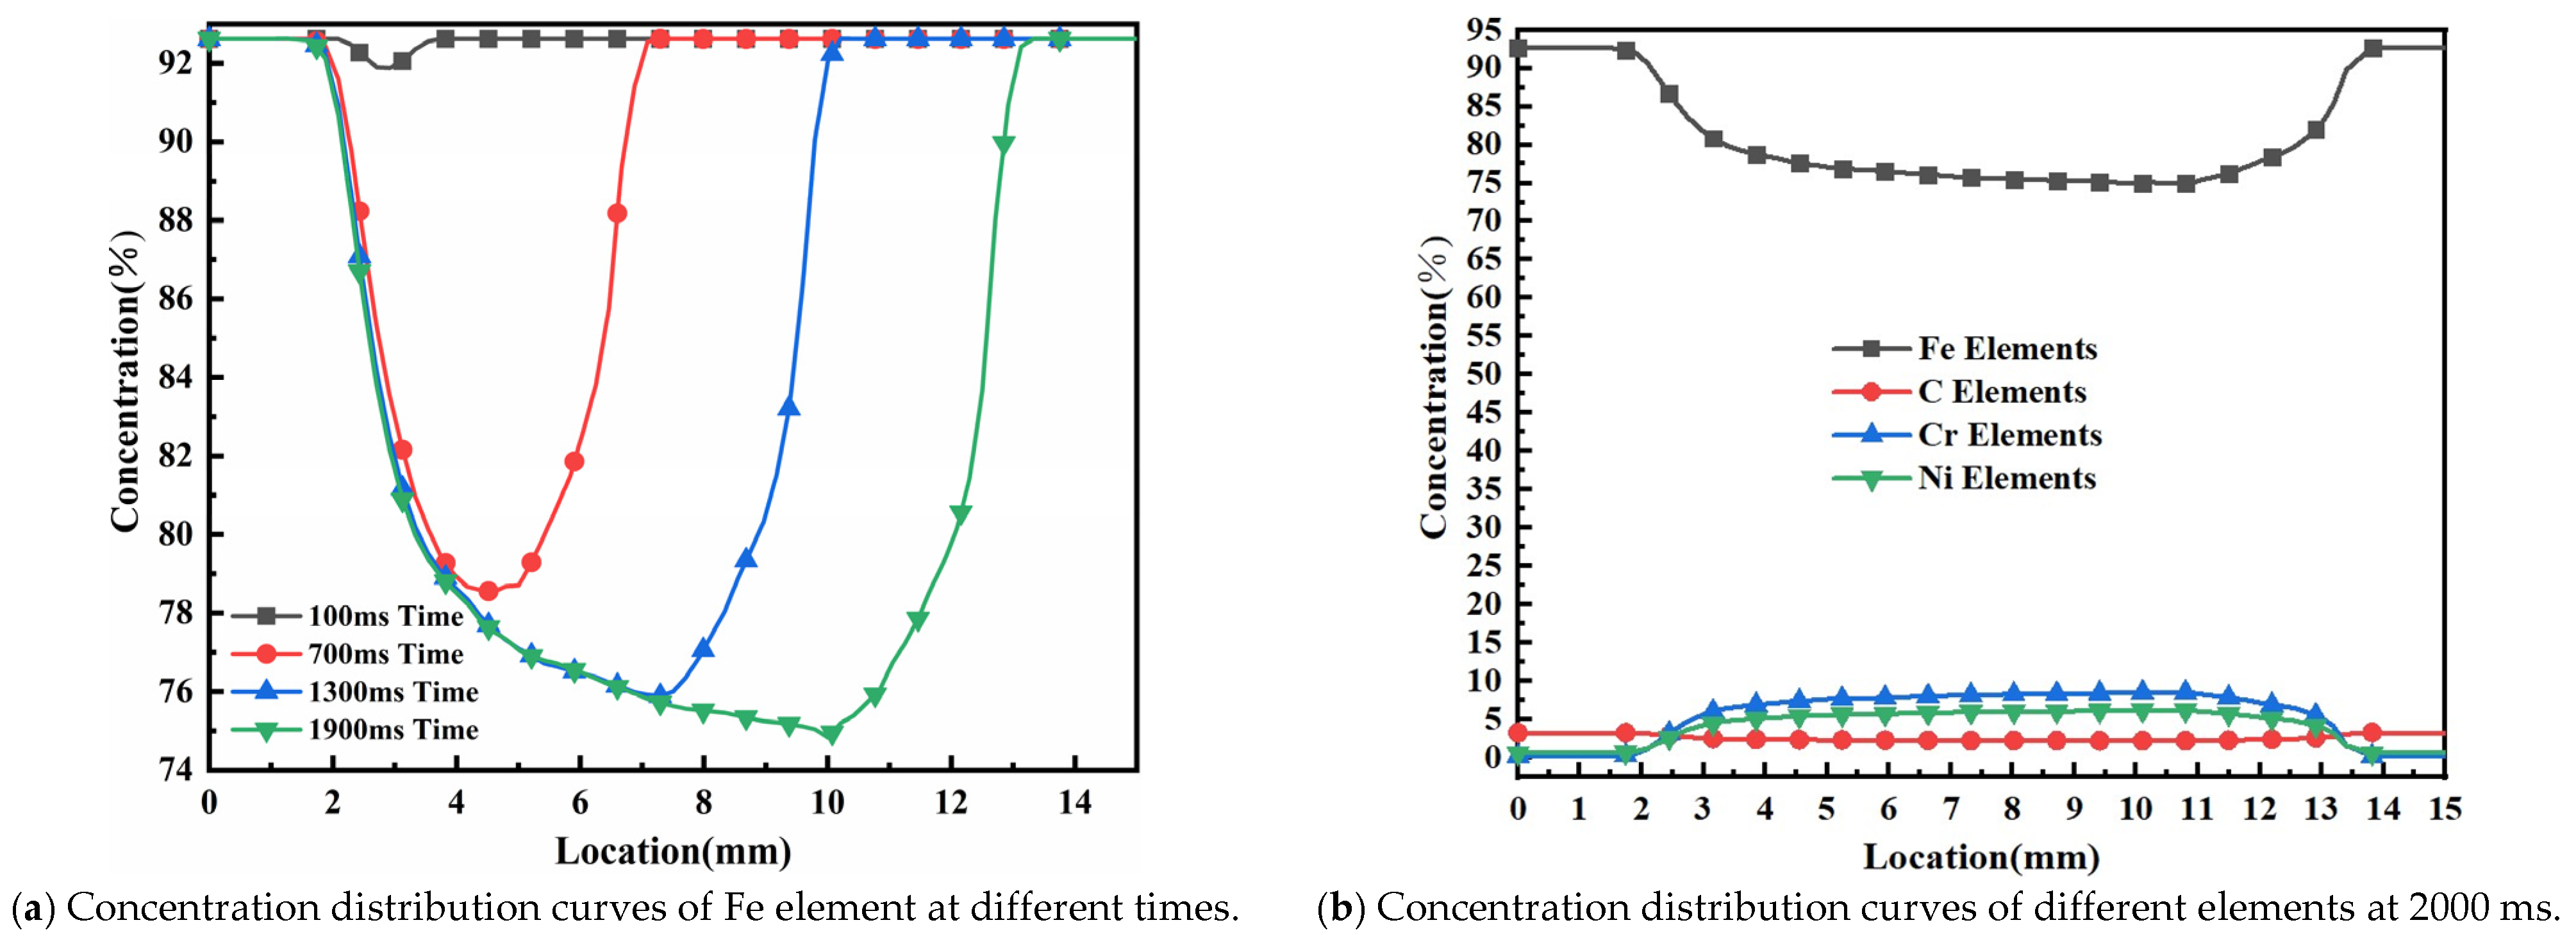
To reveal the trend in element concentration changes over time in the molten pool, the concentration distribution curves of Fe element at different times are extracted, as shown in Figure 10. Since the content of Fe element in the powder is less than that in the matrix, the concentration of Fe element in the molten pool gradually decreases as the cladding process proceeds. At the beginning of the cladding process, less powder enters the molten pool. Currently, the main component of the molten pool is the matrix composition (with a higher concentration of Fe element). As the content of powder entering the molten pool increases, the concentration of Fe element in the molten pool gradually decreases. The concentration of Fe element at the center of the laser light source is the lowest, and the concentration of Fe element is higher as it approaches the molten pool edge. This is attributed to the fact that the center of the laser light source (the center of the powder flow) is mainly composed of powder, while the edge of the molten pool is a mixed zone. The concentration distribution curves of each element at 2000 ms are shown in Figure 10b. During the laser cladding process, the concentrations of Fe and C elements in the molten pool are lower than those in the matrix, while the concentrations of Cr and Ni elements are higher than those in the matrix. As the cladding process proceeds, the concentrations of Fe and C elements in the molten pool first decrease and then reach a balance, while the concentrations of Cr and Ni elements first increase and then reach a balance.
During the laser cladding process, the evaporation and ionization of the molten material have a significant effect on the concentration of elements. This physical process can be traced back to the 19th century. Hertz and Knudsen studied the evaporation process of mercury in a vacuum and combined it with the molecular motion theory to obtain the Hertz-Knudsen formula as follows [30]:
n m = P n 2 π k M i T
where nm is the maximum evaporation velocity, Pn is the saturated vapor pressure, and the calculation equation is as follow [30]:
log P n = A + B T - 1 + C log T + D T
where A, B, C, and D are constants. The corresponding constant values for the calculation equation of the saturated vapor pressure of each element are shown in Table 3.
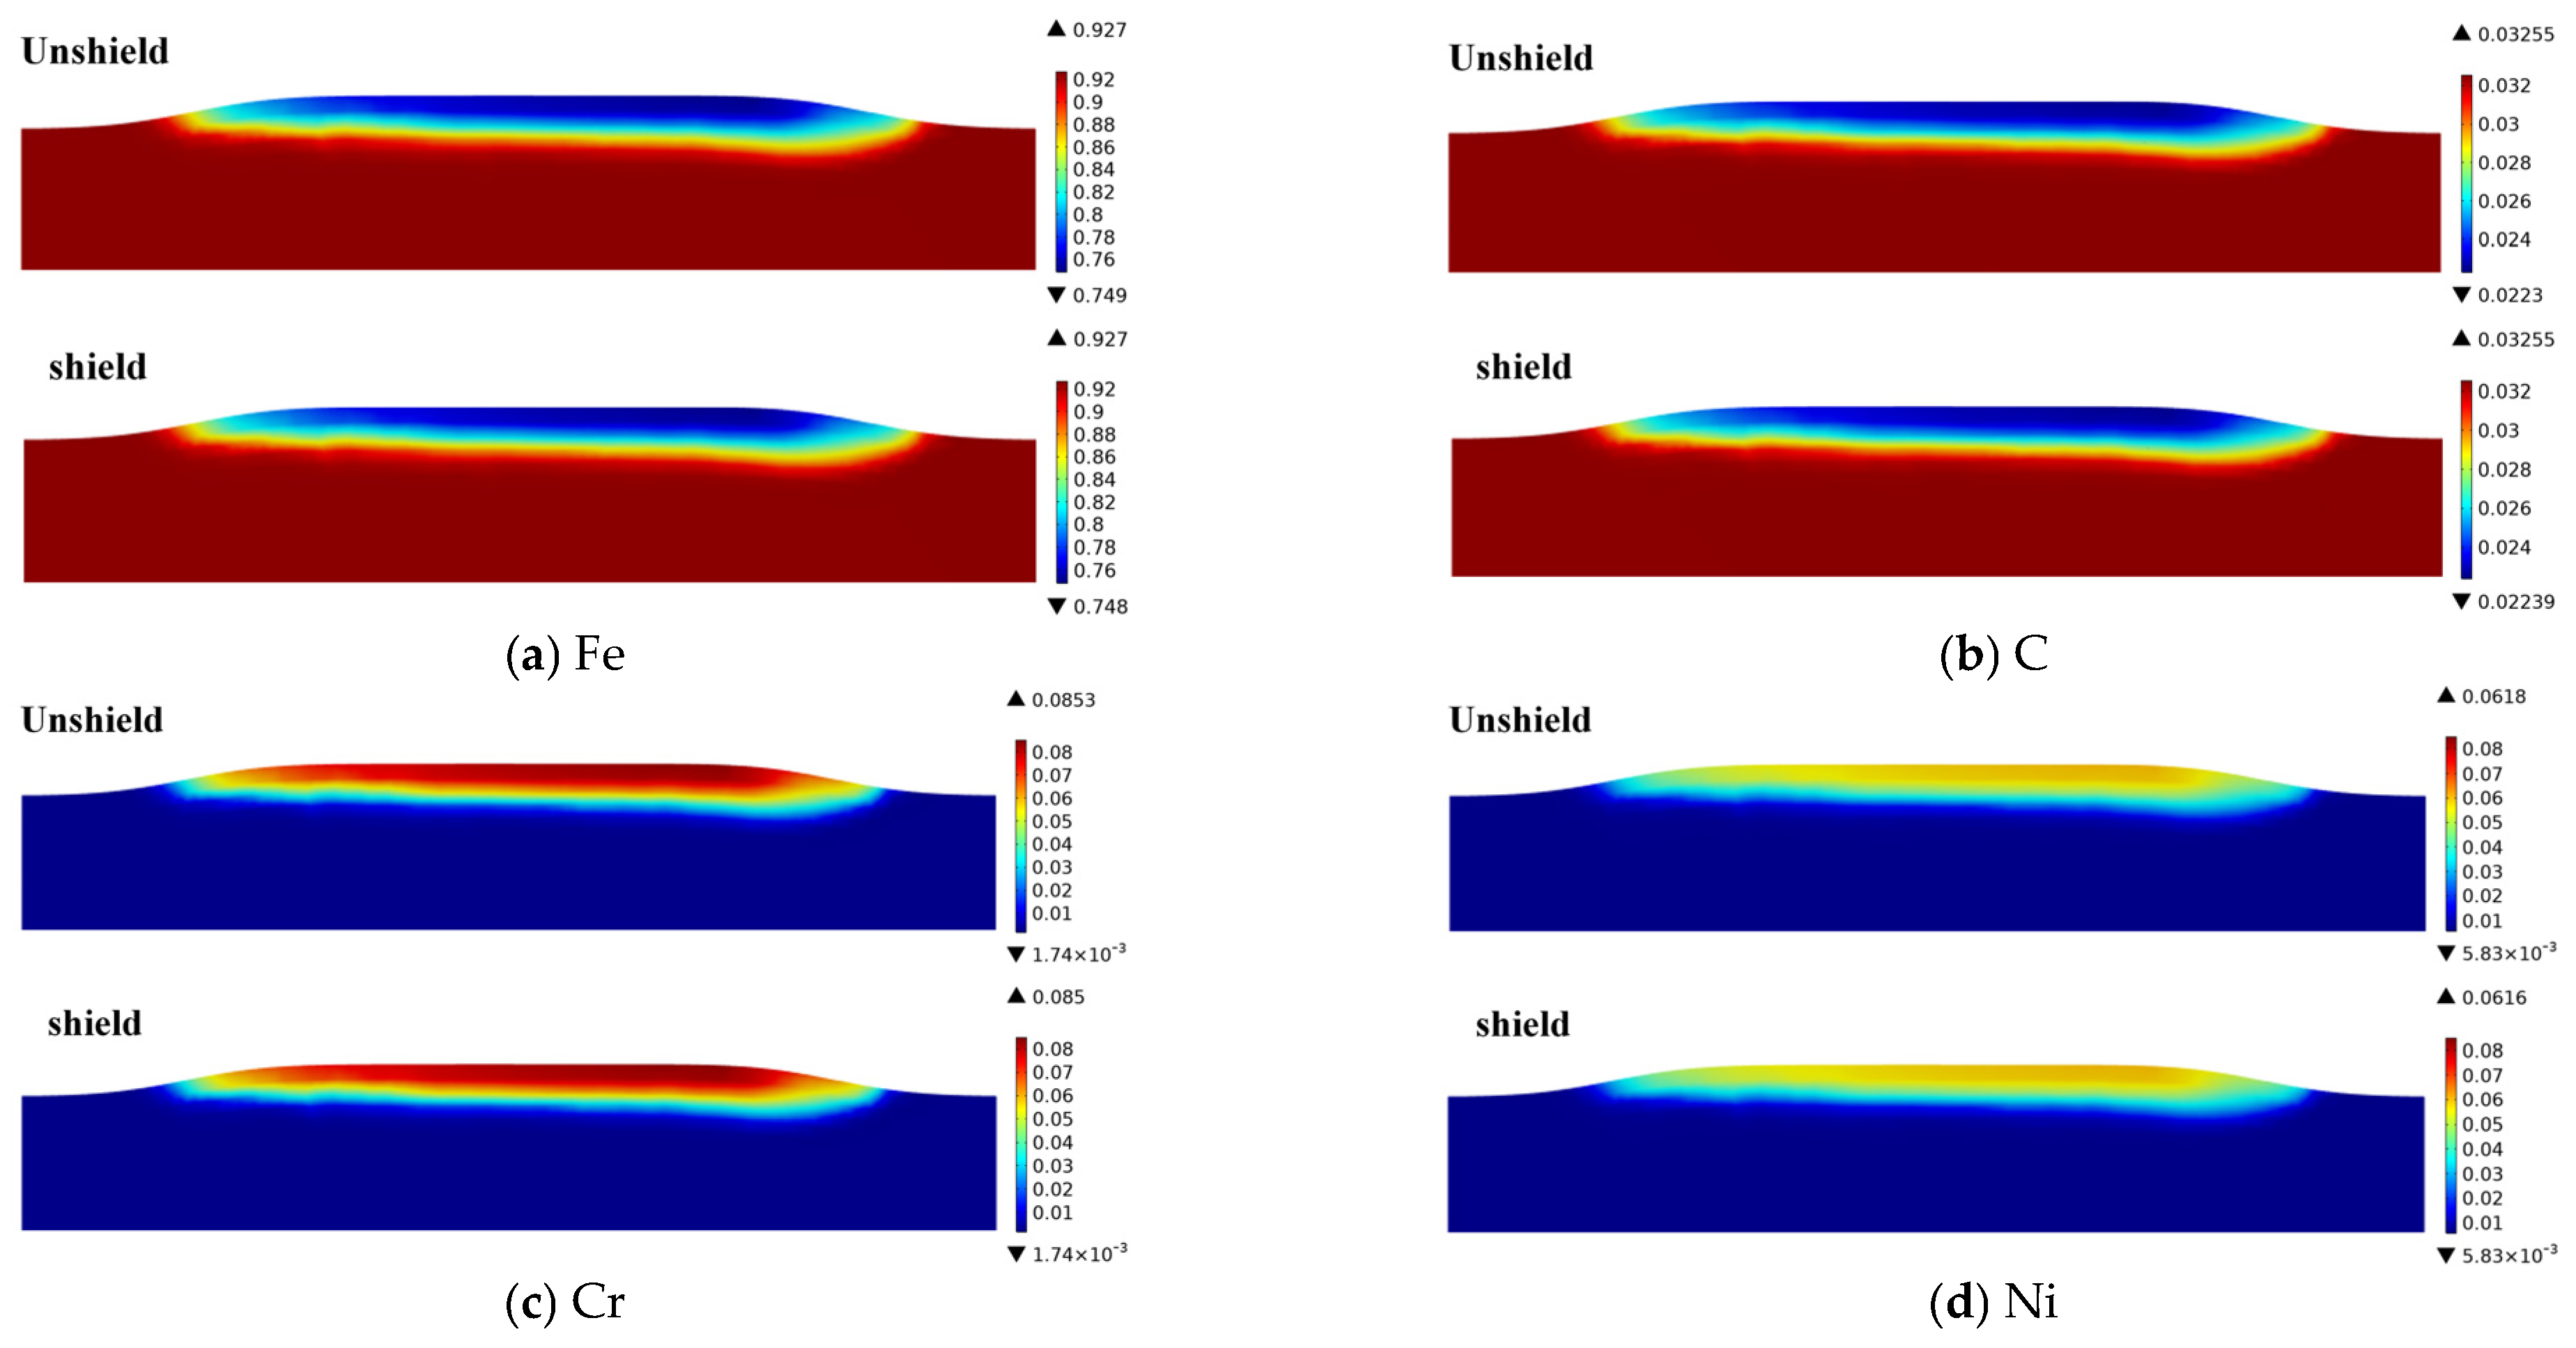
Based on Equations (26) and (27), the fusion equation was improved and calculated, and the concentration field results considering material evaporation and plasma cloud shielding were obtained. The calculation results under power of 1200 W and time of 2000 ms with and without plasma cloud shielding were compared, as shown in Figure 11. The results show that the element distribution in the molten pool is the same in both cases. The minimum Fe concentration with plasma cloud shielding is 74.8wt%, slightly lower than that without plasma cloud shielding (74.9wt%), as shown in Figure 11a. The minimum C concentration with plasma cloud shielding is 2.239wt%, slightly higher than that without plasma cloud shielding (2.23wt%), as shown in Figure 11b. The maximum Cr concentration with plasma cloud shielding is 8.5wt%, slightly lower than that without plasma cloud shielding (8.53wt%), as shown in Figure 11c. The maximum Ni concentration with plasma cloud shielding is 6.18wt%, slightly lower than that without plasma cloud shielding (6.16wt%), as shown in Figure 11d. In summary, when considering plasma cloud shielding, the concentrations of Fe, Cr, and Ni are slightly decreased, while the concentration of C is slightly increased.
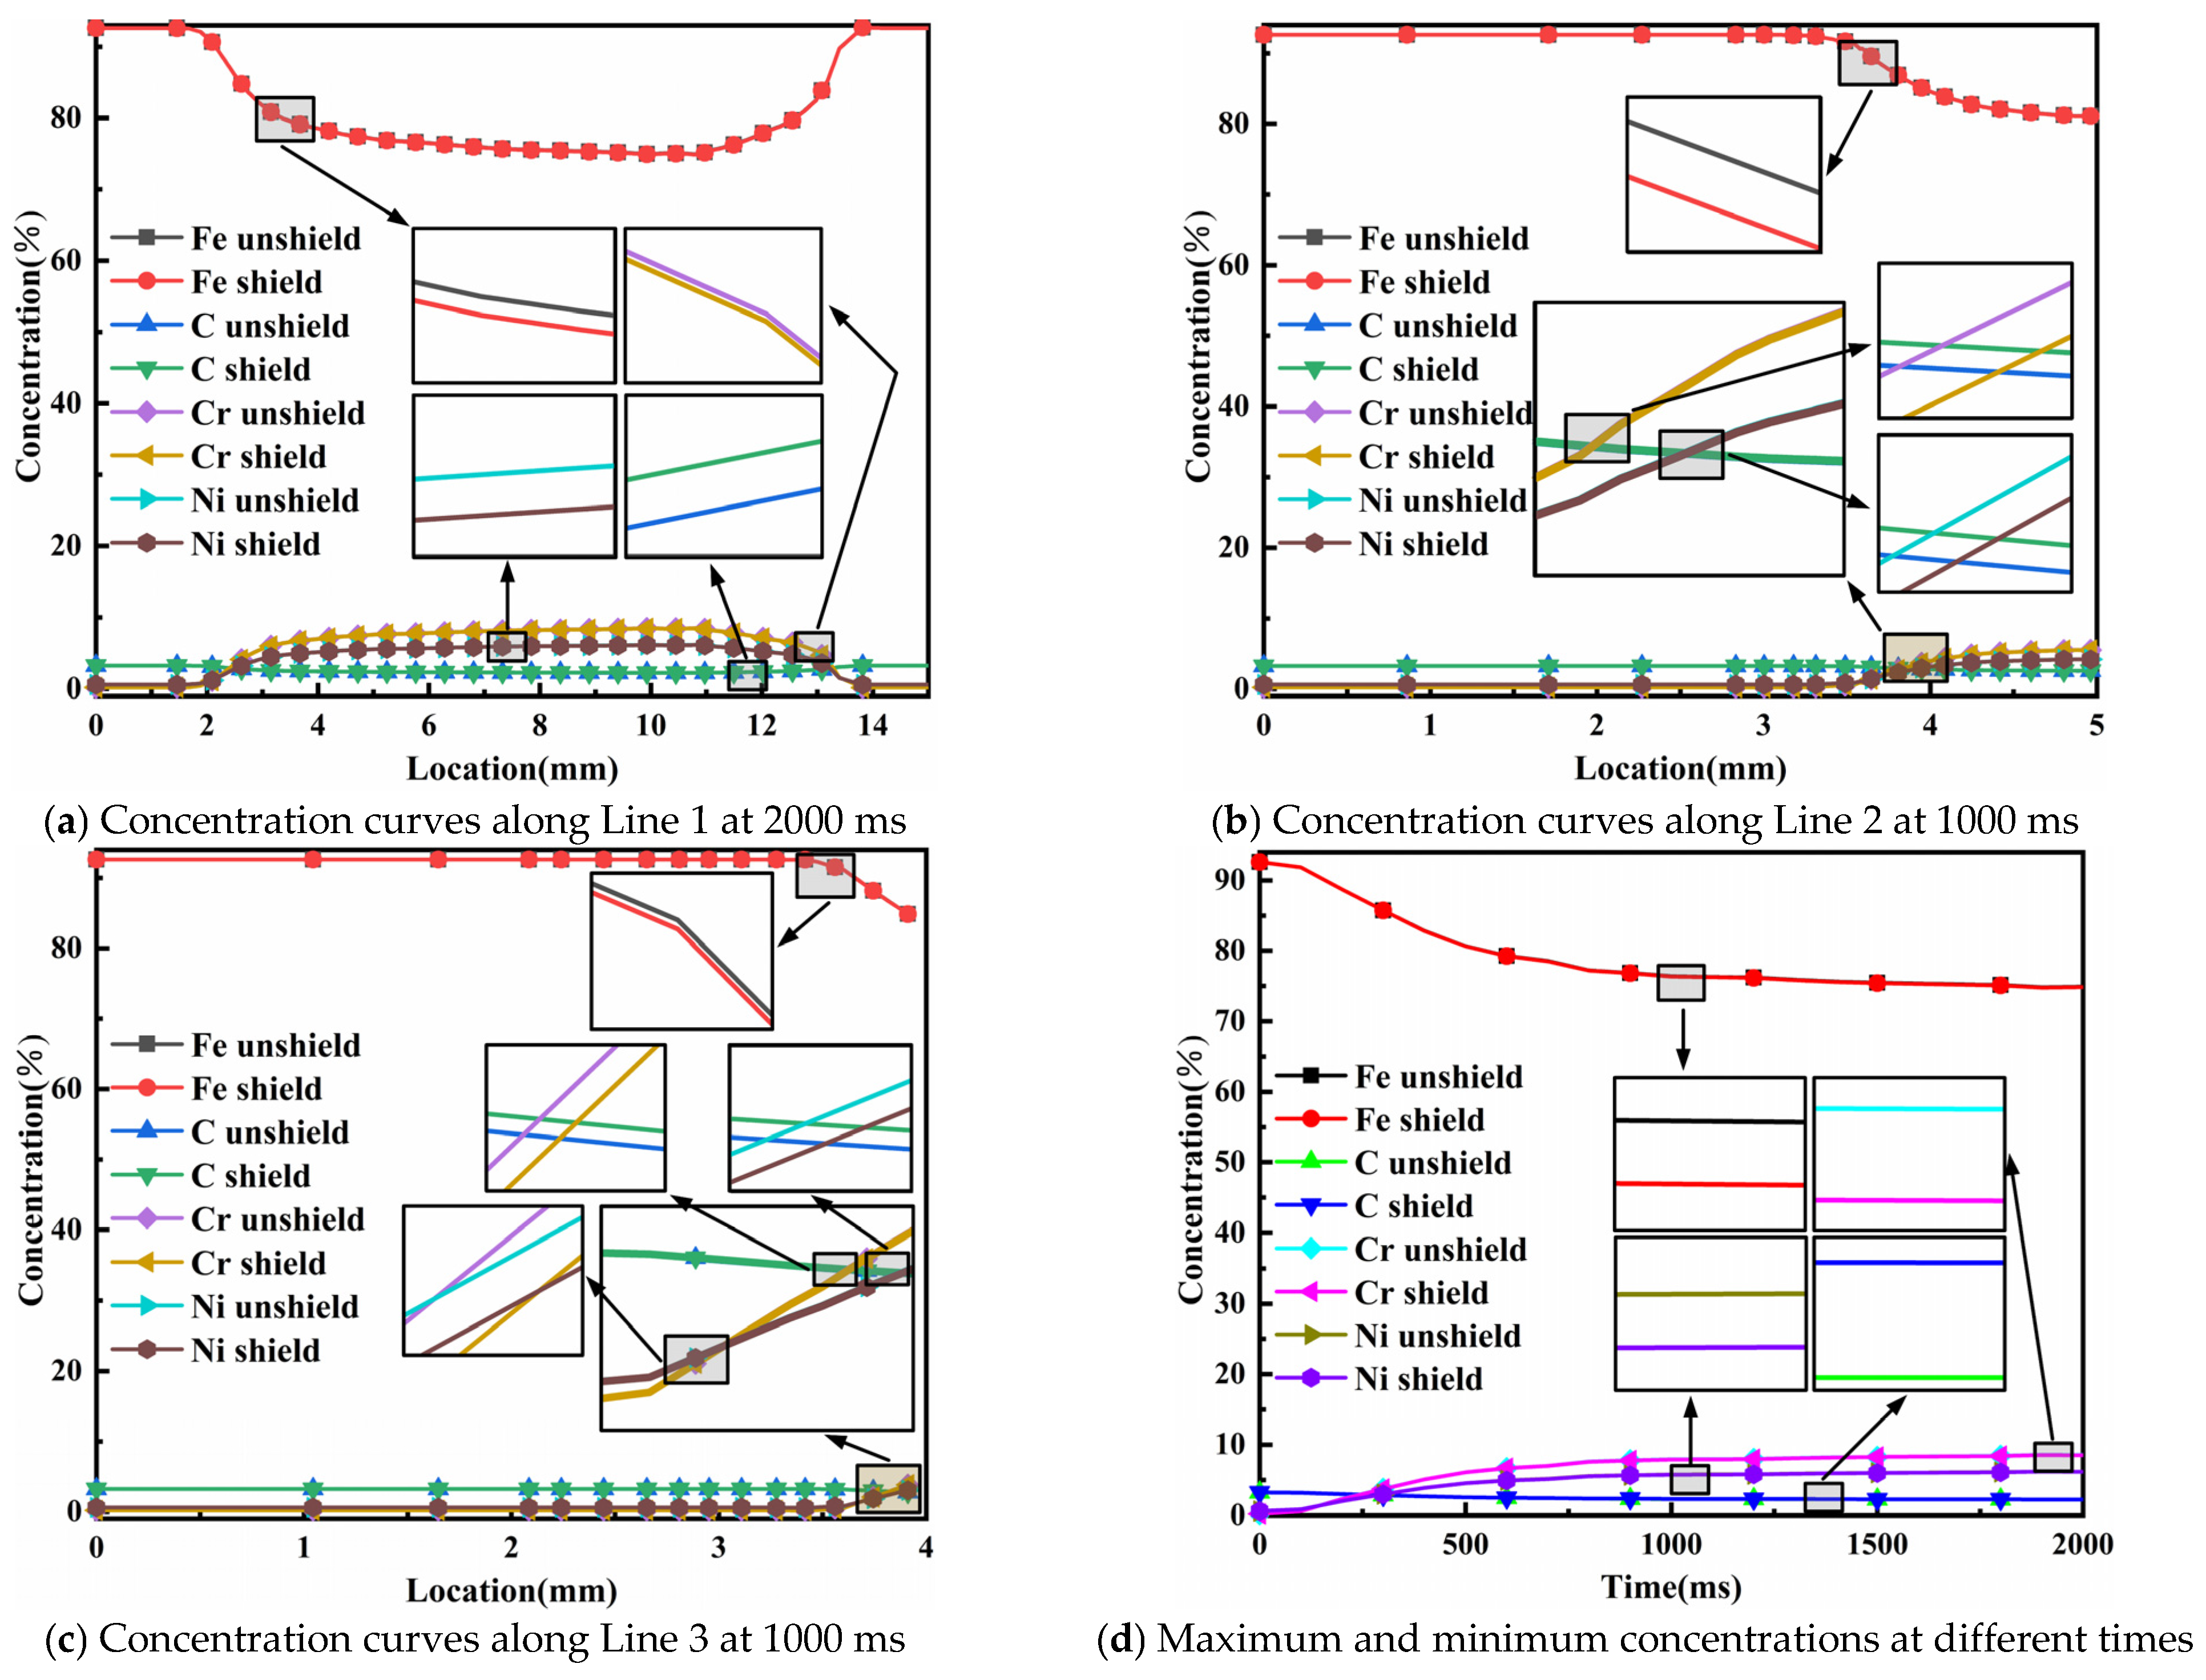
To quantitatively reveal the effect of plasma cloud shielding on the distribution of elements in the molten pool, concentration curves in different directions are extracted, as shown in Figure 12a–c, respectively. The concentrations of Fe and C elements are lowered as close to the center of the molten pool. The concentrations of Cr and Ni elements are raised as close to the center of the molten pool. Compared with the case where plasma cloud shielding is not considered, the concentrations of Fe, Cr, and Ni elements are lower under the condition of considering plasma cloud shielding, while the change trend in the C element concentration is opposite. The maximum values of element concentrations at different times are shown in Figure 12d, where Fe and C elements have the minimum values, and Cr and Ni elements have the maximum values. The results show that the maximum values are divided at 700 ms. Before 700 ms, the amplitude of the change in the maximum values of the concentrations of Fe and C elements (decreasing for Fe and C elements or increasing for Cr and Ni elements) is more obvious. After 700 ms, the maximum value of the concentrations remain basically unchanged. Compared with the calculation results without plasma cloud shielding, the concentrations of Fe, Cr, and Ni elements are slightly lower when plasma cloud shielding is considered, and the concentration of the C element is slightly higher. This is attributed to the fact that evaporation of some Fe, Cr, and Ni elements in the molten pool and their ionization to form plasma, which leads to a decrease in the concentrations of Fe, Cr, and Ni elements in the molten pool. At this power level, the C element does not reach the vaporization temperature, and there is no C element in the vapor. Due to the decrease in the concentrations of Fe, Cr, and Ni elements, the concentration of the C element slightly increases. In summary, when the laser power is 1200 W, a plasma cloud is generated during the laser cladding process. The plasma cloud is mainly formed by the evaporation and ionization of Fe, Cr, and Ni elements in the molten pool.

5. Conclusions

(1) During the laser cladding process, due to the effect of the plasma, the temperature of the molten pool will decrease. At the same time, affected by the expansion process of the plasma, an impact pressure will be generated around the molten pool, resulting in a decrease in the flow velocity of the molten pool. Within a very small range of the molten pool, the flow direction will change.
(2) The temperature and flow velocity of the molten pool are affected by the shielding effect of the plasma cloud; thereby, the concentrations of elements are affected. Due to the effect of metal evaporation, the concentrations of Fe, Cr, and Ni elements in the molten pool are slightly decreased, while the concentration of C is slightly increased. This shows that the plasma cloud is mainly composed of the elements Fe, Cr, and Ni.

Author Contributions

H.S. acquired the grant and revised the paper; Y.S. performed modeling and wrote the paper; N.L., X.W. and M.S. extracted and analyzed the data; L.F. and J.D. checked the grammar. All authors have read and agreed to the published version of the manuscript.

Funding

This work was supported by the Basic Research Project of Research and Development of Low-cost and High-efficiency Detection Technology and Platform for BLDC Motor Rotor Lag Fault: Application Study of Improved Current Signal Analysis Method (LJ212513203005).

Institutional Review Board Statement

Not applicable.

Informed Consent Statement

Not applicable.

Data Availability Statement

The data that supports the findings of this study are available within the article.

Conflicts of Interest

The authors declare no conflict of interest. Author Lei Feng was employed by the company Ansteel Co., Ltd. Ironmaking General Plant. Lei Feng’s contributions to this work and manuscript were made independently without any requirement, guidance or input by Ansteel Co., Ltd. Lei Feng received no financial compensation from any source for the contribution he made to this scientific work and manuscript.

References

  1. Zhao, C.; Yu, Z.; Du, W.; Zhang, Z.; Ma, L.; Zhang, T.; Bai, Y.; Chen, S. Laser Cladding of High-Temperature Alloy: Research Status and Development. Adv. Eng. Mater. 2025, 27, 2402956. [Google Scholar] [CrossRef]
  2. Gao, W.; Feng, M.; Chen, C.; Lian, G. Microstructure evolution, wear resistance and corrosion resistance of CoCrCu0.5FeNiSix high-entropy alloy coatings fabricated by laser cladding. J. Mater. Res. Technol. 2025, 36, 5539–5558. [Google Scholar] [CrossRef]
  3. Mo, K.; Cao, L.; Zhao, D.; Long, Y.; Zhong, J.; Zhong, J.; Bi, G. Study on the microstructure and wear resistance of laser clad martensitic stainless steel 420 with different content of TiC. Mater. Today Commun. 2025, 46, 112615. [Google Scholar] [CrossRef]
  4. Ding, C.; Liu, Y.; Ni, H.; Wang, X.; Wang, H. Effects of laser energy density on microstructure, texture and tribological property of CoCrFeMnNi high entropy alloy coatings fabricated by laser cladding. Surf. Interfaces 2025, 61, 106107. [Google Scholar] [CrossRef]
  5. Khamidullin, B.; Tsivilskiy, I.; Gorunov, A.; Gilmutdinov, A. Modeling of the effect of powder parameters on laser cladding using coaxial nozzle. Surf. Coat. Technol. 2019, 364, 430–443. [Google Scholar] [CrossRef]
  6. Zhang, G.; Feng, A.; Zhao, P.; Pan, X.; Feng, H. Effect of Energy Density on the Microstructure and Wear Resistance of NickelBased WC Coatings by Laser Cladding of Preset Zr702 Alloy Plates. Coatings 2023, 13, 826. [Google Scholar] [CrossRef]
  7. Tan, S.; Wu, J.; Huang, Q.; Zhang, Y.; Du, X. Femtosecond Laser Ablation of Metal Models Based on Biphasic Delay Model. Chin. J. Phys. 2019, 68, 57901. [Google Scholar]
  8. Li, C.; Sun, Y.; Sun, H.; Yu, M.; Han, X. Study on the influence of shielding effect for plasma cloud on multi-field coupling mechanism during laser cladding. Proc. Inst. Mech. Eng. Part C J. Mech. Eng. Sci. 2025, 239, 1953–1976. [Google Scholar] [CrossRef]
  9. Shen, X.; Feng, G.Y.; Jing, S.; Han, J.H.; Li, Y.G.; Liu, K. Damage characteristics of laser plasma shock wave on rear surface of fused silica glass. Chin. Phys. B 2019, 28, 085202. [Google Scholar] [CrossRef]
  10. Ming, X.; Li, X.; Rui, M.; Zhou, X.; Xu, H. Research on the Impact of Plasma Shock Wave Effect of Femtosecond Laser Abrasion on Surface Gear. Appl. Laser 2022, 42, 62–70. [Google Scholar]
  11. Ming, X.; Li, X.; Xu, H.; Chen, G.; Rui, M. Research on the Effect of Plasma Shock Wave on the Morphology of Femtosecond Laser Abraded Gear. Appl. Laser 2023, 43, 68–79. [Google Scholar]
  12. Hu, S. Simulation and Process Parameter Optimization Research on Laser Cleaning of 2219 Aluminum Alloy Coatings. Master’s Thesis, Hebei University of Technology, Tianjin, China, 2022; p. 9. [Google Scholar]
  13. Sun, Y.; Li, C.; Wang, X.; Sun, H.; Li, S.; Han, X. Influencing mechanism of the active elements on the surface tension of the laser cladding molten pool and the determination of the critical concentration. J. Laser Appl. 2025, 37, 012024. [Google Scholar] [CrossRef]
  14. Sun, Y.; Li, C.; Sun, H.; Li, S.; Han, X. Study on the macro-mesoscopic cross-scale influencing mechanism of the active element S on the solidification behavior during laser cladding. Appl. Phys. A 2025, 131, 68. [Google Scholar] [CrossRef]
  15. Marla, D.; Bhandarkar, U.V.; Joshi, S.S. A model of laser ablation with temperature-dependent material properties, vaporization, phase explosion and plasma shielding. Appl. Phys. A 2014, 116, 273–285. [Google Scholar] [CrossRef]
  16. Singh, R.K.; Narayan, J. Pulsed-laser evaporation technique for deposition of thin films: Physics and theoretical model. Phys. Rev. B 1990, 41, 8843. [Google Scholar] [CrossRef]
  17. Chen, F.F. Introduction to Plasma Physics and Controlled Fusion; Plenum Press: New York, NY, USA, 1984. [Google Scholar]
  18. Garrelie, F.; Aubreton, J.; Catherinot, A. Monte Carlo simulation of the laser-induced plasma plume expansion under vacuum: Comparison with experiments. J. Appl. Phys. 1998, 83, 5075–5082. [Google Scholar] [CrossRef]
  19. Sun, Y.; Li, C.; Liu, J.; Sun, H.; Li, S.; Han, X. Optimization of pulse laser cladding process parameters and analysis of heat and mass transfer and phase transformation based on GA-BP neural network. Appl. Phys. A 2025, 131, 306. [Google Scholar] [CrossRef]
  20. Gao, J.; Wu, C.; Hao, Y.; Xu, X.; Guo, L. Numerical simulation and experimental investigation on three-dimensional modelling of single-track geometry and temperature evolution by laser cladding. Opt. Laser Technol. 2020, 129, 106287. [Google Scholar] [CrossRef]
  21. Bennon, W.D.; Incropera, F.P. A continuum model for momentum, heat and species transport in binary solid-liquid phase change systems—I. Model formulation. Int. J. Heat Mass Transf. 1987, 30, 2161–2170. [Google Scholar] [CrossRef]
  22. Gan, Z.; Yu, G.; He, X.; Li, S. Numerical simulation of thermal behavior and multicomponent mass transfer in direct laser deposition of Co-base alloy on steel. Int. J. Heat Mass Transf. 2017, 104, 28–38. [Google Scholar] [CrossRef]
  23. Li, C.; Sun, Y.; Sun, H.; Yu, M.; Han, X.; Li, S.; Feng, L. Study on the mechanism of heat and mass transfer behavior during multiple passes and multiple layers pulsed Laser cladding regarding the overlap ratio. Proc. Inst. Mech. Eng. Part L J. Mater. Des. Appl. 2024, 14644207251346735. [Google Scholar] [CrossRef]
  24. Li, C.; Zhao, J.; Chen, X.; Han, X. Quantitative evaluation method for the impact parameters during the process of pulsed laser cladding of Fe60. Appl. Phys. A 2023, 129, 93. [Google Scholar] [CrossRef]
  25. Yi, X.; Liu, D.; Liang, Z.; Zhang, J.; Zhang, J.; Luo, W. Microstructure and Properties of Laser Cladding Fe60 Alloy Layer on Stainless Steel. Heat Treat. 2017, 32, 25–29. [Google Scholar]
  26. Toyserkani, E.; Khajepour, A.; Corbin, S. 3-D finite element modeling of laser cladding by powder injection: Effects of laser pulse shaping on the process. Opt. Lasers Eng. 2004, 41, 849–867. [Google Scholar] [CrossRef]
  27. Gan, Z. Research on Thermal and Mass Transport in Laser Additive Manufacturing of High-Temperature Alloys. Ph.D. Thesis, University of Chinese Academy of Sciences, Beijing, China, 2017; pp. 37–49. [Google Scholar]
  28. Chemin, A.; Fawaz, M.W.; Amans, D. Investigation of the blast pressure following laser ablation at a solid–fluid interface using shock waves dynamics in air and in water. Appl. Surf. Sci. 2022, 574, 151592. [Google Scholar] [CrossRef]
  29. Liu, T.; Wu, Y.; Feng, C. Experimental Study on the Degree of Metal Material Damage Based on Acoustic Emission Signals. Equip. Manag. Maint. 2021, 25, 133–134. [Google Scholar]
  30. Wang, D. Research on the Electron Beam Evaporation Characteristics of Metals and Alloys. Master’s Thesis, Beijing Nonferrous Metals Research Institute, Beijing, China, 2021; pp. 12–42. [Google Scholar]
  31. Alder, B.J.; Wainwright, T.E. Phase transition for a hard sphere system. J. Chem. Phys. 1957, 27, 1208–1209. [Google Scholar] [CrossRef]
Figure 1. Schematic of laser cladding with different powder feeding methods.
Coatings 15 00991 g001
Figure 2. Geometric modeling and meshing.
Coatings 15 00991 g002
Figure 3. Schematic of information collection line for multi-field coupled numerical model.
Coatings 15 00991 g003
Figure 4. The cloud images of temperature distribution with and without plasma cloud shielding effect at different times.
Coatings 15 00991 g004
Figure 5. Schematic of temperature collection lines of the molten pool.
Coatings 15 00991 g005
Figure 6. Temperature distribution curves with and without plasma cloud shielding.
Coatings 15 00991 g006
Figure 7. Flow velocity of the molten pool with and without plasma cloud shielding at different times.
Coatings 15 00991 g007aCoatings 15 00991 g007b
Figure 8. The distribution curve of flow velocity with and without plasma cloud shielding.
Coatings 15 00991 g008aCoatings 15 00991 g008b
Figure 9. Comparison of flow direction in the center of the molten pool with and without plasma cloud shielding.
Coatings 15 00991 g009
Figure 10. Curve of element concentration distribution.
Coatings 15 00991 g010
Figure 11. Cloud images of element concentration distribution with and without plasma cloud shielding at 1000 ms.
Coatings 15 00991 g011
Figure 12. Concentration curves of Fe, C, Cr, and Ni Elements under conditions with and without the plasma cloud shielding.
Coatings 15 00991 g012
Table 1. Composition and content of ASTM 1045 (wt%).
ElementNiMoCrMnSiCPFe
Content0.60.20.20.352.733.250.05Bal.
Table 2. Composition and content of Fe60 (wt%).
ElementCrNiSiBCFe
Content181224.21.2Bal.
Table 3. Composition and content of Fe60 (wt%) [31].
ABCD
Fe6.347−19,57400
Cr5.849−16,41500
Ni6.666−20,76500
Disclaimer/Publisher’s Note: The statements, opinions and data contained in all publications are solely those of the individual author(s) and contributor(s) and not of MDPI and/or the editor(s). MDPI and/or the editor(s) disclaim responsibility for any injury to people or property resulting from any ideas, methods, instructions or products referred to in the content.