Article

Formation of Black Coatings on AA7075 and AA6061 by Low-Voltage Plasma Electrolytic Oxidation for Use as Flat Solar Absorbers in the Aerospace

1
Department of Industrial Engineering, University of Padova, Via Marzolo 9, 35131 Padova, Italy
2
Institute of Condensed Matter Chemistry and Technologies for Energy, National Research Council of Italy, C.So Stati Uniti 4, 35127 Padova, Italy
*
Author to whom correspondence should be addressed.
Coatings 2025, 15(9), 989; https://doi.org/10.3390/coatings15090989
Submission received: 18 July 2025 / Revised: 19 August 2025 / Accepted: 20 August 2025 / Published: 25 August 2025
(This article belongs to the Section Plasma Coatings, Surfaces & Interfaces)

Abstract

In this work, a unique approach was used to synthesise black coatings on aluminium alloys (AA) 6061 and 7075 for applications in the aerospace field. In detail, plasma electrolytic oxidation (PEO) technology was used, maintaining the voltage constant at a relatively low value (Vmax ≤ 292 V) during the process. NaVO3 additive was used in the silicate-based electrolyte to obtain a black colour. The coatings were characterised by SEM-EDS, XPS, XRD, VIS-NIR spectroscopy, and EIS. The presence of vanadium oxides in the PEO coatings was detected by EDS, XPS, and XRD analyses. PEO coatings on AA7075 produced with 10 g/L of NaVO3 exhibited exceptional optical characteristics, with a solar absorptance value of 95.3% in the VIS-NIR spectrum (wavelength range of 400–2000 nm). All the coatings improved the corrosion performances of the tested AA6061 and AA7075 by two or three orders of magnitude in 3.5 wt. % aqueous NaCl. Moreover, there was no sign of delamination, cracks, or any visible changes on coatings after thermal shock, performed by cycling samples between two extreme temperatures, −196 °C and 150 °C, respectively.

Graphical Abstract

1. Introduction

During the last three decades, plasma electrolytic oxidation (PEO) has been the subject of intense research as an advanced surface treatment [1,2]. PEO is considered a potential replacement for traditional anodisation, primarily because it is a more environmentally friendly process that does not require toxic and environmentally harmful chemicals. The process takes place under relatively mild electrolytic conditions, reducing the negative impact on the environment [3,4,5,6,7].
The key advantage of PEO over conventional anodisation lies in the simplicity, considering that only one technological step is needed, with the possibility of producing corrosion-resistant and wear-resistant coatings [8,9,10].
However, the actual drawbacks of the PEO technology, despite its benefits, are high electrical parameters, i.e., high cell voltage and current densities [11,12], which lead to significant energy consumption [13,14,15] and can limit industrial applications [16].
Oxide ceramic coatings obtained by PEO have prominent application potential in the aerospace industry, particularly with a blackish appearance [17,18]. The spacecraft temperature can be passively regulated by the thermo-optical properties of suitable surfaces [19]. In general, there are four types of surfaces used for spacecraft applications: flat absorbers (high α S and high ε I R ), solar absorbers (high α S and low ε I R ), flat reflectors (low α S and low ε I R ), and solar reflectors (low α S and high ε I R ), respectively [20]. α S stands for solar absorptance, and it is a parameter connected to the wavelength range of 400–2000 nm, while ε I R stands for thermal emittance, a parameter connected to the infrared region of the spectra in the wavelength range from 2 to 50 µm [17].
Black coatings, characterised by high thermo-optical properties (high α S and high ε I R ), are often used for the structures of astronomical payloads or applied to the internal components of spacecraft [21,22,23,24,25].
PEO coatings of this type can be produced by careful choice of the electrolyte, usually phosphate or silicate base solutions with additives like W O 4 2 , V O 3 , and M o O 4 2 and anions or transition metal cations such as F e 2 + , C u 2 + , C o 2 + , and Z r 4 + [26,27,28,29]. The type of electrolyte and additives play a crucial role due to their contribution to electrochemical reactions that are actively involved in the synthesis and resulting properties of oxide PEO coatings [30,31,32].
A survey of published articles, in Table 1, reveals the most relevant works on black PEO coatings on AA, 6061 and 7075. All PEO coatings in these studies were produced with a cell voltage greater than 400 V, regardless composition of the base electrolyte or the additives used. High voltage requirements negatively affect their suitability for industrial applications.
This research demonstrates the possibility of synthesising flat absorber surfaces on two AA, 6061 and 7075, by fixing the cell voltage at a relatively low value of only 292 V throughout the PEO process. The obtained PEO coatings were characterised in detail in terms of morphology, chemical composition, optical properties, thermal shock stability, and electrochemical performance.

2. Materials and Methods

2.1. PEO Experimental Condition

Substrate samples were prepared using two AA, 6061 and 7075 (for nominal chemical composition see Table 2). Substrate dimensions were 4 × 1.6 × 0.3 cm. Before plasma electrolytic oxidation (PEO) treatment, the samples were polished with silicon carbide (SiC) sandpapers, following the ISO/FEPA grit designations P120, P320, P500, and P800. After polishing, samples were cleaned in ethanol using an ultrasonic bath and dried with compressed air. The PEO process was carried out using a power supply (315 V/8.4 A, TDK-Lambda Corporation, Tokyo, Japan)and a waveform generator (DG812, RIGOL Technologies, Beijing, China), at direct current (DC) and unipolar pulsed current mode. Samples were anode, while a carbon steel cage served as the cathode. Voltage variations during the PEO process were recorded using a oscilloscope (DS1104 Z Plus, RIGOL Technologies, Beijing, China). The temperature of the electrolyte was maintained at 20 °C using a thermostatic bath. Following the PEO treatment, the samples were rinsed with distilled water and dried with compressed air. In more detail, electrolyte composition and PEO process parameters are shown in Table 3. In all cases, the maximum cell voltage value was fixed at 292 V.

2.2. PEO Coatings Morphology, Phase, and Chemical Characterisation

A scanning electron microscope (SEM) (Stereoscan 440p, Cambridge Instruments, Cambridge, UK) equipped with a energy-dispersive X-ray spectrometer (EDS) (PV9800, Philips, Almelo, The Netherlands) has been used to characterise morphological and chemical characteristics of the PEO coatings. SEM analysis was conducted on both the surface and cross-sections of the coatings. The procedure to prepare sample cross-sections was as follows: samples were cut using a silicon carbide (SiC) disk, embedded in epoxy resin, and ground with abrasive papers up to P4000 grit. Final polishing was performed using polishing cloths and diamond suspensions with particle sizes of 6 μm, 3 μm, and 1 μm.
The phases present in the PEO layer were identified using X-ray diffraction (XRD). Analysis was performed with a diffractometer (D8 Advance, Bruker AXS, Karlsruhe, Germany) equipped with a Ni-filtered Cu-Kα radiation source (λ = 0.15405 nm), operated at 40 kV and 40 mA. In detail, the diffraction patterns were recorded over a 2 θ range of 10–90°, with a step size of 0.05° and a counting time of 1 s per step. Phase identification was conducted using High Score Plus software (Version 5.3.0).
The X-ray photoelectron (XPS) investigations were performed using a instrument (EnviroESCA, SPECS Surface Nano Analysis GmbH, Berlin, Germany) using an AlKα excitation source (hυ = 1486.6 eV), working at an operating pressure of ca. 10 6 mbar. Survey spectra were acquired in the binding energy (BE) range between 0 and 1100 eV, collecting data at 100 eV pass energy, 1.0 eV∙ s t e p 1 , and 0.1 s∙ s t e p 1 . High resolution scans were acquired at 40 eV pass energy, 0.1 eV∙ s t e p 1 , and 0.2 s∙ s t e p 1 . XPS curves (BE uncertainty = ±0.2 eV) were fitted using the Keystone software (Version 4.114.1) of Specs and applying a Shirley-type background function [35]. The sensitivity factors of integrated peak areas used for atomic percentages (at. %) quantification were supplied by Specs. XPS is performed without additional surface cleaning before measurement.

2.3. Evaluation of Solar Absorptance ( α S )

The thermo-optical properties of the samples were analysed using a UV-VIS-NIR spectrophotometer (V-770, JASCO Corporation, Tokyo, Japan) equipped with an integrating sphere operating in the 300–2000 nm range. The acquisition interval was set to 2 nm, with a continuous scan mode and a scanning speed of 400 nm/min. Calculation of the solar absorptance was conducted through the following formula:
α S = 300   nm 2000   nm I sol ( λ ) ( 1 R ( λ ) ) d λ 300   nm 2000   nm I sol ( λ ) d λ
where I s o l (λ) represents the solar spectrum, R(λ) means the reflection of the sample at a given wavelength of λ [36,37,38].

2.4. Thermal Shock Evaluation

To assess the adhesion between the substrate and the PEO coatings after exposure to extreme environmental conditions, thermal shock tests were performed. The samples used in thermal shock tests were rectangular, approximately 40 mm × 16 mm × 3 mm, with coatings applied to a 10 mm × 10 mm × 3 mm area on one part, and a mass of the sample of around 2.5 g. The samples were alternately transferred between a Dewar containing liquid nitrogen at −196 °C and an oven (P300 Controller, Nabertherm GmbH, Lilienthal/Bremen, Germany) set at 150 °C. The test consisted of 20 cycles, with all samples being exposed to the liquid nitrogen and oven for 30 s each time. After the test, the sample’s surfaces were inspected visually and examined using a stereo microscope.

2.5. Corrosion Resistance Evaluation

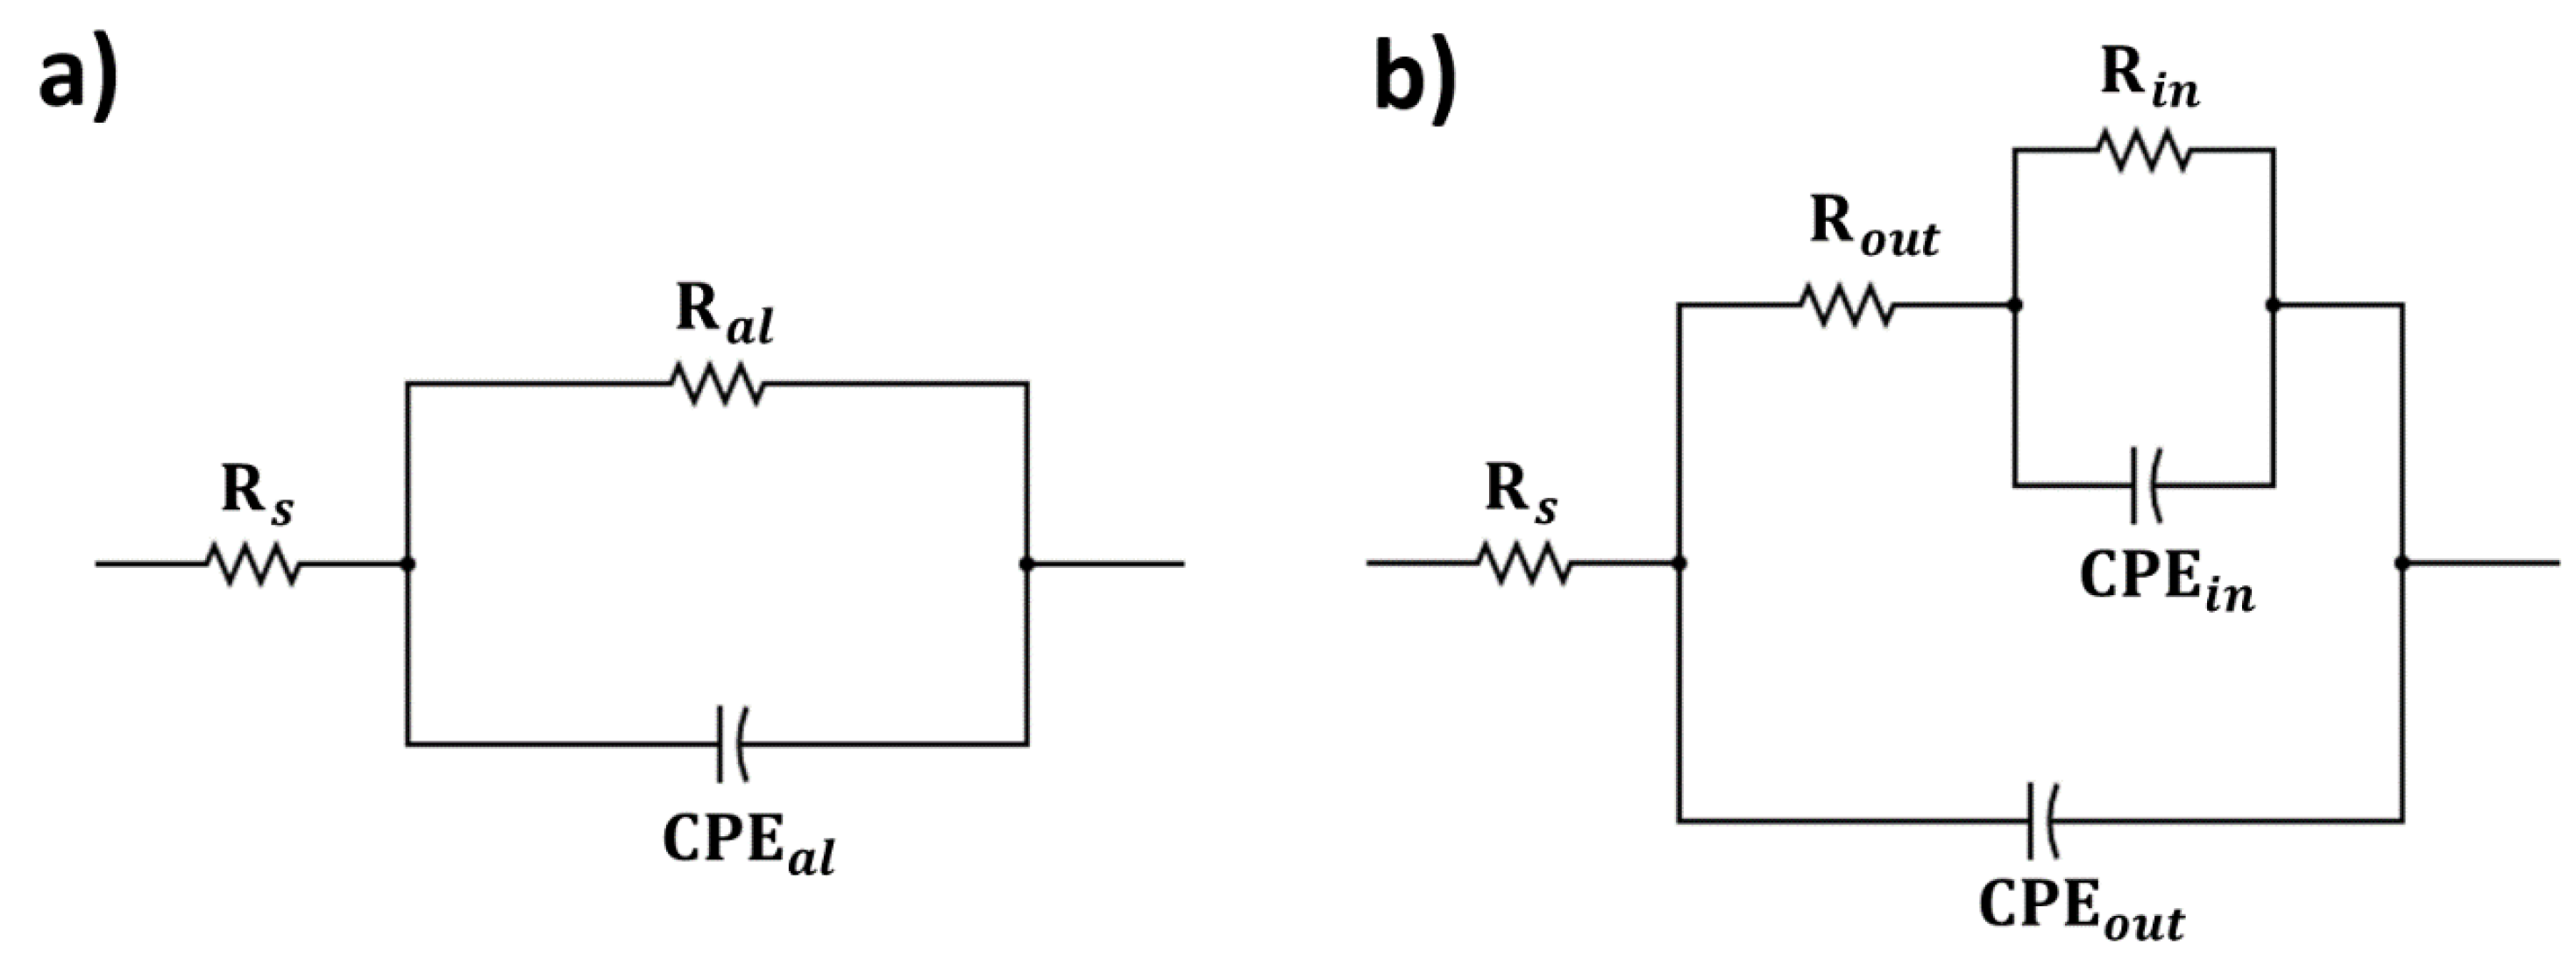
Corrosion performances of PEO coatings were evaluated by electrochemical impedance spectroscopy (EIS) test. A mildly aggressive solution containing 0.1 M Na2SO4 and 0.05 M NaCl has been used to simulate a corrosive environment. EIS measurements were performed on both uncoated and coated samples. A potentiostat (Interface 1010E, Gamry Instruments, Warminster, PA, USA) and electrochemical cell with three electrodes set up have been used. Saturated calomel electrode (SCE) worked as a reference electrode, platinum as a counter electrode, and analysed samples as a working electrode. EIS tests were performed after stabilisation at open circuit potential (OCP) for 30 min. A frequency range of 105 Hz to 10−2 Hz, with 10 frequency points per logarithmic decade and a perturbation amplitude of 10 mV, was applied. Impedance data were analysed and fitted using two equivalent electrical circuits (EEC) and Gamry Echem Analyst software (version 7.9.0.11572).

3. Results and Discussion

3.1. PEO Process—Cell Voltage

Two PEO electrical modes were utilised to prepare PEO coatings in this work: direct current (DC) and unipolar pulsed mode, respectively. The PEO coatings used for comparison purposes, with no additive added in the electrolyte, labelled with “AA6061 base” and “AA7075 base”, were produced by DC mode, with a cell voltage whose maximum value was fixed at 292 V. Without additives in the electrolyte, no coating was achieved using the pulsed mode. PEO coatings with vanadium additive in two different concentrations, 5 g/L and 10 g/L, were produced by unipolar pulsed mode, with a maximum cell voltage of 292 V.
Figure 1 shows the voltage waveform applied to the system at 500 Hz and a duty cycle of 50%, recorded with the oscilloscope during the unipolar pulsed PEO process mode. It is generally considered that PEO usually occurs during the positive voltage pulse, with the lifetime of the discharges in milliseconds [23]. From the presented waveform, it is visible that the lifetime of the positive electrical pulse in our system is 1 millisecond under the applied electrical parameters of 500 Hz and 50% duty cycle. It took only a few milliseconds for the PEO system to reach this waveform, and it remained constant over all 8 min of the PEO process, with a maximum cell voltage of 292 V. When compared to the data from the literature about the cell voltage during the PEO process, generally it involves much higher voltage, exceeding 400 V [16,39,40]. Therefore, this relatively low voltage mode represents a unique approach in the PEO coatings synthesis.

3.2. PEO Coatings Morphology, Chemical, and Phase Evaluation

The surface morphologies of the PEO coatings with and without additives, on both AA6061 and AA7075, are presented on the SEM images in Figure 2. The characteristic porous morphology is visible, with the pore size that differs depending on the sample and PEO electrical conditions. When DC mode is used, for the base samples, pores are larger, with the diameter of the pore going up to 50 µm. In the case of the samples with additive and pulsed PEO mode, pores are smaller, more homogenous, and better distributed. These differences among the coatings produced with different PEO electrical conditions are in agreement with the data from the literature, where it is reported that discharge phenomena can be better controlled by applying pulsed PEO electrical mode, which affects pore size and distribution on the coating [41]. In general, the mechanism of pore formation during the PEO process involves the flow of current through dielectric breakdown sites. This process promotes the localised melting of the substrate and existing oxides and their re-solidification around the pores of discharge sites on the coating or substrate surface [42].
Cross-sections of the prepared PEO coatings, presented in the left part of Figure 3, provide information on the coating homogeneity, adherence to the substrate, and thickness. The average coating thickness values were calculated from the SEM cross-section images and are reported in Table 4. There is significant variation in the thickness among the coatings depending on the substrate alloy, PEO electrical regime, and electrolyte composition. Base coatings, produced at DC mode, exhibit significantly thicker coatings when compared to the coatings produced with the pulsed mode, with the base coating on AA7075 that is more than twice as thick as the base coating on AA6061. A reason for the significant variation in thickness between two different base samples could be a higher oxidation status for AA7075 compounds with respect to AA6061 samples. This theory is confirmed later by XPS and XRD results. The thickness between base samples and those with additives cannot be compared since they are produced with different process times. Generally, it is considered that time has a beneficial influence on coating thickness; thicker coatings can be produced by increasing the PEO process time [43]. All the coatings, regardless of the PEO electric mode or the presence of the additive, are generally compact, with some variation in porosity. PEO coatings typically consist of two layers: a dense barrier layer that adheres tightly to the substrate and a porous outer layer [44]. The barrier layer is often difficult to detect in SEM images as it is a few nm thick, whereas the outer porous layer is clearly visible. However, the barrier layer is identified through impedance measurements and plays a crucial role in the corrosion resistance of PEO coatings.
SEM-EDS analysis was performed on the cross-section coatings, and the results are presented in Figure 3 and Table 5. All PEO coatings primarily consist of O, Si, and Al, which is expected given the use of a silicate-based electrolyte and aluminium as the substrate material. Small amounts of Na were detected, and its presence is connected with the used chemicals in the base electrolyte (see Table 3). Additionally, the presence of Mg was observed. A potential explanation for its detection could be in the oxidation of alloying Mg from AA6061 and AA7075 (see Table 2). The appearance of Mg was further validated by XPS and XRD analysis. Successful V incorporation is confirmed with the V detection in V-doped PEO coatings, proving their black appearance.
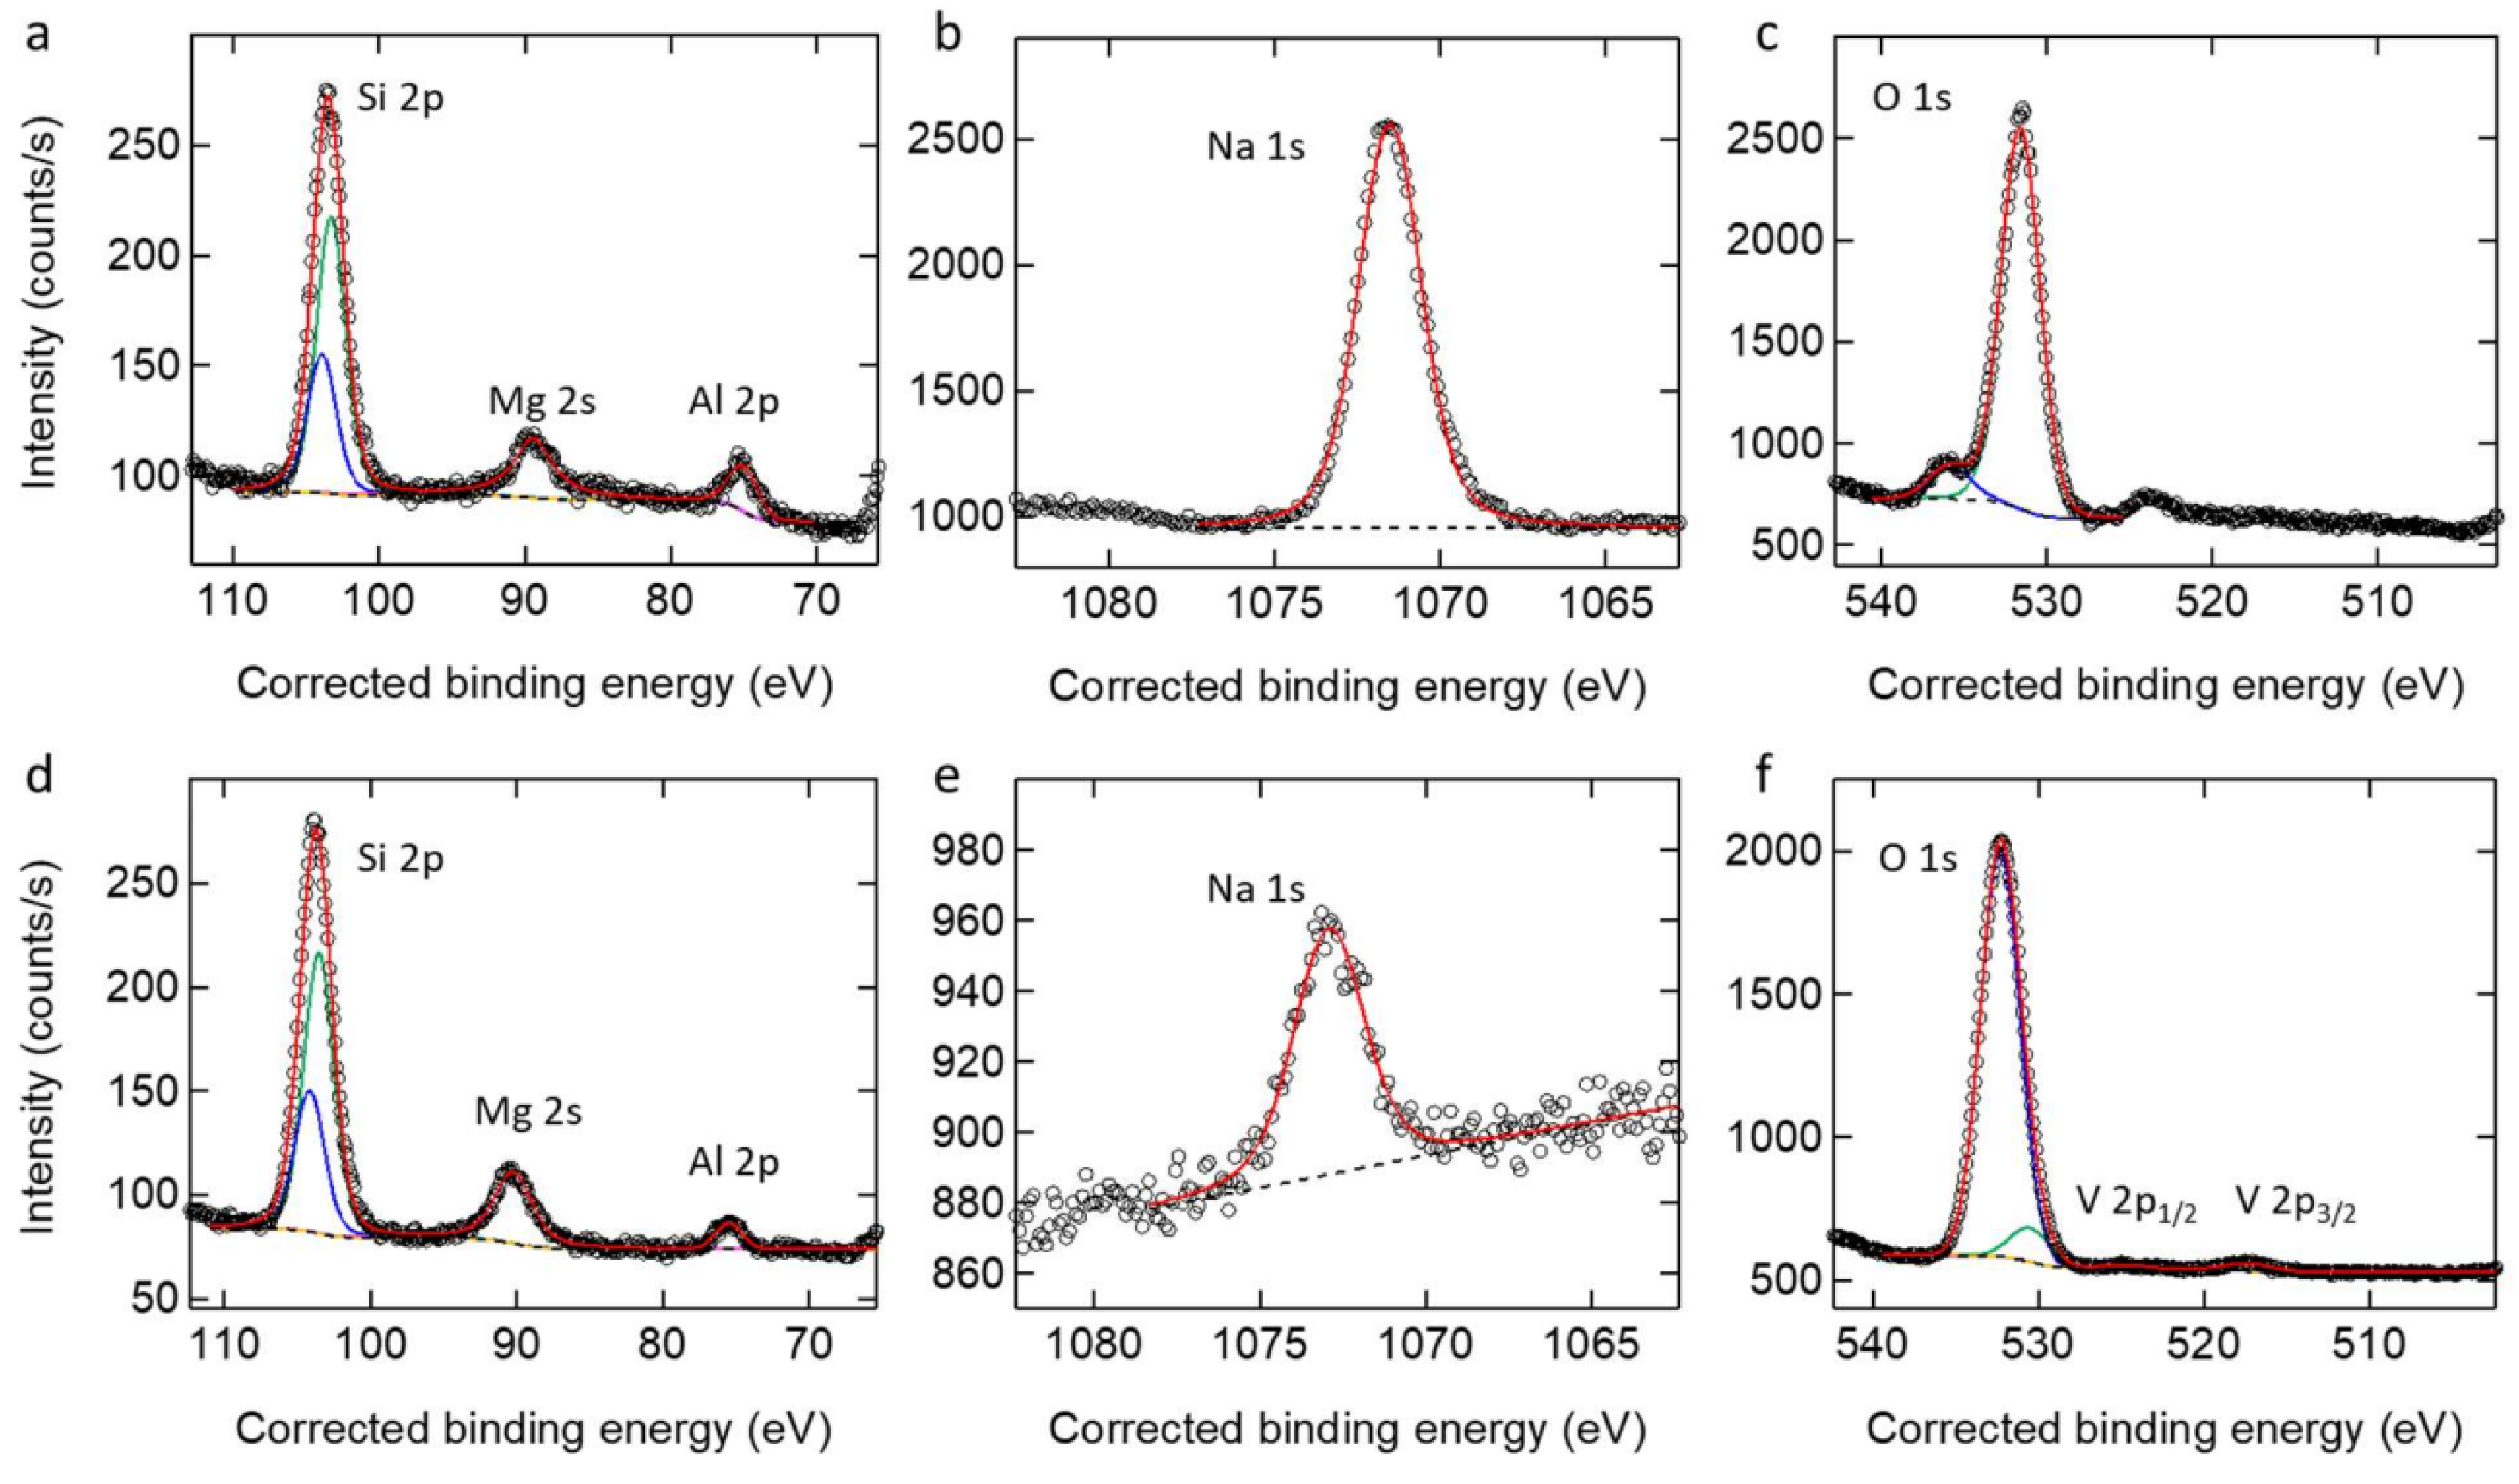
XPS analysis performed on the samples AA6061_base, AA6061_10V, AA7075_base, and AA7075_10V revealed the presence of C, O, Al, Na, Si, Mg, and V on their surface (see Figure 4 and Table 6). The surface of the investigated samples is mainly composed of oxygen. In particular, “base” samples reveal a lower amount of oxygen with respect to the corresponding “10V” samples. In addition, the surface of AA6061 samples is richer in oxygen with respect to AA7075 samples. Quantitatively, the oxygen atomic percentage rises in the order AA7075_base < AA6061_base < AA7075_10V < AA6061_10V, reaching values of 55.42, 63.97, 69.46, and 71.63 at. %, respectively.
A moderately high concentration of sodium is detected in “base” samples, showing a value of 10.18 and 27.07 at.% for AA6061_base and AA7075_base, respectively. In samples with vanadium additive, these values decrease to ca. 2 at.%. Apart from Na for AA7075_base, silicon is the most abundant metal on the surface of the samples, which appears to increase in samples with the additive. In particular, Si at.% rises from 16.82 to 18.09 in AA6061, and from 10.91 to 18.43 in AA7075. Aluminium atomic percentage decreases in the order AA6061_base > AA6061_10V > AA7075_base > AA7075_10V, reaching values of 3.52, 1.83, 1.60, and 1.30 at.%, respectively. Magnesium shows a concentration of ca. 5 at.% for all the samples apart from AA7075_10V, where a value of 8.14 at.% is determined. Finally, a low amount of vanadium is detected on the surface of PEO samples with vanadium additive: 1.31 and 0.60 at.% for AA6061_10V and AA7075_10V, respectively. For all the samples, the Si 2p feature appears as an asymmetrical peak, due to the presence of the 2p3/2 and 2p1/2 contributions resulting from the spin–orbit splitting (see Figure 5a,d and Figure 6a,d). In AA6061 samples, the Si 2p3/2 peak is observed at ca. 102.7 eV, which is attributed to Si(IV) atoms in aluminium silicate compounds [45]. For AA7075 samples, this peak shifts towards higher binding energy (BE), ca. 103.5 eV. This position is similar to that observed in S i O 2 [46]. This evidence is an index of a more oxidised status for AA7075 with respect to AA6061 samples. Mg 2s is peaking at ca. 89.3 eV (see Figure 5a,d and Figure 6a,d), which is typical of M g 2 + ions into metal oxide materials [47]. The low intensity of the Al 2p peak and the small spin–orbit splitting for this feature do not allow us to distinguish the 2p3/2 and 2p1/2 components (see Figure 5a,d and Figure 6a,d). Thus, a single peak is observed, centred at ca. 74.9 eV and attributed to aluminium in aluminosilicate compounds [48]. The position of the Na 1s peak is higher for “10V” samples with respect to “base” materials (see Figure 5b,e and Figure 6b,e), showing a value of ca. 1072.6 and 1071.6 eV, respectively. In both cases, sodium is present as N a + [49,50], even though a higher oxidised character is expected for “10V” samples. At high Na concentration (i.e., “base” samples), the Na KLL Auger peaks are observed at ca. 536 eV overlapping with the O 1s features (see Figure 5c,f and Figure 6c,f). The “base” samples show the presence of a single O 1s peak at ca. 531.7 eV (see Figure 5c,f and Figure 6c,f), typical of oxygen atoms in aluminosilicate materials [51]. Interestingly, this peak shifts towards higher BEs in “10V” samples, reaching a value of 532.3 eV (higher degree of oxidation). In addition, a second peak appears at ca. 530.6 eV, which is attributed to the presence of metal oxides, such as vanadium oxide [52]. Indeed, for these latter samples, AA6061_10V and AA7075_10V, two new peaks appear at ca. 517.3 and 524.5 eV, respectively. These peaks are assigned to the V 2p3/2 and 2p1/2 features of vanadium (V) oxide ( V 2 O 5 ) [53,54,55].
To further validate the EDS and XPS results, phase analysis of the PEO coatings was conducted by X-ray diffraction (XRD) analysis, with results presented in Figure 7a for the coatings on AA6061 and Figure 7b for the coatings on AA7075. The phase composition of the PEO coatings varies depending on the PEO process and electrolyte conditions. For comparison, the XRD patterns of the uncoated alloys (substrates), AA6061 and AA7075, are included. Substrate peaks are visible in XRD patterns of additive-containing coatings produced by the pulsed mode, but are absent for base coatings produced under DC mode. This likely reflects thickness effects: the base coatings are thicker, whereas the additive-containing coatings are thinner and more porous, allowing X-rays to penetrate and register the substrate. In all PEO-coated samples, sharp peaks of MgO are present, corresponding to cubic MgO (PDF 96-900-8672). The presence of Mg in all PEO coatings, base, and with an additive, was confirmed by both EDS and XPS analyses. Since Mg was neither present in the PEO electrolyte nor added as an additive, its incorporation is attributed to the Mg oxidation from the aluminium alloys, which contain a certain amount of Mg. In the AA6061_base sample, only MgO was detected, indicating that aluminium and silicate oxides are likely present in the amorphous phase. In all the other samples, apart from the sample AA6061_5V, the diffraction peaks of cubic γ A l 2 O 3 (PDF 96-101-0462) and tetragonal S i O 2 (PDF 96-412-4082) were detected. γ A l 2 O 3 comes from the substrate oxidation, while the S i O 2 phase is coming from the electrolyte used to produce PEO coatings. In the sample AA6061_5V, only peaks of γ A l 2 O 3 are present, suggesting that S i O 2 is probably part of the amorphous phase. Diffraction peaks attributed to vanadium compounds were not observed in the XRD patterns of additive-containing coatings, indicating their amorphous nature. This interpretation is consistent with prior studies on PEO coatings formed in silicate-based electrolytes, which likewise reported vanadium compounds to be deposited as amorphous in the PEO coatings [27,28].

3.3. Optical Properties of the Coatings

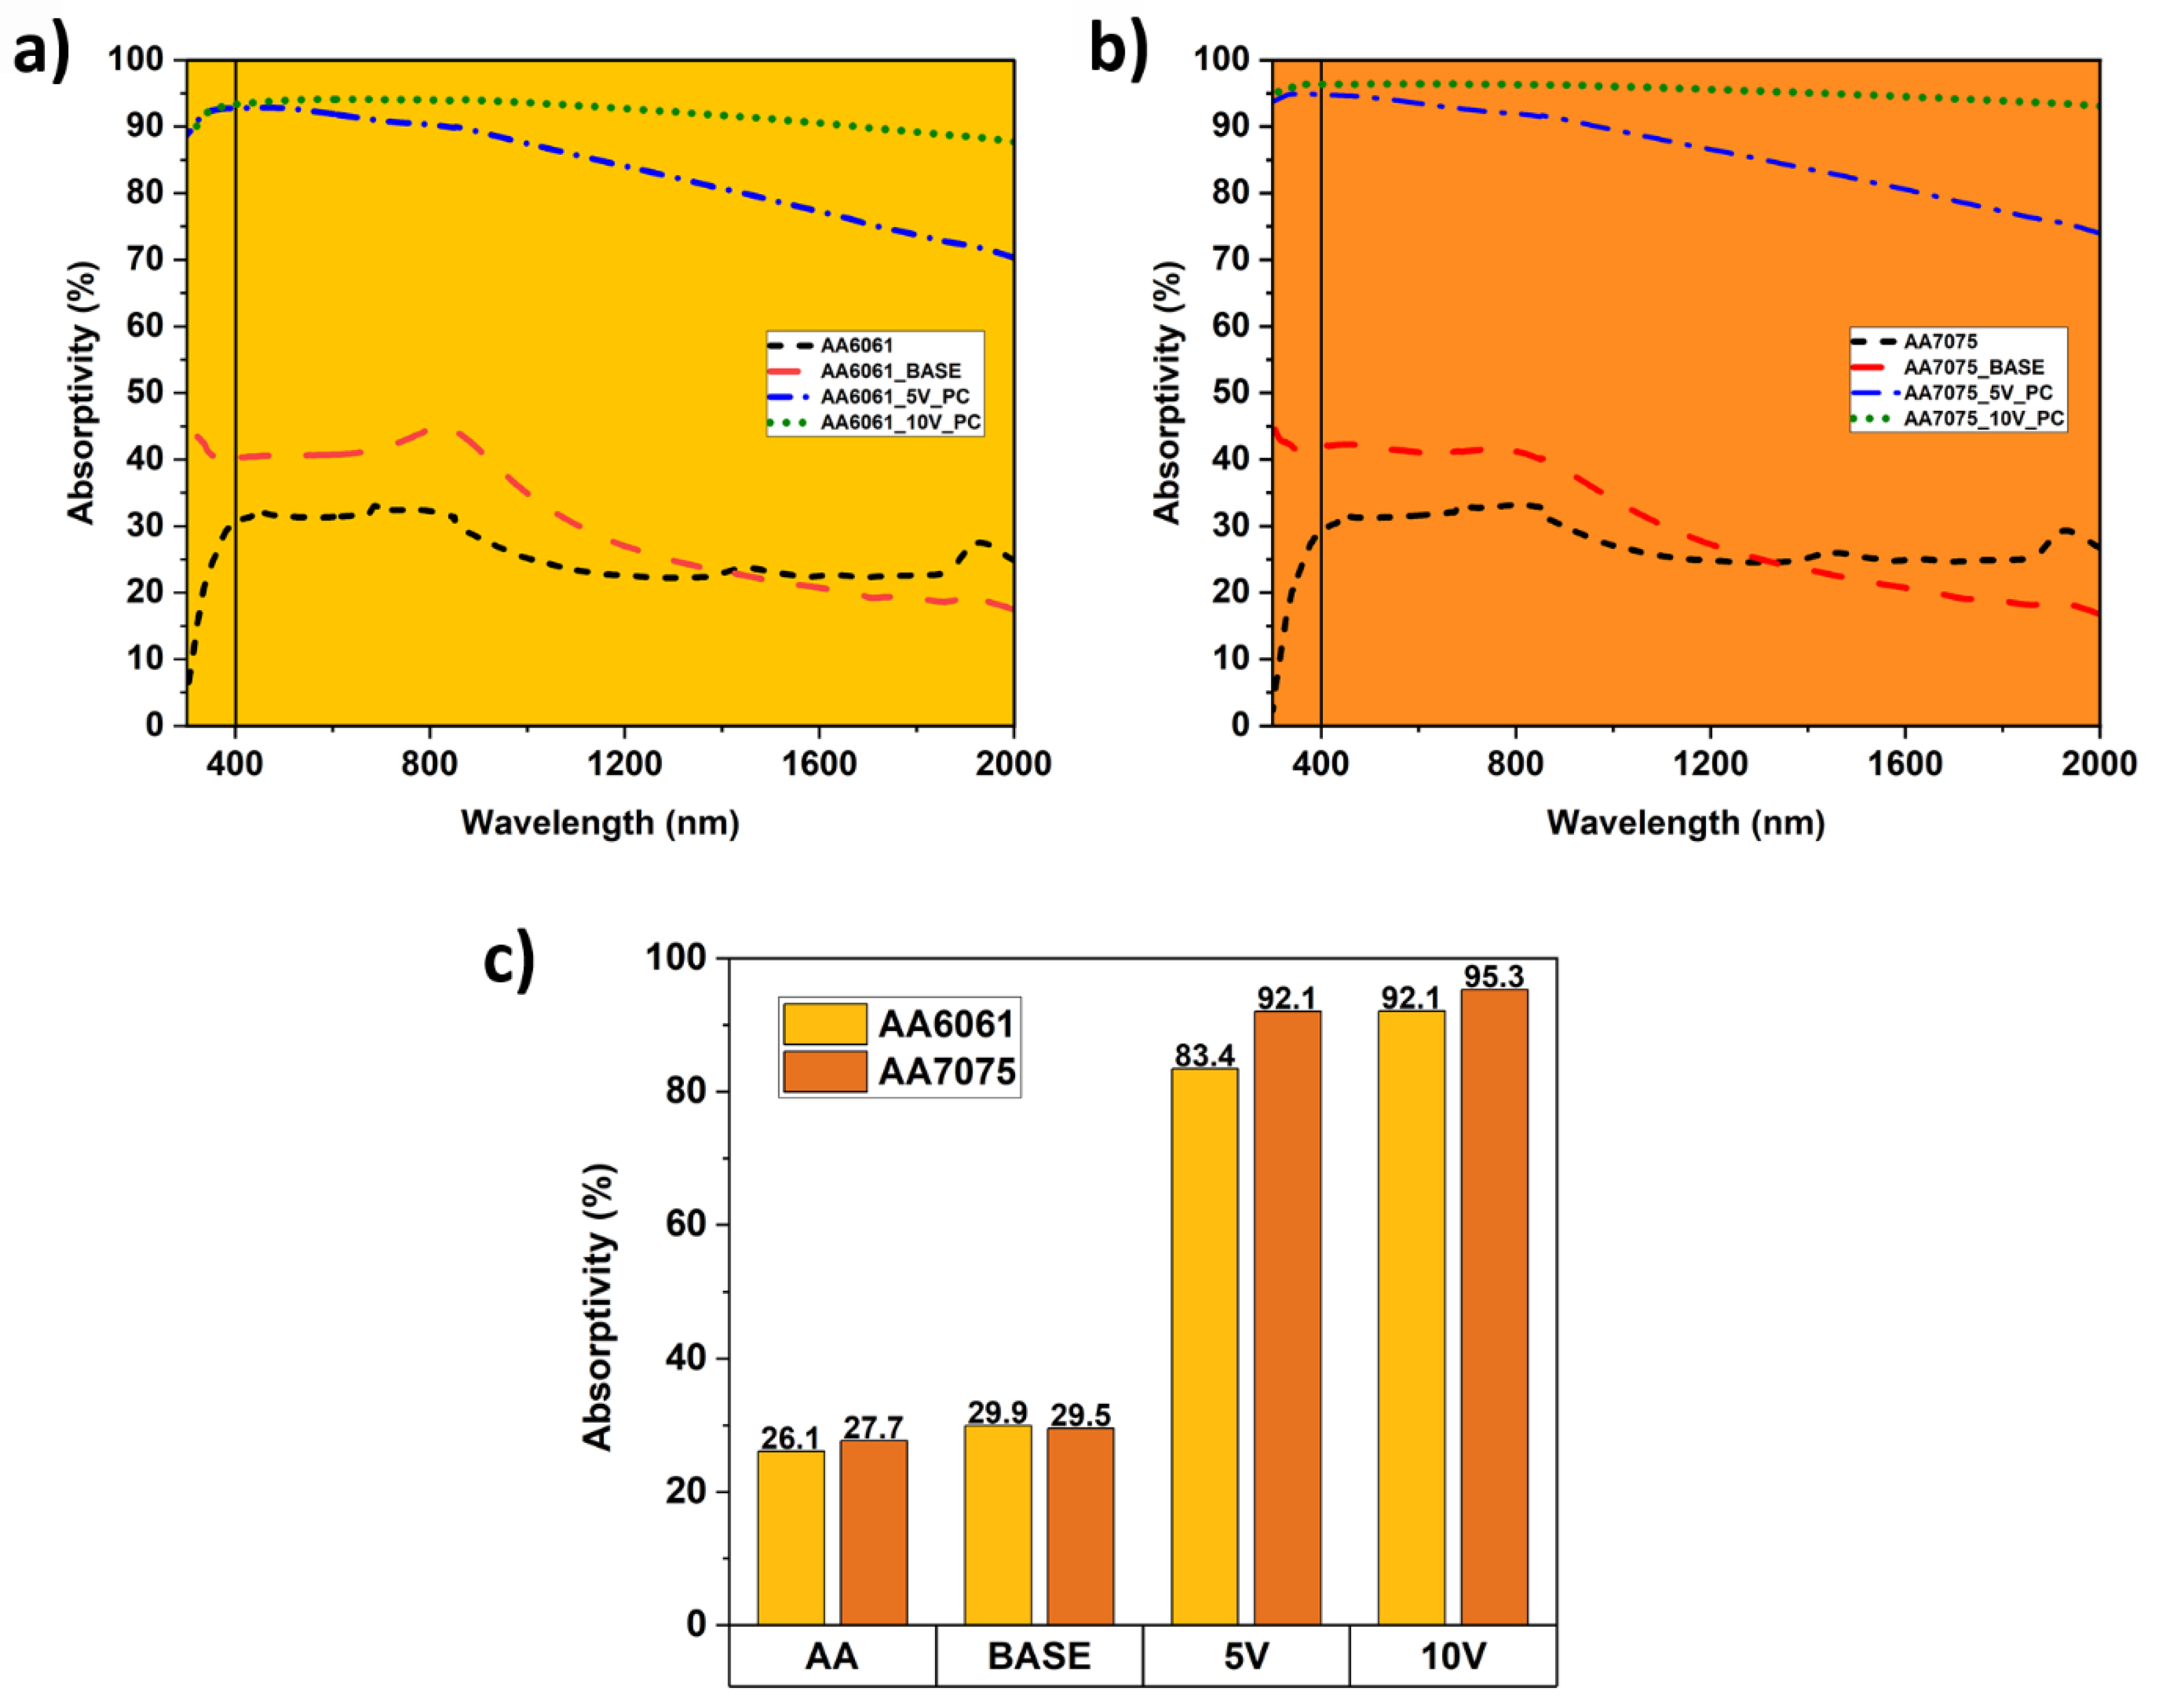
Figure 8a,b illustrate the solar absorptance spectra of PEO-coated and uncoated AA6061 and AA7075, across a wavelength range of 300 nm to 2000 nm. The spectral profiles between alloys exhibit similar trends, whether additives are present or absent. However, a significant increase in solar absorptance is observed in samples containing vanadium, particularly at higher concentrations of 10 g/L, when compared to samples with 5 g/L, with the mean value of the solar absorptance (in the VIS-NIR spectral range) going up to 95.3% for the sample AA7075_10V (see histogram at Figure 8c). Solar absorptance of the sample AA6061_5V is significantly lower, with the mean value of only 83.4%, and it can be correlated with the surface morphology of this coating, where lower porosity can be noticed when compared to the more porous surfaces of AA6061_10V, AA7075_5V, and AA7075_10V, respectively (see Figure 2). The porosity of the coating is important as it acts as a light trap, extending the light transmission path and enhancing absorptance value [36].

3.4. Thermal Shocks Evaluation

The thermal shock tests were performed by cycling the samples 20 times between liquid nitrogen at –196 °C and an oven at 150 °C for 30 s at each temperature. A test was performed to assess the durability of the PEO coatings, their adhesion to the substrate, and the potential formation of cracks. Despite the relatively thick nature of the coatings, no visible changes or damages were observed after exposure to these extreme conditions, as evidenced by the stereomicroscope images taken before and after testing, and reported in Figure 9a for the PEO coatings on the AA6061 and in Figure 9b for the coatings on AA7075. The positive thermal shock resistance of the PEO coatings can be attributed to good cohesion within the coating and strong adhesion on the coating–substrate interface.

3.5. Corrosion Resistance Evaluation

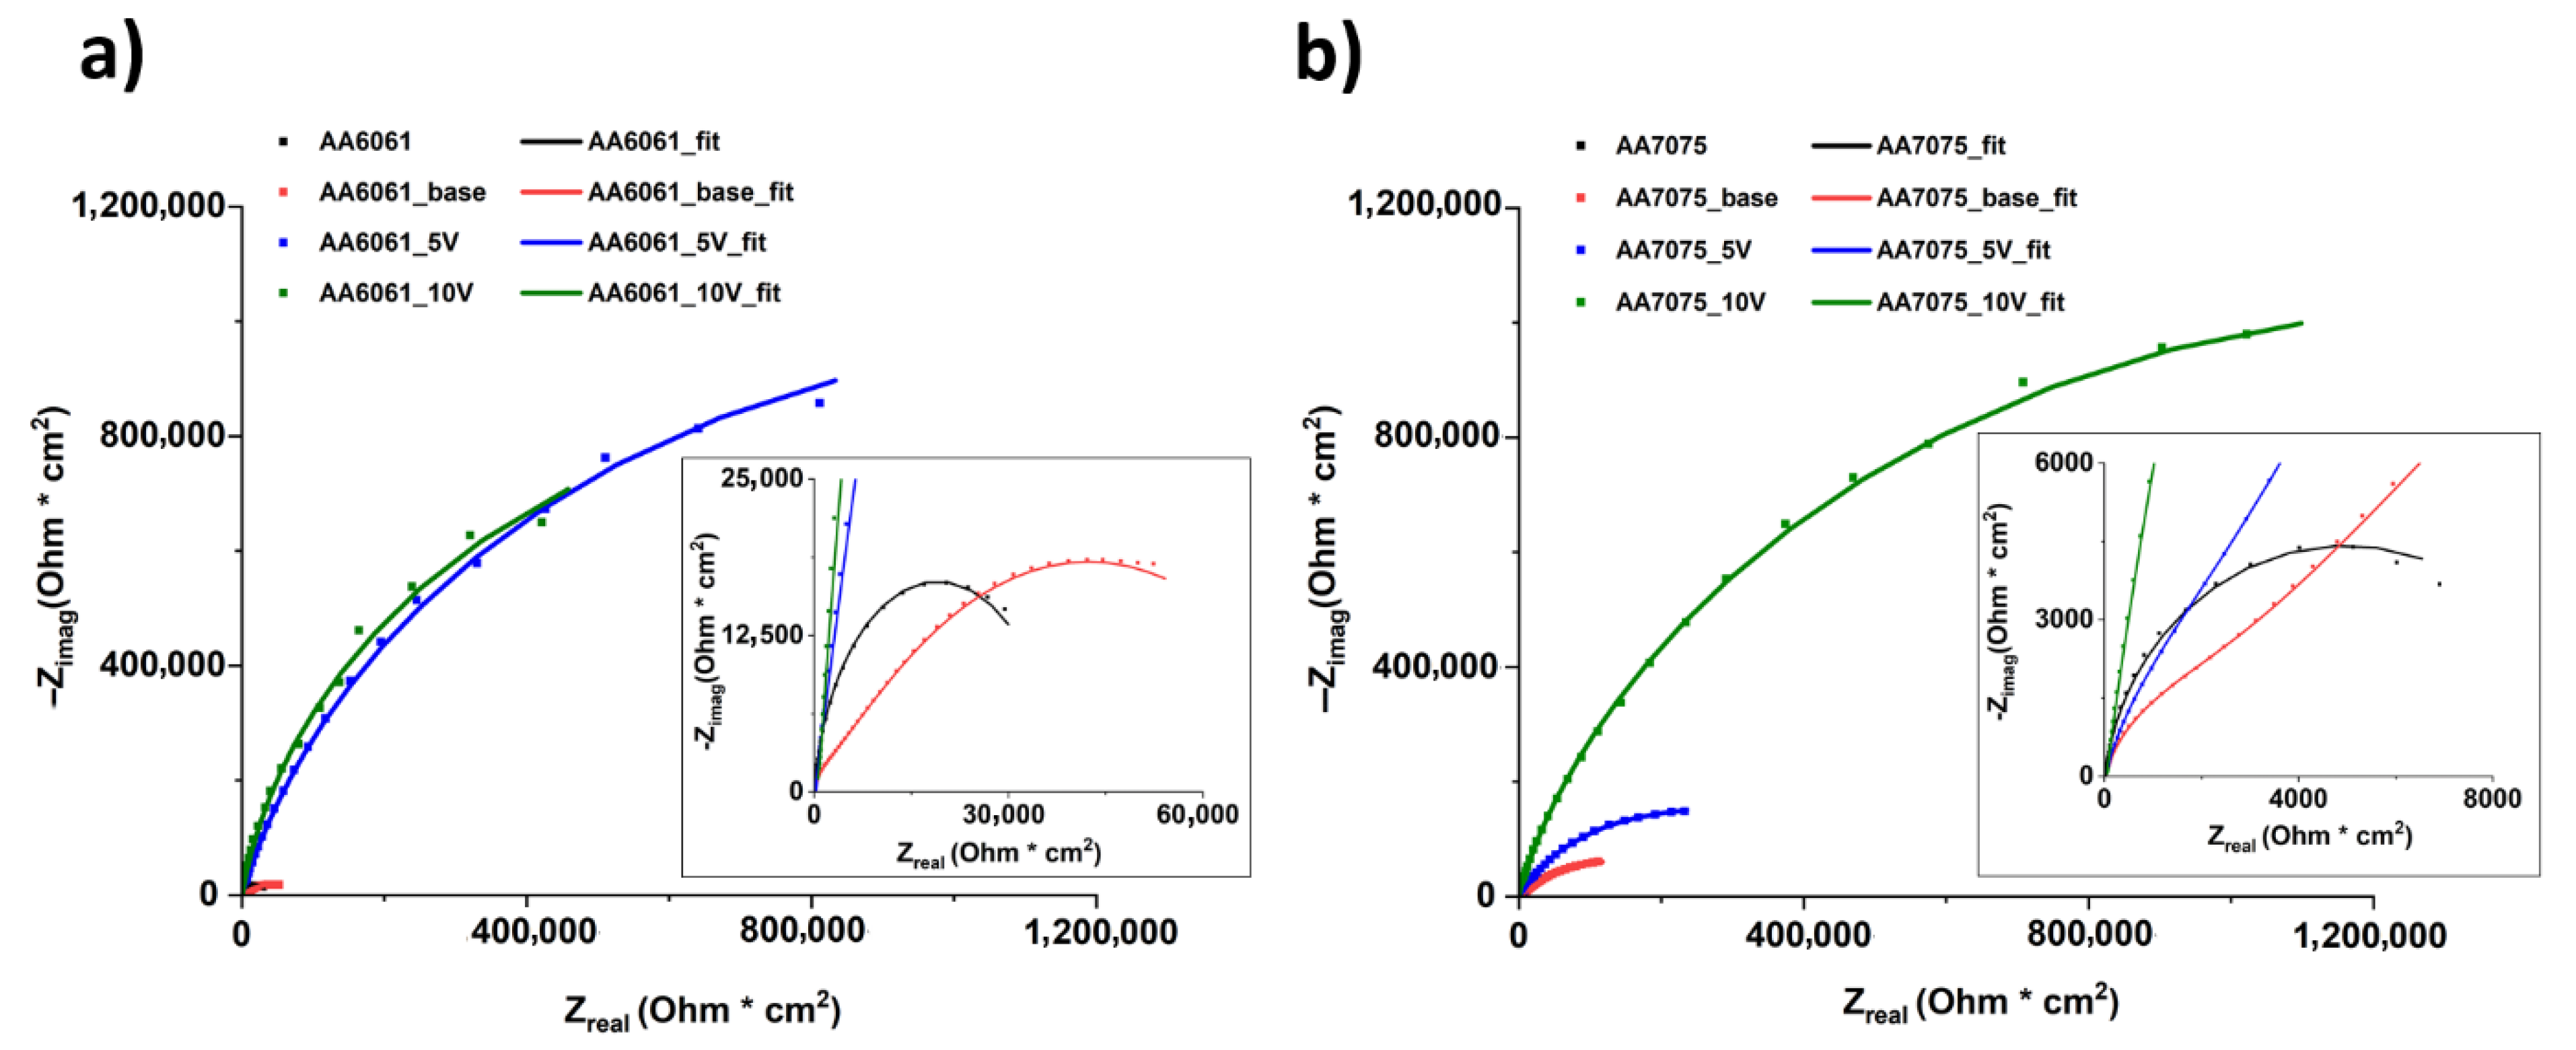
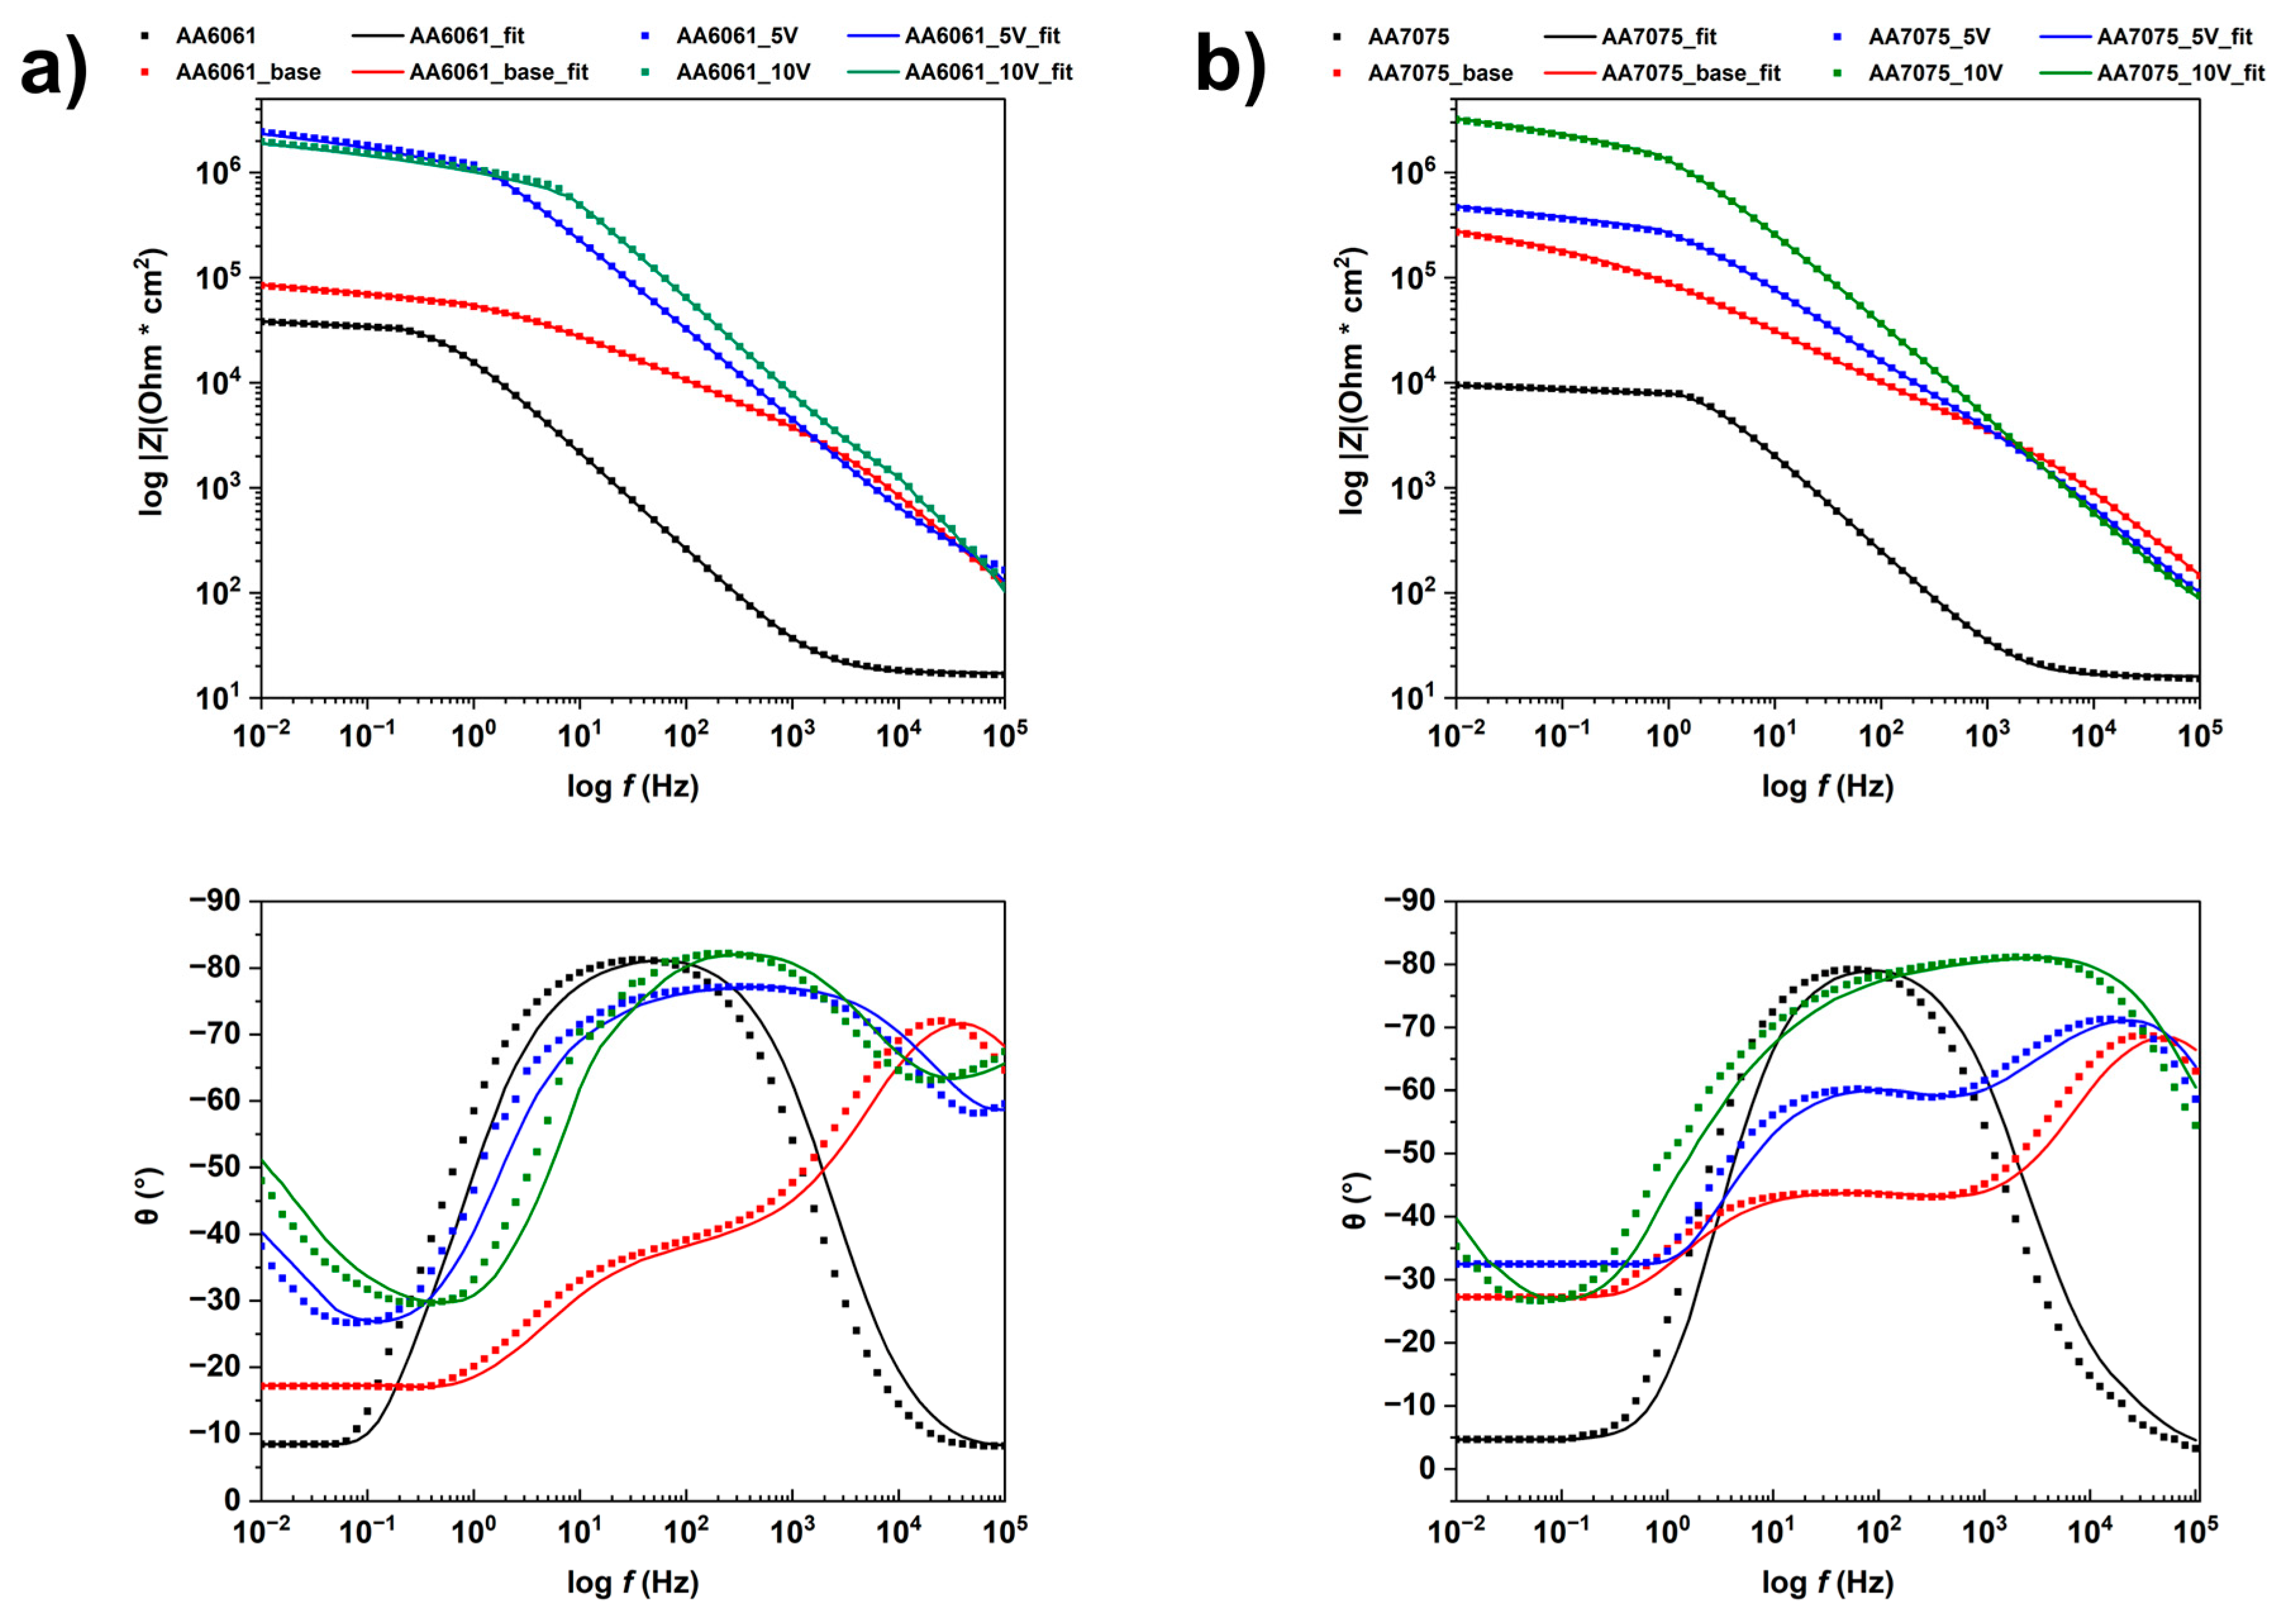
The corrosion resistance of PEO coatings was evaluated in a test solution consisting of 0.1 M Na2SO4 and 0.05 M NaCl. The study compared the corrosion behaviour of samples with and without vanadium additive, coatings prepared under two different PEO electrical modes, DC and pulsed, as well as uncoated AA6061 and AA7075 samples. EIS data are reported in a Nyquist plot (see Figure 10a for the AA6061 and Figure 10b for the AA7075) and a Bode plot format (see Figure 11a for the AA6061 and Figure 11b for the AA7075), where experimental results are depicted as dots, while the fitted results are shown as solid lines.
As widely reported in the literature, PEO coatings consist of two layers: an inner compact layer and an outer porous layer [56,57]. The inner layer is a compact, homogeneous layer of only a few nm in direct contact with the metal surface, so it plays an important role in the corrosion resistance of PEO coatings. In contrast, the outer layer, typically several µm thick, has a porous structure, making it susceptible to electrolyte penetration and, therefore, less effective in providing corrosion protection [58]. To fit the experimental EIS data, an ECC with a two-time constant was selected for PEO-coated samples (see Figure 12b), while a simple ECC was used to fit uncoated AA (see Figure 12a). In the ECC, the time constant corresponding to the outer porous layer is represented as ( R o u t C P E o u t ), whereas the one associated with the inner compact layer is denoted as ( R i n C P E i n ). The constant phase element (CPE) is used instead of the pure capacitance to assess non-ideal capacitive behaviour of the PEO coatings [59]. Additionally, an R s element in the ECC represents the resistance of the corrosion test electrolyte used in the study, and its value depends on the geometry of the electrochemical cell and the conductivity of the test solution [60].
The quantitative fitting results are reported in Table 7, and the quality of the fitting is evaluated by the chi-square ( χ 2 ), whose values are constantly small (in the range of × 10 4 ) for all tested samples, indicating the accurate fit between experimental EIS data and ECC-s [61]. R i n values of the PEO coatings on AA7075 are three orders of magnitude higher than the R a l value of uncoated AA7075, while R i n values of coatings on AA6061 perform two orders of magnitude higher than R a l values of uncoated AA7075, indicating strong improvement in corrosion resistance, in both cases. R i n values are in the order of MΩ· c m 2 , which is in correlation with the data from the literature for the resistance of the black PEO coatings on AA [30,34]. Additionally, coatings produced with the PEO pulsed mode perform better than those produced by the DC mode. The observed difference may be attributed to the significantly larger pore size in the DC coatings compared to the PEO pulsed coatings (see Figure 2) and a greater chance for a corrosive electrolyte penetration toward the sample’s surface. Moreover, the use of vanadium as an additive could also play a role, since vanadium oxide can close some of the PEO coatings’ pores.

4. Conclusions

This work presents a unique approach to generate PEO coatings at a particularly low fixed cell voltage with a maximum of only 292 V throughout the entire 8 or 10 min PEO process, depending on the mode (DC or pulsed). The resulting black coatings, produced by utilising vanadium anion as a colourant, were characterised in detail and compared to the “base” PEO coatings, without a vanadium additive, and produced with the DC mode.
  • Vanadium was confirmed in all coatings where it was used as an additive in the PEO electrolyte by XPS, EDS, and XRD analyses.
  • Produced black PEO coatings show excellent optical properties with a solar absorbance, α S , exceeding 83% for samples with vanadium additive, where the maximum of 95.3% is detected for the sample with 10 g/L of vanadium additive on AA7075 substrate.
  • All PEO coatings, with and without an additive, have a characteristic porous PEO structure, with a larger pore size, as well as a higher thickness of the “base” coatings obtained by DC PEO mode.
  • The coatings are mainly composed of aluminium and silicate oxides in amorphous or crystalline form, depending on the sample. Also, a higher degree of oxidation was confirmed by XPS and XRD analysis for samples on AA7075.
  • After cycling at extreme temperature exposure in the thermal shock test, there were no visible signs of delamination, creaks, or any damage.
  • All PEO coatings improve the corrosion resistance of the tested aluminium alloys by two or three orders of magnitude, with inner layer resistance, R i n , in the MΩ· c m 2 range.

Supplementary Materials

The following supporting information can be downloaded at: https://www.mdpi.com/article/10.3390/coatings15090989/s1, Figure S1. 5V PEO coatings produced under continuous DC mode on AA6061 (a) before and (b) after thermal shock test. Stereomicroscope images of the PEO coating surfaces (c) before and (d) after thermal shock test on the same AA6061. Figure S2. 5V PEO coatings produced under continuous DC mode on AA7075 (a) before and (b) after thermal shock test. Stereomicroscope images of the PEO coating surfaces (c) before and (d) after thermal shock test on the same AA7075.

Author Contributions

Conceptualisation, L.K. and K.B.; methodology, L.K., L.P., and K.B.; software, L.K.; validation, L.K.; formal analysis, L.K.; investigation, A.P., L.K., L.P., M.P., E.C., and G.P.; resources, M.D., K.B., and V.D.N.; data curation, A.P., L.K., and G.P.; writing—original draft preparation, L.K. and G.P.; writing—review and editing, K.B., L.K., and M.P.; visualisation, L.K. and A.P.; supervision, M.D. and K.B.; project administration, M.D. and K.B.; funding acquisition, M.D. and K.B. All authors have read and agreed to the published version of the manuscript.

Funding

This research received no external funding.

Institutional Review Board Statement

Not applicable.

Informed Consent Statement

Not applicable.

Data Availability Statement

The data supporting the findings of this study are available from the corresponding author upon request. These data are not publicly accessible as they form part of an ongoing research project.

Conflicts of Interest

The authors declare no conflicts of interest.

Abbreviations

The following abbreviations are used in this manuscript:
AAAluminium Alloy
PEOPlasma Electrolytic Oxidation
SEM-EDSScanning Electron Microscopy with Energy-Dispersive X-ray Spectroscopy
XPSX-ray Photoelectron Spectroscopy
XRDX-ray Diffraction Spectroscopy
UV-VIS-NIRUltraviolet–Visible–Near-Infrared Spectroscopy
EISElectrochemical Impedance Spectroscopy
α S Solar Absorptance
ε IR Thermal Emittance
ISO/FEPAInternational Organisation for Standardization/Federation of European Producers of Abrasives
DCDirect Current
wt. %Weight Percent
BEBinding Energy
at. %Atomic Percentages
I s o l Solar Spectrum
SCESaturated Calomel Electrode
OCPOpen Circuit Potential
EECEquivalent Electrical Circuits
CPEConstant Phase Element

References

  1. Snizhko, L.O.; Yerokhin, A.L.; Pilkington, A.; Gurevina, N.L.; Misnyankin, D.O.; Leyland, A.; Matthews, A. Anodic Processes in Plasma Electrolytic Oxidation of Aluminium in Alkaline Solutions. Electrochim. Acta 2004, 49, 2085–2095. [Google Scholar] [CrossRef]
  2. Clyne, T.W.; Troughton, S.C. A Review of Recent Work on Discharge Characteristics during Plasma Electrolytic Oxidation of Various Metals. Int. Mater. Rev. 2019, 64, 127–162. [Google Scholar] [CrossRef]
  3. Mohedano, M.; Lopez, E.; Mingo, B.; Moon, S.; Matykina, E.; Arrabal, R. Energy Consumption, Wear and Corrosion of PEO Coatings on Preanodized Al Alloy: The Influence of Current and Frequency. J. Mater. Res. Technol. 2022, 21, 2061–2075. [Google Scholar] [CrossRef]
  4. Premchand, C.; Manojkumar, P.; Lokeshkumar, E.; Rama Krishna, L.; Ravisankar, B.; Rameshbabu, N. Surface Characteristics of AC PEO Coatings Fabricated on Commercial Al Alloys. Surf. Coat. Technol. 2022, 449, 128975. [Google Scholar] [CrossRef]
  5. Wang, S.; Wang, Y.; Cao, G.; Chen, C.; Zhu, Y.; Serdechnova, M.; Blawert, C.; Zheludkevich, M.L.; Zou, Y.; Ouyang, J.; et al. High Temperature Oxidation and Hot Corrosion Behaviors of PEO and PEO/Polysilazane Preceramic-Based Dual-Layer Coatings on Ti6Al4V Alloy. Corros. Sci. 2023, 216, 111076. [Google Scholar] [CrossRef]
  6. Lu, X.; Mohedano, M.; Blawert, C.; Matykina, E.; Arrabal, R.; Kainer, K.U.; Zheludkevich, M.L. Plasma Electrolytic Oxidation Coatings with Particle Additions—A Review. Surf. Coat. Technol. 2016, 307, 1165–1182. [Google Scholar] [CrossRef]
  7. Ignjatović, S.; Blawert, C.; Serdechnova, M.; Karpushenkov, S.; Damjanović, M.; Karlova, P.; Wieland, D.C.F.; Starykevich, M.; Stojanović, S.; Damjanović-Vasilić, L.; et al. Formation of Multi-Functional TiO2 Surfaces on AA2024 Alloy Using Plasma Electrolytic Oxidation. Appl. Surf. Sci. 2021, 544, 148875. [Google Scholar] [CrossRef]
  8. Magniez, L.; Tousch, C.D.S.; Fontana, S.; Cahen, S.; Martin, J.; Hérold, C.; Henrion, G. Plasma Electrolytic Oxidation of Aluminium in Electrolytes Containing Various Concentrations of Carbon Black Nanoparticles. Surf. Coat. Technol. 2023, 473, 129990. [Google Scholar] [CrossRef]
  9. Torskaya, E.; Shkalei, I.; Morozov, A.; Stepanov, F.; Malyshev, V.; Svistkov, A. Structure, Friction and Wear of AlZn5.5MgCu Based PEO Coatings Modified by Diamond Nanoparticles and Silver Micropowder. Tribol. Int. 2025, 203, 110417. [Google Scholar] [CrossRef]
  10. Shahri, Z.; Allahkaram, S.R.; Soltani, R.; Jafari, H. Modeling of PEO Coatings by Coupling an Artificial Neural Network and Taguchi Design of Experiment. J. Mater. Eng. Perform. 2024, 33, 7111–7122. [Google Scholar] [CrossRef]
  11. Tu, W.; Cheng, Y.; Wang, X.; Zhan, T.; Han, J.; Cheng, Y. Plasma Electrolytic Oxidation of AZ31 Magnesium Alloy in Aluminate-Tungstate Electrolytes and the Coating Formation Mechanism. J. Alloys Compd. 2017, 725, 199–216. [Google Scholar] [CrossRef]
  12. Dorneles, M.T.; de Castro, V.V.; dos Santos, A.G.; Aguzzoli, C.; de Andrade, A.M.H.; Schroeder, R.M.; de Fraga Malfatti, C. Tribological and Corrosion Behavior of PEO Coatings on AA 2024-T3 Aluminum Alloy Obtained with Optimized Electrical Parameters under Low Current Densities. J. Braz. Soc. Mech. Sci. Eng. 2024, 46, 479. [Google Scholar] [CrossRef]
  13. Yeshmanova, G.; Blawert, C.; Serdechnova, M.; Wieland, D.C.F.; Starykevich, M.; Gazenbiller, E.; Höche, D.; Smagulov, D.; Zheludkevich, M.L. Effect of Electrolyte Composition on the Formation of PEO Coatings on AA2024 Aluminium Alloy. Surf. Interfaces 2024, 44, 103797. [Google Scholar] [CrossRef]
  14. del Olmo, R.; López, E.; Matykina, E.; Tiringer, U.; Mol, J.M.C.; Mohedano, M.; Arrabal, R. Hybrid PEO/Sol-Gel Coatings Loaded with Ce for Corrosion Protection of AA2024-T3. Prog. Org. Coat. 2023, 182, 107667. [Google Scholar] [CrossRef]
  15. Iqbal, M.A.; Asghar, H.; Maurino, V.; Matykina, E.; Arrabal, R.; Mohedano, M. Evaluating the Energy Consumption, Structural, and Corrosion Resistance Properties of Photocatalytic TiO2-Based PEO Coatings on Pre-Anodized AA2024-Al. Surf. Interfaces 2024, 44, 103659. [Google Scholar] [CrossRef]
  16. Mohedano, M.; Mingo, B.; Mora-Sánchez, H.; Matykina, E.; Arrabal, R. Effects of Pre-Anodizing and Phosphates on Energy Consumption and Corrosion Performance of PEO Coatings on AA6082. Surf. Coat. Technol. 2021, 409, 126892. [Google Scholar] [CrossRef]
  17. Pillai, A.M.; Rajendra, A.; Sharma, A.K.; Bera, P.; Poornima, S.; Sampath, S. Development of Vanadium Impregnated Flat Absorber Composite PEO Coating on AA6061 Alloy. Surf. Coat. Technol. 2021, 410, 126891. [Google Scholar] [CrossRef]
  18. Yao, R.; Yao, Z.; Li, Y.; Zhang, P.; Lu, S.; Wu, X. Preparation of Black Thermal Control PEO Coatings on TC4 with Enhanced Electrical Conductivity by Gas Thermal Penetration Post-Treatment. Surf. Coat. Technol. 2023, 454, 129152. [Google Scholar] [CrossRef]
  19. Goueffon, Y.; Arurault, L.; Mabru, C.; Tonon, C.; Guigue, P. Black Anodic Coatings for Space Applications: Study of the Process Parameters, Characteristics and Mechanical Properties. J. Mater. Process Technol. 2009, 209, 5145–5151. [Google Scholar] [CrossRef]
  20. Sharma, A.K. Surface Engineering for Thermal Control of Spacecraft. Surf. Eng. 2005, 21, 249–253. [Google Scholar] [CrossRef]
  21. Madhuri, D.; Ghosh, R.; Hasan, M.A.; Dey, A.; Pillai, A.M.; Angamuthu, M.; Anantharaju, K.S.; Rajendra, A. Flat Absorber Black PEO Coatings on Ti6Al4V for Spacecraft Thermal Control Application. Ceram. Int. 2022, 48, 35906–35914. [Google Scholar] [CrossRef]
  22. Liang, J.; Peng, Z.; Li, R.; Wang, B. Preparation of White ZrO2 Coating with Low Solar Absorptance on Aluminum Alloy by Plasma Electrolytic Oxidation. Ceram. Int. 2023, 49, 29133–29140. [Google Scholar] [CrossRef]
  23. Tu, W.; Zhu, Z.; Zhuang, X.; Cheng, Y.; Skeldon, P. Effect of Frequency on Black Coating Formation on AZ31 Magnesium Alloy by Plasma Electrolytic Oxidation in Aluminate-Tungstate Electrolyte. Surf. Coat. Technol. 2019, 372, 34–44. [Google Scholar] [CrossRef]
  24. Nagumothu, R.B.; Thangavelu, A.; Nair, A.M.; Sukumaran, A.; Anjilivelil, T. Development of Black Corrosion-Resistant Ceramic Oxide Coatings on AA7075 by Plasma Electrolytic Oxidation. Trans. Indian Inst. Met. 2019, 72, 47–53. [Google Scholar] [CrossRef]
  25. Arunnellaiappan, T.; Rama Krishna, L.; Anoop, S.; Uma Rani, R.; Rameshbabu, N. Fabrication of Multifunctional Black PEO Coatings on AA7075 for Spacecraft Applications. Surf. Coat. Technol. 2016, 307, 735–746. [Google Scholar] [CrossRef]
  26. Pan, J.; Wen, Y.; Wang, L.; Wu, Z.; Dong, H.; Ye, Z. Doping and Defects: The Coloring Mechanism of Black Plasma Electrolytic Oxidation (PEO) Films on Aluminum Alloys. Surf. Coat. Technol. 2022, 431, 128035. [Google Scholar] [CrossRef]
  27. Liang, J.; Peng, Z.; Cui, X.; Li, R.; Wang, B. Characterization of V-Containing Black Plasma Electrolytic Oxide Coatings on Aluminium Alloy: Impact of Base Electrolytes. J. Mater. Res. Technol. 2024, 30, 110–119. [Google Scholar] [CrossRef]
  28. Yao, Z.; Li, X.; Wei, H.; Xia, Q.; Wang, Y.; Li, D.; Jiang, Z. Black Ceramic Coatings on Ti Alloy with Enhanced High Absorptivity and High Emissivity by Plasma Electrolytic Oxidation. Int. J. Appl. Ceram. Technol. 2019, 16, 994–1003. [Google Scholar] [CrossRef]
  29. Rakoch, A.G.; Van Tuan, T.; Khabibullina, Z.V.; Blawert, C.; Serdechnova, M.; Scharnagl, N.; Zheludkevich, M.L.; Gladkova, A.A. Role of Cobalt Additive on Formation and Anticorrosion Properties of PEO Coatings on AA2024 Alloy in Alkali-Silicate Electrolyte. Surf. Coat. Technol. 2022, 433, 128075. [Google Scholar] [CrossRef]
  30. Aliramezani, R.; Raeissi, K.; Santamaria, M.; Hakimizad, A. Characterization and Properties of PEO Coatings on 7075 Al Alloy Grown in Alkaline Silicate Electrolyte Containing KMnO4 Additive. Surf. Coat. Technol. 2017, 329, 250–261. [Google Scholar] [CrossRef]
  31. Husak, Y.; Olszaniecki, J.; Pykacz, J.; Ossowska, A.; Blacha-Grzechnik, A.; Waloszczyk, N.; Babilas, D.; Korniienko, V.; Varava, Y.; Diedkova, K.; et al. Influence of Silver Nanoparticles Addition on Antibacterial Properties of PEO Coatings Formed on Magnesium. Appl. Surf. Sci. 2024, 654, 159387. [Google Scholar] [CrossRef]
  32. Pillai, A.M.; Ghosh, R.; Dey, A.; Prajwal, K.; Rajendra, A.; Sharma, A.K.; Sampath, S. Crystalline and Amorphous PEO Based Ceramic Coatings on AA6061: Nanoindentation and Corrosion Studies. Ceram. Int. 2021, 47, 14707–14716. [Google Scholar] [CrossRef]
  33. Hao, Y.; Ye, Z.; Ye, M.; Dong, H.; Wang, L.; Du, Y. Construction and Growth of Black PEO Coatings on Aluminum Alloys for Enhanced Wear and Impact Resistance. Ceram. Int. 2023, 49, 30782–30793. [Google Scholar] [CrossRef]
  34. Zhu, M.; Song, Y.; Liu, Z.; Xu, D.; Dong, K.; Han, E.H. Optimization of Thermal Control and Corrosion Resistance of PEO Coatings on 7075 Aluminum Alloy by Frequency Alteration. Surf. Coat. Technol. 2022, 446, 128797. [Google Scholar] [CrossRef]
  35. Shirley, D.A. High-resolution X-ray photoemission spectrum of the valence bands of gold. Phys. Rev. B 1972, 5, 4709–4714. [Google Scholar] [CrossRef]
  36. Li, Z.; Zhou, Z.; Wang, Q.; Lu, S. Optimal of Black Anti-Static AZO/Al2O3-SiO2-VxOy Coatings for Spacecraft Stray Light on High Silicon Aluminum Alloys. Curr. Appl. Phys. 2023, 55, 44–52. [Google Scholar] [CrossRef]
  37. Kostelac, L.; Pezzato, L.; Colusso, E.; Natile, M.M.; Brunelli, K.; Dabalà, M. Black PEO Coatings on Titanium and Titanium Alloys Produced at Low Current Densities. Appl. Sci. 2023, 13, 12280. [Google Scholar] [CrossRef]
  38. Yao, R.; Li, Y.; Yao, Z.; Zhang, P.; Lu, S.; Wu, X. Black PEO Coating with Enhanced Thermal Stability on Titanium Alloy and Its Thermal Control Properties. Surf. Coat. Technol. 2022, 429, 127934. [Google Scholar] [CrossRef]
  39. Dilimon, V.S.; Shibli, S.M.A. A Review on the Application-Focused Assessment of Plasma Electrolytic Oxidation (PEO) Coatings Using Electrochemical Impedance Spectroscopy. Adv. Eng. Mater. 2023, 25, 2201796. [Google Scholar] [CrossRef]
  40. Dehnavi, V.; Shoesmith, D.W.; Luan, B.L.; Yari, M.; Liu, X.Y.; Rohani, S. Corrosion Properties of Plasma Electrolytic Oxidation Coatings on an Aluminium Alloy—The Effect of the PEO Process Stage. Mater. Chem. Phys. 2015, 161, 49–58. [Google Scholar] [CrossRef]
  41. Settimi, A.G.; Pezzato, L.; Longato, A.; Brunelli, K.; Martucci, A.; Gross, S.; Dabalà, M. Photoluminescent Plasma Electrolytic Oxidation Coatings Containing YAG: Ce Produced on 1050 Aluminum Alloy. J. Mater. Eng. Perform. 2023, 32, 5967–5979. [Google Scholar] [CrossRef]
  42. Mojsilović, K.; Serdechnova, M.; Blawert, C.; Zheludkevich, M.L.; Stojadinović, S.; Vasilić, R. In-Situ Incorporation of LDH Particles during PEO Processing of Aluminium Alloy AA2024. Appl. Surf. Sci. 2024, 654, 159450. [Google Scholar] [CrossRef]
  43. Moga, S.G.; Negrea, D.A.; Ducu, C.M.; Malinovschi, V.; Schiopu, A.G.; Coaca, E.; Patrascu, I. The Influence of Processing Time on Morphology, Structure and Functional Properties of PEO Coatings on AZ63 Magnesium Alloy. Appl. Sci. 2022, 12, 12848. [Google Scholar] [CrossRef]
  44. Zhu, L.; Zhang, W.; Liu, H.; Liu, L.; Wang, F.; Qiao, Z. Single Dense Layer of PEO Coating on Aluminum Fabricated by “Chain-like” Discharges. Materials 2022, 15, 4635. [Google Scholar] [CrossRef]
  45. Barr, T.L. An XPS study of Si as it occurs in adsorbents, catalysts, and thin films. Appl. Surf. Sci. 1983, 15, 1–35. [Google Scholar] [CrossRef]
  46. Hartney, M.A.; Chiang, J.N.; Hess, D.W.; Soane, D.S. Oxide Formation during Plasma Etching of Silicon-Containing Resists. Appl. Phys. Lett. 1989, 54, 1510–1512. [Google Scholar] [CrossRef]
  47. Derek Haycock, B.E.; Nicholls, C.J.; Urch, D.S.; Webber, M.J.; Wiech, G. The electronic structure of magnesium dialuminium tetraoxide (spinel) using X-ray emission and X-ray photoelectron spectroscopies. J. Chem. Soc. 1978, 12, 1785–1790. [Google Scholar] [CrossRef]
  48. Hughes, A.E.; Hedges, M.M.; Sexton, B.A. Reactions at the Al/SiO2/SiC layered interface. J. Mater. Sci. 1990, 25, 4856–4865. [Google Scholar] [CrossRef]
  49. Wagner, C.D. Chemical shifts of Auger lines, and the Auger parameter. Faraday Discuss. 1975, 60, 291–300. [Google Scholar] [CrossRef]
  50. Seyama, H.; Soma, M. Bonding-state characterization of the constituent elements of silicate minerals by X-ray photoelectron spectroscopy. J. Chem. Soc. Faraday Trans. 1 1985, 81, 485–495. [Google Scholar] [CrossRef]
  51. Kovacich, J.A.; Lichtman, D. A qualitative and quantitative study of the oxides of aluminium and silicon using AES and XPS. J. Electron Spectrosc. Relat. Phenom. 1985, 35, 7–18. [Google Scholar] [CrossRef]
  52. Nefedov, V.I.; Firsov, M.N.; Shaplygin, I.S. Electronic structures of MRhO2, MRh2O4, RhMO4 and Rh2MO6 on the basis of X-ray spectroscopy and ESCA data. J. Electron Spectrosc. Relat. Phenom. 1982, 26, 65–78. [Google Scholar] [CrossRef]
  53. Fierro, J.L.G.; Arrua, L.A.; Nieto, J.M.L.; Kremenic, G. Surface properties of Coprecipitated VTiO catalysts and their relation to the selectiveoxidation of isobutene. Appl. Catal. 1988, 37, 323–338. [Google Scholar] [CrossRef]
  54. Bond, G.C.; Flamerz, S. Structure and reactivity of titania-supported oxides: IV. Characterisation of dried vanadia/titania catalyst precursors. Appl. Catal. 1989, 46, 89–102. [Google Scholar] [CrossRef]
  55. Lee, A.Y.; Powell, C.J.; Gorham, J.M.; Morey, A.; Scott, J.H.J.; Hanisch, R.J. Development of the NIST X-Ray Photoelectron Spectroscopy (XPS) Database, Version 5. Data Sci. J. 2024, 23, 45. [Google Scholar] [CrossRef]
  56. Jaleh, B.; Nasri, A.; Chaharmahali, R.; Kaseem, M.; Fattah-alhosseini, A. Exploring Wear, Corrosion, and Microstructure in PEO Coatings via Laser Surface Treatments on Aluminum Substrates. Opt. Laser Technol. 2025, 181, 111958. [Google Scholar] [CrossRef]
  57. Yang, D.; Gerelt Od, D.; Ramu, A.G.; Choi, D. Fabrication of Enhanced Corrosion Protection of PEO/PFOTES Nanocomposite Film Coatings on Aluminum Alloy Deposited by Plasma Electrolytic Oxidation. Mater. Lett. 2022, 315, 131898. [Google Scholar] [CrossRef]
  58. Nadimi, M.; Dehghanian, C.; Etemadmoghadam, A. Influence of SiO2 Nanoparticles Incorporating into Ceramic Coatings Generated by PEO on Aluminium Alloy: Morphology, Adhesion, Corrosion, and Wear Resistance. Mater. Today Commun. 2022, 31, 103587. [Google Scholar] [CrossRef]
  59. Hashemzadeh, M.; Raeissi, K.; Ashrafizadeh, F.; Hakimizad, A.; Santamaria, M.; Lampke, T. Silicate and Hydroxide Concentration Influencing the Properties of Composite Al2O3-TiO2 PEO Coatings on AA7075 Alloy. Coatings 2022, 12, 33. [Google Scholar] [CrossRef]
  60. Pezzato, L.; Kostelac, L.; Tonelli, L.; Elsayed, H.; Kajánek, D.; Bernardo, E.; Martini, C.; Dabalà, M.; Brunelli, K. Effect of Different Types of Glass Powders on the Corrosion and Wear Resistance of Peo Coatings Produced on 6061 Aluminum Alloy. Met. Mater. Int. 2024, 31, 636–653. [Google Scholar] [CrossRef]
  61. Zhu, H.; Huang, J.; Gong, Y.; Zhao, D.; Zhang, H.; Chen, D.; Wang, M.; Wang, H. Insight into Continuous Growth Mechanisms of ZrO2-Al2O3 Composite PEO Coatings with Superior Cavitation Erosion Resistance. Surf. Coat. Technol. 2024, 477, 130355. [Google Scholar] [CrossRef]
Figure 1. Applied voltage waveform to the samples produced by the unipolar pulsed PEO mode.
Coatings 15 00989 g001
Figure 2. SEM images of the PEO coatings surfaces on both AAs 6061 (on the left) and 7075 (on the right).
Coatings 15 00989 g002
Figure 3. EDS spectra and the corresponding SEM images of the PEO coatings’ cross-sections.
Coatings 15 00989 g003
Figure 4. XPS survey analyses of the investigated materials.
Coatings 15 00989 g004
Figure 5. High-resolution XPS spectra and deconvolution in the different spectral regions for AA6061_base (ac) and AA6061_10V (df) samples.
Coatings 15 00989 g005
Figure 6. High-resolution XPS spectra and deconvolution in the different spectral regions for AA7075_base (ac) and AA7075_10V (df) samples.
Coatings 15 00989 g006
Figure 7. XRD patterns of uncoated and PEO-coated (a) AA6061 and (b) AA7075.
Coatings 15 00989 g007
Figure 8. Solar absorptance spectrum of the uncoated aluminium alloys and PEO-coated ones with and without additive added on (a) AA6061 and (b) AA7075. Image (c) presents the mean solar absorbance value in the visible (VIS) and near-infrared (NIR) spectral region (wavelength value from 400 to 2000 nm) for all samples.
Coatings 15 00989 g008
Figure 9. Stereomicroscope images of the PEO coating surfaces before and after thermal shock test on (a) AA6061 and (b) AA7075.
Coatings 15 00989 g009
Figure 10. Experimental EIS data and the fitting results of the PEO-coated and uncoated samples presented in the form of Nyquist plot for the (a) AA6061 and (b) AA7075.
Coatings 15 00989 g010
Figure 11. Experimental EIS data and the fitting results of the PEO-coated and uncoated samples presented in the form of Bode plot for the (a) AA6061 and (b) AA7075.
Coatings 15 00989 g011
Figure 12. Equivalent electrical circuits (EECs) used to fit experimental EIS data from (a) uncoated AA6061 and AA7075; (b) PEO-coated samples.
Coatings 15 00989 g012
Table 1. Published works on black PEO coatings on two AA, 6061 and 7075, with the focus on cell voltage, electrolyte composition, and black appearance.
SubstrateCell
Voltage
(V)
Electrolyte
(Base)
Electrolyte
(Additive)
Solar
Absorptance α S
Thermal Emittance ε I R Ref.
AA6061>500
N a 2 S i O 3
NaOH
V O S O 4
0.920.88[17]
AA6061>450
( N a P O 3 ) 6
KOH
N H 4 V O 3
K 2 C r 2 O 7
0.93-[33]
AA6061>450
N a 2 S i O 3
N a 3 P O 4
KOH
N H 4 V O 3
0.895
0.915
0.81
0.83
[27]
AA7075>500
N a 2 S i O 3
KOH
( N H 4 ) 6 Mo 7 O 24
K 2 T i F 6
N a 2 W O 4
0.90.79[25]
AA7075>450
N a 2 S i O 3
KOH
K M n O 4
--[30]
AA7075>450
N a 2 S i O 3
NaOH
( N a P O 3 ) 6
N H 4 V O 3
-0.85[34]
Table 2. Nominal composition of the AA6061 and AA7075 substrates.
Element (wt. %)AlMgSiCuMnFeCrZn
AA6061Bal.0.90.7-0.050.60.250.20
AA7075Bal.2.50.081.50.040.30.185.6
Table 3. Process parameters followed in this work.
SubstrateElectrolyte
(Base)
Electrolyte
(Additive)
Electrical ModeCurrent
Density
(A/cm2)
Frequency
(Hz)
Duty
Cycle
(%)
Time
(min)
AA6061
base
2 g/L N a 2 S i O 3 ·9 H 2 O
2 g/L NaOH
-DC0.2--10
AA6061
5V **
2 g/L N a 2 S i O 3 ·9 H 2 O
2 g/L NaOH
5 g/L N a V O 3 DC0.2--10
AA6061
base *
2 g/L N a 2 S i O 3 ·9 H 2 O
2 g/L NaOH
-pulsed0.8500508
AA6061
5V
2 g/L N a 2 S i O 3 ·9 H 2 O
2 g/L NaOH
5 g/L N a V O 3 pulsed0.8500508
AA6061
10V
2 g/L N a 2 S i O 3 ·9 H 2 O
2 g/L NaOH
10 g/L N a V O 3 pulsed0.8500508
AA7075
base
2 g/L N a 2 S i O 3 ·9 H 2 O
2 g/L NaOH
-DC0.2--10
AA7075
5V **
2 g/L N a 2 S i O 3 ·9 H 2 O
2 g/L NaOH
5 g/L N a V O 3 DC0.2--10
AA7075
base *
2 g/L N a 2 S i O 3 ·9 H 2 O
2 g/L NaOH
-pulsed0.8500508
AA7075
5V
2 g/L N a 2 S i O 3 ·9 H 2 O
2 g/L NaOH
5 g/L N a V O 3 pulsed0.8500508
AA7075
10V
2 g/L N a 2 S i O 3 ·9 H 2 O
2 g/L NaOH
10 g/L N a V O 3 pulsed0.8500508
* No coating was produced under these electrical conditions, so for this reason, base samples were only synthesised utilising direct current PEO mode. ** Coatings produced under these conditions were not homogeneous, and they failed the thermal shock test; they were therefore excluded from further discussion (a visual representation of the coatings and the results of the failed thermal shock test can be seen in the Supplementary Materials).
Table 4. PEO coatings thicknesses calculated from cross-sectional SEM images.
AA6061
Base
AA6061
5V
AA6061
10V
AA7075
Base
AA7075
5V
AA7075
10V
Thickness
(µm)
36.1 ± 2.115.9 ± 1.012.9 ± 0.781.6 ± 1.78.2 ± 0.516.3 ± 1.0
Table 5. PEO coatings cross-sectional elemental composition by EDS analysis.
At. %AA6061
Base
AA6061
5V
AA6061
10V
AA7075
Base
AA7075
5V
AA7075
10V
O64.1358.5857.5664.9256.0358.26
Na1.910.270.132.111.070.53
Si23.0819.4718.2621.3721.3518.77
Al10.5119.2518.9211.8918.6817.49
Mg0.370.260.120.600.310.30
V-2.175.01-2.554.65
Table 6. PEO coatings’ surface elemental composition by XPS analysis.
At. %AA6061
Base
AA6061
10V
AA7075
Base
AA7075
10V
O63.9771.6355.4269.46
Na10.182.5627.072.08
Si16.8218.0910.9118.43
Al3.521.831.601.30
Mg5.524.585.018.14
V-1.31-0.60
Table 7. Fitting results of EIS experimental data.
AA
6061
AA
6061
Base
AA
6061
5V
AA
6061
10V
AA
7075
AA
7075
Base
AA
7075
5V
AA
7075
10V
R s · c m 2 )17.032.930.6122.616.118.433.245.2
R a l (kΩ · c m 2 )38.1---9.5---
C P E a l   ( µ F · c m 2 · s n 1 )10.2---1.0---
n a l 0.92---0.93---
R o u t   (kΩ · c m 2 )-3.21.04.7-3.06.6215.0
C P E o u t   ( nF · c m 2 · s n 1 ) -47.3117.436.1-64.198.673.0
n o u t -0.910.830.89-0.870.870.91
R i n (kΩ · c m 2 )-84.12446.01967.0-270.6463.43190.0
C P E i n   ( nF · c m 2 · s n 1 ) -357013.37.6-3220552109
n i n -0.510.970.98-0.540.680.53
χ 2   ( × 10 4 ) 18.91.13.47.321.92.51.33.4
Disclaimer/Publisher’s Note: The statements, opinions and data contained in all publications are solely those of the individual author(s) and contributor(s) and not of MDPI and/or the editor(s). MDPI and/or the editor(s) disclaim responsibility for any injury to people or property resulting from any ideas, methods, instructions or products referred to in the content.