Abstract
Engineering structures often face safety risks under impact or explosion loading, making the design of lightweight and efficient cushioning systems crucial. This study investigates the dynamic response and energy-dissipation characteristics of Expanded Polystyrene (EPS), Expanded Polyethylene (EPE), and soil–foam composite cushion layers under impact loading, using a Split Hopkinson Pressure Bar (SHPB) testing apparatus. The tests include pure foam layers (lengths ranging from 40 to 300 mm) and a soil–foam composite layer with a total length of 60 mm (soil/foam ratio 1:1 to 1:3), subjected to impact velocities of 9.9–15.4 m/s. The results show that the stress wave propagation velocity of EPE is 149.6 m/s, lower than that of EPS at 249.3 m/s. At higher velocities, the attenuation coefficient for the 40 mm EPE sample reaches as low as 0.22, while EPS is 0.31. Furthermore, the maximum energy absorption coefficient of EPE exceeds 98%, with better stability at high impact velocities. In composite cushion layers, both soil and foam collaborate in energy absorption, but an increased proportion of soil leads to a decrease in energy absorption efficiency and attenuation capacity. Under equivalent ratios, the soil–EPE combination performs better than the soil–EPS combination. By constructing a comprehensive evaluation system based on three indices: stress wave attenuation coefficient, energy absorption coefficient, and energy absorption density, this study quantifies the impact resistance performance of different cushioning layers, providing theoretical and parametric support for material selection in engineering design.
1. Introduction
In modern engineering practice, the loading conditions faced by structures are becoming increasingly complex, particularly with extreme loads such as explosions [1] and impacts [2], which are characterized by nonlinearity, high-velocity propagation, and localized damage [3]. These loads pose a growing threat to engineering structures, making the enhancement of impact resistance a core issue in fields such as civil and protective engineering. Research has demonstrated that adding cushion layers can absorb the significant energy generated by dynamic loads, ensuring that the primary structure of the engineering system is not damaged under high-pressure peak loads. For instance, in traditional rockfall protection structures, such as protective rock-shed and pile-slab barriers (Figure 1), materials like sand and soil are often added to the impact side to absorb the massive impact forces from falling rocks. However, these materials are heavy, have low energy absorption efficiency, and require large foundations for support [4,5,6]. With the rapid development of new materials and technologies, the use of multi-layered, multi-material-composite “layered cushioning” structures has proven to be an effective approach for improving impact resistance and energy dissipation efficiency. Expanded Polystyrene (EPS) and Expanded Polyethylene (EPE), due to their lightweight, porous, and high energy absorbing properties, are widely used in impact protection, vibration damping, and other engineering applications [7,8,9]. Therefore, utilizing the advantages of different energy absorbing materials and constructing well-designed composite-layered wave-damping structures is crucial. These structures dissipate high-peak transient shock waves into lower peak, longer rise-time weak shock waves, thereby reducing the intensity of shock waves transmitted to the protected structural surface. This approach is key to enhancing structural safety and significantly improves the impact and blast resistance of layered protective structures.
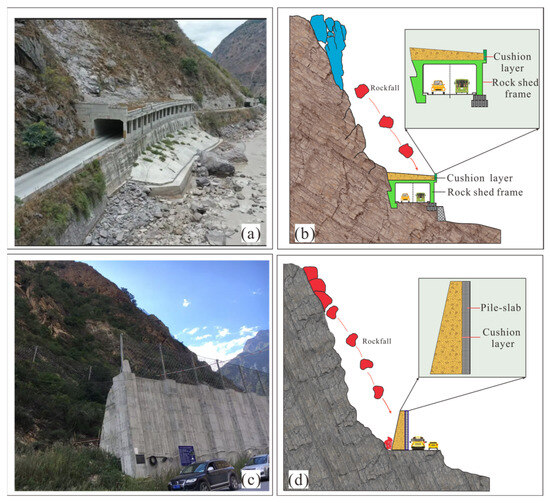
Figure 1.
Engineering application background: (a,b) rock-shed; (c,d) pile-slab and cushion layer rockfall barrier.
Similar granular materials exhibit porous and loose characteristics, making them complex, non-equilibrium energy dissipation systems [10]. These materials have been widely applied in the design of protective engineering structures, particularly in impact- and blast-resistant structural design. Through the disruption of the inherent structure between particles, such materials cause particle sliding, displacement, and even fragmentation, which weakens the peak stress of the applied shock waves [11]. Moreover, the irreversible plastic deformation of sand and soil under loading leads to additional energy loss, further increasing the attenuation of the stress wave. To investigate the propagation characteristics of stress waves in particles, shock tubes [12,13], drop-weight devices [14,15], and physical model experiments [16,17] are commonly used. However, shock tubes and drop-weight devices face challenges in obtaining the mechanical response of materials under medium-to-high strain rate conditions [18], while model experiments typically rely on embedded pressure gauges to capture stress data. Due to the significant difference in wave impedance between the pressure gauges and the materials, as well as the interference caused by the gauges on the stress waves, this can result in the transmitted stress being greater than the incident stress, leading to calibration difficulties [19]. For instance, Hampton et al. [20] found that the transmitted stress measured by pressure gauges was higher than the actual incident pressure due to interactions between the gauges and the soil, with the maximum deviation reaching 50%. Schindler [21] pointed out that the placement of the pressure gauges could cause significant sample disturbance, making calibration within the sample difficult. The Split Hopkinson Pressure Bar (SHPB) resolves the issue of simultaneously measuring stress and strain at the same position in the sample over time by measuring the elastic deformation at the ends of the incident and transmission bars. This approach provides more accurate results than embedded pressure gauges and allows high strain-rate loading by varying the bars’ diameters and increasing projectile velocity. Yu et al. [22] noted that using SHPB to analyze stress wave propagation in “long specimens” does not require the assumption of stress uniformity. Based on one-dimensional stress wave theory, they discussed the propagation characteristics of stress waves in coral sand samples of varying lengths. Lyu et al. [23] and Yu et al. [24] studied the attenuation effects of stress waves in silica sand and calcareous sand using SHPB. Cui [25] investigated the attenuation of stress waves in sand samples and provided a quantification model. Additionally, to explain the propagation characteristics of stress waves in granular media, numerical analysis methods such as the Finite Element Method (FEM), Discrete Element Method (DEM), and Smoothed Particle Hydrodynamics (SPH) have been extensively used by researchers [26,27,28], yielding promising results.
Traditional sand and soil cushion layers require significant thickness to resist high-impact energy. According to the “Highway Tunnel Design Code” in China [29], the thickness of the soil cushion layer should exceed 1.5 m to resist rockfalls, and in areas with frequent rockfalls, even thicker sand and soil layers are required. However, excessively thick cushions result in greater self-weight, which reduces the design efficiency of protective structures such as shelters [30]. To enhance both energy absorption efficiency and structural stability under extreme dynamic loads, researchers have increasingly introduced lightweight foam materials into wave-damping energy dissipation systems [31]. Typical lightweight damping and cushioning materials can absorb substantial dynamic energy through deformation, the rupturing of cell walls, and the collapse of porous structures [32,33,34,35]. Studies have shown that combining sand and foam materials to form composite cushion layers can fully leverage the advantages of both materials, improving the overall impact and blast resistance of the structure. According to experimental results from Zhao et al. [36], EPS foam tends to undergo permanent deformation after multiple impacts, leading to a decrease in energy absorption capacity. However, Expandable Polyethylene (EPE) exhibits excellent elasticity and cushioning properties, with nearly no residual deformation after compression. Meree et al. [37] proposed a new EPS particle–sand composite cushion layer based on drop-weight impact tests, achieving a 90% reduction in weight while improving energy dissipation efficiency by 84.3%. Wu et al. [38] found in their experimental study that embedding EPS foam boards in sand layers can effectively delay the propagation velocity of stress wave fronts, reduce stress peaks, and enhance the cushioning effect of the structure. Additionally, some studies have employed an alternating foam–sand layering design. By optimizing the foam thickness and interlayer contact interfaces, energy dissipation can be achieved in a gradient manner across the layers, effectively reducing the intensity of stress waves on the protected side of the structure and improving protective performance [39,40]. With the advancement of numerical simulation techniques, three-dimensional models including foam materials, sand, and structural components have been developed to precisely simulate the propagation of shock waves in composite structures. These models can analyze the impact resistance performance of different material parameters and structural configurations [41,42,43,44]. This approach not only reduces experimental costs but also allows for the optimization of the structure during the design phase, thereby improving its impact resistance performance. Overall, significant progress has been made in understanding the energy absorption characteristics of lightweight cushion layers under dynamic loading. However, most studies compare the energy absorption performance of different materials based on experimental observations, lacking a unified mathematical model to describe the quantitative relationship between the material’s energy absorption properties, sample length, and loading conditions. This limitation hinders a deeper understanding and the efficient design of lightweight cushion materials.
This study is based on the SHPB testing system and investigates two typical lightweight foams, EPS and EPE. Pure foam and soil–foam composite specimens were constructed by varying sample lengths (40–300 mm), the foam-to-soil ratio (1:1 to 1:3), and impact velocities (9.9–15.4 m/s). The propagation characteristics of stress waves and the energy dissipation mechanisms in different layered structures under impact loading conditions were systematically studied. The effects of sample length and material composition ratio on the propagation characteristics and energy dissipation behavior of stress waves were analyzed. Innovative mathematical models for the stress attenuation coefficient, energy absorption coefficient, and energy absorption density have been proposed, enabling multidimensional quantification and comprehensive evaluation of the cushioning and energy absorption performance of different materials. These models provide experimental evidence and a theoretical foundation for the design and protective applications of composite structures under dynamic loading.
2. Experimental Design
2.1. Test Material
The sand used in the tests was sourced from Zibo City, Shandong Province (Figure 2a,b). According to the results of the geotechnical tests, the natural water content of the soil sample was 32.3%. As this study does not consider the impact of water content on stress wave propagation, the soil was dried at 105 °C for 48 h during preparation. Subsequently, sieve analysis was conducted using sieves with apertures of 5 mm, 2.5 mm, 1.25 mm, 0.6 mm, 0.3 mm, and 0.08 mm. Based on the particle size distribution curve (Figure 3), particles larger than 2 mm accounted for 5.0% of the total mass, while particles larger than 0.075 mm constituted 67.0% of the total mass. According to national standards [45], the soil sample was classified as sandy soil. Additionally, the median particle size (d50) of the soil was 0.58 mm, with a uniformity coefficient (Cu) of 5.00 and a curvature coefficient (Cc) of 0.91. Scanning Electron Microscopy (SEM) images of the soil sample show that the soil particles consist of irregularly shaped particles with sharp edges and high surface roughness. Numerous micro-cracks and pores are visible on the particle surfaces, with particles primarily in point or mixed point-face contact. XRD (X-ray diffraction) analysis results (Figure 4) indicate that quartz and albite are the main mineral components in the soil samples, with a relatively high intensity of quartz diffraction peaks, accompanied by multiple sets of feldspar diffraction peaks.
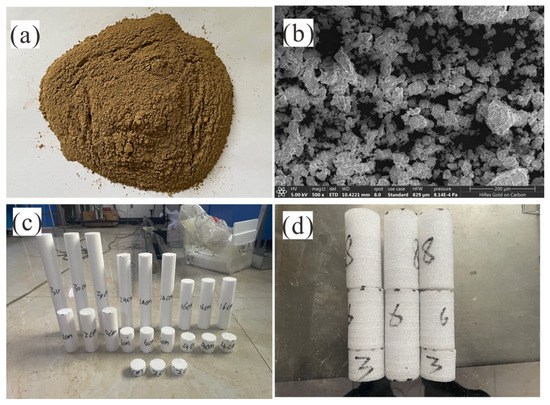
Figure 2.
Specimen electron microscope scanning morphology: (a,b) soil; (c) EPS cushion layer; (d) EPE cushion layer.
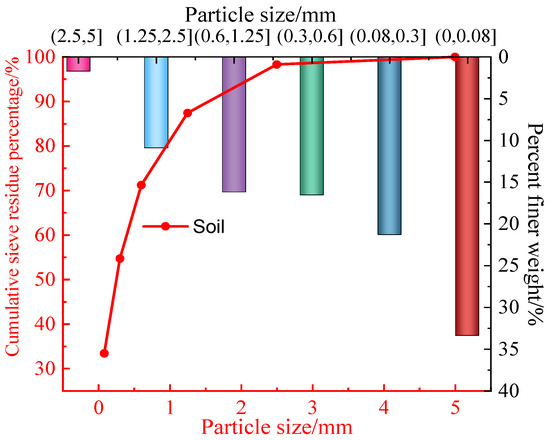
Figure 3.
Particle size distribution.
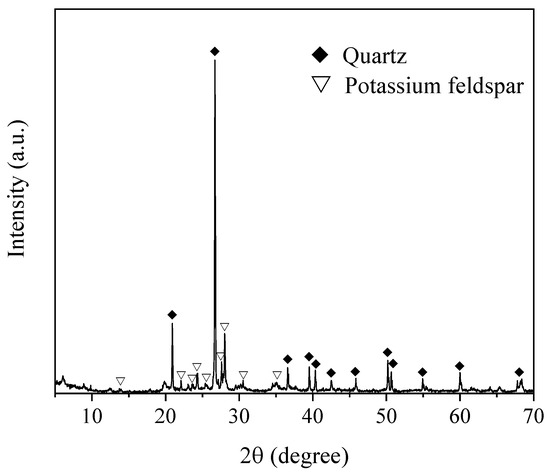
Figure 4.
XRD Spectrum of the soil sample.
EPS and EPE materials used in this study were both commercially available lightweight foams (Chengdu Xuchuan Building Materials Co., Ltd., Chengdu, China). EPS has a density of 15 kg/m3 (Figure 2c). According to the study by Sarmiento et al. [46] on the microscopic characteristics of EPS, foam cell morphology is regular, with distinct boundaries, representing a typical closed-cell structure. Thin walls separate the cells, forming the unique ‘foam skeleton’ of EPS material, which deforms, collapses, and ruptures during compression, playing a key role in its energy absorption performance. Based on the experimental design, 18 groups of EPS samples with different lengths were tested in this study.
EPE foam used in the experiment has a density of 20 kg/m3 (Figure 2d). According to Tan’s study [47], EPE material exhibits a typical foam cell structure, with polyhedral closed cells and a relatively uniform pore size distribution. Additionally, the cells are large, and the cell walls are thick, providing good deformation stability. The cells are interconnected through the cell walls, forming a complex spatial network skeleton. To compare the energy absorption performance with that of EPS, 18 groups of EPE samples with different lengths were also tested in this study.
2.2. SHPB Testing Apparatus and Improved Sleeve
Experiments were conducted using the Split Hopkinson Pressure Bar (SHPB) system provided by the Archimedes Dynamic Testing Laboratory (Tianjin, China) with modifications made to the setup to accommodate testing of particulate materials (Figure 5). The system consists of three main modules: the power module, the pressure bar system, and the data acquisition module. The power module compresses nitrogen gas, stores it, and drives a metal projectile to impact the incident bar, generating a compressive stress wave. The projectile velocity is controlled by adjusting the nitrogen pressure, allowing for loading at different strain rates. The bar system comprises a 2.4 m long incident bar and a 2.0 m long transmission bar, both made from 7075 aluminum alloy, with an elastic modulus of 71 GPa and a stress wave propagation velocity of approximately 5000 m/s. Due to the significant wave impedance mismatch between the specimen and the bars, semiconductor strain gauges were selected for signal acquisition. The strain gauges have a nominal resistance of 120 Ω and are amplified by a factor of 1000. The strain gauges are positioned 850 mm from each end of the specimen. Data acquisition is performed at a frequency of 10 MHz, ensuring accurate capture of the entire stress wave propagation process under impact loading, thus guaranteeing data timeliness and integrity.
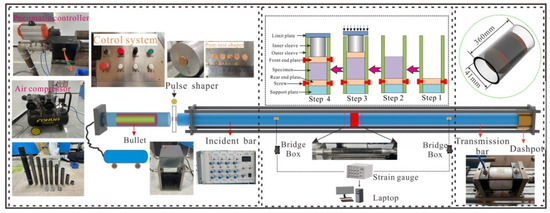
Figure 5.
Modified SHPB apparatus.
The specimen housing sleeve consists of an outer sleeve, an inner sleeve, and front, rear, and support plates. The outer sleeve is made from high-strength steel, with a total length of 360 mm, an inner diameter of 40.1 mm, and a wall thickness of 2.0 mm, providing ideal lateral confinement. The sleeve is pre-equipped with a series of threaded holes for installing and adjusting the plate positions, allowing for precise control of the specimen’s initial length and density before loading. All bolts must be removed during loading to prevent interference with the propagation of the stress wave. The inner sleeve is made of the same material as the outer sleeve, with a diameter of 25 mm, and its primary function is to further restrict the specimen’s length and packing density, enhancing the repeatability and consistency of the test. The front and rear plates are made from the same material as the SHPB bars, with a diameter of 40.0 mm and a thickness of 15 mm. These plates help reduce wave impedance mismatch caused by interface discontinuities and prevent specimen particle leakage. The support plate is 10 mm thick and made from high-strength steel, positioned below the rear plate to ensure the plates do not tilt when bolted.
In this study, EPS and EPE were solid materials that could theoretically have been directly loaded. However, to maintain consistent testing conditions for different sample types under the same constraints and improve the comparability and data consistency, all samples were loaded using the same sleeve device. The test conditions are summarized in Table 1.

Table 1.
Test conditions.
2.3. Sample Preparation and Testing Procedure
This study primarily tests different lengths of EPS and EPE, as well as soil–EPS and soil–EPE composite specimens with varying proportions under a fixed length. The experimental procedure is as follows: (1) Positioning the Plates: Place the support plate on a level working surface and stack the rear plate. Secure the outer sleeve and the rear plate with bolts to ensure the bottom structure is stable and reliable. (2) Filling the Test Material: For pure EPS and EPE materials, place them directly inside the sleeve according to the designed length, and position a plate on top of the test material before applying the impact load. For composite material layers, first place the designed length of EPS or EPE foam material on the rear plate, then fill the calculated amount of soil on top of the foam material to form a layered structure with a total length of 60 mm. The foam-to-soil layer length ratios are 1:1, 1:2, and 1:3. (3) Density Control for Composite Layers: To ensure uniform density of the soil across different impact conditions, a constant-mass filling method is used. The soil density is maintained at 1.6 g/cm3 through multiple pre-compression and leveling adjustments. It is important to note that the applied pre-compression is minimal and does not alter the initial density of the foam. When the top of the inner sleeve is aligned with the end of the outer sleeve, the limiting plate should be in contact with the outer sleeve, ensuring that the specimen length is precisely set. (4) Assembly and Impact Loading: The assembled specimen is placed between the SHPB incident and transmission bars. The sleeve’s orientation is adjusted to maintain a horizontal position, ensuring full contact between the plate ends and the bar ends. The fixing bolts are then removed, and impact loading is applied. To reduce interface friction and improve experimental accuracy, graphite powder is evenly applied on the contact surfaces between the incident bar and the front plate, and between the transmission bar and the rear plate.
3. Results and Analysis
3.1. Test Validity Verification
Figure 6 displays the typical incident, reflected, and transmitted wave signals, all of which are smooth and continuous without noticeable jumps or oscillations. Figure 7 compares stress wave propagation before and after introducing the pulse shaper. Without it, the incident waveform is sharp and exhibits high-frequency oscillations, while the transmitted wave shows pronounced distortion—indicating a steep shock front prone to reflection and interface interference. With the pulse shaper, the incident waveform is smoother, its rising edge broader, and oscillations greatly reduced; the transmitted signal becomes more stable, and its main peak is delayed. These improvements signify that the pulse shaper prolongs the loading duration and optimizes the stress wave delivery process. Overall, compared to tests without a pulse shaper, the application of the pulse shaper increased the pulse duration by 60%, greatly enhancing the reliability of the experiment. Figure 8 compares no-load conditions before and after adding the sleeve and plates. Before this modification (Figure 8a), the incident and transmitted signals overlap significantly. Afterward (Figure 8b), using matching materials for plates and bars eliminates waveform changes, confirming that the sleeve and plates have negligible impact on the signals and satisfy experimental requirements.
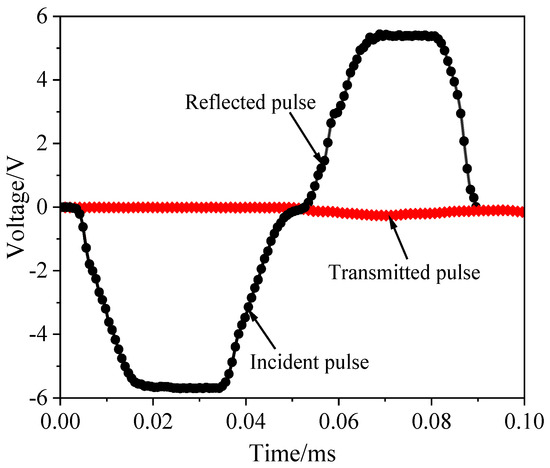
Figure 6.
Test validity verification.
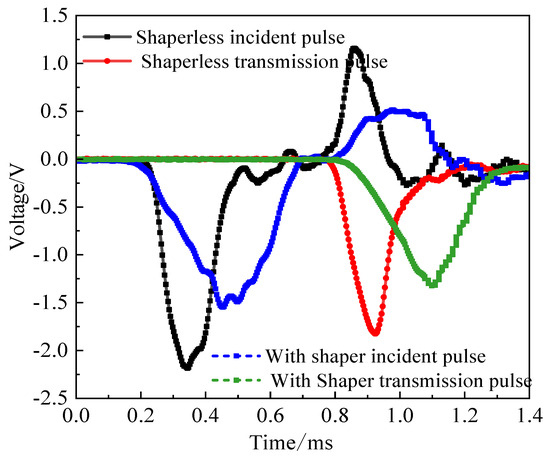
Figure 7.
Effect of shapers on waveform.
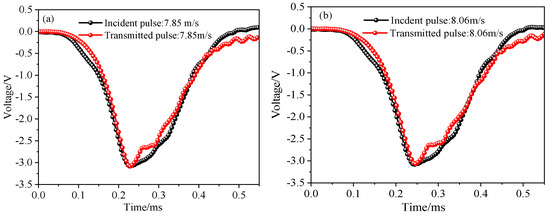
Figure 8.
Sleeve and plate calibration: (a) pre-improvement waveform; and (b) improved waveform.
3.2. Compressive Stress Wave Propagation and Attenuation Characteristics
Figure 9 illustrates the propagation process of the stress wave in the specimen. At the start of the experiment, the impact bar, driven by the actuator, strikes the free end of the incident bar at a certain velocity, generating a compressive stress wave that propagates axially along the incident bar, referred to as the incident wave. This wave propagates through the incident bar at the material’s elastic wave velocity until it reaches the interface between the incident bar and the specimen. Upon reaching the interface, due to the difference in wave impedance between the two materials, a portion of the wave is reflected back into the incident bar, forming the reflected wave. The reflected wave propagates in the opposite direction along the incident bar and is recorded by the strain gauges. At the same time, another portion of the energy from the incident wave passes through the interface into the specimen and continues to propagate. When the wave passes through the specimen and reaches the interface between the specimen and the transmission bar, part of the wave is transmitted into the transmission bar, forming the transmitted wave, which is recorded by the strain gauges installed on the transmission bar.
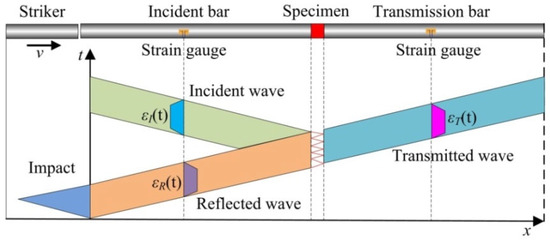
Figure 9.
Schematic diagram of stress wave generation and propagation process.
The propagation velocity of stress waves in a medium is crucial for studying wave propagation characteristics and the constitutive model of materials. Based on the SHPB stress wave time history curve, the velocity of the compressive stress wave and the peak stress velocity in soil can be calculated as Equations (1) and (2):
where C is the stress wave velocity, is the peak stress velocity, LS is the specimen length, is the time difference between the initial starting points of the incident and transmitted waves, tm is the time difference between the peak points of the incident and transmitted waves, is the time for the incident bar strain gauge to reach the specimen’s front end, and is the time for the specimen’s rear end to reach the transmission bar strain gauge.
Figure 10 illustrates the effect of specimen length on stress wave propagation velocity. For EPS foam (Figure 10a), the stress wave velocity ranges from 162.8 to 354.1 m/s, with an average velocity of approximately 249.3 m/s. Additionally, the peak stress velocity decreases significantly with increasing specimen length and shows a strong negative linear relationship. For EPE foam (Figure 10c), the velocity ranges from 81.2 to 199.6 m/s, with an average velocity of 149.6 m/s, which is notably lower than the average velocity of stress waves in EPS foam. Aside from the stress wave propagation characteristics, the specimen length of foam materials also has a significant impact on the propagation characteristics of shock waves. The average velocity in EPS foam is consistently higher than in EPE foam, indicating that EPS material has a weaker damping effect on shock wave propagation and transmits waves more quickly. In addition, the difference in peak stress velocity between EPS and EPE is primarily attributed to the attenuation of stress waves during propagation through the materials (Figure 10b,d). As the sample length increases, the propagation path of the stress wave becomes longer, leading to greater energy dissipation. Moreover, EPE foam, compared to the more rigid and brittle EPS foam, exhibits greater flexibility, resilience, and a closed-cell structure, providing higher damping and cushioning capabilities. Consequently, at the same thickness, EPE foam is more effective in absorbing and attenuating shock waves, resulting in a lower peak stress velocity. Furthermore, in EPE foam, the peak stress velocity decreases more significantly with increasing length, with the slope of the fitted curve being steeper. This suggests that EPE foam has a stronger shock wave cushioning capability and can more effectively reduce the intensity of the shock waves.
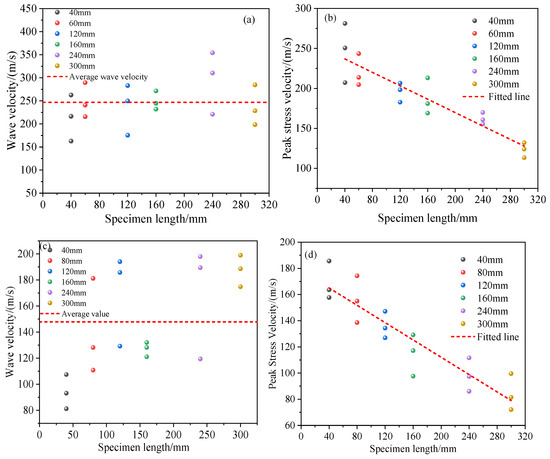
Figure 10.
Effect of EPS layer specimen length on stress wave propagation characteristics: (a) wave velocity in EPS cushion layer; (b) peak stress velocity in EPS cushion layer; (c) wave velocity in EPE cushion layer; and (d) peak stress velocity in EPE cushion layer.
Figure 11a,b show the propagation characteristics of the average wave velocity and peak stress velocity in the soil–EPS composite layer. The results indicate that as the soil length increases, the propagation velocity of the stress wave significantly decreases. For a 1:1 ratio, the average wave velocity is 246.7 m/s, while for the 2:1 and 3:1 ratios, the average velocities are 272.4 m/s and 283.6 m/s, respectively. Furthermore, the peak stress velocity increases linearly with the increase in the soil-to-EPS ratio. In the soil–EPE composite layer (Figure 11c,d), both the average wave velocity and peak stress velocity exhibit the same trend as in the soil–EPE composite layer. However, for the same ratios, both the average wave velocity and peak stress velocity are significantly lower. Compared to EPS, EPE foam has a softer structure and undergoes more complete compressive deformation, which allows it to dissipate shock energy more effectively, resulting in a more significant reduction in wave velocity. Fang and Liu [48] suggested that the peak stress velocity is typically treated as a constant without considering the effects of particle size. However, based on the results of the present analysis, peak stress velocity is shown to be dependent on specimen length and layer material properties. Thus, simplifying the peak stress velocity as a constant may underestimate the actual impact of the cushion layer on the shock response, which would be unsafe for engineering design.
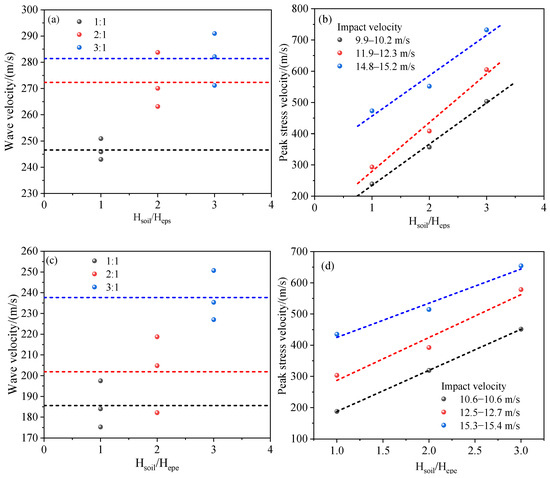
Figure 11.
Effect of composite cushion layer on stress wave propagation characteristics: (a) wave velocity in soil–EPS cushion layer; (b) peak stress velocity in soil–EPS cushion layer; (c) wave velocity in soil–EPE cushion layer; (d) peak stress velocity in soil–EPE cushion layer.
In SHPB experiments, as the stress wave propagates through the specimen, the amplitude of the stress wave experiences attenuation. Traditional wave theory primarily focuses on wave propagation velocity, waveform, and other characteristics, but lacks a quantitative description of wave amplitude attenuation. To address this, the attenuation coefficient is introduced to quantify the wave-shaping characteristics of the specimen. It is defined as follows:
where is the maximum stress at the transmission bar end and is the maximum stress at the incident bar end. reflects the specimen’s ability to attenuate the energy of the incident stress wave. A smaller value indicates stronger attenuation of the stress wave by the specimen, leading to a smaller amplitude of the transmitted wave.
For both EPS and EPE, the stress wave attenuation coefficient decreases exponentially with increasing specimen length (Figure 12a,b). In the case of EPS, when the specimen length is less than 50 mm, the attenuation coefficient decreases rapidly, indicating that most of the stress waves are either reflected or absorbed in EPS. As the specimen length increases beyond 100 mm, the transmission coefficient stabilizes, suggesting that the dissipation of stress waves by the cushion layer gradually saturates. For the same specimen length, a higher impact velocity results in a larger proportion of transmitted stress, showing that the attenuation effect in the medium is strain rate-sensitive. Figure 12b shows the relationship between the stress wave attenuation coefficient and specimen length for EPE material. Compared to the EPS medium, the relationship between the attenuation coefficient and specimen length is approximately the same. However, for specimens shorter than 50 mm, the attenuation coefficient of EPS is significantly higher than that of EPE. Moreover, in EPS, a larger thickness is required to reduce the attenuation coefficient to a level similar to that of EPE. Overall, under the same conditions, EPE foam exhibits a generally superior attenuation capacity compared to EPS foam, particularly under short-range and high-intensity impacts, demonstrating better cushioning performance for stress wave attenuation.
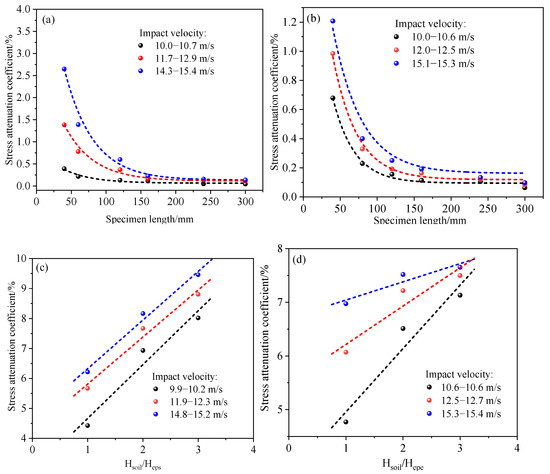
Figure 12.
Stress wave attenuation characteristics in different cushion layers: (a) EPS cushion layer; (b) EPE cushion layer; (c) soil–EPS cushion layer; and (d) soil–EPE cushion layer.
Figure 12c,d show the attenuation characteristics of stress waves in composite specimens. The results indicate that the attenuation coefficient increases with the soil-to-foam ratio, suggesting that as the proportion of soil increases, the specimen’s ability to attenuate stress waves decreases. Additionally, the impact velocity negatively correlates with the attenuation coefficient. Under the same soil-to-foam ratio, higher velocity results in a more compact specimen, leading to a larger attenuation coefficient. Comparing different composite specimens, the attenuation coefficient of the EPE composite layer is lower than that of the EPS composite layer, indicating that the former exhibits more significant attenuation of stress waves.
3.3. Laws of Energy Evolution and Dissipation
3.3.1. Characterization of Energy Evolution
In energy absorbing materials in protective structures, compression deformation and friction under impact loading are accompanied by energy transfer and conversion. The peak stress attenuation index can be used to quantify the changed characteristics of the compressive wave in granular materials. Additionally, the energy variation during the impact process can also describe the energy absorption characteristics of granular media. In the SHPB test, the incident energy WI, reflected energy WR, transmitted energy WT, and absorbed energy WS can be calculated using Equations (4)–(7) [49]:
where WI, WR, WT, and WS represent the incident energy, reflected energy, transmitted energy, and absorbed energy, respectively. AC and EC are the cross-sectional area and the elastic modulus of the bar, respectively. CC is the propagation velocity of the compressive stress wave in the bar. εI and εR are the incident and reflected strains, respectively, and εT is the transmitted strain. t represents time.
Figure 13 illustrates the variation in energy with time for a typical specimen during the SHPB test, reflecting the material’s energy absorption characteristics. During the test, incident energy rapidly increases with loading time and stabilizes after 0.032 ms. Both reflected and transmitted energies rise synchronously, but their amplitudes are much lower than that of the incident energy. Absorbed energy shows a continuous increase with time, indicating the specimen’s dissipation effect on incident energy. Furthermore, soil particles are a low wave impedance material, resulting in most of the incident energy being converted into reflected energy, with relatively small proportions of transmitted and absorbed energies.
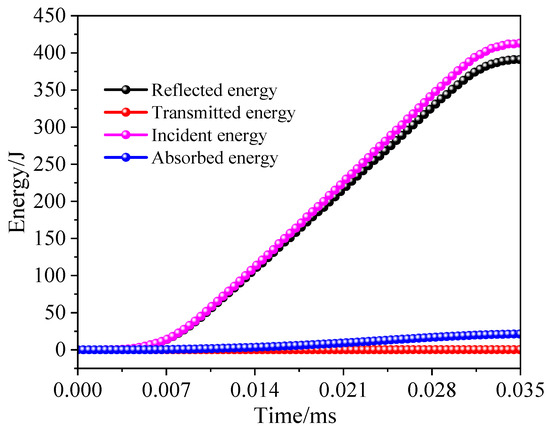
Figure 13.
Typical energy change time course curve.
3.3.2. Energy Dissipation Characteristics
Although the incident energy, reflected energy, and transmitted energy all increase with the impact velocity, the ratio of absorbed energy to the total energy entering the specimen can describe the material’s energy dissipation characteristics. According to the law of energy conservation, the energy absorption coefficient α is defined as:
where α is the energy absorption coefficient, is the absorbed energy, and and are the incident energy and reflected energy, respectively.
Figure 14a,b show the variation in the energy absorption coefficient with specimen length for EPS and EPE foam materials under different impact velocities. As the specimen length increases, the energy absorption coefficient increases and stabilizes once the specimen length exceeds 100 mm. This indicates that the material’s energy absorption effect rapidly diminishes within a certain propagation distance. Comparing the two materials, EPE exhibits a higher energy absorption coefficient than EPS under the same conditions, with a steeper increase in the curve, demonstrating superior energy dissipation properties.
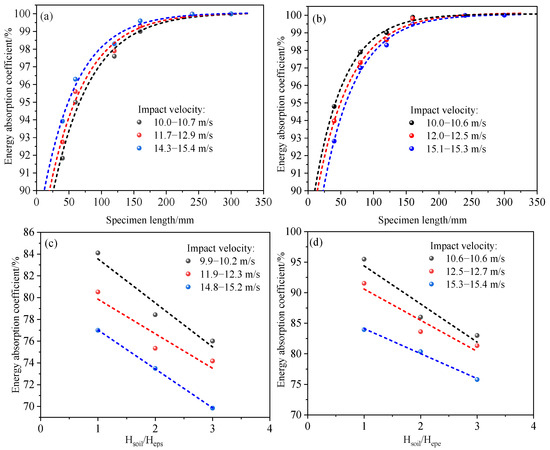
Figure 14.
Energy absorption coefficients in different cushion layers: (a) EPS cushion layer; (b) EPE cushion layer; (c) soil–EPS cushion layer; (d) soil–EPE cushion layer.
Figure 14c,d show the trend of the energy absorption coefficient with the soil-to-foam material ratio in composite specimens under different impact velocities. Overall, both composite specimens exhibit similar patterns. The energy absorption coefficient of the soil–EPE composite cushion layer is significantly higher than that of the soil–EPS composite cushion layer, especially when the soil-to-foam ratio is low, with the energy absorption coefficient of soil–EPE reaching nearly 95%, compared to around 84% for the soil–EPS layer. Additionally, the energy absorption coefficient decreases significantly as the soil proportion increases, indicating that the foam material plays the primary energy-dissipating role in the composite layer, with EPE performing better in energy absorption. In contrast, the energy absorption performance of the EPS layer decreases more significantly under higher soil proportions and increased impact velocities, with slightly lower stability.
The energy absorption density index is further used to reflect the energy dissipation characteristics of the specimens [50]:
where represents the energy absorption density, WS denotes the absorbed energy, and V is the sample volume. The energy absorption density is a measure of the material’s efficiency in absorbing impact energy. The higher its value, the greater the proportion of incident energy effectively absorbed by the material, indicating better energy absorption performance.
Figure 15a,b show that the energy absorption density significantly decreases with increasing foam specimen length and eventually stabilizes at a lower value. This indicates that shorter specimen segments can absorb more energy per unit volume, while as the length increases, the volume expands, but the energy absorption contribution from the added volume diminishes. Therefore, in practical engineering, infinitely increasing the cushion layer thickness has certain limitations in improving its energy dissipation capacity.
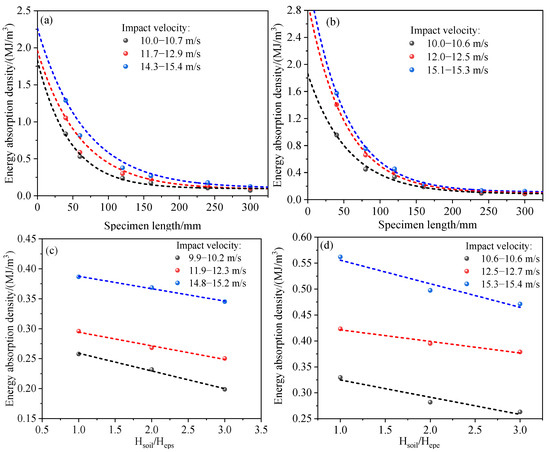
Figure 15.
Energy absorption density in different cushion layers: (a) EPS cushion layer; (b) EPE cushion layer; (c) soil–EPS cushion layer; and (d) soil–EPE cushion layer.
Figure 15c,d show the variation trends of energy absorption density for composite specimens under different impact velocities. The results indicate that for both soil–EPS and soil–EPE composite layers, the energy absorption density significantly decreases as the soil specimen length ratio increases. This suggests that as the soil content increases, the overall energy absorption capability of the material deteriorates. Therefore, although soil may provide some structural support, its inherently weak energy absorption capacity actually dilutes the energy absorption contribution of the foam.
3.3.3. Compression Properties of Foam
In the SHPB foam impact test, the degree of pore collapse can be quantified by comparing the initial density ρ0 and the final density ρf, revealing the dynamic energy dissipation characteristics and stress wave attenuation behaviors of different density foams. This provides a basis for evaluating their cushioning performance under high-velocity impact environments. The density variation ratio is defined as:
where ρ0 is the initial density of the specimen, ρf is the final density after impact, and represents the density variation ratio.
The results shown in Figure 16 indicate that the density variation ratio of EPS material significantly increases with the impact velocity. At impact velocities between 14.3 and 15.4 m/s, the density variation ratio of a 40 mm short specimen exceeds 100%, suggesting substantial compression. As the specimen length increases, the density variation ratio gradually decreases, especially at 300 mm, where it drops below 30%. This reflects a decline in the impact energy absorption and transmission capabilities of longer specimens, as well as a weakening of the compaction effect. In contrast, EPE material exhibits a similar trend, but the overall density variation ratio is lower than that of EPS. For example, under impact velocities of 15.1–15.3 m/s, the density variation ratio of a 40 mm EPE specimen is about 85%, lower than the over 100% observed for EPS, thus maintaining better structural integrity. Therefore, EPE can absorb some of the impact energy and achieve partial stress release through elastic deformation, making it suitable for engineering scenarios that require high cushioning repeatability and structural integrity.
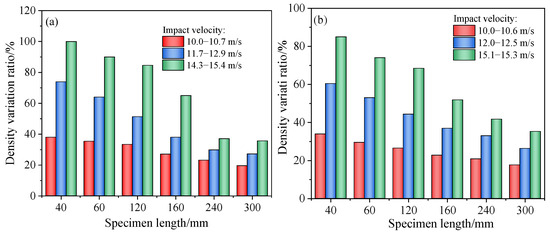
Figure 16.
Density variation ratio of specimens: (a) EPS cushion layer; and (b) EPE cushion layer.
Figure 17 compares the variations in the stress attenuation coefficient of EPS and EPE foams under different impact velocities and density variation ratio conditions. The results show that EPE foam consistently exhibits lower stress attenuation coefficients and superior energy absorption capabilities compared to EPS foam. The stress wave dissipation effect of EPE foam is more effective than that of EPS foam, with EPE displaying lower sensitivity to changes in impact velocity. Moreover, under the same impact velocity, the density variation ratio decreases as the specimen length increases. This is because longer specimens extend the stress wave propagation path, leading to a more uniform distribution of strain energy within the unit volume, which mitigates local compaction damage and reduces the density variation ratio. In EPE foam, longer specimens not only have smaller density variation ratios but also exhibit lower attenuation coefficients. In contrast, EPS foam is more prone to early collapse under shorter specimen lengths or higher impact velocities, leading to significantly higher transmitted stress, increased attenuation coefficients, and reducing energy absorption performance. In summary, EPE foam demonstrates superior energy dissipation and structural adaptability under various impact conditions, indicating its higher potential for engineering applications.
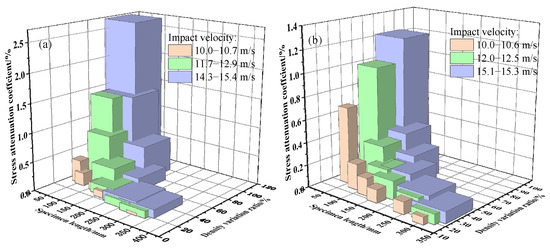
Figure 17.
Stress attenuation coefficient in foam: (a) EPS cushion layer; and (b) EPE cushion layer.
Figure 18 analyzes the variation trends of the energy absorption coefficient for EPS and EPE foams under different impact velocities and density variation ratio conditions. The energy absorption coefficient of EPE foam fluctuates very little with compression, while that of EPS foam decreases significantly as the density variation ratio increases. Under different impact velocities, EPE foam not only exhibits a higher overall energy absorption coefficient but also remains almost stable, with minimal influence from the density variation ratio. In contrast, EPS foam shows a noticeable decrease in the energy absorption coefficient at higher density variation ratios, particularly at higher impact velocities, indicating that the material is more prone to localized failure or stress concentration under large deformations. Furthermore, EPE foam maintains nearly 100% energy absorption at higher velocity ranges, while EPS foam experiences significant degradation under the same conditions. A similar trend is observed in the effect of density variation ratio on energy absorption density (Figure 19). Overall, EPE foam demonstrates better extensibility and structural recovery throughout the compression process, providing sustained energy absorption capacity and good deformation coordination, which makes it more suitable for applications under high-energy impact loads.
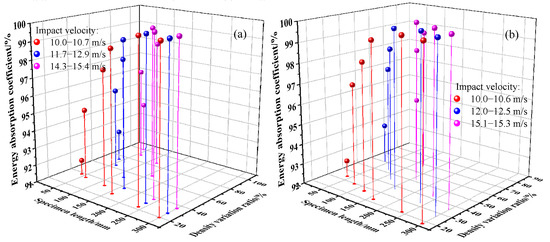
Figure 18.
Effect of density variation ratio on energy absorption coefficient: (a) EPS cushion layer; and (b) EPE cushion layer.
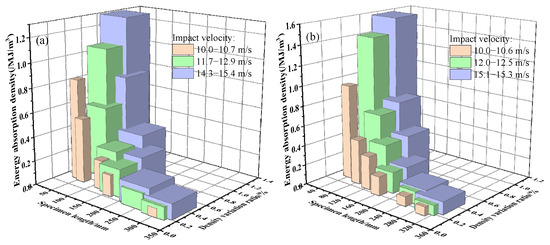
Figure 19.
Effect of density variation ratio on energy absorbing density: (a) EPS cushion layer; and (b) EPE cushion layer.
4. Conclusions
This study systematically investigates the dynamic response characteristics of EPS and EPE foams and their composite cushion layers with soil under impact loading, through SHPB experimental testing and energy evolution analysis. The main conclusions are as follows:
(1) In a single foam material structure, the average stress wave propagation velocity in EPE foam is 149.6 m/s, significantly lower than the 249.3 m/s in EPS foam, indicating stronger wave resistance in EPE. For the 40 mm specimen, the stress attenuation coefficient in EPE is as low as 0.22, compared to 0.31 in EPS at the same velocity. Additionally, in the 14.3–15.4 m/s velocity range, the density variation ratio for EPS can reach up to 100%, whereas EPE only reaches 87% under similar impact conditions. Therefore, EPE exhibits stronger plastic cushioning and structural stability, making it more suitable for energy dissipation under repeated impacts. It is recommended to use EPE instead of traditional EPS for structural design in engineering.
(2) The energy absorption effect of the soil–foam composite layer decreases as the proportion of soil increases. A higher foam proportion leads to more significant energy dissipation. When the foam-to-soil ratio is 1:1, the energy absorption coefficient of the soil–EPE composite structure reaches 94.7%, significantly higher than the 84% for the soil–EPS composite cushion layer. As the soil proportion increases to 1:2 and 1:3, the energy absorption coefficient decreases significantly, indicating that soil, while providing support, has limited energy dissipation capacity. A higher soil proportion weakens the overall energy absorption effect of the structure. Therefore, in practical engineering design, the foam layer should occupy at least 50% of the total volume to maximize energy absorption.
(3) As the foam specimen length increases from 40 mm to 300 mm, the stress wave propagation velocity continuously decreases, the peak stress response significantly weakens, and the energy absorption coefficient gradually increases. This indicates that increasing the thickness helps enhance wave attenuation and energy dissipation. However, the energy absorption density per unit volume decreases as the length increases, indicating that the additional volume contributes less to energy absorption. Longer foam layers extend the stress wave path and reduce local compaction. Thus, cushion layer thickness should not be arbitrarily increased. The relationship between foam thickness and energy absorption density should be optimized, considering impact energy, available space, and structural load capacity, to balance energy dissipation with structural dimensions and weight.
(4) The SHPB testing method employed in this study is suitable for investigating the dynamic behavior of different cushioning materials at high strain rates. However, the small size of the specimens does not fully account for the effects of specimen size and the influence of macroscopic structures on the overall response. Future research should integrate SHPB testing with large-scale model experiments to more comprehensively evaluate the dynamic protective performance of material systems under real engineering conditions.
Author Contributions
Conceptualization, J.G. and L.L.; methodology, X.M.; validation, D.L., J.W., and P.C.; formal analysis, J.W. and P.C.; investigation, D.L.; resources, D.L. and P.C.; data curation, D.L. and J.W.; writing—original draft preparation, D.L. and J.W.; writing—review and editing, P.C.; visualization, D.L. and J.W.; supervision, P.C. All authors have read and agreed to the published version of the manuscript.
Funding
This work was supported by the Natural Science Foundation of Inner Mongolia, China (Grant No. 2025MS05007), the Projects of the Guizhou Provincial Department of Transportation (Grant No. 2024-122-022), and the Projects of the Sichuan Provincial Department of Transportation (Grant No. 2022-A-1).
Institutional Review Board Statement
Not applicable.
Informed Consent Statement
Not applicable.
Data Availability Statement
Data are contained within the article.
Conflicts of Interest
Authors Dengfeng Li and Jianli Wu were employed by the China 19th Metallurgical Group Co., Ltd. Author Peng Cui was employed by the Shandong Energy Group Luxi Mining Co., Ltd. The remaining authors declare that the research was conducted in the absence of any commercial or financial relationships that could be construed as a potential conflict of interest.
References
- Li, X.M.; Wang, M.; GUO, X.; Yan, J.L.; Ying, C.P. Measurement of stress attenuation effect in the sand under explosion wave. Appl. Mech. Mater. 2014, 556–562, 3187–3190. [Google Scholar] [CrossRef]
- Yu, X.; Wang, J.R.; Zhou, B.K.; Chen, L.; Fang, Q. Experimental study on the mechanical behavior and energy absorption capacity of coral sand at high strain rates. Ocean Eng. 2024, 291, 116343. [Google Scholar] [CrossRef]
- Song, B.; Chen, W.W.; Luk, V. Impact compressive response of Dry sand. Mech. Mater. 2009, 41, 777–785. [Google Scholar] [CrossRef]
- US Department of the Army. Structures to Resist the Effects of Accidental Explosions: TM5-1300; US Department of the Army: Washington, DC, USA, 1990.
- Jia, J.X.; Tang, H.P.; Chen, H.J. Dynamic mechanical properties and energy dissipation characteristics of frozen soil under passive confined pressure. Acta Mech. Solida Sin. 2021, 34, 184–203. [Google Scholar] [CrossRef]
- Ma, Q.; Cao, Z. Experimental study on fractal characteristics and energy dissipation of stabilized soil based on SHPB test. J. Mater. Civ. Eng. 2019, 31, 04019264. [Google Scholar] [CrossRef]
- Yan, S.; Wang, Y.; Wang, D.P.; He, S.M. Application of EPS geofoam in rockfall galleries: Insights from large-scale experiments and FDEM simulations. Geotext. Geomembr. 2022, 50, 677–693. [Google Scholar] [CrossRef]
- Zhao, P.; Yuan, S.; Li, L.; Ge, Q.; Liu, J.; Du, L. Experimental study on the multi-impact resistance of a composite cushion composed of sand and geofoam. Geotext. Geomembr. 2021, 49, 45–56. [Google Scholar] [CrossRef]
- Ouyang, C.J.; Liu, Y.; Wang, D.; He, S.M. Dynamic Analysis of Rockfall Impacts on Geogrid Reinforced Soil and EPS Absorption Cushions. KSCE J. Civ. Eng. 2019, 23, 37–45. [Google Scholar] [CrossRef]
- Cui, P.; Luo, G.; Liu, L.; Cao Xi Li, B.; Mei, X. Experimental study on crushing characteristics and energy absorption effect of silica sand under dynamic loading. Explos. Shock. Waves 2025, 45, 093101. [Google Scholar] [CrossRef]
- Lv, Y.R.; Li, X.; Wang, Y. Particle breakage of calcareous sand at high strain rates. Powder Technol. 2020, 366, 776–787. [Google Scholar] [CrossRef]
- Bakken, J.; Slungaard, T.; Engebretsen, T.; Christensen, S.O. Attenuation of shock waves by granular filters. Shock Waves 2003, 13, 33–40. [Google Scholar] [CrossRef]
- Balan, S.G.; Raj, A.S. Impact load bearing and energy absorption in sandwich polymer composites: Projectile versus shock loadings. Results Eng. 2025, 25, 103815. [Google Scholar] [CrossRef]
- Wu, J.L.; Hu, X.W.; Mei, X.F. Dynamic response of a combined structure of falling stone impacted concrete slab and buffer layer. Hydrogeol. Eng. Geol. 2021, 48, 78–87. [Google Scholar]
- Guo, Q.; Gou, Y.; Chen, J. Dynamic response of foam concrete under low-velocity impact: Experiments and numerical simulation. Int. J. Impact Eng. 2020, 146, 103693. [Google Scholar] [CrossRef]
- Pan, Y.H.; Zong, Z.H.; QIAN H., M.; Huang, J.; Shan, Y.L. Experiment study on blast wave propagation in calcareous sand. Explos. Shock Waves 2023, 43, 1–15. [Google Scholar]
- Peila, D.; Oggeri, C.; Castiglia, C. Ground reinforced embankments for rockfall protection: Design and evaluation of full scale tests. Landslides 2007, 4, 255–265. [Google Scholar] [CrossRef]
- Wu, L.; Lyu, Y.R.; Zhang, S.; Din, S.C. Research progress and discussion on problems of sandy soil SHPB impact tests and numerical simulations. Rock Soil Mech. 2024, 45, 3461–3480. [Google Scholar] [CrossRef]
- Yu, X.; Chen, L.; Fang, Q. Experimental study on the attenuation of stress wave in coral sand. Chin. J. Rock Mech. Eng. 2018, 37, 1520–1529. [Google Scholar]
- Hampton, D.; Wetzel, R.A. Stress Wave Propagation in Confined Soils. IIT Res. Inst Chic. IL 1966, AFWL-TR-66-56. Available online: https://www.semanticscholar.org/paper/STRESS-WAVE-PROPAGATION-IN-CONFINED-SOILS-Hampton-Wetzel/8898a6a555062f1682757ae19d62278ccd6573dd (accessed on 6 September 2025).
- Schindler, L. Design and Evaluation of a Device for Determining the One-Dimensional Compression Characteristics of Soils Subjected to Impulse-Type Loads; Army Engineer Waterways Experiment Station: Vicksburg, MS, USA, 1968. [Google Scholar]
- Yu, X.; Chen, L.; Fang, Q. A testing method on the attenuation of stress waves in loose porous media and its application to coral sand. Eng. Mech. 2019, 36, 44–52. [Google Scholar]
- Lv, Y.; Ng, C.W.; Wang, Y. Evaluation of wave dissipation in sand under impact loading. J. Geotech. Geoenvironmental Eng. 2019, 145, 06019007. [Google Scholar] [CrossRef]
- Yu, X.; Chen, L.; Zhou, B. Discussion of “Evaluation of Wave Dissipation in Sand under Impact Loading” by Yaru Lv, Charles, W.W. Ng, and Yuan Wang. J. Geotech. Geoenviron. Eng. 2019, 145, 06019007. [Google Scholar]
- Cui, P.; Su, T.; Liu, L.; Wang, T.; Li, B.X.; Guan, X.T.; Mei, X.F. Characteristics of compression wave propagation and energy absorption effects in dry sandy soil. Sci. Rep. 2024, 14, 31625. [Google Scholar] [CrossRef]
- Prabhu, S.; Qiu, T. Simulation of split Hopkinson pressure bar tests on sands with low water content. J. Eng. Mech. 2020, 146, 04020082. [Google Scholar] [CrossRef]
- Prabhu, S.; Qiu, T. Modeling of sand particle crushing in split Hopkinson pressure bar tests using the discrete element method. Int. J. Impact Eng. 2021, 156, 103974. [Google Scholar] [CrossRef]
- Lv, Y.R.; Wu, L.; Zhang, S.; Ding, S.C. Macro and micro quantitative study on impact behavior of glass beads by SHPB tests and FEM-DEM coupling analysis. Eng. Mech. 2023, 40, 245–256. [Google Scholar]
- JTGT D70-2010; Guidelines for Design of Highway, Tunnel. Ministry of Transport of the People’s Republic of China: Beijing, China, 2010. Available online: https://www.doc88.com/p-7327311462091.html (accessed on 6 September 2025).
- Zhao, P.; Xie, L.Z.; He, B.; Zhang, Y. Experimental study of rock-sheds constructed with PE fibres and composite cushion against rockfall impacts. Eng. Struct. 2018, 177, 175–189. [Google Scholar] [CrossRef]
- Huang, B.K.; Kin, S.K.; Kim, J.H.; Kim, J.D.; Lee, J.M. Dynamic compressive behavior of rigid polyurethane foam with various densities under different temperatures. Int. J. Mech. Sci. 2020, 180, 105657. [Google Scholar] [CrossRef]
- Mazek, S.A.; Mostafa, A.A. Impact of a shock wave on a structure strengthened by rigid polyurethane foam. Struct. Eng. Mech. 2013, 48, 569–585. [Google Scholar] [CrossRef]
- De, A.; Morgante, A.N.; Zimmie, T.F. Numerical and physical modeling of geofoam barriers as protection against effects of surface blast on underground tunnels. Geotext. Geomembr. 2016, 44, 1–12. [Google Scholar]
- Gupta, N. A functionally graded syntactic foam material for high energy absorption under co repression. Mater. Lett. 2007, 61, 979–982. [Google Scholar] [CrossRef]
- Hu, J.; Sun, Q.; Wu, X.T. Numerical analysis of the anti-explosion properties of tunnel constructions with EPS geofoam inclusions of different density. Proective Eng. 2012, 34, 38–43. Available online: https://kns.cnki.net/kcms2/article/abstract?v=Y2E-z2Sa5CMREp4uuR0fBdO2V7BoDY0AFcWlTikysKIj33sTDlGWbxXroreKhz4RE7-xx1VoqprnGF0Ngt-zYleLm1Uv_t8gHfOhKP8hzY3AjXO0Lr5OlV1_B20T9ZGkqvPwLAYgTjbk3CNL2FmsFHV3EoxHs6j6ECQx4oRiSKwoo0xMkUJJXg==&uniplatform=NZKPT&language=CHS (accessed on 6 September 2025).
- Zhao, P.; Xie, L.; Li, L.; Liu, Q.; Yuan, S.X. Large-scale rockfall impact experiments on a RC rock-shed with a newly proposed cushion layer composed of sand and epe. Eng. Struct. 2018, 175, 386–398. [Google Scholar]
- Hani, M.; Wang, D.P.; Yan, S.X.; Stéphane, L.; Chen, Y.H.; Qi, D. Optimization and performance analysis of novel waste EPS bead-sand composite cushions for rockfall mitigation: An integrated experimental and numerical study. Geotext. Geomembr. 2025, 53, 1314–1331. [Google Scholar]
- Wu, J.; Ma, G.; Zhou, Z.; Mei, X.F.; Hu, X.W. Experimental Investigation of Impact Response of RC Slabs with a Sandy Soil Cushion Layer. Adv. Civ. Eng. 2021, 2021, 1562158. [Google Scholar] [CrossRef]
- Ren, F.; Liu, J.; Huang, Q.; Ding, H.; Hu, Z.; Wang, G. Experimental study on the buffering mechanism of EPS bead-sand cushions under single and multiple impacts. Geoenviron. Disasters 2024, 11, 31. [Google Scholar] [CrossRef]
- Alaie, R.; Chenari, R.J. Dynamic Properties of EPS-Sand Mixtures Using Cyclic Triaxial and Bender Element Tests. Geosynth. Int. 2019, 26, 563–579. [Google Scholar] [CrossRef]
- Bhatti; Qadir, A. Computational Modeling of Energy Dissipation Characteristics of Expanded Polystyrene (EPS) Cushion of Reinforce Concrete (RC) Bridge Girder Under Rockfall Impact. Int. J. Civ. Eng. 2018, 16, 1635–1642. [Google Scholar] [CrossRef]
- Özgür, A.; Erdem, R.T.; Kantar, E. Improving the impact behavior of pipes using geofoam layer for protection. Int. J. Press. Vessel. Pip. 2015, 132–133, 52–64. [Google Scholar] [CrossRef]
- Wang, D.P.; Zhou, L.K.; Pei, X.J.; Huang, R.Q.; Liu, X.R. Experimental and numerical study on rockfall impacts on sand-soil cushions. J. Vib. Shock 2020, 39, 195–202. [Google Scholar]
- Pham, T.T.; Kurihashi, Y.; Masuya, H. Impact response of reinforced concrete beam with cushion using finite-element analysis. Case Stud. Constr. Mater. 2022, 17, e1147. [Google Scholar] [CrossRef]
- GB/T 50123–2019; Standard for Geotechnical Testing Method. Ministry of Housing and Urban-Rural Development of the People’s Republic of China : Beijing, China; Planning Press: Beijing, China, 2019.
- Sarmientom, A.M.; Guzman, H.L.; Morales, G. Expanded Polystyrene (EPS) and Waste Cooking Oil (WCO): From Urban Wastes to Potential Material of Construction. Waste Biomass Valorization 2016, 7, 1245–1254. [Google Scholar] [CrossRef]
- Tan, Y. Preparation and Properties of Room Temperature Vulcanized Silicone Foam Packaging Material. Ph.D. Thesis, Hunan University of Technology, Zhuzhou, China, 2020. Available online: https://kns.cnki.net/kcms2/article/abstract?v=Y2E-z2Sa5COK4_fBFkgt42UT6jokDbeDkS48CZDWwAegs3Qx2gjGY94YMgVSCASdpeoPIoDuQEAHokQByNg-23pWZwohr17z1zaCFJqX0KYtRQboinonr1aFGqOOVnC23eGjjWq1tHi3UfWBnFK3C9IkKBKal2EQGFjnwRC0scm2aW7jsLBBQ6n1WDTDg7SN&uniplatform=NZKPT&language=CHS (accessed on 6 September 2025).
- Fang, Q.; Liu, J.C. Underground Protective Structure; China Water and Power Press: Beijing, China, 2010. [Google Scholar]
- Fu, T.; Zhu, Z.; Cao, C. Simulating the dynamic behavior and energy consumption characteristics of frozen sandy soil under impact loading. Cold Reg. Sci. Technol. 2019, 166, 102821. [Google Scholar] [CrossRef]
- Yu, T.X.; Lu, G.X. Energy Absorption of Structures and Materials; Chemical Industry Press: Beijing, China, 2006. [Google Scholar]
Disclaimer/Publisher’s Note: The statements, opinions and data contained in all publications are solely those of the individual author(s) and contributor(s) and not of MDPI and/or the editor(s). MDPI and/or the editor(s) disclaim responsibility for any injury to people or property resulting from any ideas, methods, instructions or products referred to in the content. |
© 2025 by the authors. Licensee MDPI, Basel, Switzerland. This article is an open access article distributed under the terms and conditions of the Creative Commons Attribution (CC BY) license (https://creativecommons.org/licenses/by/4.0/).