Article

Frost Resistance and Life Prediction of Waste Polypropylene Fibre-Reinforced Recycled Aggregate Concrete

1
Department of Civil Engineering, School of Civil Engineering and Geomatics, Shandong University of Technology, Zibo 255000, China
2
China Design Testing Technology Co., Ltd., Nanjing 210000, China
3
Department of Civil Engineering, School of Higher-Educational Engineering Research Centre for Intelligence and Automation in Construction, Huaqiao University, Xiamen 361021, China
4
Department of Engineering and Management, International College, Krirk University, No. 3 Soi Ramintra 1, Ramintra Road, Anusaowaree, Bangkhen, Bangkok 10220, Thailand
*
Authors to whom correspondence should be addressed.
Coatings 2025, 15(9), 1070; https://doi.org/10.3390/coatings15091070
Submission received: 20 August 2025 / Revised: 2 September 2025 / Accepted: 10 September 2025 / Published: 11 September 2025

Abstract

The inherent defects of recycled coarse aggregate (RCA) lead to poor frost resistance in recycled aggregate concrete (RAC), limiting its application in cold coastal regions. Waste polypropylene fibre (WPF), utilized as a reinforcement material, can improve the frost resistance of RAC. This study systematically analyzes the influence of WPF on the frost resistance of RAC and establishes a life prediction model. The results indicate that the damage to concrete in a saline freeze–thaw environment is significantly greater than that in a freshwater environment. WPF mitigates the development of freeze–thaw damage in RAC effectively by bridging microcracks and segmenting interconnected pores, thereby optimizing the pore structure and enhancing the matrix compactness. After 125 freeze–thaw cycles, the attenuation amplitude of the relative dynamic elastic modulus (RDEM) for RAC incorporated with WPF decreased by 9.69% and 5.77% in freshwater and saline environments, respectively, while the compressive strength increased by 20.65% and 18.57%. Concurrently, the negative mass growth rate of RAC in freshwater decreased by 20.62%, and the mass loss in the salt solution decreased by 5.84%. Furthermore, life predictions based on both RDEM and the compressive strength loss rate demonstrate that WPF extends the service life of RAC. Notably, the RDEM-based prediction yields a longer life but corresponds to a larger strength loss, whereas the prediction based on the compressive strength loss rate, although slightly shorter, corresponds to a more stable residual strength.

1. Introduction

With the continuous advancement of global urbanization, the demand for natural aggregates in the construction industry has increased significantly, triggering a series of serious problems such as over-exploitation of natural sand and gravel resources, deterioration of the ecological environment, and depletion of mineral resources [1,2]. Concurrently, the production of construction and demolition waste (CDW) generated from building demolition and construction activities has increased dramatically. It is projected that annual CDW production in the United States will reach 330 million tons from 2022 to 2026 [3]. Meanwhile, China’s annual CDW production has already reached a staggering 2.4 billion tons [4]. Faced with such massive quantities of CDW, traditional landfill disposal methods not only encroach upon valuable land resources but also pose potential risks of soil and groundwater contamination. This makes the resource utilization of CDW a critical challenge that must be addressed to achieve sustainable development [5]. Against this backdrop, recycled aggregate concrete (RAC) technology has emerged. This technology processes CDW into recycled coarse aggregate (RCA) to replace natural coarse aggregate (NCA), demonstrating significant environmental benefits in reducing natural resource consumption, lowering carbon emissions, and alleviating landfill pressure [6,7].
Concrete structures located in mid-to-high latitude cold regions are universally subjected to freeze–thaw damage [8]. This issue is particularly prominent in offshore and coastal engineering, where freeze–thaw damage in saline environments is characterized by more severe, deeper, and faster deterioration [9]. Consequently, frost resistance and its performance in saline environments are key indicators for evaluating the durability and service life of concrete. However, compared to natural aggregate concrete (NAC), RAC exhibits significantly degraded mechanical properties and frost resistance due to the high porosity, high water absorption, and complex multi-interface transition zone (ITZ) structure resulting from the residual old mortar adhered to the RCA surface. This degradation constrains the wider application of RAC [2]. Research has indicated that incorporating RCA reduces the frost resistance of concrete, and the degree of performance deterioration has intensified with increasing RCA replacement ratios and the accumulation of freshwater freeze–thaw cycles [10,11]. Notably, studies by Bogas et al. have presented a contrasting view, suggesting that the higher permeability of RCA could potentially improve the frost resistance of RAC [12].
In a saline freeze–thaw environment, the trends of decreasing compressive strength and relative dynamic elastic modulus (RDEM) of RAC with increasing freeze–thaw cycles are consistent with those observed in a freshwater environment, but the damage caused by freeze–thaw in salt solution is more severe [13]. After 125 freeze–thaw cycles, the compressive strength loss rates of RAC in saline and freshwater environments were 36.70% and 22.89%, respectively, significantly higher than those of NAC at 9.78% and 9.13% [14]. This difference is primarily attributed to the greater initial defects in RAC. Cl penetration not only lowers the freezing point of pore water and increases the degree of saturation but also generates osmotic pressure. The combined action of osmotic pressure, salt crystallization pressure, and ice crystal expansion pressure creates a multi-directional destructive stress field, accelerating the material deterioration process [15,16]. The freeze–thaw cycles themselves also significantly accelerate the transport of salt solution within the concrete, further exacerbating the increase in internal Cl concentration and the deterioration of the pore structure [17]. As the number of freeze–thaw cycles gradually increases, porosity increases, small pores degenerate into larger ones, and the number of connected pores rises [18]. This continuously deteriorating pore structure directly leads to a decline in the macro-mechanical properties of concrete and a significant increase in permeability. When the number of freeze–thaw cycles in salt solution reached 300, the concrete exhibited severe external damage: new cracks were initiated, propagated, and connected along pores and interface zones in the outer section, leading to aggregate spalling from the surface inward [19].
To improve the frost resistance of RAC, researchers have conducted extensive studies and achieved certain results. For instance, methods such as reducing the water–cement ratio, optimizing the screening and processing techniques for recycled aggregates, and rationally using air-entraining agents have all been demonstrated to enhance the frost resistance of RAC to some extent [20,21,22,23]. In recent years, fibre-reinforced concrete technology has attracted widespread attention due to its potential in inhibiting crack initiation and propagation and improving material toughness. Researchers have attempted to enhance the frost resistance and other comprehensive properties of concrete by incorporating fibres. Studies show that fibre incorporation can effectively improve the performance of concrete under freeze–thaw conditions. Various fibres, such as steel, basalt, and glass fibres, primarily function through mechanisms like crack bridging, pore refinement, and matrix densification [24][25,26,27,28]. Among these, polypropylene fibre (PPF) has become a research hotspot due to its characteristics of being lightweight, having strong chemical inertness, having good flexibility, and easily mixing with concrete. PPF can effectively inhibit the development of microcracks and surface scaling in concrete, thereby enhancing frost resistance, reducing strength loss, improving impermeability and resistance to freeze–thaw damage in salt solution, while simultaneously enhancing flexural and splitting tensile strength [29,30,31].
Specifically, recent research has focused on utilizing waste textiles (such as carpets) to prepare waste polypropylene fibre (WPF) for engineering applications, aligning with reverse management in the textile industry and the principles of a circular economy [32,33,34]. Compared to virgin PPF, WPF not only alleviates resource shortages and environmental pressure but also demonstrates significant potential in enhancing concrete durability. Studies indicate that WPF can reduce freeze–thaw damage, drying shrinkage, and the Cl penetration coefficient by 47%, 79%, and 50%, respectively, effectively extending the service life of concrete [32,33]. However, existing research has predominantly focused on the frost resistance improvement of NAC or within a single freeze–thaw environment. Investigations into the frost resistance of waste polypropylene fibre-reinforced recycled aggregate concrete (FRAC) under freeze–thaw conditions in salt solution remain relatively scarce, particularly regarding the mechanism of fibre action on the multiple ITZs within RAC. Furthermore, while Cui et al. [33] studied frost resistance and life prediction of recycled brick aggregate concrete with WPF, their work primarily utilized brick-based recycled aggregates and focused on a single freeze–thaw medium. In contrast, the present study employs conventional concrete-sourced RCA, systematically compares performance in both saline and freshwater environments, and specifically investigates the role of WPF in mitigating damage within the complex multi-ITZ structure of RAC. Moreover, most existing life prediction models use a 60% reduction in RDEM as the failure criterion [33]. However, the synergistic damage from freeze–thaw in salt solution and the heterogeneity of recycled materials may alter this critical value, leading to prediction deviations. Therefore, a dual-parameter approach considering both RDEM and compressive strength loss rate is necessary for more accurate and conservative life assessment.
To address these research gaps, the present study systematically evaluates the improvement effect of WPF on the frost resistance of RAC in both saline and freshwater environments, reveals its enhancement mechanism particularly at the multi-ITZs, and proposes novel life prediction models based on both RDEM and compressive strength loss rate. This work aims to provide a theoretical basis for the durability design and life assessment of RAC structures in cold coastal regions, promoting the resource utilization of CDW and the development of high-performance, low-carbon building materials.

2. Experimental Materials and Methods

2.1. Raw Materials

The coarse aggregates used in this study were recycled coarse aggregate (RCA) and natural coarse aggregate (NCA) with a continuous gradation of 5–26.5 mm. The RCA was sourced from construction and demolition waste (CDW) of a demolition project in Zibo City and prepared through mechanical crushing, sieving, and grading processes. The NCA was conventional crushed stone. The performance indices of the coarse aggregates complied with the technical requirements of JGJ 52-2006 [35]. It is worth noting that the continuous gradation of 5–26.5 mm for coarse aggregates was chosen to achieve a dense particle packing structure, minimizing the void content and improving the overall compactness of the concrete, which is especially critical for frost resistance.
Manufactured sand produced by a dry grinding process was selected as the fine aggregate, with a particle size distribution of 0–5 mm and a fineness modulus of 2.8, classifying it as medium sand. The appearance and morphology of the aggregates and their gradation curves are shown in Figure 1 and Figure 2, respectively. The main physical properties of the coarse aggregates are shown in Table 1.
The cementitious material was Shanlv brand P·O 42.5 ordinary Portland cement produced by Shandong Zibo Shanlv Cement Co., Ltd. in China. Its physical property indices are listed in Table 2. Tap water from the municipal supply network was used as the concrete mixing water. The water quality met the requirements for mixing water specified in JGJ 63-2006 [36] and was left standing for 24 h before use to eliminate the effect of residual chlorine. The admixtures employed were a composite polycarboxylic acid high-efficiency water-reducing agent and a concrete air-entraining agent.
Discarded polypropylene fibre (PPF) carpets were selected as the source material for the test fibres. The fibre material for testing was prepared through manual processing. After the raw fibre material underwent disassembly and sorting, it was successively subjected to pre-treatment processes of cleaning, disinfecting, and natural air-drying. Subsequently, manual sorting and precise cutting processes were employed to control the fibre bundle length parameter (19 mm), ultimately yielding fibre material that met the test requirements. The relevant performance parameters of the waste polypropylene fibre (WPF) are listed in Table 3. The specific processing flow chart for the WPF is shown in Figure 3.
The release agent for freeze–thaw testing was selected in compliance with the relevant provisions of GB/T 50082-2024 [38]. This standard explicitly prohibits the use of hydrophobic release agents. Therefore, the F-198 hydrophilic release agent was selected for the tests. Its active ingredients are polymeric organic compounds with a pH value of 6–8 (in a 1% aqueous solution). Before use, it was prepared as an aqueous solution at a 1:1 volume ratio and brushed onto the mold surfaces.

2.2. Mix Proportion Design

The concrete mix proportions were designed according to the technical specifications of JGJ55-2011 [39]. Due to the high water absorption of RCA, which can lead to mixing water loss and reduced slump during pouring while also exacerbating shrinkage crack formation during the curing period, additional water was incorporated to compensate for water loss to maintain concrete workability and test reliability. Specifically, additional water equivalent to 85% of the 24 h water absorption of the pre-dried RCA (3.5%, see Table 1) was added in the RAC and FRAC mixes [40].
Previous studies have shown that excessive fibre content or excessive fibre length readily leads to fibre agglomeration, forming fibre bundles. Therefore, based on multiple preliminary experiments and existing research, this study determined fibre parameters that are relatively easy to disperse (length 19 mm, volume fraction 0.12%) [41,42]. The final concrete mix proportions obtained through trial mixing are shown in Table 4. Herein, NAC denotes natural aggregate concrete, while RAC and FRAC represent recycled aggregate concrete and waste polypropylene fibre-reinforced recycled aggregate concrete, respectively.

2.3. Specimen Preparation

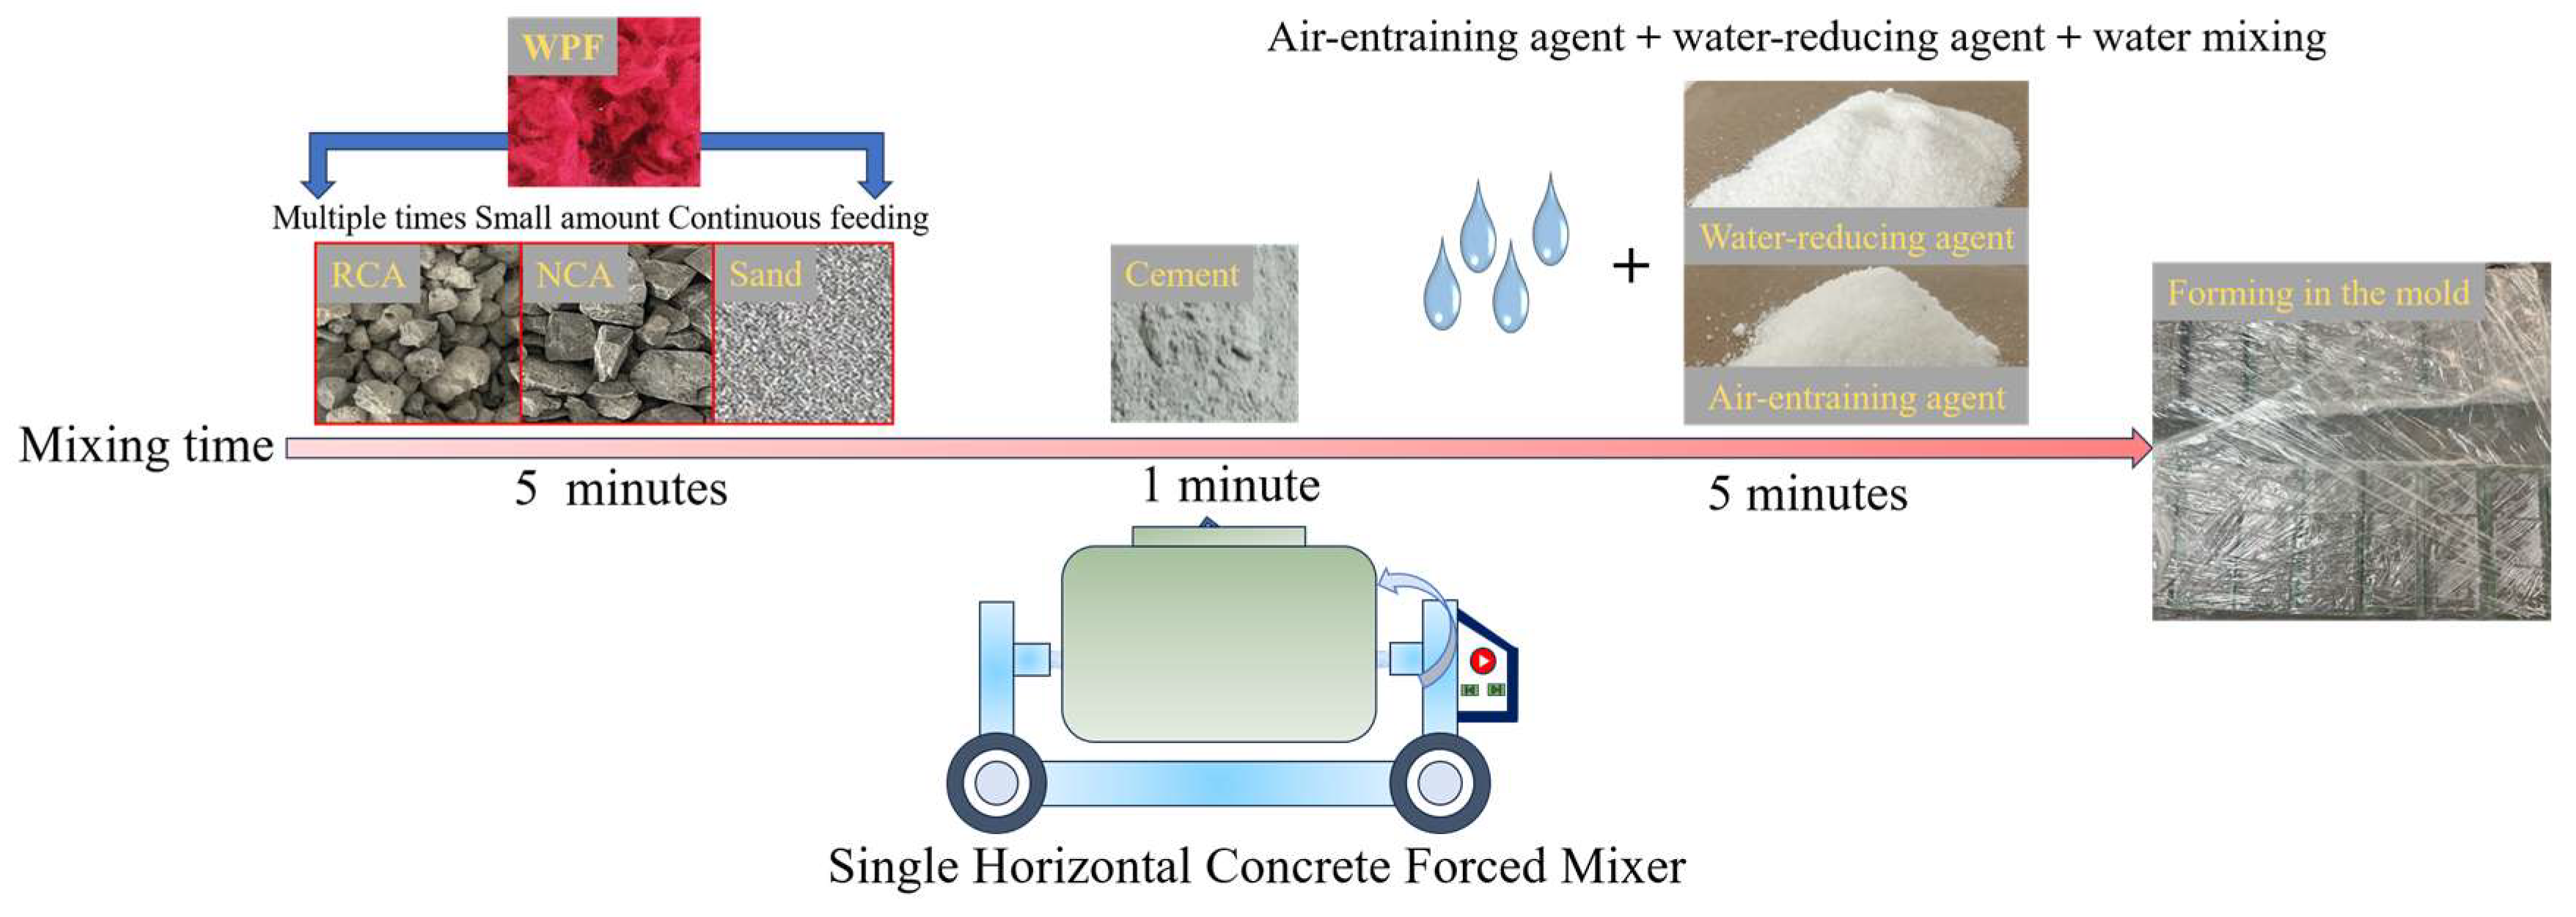
To ensure uniform distribution of fibres during mixing with concrete, the dry mixing method was adopted in this test. The specific procedure is shown in Figure 4.
According to the provisions of GB/T 50476-2019 [43], two standard specimen sizes were used: cube specimens measuring 100 mm × 100 mm × 100 mm for testing compressive strength changes before and after freeze–thaw cycles, and prism specimens measuring 100 mm × 100 mm × 400 mm for determining mass loss rate and relative dynamic elastic modulus (RDEM). Three parallel specimens were prepared for each group. The specimen grouping design scheme is shown in Table 5. After casting, the specimens were covered with curing membranes. They were demolded after 24 h of curing and subsequently placed in a standard concrete curing room with a relative humidity of 95% and a temperature of 20 ± 2 °C for 28 days of curing before testing.

2.4. Testing Methods

The test procedure for this study is shown in Figure 5 and mainly comprises the following three parts: specimen preparation, macroscopic testing, and microscopic testing. The specific testing methods are described below.

2.4.1. Freeze–Thaw Cycle Test

The freeze–thaw cycle test employed the “rapid freezing method”. The freeze–thaw equipment was a KDR-V9 concrete rapid freeze–thaw cycling testing machine, produced by Beijing Road Construction Science Instrument Co., Ltd. in China. Following the specifications of GB/T 50082-2024 and relevant research [13,15,38], concrete specimens cured for 28 days underwent rapid freeze–thaw testing. The specific procedure was as follows: Specimens were removed from the curing room 4 days before the test. After screening for qualified specimens, they were immersed in freshwater or salt solution maintained at 20 ± 2 °C, with the liquid level 20–30 mm above the top surface of the specimen. After 4 days, the specimen surfaces were dried, and the initial mass and RDEM were measured. During the test, the same type of solution was injected into the specimen container, maintaining a liquid level 5 mm above the top surface of the specimen. The temperature-controlled specimens were placed in the core area of the freeze–thaw chamber. After sensor calibration, the testing instrument was activated. The freeze–thaw cycle parameters were controlled to meet the following requirements: a single cycle duration of 2–4 h (with the thawing duration accounting for ≥25% of the total), the specimen center temperature strictly limited to the range of −18 ± 2 °C (minimum low temperature) to 5 ± 2 °C (maximum high temperature), the time taken for the temperature to decrease from 3 °C to −16 °C and the time for the reverse heating both exceeding 50% of the duration of the corresponding phase, and the phase transition time ≤10 min.

2.4.2. Mass Loss Rate Test

The mass loss rate can be used for quantitative analysis of the degree of surface scaling in concrete [44]. The masses of specimens in each group were measured using an electronic platform balance with an accuracy of 0.1 g. The mass loss rates were calculated according to Equation (1). The average value of the calculation results from three specimens was taken as the test result:
W n = W 0 W n W 0 × 100 %
where w0 is the initial mass of the specimen before freeze–thaw cycles (g); wn is the mass of the specimen after n freeze–thaw cycles (g).

2.4.3. RDEM Test

The RDEM of specimens reaching the target number of freeze–thaw cycles were tested using a DT-20 dynamic elastic modulus tester produced by Beijing Zhongke Dongchen Technology Co., Ltd., China. The RDEM of concrete was calculated according to Equation (2). The average value of the calculation results from three specimens was taken as the test result:
P n = f n 2 f 0 2 × 100 %
where f0 is the transverse fundamental frequency of the specimen before freeze–thaw cycles; fn is the transverse fundamental frequency after n freeze–thaw cycles.

2.4.4. Compressive Strength Test

The compressive strength test was conducted using an HYE-2000 microcomputer-controlled electro-hydraulic servo pressure testing machine produced by Hebei Sanyu Testing Machine Co., Ltd. in China. Testing was performed according to GB/T 50081-2019 [45]. Continuous and uniform vertical loading was maintained during the test at a loading rate of 0.5 MPa/s to determine the compressive strength of concrete cubes after different numbers of freeze–thaw cycles. The compressive strength of concrete was calculated according to Equation (3). It is important to note that due to size limitations of the freeze–thaw specimen containers, this study used 100 mm × 100 mm × 100 mm cube specimens for testing. In accordance with the provisions of GB/T 50081-2019 [45], the calculation results were multiplied by a size conversion factor of 0.95, and the average value of the strengths from three specimens was taken as the final test result.
f c u = 0.95 × F A
where fcu is the cube compressive strength (MPa); F is the failure load of the specimen (N); A is the bearing area of the specimen (mm2).
Based on Equation (3), the compressive strength loss rate for each specimen group was further calculated according to Equation (4):
f c u ( n ) = f c u , 0 f c u , n f c u , 0 × 100 %
where △fcu(n) is the compressive strength loss rate after n freeze–thaw cycles (%); fcu,0 is the initial compressive strength before any freeze–thaw cycles (MPa); fcu,n is the compressive strength after n freeze–thaw cycles (MPa).

2.4.5. Scanning Electron Microscopy (SEM) Test

This study used a Sirion 200 SEM produced by FEI Company in Oregon, USA, to scan RAC and FRAC specimens after the freeze–thaw cycles. Sample blocks were cut from the core of the tested specimens to avoid edge effects, with a specific focus on areas containing the interface transition zone (ITZ) between aggregate and mortar. These samples were then dried, and sputter-coated with a thin layer of gold to ensure electrical conductivity. The scanning acceleration voltage ranged from 0.2 to 30 kV, and the image resolution was 1.5 nm.

3. Results and Analysis

3.1. Evolution of Apparent Damage

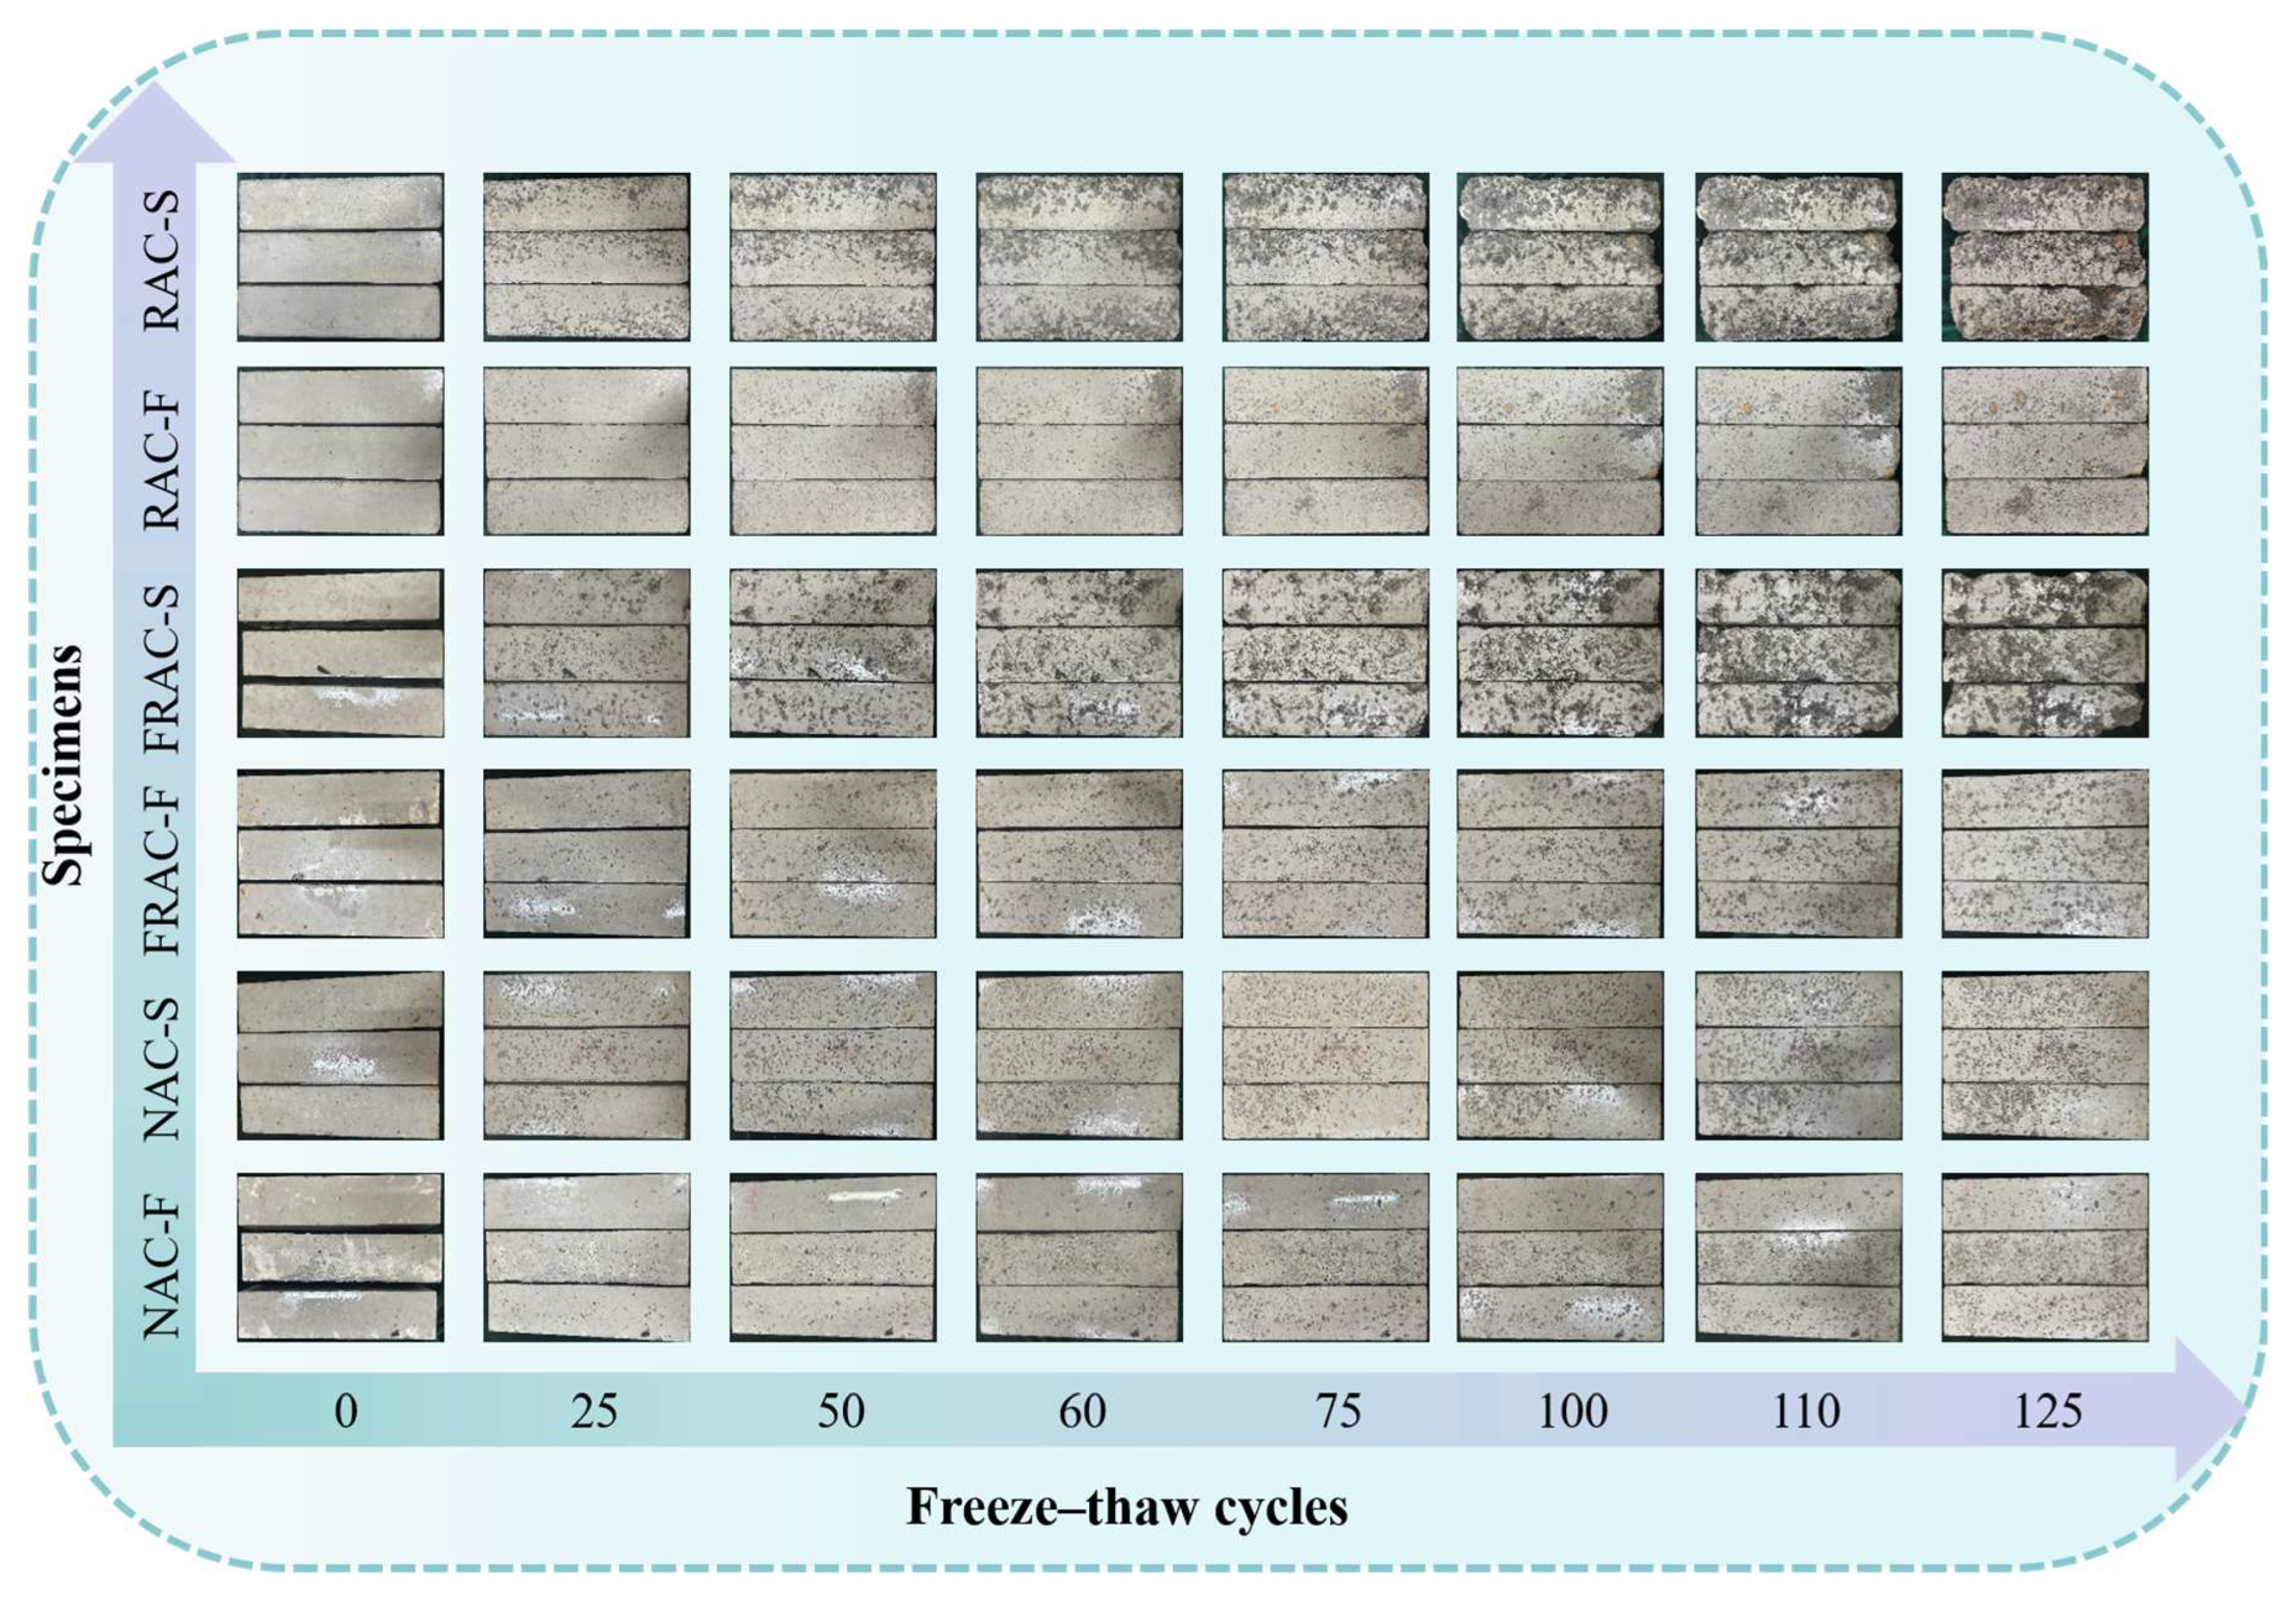
The apparent morphological characteristics of concrete specimens from each group after freeze–thaw cycles are shown in Figure 6. Before testing, all specimen surfaces were dense and smooth, showing no significant differences. With increasing freeze–thaw cycles, surface damage to the concrete continuously intensified, and its deterioration process can be divided into three stages: (1) Initial deterioration stage (0 < freeze–thaw cycles ≤ 25)—pits appeared on the concrete surface accompanied by surface mortar spalling, making the entire specimen very rough. (2) Damage propagation stage (25 < freeze–thaw cycles ≤ 75)—as the number of freeze–thaw cycles increased, the size of surface pits enlarged and connected, leading to large-area mortar spalling; the specimen surface became distinctly pitted and uneven; some aggregates were exposed and exhibited edge/corner defects. (3) Severe damage stage (freeze–thaw cycles > 75)—the degree of aggregate exposure and edge/corner defects increased dramatically. Because the corners of the concrete have the largest contact area with the freeze–thaw environment, their damage was the most severe. After 125 freeze–thaw cycles, more severe aggregate spalling occurred at the corners, exposing internal mortar and aggregates, severely compromising the integrity of the specimens. It is noteworthy that concrete subjected to freeze–thaw cycles in freshwater exhibited overall lighter damage without severe apparent deterioration. In contrast, damage was significantly exacerbated in the saline environment. This is attributed to the combined effect of non-uniform phase transition of ice crystals and salt crystallization precipitation, triggered by the elevated degree of saturation from the salt solution, which produced superimposed expansion stresses [9,14]. Furthermore, NAC demonstrated the best apparent integrity in both environments. This is because its raw materials possess higher compactness and superior frost resistance, enabling effective resistance to freeze–thaw damage.
The comparison in Figure 6 reveals that the incorporation of WPF effectively reduced the apparent damage in RAC. After experiencing the same number of freeze–thaw cycles, the amount of surface mortar and aggregate spalling in FRAC was significantly lower. WPF formed a three-dimensional network within RAC. When freeze–thaw cycles induced microcrack initiation, the fibres bridging the crack sides exerted a bridging effect. This bridging action effectively inhibited the occurrence and propagation of cracks, dispersing the concentrated stress at the crack tip and transferring it to the surrounding concrete matrix [46]. WPF segmented large pores, refined the pore structure of the matrix, and blocked potentially interconnected microcracks. This restricted the migration of water between pores and the continuous growth of ice crystals, thereby significantly weakening the frost heave pressure and inhibiting the development of macro-damage and the spalling of surface mortar [47,48]. Furthermore, the improvement effect of WPF on apparent damage was more pronounced in the saline environment. In the early stage of freeze–thaw in salt solution, the surface of RAC without WPF exhibited densely pitted surfaces with concentrated spalling. In contrast, after incorporating WPF, the damage manifested as discrete pits with dispersed spalling. In the later stage of freeze–thaw in salt solution, RAC without WPF showed large areas of exposed aggregates and severe edge/corner damage. Comparatively, RAC incorporating WPF exhibited significantly reduced overall damage severity. However, in the freshwater freeze–thaw environment, where the damage level itself was lighter, RAC did not exhibit severe apparent damage, regardless of whether WPF was incorporated.

3.2. Mass Loss Rate

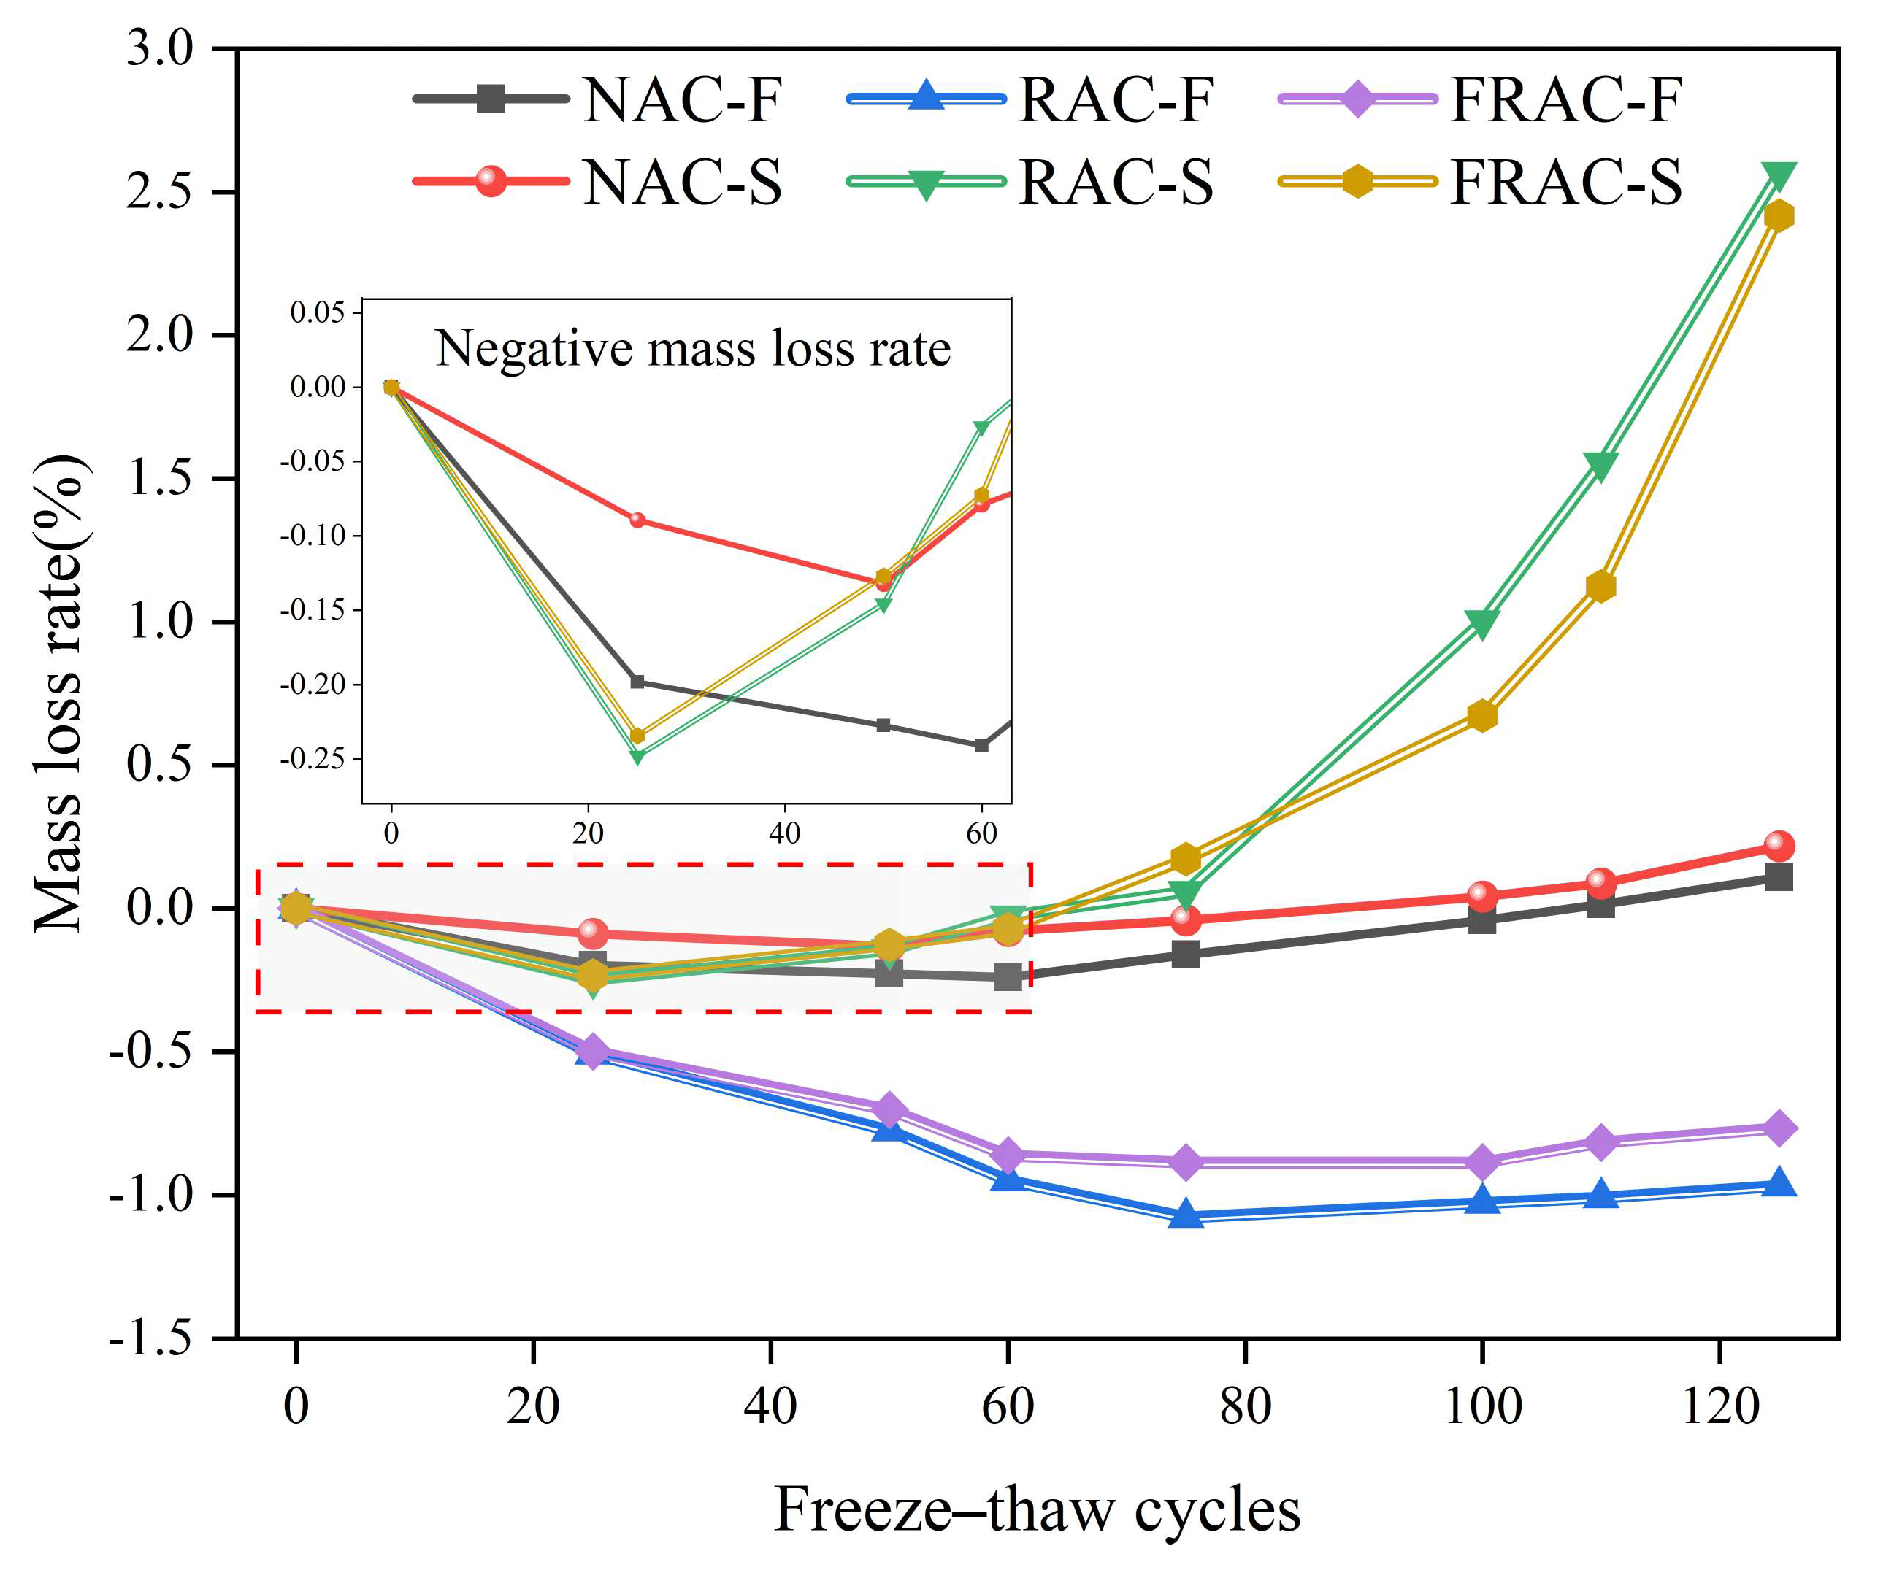
The relationship between the mass loss rate and the number of freeze–thaw cycles for each group of specimens is shown in Figure 7. As the number of freeze–thaw cycles increased, all specimen groups exhibited a trend of initial decrease (including negative values, indicating mass gain) followed by an increase in mass loss rate, which is consistent with literature reports [49,50]. The negative mass loss rate, i.e., mass gain, occurred despite pre-soaking because the specimens were not fully saturated at the start of the test. Early freeze–thaw cycles promoted the development and interconnection of microcracks, facilitating the infiltration of external solution into these newly formed micropores. This ingress of water contributed temporarily to mass gain, outweighing the limited mortar spalling at this stage. The subsequent increase in loss rate was due to the increasing number of freeze–thaw cycles exacerbating surface mortar spalling of the specimens, where the resulting mass loss surpassed the compensatory effect of solution infiltration [13]. It is worth noting that including mass gain in the analysis is relevant for frost damage assessment, as it provides insight into early micro-damage development prior to macroscopic material loss. The presence of this phase underscores the importance of considering both mass gain and loss to fully understand the deterioration mechanism of concrete under freeze–thaw conditions.
Comparative analysis showed that NAC exhibited minimal change in mass loss rate during freeze–thaw cycling (maximum only 0.22%), significantly lower than RAC (maximum reaching 2.57%). This is attributed to the low porosity and dense ITZ of NAC, which effectively restricted the development of microcracks and the compensatory effect of solution infiltration. In contrast, the inherent high porosity and weak ITZ of RCA within RAC significantly reduced its resistance to freeze–thaw damage. Furthermore, freeze–thaw in salt solution significantly exacerbated the mass loss of concrete. After 125 freeze–thaw cycles in salt solution, the mass loss rate of RAC dramatically increased by 365% compared to the freshwater environment. This is because the high permeability of the salt solution elevated the degree of saturation of the concrete. The combined action of its non-uniform phase transition and salt crystallization precipitation produced superimposed expansion stresses, accelerating microcrack propagation and resulting in a substantial increase in mortar spalling [9].
The incorporation of WPF effectively mitigated the mass loss in RAC. During freshwater freeze–thaw cycling, the mass loss rates of both RAC and FRAC remained negative (i.e., indicating mass increase). After 125 freshwater freeze–thaw cycles, the mass loss rate of RAC without WPF was −0.97%, while that of RAC with WPF increased to −0.77%. The incorporation of WPF reduced the negative mass loss rate of RAC by 20.62%. After 125 freeze–thaw cycles in salt solution, the mass loss rate of RAC without WPF reached 2.57%, while that with WPF decreased to 2.42%, representing a reduction of 5.84%. The reasons for the improved mass damage resistance in RAC after WPF incorporation are as follows: (1) WPF formed a three-dimensional randomly distributed network within the RAC matrix, bridging microcracks and effectively restricting their chained propagation, thereby reducing aggregate and mortar spalling caused by continuous crack development [46]. (2) The presence of WPF obstructed the migration paths of water and salt within the pore solution in RAC, reducing the freezable water content inside pores. This effectively alleviated the frost heave pressure generated by ice crystal expansion and inhibited the increase in mass loss rate [48]. (3) WPF optimized the microstructure of RAC and enhanced matrix compactness. On one hand, this suppressed the initiation and development of microcracks; on the other hand, it reduced the number of newly formed water-bleeding channels generated by freeze–thaw cycles, thereby decreasing the secondary absorption of water in subsequent cycles and consequently reducing secondary mass gain [50].

3.3. RDEM Attenuation

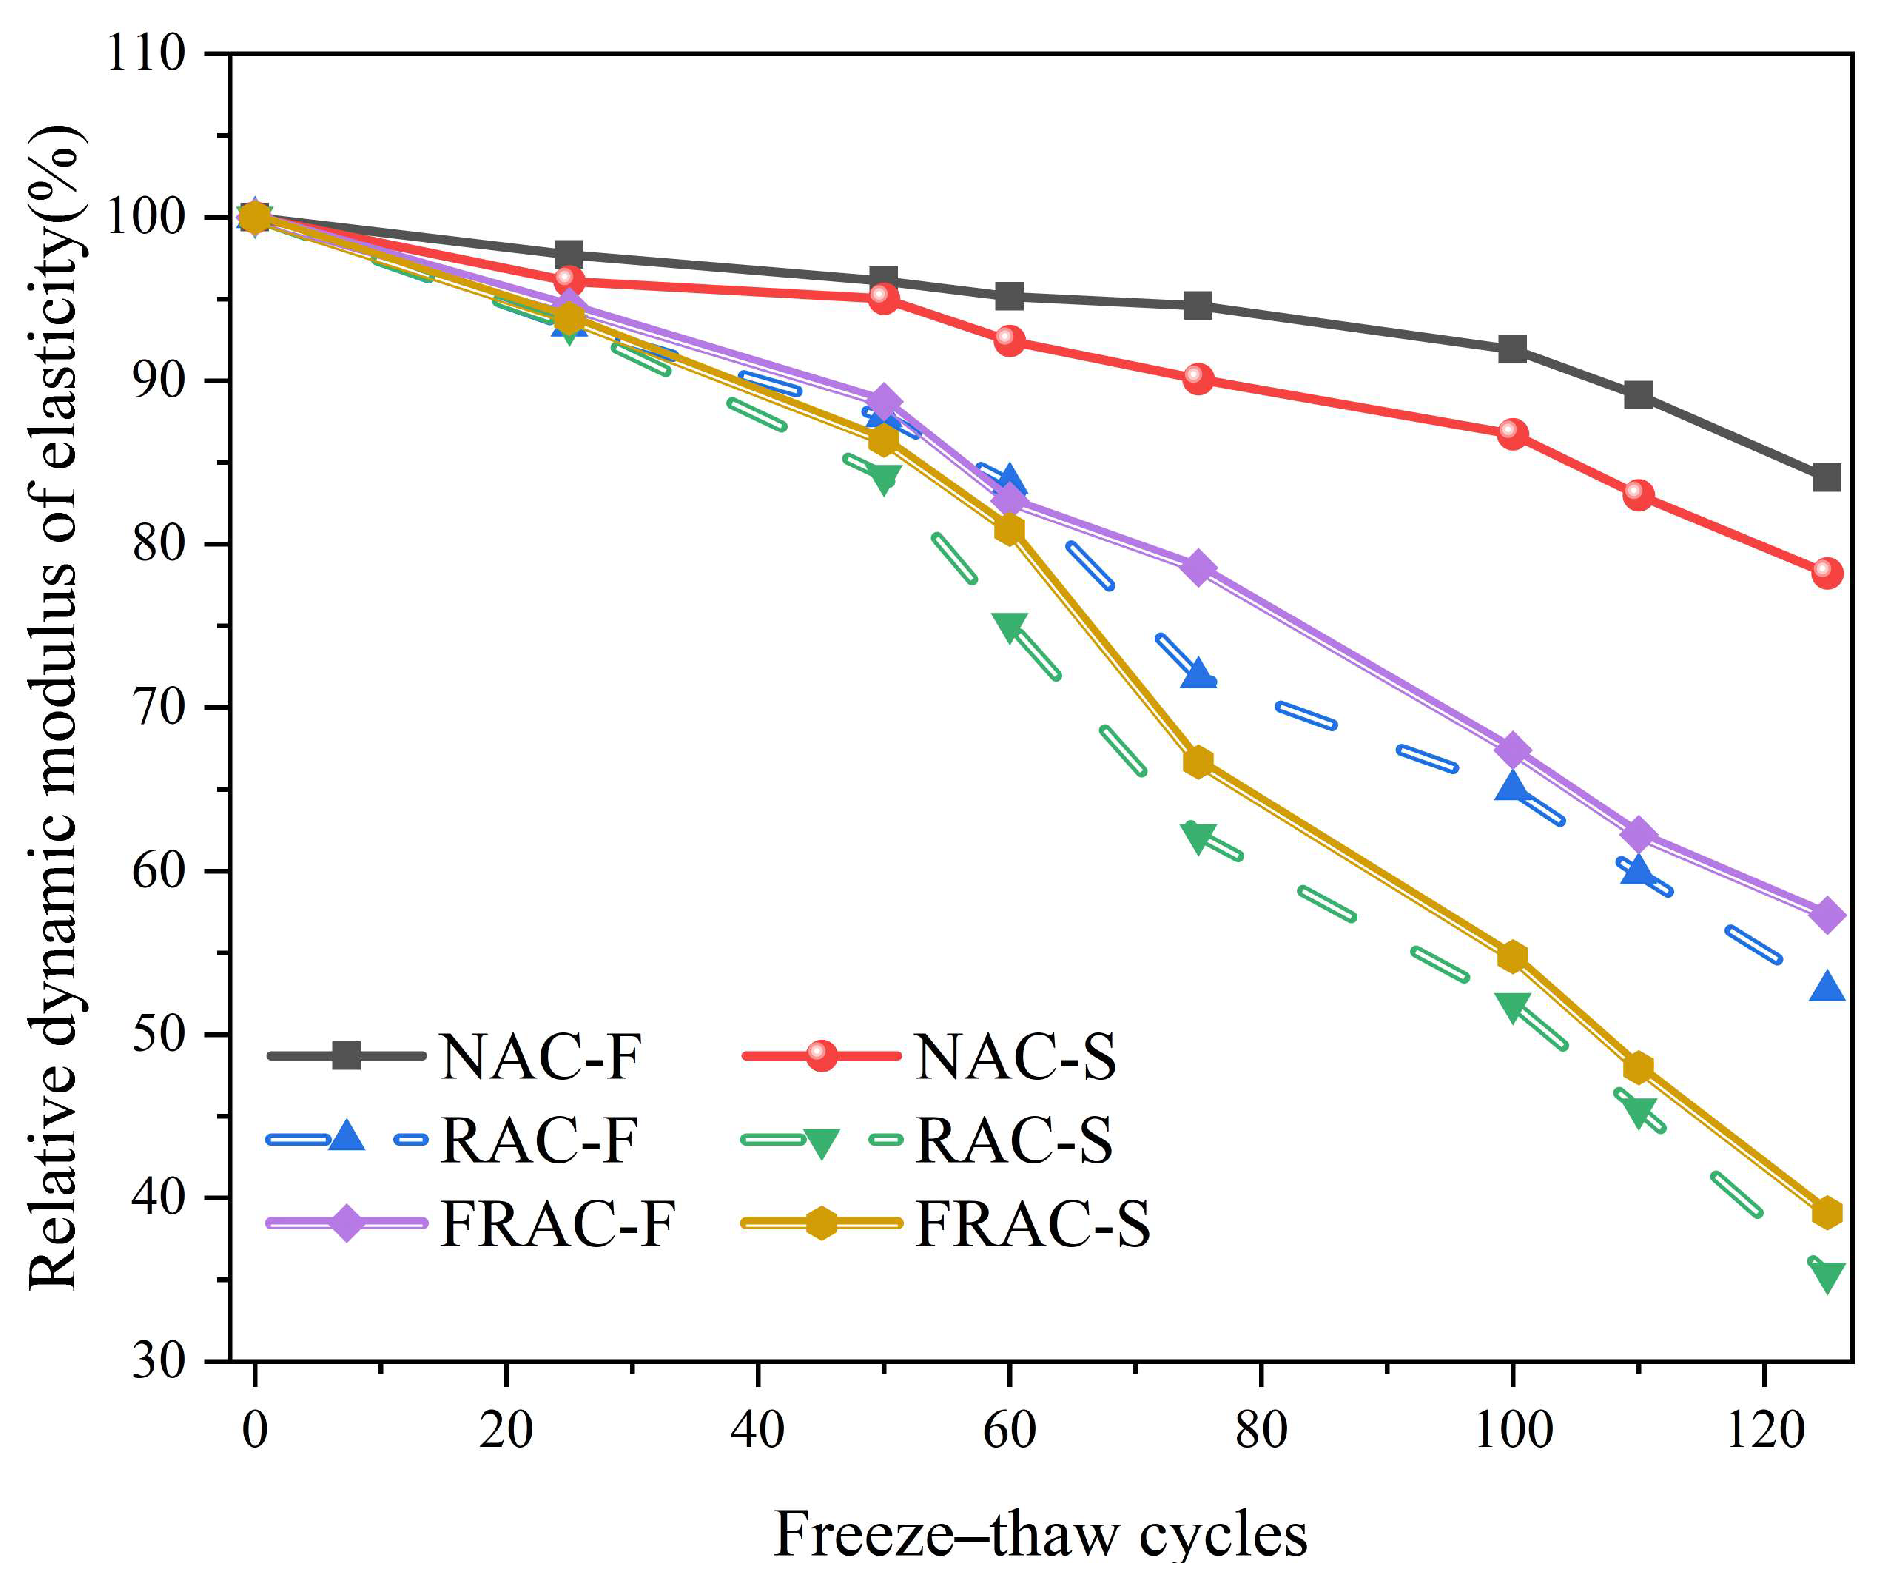
As a key indicator for evaluating the elastic properties of materials, the continuous attenuation of the RDEM directly reflects the irreversible accumulation process of freeze–thaw damage. The RDEM of specimens in all groups exhibited a continuous decreasing trend with increasing freeze–thaw cycles, as shown in Figure 8. This is primarily because freeze–thaw cycles caused coarsening of the concrete pore structure and aggravated interconnection of microcrack networks, compromising the continuity of the matrix and hindering ultrasonic wave propagation [49]. Furthermore, the attenuation amplitude of RDEM in RAC was significantly higher than that in NAC. The reason is that the inherent microcracks and weak interfaces within RCA provided preferential paths for freeze–thaw damage development, thereby accelerating performance deterioration [51]. The damaging effect of the saline freeze–thaw environment on RDEM was more severe compared to the freshwater environment. This stemmed from the high crystallization expansion pressure generated by salt solution, which far exceeded that of freshwater freeze–thaw, intensifying microcrack development and further compromising the continuity of the matrix [15].
WPF effectively inhibited the attenuation of the RDEM in RAC. After 125 freshwater freeze–thaw cycles, the RDEM attenuation of RAC without WPF reached 47.29%, while that incorporating WPF decreased to 42.71%, representing a reduction in attenuation amplitude of 9.69%. After 125 freeze–thaw cycles in salt solution, the RDEM attenuation of RAC without WPF reached 64.64%, while that with WPF decreased to 60.91%, representing a reduction in attenuation amplitude of 5.77%. WPF formed a three-dimensional randomly distributed network within the matrix. Through its bridging effect, it effectively inhibited the initiation and propagation of initial microcracks and reduced the connectivity of the crack network, thereby maintaining the structural continuity of the matrix and the integrity of the ultrasonic wave propagation path [52]. Furthermore, WPF obstructed the migration of water and salt, reducing the amount of freezable water within pores and dispersing the expansion stresses generated by ice crystals and salt crystallization. This significantly alleviated the destructive pressure exerted on the matrix by freeze–thaw phase transitions [30]. It is noteworthy that although the incorporation of WPF effectively improved the RDEM attenuation of RAC, the degree of improvement differed significantly between environments. In the freshwater environment, incorporating WPF reduced the RDEM attenuation of RAC by 9.69%, whereas in the saline environment, the reduction was only 5.77%. The reason is that salt solution erosion damaged the bonding interface between WPF and the matrix, weakening the fibre’s bridging effect, particularly its crack-restraining capacity, which resulted in diminished improvement effectiveness [53].

3.4. Compressive Strength

3.4.1. Compressive Strength Loss Rate

The variations in compressive strength and compressive strength loss rate with the number of freeze–thaw cycles for each specimen group are shown in Figure 9a,b. The compressive strength of all specimen groups continuously decreased with increasing freeze–thaw cycles, while the compressive strength loss rate correspondingly increased. This strength deterioration pattern is consistent with reports in existing studies [54]. The primary reason is that the repeated cyclic stress induced by frost heave pressure caused progressive propagation of microcracks and weakening of interfacial bonding between the aggregate and the mortar. This reduced the effective load-bearing area and induced stress concentration, leading to a macroscopic decline in compressive strength.
Comparative analysis revealed that the strength loss rate of RAC was consistently significantly higher than that of NAC (Figure 9b). The reason is that the microcracks introduced by RCA and the multiple weak ITZs (aggregate-old mortar-new mortar) possessed high porosity and water absorption, accelerating the accumulation and propagation of freeze–thaw damage within the interfacial zones [41]. Furthermore, the damaging effect of the saline freeze–thaw environment on strength far exceeded that of the freshwater environment. After 125 cycles, the strength loss rate of RAC in salt solution increased by 7.28% compared to the freshwater environment. The reason is that the salt solution elevated the degree of saturation of RAC. The combined action of non-uniform ice formation and salt crystallization precipitation generated a superimposed expansion pressure differential, creating multi-directional destructive stresses [9,55].
WPF effectively inhibited the strength damage in RAC. After 125 freshwater freeze–thaw cycles, the compressive strength loss rate of RAC without WPF reached 57.27%; after incorporating WPF, it decreased to 54.68%, representing a reduction of 4.52%. After 125 freeze–thaw cycles in salt solution, the compressive strength loss rate of RAC without WPF was 61.44%; after incorporating WPF, it decreased to 59.60%, representing a reduction of 3.00%. The improvement mechanism of WPF on RAC strength damage can be attributed to the following two aspects: (1) Enhanced crack resistance—when microcracks occurred, WPF bridged the cracks and transferred stress, effectively restricting further crack propagation and reducing the connectivity between cracks. This enhanced the crack resistance of concrete, thereby delaying the specimen failure process [56,57]. (2) Improved matrix structure—the three-dimensional network formed by WPF within the matrix effectively connected its various components, enhancing overall compactness. This network reduced the connectivity of capillary pores, decreased the number of large pores, increased the proportion of small pores, and made the pore distribution more uniform. Consequently, it mitigated the destructive pressure exerted on RAC by ice crystal and salt crystallization expansion [50]. Furthermore, although the strength damage of RAC was effectively improved after incorporating WPF, the degree of improvement differed between saline and freshwater environments. In the freshwater environment, incorporating WPF reduced the strength loss rate of RAC by 4.52%, whereas in the saline environment, the reduction was only 3.00%. The improvement effect in saline was reduced by 33.63% compared to freshwater. This is because salt solution erosion weakened the interfacial bonding between WPF and the matrix, reducing the fibre’s stress transfer efficiency and crack-restraining capacity, resulting in limited enhancement effectiveness.
To further investigate the improvement effect of WPF on the compressive strength of RAC under different numbers of freeze–thaw cycles and in different environments, this study calculated the enhancement rate of WPF on RAC compressive strength according to Equation (5):
U ( n ) = ( f F , c u , n f R , c u , n 1 ) × 100 %
where △U(n) is the enhancement rate of WPF on RAC compressive strength after n freeze–thaw cycles (%); fF,cu,n and fR,cu,n are the compressive strength of FRAC and RAC after n freeze–thaw cycles (MPa), respectively.
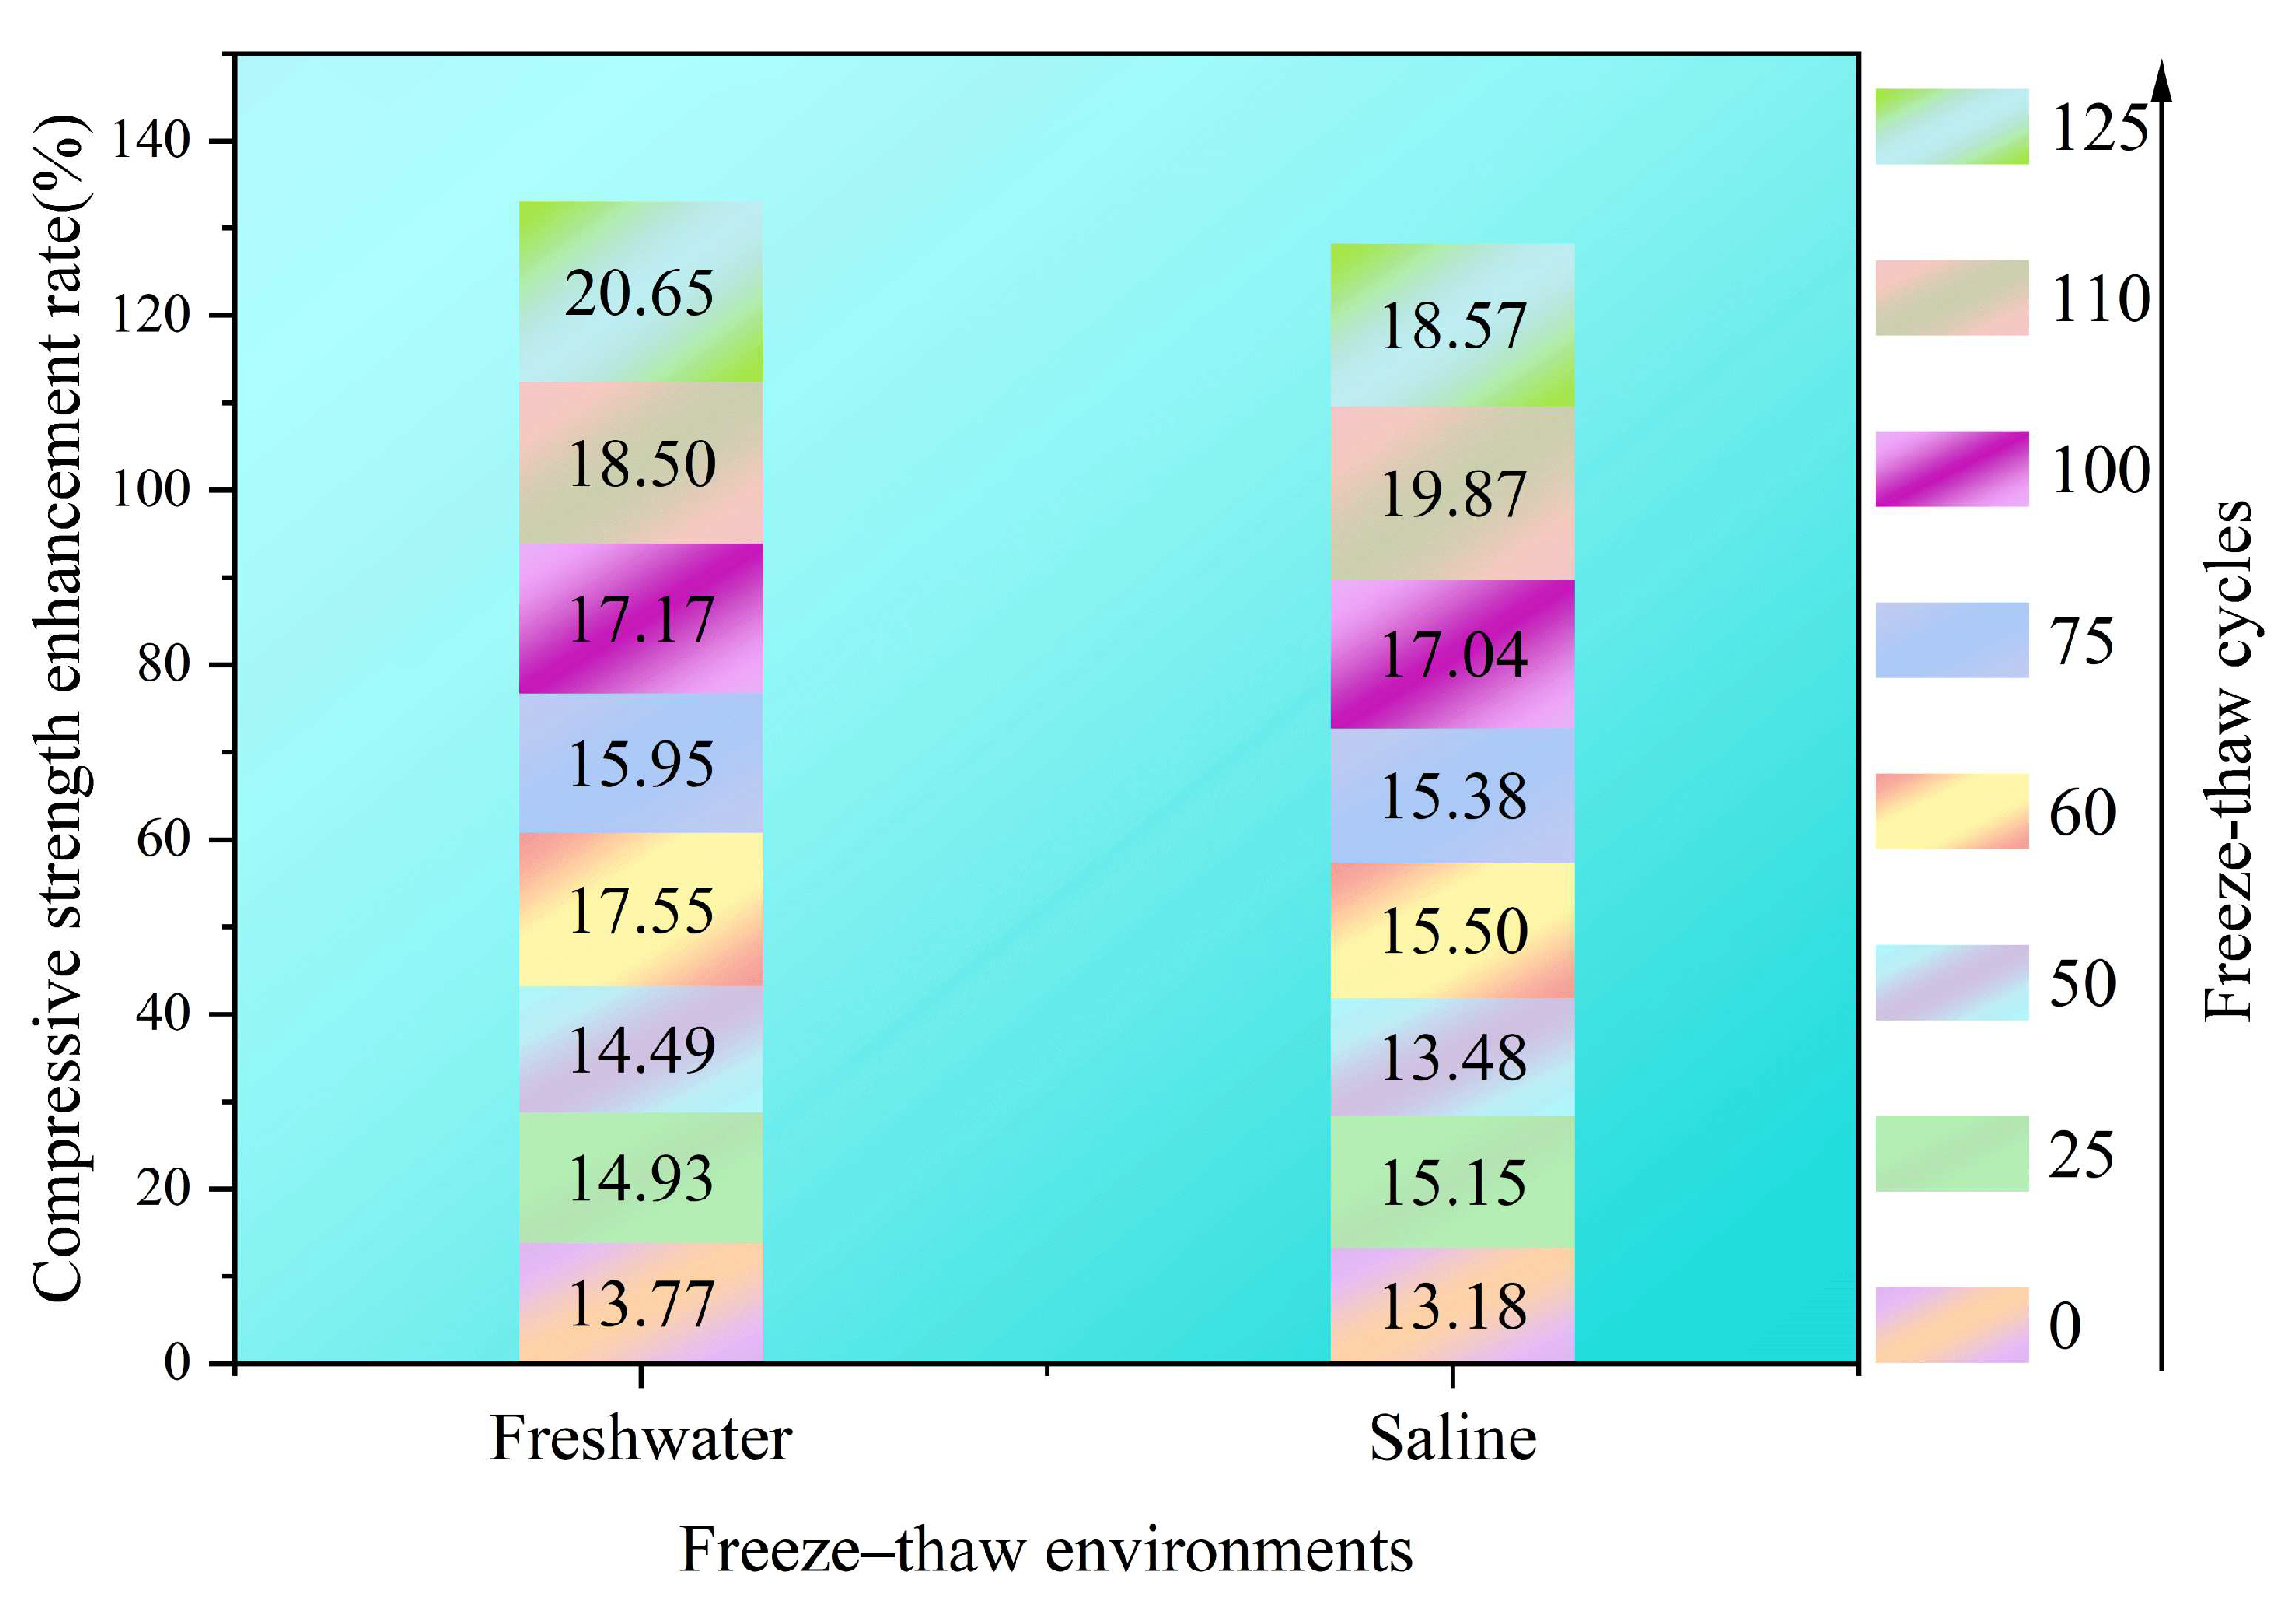
The improvement effect of WPF on the compressive strength of RAC after freeze–thaw cycles is shown in Figure 10. The enhancement rate of WPF on RAC compressive strength generally exhibited an increasing trend with the number of freeze–thaw cycles, with a peak increase reaching 20.65%. This is consistent with the pattern reported in the existing literature [33]. In the early stages of freeze–thaw cycles, matrix damage was minor, and the fibre reinforcement effect had not been fully exerted. As the number of freeze–thaw cycles increased, the internal microcrack network in concrete continuously developed. The crack-bridging and three-dimensional restraining effects of the fibres became significantly enhanced, effectively inhibiting the loss of load-bearing cross-section caused by crack interconnection. Consequently, the fibre improvement effect increased with the intensification of freeze–thaw damage. It was noteworthy that the enhancement effect of WPF on RAC compressive strength in the freshwater environment was generally slightly higher than that in the saline environment. This may be related to the chemical erosion effect of salt solution. Salt solution damaged the compactness of the fibre-matrix interface, reducing the friction coefficient and stress transfer efficiency, thereby weakening the bridging effect and consequently diminishing the fibre’s enhancement effect on compressive strength.

3.4.2. Compressive Strength Prediction Model

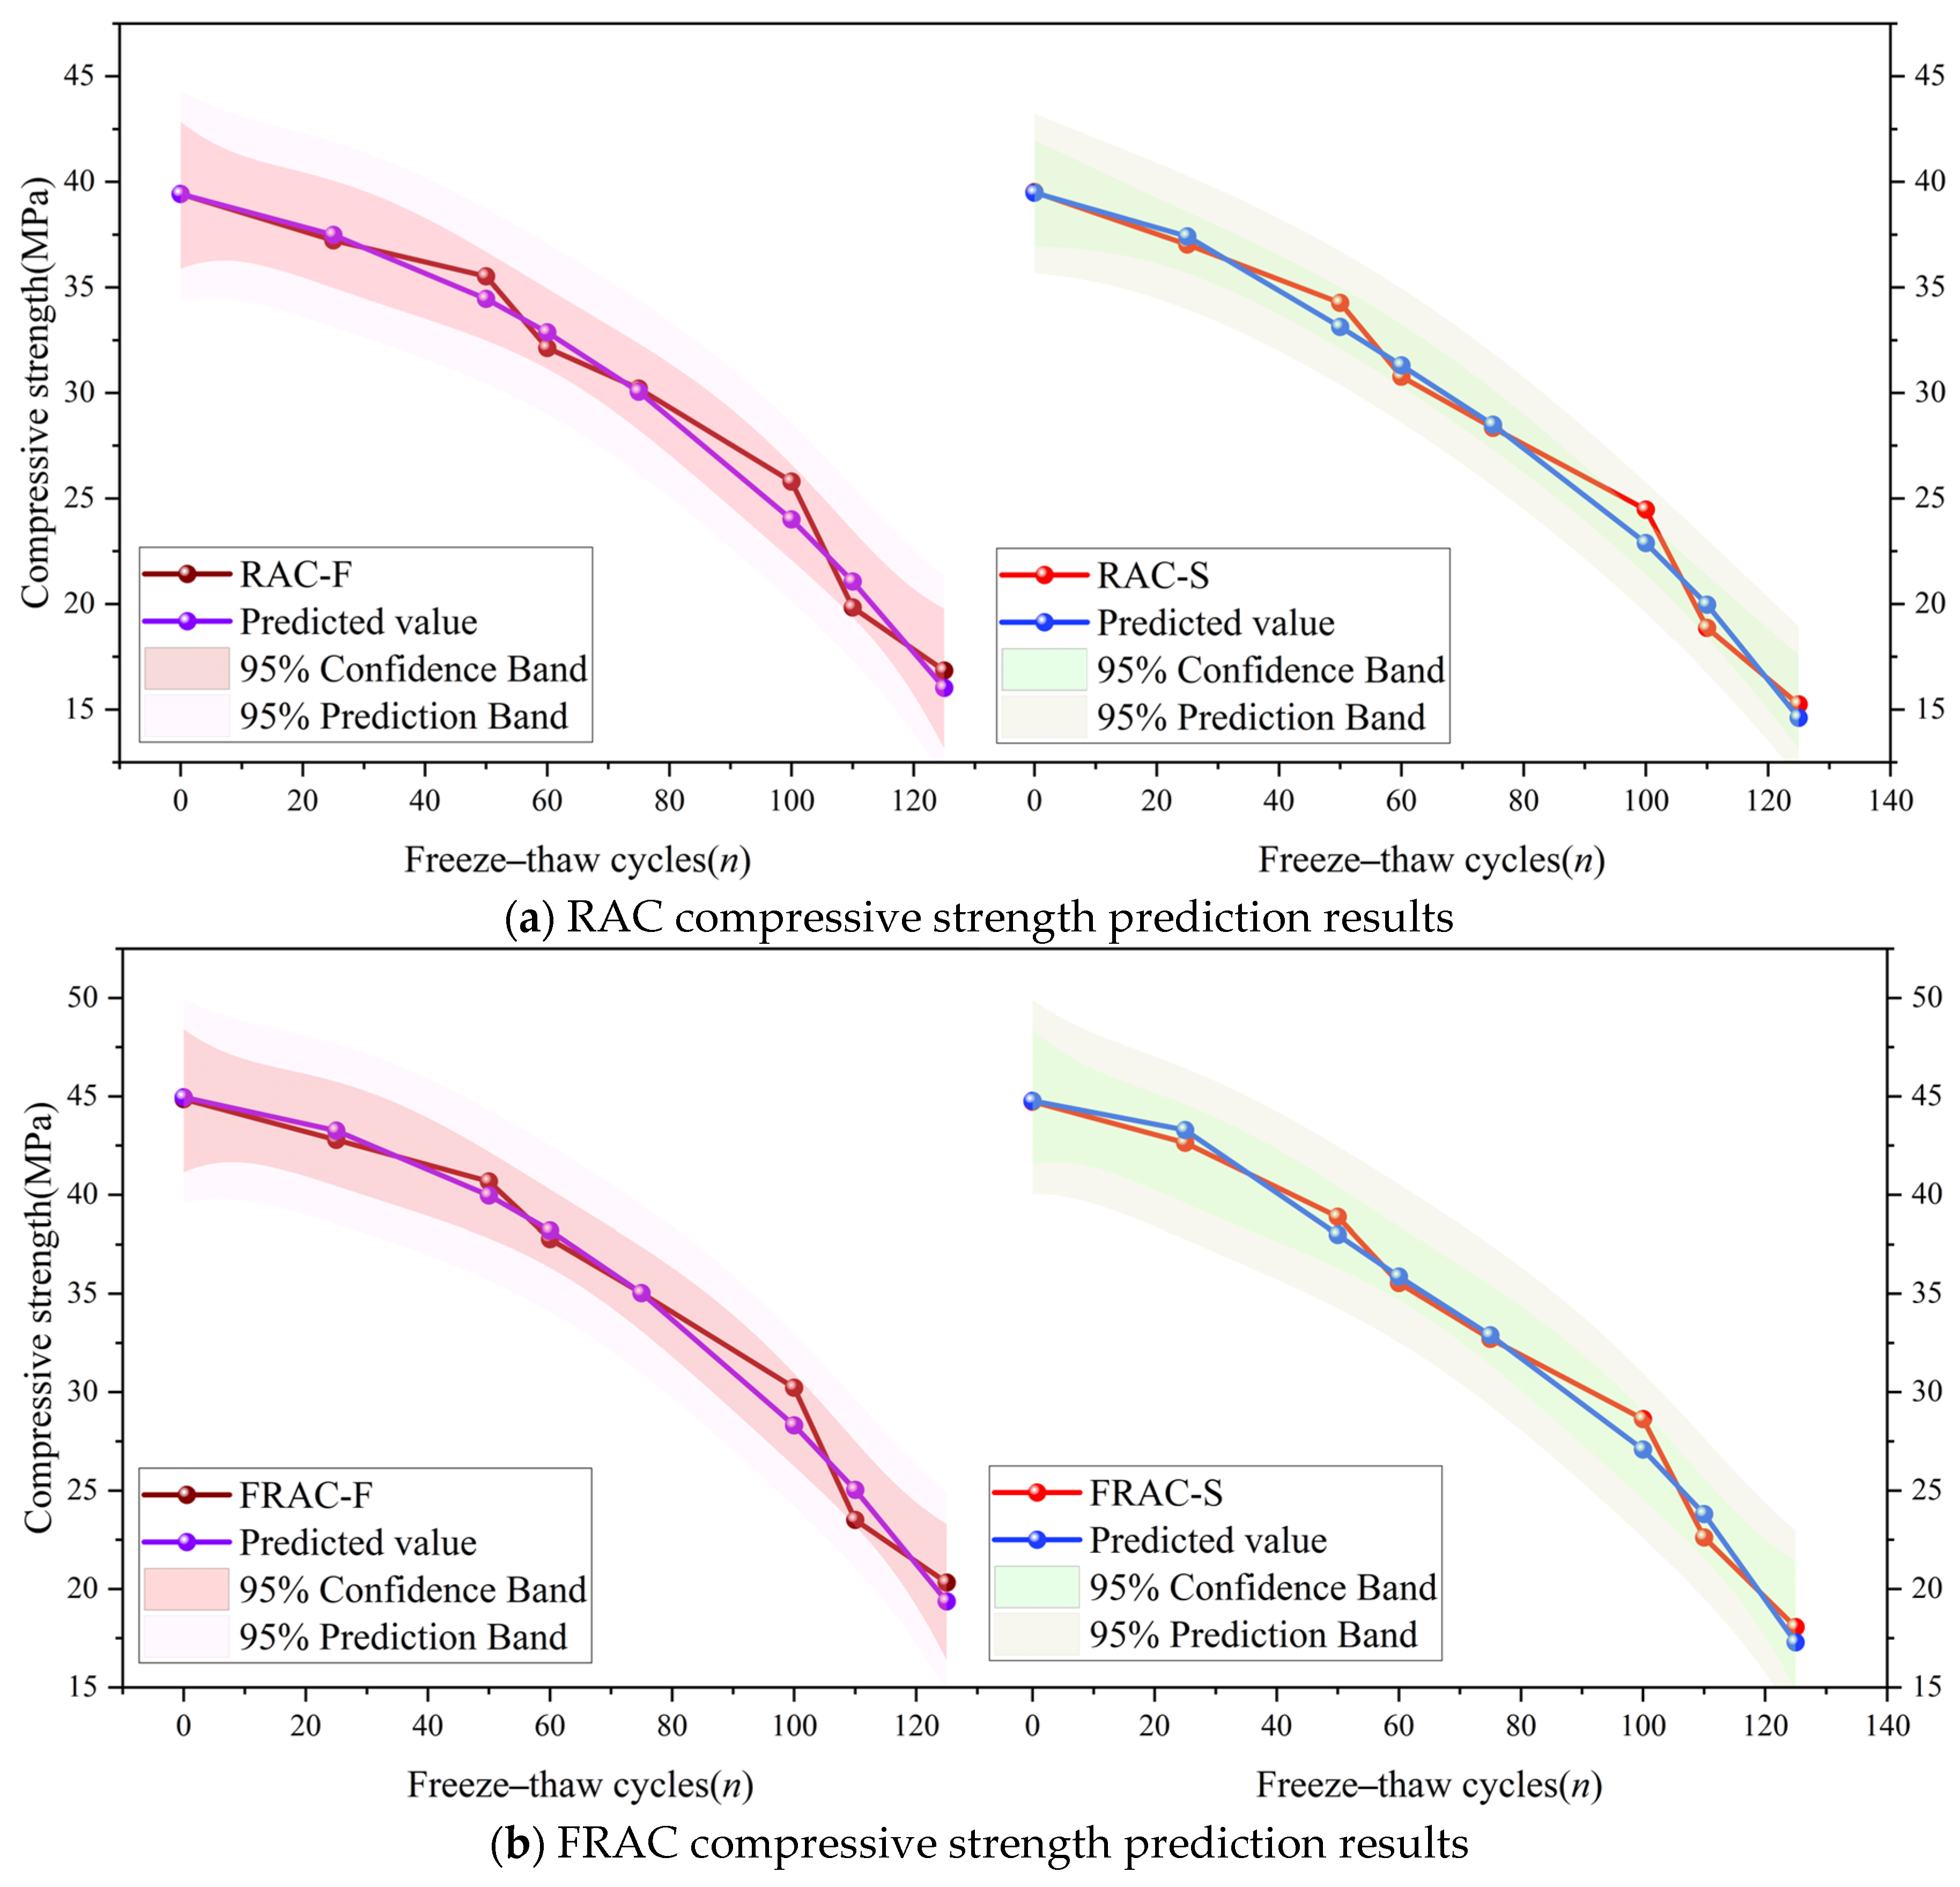
Based on the test results, a predictive model for the compressive strength of RAC in a freshwater freeze–thaw environment was developed through polynomial regression analysis. The model was fitted using experimental data obtained from eight different freeze–thaw cycles (n = 0, 25, 50, 60, 75, 100, 110, and 125), with three parallel specimens for each data point, thus constituting a robust dataset for the analysis. The specific expression is shown in Equation (6):
f R , n = f R , 0 0.06 n 6.39 × 10 4 n 2 3.03 × 10 6 n 3                   R 2 = 0.98
where fR,0 is the compressive strength of the RAC specimen before freeze–thaw cycles (MPa); n is the number of freeze–thaw cycles.
Considering the influence of WPF and salt solution on compressive strength, a fibre enhancement coefficient (βε) and a salt solution attenuation coefficient (αω) were defined to characterize the effect degree of WPF and salt solution on compressive strength. The specific expressions are shown in Equations (7) and (8):
α ω = 1 ω s , n ω f , n
β ε = ε F R A C , n ε R A C , n 1
where ωs,n and ωf,n represent the compressive strengths of the specimen after n freeze–thaw cycles in salt solution and freshwater (MPa), respectively; εFRAC,n and εRAC,n represent the compressive strengths of FRAC and RAC after n freshwater freeze–thaw cycles (MPa), respectively.
After substituting the test data into Equations (7) and (8), the relationships between the fibre enhancement coefficient (βε), the salt solution attenuation coefficients for RAC (αω,1) and FRAC (αω,2), and the number of freeze–thaw cycles were determined through regression analysis (R2 ≥ 0.88). The specific expressions are shown in Equations (9) to (11):
β ε = 0.14 + 8.3 × 10 4 n 1.29 × 10 5 n 2 + 8.53 × 10 8 n 3
α ω , 1 = 0.00147 0.00192 n + 1.17466 × 10 4 n 2 1.59 × 10 6 n 3 + 6.5539 × 10 9 n 4
α ω , 2 = 0.00383 0.00356 n + 1.94258 × 10 4 n 2 2.64246 × 10 6 n 3 + 1.09538 × 10 8 n 4
Substituting Equations (9)–(11) into Equation (6) yielded the compressive strength prediction model that comprehensively considered the number of freeze–thaw cycles, the enhancement effect of WPF, and the deterioration effect of salt solution, as shown in Equation (12):
f c u , n = ( 1 α ω ) ( 1 + β ε ) f R , n
where for RAC specimens, αω takes the value αω,1; for FRAC specimens, αω takes the value αω,2.
The predicted compressive strength results calculated using Equation (12) are shown in Figure 11. The results indicate that the model predictions were highly consistent with the test results. This prediction model can accurately predict the effects of freeze–thaw cycles, WPF, and salt solution on compressive strength.

3.5. Systematic Quantitative Comparison of Frost Resistance

To provide a clear and systematic overview of the deterioration degree of different specimens, the key indicators (mass loss rate, RDEM attenuation, and compressive strength loss rate) at critical freeze–thaw cycles (0, 75, 125) are summarized in Table 6.
As presented in Table 6, the degradation of all specimens exhibited a consistent pattern where NAC demonstrated the best performance, followed by FRAC, with plain RAC showing the most severe deterioration. This pattern was particularly evident when examining the compressive strength loss after 125 freeze–thaw cycles in salt solution, where RAC-S experienced 61.44% strength loss compared to 24.56% for NAC-S while FRAC-S showed a noticeable improvement of 59.6% strength loss. These results clearly demonstrated that RAC was more susceptible to freeze–thaw damage than NAC, and that the incorporation of WPF effectively mitigated this damage in RAC.
The damaging effect of the saline environment was clearly observable in the experimental data. For all recycled aggregate specimens, the damage was significantly more severe in salt solution than in freshwater across all evaluation metrics. This was well illustrated by the RDEM values after 125 cycles, where RAC-S dropped to 35.36% compared to 52.71% for RAC-F, confirming the synergistic damaging effect of salt solution in combination with freeze–thaw cycles.
The effectiveness of WPF in enhancing frost resistance was quantitatively demonstrated in the results. In the freshwater environment, the addition of fibre reduced the compressive strength loss from 57.27% to 54.68% after 125 cycles, representing a 4.52% reduction in strength loss. Although the improvement was less pronounced in the more challenging saline environment, with the strength loss decreasing from 61.44% to 59.60%, the fibre reinforcement still consistently enhanced the durability performance under these severe conditions.
Additionally, the table clearly shows the initial mass gain phase, represented by negative values, for samples tested in freshwater at 75 cycles, which subsequently transitioned to mass loss at later stages. This quantitative information effectively supports and complements the qualitative description of this phenomenon presented earlier in Section 3.2.

3.6. Dual-Damage Parameter Life Prediction

3.6.1. Life Prediction Based on RDEM Threshold

Based on damage mechanics principles, internal damage in concrete gradually accumulates under freeze–thaw cycles. Using dynamic elastic modulus as the damage characterization index, its damage degree Dn was defined as follows:
D n = 1 E n E 0
where Dn is the damage degree after n freeze–thaw cycles; En is the dynamic elastic modulus after n freeze–thaw cycles; E0 is the initial dynamic elastic modulus of the concrete. A two-parameter Weibull model with high conformity to concrete behavior was adopted to predict the service life of concrete structures. Assuming the service life was T, its probability density function and cumulative distribution function are shown in Equations (14) and (15), respectively:
f ( T ) = β α   ( T α ) ( β 1 ) e x p [ ( T α ) β ]
F ( T ) = 1 e x p [ ( T α ) β ]
where α is the scale parameter and β is the shape parameter. The failure probability Pf(n1) after n1 freeze–thaw cycles is shown in Equation (16):
P f ( n 1 ) = 1 e x p [ ( n 1 α ) β ]
When the structure reaches its service life (i.e., failure), Pf(n1) → 1. At this point, the damage degree D(nn) → 1, meaning (nn/α)β→ ∞. The reliability function R(n) derived from the Weibull distribution function is as follows:
R ( n ) = 1 F ( n ) = e x p [ ( n α ) β ]
Performing a Weibull transformation on Equation (17) and taking the logarithm twice yielded a linear relationship:
ln [ ( ln ( 1 R ( n ) ) ) ] = β ( ln ( n ) ln ( α ) )
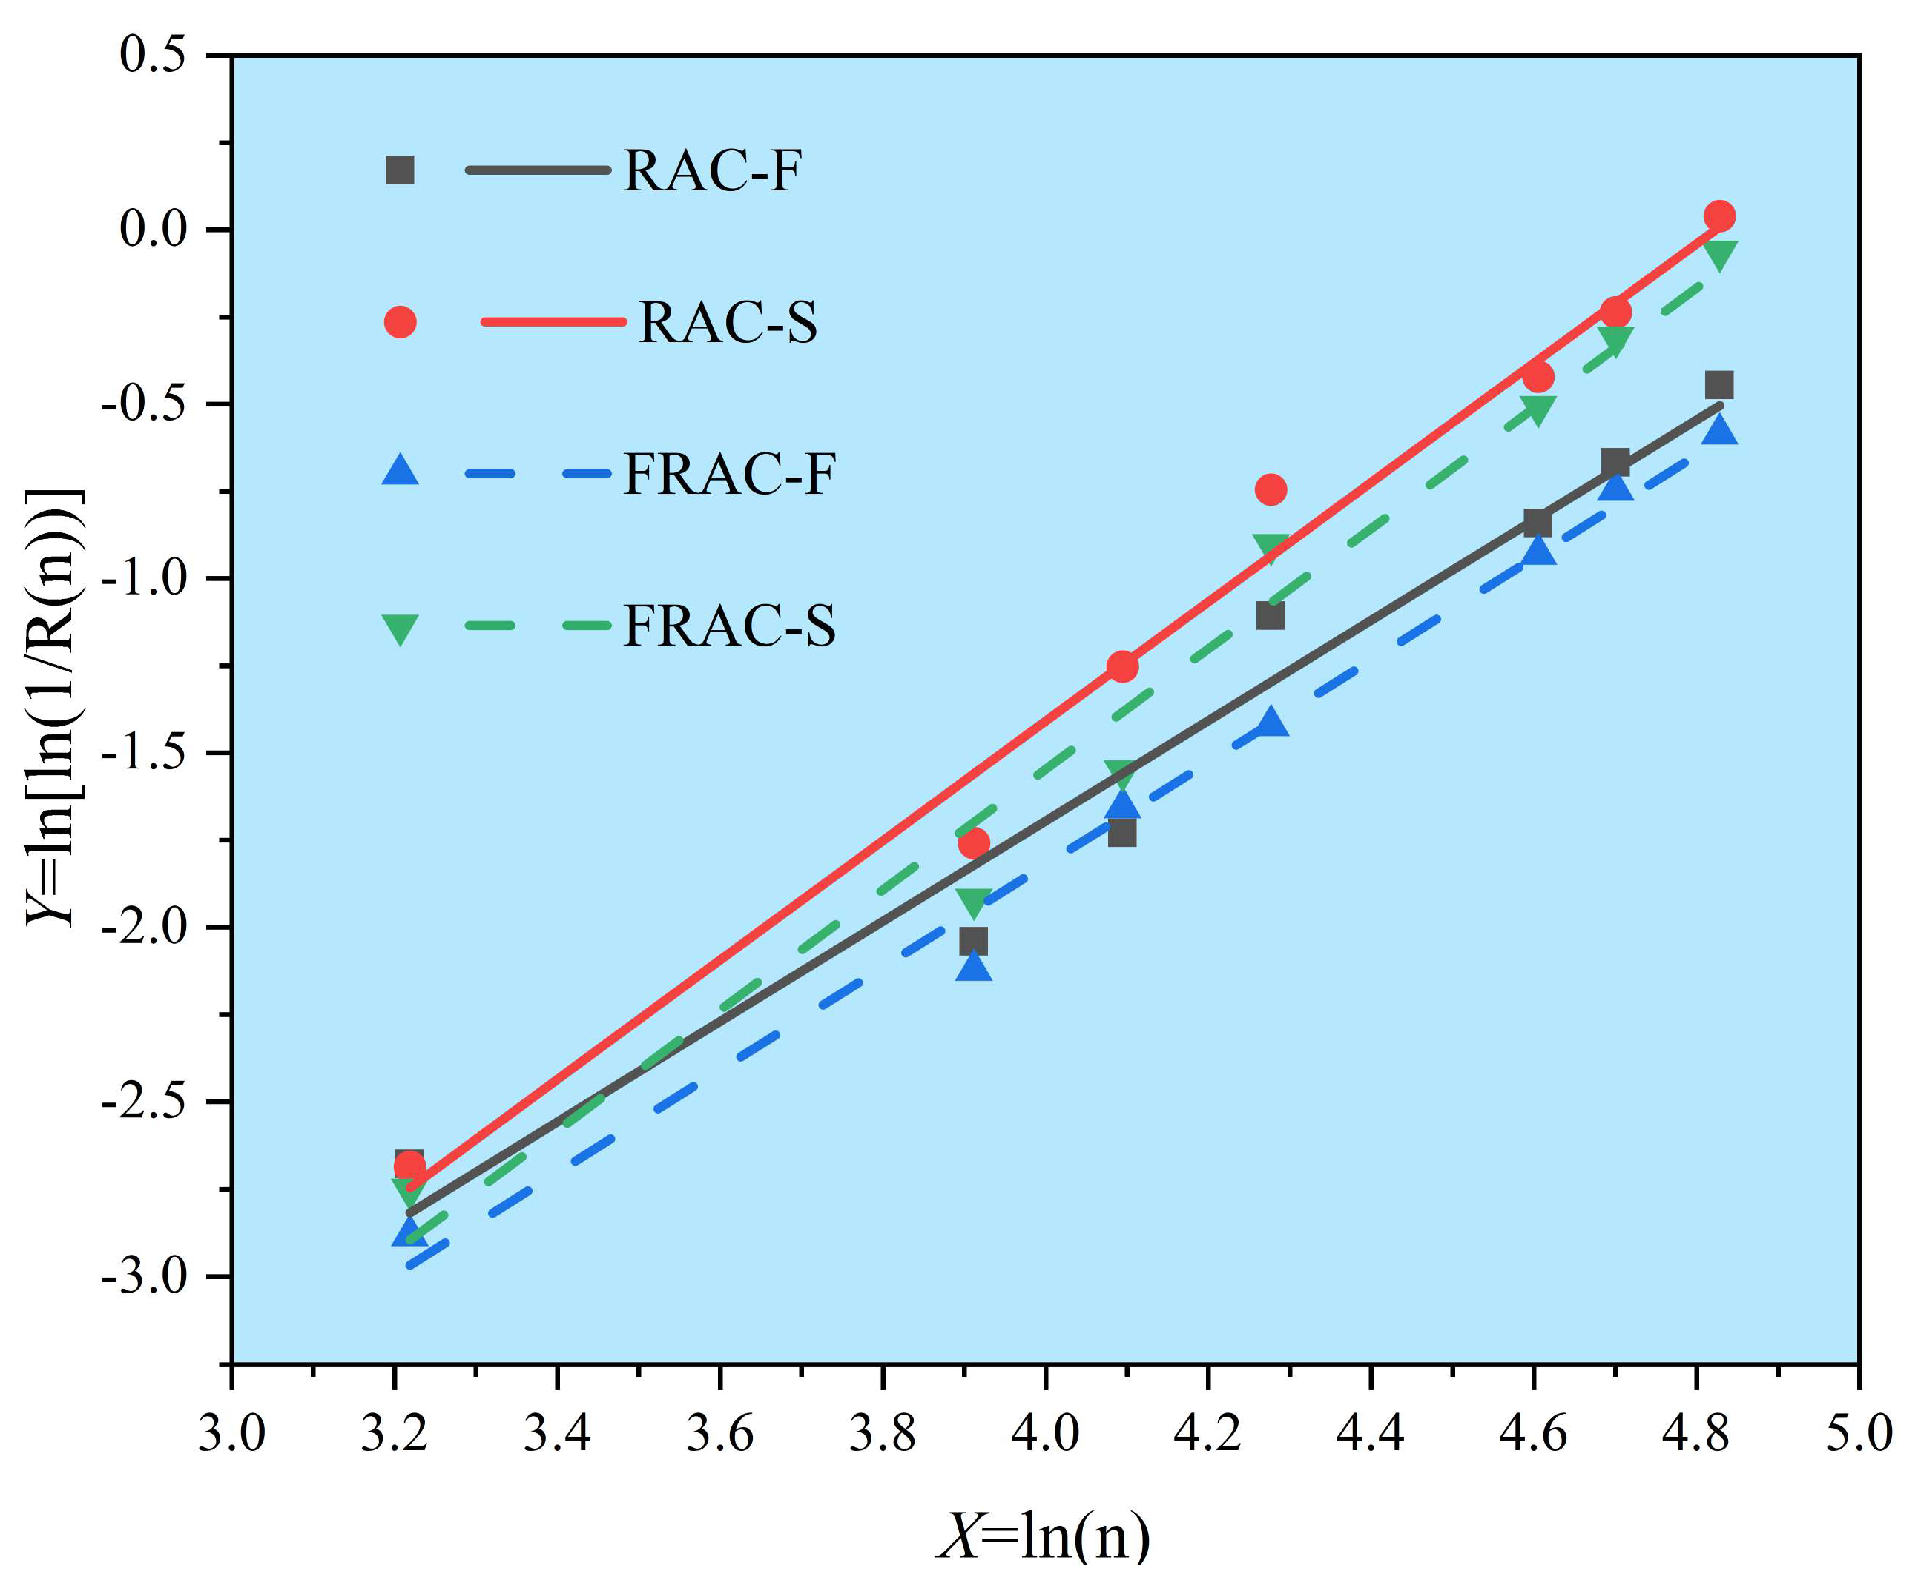
Let Y = ln[ln(1/R(n))], X = ln(n), A = β, B = −βln(α). Then, Equation (18) simplifies to Y = Ax + B. If the life prediction data conforms to the Weibull distribution, Y and X should exhibit a strong linear relationship. The least squares method was used to fit parameters A, B, and the correlation coefficient R2. If R2 > 0.90, it indicates the life prediction data conforms to the Weibull distribution.
Based on the Weibull correlation test equation (Equation (18)), correlation analysis was performed on the RDEM of the concrete to obtain its Weibull distribution values for life prediction, shown in Table 7. The data in Table 7 was linearly fitted using OriginPro 2022 software; the fitting results are shown in Figure 12 and Table 8. The results show that the R2 values for all specimens were very close to 1, confirming the data highly conforms to the Weibull distribution. The fitted life prediction models are as follows:
RAC - F :   Y = l n [ ln ( 1 / R ( n ) ) ] = 1.43677 l n n 7.44156
RAC - S :   Y = l n [ ln ( 1 / R ( n ) ) ] = 1.71116 l n n 8.25331
FRAC - F :   Y = l n [ ln ( 1 / R ( n ) ) ] = 1.46745 l n n 7.69048
FRAC - S :   Y = l n [ ln ( 1 / R ( n ) ) ] = 1.72544 l n n 8.44831
According to specifications and previous research [33], concrete components are considered to have failed when the RDEM drops to 60%, i.e., when the reliability R(n) = 0.6. Substituting this critical value into Equations (19)–(22) yielded predicted life for RAC-F, RAC-S, FRAC-F, and FRAC-S of 111, 83, 119, and 90 freeze–thaw cycles, respectively.
To verify the reliability of this model’s predictions, the compressive strength and loss rate of each specimen group at the predicted life cycle number were calculated using Equation (12). The calculation results are shown in Table 9. The results indicate that there were significant differences in the service life and strength loss rate among the four specimen groups under freeze–thaw conditions. The service lives of RAC-F and RAC-S were 111 and 83 cycles, respectively, while those of the fibre-reinforced groups FRAC-F and FRAC-S increased to 119 and 90 cycles. This demonstrates that WPF effectively delayed the freeze–thaw damage process in RAC and significantly enhanced its service life. It is noteworthy that although the life of FRAC-F was longer than that of RAC-F, its compressive strength loss rate reached 51.59%, notably higher than the 47.37% for the RAC-F group. Concurrently, the strength loss rate in the freshwater freeze–thaw environment was also significantly higher than that in the saline environment. This anomalous relationship between strength loss rate and life was also observed in the study by Cui et al. [33]. This suggests that relying solely on the RDEM threshold (e.g., 60%) to determine life may underestimate the risk associated with the concrete’s residual load-bearing capacity.

3.6.2. Life Prediction Based on Compressive Strength Loss Rate Threshold

Based on the compressive strength prediction formula (Equation (12)) from Section 3.4.2) the compressive strength damage degree Gn was defined as follows:
G n = 1 f c u , n f c u , 0
where Gn is the compressive strength damage degree after n freeze–thaw cycles; fcu,n is the compressive strength after n freeze–thaw cycles; fcu,0 is the initial compressive strength of the concrete with the same mix proportion before any freeze–thaw cycles.
Similarly, using the Weibull correlation test equation (Equation (18)), correlation analysis was performed on the compressive strength loss rate of the concrete to obtain its Weibull distribution values for life prediction, shown in Table 10. Linear fitting was applied to the data in Table 10; the fitting results are shown in Figure 13 and Table 11. The results indicate that the correlation coefficient R2 for all specimens was greater than 0.90, confirming that the strength prediction data also conforms to the Weibull distribution. The fitted life prediction models based on strength loss rate are as follows:
RAC - F :   Y = l n [ ln ( 1 / R ( n ) ) ] = 4.69317 1.04803 l n n
RAC - S :   Y = l n [ ln ( 1 / R ( n ) ) ] = 4.74667 1.08344 l n n
FRAC - F :   Y = l n [ ln ( 1 / R ( n ) ) ] = 4.79154 1.05605 l n n
FRAC - S :   Y = l n [ ln ( 1 / R ( n ) ) ] = 4.95578 1.11818 l n n
Currently, existing research has not established a unified standard for the strength attenuation threshold signifying failure of concrete structures. Dong et al. [58] proposed a compressive strength loss rate of 25% as the failure criterion whereas Wiyanto et al. [59] suggested that a strength loss rate of 50% should be required for failure determination. Furthermore, Ma et al. [60] advocated for an absolute value threshold method, i.e., failure is determined when the compressive strength drops to a specific critical value. Based on previous studies, a compressive strength loss rate of 35% (i.e., reliability R(n) = 0.35) was selected as the criterion for component failure. Substituting R(n) = 0.35 into Equations (24)–(27) yielded a predicted life for RAC-F, RAC-S, FRAC-F, and FRAC-S of 84, 76, 89, and 84 freeze–thaw cycles, respectively. The model verification results are shown in Table 12. The residual strength of all specimen groups at their predicted life stabilized between 28 and 32 MPa, and the strength loss rate converged within 28%–31%. This indicates that specimens successively failed when the strength loss rate approached approximately 30%, and the attenuation of load-bearing capacity is the core mechanism determining ultimate failure.
Furthermore, comparing Table 9 and Table 12 reveals that both prediction methods demonstrate that WPF incorporation significantly enhanced the service life of RAC. However, the life predicted based on RDEM was generally greater than that predicted based on strength loss rate. Critically, the former exhibited a strength loss rate as high as 47%–52% at the end of its predicted life, far exceeding established engineering safety thresholds. In contrast, the latter method constrained the loss rate to around 30%. Although its predicted life was shortened by approximately 16% on average, it effectively avoided the structural risk associated with low residual strength accompanying long life. Therefore, when assessing the service life of concrete structures in freeze–thaw environments, the evolution patterns of both RDEM and compressive strength should be comprehensively considered to more accurately evaluate their safe service period.

3.6.3. Sensitivity Analysis and Engineering Failure Thresholds

The selection of failure thresholds (60% for RDEM and 35% for compressive strength loss) significantly influences the predicted service life and residual strength of concrete. To evaluate the sensitivity of these thresholds, this study conducted a supplementary analysis by varying the failure criteria and observing the corresponding changes in predicted life and strength loss. When the RDEM threshold was tightened to 70%, the predicted service life of FRAC-S decreased from 90 to 74 cycles, while the compressive strength loss rate at failure decreased to 26.11%. Conversely, relaxing the RDEM threshold to 50% extended the predicted life to 108 cycles, with a strength loss rate of 45.23%. Similarly, if the compressive strength loss threshold was adjusted to 25%, the predicted life of FRAC-S decreased to 65 cycles; if the compressive strength loss threshold raised to 40%, the predicted life of FRAC-S increased to 96 cycles.
These variations highlight a trade-off between service life and structural safety. The 60% RDEM threshold, while widely adopted in standards and previous studies [33], may lead to an overestimation of usable life under high residual strength requirements. In contrast, the 35% strength loss threshold provides a more conservative estimate, ensuring that the residual strength remains above 28 MPa, which is critical for load-bearing structures in harsh environments. The 35% strength loss criterion is further justified by its alignment with practical engineering safety margins. For instance, many existing studies stipulate that when predicting the service life of concrete structures, the maximum allowable strength of concrete should be reduced by 25%–50% [58,59]. Moreover, the 60% RDEM threshold is primarily based on acoustic and elastic properties, which may not fully capture the mechanical degradation under combined freeze–thaw. Therefore, for applications where residual strength is a primary concern (e.g., structures in coastal regions), the strength-based model is recommended. For non-structural or lightly loaded structures, the RDEM-based model may suffice.
In summary, the dual-parameter approach allows engineers to select the appropriate failure criterion based on specific performance requirements, thereby enhancing the flexibility and reliability of life prediction for RAC structures in freeze–thaw environments.

3.7. Microstructure Analysis

The micro-morphological characteristics of RAC and FRAC after freeze–thaw cycles are shown in Figure 14 and Figure 15, respectively. SEM images of RAC reveal that, compared to NAC which exhibits only a single NCA-new mortar ITZ, the inherent characteristics of RCA lead to the formation of three distinct types of ITZ structures with different morphological features within RAC. These are the new mortar–old mortar ITZ, the RCA–old mortar ITZ, and the RCA–new mortar ITZ [42]. Among these, the bonding state between the new mortar and the RCA surface, as well as the interfacial bonding between the old and new mortars, is relatively dense. Hydration products at these interfaces are densely interwoven with low porosity, indicating good mechanical continuity. However, during the secondary crushing process of RCA, the old mortar adhering to its surface inevitably suffers mechanical damage. This results in the generation of microcracks within the old mortar layer and localized debonding from the aggregate substrate. This process-induced damage is visually manifested in SEM images as significantly widened crack structures within the ITZ between the RCA and the old mortar layer. The interface connection is loose and exhibits discontinuous defects. The microcracks in this region not only weaken the integrity between the aggregate and mortar but, more critically, due to their significant geometric discontinuity and mechanical weakness, become preferential paths for stress concentration and crack propagation. Ultimately, this region evolves into a key damage evolution zone, influencing the macroscopic performance degradation of RAC.
Furthermore, three typical micro-morphological features of cement hydration products can be clearly identified from Figure 14b,c. For instance, layered crystalline calcium hydroxide (CH) densely fills capillary pores in the form of hexagonal plate-like crystals. Its flaky structure forms physical barriers within the mortar matrix, effectively reducing the connectivity of pores. Needle-columnar ettringite (AFt) exhibits a distribution of slender radiating clusters, penetrating pores and interfacial regions. Its rigid skeleton structure provides microscale support to the matrix. Amorphous calcium silicate hydrate gel (C-S-H gel), as the primary cementing phase, envelops aggregates with a dense reticular network. Its high specific surface area and cohesive properties constitute the core source of matrix strength [61,62]. It is noteworthy that these products can provide a certain degree of protection to the matrix during the initial stages of freeze–thaw by reducing water infiltration channels, restricting pore deformation, and enhancing matrix cohesion. However, if the equilibrium between hydration products is disrupted, such as excessive consumption of CH or over-expansion of Aft, it can compromise the frost resistance of concrete [50].
Typical micro-SEM images of FRAC are shown in Figure 15. WPF is distributed within the concrete matrix in a tightly embedded state. Its surface is encased by hydration products and exhibits micro-protrusions, forming a significant mechanical anchorage enhancement effect [63]. This bonding in the fibre-matrix interfacial zone effectively fills local pores and enhances the overall compactness of the matrix. Figure 15b shows that when crack propagation reaches a fibre location, the fibre bridges both sides of the crack, effectively restraining the separated matrix fragments. This bridging force retards the speed of crack interconnection and imparts higher fracture toughness to the material [64]. It is noteworthy that in this image, a fibre traverses a large pore, dividing it into two isolated smaller pores. This phenomenon visually demonstrates the pore structure refinement capability of fibres. By transforming interconnected large pores into dispersed micropores, the stress concentration effect of the pores is weakened. Furthermore, Figure 15c reveals that numerous fibres exhibit random, non-directional distribution within the matrix, interwoven into a continuous three-dimensional network skeleton. This multi-directional confinement system can effectively transfer loads and inhibit crack initiation. Meanwhile, dense micropores are observable surrounding the fibres. Significantly, the exposed fibre fracture surfaces after matrix failure all present smooth single fracture planes. This fracture morphology indicates that the fibres provided effective stress transfer and fully exerted their crack-blocking function.
A comparative analysis of SEM images revealed that the incorporation of WPF significantly refined the pore structure. Compared to plain RAC, the addition of fibres reduced the number of large, interconnected pores and promoted the formation of a more dispersed and finer pore structure in FRAC. This microstructural improvement is consistent with the enhancement in its macro-scale durability performance. Furthermore, research by Ren et al. indicated that incorporating PPFs could reduce concrete porosity by 17.4% and significantly decrease the proportion of large pores greater than 5000 nm [48]. Studies by Wu et al. also pointed out that after adding fibres and undergoing 200 freeze–thaw cycles, the proportion of large pores greater than 1000 nm decreased by 50.22%, the total porosity was reduced by 50.39%, and the fibre–matrix interfacial bonding performance was noticeably enhanced [65]. Research by Huang further demonstrated that the introduction of an appropriate amount of fibre could reduce concrete porosity by 30.65%, decrease the peak signal of large pores by 68.84%, and increase the proportion of small pores, thereby optimizing the pore size distribution, enhancing the fibre-matrix interfacial density, and effectively inhibiting crack propagation [66]. These studies consistently indicate that the incorporation of fibres, by optimizing the pore structure and enhancing interfacial properties, is a key mechanism for improving the durability of concrete.

3.8. Mechanism Analysis

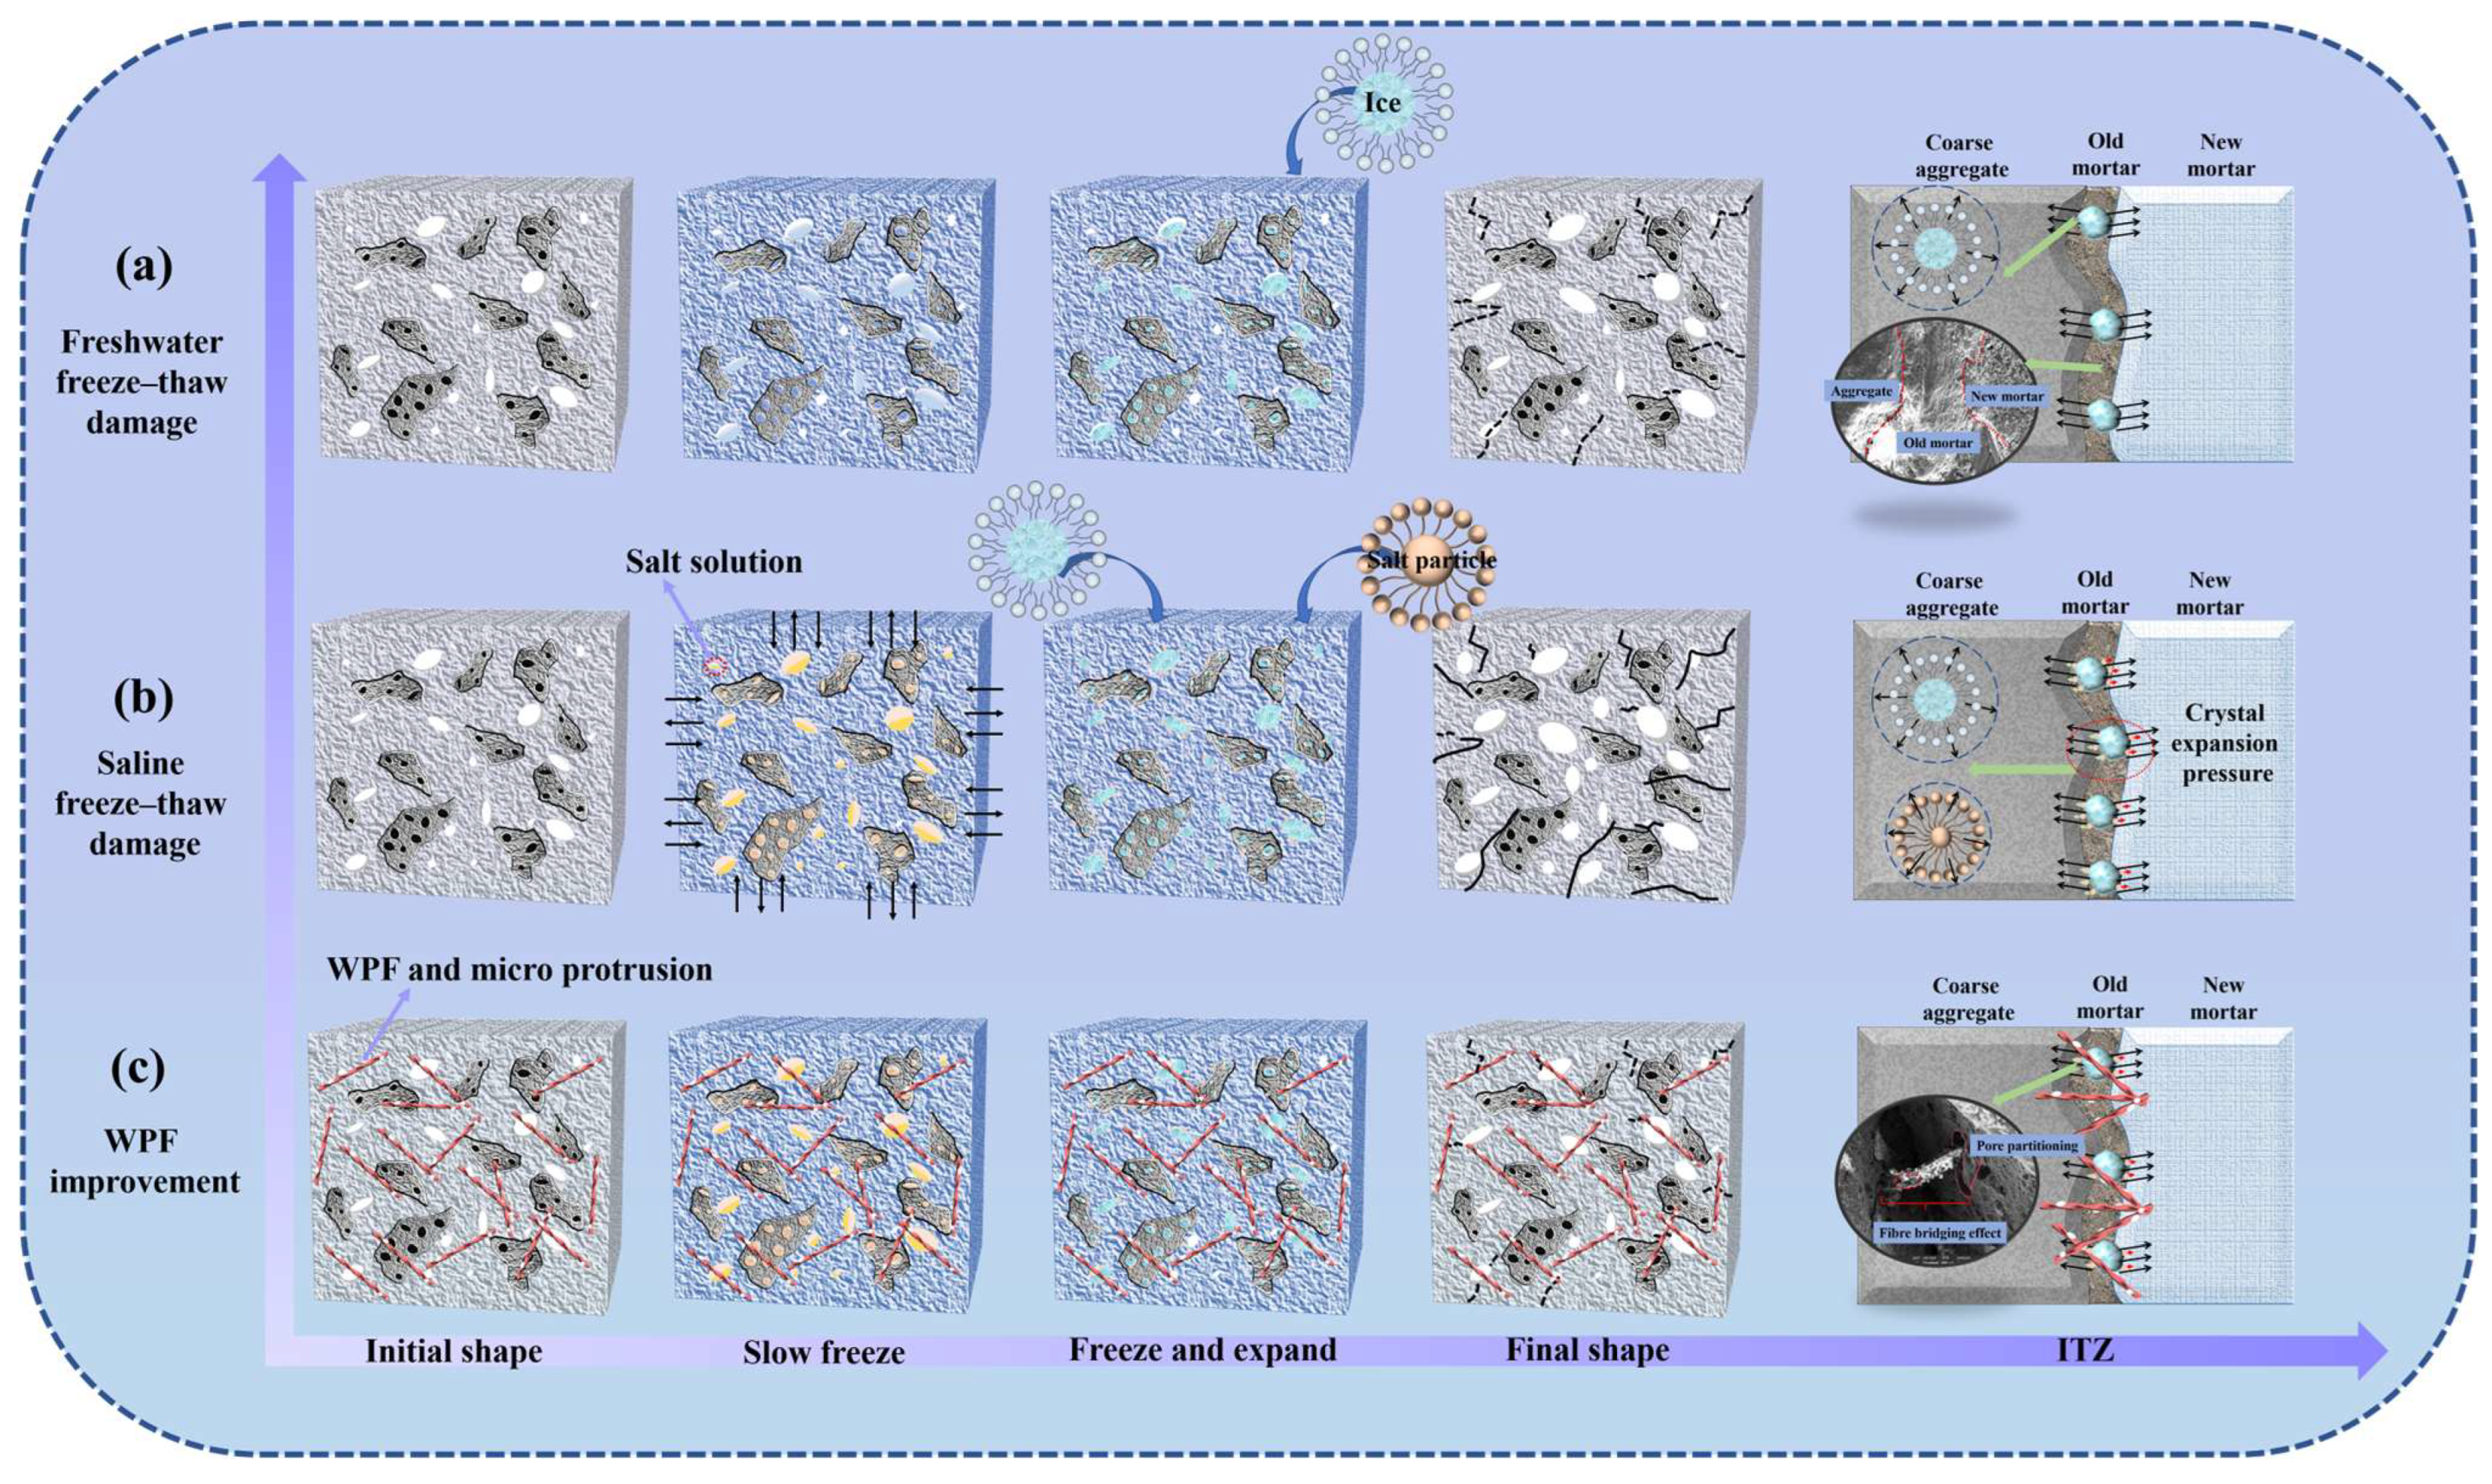
Schematic diagrams illustrating the damage mechanisms of RAC under different freeze–thaw environments and the improvement mechanism of WPF on RAC are shown in Figure 16. The failure of RAC under freeze–thaw cycles is a progressive deterioration process originating from its unique microstructure. Its core weak link lies in the multiple ITZs formed by RCA, old mortar, and new mortar [67,68], as shown in Figure 16a. This region’s inherent characteristics of high tortuous porosity, propensity for Cl enrichment, and relatively weak bond strength make it the origin for the initiation and development of freeze–thaw damage. In the freshwater freeze–thaw environment, water penetrating the matrix preferentially fills and is retained in the high-porosity areas of the ITZ. Upon freezing, this water forms ice crystals and generates expansion pressure. Due to the higher degree of saturation and tortuous pores in the ITZ, the degree of ice formation far exceeds that in other parts of the matrix. The ice crystal expansion pressure amplifies sharply with increasing saturation, directly causing debonding in the ITZ region and damage to the interfacial bonding. After multiple freeze–thaw cycles, the pore area in RAC increases, and freeze–thaw cracks propagate from the outer surface towards the interior.
Figure 16b shows that the saline freeze–thaw environment induces a more complex multi-stress damage mechanism. The intrusion of salt solution brings not only water but also Cl. During freezing, the Cl enriched in the ITZ forms a high-concentration salt solution, creating a significant concentration gradient with the external solution, which induces osmotic pressure. This osmotic pressure continuously attracts external water to infiltrate, further substantially increasing the degree of saturation and freezable water content within the ITZ. Consequently, a larger ice crystal expansion pressure is generated compared to the freshwater environment [9]. Furthermore, as water freezes and ice crystals precipitate, the salt concentration in the remaining solution sharply increases, forming a supersaturated solution. With the gradual increase in salt solution concentration, crystallization eventually occurs, precipitating salt particles. These precipitated salt particles are squeezed and wedged into the matrix during ice crystal expansion, exerting a physical wedging action that further weakens the interfacial bonding [9,55]. The synergistic effect of osmotic pressure, ice crystal expansion pressure, and salt crystallization pressure at the vulnerable ITZ promotes the initiation of microcracks and accelerates their propagation and interconnection. Therefore, the damage to RAC under freeze–thaw in salt solution is more severe, manifested by a further increase in internal pore area, an increase in the number, width, and penetration depth of freeze–thaw damage cracks developing from the outside inward, leading to rapid loss of structural integrity.
The improvement mechanism of WPF on the frost resistance of RAC is shown in Figure 16c. The beneficial effect of WPF originates from its three-dimensional randomly distributed structure within the RAC matrix and the synergistic effects it triggers. Firstly, WPF effectively optimizes the pore structure: its incorporation blocks capillary water infiltration channels, reducing the penetration of water and Cl; simultaneously, it segments and refines large, interconnected pores within the matrix into isolated micropores, increasing the proportion of small pores and decreasing the number of large pores, resulting in a more uniform pore distribution [69]. This optimized structure not only provides buffer space for crystal volume expansion, significantly alleviating the direct destructive pressure exerted on pore walls by ice crystal frost heave and salt crystallization pressure [30], but also reduces the amount of freezable water and inhibits the migration and local accumulation of Cl within the pore network, thereby mitigating the risk of freeze–thaw damage [50]. Secondly, WPF significantly enhances the crack resistance and toughness of the material: During freeze–thaw cycles, when microcracks form in the matrix (particularly in vulnerable ITZ regions) due to ice crystal expansion and salt crystallization, fibres bridging the cracks, leveraging their high elastic modulus and tensile strength, effectively transfer and disperse stress. This avoids stress concentration at the crack tip and absorbs energy through their own deformation, thereby retarding crack propagation [63,70]. This bridge-like effect is particularly prominent at the ITZ. Fibres traversing the ITZ effectively inhibit interfacial debonding failure in RAC under freeze–thaw conditions and enhance the overall toughness of the concrete.
In summary, RAC undergoes an irreversible process in freeze–thaw (especially saline freeze–thaw) environments, driven by ITZ deterioration, involving microcrack initiation and propagation that ultimately lead to structural disintegration. However, with the improvement provided by WPF, RAC not only exhibits a significantly reduced rate of freeze–thaw deterioration but also effectively limits the depth and extent of internal damage (particularly ITZ degradation). It suppresses the propagation and interconnection of cracks, thereby significantly enhancing the structural stability and frost resistance of RAC.

4. Conclusions

This study systematically analyzed the influence of WPF on the frost resistance of RAC under freshwater and saline freeze–thaw environments, revealed the improvement mechanism of WPF on the frost resistance of RAC, and established life prediction models. The main conclusions are as follows:
(1)
With increasing freeze–thaw cycles, the mass loss rate of concrete first decreased and then increased, while the compressive strength and RDEM continuously decreased. Freeze–thaw in salt solution exacerbated the structural damage of RAC, and the frost resistance of RAC was significantly lower than that of NAC.
(2)
WPF effectively enhanced the frost resistance of RAC. The improvement was more pronounced in freshwater. After 125 freeze–thaw cycles, the RDEM attenuation amplitude of FRAC decreased by 9.69% (freshwater) and 5.77% (salt solution) compared to RAC. The compressive strength increased by 20.65% and 18.57%, respectively. The negative mass growth rate in freshwater decreased by 20.62%, and the mass loss rate in salt solution decreased by 5.84%.
(3)
WPF optimized the pore structure of RAC and enhanced the density of the matrix by bridging microcracks and dividing connected pores, effectively inhibiting the penetration of water and salt, delaying the debonding failure and crack propagation of the ITZ, and thereby improving the frost resistance of RAC.
(4)
Life prediction demonstrated that WPF increased the service life of RAC. The RDEM-based model predicted longer lives (119/90 cycles for FRAC-F/FRAC-S) but corresponded to higher strength loss rates (34%–52%). Conversely, the strength-based model predicted shorter lives (89/84 cycles) but more stable residual strength (30%–31% loss rate). A comprehensive analysis using both models is recommended for accurate life assessment.

5. Limitations and Future Research

This study provides insights into FRAC’s frost resistance under laboratory conditions but has certain limitations. For example, the 125 freeze–thaw cycles, while sufficient to reveal trends, limit the understanding of long-term durability. Additionally, this study only conducted qualitative pore structure observations via SEM; the lack of quantitative analysis (e.g., pore size distribution, fibre-matrix bonding) limits in-depth understanding of WPF’s reinforcement mechanism. Future research should consider increasing the number of freeze–thaw cycles to investigate FRAC’s long-term durability performance. It is also recommended to use advanced techniques like X-ray CT for quantitative microstructural analysis, such as measuring pore size distribution and quantifying fibre–matrix bonding, to better clarify WPF’s reinforcement mechanism.

Author Contributions

X.Y.: Writing—original draft, investigation. Z.Z.: Writing–review and editing. H.-W.T.: Writing—review and editing. B.L.: Investigation, data curation, funding acquisition. J.L. (Jiahui Li): Writing—original draft, methodology, investigation. W.Z.: Writing—review and editing. T.S.: Writing–review and editing, writing—original draft, supervision, investigation, funding acquisition. J.L. (Jianping Liu): Writing—review and editing, investigation. All authors have read and agreed to the published version of the manuscript.

Funding

This research was supported by the National Natural Science Foundation of China (52309137), the China Postdoctoral Science Foundation (2022M723687; 2024M751866), the Natural Science Foundation of Shandong Province, China (ZR2024QE218; ZR2025MS802).

Data Availability Statement

Data will be made available upon request.

Conflicts of Interest

Author Zehui Zhang was employed by the company China Design Testing Technology Co., Ltd. The remaining authors declare that the research was conducted in the absence of any commercial or financial relationships that could be construed as a potential conflict of interest.

Abbreviations

The following abbreviations are used in this manuscript:
RCARecycled coarse aggregate
RACRecycled aggregate concrete
NCANatural coarse aggregate
NACNatural aggregate concrete
SEMScanning electron microscopy
WPFWaste polypropylene fibre
FRACWaste polypropylene fibre-reinforced recycled aggregate concrete
RDEMRelative dynamic elastic modulus
ITZInterface transition zone
CDWConstruction and demolition waste

References

  1. Pandey, B.; Brelsford, C.; Seto, K.C. Rising infrastructure inequalities accompany urbanization and economic development. Nat. Commun. 2025, 16, 1193. [Google Scholar] [CrossRef]
  2. Bai, G.; Zhu, C.; Liu, C.; Liu, B. An evaluation of the recycled aggregate characteristics and the recycled aggregate concrete mechanical properties. Constr. Build. Mater. 2020, 240, 117978. [Google Scholar] [CrossRef]
  3. Wu, L.; Sun, Z.; Cao, Y. Modification of recycled aggregate and conservation and application of recycled aggregate concrete: A review. Constr. Build. Mater. 2024, 431, 136567. [Google Scholar] [CrossRef]
  4. Cho, N.; El Asmar, M.; Aldaaja, M. An analysis of the impact of the circular economy application on construction and demolition waste in the United States of America. Sustainability 2022, 14, 10034. [Google Scholar] [CrossRef]
  5. Liu, H.; Guo, D.; Xu, H. Pathway selection to achieving synergistic benefits of pollution and carbon reduction through solid waste resource utilization based on system dynamics. Environ. Impact Assess. Rev. 2025, 115, 108053. [Google Scholar] [CrossRef]
  6. Salgado, F.D.A.; Silva, F.D.A. Recycled aggregates from construction and demolition waste towards an application on structural concrete: A review. J. Build. Eng. 2022, 52, 104452. [Google Scholar] [CrossRef]
  7. Xiao, J.; Zhang, K.; Ding, T.; Zhang, Q.; Xiao, X. Fundamental issues towards unified design theory of recycled and natural aggregate concrete components. Engineering 2023, 29, 188–197. [Google Scholar] [CrossRef]
  8. Hao, L.; Liu, Y.; Wang, W.; Zhang, J.; Zhang, Y. Effect of salty freeze-thaw cycles on durability of thermal insulation concrete with recycled aggregates. Constr. Build. Mater. 2018, 189, 478–486. [Google Scholar] [CrossRef]
  9. Luan, H.; Wu, J.; Xu, C.; Hu, J.; Guo, S.; Wang, Y.; Geng, F.; Li, Z. Freeze-thaw deterioration development characterization and mechanism investigation of recycled coarse aggregate concrete under deicing salt exposure. Constr. Build. Mater. 2025, 489, 142232. [Google Scholar] [CrossRef]
  10. Huda, S.B.; Alam, M.S. Mechanical and freeze-thaw durability properties of recycled aggregate concrete made with recycled coarse aggregate. J. Mater. Civ. Eng. 2015, 27, 04015003. [Google Scholar] [CrossRef]
  11. Yuan, C.; Qu, S.; Bai, W.; Guan, J.; Xie, Y. Study on the mechanical properties and mesoscopic damage mechanism of recycled aggregate concrete under different dynamic strain rates after freeze-thaw cycles. Case Stud. Constr. Mater. 2025, 22, e04182. [Google Scholar] [CrossRef]
  12. Bogas, J.A.; Gomes, A. Non-steady-state accelerated chloride penetration resistance of structural lightweight aggregate concrete. Cem. Concr. Compos. 2015, 60, 111–122. [Google Scholar] [CrossRef]
  13. Hu, J.; Wu, J. Mechanical properties and uni-axial compression stress-strain relation of recycled coarse aggregate concrete subjected to salt-frost cycles. Constr. Build. Mater. 2019, 197, 652–666. [Google Scholar] [CrossRef]
  14. Su, T.; Wu, J.; Yang, G.; Zou, Z. Bond behavior between recycled coarse aggregate concrete and steel bar after salt-frost cycles. Constr. Build. Mater. 2019, 226, 673–685. [Google Scholar] [CrossRef]
  15. Su, T.; Wang, T.; Wang, C.; Yi, H. The influence of salt-frost cycles on the bond behavior distribution between rebar and recycled coarse aggregate concrete. J. Build. Eng. 2022, 45, 103568. [Google Scholar] [CrossRef]
  16. Thaulow, N.; Sahu, S. Mechanism of concrete deterioration due to salt crystallization. Mater. Charact. 2004, 53, 123–127. [Google Scholar] [CrossRef]
  17. Du, X.; Li, G.; Cao, A.; Wang, A.; Zhou, Y. Study of transport and binding behavior of chloride ions in concrete under single-sided salt-freezing cycle. Constr. Build. Mater. 2025, 471, 140749. [Google Scholar] [CrossRef]
  18. Chen, C.; Zhang, K.; Yin, Z.; Zhou, J. Deterioration performance of recycled aggregate Pervious concrete under freezing-thawing cycle and chloride environment. Buildings 2023, 13, 645. [Google Scholar] [CrossRef]
  19. Chen, S.; Ren, J.; Li, Y.; Ren, X.; Song, Y.; Sun, J. Macroscopic and mesoscopic deterioration behaviors of concrete under the coupling effect of chlorine salt erosion and freezing-thawing cycle. Materials 2021, 14, 6471. [Google Scholar] [CrossRef]
  20. Zhu, H.; Li, X. Experiment on freezing and thawing durability characteristics of recycled aggregate concrete. Key Eng. Mater. 2009, 400–402, 447–452. [Google Scholar] [CrossRef]
  21. Richardson, A.; Coventry, K.; Bacon, J. Freeze/thaw durability of concrete with recycled demolition aggregate compared to virgin aggregate concrete. J. Clean. Prod. 2011, 19, 272–277. [Google Scholar] [CrossRef]
  22. Atasham ul haq, M.; Wang, P.; Wang, Y.; Cui, H.; Tahir, M.; Gong, F.; Li, W. Optimization and utilization of air-entrained recycled brick aggregate concrete under freeze-thaw environment. Case Stud. Constr. Mater. 2025, 23, e04941. [Google Scholar] [CrossRef]
  23. GivKashi, M.R.; Tohidloo, M. The effect of freeze-thaw cycles and sulfuric acid attack separately on the compressive strength and microstructure of 3D-printed air-entrained concrete. Constr. Build. Mater. 2024, 440, 137411. [Google Scholar] [CrossRef]
  24. Gao, D.; Zhang, L.; Zhao, J.; You, P. Durability of steel fibre-reinforced recycled coarse aggregate concrete. Constr. Build. Mater. 2020, 232, 117119. [Google Scholar] [CrossRef]
  25. Zhang, P.; Yang, Y.; Wang, J.; Hu, S.; Jiao, M.; Ling, Y. Mechanical properties and durability of polypropylene and steel fiber-reinforced recycled aggregates concrete (FRRAC): A review. Sustainability 2020, 12, 9509. [Google Scholar] [CrossRef]
  26. Fan, X.; Wu, D.; Chen, H. Experimental research on the freeze-thaw resistance of basalt fiber reinforced concrete. Adv. Mater. Res. 2014, 919–921, 1912–1915. [Google Scholar] [CrossRef]
  27. Liu, J.; Zhao, S.; Liu, R. Study on antifreeze properties and pore structure of basalt fiber reinforced concrete. J. Phys. Conf. Ser. 2020, 1605, 012151. [Google Scholar] [CrossRef]
  28. Moceikis, R.; Kičaitė, A.; Sahmenko, G.; Selsekienė, A. Durability characterisation of glass fibre reinforced concrete by resistance to freezing and thawing. J. Sustain. Archit. Civ. Eng. 2020, 26, 98–109. [Google Scholar] [CrossRef]
  29. Al-Lebban, M.F.; Khazaly, A.I.; Shabbar, R.; Jabal, Q.A.; Asadi, L.A.R.A.I. Effect of polypropylene fibers on some mechanical properties of concrete and durability against freezing and thawing cycles. Key Eng. Mater. 2021, 895, 130–138. [Google Scholar] [CrossRef]
  30. Wang, C.; Chen, F. Durability of polypropylene fiber concrete exposed to freeze-thaw cycles with deicing salts. In Proceedings of the 2019 International Conference on Electronical, Mechanical and Materials Engineering, Wuhan, China, 20–21 January 2019; pp. 203–206. [Google Scholar] [CrossRef]
  31. Richardson, A. Polypropylene fibres in concrete with regard to durability. Struct. Surv. 2003, 21, 87–94. [Google Scholar] [CrossRef]
  32. Idrees, M.; Saeed, F.; Farooq, Z.; Köksal, F.; Shi, J. Production of waste carpet fiber-reinforced concrete as sustainable material. J. Build. Eng. 2023, 77, 107499. [Google Scholar] [CrossRef]
  33. Cui, S.; Wang, T.; Zhang, Z.; Sun, X.; Li, J.; Li, B.; Zhang, W.; Su, T.; Cao, F. Frost resistance and life prediction of recycled brick aggregate concrete with waste polypropylene fiber. Rev. Adv. Mater. Sci. 2023, 62, 20230154. [Google Scholar] [CrossRef]
  34. Han, F.; Lang, C.; Qiu, Y. Cleaning behavior based on waste textile before resource conversion and its challenges in China–A comprehensive review. J. Clean. Prod. 2022, 370, 133509. [Google Scholar] [CrossRef]
  35. JGJ 522006; Standard for Quality and Test Methods of Ordinary Concrete Sand and Stone. China Architecture & Building Press: Beijing, China, 2006. (In Chinese)
  36. JGJ 632006; Standard for Water of Concrete. China Architecture & Building Press: Beijing, China, 2006. (In Chinese)
  37. Zhang, W.; Wang, T.; Cao, F.; Wang, C.; Mei, X.; Shao, J.; Su, T. Improvement effect assessment of waste fibre on the comprehensive performance of mixed recycled aggregate concrete. Constr. Build. Mater. 2025, 491, 142633. [Google Scholar] [CrossRef]
  38. GB/T 50082-2024; Standard for Test Methods of Long-Term Performance and Durability of Ordinary Concrete. China Architecture & Building Press: Beijing, China, 2024. (In Chinese)
  39. JGJ 552011; Specification for Mix Proportion Design of Ordinary Concrete. China Architecture & Building Press: Beijing, China, 2011. (In Chinese)
  40. Ferreira, L.; Brito, J.D.; Barra, M. Influence of the pre-saturation of recycled coarse concrete aggregates on concrete properties. Mag. Concr. Res. 2011, 63, 617–627. [Google Scholar] [CrossRef]
  41. Liu, Y.; Zhou, J.; Wu, D.; Kang, T.; Liu, A. Bond behavior of recycled fiber recycled concrete with reinforcement after freeze-thaw cycles. Crystals 2021, 11, 1506. [Google Scholar] [CrossRef]
  42. Zhou, J.; Kang, T.; Wang, F. Study on mesostructure of recycled concrete with waste fiber. Concrete 2019, 11, 78–82. [Google Scholar] [CrossRef]
  43. GB/T 50476-2019; Code for Durability Design of Concrete Structures. China Architecture & Building Press: Beijing, China, 2019. (In Chinese)
  44. Duan, M.; Qin, Y.; Li, Y.; Zhou, H. Durability and damage model of polyacrylonitrile fiber reinforced concrete under freeze-thaw and erosion. Constr. Build. Mater. 2023, 29, 132238. [Google Scholar] [CrossRef]
  45. GB/T 50081-2019; Standard for Test Methods of Physical and Mechanical Properties of Concrete. China Architecture & Building Press: Beijing, China, 2019. (In Chinese)
  46. Wang, J.; Dai, Q.; Si, R.; Guo, S. Mechanical; durability, and microstructural properties of macro synthetic polypropylene (PP) fiber-reinforced rubber concrete. J. Clean. Prod. 2019, 234, 1351–1364. [Google Scholar] [CrossRef]
  47. Lu, J.; Liu, J.; Yang, H.; Wan, X.; Gao, J.; Zhang, J.; Li, P. Experimental investigation on the mechanical properties and pore structure deterioration of fiber-reinforced concrete in different freeze-thaw media. Constr. Build. Mater. 2022, 350, 128887. [Google Scholar] [CrossRef]
  48. Ren, J.; Lai, Y. Study on the durability and failure mechanism of concrete modified with nanoparticles and polypropylene fiber under freeze-thaw cycles and sulfate attack. Cold Reg. Sci. Technol. 2021, 188, 103301. [Google Scholar] [CrossRef]
  49. Zhang, W.; Pi, Y.; Kong, W.; Zhang, Y.; Wu, P.; Zeng, W.; Yang, F. Influence of damage degree on the degradation of concrete under freezing-thawing cycles. Constr. Build. Mater. 2020, 260, 119903. [Google Scholar] [CrossRef]
  50. Wu, C.; Jierula, A.; Fu, Z.; Chen, Y.; Kuang, Y.; Xia, J. Study on the mechanism of anti sulfate freeze-thaw, dry wet cycle of polypropylene fiber foam concrete. Constr. Build. Mater. 2025, 463, 140144. [Google Scholar] [CrossRef]
  51. Feng, Z.; Wu, J.; Hu, D.; Zhao, L. Uniaxial compressive behavior and unified damage constritutive model of various types of recycled coarse aggregate concrete under freeze-thaw action. Mater. Today Commun. 2024, 41, 110976. [Google Scholar] [CrossRef]
  52. Yang, W.; Tang, Z.; Wu, W.; Zhang, K.; Yuan, J.; Li, H.; Feng, Z. Effect of different fibers on impermeability of steam cured recycled concrete. Constr. Build. Mater. 2022, 328, 127063. [Google Scholar] [CrossRef]
  53. Li, S.; Yin, S.; Gao, Y. Analysis of interface properties between TRC and concrete under chloride attack based on fracture energy. Int. J. Concr. Struct. Mater. 2020, 14, 28. [Google Scholar] [CrossRef]
  54. Xiao, Q.; Wu, Z.; Qiu, J.; Dong, Z.; Shi, S. Capillary water absorption performance and damage constitutive model of recycled concrete under freeze-thaw action. Constr. Build. Mater. 2022, 353, 129120. [Google Scholar] [CrossRef]
  55. Valenza, J.J.; Scherer, G.W. A review of salt scaling: II. Mechanisms. Cem. Concr. Res. 2007, 37, 1022–1034. [Google Scholar] [CrossRef]
  56. Gong, S.; Bai, L.; Tan, Z.; Xu, L.; Bai, X.; Huang, Z. Mechanical properties of polypropylene fiber recycled brick aggregate concrete and its influencing factors by gray correlation analysis. Sustainability 2023, 15, 11135. [Google Scholar] [CrossRef]
  57. Xu, F.; Li, T.; Li, C.; Li, Z.; Wang, S.; Zhao, N. Compressive behavior, microstructural properties, and freeze-thaw behavior of tailing recycled aggregate concrete with waste polypropylene fiber addition. Materials 2021, 14, 6712. [Google Scholar] [CrossRef]
  58. Dong, W.; Ji, Y.; Zhou, M. Microstructure and service-life prediction models of aeolian sand concrete under freeze-thaw damage. Int. J. Pavement Res. Technol. 2024, 17, 908–917. [Google Scholar] [CrossRef]
  59. Wiyanto, H.; Makarim, C.A.; Gondokusumo, O.; Siregar, J.P.; Irawan, A.P.; Cionita, T.; Najid, N. Determining concrete structure condition rating based on concrete compressive strength. Buildings 2022, 12, 776. [Google Scholar] [CrossRef]
  60. Ma, S.; Wu, Y.; Bao, P. Study on damage mechanism and residual life of clay brick in central plains of China under freeze-thaw environment. Arab. J. Sci. Eng. 2022, 47, 13317–13331. [Google Scholar] [CrossRef]
  61. Liu, Y.; Yuan, N.; Xu, H.; Yang, Q. Evaluation of ZIF-67 particle size and dosage on cement paste strength, microstructural development and calcium hydroxide morphology. Powder Technol. 2025, 464, 121271. [Google Scholar] [CrossRef]
  62. Liu, H.; Liu, C.; Wu, J.; Gao, Y.; Shao, J.; Wang, C.; Su, T.; Cao, F.; Zhang, W.; Yang, Q.; et al. Preparation of high-belite calcium sulfoaluminate cement and calcium sulfoaluminate cement from industrial solid waste: A Review. Sustainability 2025, 17, 4269. [Google Scholar] [CrossRef]
  63. Yuan, Z.; Jia, Y. Mechanical properties and microstructure of glass fiber and polypropylene fiber reinforced concrete: An experimental study. Constr. Build. Mater. 2021, 266, 121048. [Google Scholar] [CrossRef]
  64. Tang, Z.; He, X.; Wei, B.; Wang, H.; Zhou, M.; Wu, C. Flexural capacity of concrete beams reinforced by different types of polypropylene fibers and FRP bars. J. Build. Eng. 2025, 106, 112650. [Google Scholar] [CrossRef]
  65. Wu, J.; Liu, K.; Wang, S.; Quan, X.; Tian, P.; Tian, Z.; Ying, H. Evaluation of hybrid steel-polyethylene fiber-reinforced aggregated solid waste cementitious composites subjected to seawater freeze-thaw cycles attack: Durability, 3D pore structure, and microstructure. Constr. Build. Mater. 2025, 493, 143069. [Google Scholar] [CrossRef]
  66. Huang, D.; Wang, X.; Li, X.; Su, L.; Tian, J. Advanced nuclear magnetic resonance technology analysis of hybrid fiber reinforced concrete for optimized pore structure and strength. Constr. Build. Mater. 2025, 467, 140383. [Google Scholar] [CrossRef]
  67. Gokce, A.; Nagataki, S.; Saeki, T.; Hisada, M. Freezing and thawing resistance of air-entrained concrete incorporating recycled coarse aggregate: The role of air content in demolished concrete. Cem. Concr. Res. 2004, 34, 799–806. [Google Scholar] [CrossRef]
  68. Fu, K.; Sang, Y.; Chen, C.; Liu, K. Frost resistance of recycled aggregate concrete subjected to coupling sustained compressive load and freeze-thaw cycles. Constr. Build. Mater. 2024, 448, 138219. [Google Scholar] [CrossRef]
  69. Liang, N.; Geng, S.; Mao, J.; Liu, X.; Zhou, X. Investigation on cracking resistance mechanism of basalt-polypropylene fiber reinforced concrete based on SEM test. Constr. Build. Mater. 2024, 411, 134102. [Google Scholar] [CrossRef]
  70. Liang, N.; You, X.; Yan, R.; Miao, Q.; Liu, X. Experimental investigation on the mechanical properties of polypropylene hybrid fiber-reinforced roller-compacted concrete pavements. Int. J. Concr. Struct. Mater. 2022, 16, 3. [Google Scholar] [CrossRef]
Figure 1. Surface morphology of aggregates.
Coatings 15 01070 g001
Figure 2. Aggregate grading curve.
Coatings 15 01070 g002
Figure 3. Disposal process of WPF.
Coatings 15 01070 g003
Figure 4. Mixing process.
Coatings 15 01070 g004
Figure 5. Test procedure.
Coatings 15 01070 g005
Figure 6. Surface morphology of each group of specimens under different freeze–thaw cycles.
Coatings 15 01070 g006
Figure 7. Mass loss rate of concrete specimens in each group under freeze–thaw cycles.
Coatings 15 01070 g007
Figure 8. Influence of freeze–thaw cycles on the RDEM of specimens.
Coatings 15 01070 g008
Figure 9. Influence of freeze–thaw cycles on the compressive strength of concrete.
Coatings 15 01070 g009
Figure 10. Enhancement of RAC compressive strength by WPF for different freeze–thaw environments and freeze–thaw cycles.
Coatings 15 01070 g010
Figure 11. Compressive strength prediction results.
Coatings 15 01070 g011
Figure 12. Fitting result.
Coatings 15 01070 g012
Figure 13. Fitting result.
Coatings 15 01070 g013
Figure 14. SEM images of RAC.
Coatings 15 01070 g014
Figure 15. SEM images of FRAC.
Coatings 15 01070 g015
Figure 16. Mechanism diagram of freeze–thaw.
Coatings 15 01070 g016
Table 1. Coarse aggregate physical properties.
Type of Coarse AggregatesApparent Density (kg/m3)Crushing Index (%)Water Absorption (%)Mud Content (%)
RCA2541163.51.5
NCA26357.51.30.5
Table 2. Test results of physical performance indicators of cement [37].
Cement GradeDensity
(g/cm3)
Specific Surface Area (m2/kg)Initial/Final Condensation Time (min)3d/28d Compressive Strength (MPa)
P O 42.53.21312195/25924.6/45.2
Table 3. Fibre performance parameters [37].
Monofilament
Diameter (mm)
Elastic
Modulus (MPa)
Tensile
Strength (MPa)
Water
Absorption (%)
Ultimate
Elongation (%)
Density
(g/cm3)
0.0433.67 × 103380<0.101.810.91
Table 4. Mix proportions of the concrete.
SpecimensNACRACFRAC
Cement (kg/m3)485485485
Sand (kg/m3)540540540
Water (kg/m3)184184184
RCA (kg/m3)-11501150
NCA (kg/m3)1150--
Additional water (%)-3434
WPF volume fraction (%)--0.12
Water-reducing agent (%)0.110.110.11
Air-entraining agent (%)0.110.110.11
Air content (%)4.34.54.6
Table 5. Specimen design group.
Specimen GroupingMediumSpecimen Size (mm3)Number of Freeze–Thaw Cycles
NAC-Ffreshwater100 × 100 × 100
100 × 100 × 400
0, 25, 50, 60, 75, 100, 110, 125
NAC-Ssalt solution100 × 100 × 100
100 × 100 × 400
0, 25, 50, 60, 75, 100, 110, 125
RAC-Ffreshwater100 × 100 × 100
100 × 100 × 400
0, 25, 50, 60, 75, 100, 110, 125
RAC-Ssalt solution100 × 100 × 100
100 × 100 × 400
0, 25, 50, 60, 75, 100, 110, 125
FRAC-Ffreshwater100 × 100 × 100
100 × 100 × 400
0, 25, 50, 60, 75, 100, 110, 125
FRAC-Ssalt solution100 × 100 × 100
100 × 100 × 400
0, 25, 50, 60, 75, 100, 110, 125
Note: F denotes the freeze–thaw medium as freshwater; S denotes the freeze–thaw medium as a 3.5% mass fraction NaCl solution (salt solution).
Table 6. Key frost resistance indicators for test specimens at different critical freeze–thaw cycles.
Freeze–Thaw CyclesNAC-FNAC-SRAC-FRAC-SFRAC-FFRAC-S
Mass loss rate (%)0000000
75−0.16−0.04−1.080.06−0.890.17
1250.110.22−0.972.57−0.772.42
RDEM attenuation (%)0100100100100100100
7594.5890.1171.8562.2178.5566.67
12584.0578.2152.7135.3657.2939.09
Compressive strength loss rate (%)0000000
7510.3410.9123.3828.2621.9126.87
12518.9124.5657.2761.4454.6859.6
Table 7. Weibull distribution value.
Specimen GroupingFreeze–Thaw Cycle1/R(n)X = ln(n)Y = ln[ln(1/R(n))]Specimen GroupingFreeze–Thaw Cycle1/R(n)X = ln(n)Y = ln[ln(1/R(n))]
RAC-F251.0713.219−2.678RAC-S251.0713.219−2.686
501.1393.912−2.041501.1883.912−1.759
601.1944.094−1.730601.3314.094−1.252
751.3924.277−1.107751.6074.277−0.745
1001.5384.605−0.8421001.9274.605−0.422
1101.6704.700−0.6671102.2014.700−0.237
1251.8974.828−0.4461252.8284.8280.039
FRAC-F251.0583.219−2.882FRAC-S251.0663.219−2.750
501.1273.912−2.123501.1583.912−1.920
601.2104.094−1.657601.2364.094−1.551
751.2734.277−1.421751.5004.277−0.903
1001.4844.605−0.9301001.8264.605−0.507
1101.6074.700−0.7461102.0844.700−0.309
1251.7464.828−0.5851252.5584.828−0.063
Table 8. Weibull parameter values.
Specimen GroupingABR2Specimen GroupingABR2
RAC-F1.43677−7.441560.96556RAC-S1.71116−8.253310.98491
FRAC-F1.46745−7.690480.99001FRAC-S1.72544−8.448310.97722
Table 9. RDEM life prediction model validation.
Specimen GroupingRAC-FRAC-SFRAC-FFRAC-S
Service life1118311990
Predicted compressive strength (MPa)20.7526.8921.7629.70
Loss rate of maximum strength (%)47.3731.9051.5933.67
Table 10. Weibull distribution value.
Specimen GroupingFreeze–Thaw Cycle1/R(n)X = ln(n)Y = ln[ln(1/R(n))]Specimen GroupingFreeze–Thaw Cycle1/R(n)X = ln(n)Y = ln[ln(1/R(n))]
RAC-F2520.2553.2191.101RAC-S2519.0863.2191.081
507.9243.9120.727506.2103.9120.602
606.0154.0940.585604.8264.0940.454
754.2074.2770.362753.5934.2770.246
1002.5574.605−0.0631002.3794.605−0.143
1102.1474.700−0.2691102.0234.700−0.350
1251.6854.828−0.6511251.5874.828−0.772
FRAC-F2526.5423.2191.187FRAC-S2530.0483.2191.225
509.0143.9120.788506.5853.9120.634
606.6534.0940.639605.0284.0940.479
754.5344.2770.413753.7664.2770.282
1002.7024.605−0.0061002.5314.605−0.074
1102.2584.700−0.2051102.1354.700−0.277
1251.7584.828−0.5731251.6294.828−0.717
Table 11. Weibull parameter values.
Specimen GroupingABR2Specimen GroupingABR2
RAC-F−1.048034.693170.90758RAC-S−1.083444.746670.92739
FRAC-F−1.056054.791540.91925FRAC-S−1.118184.955780.94631
Table 12. Validation of compressive strength life prediction model.
Specimen GroupingRAC-FRAC-SFRAC-FFRAC-S
Service life84768984
Predicted compressive strength (MPa)28.0928.3031.5131.04
Loss rate of maximum strength (%)28.7728.3229.8930.67
Disclaimer/Publisher’s Note: The statements, opinions and data contained in all publications are solely those of the individual author(s) and contributor(s) and not of MDPI and/or the editor(s). MDPI and/or the editor(s) disclaim responsibility for any injury to people or property resulting from any ideas, methods, instructions or products referred to in the content.