Article

Analysis of AC and DC Interference in One Buried Gas Pipeline

1
China National Offshore Oil Corporation, Beijing 100027, China
2
Institute of Oceanology, Chinese Academy of Sciences, Qingdao 266071, China
3
University of Chinese Academy of Sciences, Beijing 100049, China
*
Authors to whom correspondence should be addressed.
Coatings 2025, 15(9), 1056; https://doi.org/10.3390/coatings15091056
Submission received: 12 August 2025 / Revised: 27 August 2025 / Accepted: 6 September 2025 / Published: 9 September 2025
(This article belongs to the Special Issue Surface Protection for Metal Materials)

Abstract

The complex interference created by several sources for pipelines has not been sufficiently studied. In this study, four types of interference sources were monitored and analyzed. AC voltage monitoring, DC potential monitoring, current density monitoring, and excavation observation and measurement for test pieces and the decouplers were employed to assess the AC/DC interference of one real buried pipeline in situ. The peak value obtained from the second measurement at Pile 33 decreased from 1341.8 V to 143.7 V, indicating that the 1341.8 V in the first measurement may be caused by a sudden grounding of the electrode, while the 143.7 V may be caused by the normal induced voltage. The most negative DC interference potential between the pipeline and the Cu/CuSO4 reference electrode was −11.946 V. The most positive DC interference potential between the pipeline and the Cu/CuSO4 reference electrode was 4.862 V. Pile 3 had a maximum DC current density of 240 mA/m2, and Pile 4 had a maximum AC current density of 0.615 A/m2. After excavating the test piece at Pile 3, the point with maximum DC interference, there were obvious pitting corrosion characteristics, and the corrosion products were mainly γ-FeOOH and Fe3O4. It indicated that the coupling of long-term higher positive DC current density or (DC potential) and short-term higher transient AC voltage or (AC current density) may lead to corrosion. After excavating the test piece at the point with maximum AC interference, namely, Pile 4, there were no significant AC or DC corrosion characteristics. This finding suggested that the combination of long-term low AC current voltage or (low AC current density) and long-term more negative low DC current density or (DC potential) did not result in obvious corrosion. The decouplers in this measurement significantly reduced AC interference above 2 V, but the isolation of transient AC shocks and AC interference below 2 V were not significant. During analysis of AC and DC interference, in addition to considering the value of the interference, the duration time of the interference was also an important factor. Instantaneous sharp peaks cannot represent the long-term average voltage or potential current density. The average value should be used as the main basis for judgement, and the instantaneous value should be used as the secondary basis for judgement.

1. Introduction

Stray current interference poses a significant threat to the safety and integrity of buried oil and gas pipelines. The interference can be categorized into two primary types: direct current (DC) interference and alternating current (AC) interference [1,2,3].
Over the past five years, research on DC interference sources has primarily focused on interference from DC rail traffic and high-voltage DC (HVDC) facilities. Du [4] studied the corrosion behavior of buried pipelines and the correlation between corrosion rates and dynamic DC rail traffic using laboratory simulations and on-site specimen tests. The results shows that the majority of fluctuation periods of interference from DC rail traffic were 50–200 s in China. The dynamic cycle significantly affected the corrosion rate. Feng [5] developed a measurement device to record pipe/ground potential, surface potential gradient, and current located in the vicinity of the Fujin Road station of Shanghai Metro Line 1. The results shows that over-protection and under-protection had occurred, requiring drain management. Peng [6] conducted an analysis for the interference mechanism of DC rail traffic on one pipeline using an in situ monitoring method. In recent years, with the widespread application of HVDC facilities, the interference caused by HVDC systems has increasingly drawn attention. Zhang [7] focused on the variation of DC interference parameters and the corrosion behavior of X80 steel subjected to a 100 V DC potential in Guangdong real soil with five different water contents using simulation experiments. The results shows that there were obvious differences in the current density changes of X80 specimens in various soil conditions with varying contents of water under interference of 100 V DC potential. Xu [8,9] studied the interference of buried pipelines from HVDC grounding electrodes and the corrosion behavior of X80 steel in clay soil with different water contents under HVDC interference.
Since 2020, research on AC interference sources has primarily focused on AC high-voltage transmission facilities and AC electric railroads. Wang [10] investigated the effect of transmission towers on AC interference of buried pipelines under steady-state conditions. When there were towers, the current density on the surface of the pipeline tended to be higher. The spacing between the pipeline and the power tower and the burial depth of the pipeline should be considered when calculating the interference. Moraes [11] studied the problem of electromagnetic interference between power lines and pipelines. The Electro-Magnetic Transient Program was used to predict induced voltage values due to interference caused by overhead power lines as well as fault conditions. Stress voltage values in the interfered pipeline were on the order of 50 kV, exposing the coating to the risk of breakdown, which may lead to corrosion and pipeline failure. Chen [12] analyzed the dynamic fluctuation characteristics of pipelines near high-speed railroads according to field test data. The effects of AC current density and typical dynamic disturbance cycles on the corrosion rate of X65 steel were investigated. The results shows that the corrosion rates under steady and dynamic AC interference were higher than those under natural corrosion. With the increase in the peak AC current density and interference time of each cycle, the dynamic AC corrosion rate increased. When the interference time increased to 350 s in each interference cycle, the dynamic AC corrosion rate was equivalent to the steady AC corrosion rate. Chen [13] studied the model of AC interference from high-speed railroads using auto-transformer (AT) power supply. The effects of train running position, track-to-ground transition resistance, and crossing angle were discussed. The interference was mainly from the induced voltage of high-speed railroad. Especially when the track-to-ground transition resistance was less than 50 Ω·km, AC interference voltage peaks appeared. The dynamic AC corrosion rate increased with the extension of the interference time within each interference cycle from high-speed railroads. After the JAC ≥ 100 A/m2, the dynamic AC corrosion rate shows a three-stage change with a negative shift of CP potential, first decreasing, then increasing, and then decreasing again [14]. Wang’s research shows that corrosion distribution was greatly influenced by spatial interaction between buried pipeline and rail transit system including crossing angle, parallel distance, dynamic characteristics, and operation mode of locomotive [15]. Considerable research has recently been conducted on numerical calculations of AC interference. Lucca [16] used a stochastic method assisted by finite elements to evaluate the AC corrosion of buried pipelines near 50 Hz transmission lines. Other scholars used methods such as CDEGS to calculate AC interference from power towers on buried steel pipelines during lightning strikes, to investigate AC electromagnetic interference between railways and nearby power lines, and to study coupled interference from high-voltage transmission lines on adjacent buried steel pipelines [17,18,19]. Mostafa and Osama investigated the effectiveness of potassium hydroxide polarization cells (KOH-PC) and solid-state polarization cells (SS-PC) in reducing pipelines’ AC interference from overhead power lines [20,21,22,23].
The above research is very valuable. However, most studies have only considered the influence of one interference source, while in the actual project, the long-distance pipeline may be affected by interference factors from multiple sources. The pipeline is close to high-voltage power lines, power towers, rail transit systems, industrial facilities, and other infrastructure. It runs parallel to or crosses high-voltage power lines and rail transit systems at various points along its route. As a result, there is a significant presence of both AC and DC interference hazards. In situ monitoring serves as an effective approach for acquiring real-time and long-term data on such interference. To assess the impact of AC and DC interference on the pipeline, this study employed a self-developed stray current monitoring device to record AC voltage and DC potential levels. Additionally, current density measurements were obtained at selected test piles using a custom-built current density monitoring device. Field investigations were conducted to evaluate the effectiveness of decouplers in mitigating AC interference at specific locations. Furthermore, selected test coupons were excavated for visual inspection and comprehensive measurement analysis.

2. Methods and Materials

Figure 1 is the experimental research program, which includes six items.

2.1. Test of AC Voltage and DC Potential

The AC voltage and DC potential of the buried pipelines relative to the reference electrodes are important parameters for determining the magnitude and trend of AC and DC interference. The AC/DC interference monitor employed in this study was a self-developed instrument that utilized wireless transmission to periodically send the collected data. In order to prevent loss during monitoring, the instrument can be buried in the ground. First, the cathodic protection system must be closed during monitoring. Subsequently, one end of the monitor should be connected to the potential or voltage terminal of the test piles, while the other end should be connected to the reference electrodes. In order to minimize the measurement error caused by the soil voltage gradient, the other end of the reference electrodes should be located as close as possible to the pipeline at the welding point of the wires of the test piles. In addition to placing the reference electrodes deep into the soil, it was also necessary to wet the surrounding soil with water. There were two types of reference electrodes: one was a copper/copper sulfate reference electrode used to measure DC interference potentials, and the other was a steel electrode used to measure AC interference voltage. The copper/copper sulfate reference electrodes should be buried in the deep soil in advance, near the test piles. When measuring AC voltage, the steel electrodes should be more than 1 m deep in the soil, and the minimum perforation diameter of the steel electrodes should not be less than 5 cm. The distance between the copper/copper sulfate electrodes and the pipeline was less than or equal to 10 cm, and the burial depth of the copper/copper sulfate electrodes was equal to the burial depth of the pipeline. A saturated mercury electrode was used to calibrate the copper sulfate reference electrode. The distance between the steel electrodes and the pipeline was greater than or equal to 10 m. The soil resistivity was 79.88 Ω·m [24]. Because the AC interference voltage was generally higher, the testing accuracy would not be affected by the polarization of the electrodes. For this reason, the saturated copper/copper sulfate electrodes were generally not used to measure AC voltage.
The main performance of the instrument was shown in Table 1.
Thirty-seven test piles along the pipeline were selected for assessment of stray current interference. Continuous measurements were conducted over a 24-h period. The average and peak distributions of AC and DC interference at these points were plotted. Time series analysis of AC and DC interference for each test pile was performed over the 24-h monitoring period. In order to eliminate errors in the measurements and to compare them with each other, the experiments were carried out twice within the same two 24-h periods.
The average value of AC voltage at 1 ms was calculated as noted in Equation (1) [25]:
U P = i = 1 n U i n
U p is the average value of AC voltage during the specified time period (V).
U i is the AC voltage readings during the specified time period (V).
n is the total number of readings within the specified time period.
The average value of positive and negative DC potential was calculated as noted in Equation (2):
V ± = i = 1 n V i ± n
V ± is the average value of positive and negative DC pipeline/ground potential within the specified time period (V).
V i ± is the total number of readings of positive and negative DC pipeline/ground potential within the specified time period (V).

2.2. Current Density Measurement

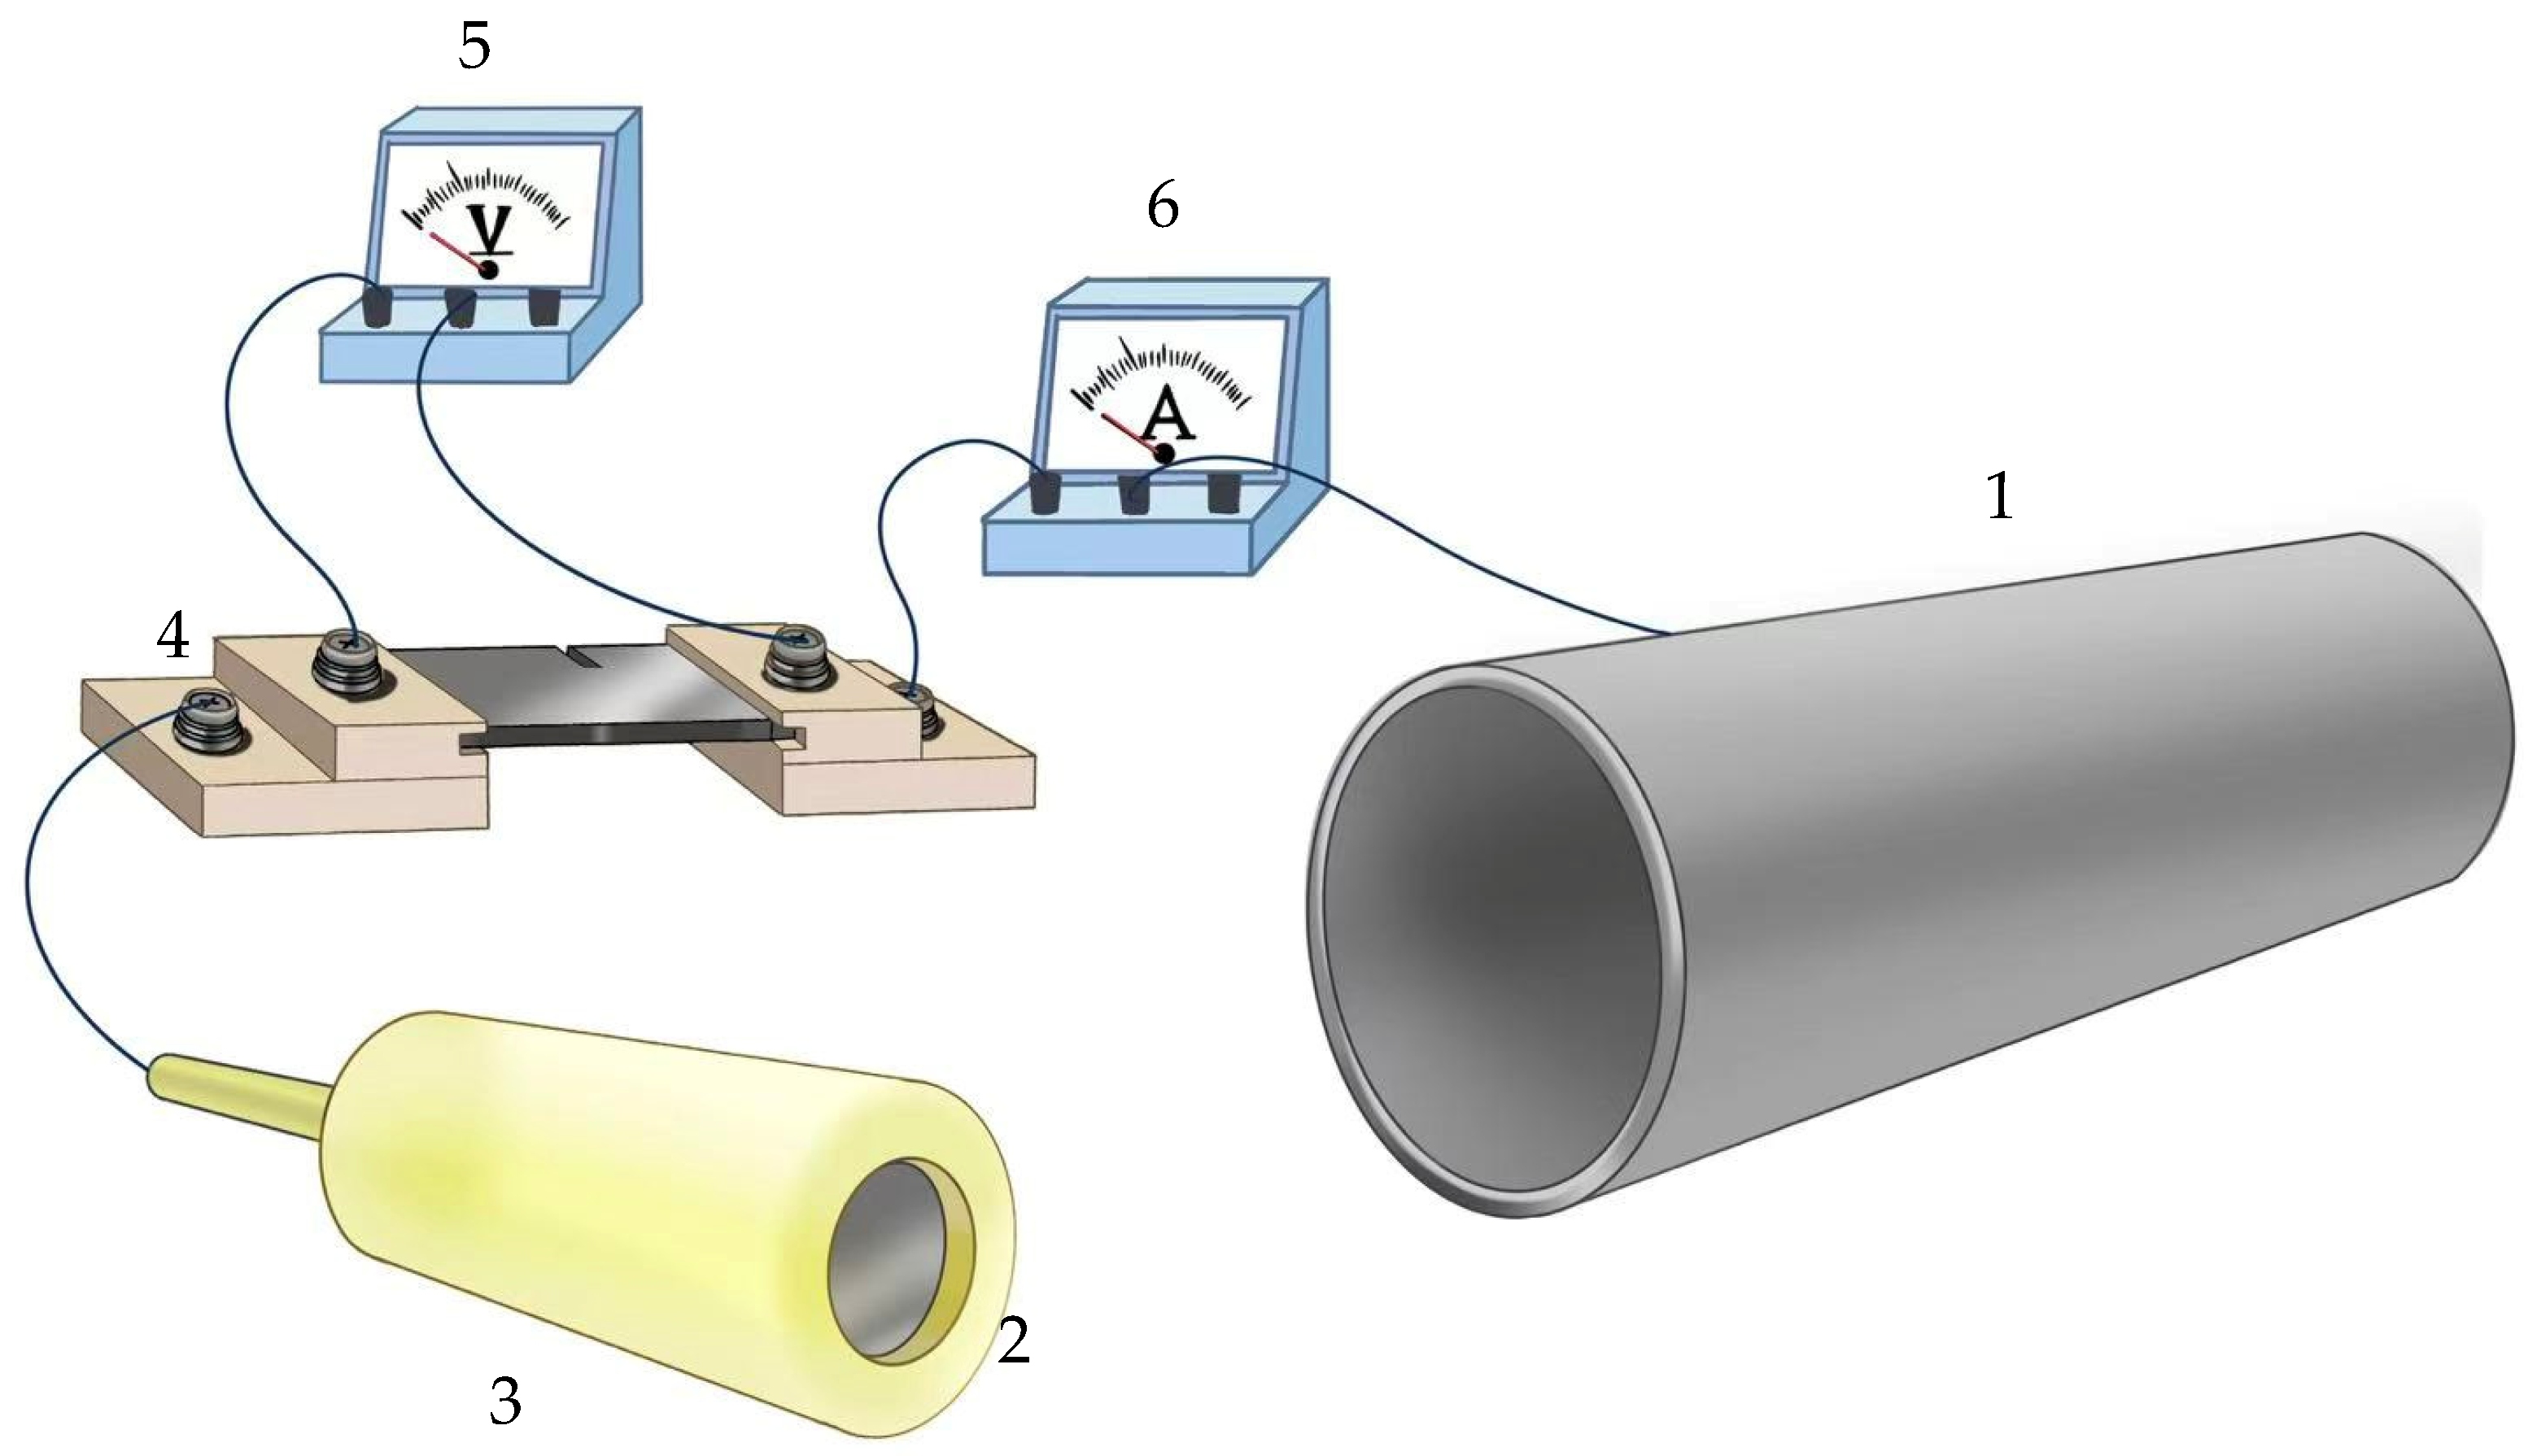
According to the results of AC voltage and DC potential measurement, one test pile with the most significant average value of AC interference and one test pile with the most positive peak value of DC interference were selected to measure the AC and DC current density using the test piece method, as illustrated in Figure 2 [26,27].
The material of the test pieces is equivalent to the X80 pipeline steel. The exposed area of the test pieces is 1 cm2. The surface was meticulously polished with sandpaper and then subsequently cleaned with anhydrous ethanol before use.
Insulated wire was led out of the end of the test pieces, leaving only one measurement surface, and other surfaces were sealed with epoxy resin. Two test pieces should be buried in proximity to the reference electrodes to ensure optimal contact with the soil and to establish a soil corrosion environment analogous to that of the buried pipeline.
The trailing wires of the test pieces were connected in series with a standard resistor, and the voltage across the standard resistor was measured and recorded using a high impedance DC voltmeter. An AC ammeter was connected in series between the other end of the standard resistor and the pipeline.
The resistance value of the standard resistor was taken as R = 0.0075 Ω. The DC current density was calculated using Equations (3) and (4). The AC current density was calculated using Equation (5).
I = V R
i = I S
j = J S
S was the exposed area of the test pieces (cm2). V was the voltage across the standard resistor. I was the actual measured DC current value, and i was the calculated DC current density. The unit of DC current density was expressed as (mA/m2). J was the actual measured AC current value. j was the calculated AC current density. The unit of AC current density was expressed in (A/m2).

2.3. Excavation Observation and Measurement

After the current density measurement, the two test pieces used for current density measurement in Section 2.2 were excavated, observed, and measured, separately.

2.3.1. Surface Observation

Took out the two pieces, dried the soil on the surface of the pieces with a dryer, gently removed the soil on the surface with a brush to avoid destroying the corrosion layer, and used visual observation for the surface condition.

2.3.2. EDS Analysis

The test piece with more serious corrosion observed on the surface was selected from the two pieces, and the surface soil of the piece was washed with anhydrous ethanol. After drying the piece, the surface products were analyzed using EDS.

2.3.3. XRD Measurement

After EDS analysis, surface analysis of products was performed using XRD.

2.3.4. SEM Observation

Put two test pieces into ultrasonic cleaner. Sprayed them with distilled water to remove any surface powder. Took the test two pieces out of the ultrasonic cleaner and dried them. Observed the corrosion morphology of the surface using SEM.

2.3.5. Weightlessness Measurement

The two test pieces were weighed with an analytical balance (accuracy 0.01 mg) before and after the measurement. The weight loss rate was calculated according to Equation (6).
w % = w 0 w t w 0 × 100 %
w % is the weight loss rate.
w 0 is the initial weight of test pieces.
w t is the weight of test pieces after excavation and washing.

2.4. Measurement After Connecting the Decouplers

Test Pile 0, Pile 1, Pile 9, Pile 14, Pile 17, and Pile 33 were selected to connect with the decouplers. AC interference voltage was measured again for 24 h during the same period.

3. Results and Discussion

3.1. Peak and Average Value Distribution of AC Interference Voltage

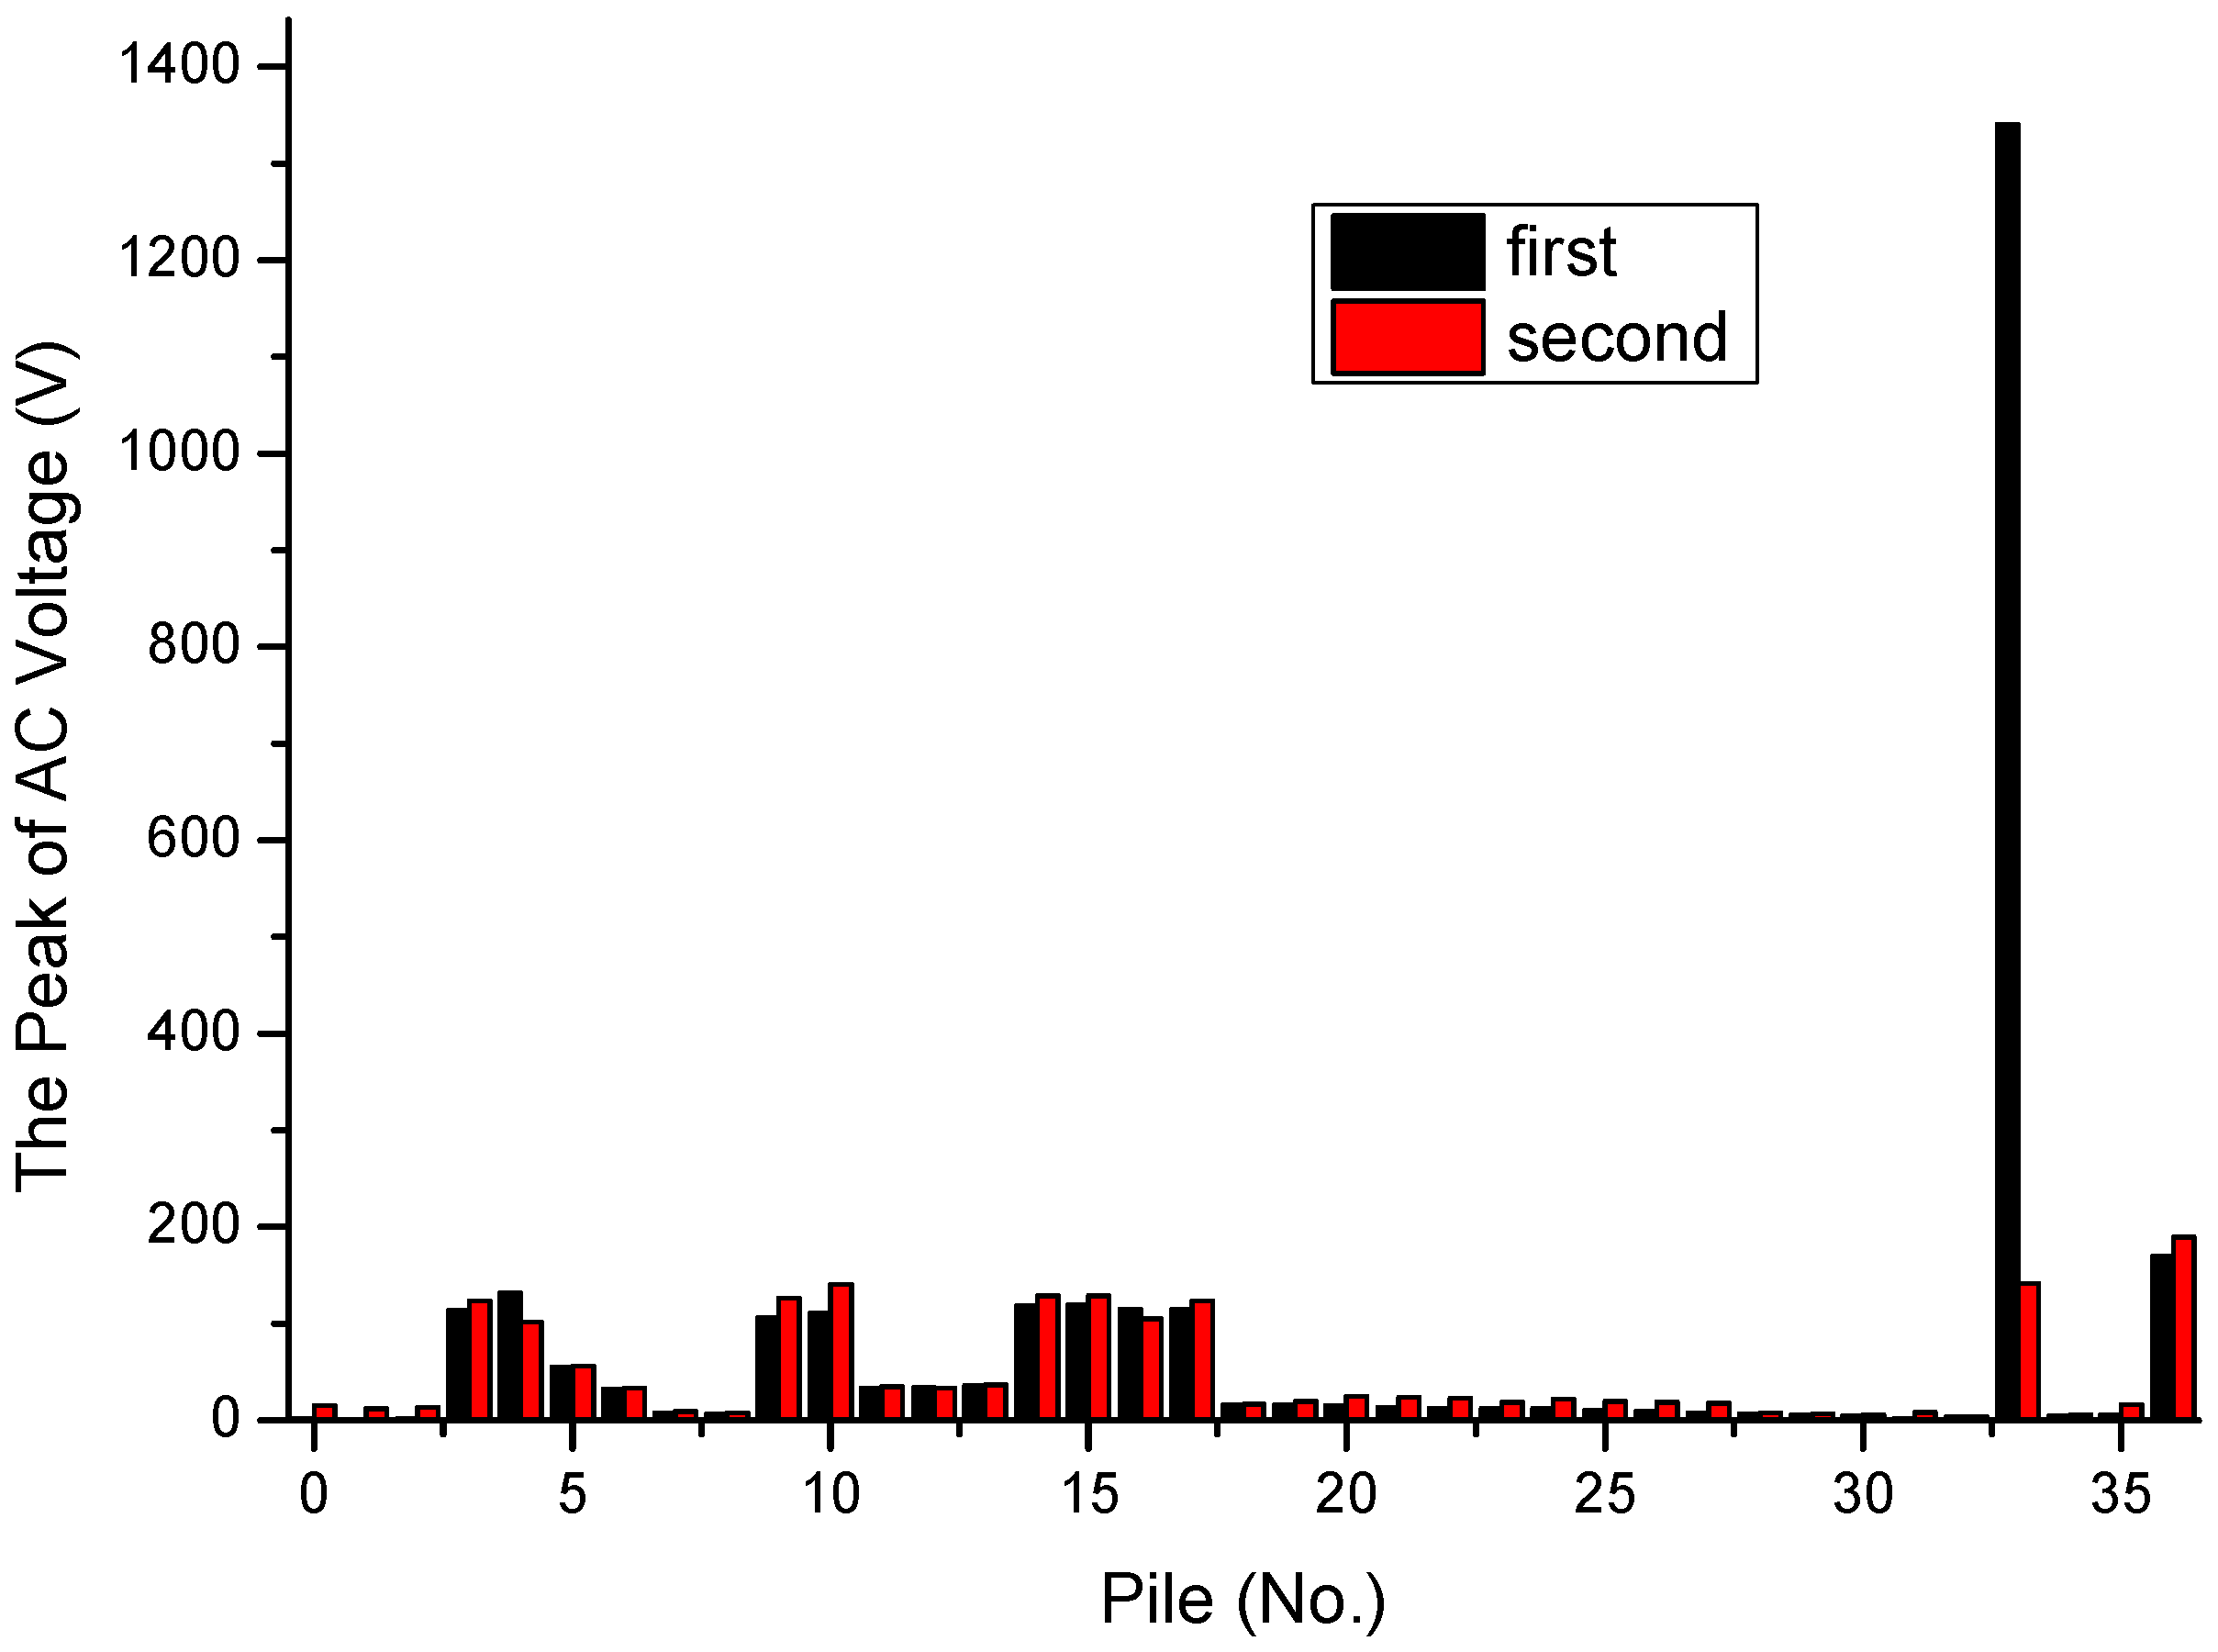
Table 2 presents the AC and DC criteria from referenced standards [28,29]. Figure 3 shows the distribution histograms of the peak values of AC interference along the pipeline. The peak value was the maximum value measured. The black bars in the histogram were the peak values obtained from the first measurement, while the red bars were the peak values obtained from the second measurement. Figure 3 indicates that the pipeline was exposed to AC interference of various magnitudes. The peak values at some test piles exceeded 100 V both in the first and second measurements, which indicates that the pipeline had been subjected to AC interference. High voltages on the pipeline may affect the safety of pipeline operation and the personal safety of the operators.
The first measurement revealed that the maximum value of AC interference was 1341.8 V at Pile 33. The second measurement shows that the maximum value of AC interference was 189.83 V at Pile 36. The peak value of 1341.8 V at Pile 33 obtained in the first measurement far exceeded the normal induced voltage value. Fortunately, this value lasted for less than 1 s. The peak voltage value at Pile 33 had dropped from 1341.8 V to 143.7 V in the second measurement. When investigating the cause, a high-voltage power tower was found approximately 1 km away from the test pile. The abnormal voltage at Pile 33 was likely caused by interference coming from the sudden grounding of equipment at the high-voltage power tower. Generally, when the insulating components of the power tower fail or during a transient short circuit, a large fault current is suddenly discharged from the grounding point into the earth. At this time, if the pipeline is within the grounding electric field generated by the fault current, it will be subjected to significant AC interference. Therefore, the peak value obtained from the second measurement at pile 33 decreased from 1341.8 V to 143.7 V, indicating that the 1341.8 V may be caused by a sudden grounding of the power tower, while the 143.7 V may be caused by the induced voltage. We looked up the records of the tower management company at that time and translated them into English, as shown in Table 3. Table 3 shows that the power tower exactly malfunctioned at that moment.
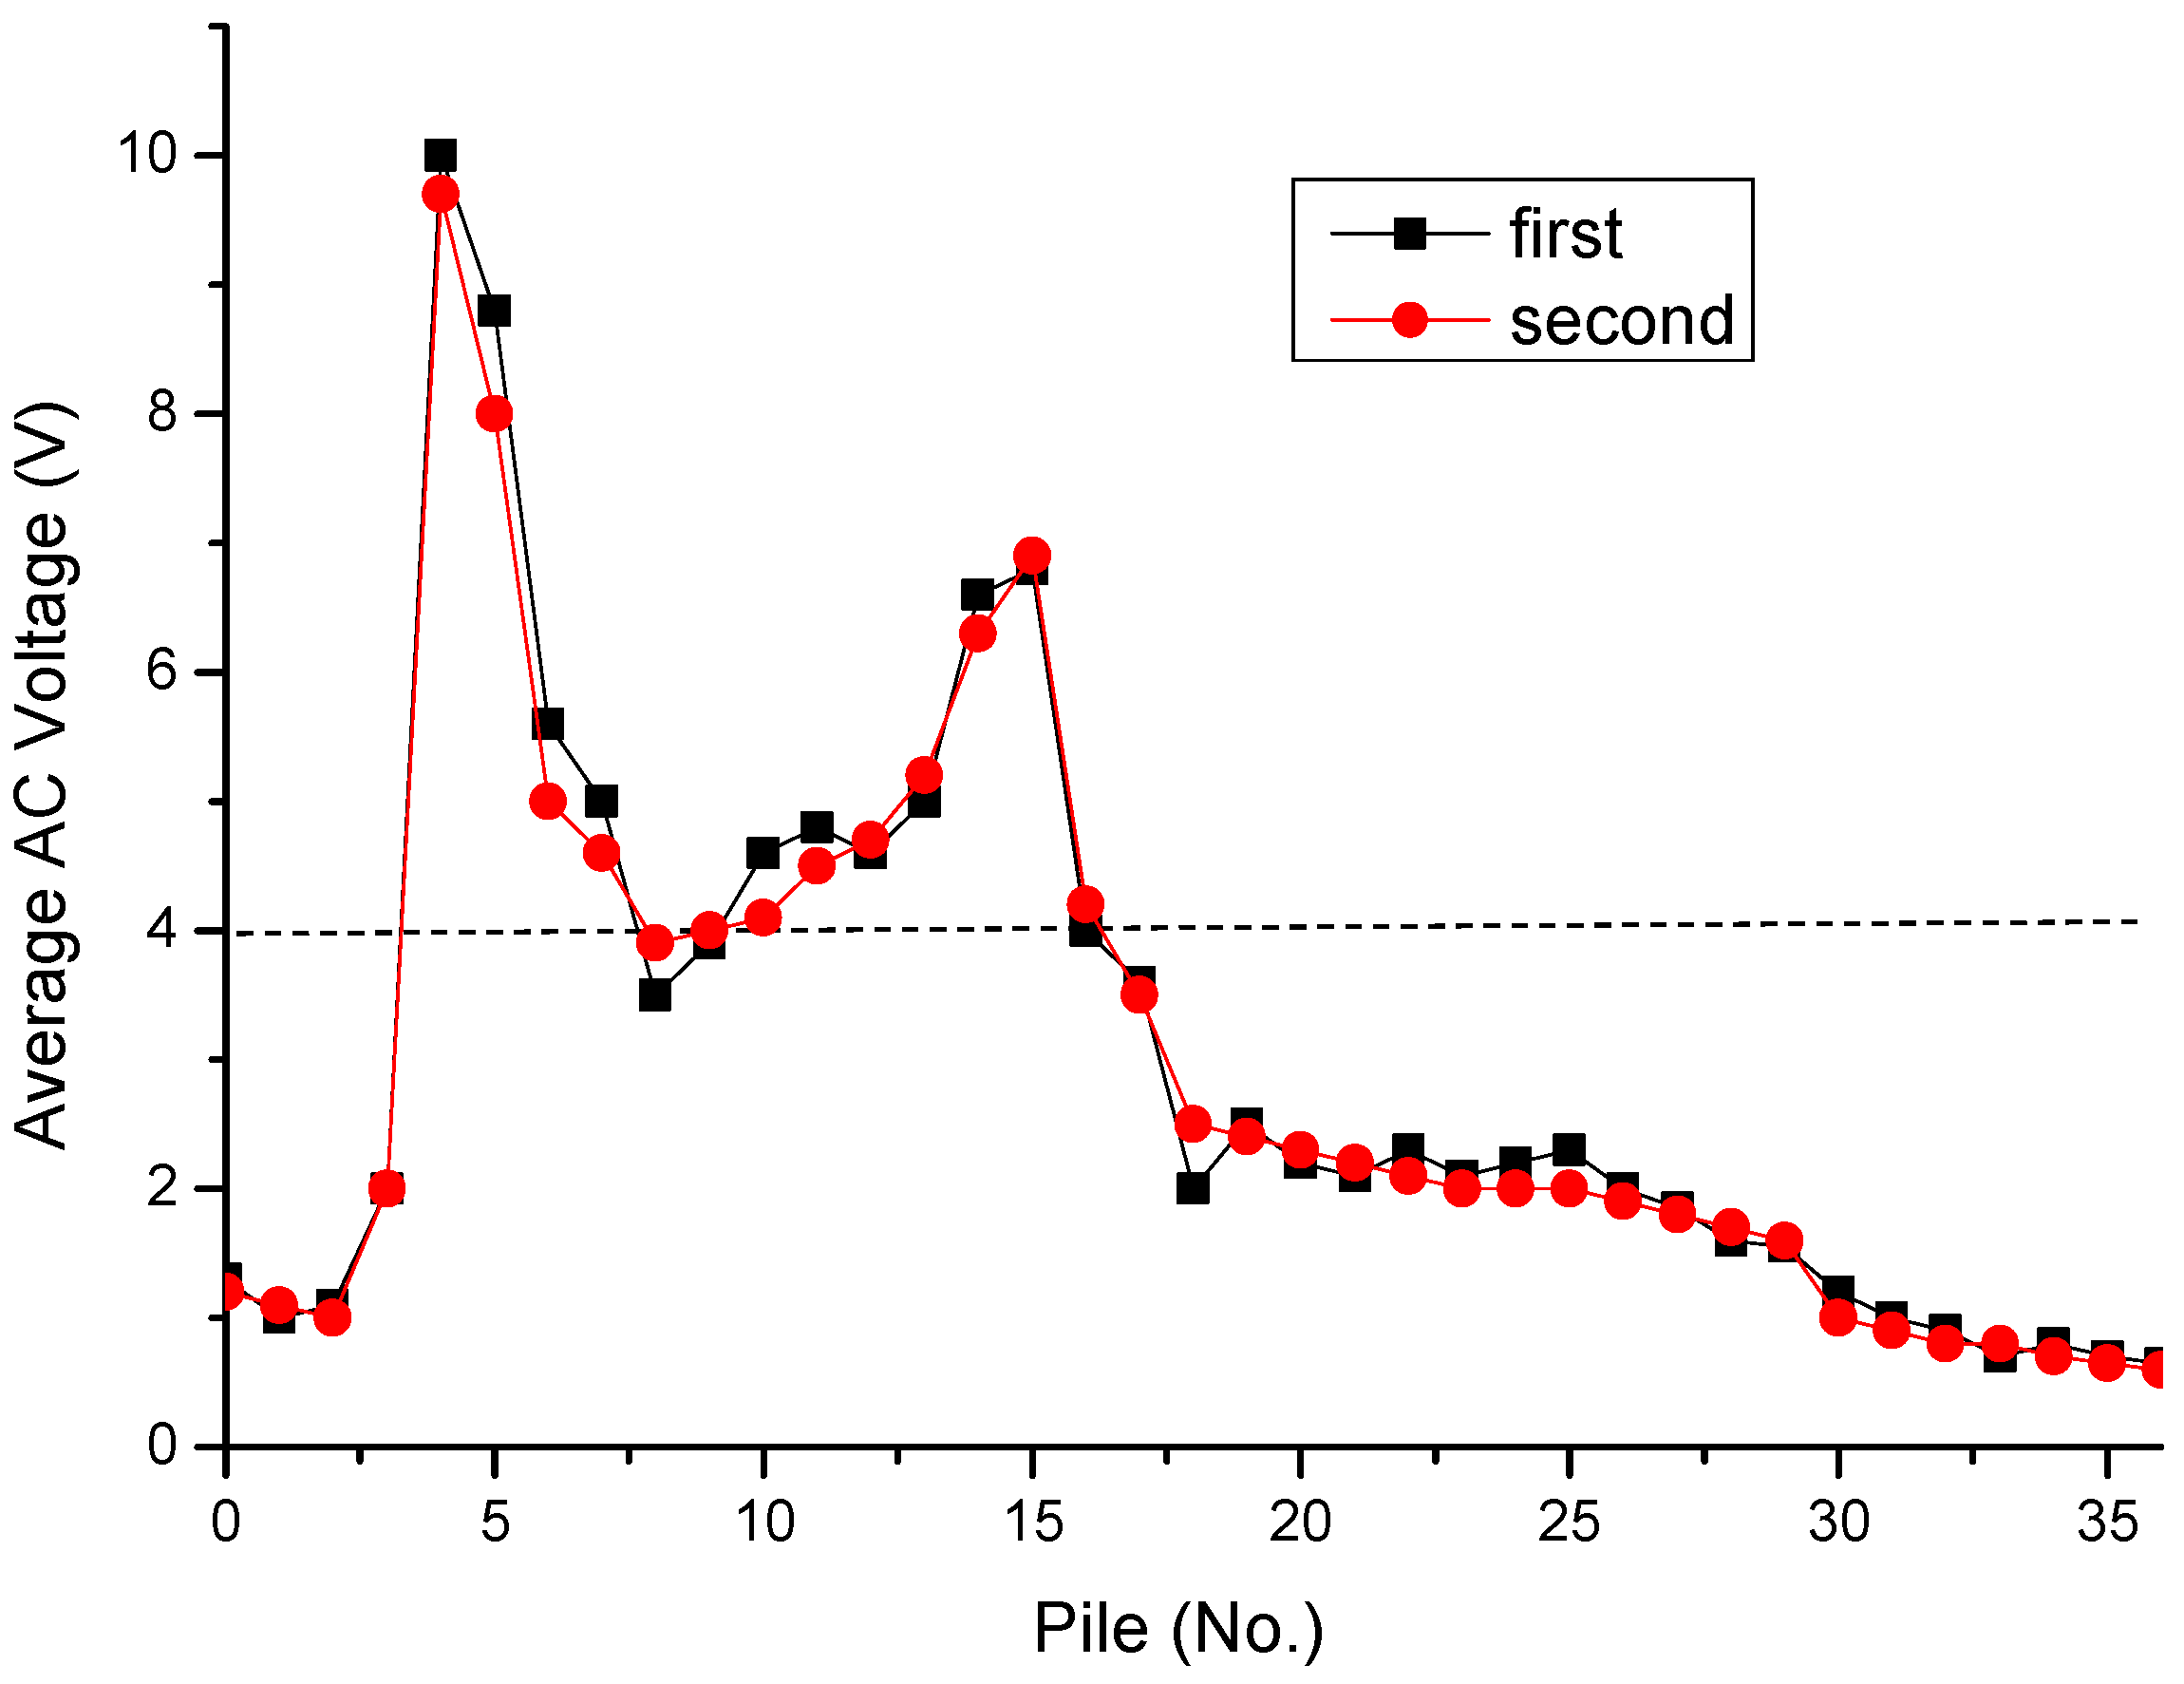
As can be seen from Figure 4, the voltage at each test pile of the pipeline oscillated violently. The black curve was the average voltage curve obtained for the first time, and the red curve was the average voltage curve obtained for the second time. The dotted line represents the interference threshold line for 4 V AC voltage according to Table 2. The maximum average value of AC voltage was close to 10 V, while the minimum average value was about 1 V. The value of each pile differed greatly. The average value of AC interference voltage was higher between Pile 4 and Pile 17 than the others. The average AC interference voltage was more than 8 V in the vicinity of Pile 4. The average voltage value of at least 2 km of pipeline was consistently higher than the permitted range of the China Petroleum Industry Standard [28,29], which indicates that the pipeline was subject to a certain amount of AC interference in this section of the pipeline. Although the average value of AC interference in the remaining part of the pipeline was lower than 6 V, its duration time was long, and it has been continuing for 24 h, with a wide interference range on the pipeline.

3.2. The Average and Peak Value of DC Interference Potential Distribution

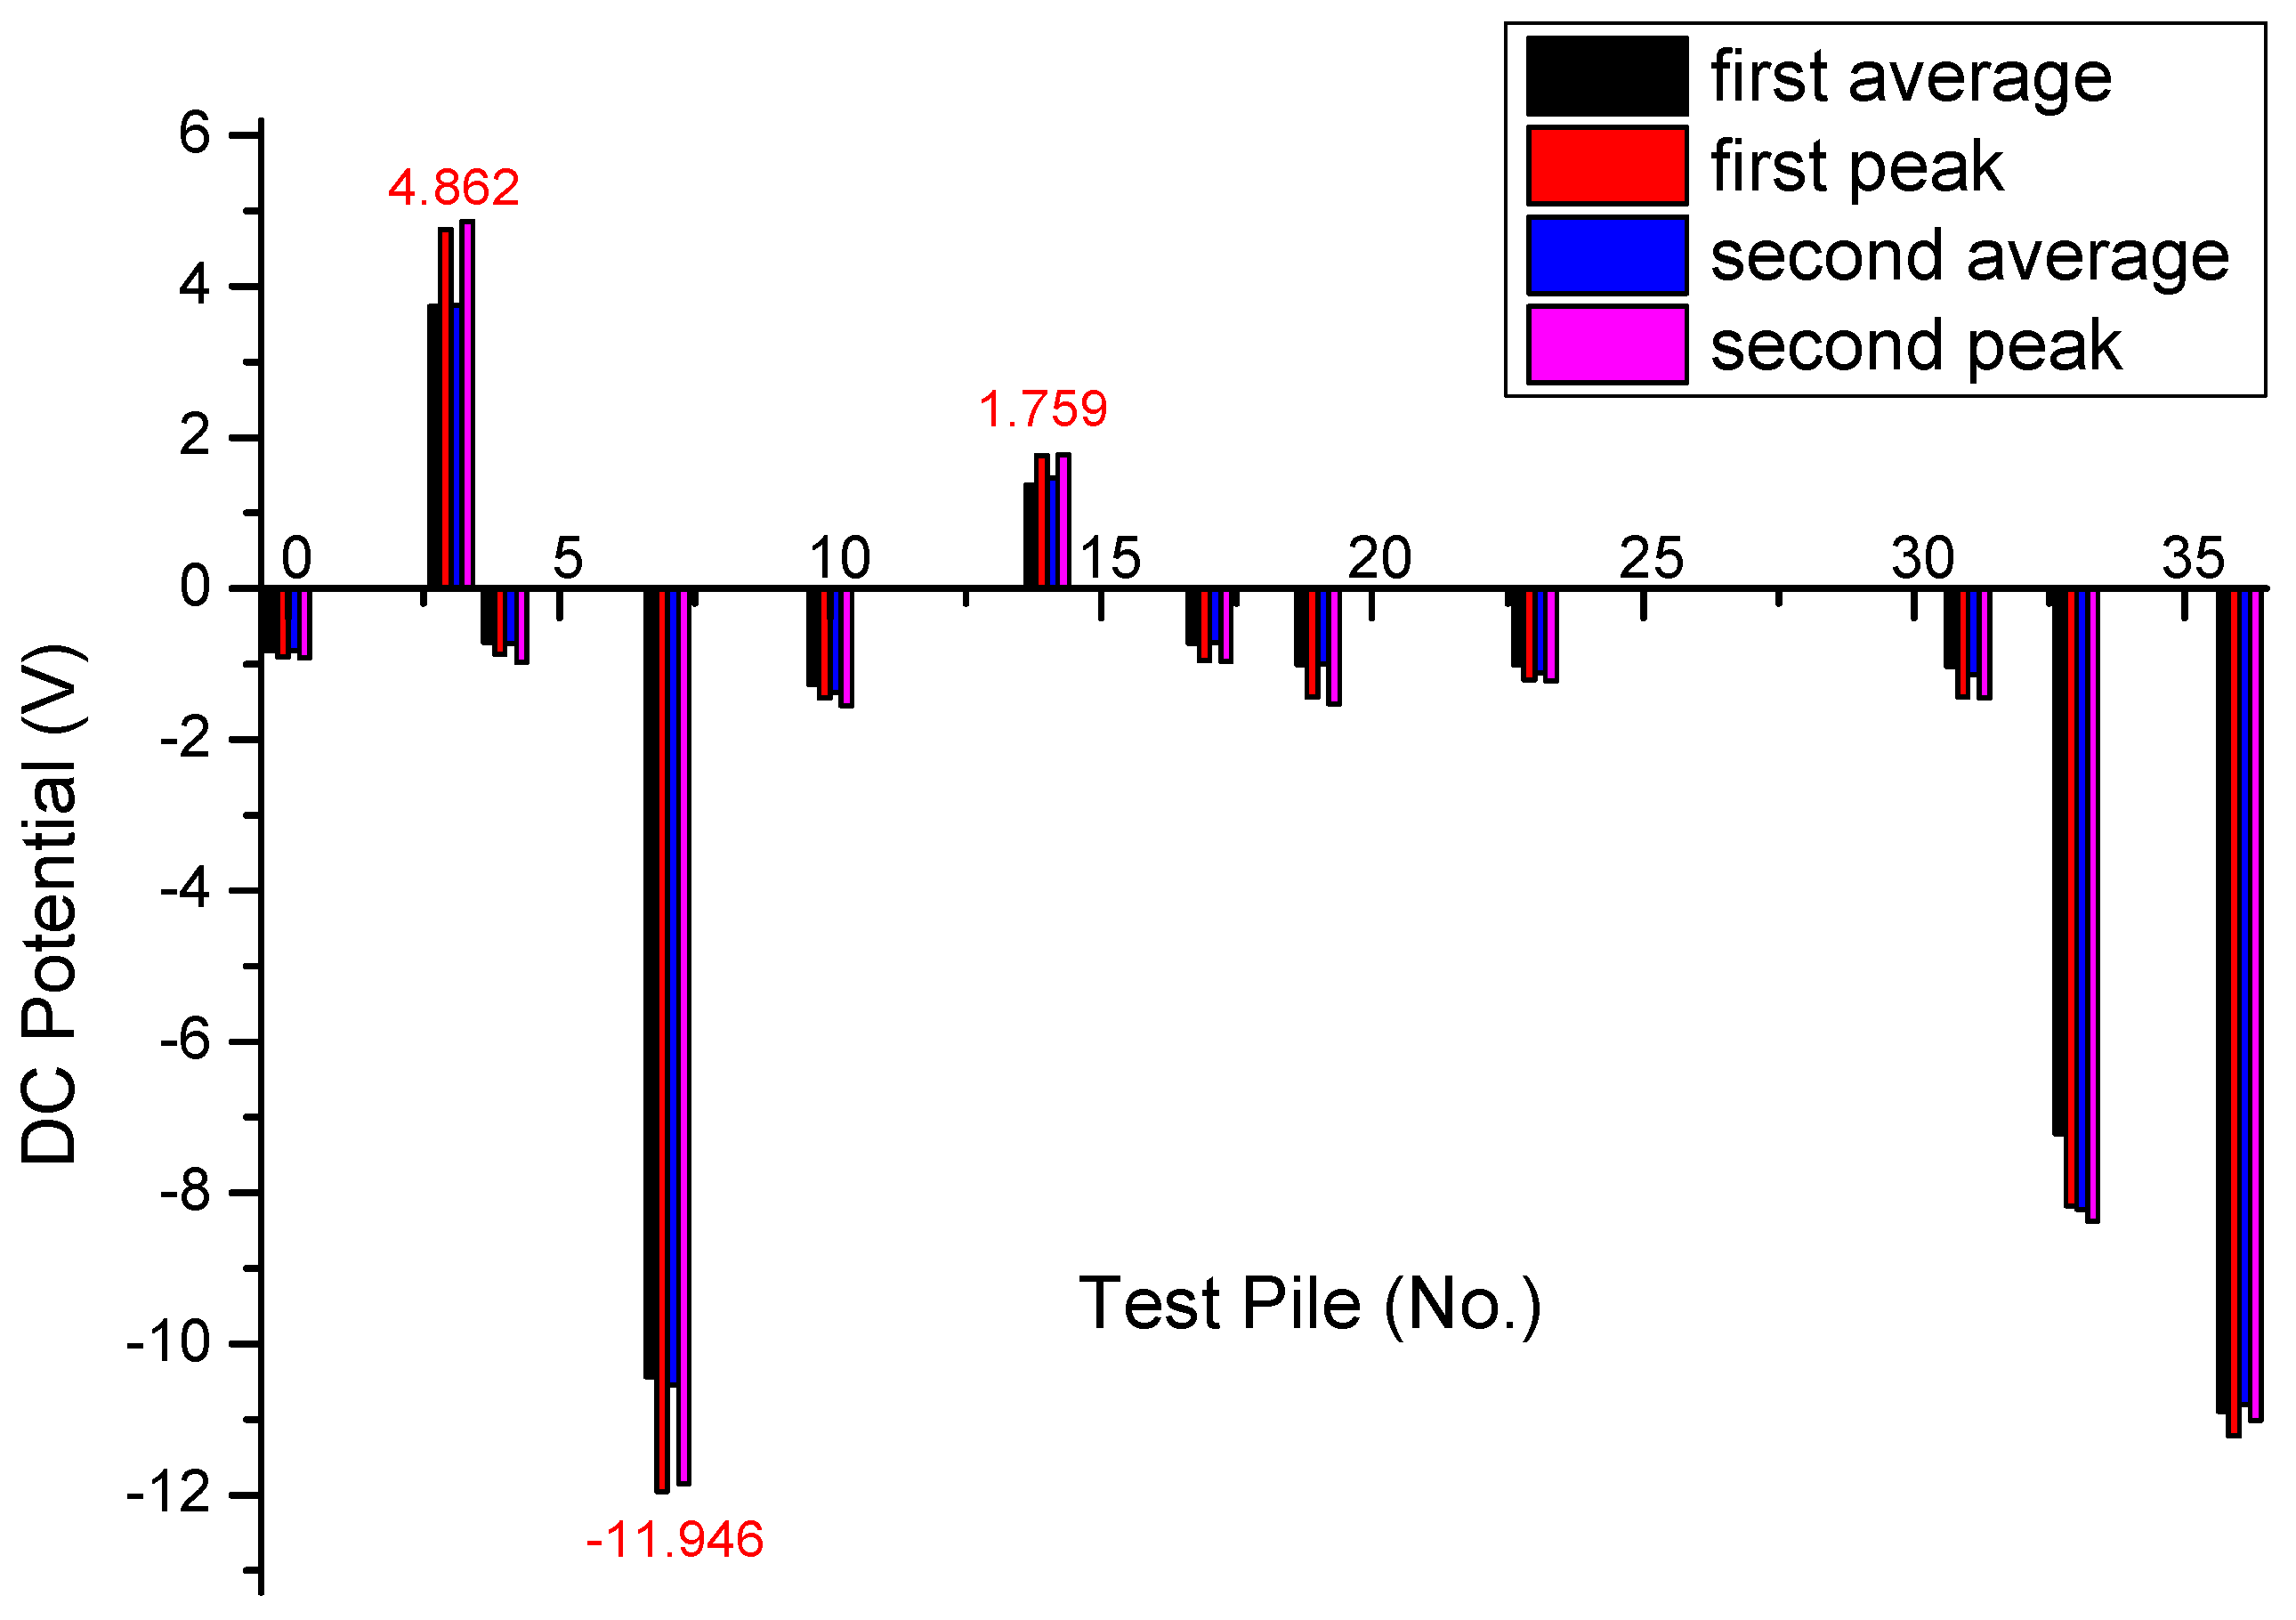
Figure 5 shows the average and peak value of the DC interference potential of the pipeline. The black bar was the average value and the red bar was the peak value for the first time. The blue bar was the average value and the pink bar was the peak value for the second time. As can be seen from Figure 5, the influence of DC stray current prevailed along the pipeline. The most negative potential of DC stray current interference was measured at Pile 7 in the first measurement, reaching −11.946 V. DC current was likely to flow in from here, causing the pipeline potential to become negative. If the long-term potential is negative than −1.20 V, which is in the over-protection condition, hydrogen precipitation reaction and coating damage are likely to occur.
The most positive potential was measured at Pile 3 in the second measurement, which reached 4.862 V. The current was likely to flow out from here, and corrosion was likely to occur here. Additionally, there were multiple positive potential points and negative potential points in the pipeline. These points indicates the presence of DC stray current interference in the pipeline, which could affect pipeline safety if left unprotected. The reason for the existence of positive and negative alternations of DC potentials in Figure 5 was that there was a DC railroad traffic nearby, almost parallel to the pipeline, which caused the positive and negative alternations of DC potentials of the pipeline. This DC railroad traffic was an important cause of DC interference in the pipeline.

3.3. Analysis for DC Potential and AC Voltage Based on Monitoring of Two Test Piles

According to Figure 3, Figure 4 and Figure 5, the peak and average value of DC interference potential of Pile 3 was the most positive, and the average value of AC interference voltage of Pile 4 was the largest. Therefore, Pile 3 and Pile 4 were selected for time series mapping analysis. Because of the complexity of the time series mappings and the similarity between the first measurement and the second measurement, the time series mappings in the second measurement were provided for analysis.
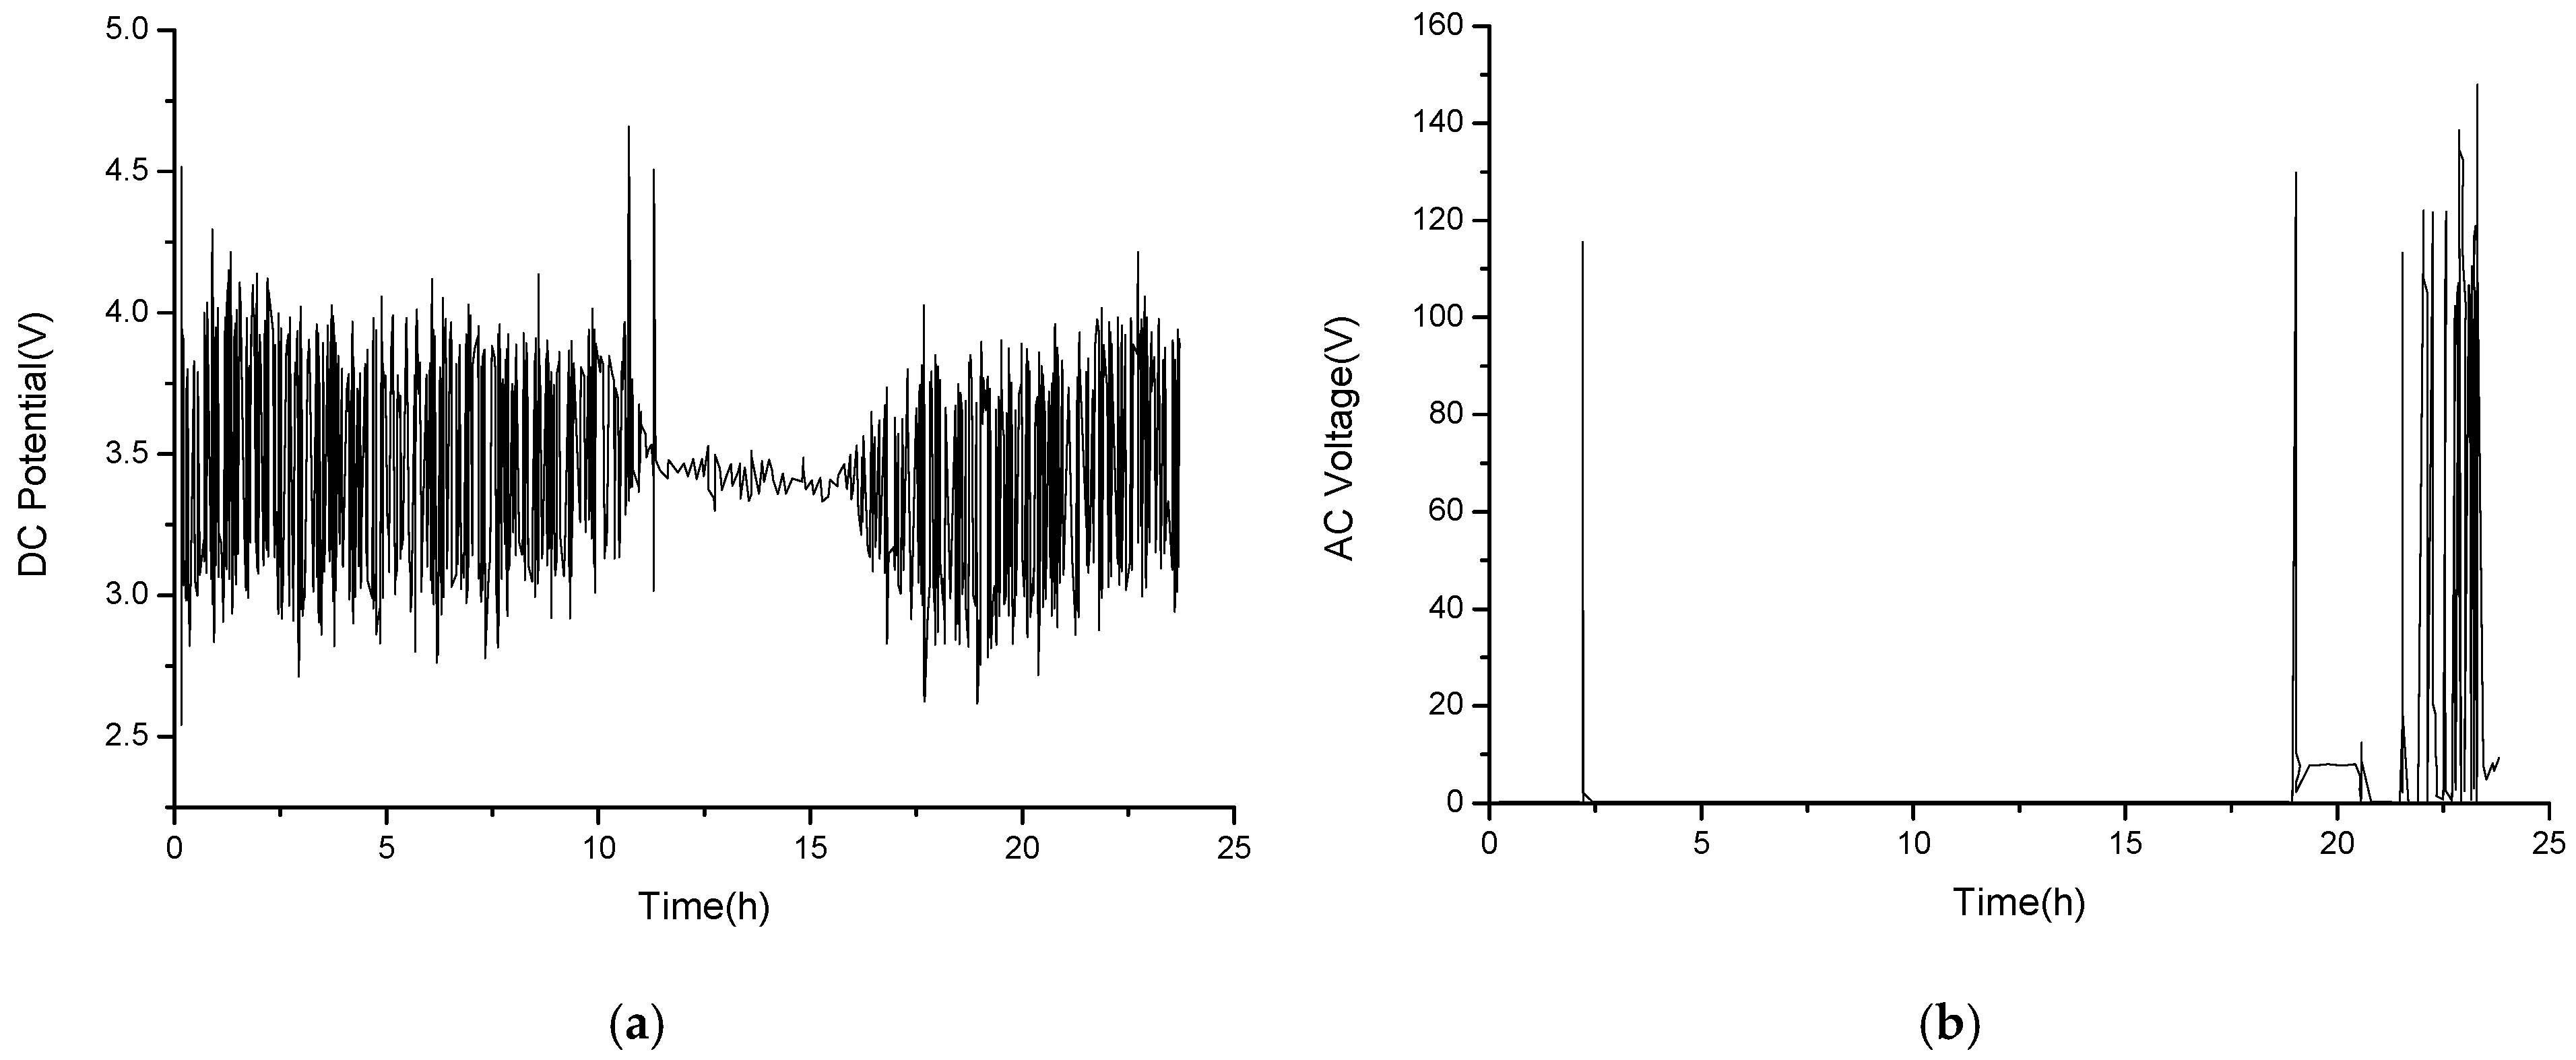
Figure 6a shows the DC time series mapping of Pile 3 with a positive pipeline/ground potential. Initially, it was concluded that the vicinity of Test Pile 3 was the outflow point of the DC current. From 0 h to 10 h, the pipeline’s DC potential oscillated between 2.5 V and 4.75 V. At around 11 h, a large positive potential spike appeared in the pipeline. From 11 h to 16 h, the pipeline’s potential remained near 3.5 V with smaller oscillations. From 17 h to 24 h, the pipeline once again shows a large oscillatory jumps. The potential oscillation was greater during the 0–10 and 17–24 h periods because some trains were constantly passing by on both the upward and downward tracks.
The DC interference current loop changed when the trains passed by. The directions of the triggered interference current were different from upward and downward trains. This resulted in serious up and down oscillations of the pipeline potential. From 11 h to 16 h, which happened to be late in the evening, the train stopped running and only a stable potential of about 3.5 V was maintained on the pipeline.
Figure 6b shows the AC voltage time series mapping for Pile 3. The AC interference voltages mostly appeared between 19 h and 24 h, ranging from 5 V to 150 V, and lasted for less than 5 h. For most of the rest time, the AC voltage value of Pile 3 was near 0 V.
This sparse distribution of interference voltage caused the average value of the AC interference voltage of Pile 3 in Figure 6b to be low. The overall average value shows that the AC interference of Pile 3 was not serious in Figure 6b. This sparse AC interference source of Pile 3 may come from one factory near Pile 3, and after communicating with this factory, the factory turned on the 380 V machinery for processing building materials in the period of 19 h to 24 h every day. The 380 V machinery would be shut down for transportation of building materials during the rest of the day. Thus, this can explain why the significant interference voltage appeared at 19–24 h. Table 4 presents the daily production schedule of the factory.
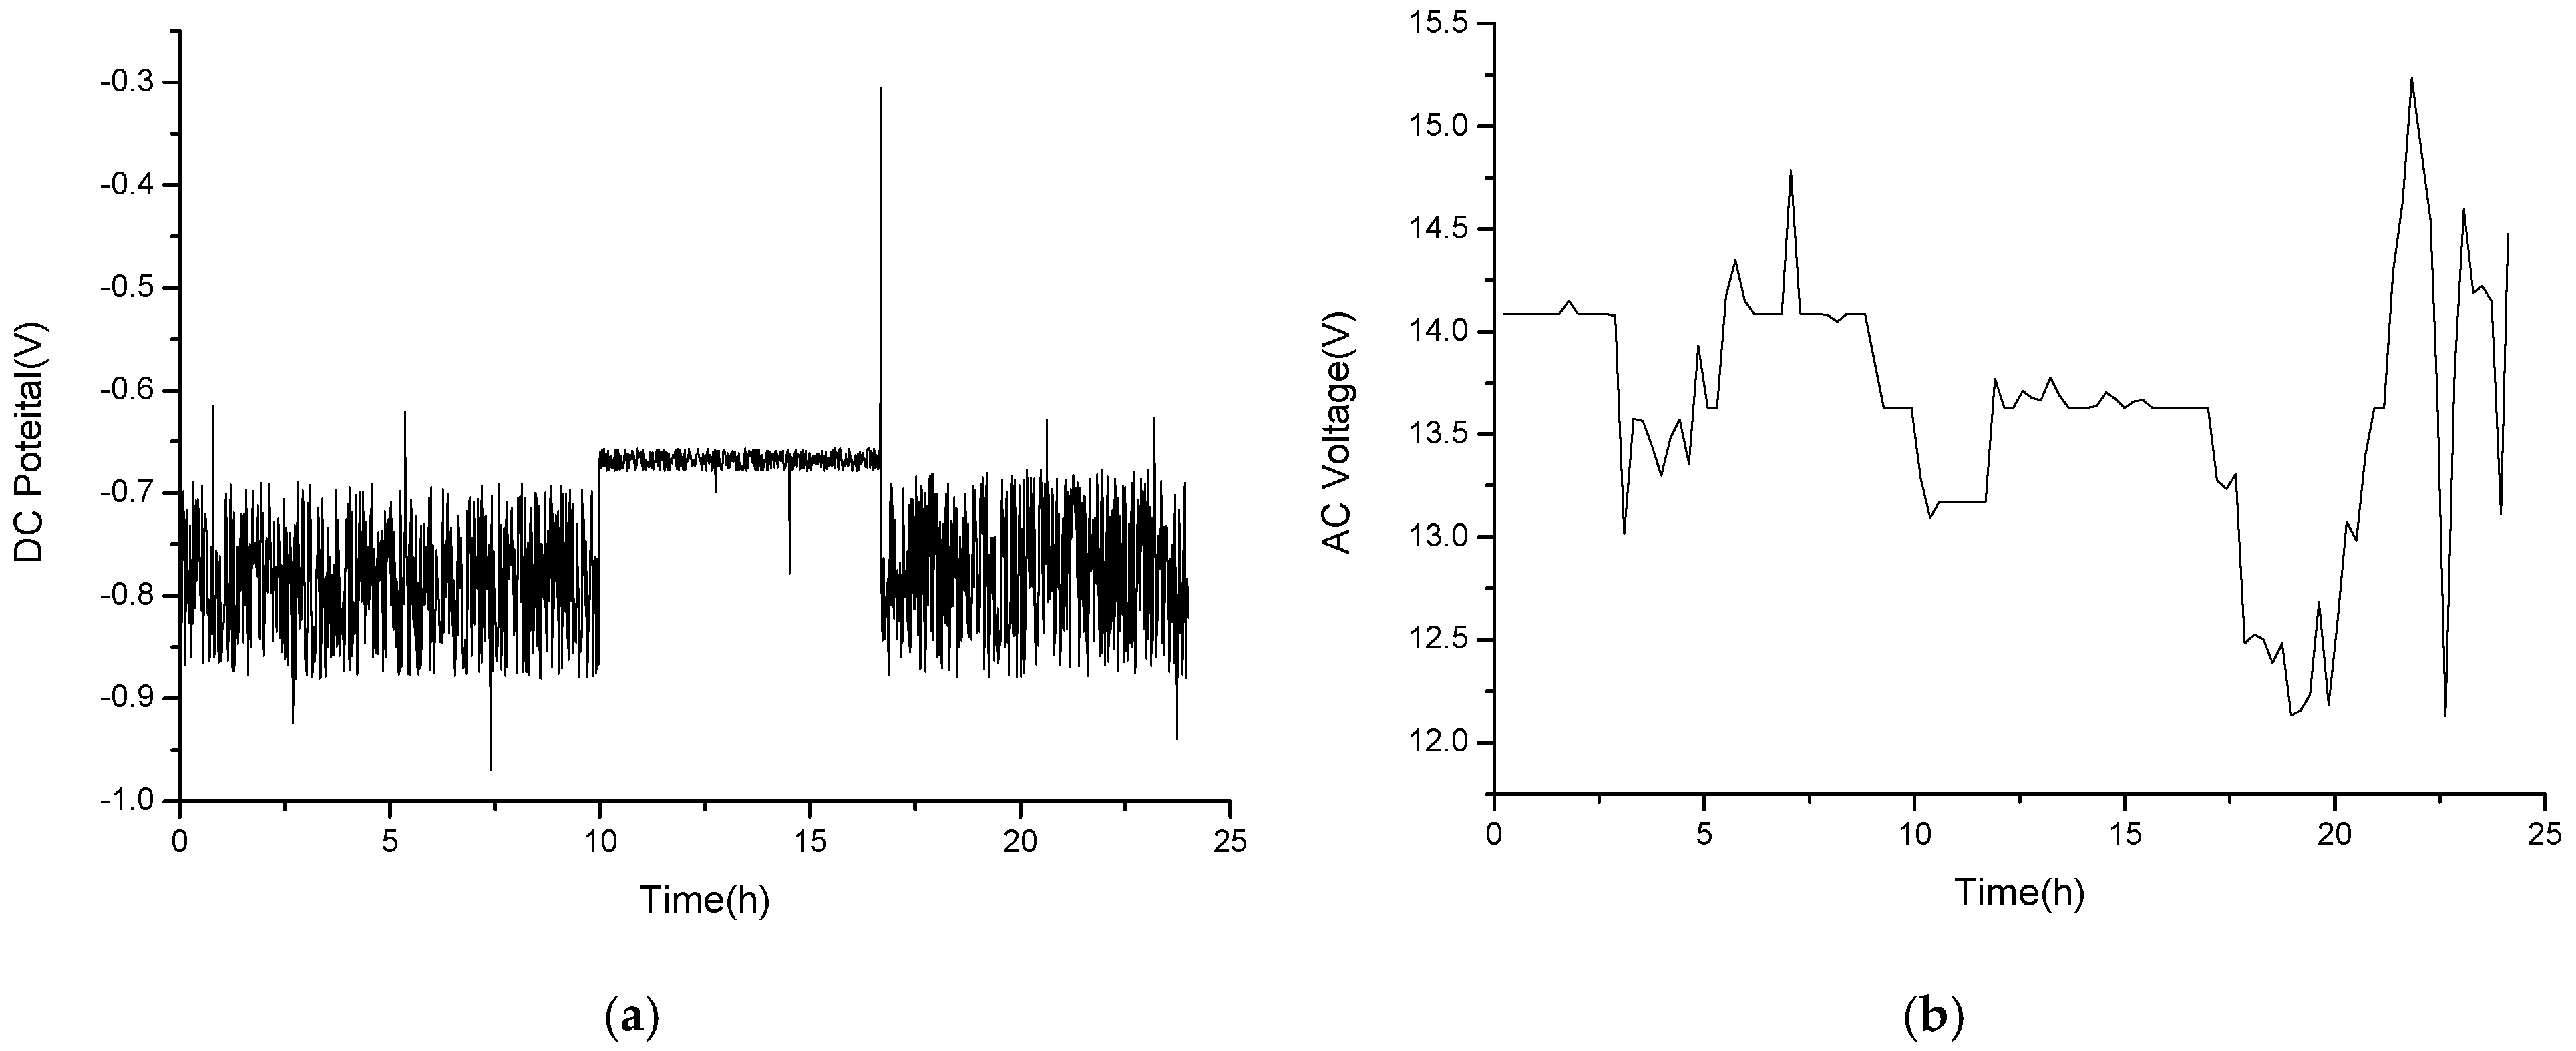
Figure 7a shows the DC time series mapping of Pile 4. The pipeline potential was negative, and it has essentially been concluded that the vicinity of test Pile 4 was the inflow point of DC current. From 0 h to 10 h, the DC potential of the pipeline oscillated and jumped between −1.0 V and −0.6 V. From 11 h to 16 h, the potential of the pipeline maintained near −0.65 V with less oscillations. From 16 h to 24 h, the pipeline again shows large oscillations and jumps. These variations are similar to those explained in Figure 6a and are related to the trains going up and down.
As illustrated in Figure 7b, the AC time series mapping of Pile 4 is shown. The AC voltage fluctuated within the range of 12 V and 15.5 V, and there was a continuous AC voltage for 24 h. The highest average value of AC interference was found in Figure 4. Above Pile 4, there was a high-voltage power line crossing through, which may be the reason for the larger average value of AC interference voltage in this particular pile.
In summary, in order to analyse the interference level, it is essential to consider more than just the instantaneous measurement value such as 1314.8 V. The duration time of interference is also another important factor, and the instantaneous sharp peaks cannot represent the long-term average value of the voltage or potential. In the judgment of interference, the average value must be used as the primary parameter, and the instantaneous and peak values can be used as the secondary parameters.

3.4. Analysis for Measurement Results of Current Density

According to Figure 3, Figure 4 and Figure 5, the peak and average value of DC interference potential of Pile 3 was the most positive and the average value of AC interference of Pile 4 was the largest. Therefore, Pile 3 and Pile 4 were selected for current density measurement and analysis, respectively. Due to limitations in excavation and other measurement conditions, only one test piece was used at one pile during the measurement, which was considered a single-sample measurement. Single-sample measurements made it impossible to compare multiple samples.
Figure 8a shows the DC current density histogram of Pile 3. The DC current density was positive and the direction of the current was the outflow from the pipeline. The distribution exhibited a substantial concentration of DC current density within the range of 140 mA/m2–160 mA/m2 and 180 mA/m2–200 mA/m2, almost a double normal distribution, and the maximum current density was near 240 mA/m2. According to the China Petroleum Industry Standard [29], the DC current density exceeded 100 mA/m2, and the pipeline near Pile 3 may be at risk of corrosion. It was imperative that the test pieces should be excavated in order to facilitate further observation and measurement.
Figure 8b shows the histogram of AC current density at Pile 3, which was between 0 A/m2 and 6 A/m2, much lower than the Chinese National Standard of 30 A/m2. According to the standard, the AC interference of Pile 3 had a smaller impact on the pipeline. One previous study has shown that AC current densities of about 100 A/m2 to 200 A/m2 would make the cathode reaction of X80 steel change from oxygen absorption to hydrogen evolution [30,31]. AC current densities were much lower at Pile 3, and hydrogen reactions would not occur.
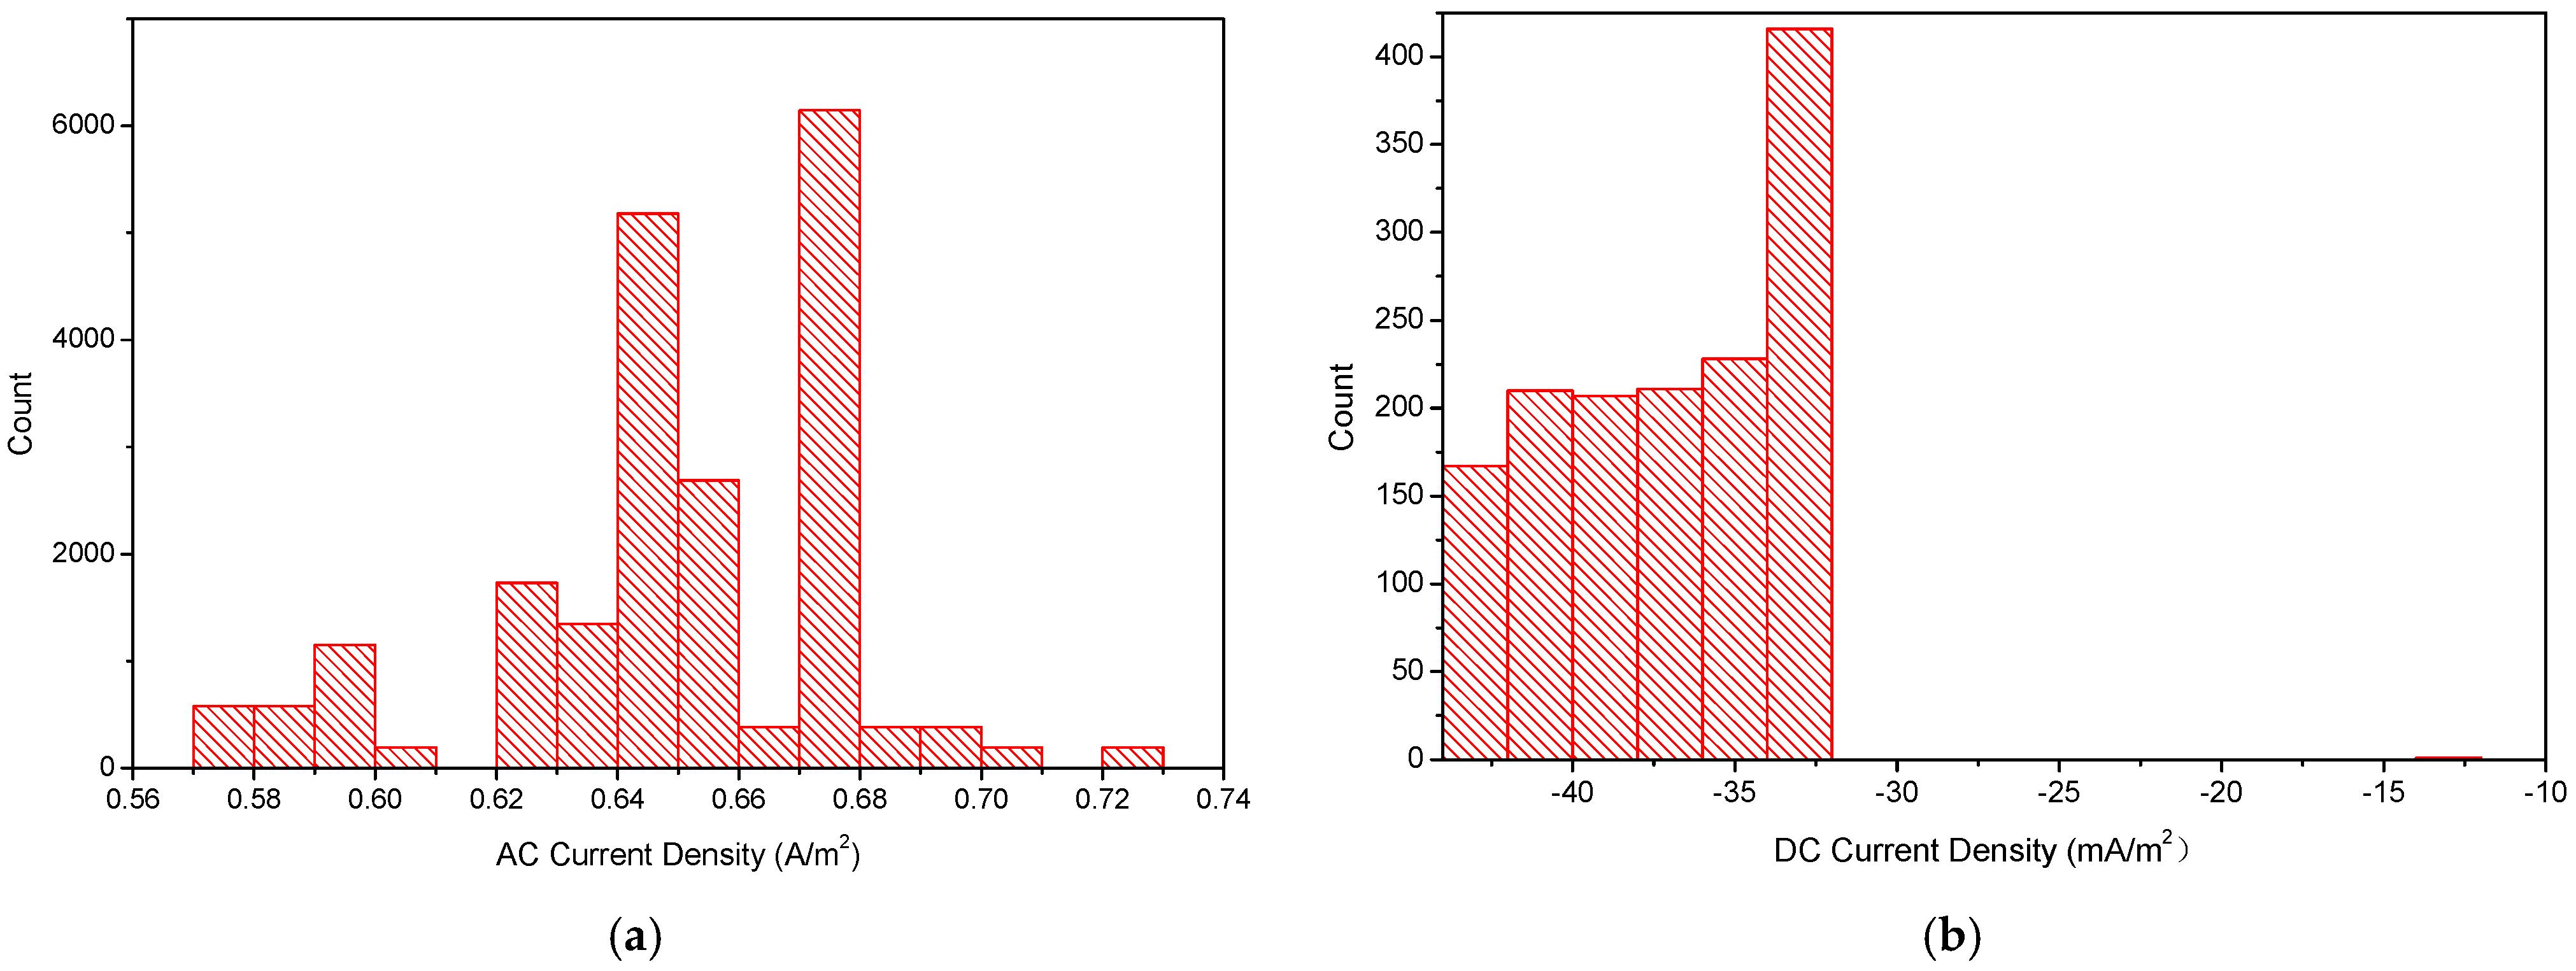
Figure 9a shows the histogram of AC current density of Pile 4. The AC current density was between 0.56 A/m2 and 0.74 A/m2, and the AC interference of Pile 4 had little influence on the pipeline. Although the maximum of the AC current density values for Pile 4 was smaller than Pile 3, Pile 4 had a long duration time of AC current density and has been suffering from a larger average AC current density for 24 h. As discussed in Section 3.3, when analyzing the AC and DC interference, in addition to considering the value of the current density, the duration time of the current density should also be considered. The average current density should be the primary focus, with the instantaneous current density acting as a supplementary element.
Figure 9b shows the DC current density histogram of Pile 4, and the current density was negative. Both DC currents flowed into the pipeline at Pile 4, and the distribution interval of the current density was very uneven. The DC interference of Pile 4 had a small impact on the pipeline.
Combining Figure 9a,b, there was a coupled interference with a large average AC current density and a more negative DC current density at Pile 4.

3.5. Analysis of the Decouplers’ Efficiency

According to Table 5, generally speaking, the decouplers were effective in reducing AC interference and can play a role in reducing the AC voltage amplitude and eliminating some of the stray current interference in the operating range. However, due to the existence of different coupling methods among high-voltage power lines, power towers, and pipelines as well as a lot of breakage points in pipeline coating, the decouplers cannot completely eliminate the effects of AC stray currents. Some monitoring points have problems, such as insufficient ability to eliminate interference and high-voltage fluctuations.
The decoupler connected at Pile 0 cannot eliminate the AC stray current interference. The average value at Pile 0 increased rather than decreased over a 24-h period, and the maximum value monitored also increased rather than decreased. This was mainly because the test point was close to the power plant. An AC equipment was being used during that period. The impact time was consistent with the usage time of that AC equipment. The above analysis shows that the decouplers lack effective protection against short and large current surges. At Pile 14, the decoupler had almost no effect on eliminating the influence of stray currents. There was no significant change in the peak value and duration time of AC interference at Pile 14.
The decouplers connected at Test Pile 9, Pile 17, and Pile 33 can play a role in reducing the peak value and the average value of interference. Although the decoupler connected to Test Pile 1 reduced the peak interference value, it doubled the average value of the interference at Test Pile 1. This indicates that the decoupler had a limited operating range and failed to isolate the low voltage and small current. The low voltage and small current would stay inside the pipeline due to the circuit design and generate continuous oscillation.

3.6. Excavation Observation and Measurement Analysis

Current density test pieces were excavated at Test Pile 3 and Pile 4.
A surface observation of the test piece at Pile 3 revealed that there were no rust layer, but a few black powdery corrosion products on the surface. However, the test piece at Pile 4 shows that there were no rust layer or black powdery corrosion products on the surface.
The surface condition of the test pieces was observed by SEM, as shown in Figure 10a,b, the surface condition of the test pieces was different. Figure 10a shows the surface condition of the test piece at Pile 3, with corrosion pits on the surface, and pitting corrosion may have occurred. Figure 10b shows the surface condition of the test piece at Pile 4. The surface was relatively flat. There was no corrosion pit, and almost no corrosion occurred.
The weight loss rate ( w % ) of the test piece at Pile 3 was 0.0054%, and the weight loss rate of the test piece at Pile 4 was 0.00021%. The weight loss rate of the test piece at Pile 3 was 25.7 times of the weight loss rate of the test piece at Pile 4.
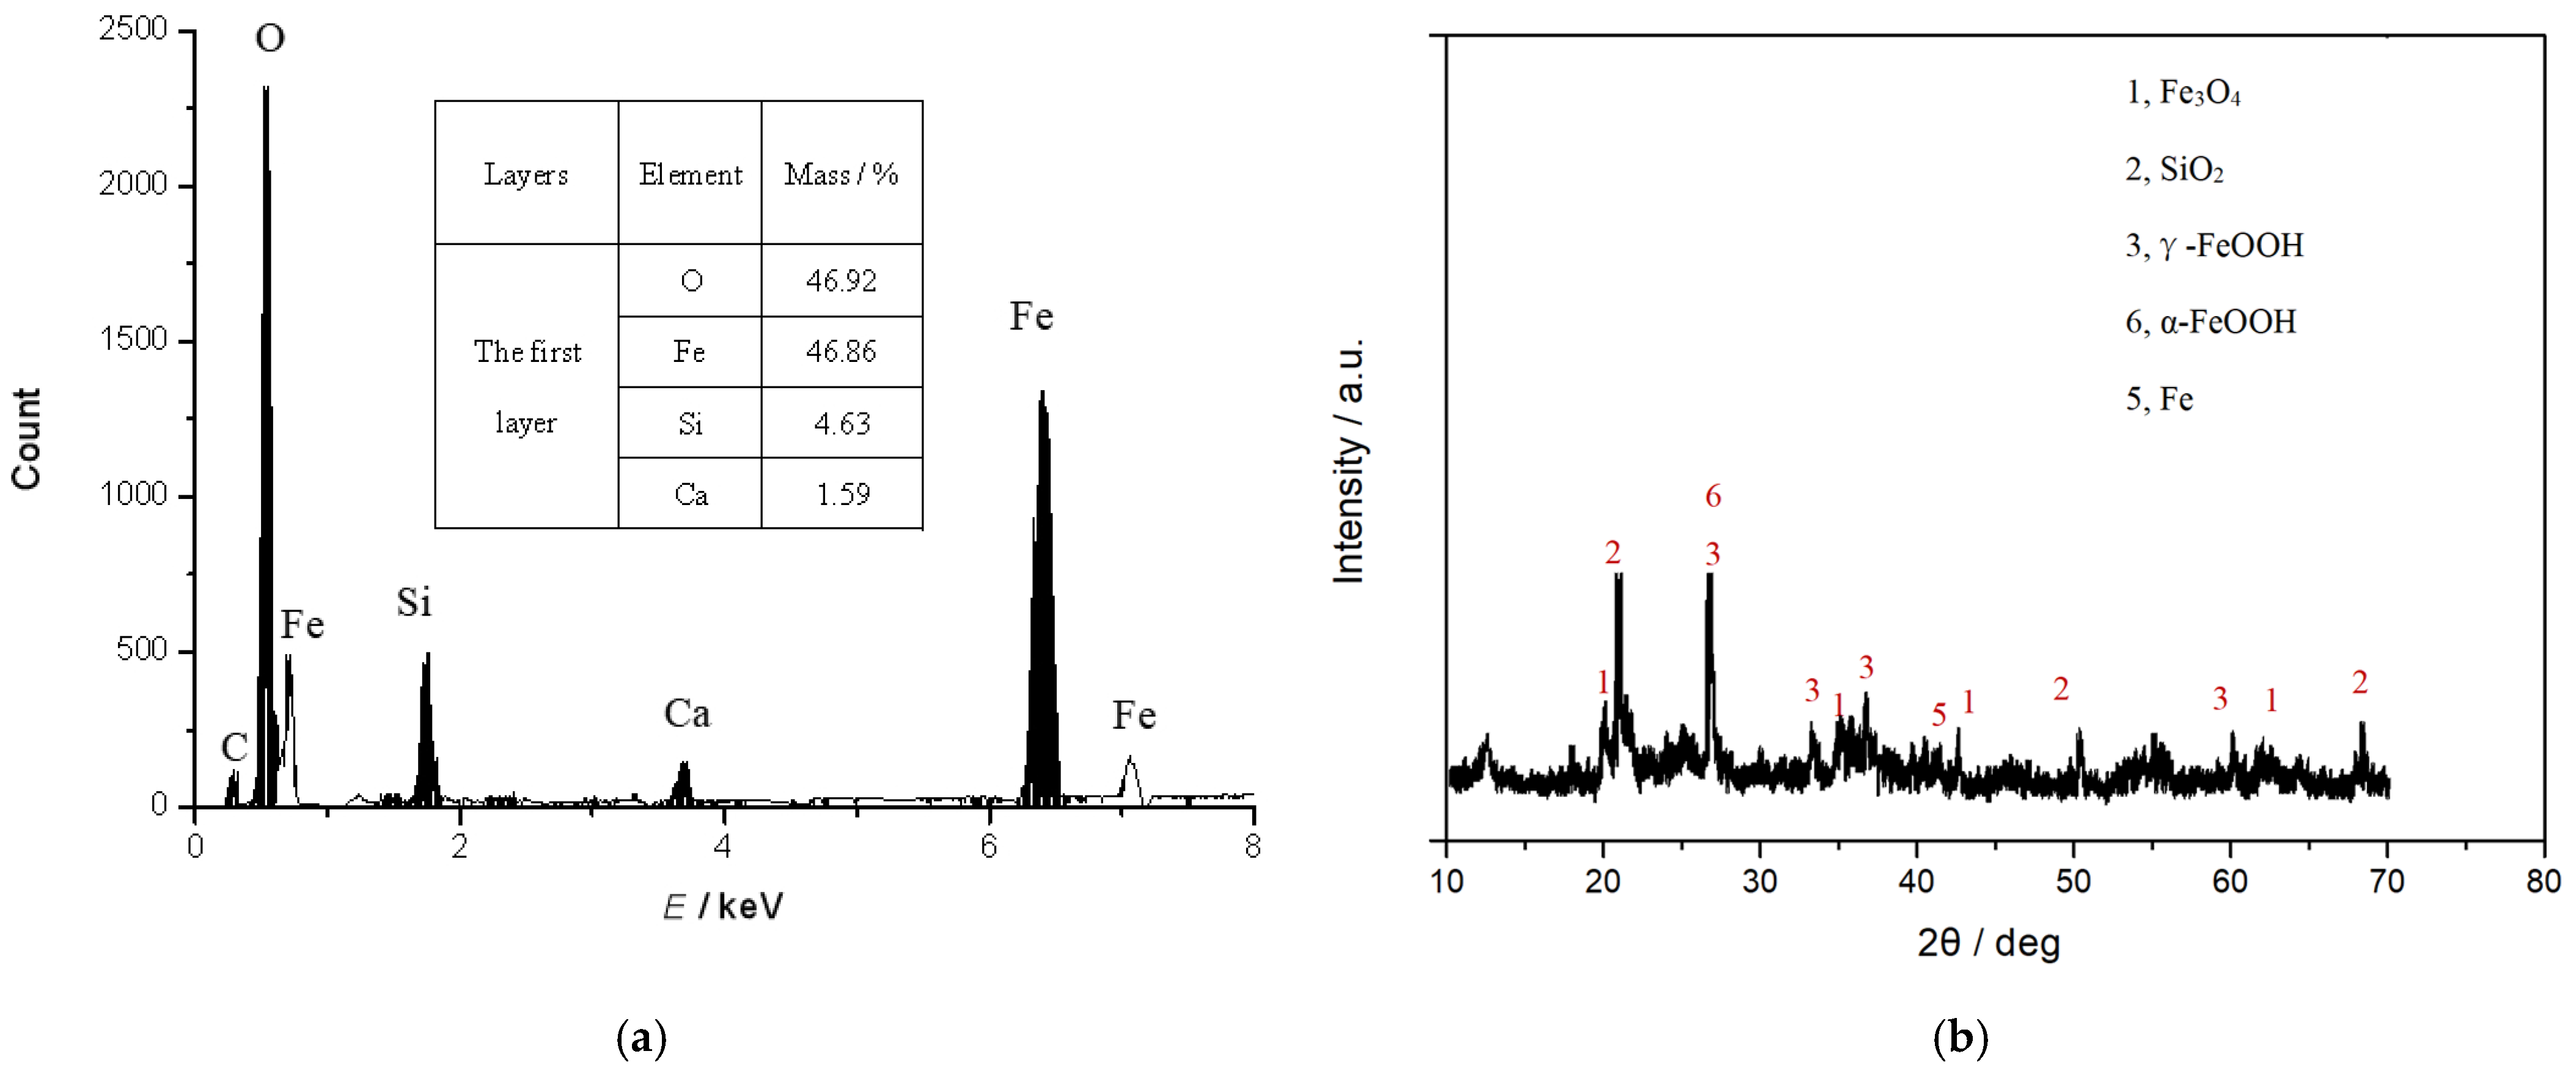
The EDS analysis results of the piece at Pile 3 were shown in Figure 11a. From Figure 11a, it can be seen that the outer product layer was mainly the oxide of Fe and contained a small amount of C, Si, Ca, etc.
The XRD analysis results of the test piece at Pile 3 were shown in Figure 11b, from which it can be seen that the outer product layer was mainly the oxide of Fe, with γ-FeOOH and Fe3O4 as the main ones. The analysis results of the corrosion product were similar to those of Andreas [32], Chen [33], and Liang [34]. Based on the above analysis and previous studies by others, the reaction near Pile 3 was inferred [35,36,37].
The anode reaction of the test piece at test Pile 3 is shown in Equation (7):
Fe − 2e → Fe+2
The cathodic region in the soil reacts is shown as in Equations (8)–(12):
O2 + 2H2O + 4e → 4OH
Fe+2 + 2OH → Fe(OH)2
4Fe(OH)2 + O2 + 2H2O → 4Fe(OH)3
Fe(OH)3 → FeOOH + H2O
8FeOOH + Fe+2 + 2e → 3Fe3O4 + 4H2O
All data have been provided to the pipeline owner, who intends to undertake interference mitigation measures based on the data. When designing new pipelines in the vicinity in future, the designers should avoid interference sources such as power lines, power towers, railways, and factories as identified in this study.

4. Conclusions

(1)
Four types of interference sources were monitored and analyzed: high-voltage tower fault, induced coupling of high-voltage power line, rail transit DC interference, and 380 V machinery interference in factory.
(2)
At Pile 33, the maximum AC interference voltage between the pipeline and the steel electrode was 1341.8 V in the first measurement. However, the peak value obtained from the second measurement at pile 33 decreased from 1341.8 V to 143.7 V, indicating that the 1341.8 V may be caused by a sudden grounding of the electrode, while the 143.7 V may be caused by the induced voltage. Meanwhile, at Pile 7, the most negative DC interference potential between the pipeline and the copper/copper sulphate reference electrode was −11.946 V. At Pile 3, the most positive DC interference potential between the pipeline and the copper/copper sulphate reference electrode was 4.862 V in the second measurement.
(3)
The maximum DC current density was 240 mA/m2 at Pile 3, and the maximum AC current density was 0.615 A/m2 at Pile 4. After excavating the piece at the maximum DC interference point at Pile 3, there was obvious pitting corrosion characteristics under the combined effect of AC and DC currents. The corrosion products of the test piece at Pile 3 were mainly γ-FeOOH and Fe3O4. At the point of Pile 3, it was the coupling effect of the long-term higher positive DC current density and the short-term higher AC current density.
(4)
After the test piece at the maximum AC interference point, Pile 4, was excavated, the test piece did not have obvious AC and DC corrosion characteristics. The coupling of long-term low AC current density and long-term negative low DC current density at Pile 4 did not cause obvious corrosion.
(5)
The decouplers in this measurement can significantly reduce AC interference above 2 V. However, the isolation of transient AC shock and AC interference below 2 V was not obvious. The decouplers needs to improve its transient shock and low voltage isolation function.
(6)
In addition to considering the measured value, the duration time of AC and DC interference is also an important factor. Instantaneous sharp peaks cannot represent the long-term average voltage or potential current density. The average value should be used as the main basis for judgement, and the instantaneous value should be used as the secondary basis.
(7)
Because there were so many test piles, current density testing could not be performed on all of them. Due to difficulties with excavation, only single-specimen samples were used in the testing. Future research should include denser testing, multi-specimen testing, and enhanced corrosion product analysis.

Author Contributions

Writing—original draft, Z.W.; writing—review and editing, H.L.; writing—original draft, J.L.; investigation, Y.L.; writing—review and editing, Y.D.; methodology, J.Z. All authors have read and agreed to the published version of the manuscript.

Funding

This research was funded by the Major Basic Research Project of Natural Science Foundation of Shandong Province, China (No. ZR2023ZD31), and the National Natural Science Foundation of China (No. 42076043).

Data Availability Statement

The data presents in this study are available on request from the corresponding author.

Conflicts of Interest

Authors Zaifeng Wang, Haishan Liu, Jianqing Liu, Yang Liu, Yu Ding were employed by the company China National Offshore Oil Corporation. The remaining author declare that the research was conducted in the absence of any commercial or financial relationships that could be construed as a potential conflict of interest.

References

  1. Liang, H.; Wu, Y.; Han, B.; Lin, N.; Wang, J.; Zhang, Z.; Guo, Y. Corrosion of buried pipelines by stray current in electrified railways: Mechanism, influencing factors, and protection. Appl. Sci. 2025, 15, 264. [Google Scholar] [CrossRef]
  2. Ma, S.; Du, Y.; Che, K.; Qin, H.; Su, Y. Research on corrosion assessment model for buried steel pipelines under dynamic DC stray current based on machine learning. Mater. Corros. 2022, 73, 540–549. [Google Scholar] [CrossRef]
  3. Chen, L.; DU, Y.; Liang, Y.; Tian, N.; Zhu, Z.; Zhang, L. Research on dynamic alternating current corrosion behavior of X65 pipeline steel under cathodic protection. Corrosion 2023, 79, 471–485. [Google Scholar] [CrossRef] [PubMed]
  4. Du, Y.; Qin, H.; Liu, J.; Tang, D. Research on corrosion rate assessment of buried pipelines under dynamic metro stray current. Mater. Corros. 2021, 72, 1038–1050. [Google Scholar] [CrossRef]
  5. Feng, J.; Chen, Z.; Xie, Y.; Wu, C.; Qin, C. Influence of urban rail transit on corrosion of buried steel gas pipeline. Int. J. Electrochem. Sci. 2021, 16, 210617. [Google Scholar] [CrossRef]
  6. Peng, X.; Huang, Z.; Chen, B.; Liu, D.; Li, H. On the interference mechanism of stray current generated by DC tram on pipeline corrosion. Eng. Fail. Anal. 2020, 116, 104760. [Google Scholar] [CrossRef]
  7. Zhang, H.; DU, Y.; Qin, R.; Xu, Z.; Gu, Q. Study on corrosion behavior of X80 steel in Guangdong soil with different water contents under HVDC interference. Electrochemistry 2020, 88, 1–7. [Google Scholar] [CrossRef]
  8. Xu, Z.; Du, Y.; Du, Y.; Qin, R.; Zhang, H. Research status of interference caused by HVDC grounding in buried metal pipeline. Corros. Prot. 2020, 41, 63–69. [Google Scholar] [CrossRef]
  9. Xu, Z.; Du, Y.; Qin, R.; Zhang, H. Study of Corrosion Behavior of X80 Steel in Clay Soil with Different Water Contents under HVDC Interference. Int. J. Electrochem. Sci. 2020, 15, 3935–3954. [Google Scholar] [CrossRef]
  10. Wang, Y.; Wang, X.; Sun, T.; Rasool, G.; Yang, L.; Qi, Y. Study on the influence of the transmission tower on the AC interference distribution on the surface of a buried steel pipeline under steady-state conditions. Electr. Power Syst. Res. 2023, 225, 109852. [Google Scholar] [CrossRef]
  11. Chen, L.; Du, Y.; Liang, Y.; Li, J. Research on corrosion behaviour of X65 pipeline steel under dynamic AC interference. Corros. Eng. Sci. Technol. 2021, 56, 219–229. [Google Scholar] [CrossRef]
  12. Chen, L.; Du, Y.; Liang, Y.; Zhuang, D.; Zhu, Z.; Jiang, Z.; Zhang, L. Research on numerical modeling of AC interference from high-speed railway to nearby buried pipeline. Electr. Power Syst. Res. 2024, 228, 110047. [Google Scholar] [CrossRef]
  13. Chen, L.; Du, Y.; Guo, L.; Zhu, Z.; Liang, Y.; Zhang, L. Corrosion behavior and evaluation method of pipeline steel under dynamic ac interference: A study. Mater. Corros. 2025, 76, 305–315. [Google Scholar] [CrossRef]
  14. Wang, C.; Xu, S.; Li, W.; Wang, Y.; Shen, G.; Wang, S. Multi-physics coupled simulation and experimental investigation of alternating stray current corrosion of buried gas pipeline adjacent to rail transit system. Mater. Des. 2024, 247, 113394. [Google Scholar] [CrossRef]
  15. Moraes, C.M.; Matos, G.H.d.S.; Martins-Britto, A.G.; Silva, K.M.; Lopes, F.V. Total AC interferences between a power line subject to a single-phase fault and a nearby pipeline with multilayered soil. IEEE Trans. Electromagn. Compat. 2023, 65, 585–594. [Google Scholar] [CrossRef]
  16. Lucca, G.; Sandrolini, L.; Popoli, A.; Simonazzi, M.; Cristofolini, A. Assessment of AC Corrosion Probability in Buried Pipelines with a FEM-Assisted Stochastic Approach. Appl. Sci. 2023, 13, 7669. [Google Scholar] [CrossRef]
  17. Wang, X.; Wang, Y.; Sun, T.; Yang, X.; Yang, L.; Qi, Y. Study of transmission line AC interference with steel-buried pipelines under lightning strikes. Electr. Power Syst. Res. 2023, 218, 109226. [Google Scholar] [CrossRef]
  18. Wang, C.; Liang, X.; Adajar, E.P. A Systematic Approach for AC Electromagnetic Interference Study Between Railways and Nearby Power Lines. IEEE Trans. Ind. Appl. 2023, 59, 5527–5538. [Google Scholar] [CrossRef]
  19. Wang, X.; Wang, Y.; Sun, T.; Yang, X.; Yang, L.; Qi, Y. Study of the coupling interference of high-voltage transmission lines on adjacent buried steel pipelines based on CDEGS. Electr. Power Syst. Res. 2023, 217, 109125. [Google Scholar] [CrossRef]
  20. Mostafa, M.A.; Al-Gabalawy, M.; Shaalan, E.M.; Hamza, A.S. Mitigation of the AC corrosion of the metallic pipelines using the hydroxide and solid-state polarization cells; A comparative study. Electr. Power Syst. Res. 2022, 202, 107585. [Google Scholar] [CrossRef]
  21. Al-Gabalawy, M.; Mostafa, M.A.; Hamza, A.S. Implementation of different intelligent controllers for mitigating the AC corrosion of metallic pipelines considering all HVOHTLs operation conditions. ISA Trans. 2021, 117, 251–273. [Google Scholar] [CrossRef]
  22. Gouda, O.E.; Al-Gabalawy, M.A. Overhead transmission lines impacts on neighboring buried metallic gas pipelines. Electr. Eng. 2021, 103, 3119–3137. [Google Scholar] [CrossRef]
  23. Gouda, O.E.; Al-Gabalawy, M.A. Screening of the high voltage overhead transmission lines impacts on the neighboring metallic gas pipelines based on the distributed KOH-PCs. Egypt. J. Pet. 2021, 30, 45–53. [Google Scholar] [CrossRef]
  24. Wang, Q.-W.; Zhang, J.-X.; Gao, Y.; Dai, N.-W.; Chen, Y.-X.; Lin, D.-Y.; Xia, X.-J. Galvanic Effect and Alternating Current Corrosion of Steel in Acidic Red Soil. Metals 2022, 12, 296. [Google Scholar] [CrossRef]
  25. SY/T 0017-2006; Standard of DC Drainage Protection for Buried Steel Pipelines. Petroleum Industry Press: Beijing, China, 2006.
  26. GBT40377-2021; Corrosion of Metals Corrosion of Metals and Alloys-Determination of AC Corrosion-Protection Criteria. China Standard Press: Beijing, China, 2021.
  27. Thakur, A.K.; Arya, A.K.; Sharma, P. Corrosion of pipe steels under alternating current. Int. J. Electrochem. Sci. 2021, 16, 211245. [Google Scholar] [CrossRef]
  28. SY/T 0087.4-2023; Corrosion Evaluation Standards for Steel Pipelines and Storage Tanks Part 4: Evaluation of DC Interference Corrosion for Buried Steel Pipelines. Petroleum Industry Press: Beijing, China, 2023.
  29. SY0087.6-2021; Standards for Corrosion Evaluation of Steel Pipelines and Storage Tanks Part 6: Evaluation of AC Interference Corrosion of Buried Steel Pipelines. Petroleum Industry Press: Beijing, China, 2021.
  30. Zhou, J.; Li, Z.; Liu, J.; Xing, X.; Cui, G.; Zhang, S.; Cheng, R.; Wang, Y. Effect of AC interference on hydrogen evolution reaction of x80 steel. Anti-Corros. Methods Mater. 2020, 67, 197–204. [Google Scholar] [CrossRef]
  31. Wan, H.; Song, D.; Liu, R.; Wang, Y.; Cai, W. Effects of Alternating Current Corrosion Behavior of X80 Pipeline Steel under Delaminated Coating Defects. J. Mater. Eng. Perform. 2025, 34, 3425–3435. [Google Scholar] [CrossRef]
  32. Olesen, A.J.; Dideriksen, K.; Nielsen, L.V.; Møller, P. Corrosion rate measurement and oxide investigation of AC corrosion at varying AC/DC current densities. Corrosion 2019, 75, 1026–1033. [Google Scholar] [CrossRef]
  33. Chen, Y.; Wang, F.; Zou, G.; Sun, W.; Li, C. Study on corrosion behavior of X65 steel of buried pipeline under dynamic stray current interference. AIP Adv. 2025, 15, 065005. [Google Scholar] [CrossRef]
  34. Liang, Y.; Du, Y.; Tang, D.; Chen, L.; Zhang, L.; Qiao, L. Research on AC corrosion behavior and corrosion product film evolution of X70 steel under the combined action of AC interference and CP. Corros. Sci. 2022, 197, 110085. [Google Scholar] [CrossRef]
  35. Markić, M.; Arat, S.; Fürbeth, W. Effect of AC interference on the corrosion behavior of cathodically protected mild steel in an artificial soil solution. Part I: Investigation on formed corrosion product layer. Mater. Corros. 2021, 73, 45–54. [Google Scholar] [CrossRef]
  36. Chen, L.; Du, Y.; Wang, M.; Liu, Y.; Liang, Y.; Zhu, Z.; Zhang, L. In situ and ex situ investigation on the product films evolution of pipeline steel under AC interference and high cathodic protection conditions. J. Electroanal. Chem. 2024, 967, 118308. [Google Scholar] [CrossRef]
  37. Zhang, Y.; Chen, L.; Qin, H.; Jiang, Z.; Du, Y.; Lu, M. Research on fluctuation characteristics of AC interference parameters and corrosion behavior of buried gas pipelines. Int. J. Electrochem. Sci. 2023, 19, 100396. [Google Scholar] [CrossRef]
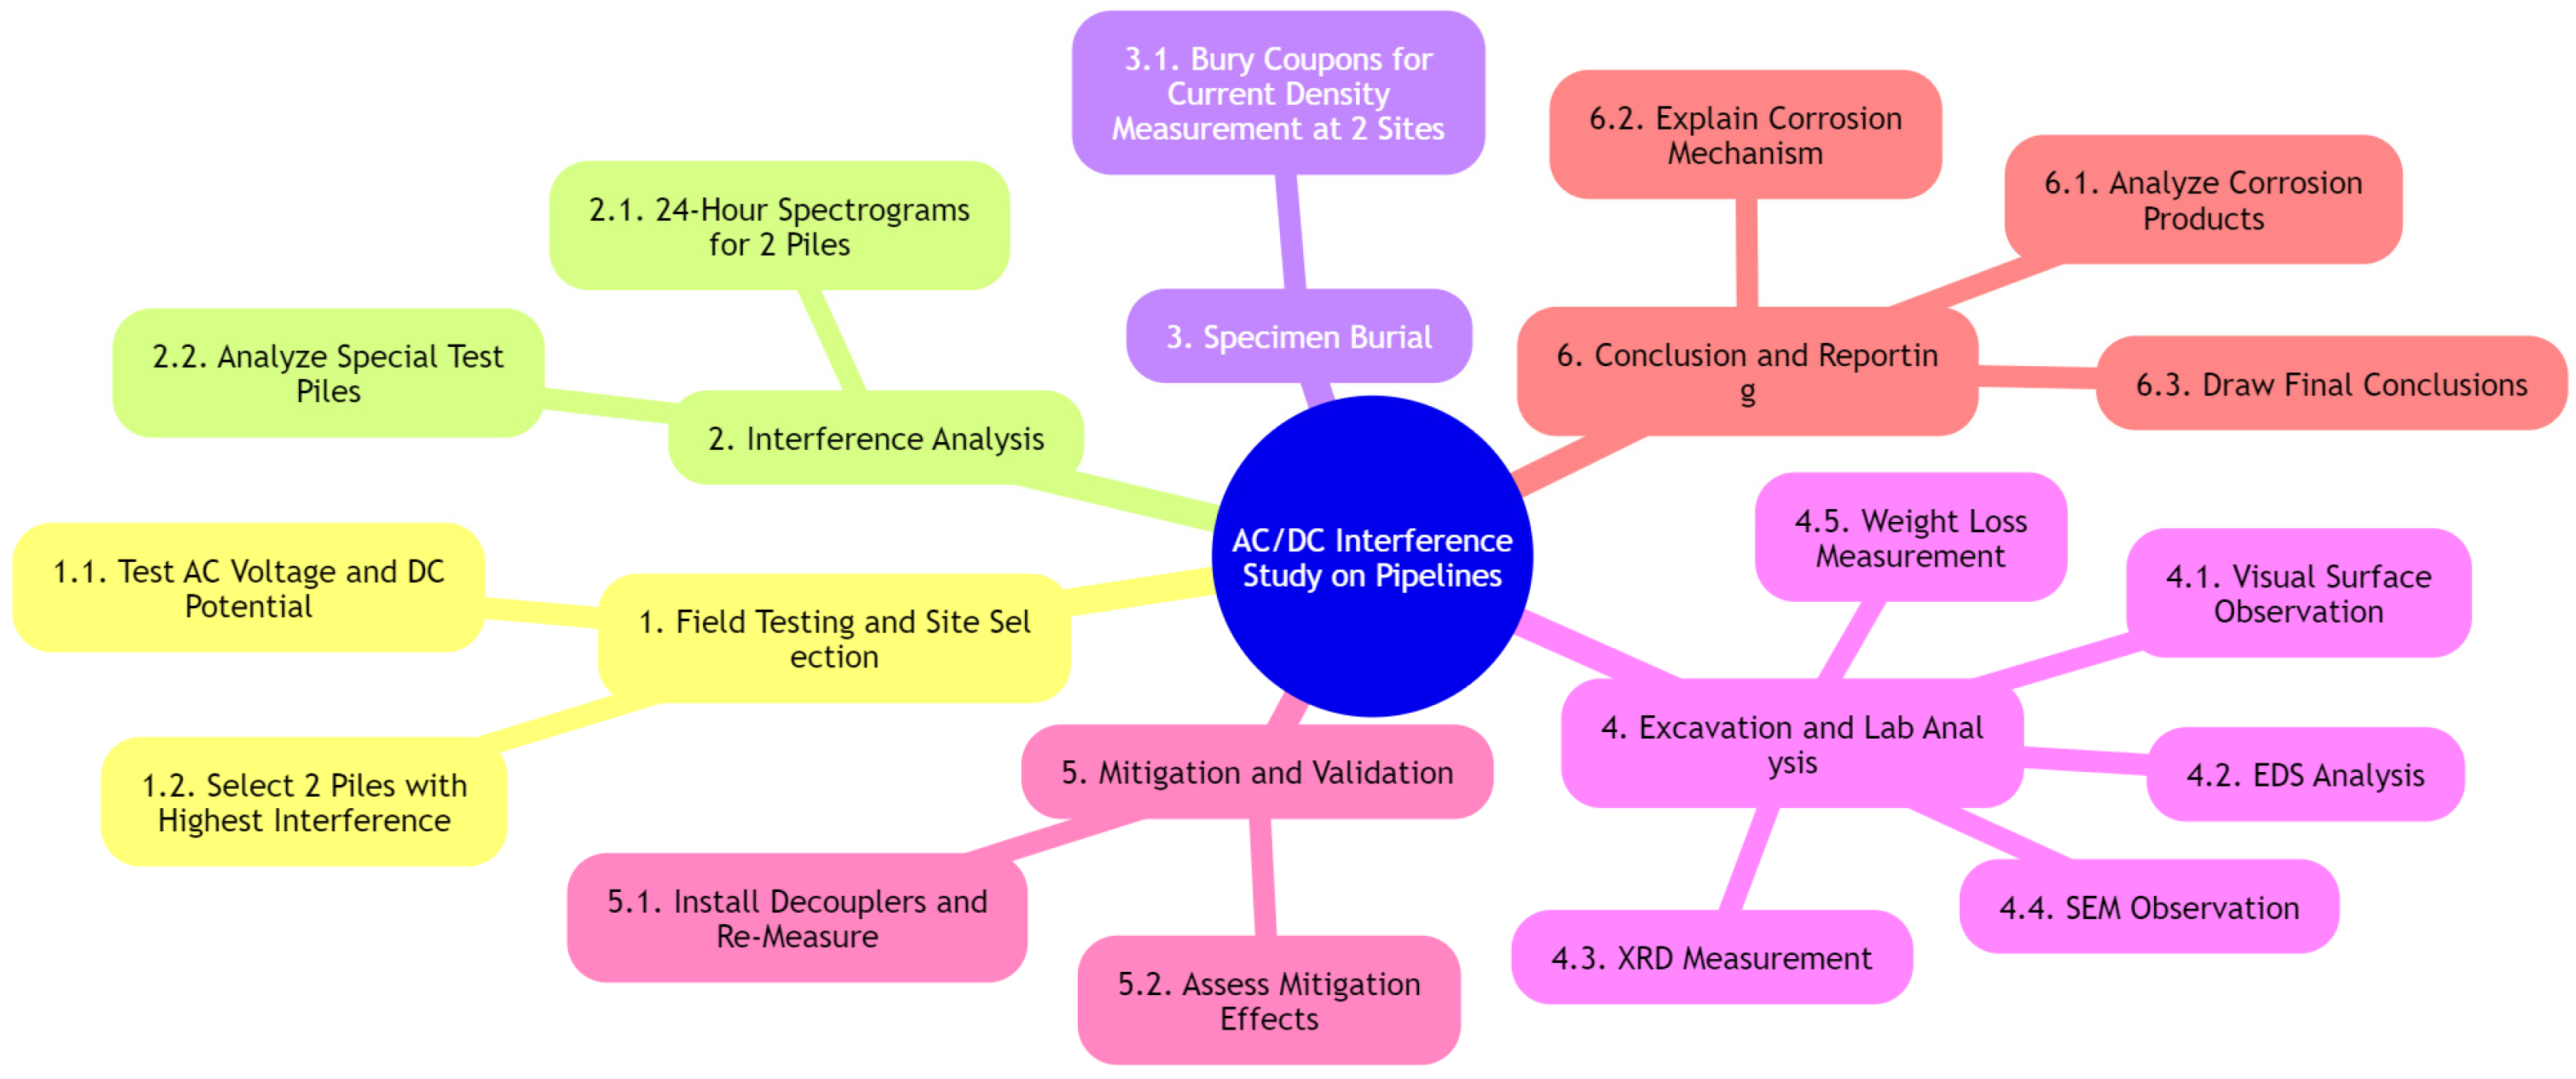
Figure 1. Experimental research program.
Coatings 15 01056 g001
Figure 2. The measurement method of AC and DC current density. 1. Test pipeline. 2. Test piece at the in situ measurement point. 3. Epoxy resin. 4. A shunt or standard resistor. 5. Voltmeter. 6. Ammeter.
Coatings 15 01056 g002
Figure 3. The peak value of AC interference along the pipeline.
Coatings 15 01056 g003
Figure 4. The average value of AC interference along the pipeline.
Coatings 15 01056 g004
Figure 5. The average and peak value of DC interference.
Coatings 15 01056 g005
Figure 6. (a). DC monitoring results at Pile 3; (b). AC monitoring results at Pile 3.
Coatings 15 01056 g006
Figure 7. (a) DC monitoring results at Pile 4; (b) AC monitoring results at Pile 4.
Coatings 15 01056 g007
Figure 8. (a) Histogram of DC current density at Pile 3; (b) histogram of AC current density at Pile 3.
Coatings 15 01056 g008
Figure 9. (a). Histogram of AC current density at Pile 4; (b) histogram of DC current density at Pile 4.
Coatings 15 01056 g009
Figure 10. (a) SEM image of the test piece at Pile 3; (b) SEM image of the test piece at Pile 4.
Coatings 15 01056 g010
Figure 11. (a) EDS analysis of the test piece at Pile 3; (b) XRD analysis of the test piece at Pile 3.
Coatings 15 01056 g011
Table 1. Performance of interference monitor.
Performance ItemsDCAC
Potential or voltage resolution±1 mV2 mV
Input impedance of instrument>1.0 × 10¹³ Ω>1.0 × 10⁶ Ω
Sampling step rate1 s/once1 millisecond/once
Measurement range±7 V2000 V
Measurement electrodesCu/CuSO4 electrodeSteel electrode
Field heat resistance temperature>70 Degrees Celsius>70 Degrees Celsius
Table 2. The AC and DC criteria from referenced standards.
AC VoltageDC PotentialAC Current Density
InterferenceVoltage (V)InterferenceValue (V)InterferenceCurrent Density (A/m2)
Weak≤4Corrosion−0.85Weak<30
Further assessment>4Hydrogen evolution−1.2Moderate≥30 and <100
Strong≥100
Table 3. Incident log of the tower management company.
Incident Log
Accident phenomenonAbout 7:15, thunderstorm, the video camera detected a sudden spark coming from Tower A.
Handling processArranged for workers to go to the site to check the situation.
Feedback from workersNo abnormalities were observed in the Tower A. Further observation was required.
Emergency responseSet up warning signs to prevent people or animals from approaching.
On-site inspectionAfter approximately one hour of observation, the thunderstorm ceased, and no further sparks were observed.
Cause of the malfunctionPossibly caused by lightning.
Handling resultNo accident occurred and normal power supply was not affected.
On dutyHidden
DateHidden
Table 4. Daily production schedule of the factory.
Daily Production Schedule
10 h to 17 hRest
17 h to 19 hPrepare building materials
19 h to 24 hTurned on the 380 V machinery
24 h to 10 hTransportation of building materials
Table 5. The comparison of the monitoring results of AC interference with or without the decouplers.
Pile No.Monitoring Maximum Value (V)Monitoring Minimum Value (V)Average Value (V)Standard Deviation
(V)
Percent Reductions in Time-Above-Threshold Values
0 (without decoupler)1.906201.15960.6998
0 (with decoupler)94.260.00071.43949.376No
1 (without decoupler)113.70.01850.02551.608
1 (with decoupler)0.316700.04290.0963100%
9 (without decoupler)106.7703.733614.87
9 (with decoupler)2.2141.7551.98720.1227100%
17 (without decoupler)114.2503.630811.18
17 (with decoupler)12.51203.5892.22598.6%
33 (without decoupler)1341.80.14720.727318.97
33 (with decoupler)0.200300.03370.0588100%
Disclaimer/Publisher’s Note: The statements, opinions and data contained in all publications are solely those of the individual author(s) and contributor(s) and not of MDPI and/or the editor(s). MDPI and/or the editor(s) disclaim responsibility for any injury to people or property resulting from any ideas, methods, instructions or products referred to in the content.