Article

Dynamic Response Analysis of Steel Bridge Deck Pavement Using Analytical Methods

Key Laboratory of Road Structure and Material Ministry of Communication, Changsha University of Science and Technology, Changsha 410114, China
*
Author to whom correspondence should be addressed.
Coatings 2025, 15(9), 1019; https://doi.org/10.3390/coatings15091019
Submission received: 30 July 2025 / Revised: 30 August 2025 / Accepted: 31 August 2025 / Published: 1 September 2025
(This article belongs to the Special Issue Novel Cleaner Materials for Pavements)

Abstract

This study simplifies the local model of the orthotropic steel bridge deck pavement into a two-dimensional composite continuous beam. Based on the Modal Superposition Method and Duhamel Integration, an analytical solution for the dynamic response of the composite continuous beam under moving harmonic loads is derived. Using the UHPC (Ultra-High Performance Concrete)-SMA (Stone Mastic Asphalt) composite pavement as an example, the influence of structural parameters on the analytical results is investigated. The results demonstrate that the natural frequencies of the three-span continuous composite beam obtained from the analytical method exhibit a relative error of less than 10% compared to finite element modal analysis, indicating high consistency. Furthermore, the analytical solutions for four key indicators—deflection, bending stress, interlayer shear stress, and interlayer vertical tensile stress—closely align with finite element simulation results, confirming the reliability of the derived formula. Additionally, increasing the thickness of the steel plate, UHPC layer, or asphalt mixture pavement layer effectively reduces the peak values of all dynamic response indicators.

1. Introduction

Orthotropic steel deck bridges have been widely used in long-span bridge structures such as suspension bridges and cable-stayed bridges due to their excellent load-bearing capacity, high degree of prefabrication, lightweight components, convenient transportation and erection, as well as short construction period [1,2]. The vibration load induced by vehicles is one of the primary loads borne by bridge structures. The steel bridge deck pavement is directly exposed to vehicle loads, and excessive dynamic responses are bound to affect the safety and service life of the bridge structure. Therefore, it is essential to conduct research on the dynamic response of steel bridge deck pavement structures.
Current research on the dynamic response of steel bridge deck pavements primarily adopts the following two approaches: field testing and numerical simulation. Wu et al. [3], Cheng et al. [4], and Ye et al. [5] conducted field testing by embedding sensors in bridge to capture the mechanical response characteristics of actual bridge structures. Obviously, field testing requires substantial human, material, and financial resources for on-site implementation, consequently being less widely used than numerical simulation. Si et al. [6] and Zeng et al. [7] investigated the mechanical response of steel bridge deck pavement layers under moving loads with different velocities. Zhang et al. [8] investigated the influence of fundamental performance parameters and structural parameters of orthotropic steel bridge decks and pavement layers on the mechanical response of pavement layers under moving constant loads. Wang et al. [9] and Chen et al. [10] evaluated the response of bridge deck pavement layers under moving constant loads with different interlayer contact conditions. Cui et al. [11] conducted a comparative analysis of the mechanical response of asphalt bridge deck pavements under sinusoidal vibration loading and rolling loading from a mesoscopic perspective using the Discrete Element Method (DEM). Chen et al. [12] and Liu et al. [13] investigated the dynamic response of steel bridge deck pavements by coupling moving constant loads with water and temperature loads, respectively.
Furthermore, existing analytical theories regarding the structural response of steel bridge deck pavements remain confined to static loading scenarios. Silva [14] developed a full probabilistic formulation to study the frequency-domain response of bridge deck pavement layers, performing detailed analytical calculations for pavement layers of varying thicknesses and deriving key conclusions. Seible and Latham [15] analyzed the mechanical behavior of complex pavement structures with full-depth asphalt concrete overlays using nonlinear slip and bending models. Wang et al. [16] further derived calculation formulas based on structural elastic theory to assess the influence of vehicles, temperature, and beam deformation on the mechanical properties of pavement layers at the ends of simply supported beams. Zhao et al. [17] established a simplified laminated beam calculation model, assuming that both the steel plate and asphalt pavement layer satisfy equilibrium and deformation compatibility conditions, with consistent shear stress distributions at the beam ends and mid-span. Based on this, they derived formulas for calculating interlayer stresses in simply supported laminated beams. Ge [18] developed a simply supported composite beam model for steel bridge decks, considering interlayer contact, deriving analytical solutions for slip strain, deflection, and interlayer normal and shear stresses. Pei et al. [19] derived an analytical expression for the stress distribution in the pavement layer under vehicle loads at normal temperatures based on two-dimensional elastic theory to address the susceptibility of steel box girder bridge decks to damage and cracking.
In summary, it is evident that current research lacks derivation of analytical solutions for dynamic responses in bridge deck pavements. So, in this study, the analytical solutions for the dynamic response of bridge deck pavement under moving harmonic loads were derived with the employment of the Modal Superposition Method and Duhamel Integration. And the pavement layer parameter analysis was executed based on this foundation, which can be with the expectation of providing a theoretical basis for the optimal design of steel bridge deck pavement.

2. Materials and Methods

To ensure clarity in the derivation process, all symbols and their corresponding physical meanings used in this chapter are systematically listed in the Table 1.

2.1. Modal Function for Equal-Span Continuous Beams

For a continuous beam with intermediate supports, we can simplify the analysis by replacing the supports with corresponding constraint reactions (R1, R2, …, Rₘ), as shown in Figure 1. So, the free vibration problem of the multi-span continuous beam is transformed into a forced vibration problem of a single simply-supported beam subjected to m unknown external forces [20].
Based on Euler-Bernoulli beam theory, the forced vibration Equilibrium equation is as follows [21]:
D 4 w x 4 + ρ A 2 w t 2 = i = 1 m P i ( t ) δ ( x x i ) 0 x ( m + 1 ) l
Constraint conditions of beam:
w x = 0 = w x = ( m + 1 ) l = 0 2 w x 2 x = 0 = 2 w x 2 x = ( m + 1 ) l = 0 w x = x 1 = w x = x 2 = w x = x 3 = = w x = x m = 0
When a continuous beam undergoes free vibration, the time-varying pattern of the intermediate support reactions coincides with the beam’s natural vibration frequencies. Therefore, we can set:
w = w ( x , t ) = W ( x ) e ω n t R i ( t ) = r i e ω n t
Substituting into the equilibrium equation yields:
D d 4 W ( x ) d x 4 ω n 2 ρ A W ( x ) = i = 1 m r i ( t ) δ ( x x i )
Laplace transform is performed on Equation (4), and by the derivative theorem, we obtain:
( s 4 k 4 ) L ( W ) = W ( 0 ) + s W ( 0 ) + s 2 W ( 0 ) + s 3 W ( 0 ) + i = 1 m r i D e s x i   ( i = 1 , 2 , , m )
Inverse Laplace transform is performed on Equation (5):
W ( x ) = i = 1 m r i 2 k 3 D sinh k ( x x i ) sin k ( x x i ) h ( x x i ) + W ( 0 ) 2 k 3 sinh k x sin k x + W ( 0 ) 2 k 2 ( cosh k x cos k x ) + W ( 0 ) 2 k ( sinh k x + sin k x ) + W ( 0 ) 2 ( cosh k x + cos k x )  
where h ( x x i ) = 0 x < x i 1 x x i and k 4 = ρ A D ω n 2 .
Equation (6) can also be written as follows:
W ( x ) = i = 1 m r i 2 k 3 D sinh k ( x x i ) sin k ( x x i ) h ( x x i ) + A sin k x + B sinh k x + C cos k x + D cosh k x
where A, B, C, and D are unknown coefficients.
The second derivative of Equation (7):
W ( x ) = i = 1 m r i 2 k D sinh k ( x x i ) + sin k ( x x i ) h ( x x i ) A k 2 sin k x + B k 2 sinh k x C k 2 cos k x + D k 2 cosh k x
Introducing Equations (7) and (8) into (2), we can obtain:
A = i = 1 m r i 2 k 3 D sin k ( L x i ) sin k L B = i = 1 m r i 2 k 3 D sinh k ( L x i ) sinh k L C = D = 0
W ( x ) = i = 1 m r i 2 k 3 D sinh k ( x x i ) sin k ( x x i ) h ( x x i ) + sin k ( L x i ) sin k L sin k x sinh k ( L x i ) sinh k L sinh k x
When x = xj, the displacement constraint conditions at supports are:
w x = x 1 = w x = x 2 = w x = x 3 = = w x = x m = 0
It can be written in matrix form
M 11 M 12 M 1 m M 21 M 22 M 2 m M m 1 M m 2 M m m r 1 r 2 r m = 0
To ensure non-trivial solutions, the determinant of the coefficient matrix in the above equation system is set to zero. This yields the frequency equation, from which the natural frequencies of each order and their ratios can be determined. Substituting these into Equation (10), the modal functions for each span and each order can be obtained. Ultimately, the modal functions of the continuous beam can also be uniformly expressed as:
W n ( x ) = a sin k n x + b sinh k n x + c cos k n x + d cosh k n x

2.2. Calculation of Bending Stiffness for Composite Beams

When the structure is a three-layer composite beam, the cross-section is shown in Figure 2.
The position of the neutral axis can be determined by the following equation
E 3 2 w x 2 z z d z E 2 2 w x 2 z z d z E 1 2 w x 2 z z d z = 0
The expression for the neutral axis position can be derived as follows:
h 0 = E 3 h 3 2 + E 2 h 2 ( 2 h 3 + h 2 ) + E 1 h 1 ( 2 h 3 + 2 h 2 + h 1 ) 2 ( E 1 h 1 + E 2 h 2 + E 3 h 3 )
where respectively denotes the elastic modulus of each layer.
The bending stiffness expression for a composite beam is:
D = E 1 ( h 1 + h 2 + h 3 h 0 ) 3 ( h 2 + h 3 h 0 ) 3 + E 2 ( h 2 + h 3 h 0 ) 3 ( h 3 h 0 ) 3 3 + E 3 h 0 3 + ( h 3 h 0 ) 3 3

2.3. Forced Vibration Calculation of a Three-Equal-Span Composite Beam

Consider a three-equal-span continuous beam subjected to a moving harmonic load, as illustrated in Figure 3. The load expression is assumed to be: F ( x , t ) = f 0 ( 1 + α sin ω v t ) δ ( x v t ) , where f represents the load amplitude; α represents the load impact factor, v denotes the constant traveling velocity, and ωv is the vibration frequency of the moving load
According to d’Alembert’s principle, the forced vibration equation is:
2 x 2 ( D 2 w x 2 ) + ρ A 2 w t 2 = F x , . t
Assuming the deflection of beam as follows:
w = w ( x , t ) = n = 1 W n ( x ) q n ( t )
where q n ( t ) represents the corresponding modal coordinate for the n-th mode, W n ( x ) denotes the n-th natural vibration mode function of the structure.
Substituting Equation (18) into Equation (17) and employing the orthogonality of modal function, we obtain:
d 2 q n ( t ) d t 2 + ω n 2 q n ( t ) = Q n ( t ) ρ A ψ
The generalized force is expressed as follows:
Q n ( t ) = L F x , t W n x d x 0 l F x , t W n 1 x d x 0   t l v 0 2 l F x , t W n 2 x d x l v   t 2 l v 0 3 l F x , t W n 3 x d x 2 l v   t 3 l v
When the load is in the first span, the modal coordinate is calculated based on principle of Duhamel’s Integral as follows:
q n ( t ) = 1 ρ A ψ ω n 0 t F τ W n 1 v τ sin w n t τ d τ
when the load is in the middle span,
q n ( t ) = 1 ρ A ψ ω n 0 l v F τ W n 1 v τ sin w n t τ d τ + l v t F τ W n 2 v τ sin w n t τ d τ
when the load is in the third span,
q n ( t ) = 1 ρ A ψ ω n 0 l v F τ W n 1 v τ sin w n t τ d τ + l v 2 l v F τ W n 2 v τ sin w n t τ d τ + 2 l v t F τ W n 3 v τ sin w n t τ d τ
By applying the equilibrium conditions in the x-direction, we can obtain:
τ x z 3 = z σ x 3 x d z = h 0 z E 3 z 3 w ( x , t ) x 3 d z = E 3 3 w ( x , t ) x 3 z 2 h 0 2 2 + K 5
By imposing the boundary condition τ xz 3 z = h 0 = 0 , we can derive:
K 5 = 0 τ x z 3 = E 3 3 w ( x , t ) x 3 z 2 h 0 2 2
Similarly, we can obtain:
τ x z 2 = z σ x 2 x d z ( h 0 h 3 ) z E 2 z 3 w ( x , t ) x 3 d z = E 2 3 w ( x , t ) x 3 z 2 ( h 0 h 3 ) 2 2 + K 6
By imposing the interlayer continuity conditions τ xz 3 z = ( h 0 h 3 ) = τ xz 2 z = ( h 0 h 3 ) , we can derive:
K 6 = E 3 ( h 3 2 2 h 0 h 3 ) 2 E 2 τ x z 2 = E 2 3 w ( x , t ) x 3 z 2 ( h 0 h 3 ) 2 2 + E 3 ( h 3 2 2 h 0 h 3 ) 2 E 2
Likewise, we can obtain:
τ x z 1 = z σ x 1 x d z ( h 0 h 3 h 2 ) z E 1 z 3 w ( x , t ) x 3 d z = E 1 3 w ( x , t ) x 3 z 2 ( h 0 h 3 h 2 ) 2 2 + K 7
By imposing the interlayer continuity condition, we can derive:
K 7 = E 2 ( h 0 h 3 h 2 ) 2 ( h 0 h 3 ) 2 + E 3 ( h 3 2 2 h 0 h 3 ) 2 E 1 τ x z 1 = E 1 3 w ( x , t ) x 3 z 2 ( h 0 h 3 h 2 ) 2 2 + E 2 ( h 0 h 3 h 2 ) 2 ( h 0 h 3 ) 2 + E 3 ( h 3 2 2 h 0 h 3 ) 2 E 1
By applying the equilibrium conditions in the z-direction, we can obtain:
σ z 3 = h 0 z ( ρ 3 2 w ( x , t ) t 2 τ x z 3 x ) d z   = ρ 3 2 w ( x , t ) t 2 z h 0 E 3 4 w ( x , t ) x 4 z 3 6 h 0 2 2 z z h 0   = ρ 3 2 w ( x , t ) t 2 z + h 0 E 3 4 w ( x , t ) x 4 z 3 + h 0 3 6 h 0 2 2 z + h 0 + K 8
By imposing the boundary condition σ z 3 z = h 0 = 0 , we can derive:
σ z 3 = h 0 z ( ρ 3 2 w ( x , t ) t 2 τ x z 3 x ) d z   = ρ 3 2 w ( x , t ) t 2 z z h 0 E 3 4 w ( x , t ) x 4 z 3 6 h 0 2 2 z z h 0   = ρ 3 2 w ( x , t ) t 2 z + h 0 E 3 4 w ( x , t ) x 4 z 3 + h 0 3 6 h 0 2 2 z + h 0
Similarly, we can obtain:
σ z 2 = h 0 h 3 z ( ρ 2 2 w ( x , t ) t 2 τ x z 2 x ) d z   = h 0 h 3 z ρ 2 2 w ( x , t ) t 2 E 2 4 w ( x , t ) x 4 z 2 ( h 0 h 3 ) 2 2 + E 3 ( h 3 2 2 h 0 h 3 ) 2 E 2 d z   = ρ 2 2 w ( x , t ) t 2 E 2 4 w ( x , t ) x 4 z 3 6 ( h 0 h 3 ) 2 2 z + E 3 ( h 3 2 2 h 0 h 3 ) 2 E 2 z z h 0 h 3   = ρ 2 2 w ( x , t ) t 2 ( z + h 0 h 3 ) E 2 4 w ( x , t ) x 4 z 3 6 ( h 0 h 3 ) 2 2 z + E 3 ( h 3 2 2 h 0 h 3 ) 2 E 2 z h 0 h 3 3 3 + E 3 ( h 3 2 2 h 0 h 3 ) h 0 h 3 2 E 2 + K 9
By imposing the interlayer continuity conditions σ z 3 z = h 0 h 3 = σ z 2 z = h 0 h 3 , we can derive:
σ z 2 = 4 w ( x , t ) x 4 E 2 z 3 6 ( h 0 h 3 ) 2 2 z E 3 2 ( h 3 2 2 h 0 h 3 ) z + E 2 h 0 h 3 3 3 + E 3 3 h 0 h 3 2 h 3 3 6 + ( 2 h 0 h 3 h 3 2 ) 2 h 0 h 3   + ρ 2 2 w ( x , t ) t 2 ( z + h 0 h 3 ) + ρ 3 2 w ( x , t ) t 2 h 3
σ z 2 z = ( h 0 h 3 h 2 ) = E 3 4 w ( x , t ) x 4 3 h 0 h 3 2 h 3 3 6 + h 2 ( 2 h 0 h 3 h 3 2 ) 2 + ρ 3 2 w ( x , t ) t 2 h 3 + E 2 4 w ( x , t ) x 4 ( h 0 h 3 h 2 ) h 0 h 3 h 2 2 3 ( h 0 h 3 ) 2 6 + h 0 h 3 3 3 + ρ 2 2 w ( x , t ) t 2 h 2
Likewise, we can obtain:
σ z 1 = h 0 h 3 h 2 z ( ρ 1 2 w ( x , t ) t 2 τ x z 1 x ) d z   = 4 w ( x , t ) x 4 E 1 z 3 6 ( h 0 h 3 h 2 ) 2 2 z + h 0 h 3 h 2 3 3 E 2 2 ( h 0 h 3 h 2 ) 2 ( h 0 h 3 ) 2 h 0 h 3 h 2 + z E 3 2 ( h 3 2 2 h 0 h 3 ) z + h 0 h 3 h 2   + ρ 1 2 w ( x , t ) t 2 ( z + h 0 h 3 h 2 ) + K 10
Likewise, by imposing the interlayer continuity conditions σ z 2 z = h 0 h 3 h 2 = σ z 1 z = h 0 h 3 h 2 , we can derive:
σ z 1 = 4 w ( x , t ) x 4 E 1 z 3 6 ( h 0 h 3 h 2 ) 2 2 z + h 0 h 3 h 2 3 3 E 2 2 ( h 0 h 3 h 2 ) 2 ( h 0 h 3 ) 2 h 0 h 3 h 2 + z E 3 2 ( h 3 2 2 h 0 h 3 ) z + h 0 h 3 h 2   + E 3 4 w ( x , t ) x 4 3 h 0 h 3 2 h 3 3 6 + h 2 ( 2 h 0 h 3 h 3 2 ) 2   + E 2 4 w ( x , t ) x 4 ( h 0 h 3 h 2 ) h 0 h 3 h 2 2 3 ( h 0 h 3 ) 2 6 + h 0 h 3 3 3   ρ 3 2 w ( x , t ) t 2 h 3 + ρ 2 2 w ( x , t ) t 2 h 2 + + ρ 1 2 w ( x , t ) t 2 ( z + h 0 h 3 h 2 )

3. Results and Discussions

3.1. Evaluation of Analytical Solution

The composition and dimensions of the selected steel bridge deck pavement example are listed in Table 2.
Since the actual cross-section of the orthotropic steel bridge deck pavement contains U-rib stiffeners, the U-ribs are converted into an equivalent steel plate thickness based on the principles of stiffness equivalence and mass equivalence. This simplification allows the local model of the steel bridge deck pavement to be represented as a three-equal-span composite continuous beam, where each span length corresponds to the diaphragm spacing.
Based on the continuous beam natural frequency formula derived in the previous section, the natural frequencies of the continuous beam were calculated. A finite element model of the composite beam with identical parameters was subsequently established using Abaqus 2022 software for modal analysis and is shown in Figure 4. The element type selected is the 8-node linear hexahedron reduced integration (C3D8R) element, and after meshing, there are a total of 9600 elements.
The first five natural frequencies obtained from these two computational methods are presented in Table 3. From Table 3, we can see that the relative errors between these two computational approaches remain consistently below 1%. This close agreement substantiates the validity and reliability of the derived analytical frequency equations for practical engineering applications.
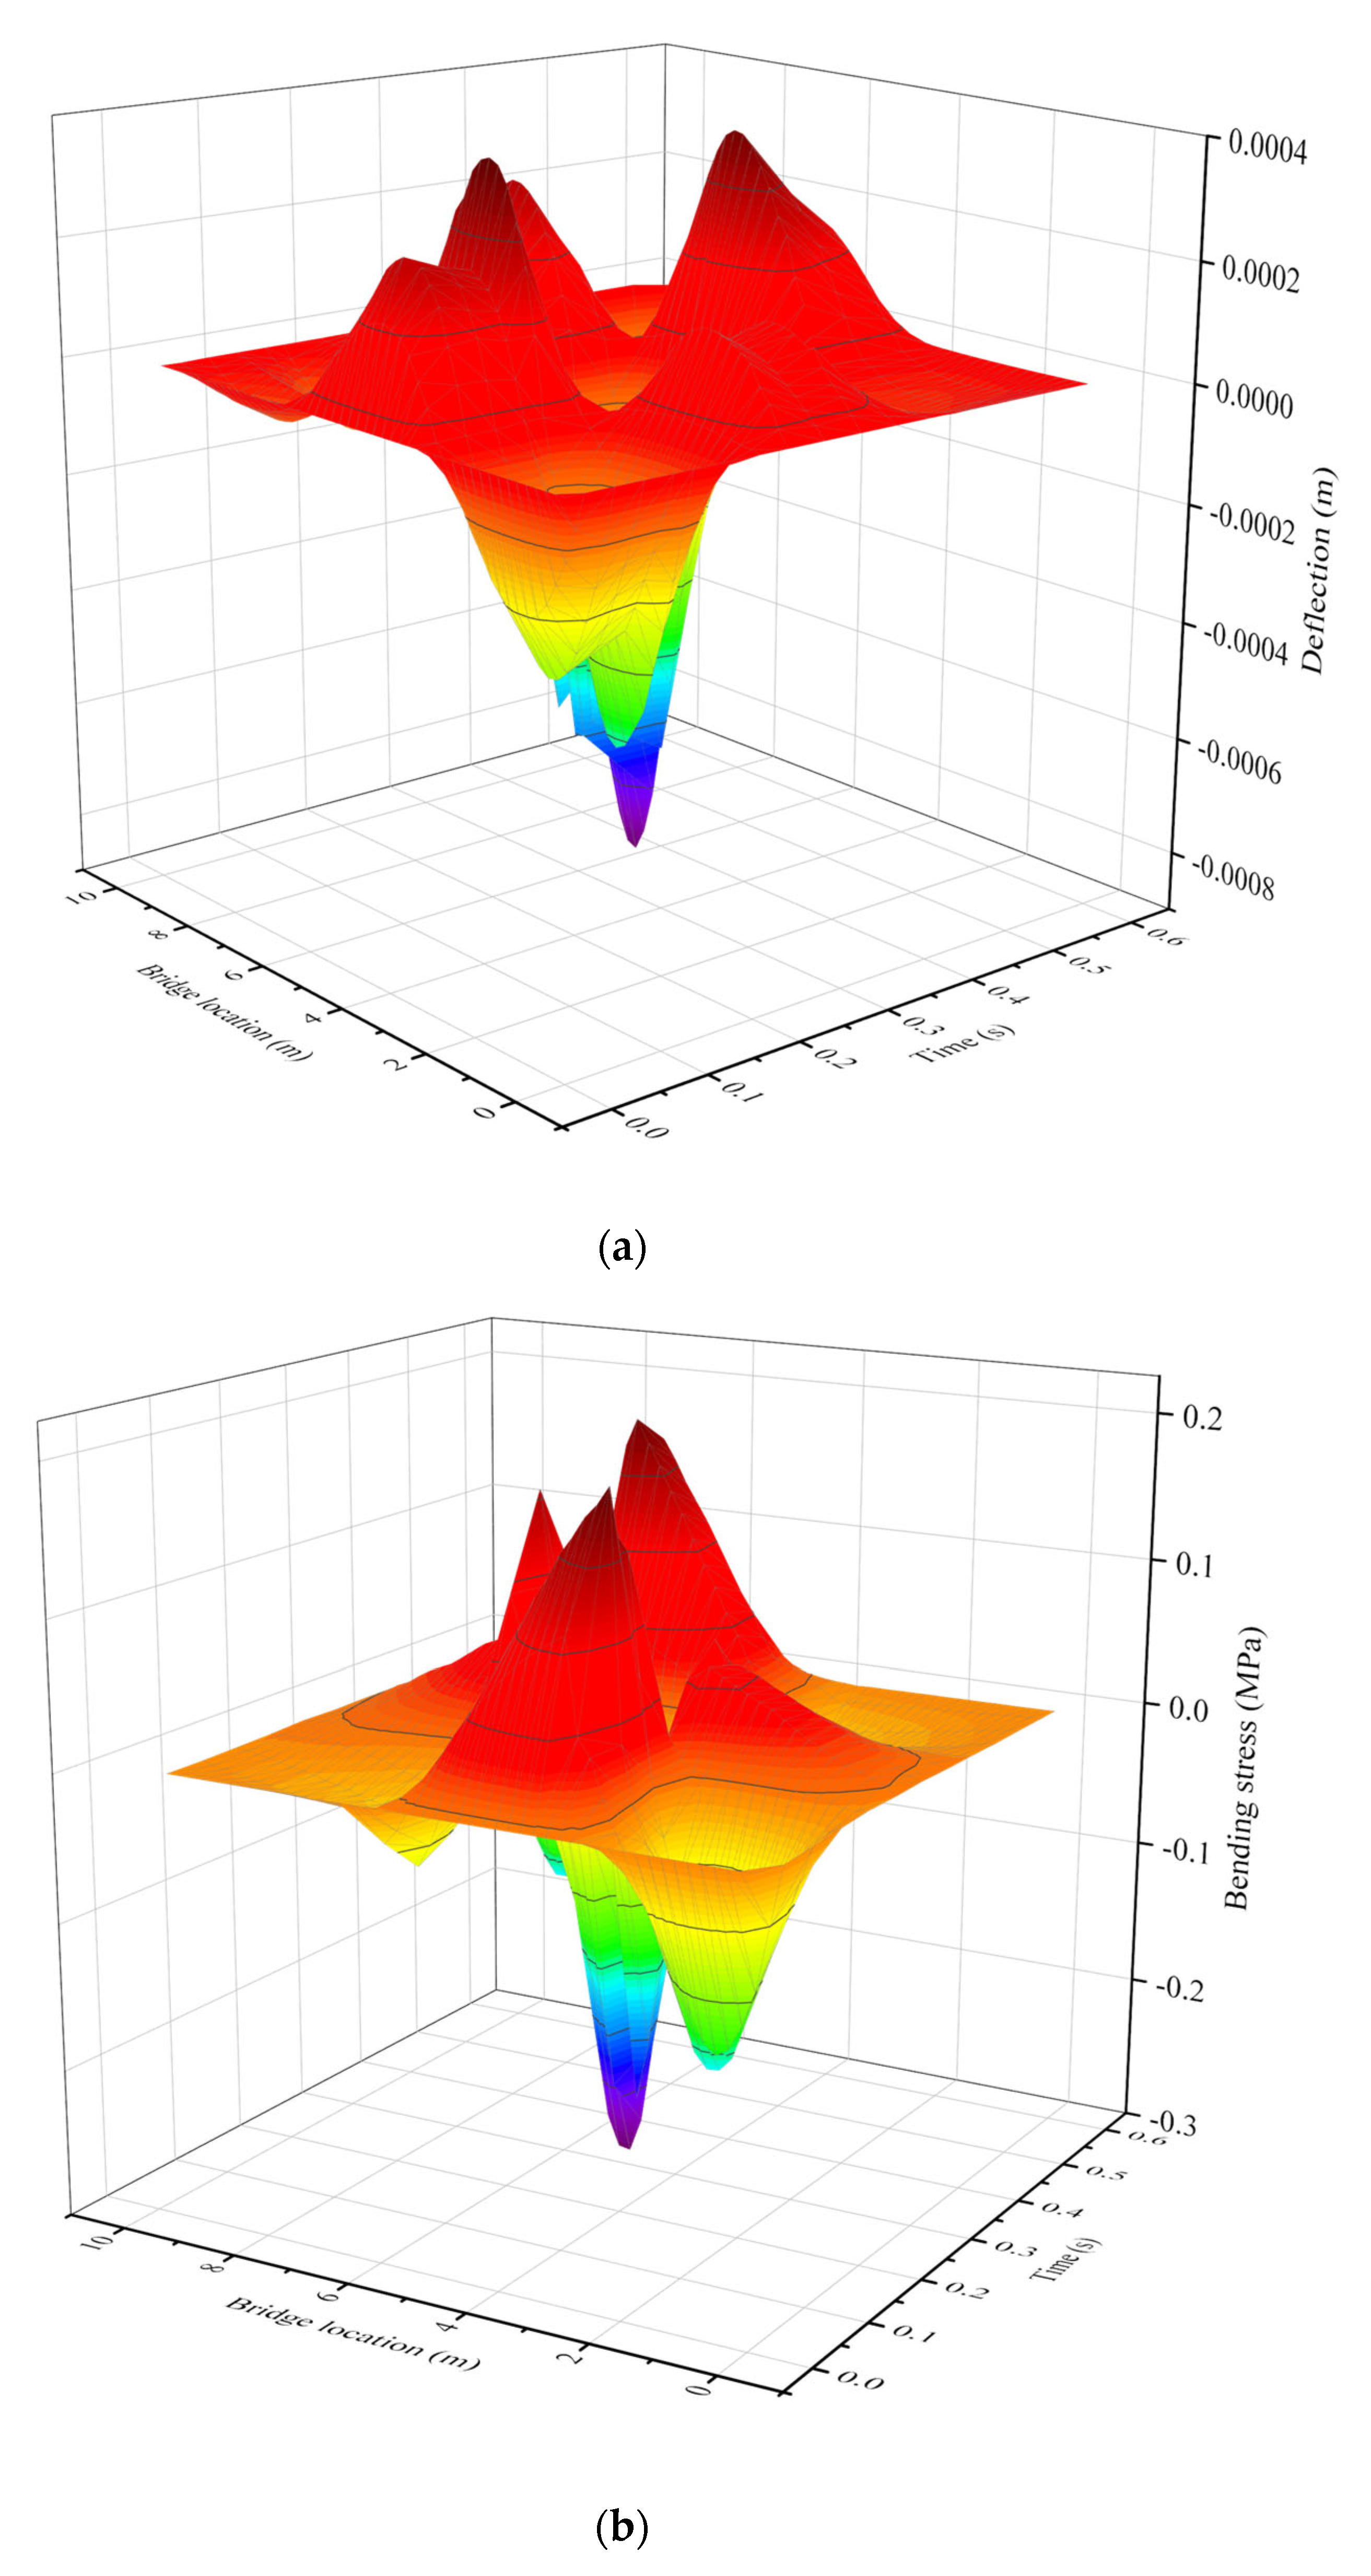
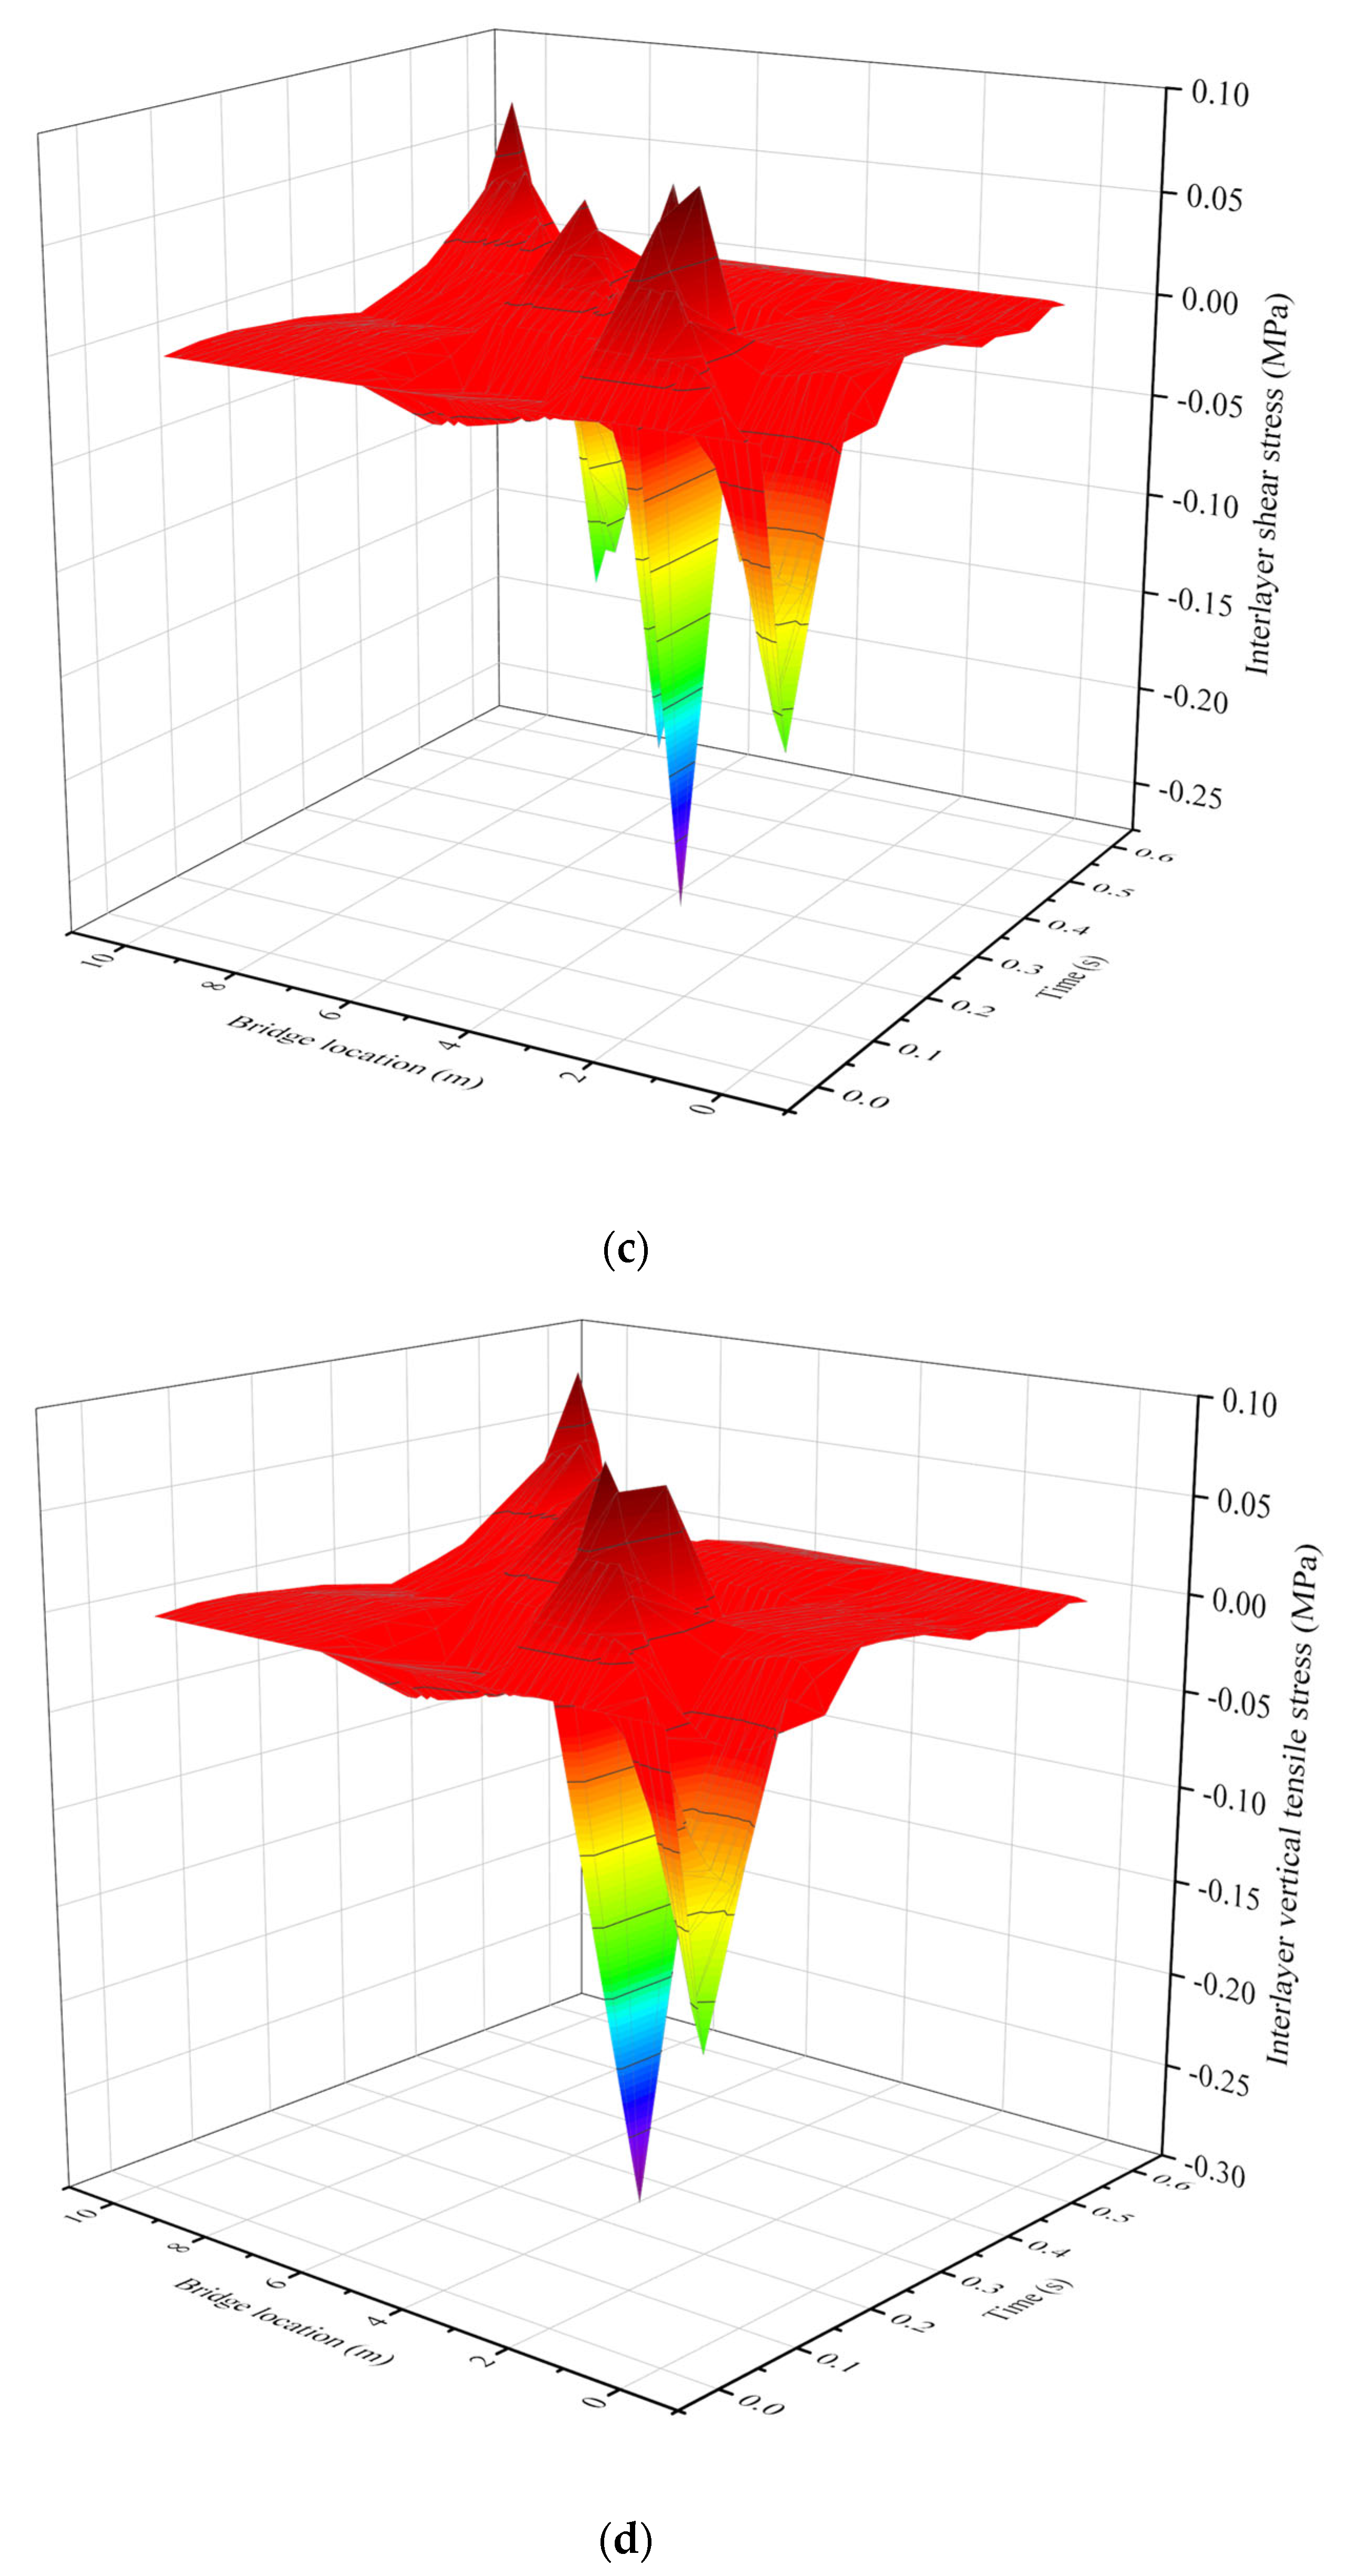
Based on the deflection and internal force calculation formulas derived in the previous chapter, the dynamic response results of the three-span continuous composite beam model under moving sinusoidal loading were computed. The key loading parameters are specified as follows: α = 0.3 ; v = 16.67   m / s ; ω v = 10   Hz . And the results are shown in Figure 5.
From the figure, it can be observed that for the deflection indicator, the deflection at each point generally reaches its peak when the load acts directly on that point. Among them, the deflection near the midspan of the second span is the largest. Therefore, for the deflection indicator, the midspan of the second span is selected as the most critical location. For the bending stress indicator, the peak stress occurs at the beginning of the second span. Hence, in subsequent bending stress analysis, the beginning of the second span is chosen as the most critical position. Regarding the interlayer shear stress between the UHPC and SMA layers, the peak value appears at the beginning of the second span and reaches its maximum when the moving load passes near this location. This implies that when the load traverses near the diaphragm, the longitudinal interlayer shear stress above the diaphragm reaches its highest values. Accordingly, for further analysis on this indicator, the beginning of the second span is also selected as the most critical position. As for the interfacial vertical stress between the UHPC and SMA layers, both tensile and compressive stresses also occur at the beginning of the second span. The maximum tensile stress is attained as the load approaches this point, while the maximum compressive stress appears when the load is directly above it, with the compressive peak being higher than the tensile peak. Similarly, in subsequent analysis of interfacial vertical tensile stress, the beginning of the second span is again identified as the most critical location.
The deflection at mid-span of the second span, bending stress, UHPC-SMA interlayer shear, and vertical tensile stress at the beginning of the second span were calculated using analytical formulations and composite beam finite element modeling. The comparative results are presented in Figure 6. It shows that the analytical solution result of dynamic response derived in this paper is close to the result computed by the finite element solution, indicating that the derived analytical calculation formula of dynamic response is accurate and reliable.

3.2. Influence of Structural Parameters on Dynamic Response

3.2.1. Steel Plate Thickness

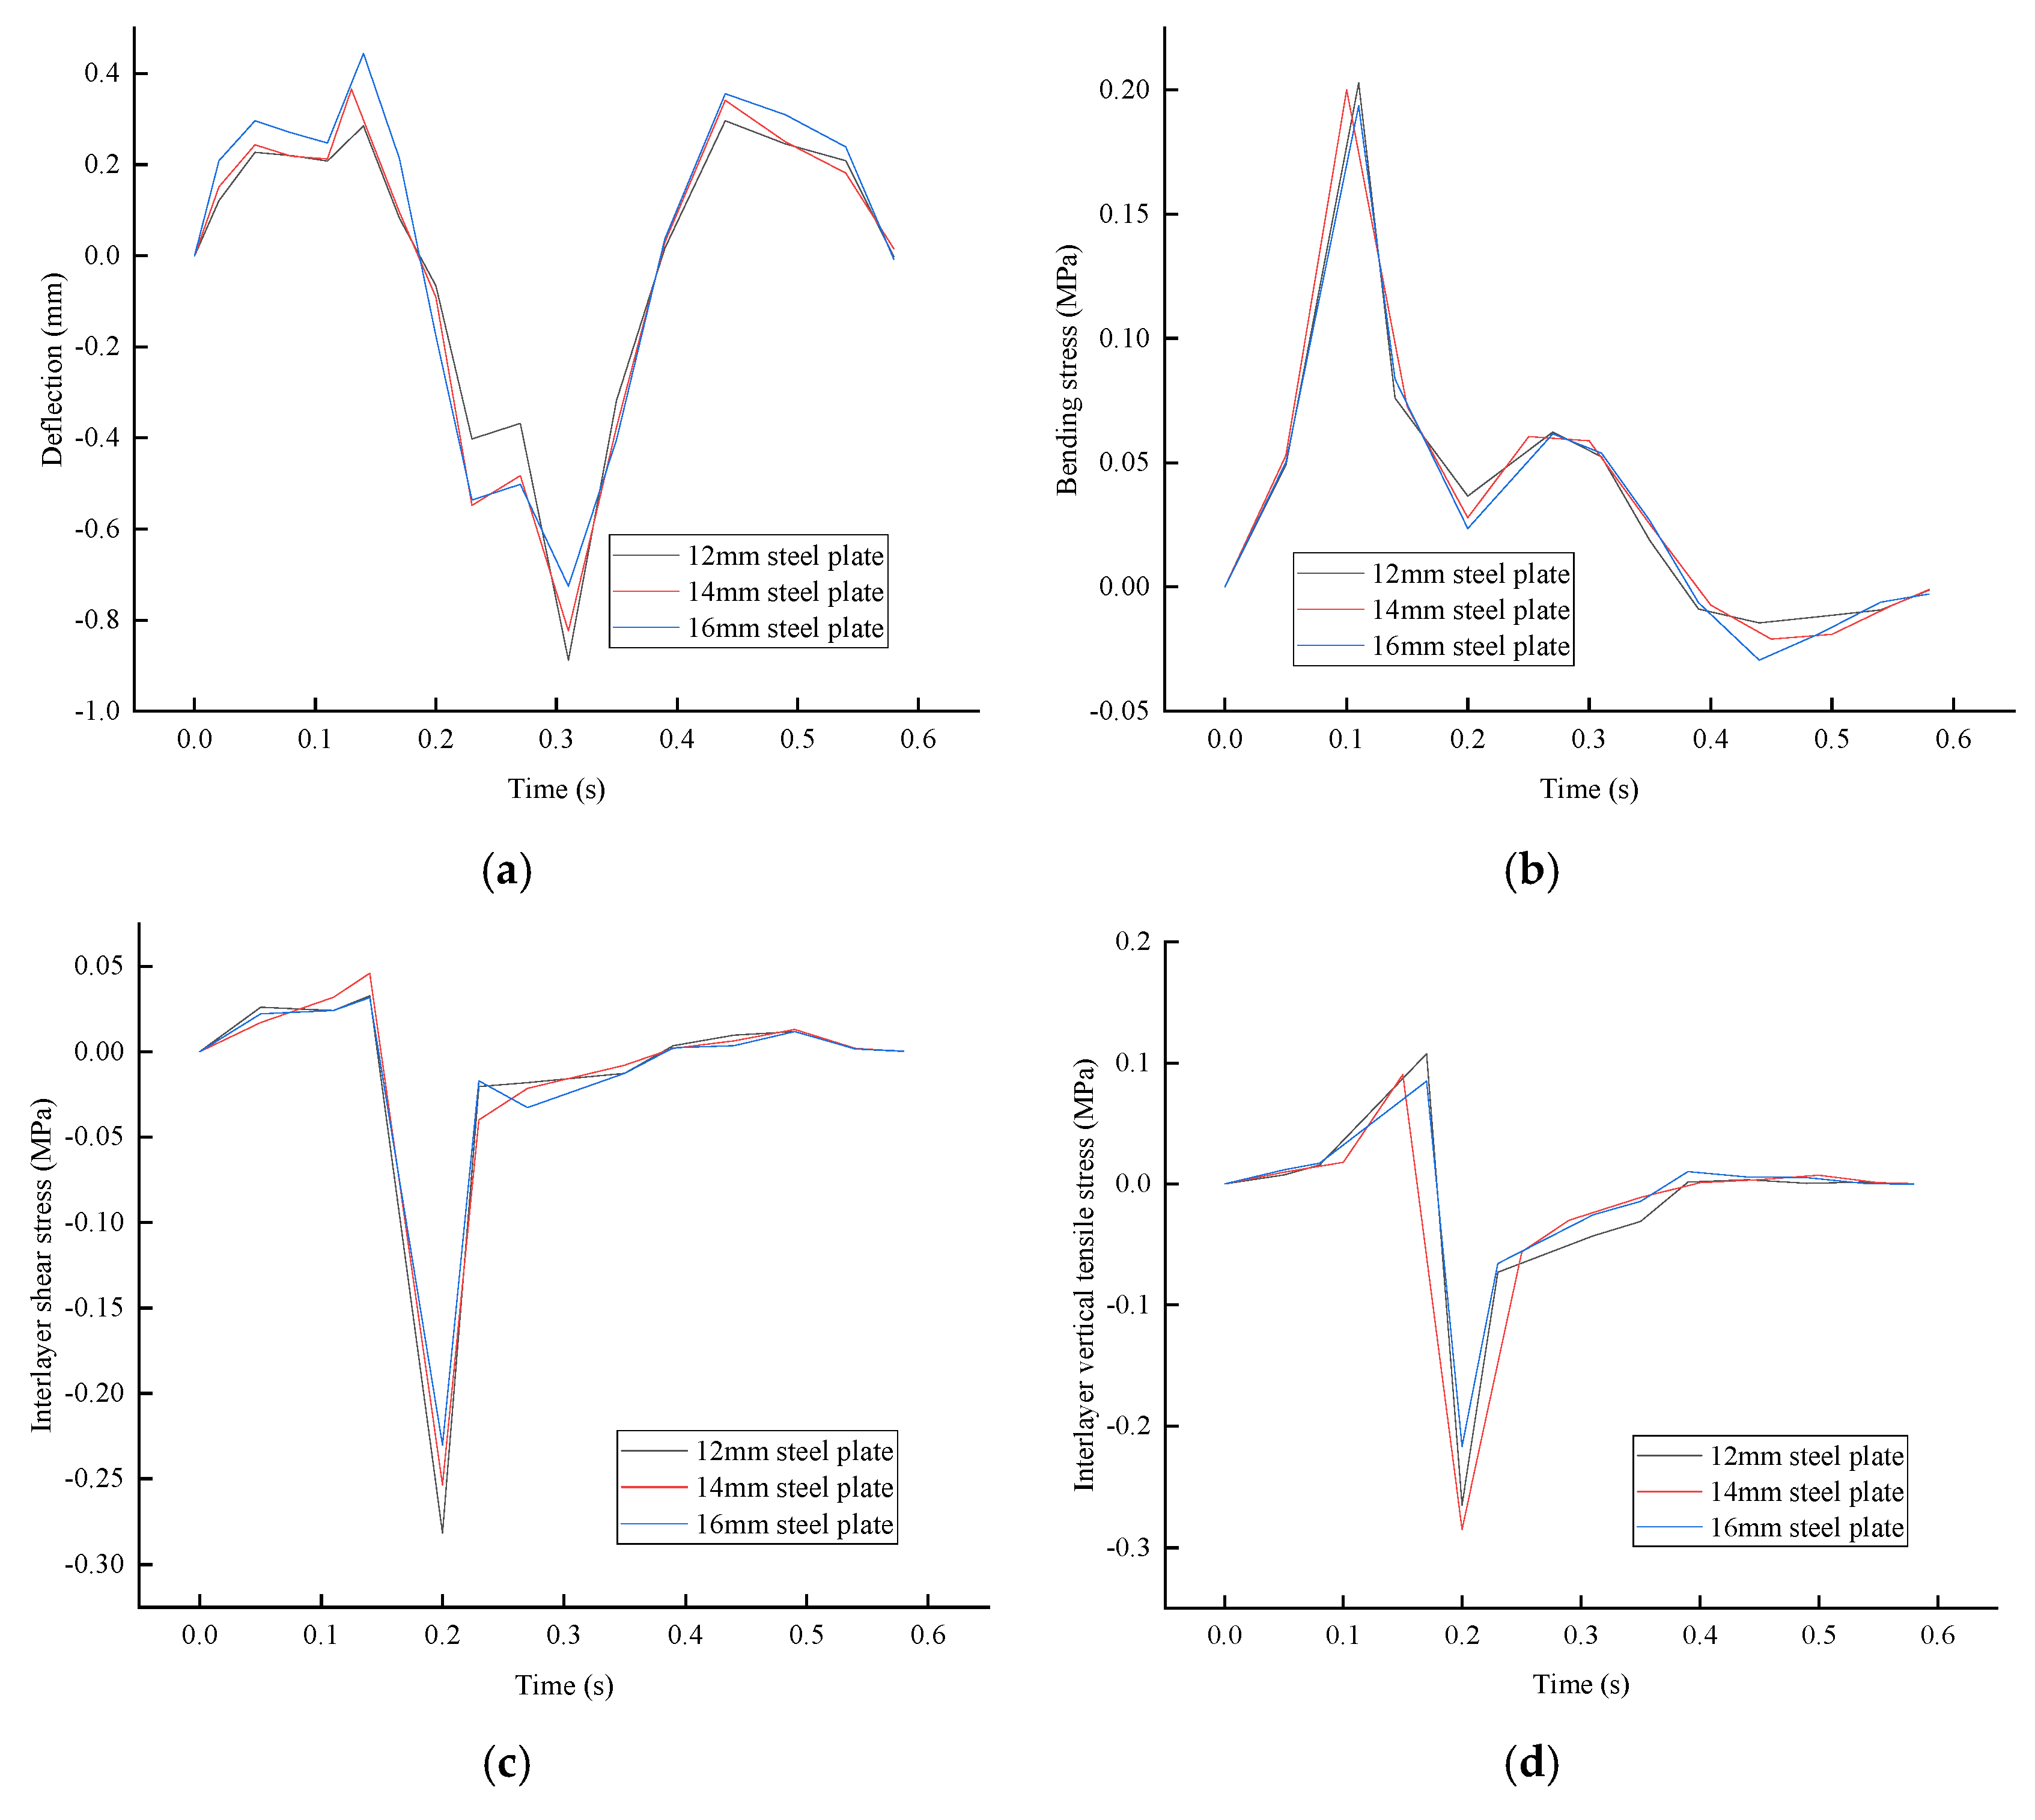
Steel plate thicknesses of 12 mm, 14 mm, and 16 mm were selected, and the dynamic responses under each working condition were calculated using analytical formulas. The time-history diagrams of dynamic responses at the most critical locations for each indicator are shown in Figure 7, and the peak values under different conditions are shown in Table 4.
The results demonstrated that when the steel plate thicknesses are 12 mm, 14 mm, and 16 mm, the peak deflections under the three conditions were 0.888 mm, 0.824 mm, and 0.726 mm, respectively. It was evident that as the steel plate thickness increased, the peak deflection exhibited a gradual but slight decreasing trend. Compared to the 12 mm condition, the peak deflection for the 14 mm and 16 mm conditions decreased by 7% and 18% respectively. For the bending stress indicator, the peak values corresponding to steel plate thicknesses of 12 mm, 14 mm, and 16 mm were 0.209 MPa, 0.200 MPa, and 0.194 MPa, respectively. As the steel plate thickness increases, the bending stress showed a generally decreasing trend, though the reduction is not particularly significant. Regarding the peak UHPC-SMA interlayer shear stress indicator, a noticeable reduction occurred as the steel plate thickness increased. When the thickness rose from 12 mm to 14 mm, it decreased from 0.281 MPa to 0.254 MPa, representing a 10% reduction. Further increasing the thickness to 16 mm resulted in a peak value of 0.230 MPa, marking an 18% reduction compared to the 12 mm condition. Concerning the UHPC-SMA interlayer vertical tensile stress indicator, when the steel plate thickness increased from 12 mm to 14 mm, the peak value dropped from 0.108 MPa to 0.0903 MPa with a reduction of 16%. Upon further thickening to 16 mm, the peak value decreased to 0.0848 MPa, corresponding to a 21% reduction.
This differential sensitivity suggests that while increasing steel plate thickness universally improves performance, both the interfacial shear and vertical tensile stress benefit more from thickness enhancement compared to deflection and bending stress.

3.2.2. UHPC Thickness

Three UHPC thicknesses (60 mm, 70 mm, and 80 mm) were selected to calculate the dynamic responses under various conditions using analytical formulas. The time-history curves of dynamic responses at the most critical locations for each indicator are illustrated in Figure 8, and the peak values under different conditions are shown in Table 5.
The results showed that when the UHPC thickness was set at 60 mm, 70 mm, and 80 mm, respectively, the peak deflection under the three working conditions was 0.864 mm, 0.824 mm, and 0.808 mm. This indicates that only a marginal reduction appears in peak deflection with increasing UHPC thickness. The peak bending stress exhibited a gradual decreasing trend as thickness increased. For UHPC thicknesses of 60 mm, 70 mm, and 80 mm, the corresponding peak tensile stresses were 0.212 MPa, 0.200 MPa, and 0.179 MPa, respectively. Compared to the 60 mm condition, the peak value for the 70 mm and 80 mm conditions decreased by 6% and 16% respectively. The peak UHPC-SMA interlayer shear stress also decreased with increasing UHPC thickness. When the thickness increased from 60 mm to 70 mm, the peak value decreased from 0.284 MPa to 0.254 MPa (a 11% reduction). Further increasing the thickness to 80 mm resulted in a peak interfacial shear stress of 0.233 MPa, representing an 18% reduction. For the UHPC-SMA interlayer vertical tensile stress, increasing the thickness from 60 mm to 70 mm, the peak stress developed from 0.0998 MPa to 0.0903 MPa with a reduction of 10%. However, when the thickness increased to 80 mm, the peak value decreased significantly to 0.0787 MPa, achieving a substantial 21% reduction, which showed more significant variation than the other three indexes.
The analysis demonstrates that increasing UHPC thickness can reduce the peak values of all four dynamic response indicators to varying degrees. Comparative evaluation reveals that deflection shows lower sensitivity to UHPC thickness variations than the other response indicators.

3.2.3. SMA Thickness

Three SMA thicknesses (30 mm, 35 mm, and 40 mm) were selected to calculate the dynamic responses under various working conditions using analytical formulas. The time-history curves of dynamic responses for each indicator are illustrated in Figure 9, and the peak values under different conditions are shown in Table 6.
When the SMA thickness was set at 30 mm, 35 mm, and 40 mm, respectively, the peak deflection under the three working conditions was 0.848 mm, 0.832 mm, and 0.824 mm. The results indicate that increasing the SMA thickness only leads to a marginal reduction in peak deflection. Compared to the 30 mm condition, the average peak deflection for the 35 mm and 40 mm conditions decreased by approximately 2%. The peak bending stress also exhibited a gradual decreasing trend with increasing thickness. For SMA thicknesses of 30 mm, 35 mm, and 40 mm, the corresponding peak values were 0.215 MPa, 0.202 MPa, and 0.200 MPa, respectively. Relative to the 30 mm condition, the peak value for the 35 mm and 40 mm conditions decreased by 6% and 7% respectively. The peak UHPC-SMA interlayer shear stress demonstrated a fluctuating decreasing pattern as the SMA thickness increased. When the thickness increased from 30 mm to 35 mm, the peak value decreased from 0.265 MPa to 0.240 MPa (a 10% reduction). However, when the thickness was further increased to 40 mm, the peak value slightly rebounded to 0.254 MPa, representing a 4% reduction compared to the 30 mm condition but a minor increase relative to the 35 mm condition. For the UHPC-SMA interlayer vertical tensile stress indicator, increasing the thickness from 30 mm to 35 mm reduced the peak stress from 0.111 MPa to 0.104 MPa (a 6% reduction). When the thickness was further increased to 40 mm, the peak value decreased significantly to 0.0903 MPa, achieving a substantial 19% reduction.
The analysis demonstrates that increasing the SMA thickness can reduce the peak values of all the aforementioned dynamic response indicators to varying degrees. Comparatively, the influence of SMA thickness on the UHPC-SMA interlayer vertical tensile stress is notably more significant than its effects on the other indicators.

4. Conclusions

This study establishes a theoretical foundation for dynamic response prediction and parameter optimization in orthotropic steel bridge deck pavement systems under moving harmonic loads. The conclusions are drawn as follows:
  • The proposed analytical model demonstrates exceptional accuracy, with deviations of less than 1% in natural frequencies compared to FEM results, validating its effectiveness in capturing dynamic characteristics.
  • All key response indicators derived from the analytical formulas show strong agreement with finite element simulations, confirming the reliability and general applicability of the theoretical framework.
  • A significant finding is the identification of critical response locations: maximum deflection occurs near the midspan of the second span, while the most unfavorable conditions for bending stress, UHPC-SMA interlayer shear stress, and vertical tensile stress are consistently located at the beginning of the second span.
  • This study quantitatively demonstrates that increasing the thickness of key components—namely the steel plate, UHPC layer, and asphalt pavement—effectively reduces peak dynamic responses and enhances overall mechanical performance under dynamic loads, providing practical guidance for optimized design. At the same time, within the range of parameters discussed, the optimal structural combination plan is: 16 mm steel plate + 80 mmUHPC + 40 mmSMA.
In summary, the analytical formulas demonstrate outstanding accuracy in predicting the full set of key response indicators—including deflection, bending stress, and interfacial shear/vertical tensile stresses. This provides designers with a unified and efficient tool, enabling rapid and comprehensive dynamic response assessment without relying on computationally expensive finite element simulations. However, this study has the following limitations: a. There is a lack of experimental validation. b. The impact of the natural factors (such as temperature and moisture) and even coupling factors on dynamic response can be considered in future work. c. It is necessary to establish finite element results based on relevant orthotropic steel bridge deck pavement models to modify the analytical calculation results derived from simplified models, with the aim of acquiring the dynamic response of steel deck pavement more accurately.

Author Contributions

Conceptualization, S.Y.; data curation, S.Y. and Y.Z.; formal analysis, S.Y.; investigation, S.Y.; methodology, S.Y.; supervision, Z.Z.; validation, K.L.; writing—original draft, S.Y.; writing—review and editing, S.Y. and Y.Z. All authors have read and agreed to the published version of the manuscript.

Funding

This research received no external funding.

Institutional Review Board Statement

Not applicable.

Informed Consent Statement

Not applicable.

Data Availability Statement

Data are contained within the article.

Conflicts of Interest

The authors declare no conflicts of interest.

References

  1. Han, Y.J.; Zhang, Z.; Tian, J.H.; Ni, F.J. Long-term in situ performance evaluation of epoxy asphalt concrete for long-span steel bridge deck pavement. Coatings 2023, 13, 545. [Google Scholar] [CrossRef]
  2. Deng, S.W.; Zhou, H.Y.; Shao, X.D.; Mo, R.; Wag, Y. Effects of moving traffic on fresh UHPC retrofit orthotropic steel decks. Constr. Build. Mater. 2025, 491, 142614. [Google Scholar] [CrossRef]
  3. Wu, J.T.; Ye, F.; Wu, H.R.; Jia, X.Y. Dynamic strain response of asphalt pavement on steel bridge deck under real bridge loading. J. Tongji Univ. (Nat. Sci.) 2014, 42, 378–385. [Google Scholar]
  4. Cheng, H.L.; Liu, L.P.; Sun, L.J. Experimental study on dynamic strain response of asphalt mixture pavement on steel bridge deck. China Civ. Eng. J. 2019, 52, 100–109. [Google Scholar]
  5. Ye, F.; Song, Q.Q. Mechanical response of ultra-high performance concrete pavement on steel bridge deck under real bridge loading. J. Tongji Univ. (Nat. Sci.) 2020, 48, 982–989. [Google Scholar]
  6. Si, C.; Su, X.; Chen, E.; Yan, Z. Comparative study on dynamic response of deck pavement of two kinds of box girder bridges under moving loads. Shock Vib. 2019, 2019, 6052745. [Google Scholar] [CrossRef]
  7. Zeng, G.D.; Xu, W.; Huang, H.M. Study of the strain response of asphalt pavements on orthotropic steel bridge decks through field testing and numerical simulation. J. Test. Eval. 2020, 48, 1615–1633. [Google Scholar] [CrossRef]
  8. Zhang, C.; Chen, L.; Liu, G.; Qian, Z. Dynamic response of multitower suspension bridge deck pavement under random vehicle load. Adv. Mater. Sci. Eng. 2021, 2021, 6667853. [Google Scholar] [CrossRef]
  9. Wang, X.; Zhang, C.; Sun, R. Response analysis of orthotropic steel deck pavement based on interlayer contact bonding condition. Sci. Rep. 2021, 11, 23692. [Google Scholar] [CrossRef] [PubMed]
  10. Chen, W.; Hui, B.; Rahman, A. Interlayer shear characteristics of bridge deck pavement through experimental and numerical analysis. Materials 2022, 15, 7001. [Google Scholar] [CrossRef] [PubMed]
  11. Cui, Y.; Si, C.; Li, S.; Fan, T. Comparative study of the mesomechanical response of asphalt bridge deck pavement under multiple loads. Coatings 2022, 12, 1665. [Google Scholar] [CrossRef]
  12. Chen, L.; Liu, G.; Pan, G.; Qian, Z.D. Investigation on the pore water pressure in steel bridge deck pavement under the coupling effect of water and vehicle load. Constr. Build. Mater. 2023, 409, 134021. [Google Scholar] [CrossRef]
  13. Liu, Y.; Qian, Z.D.; Zhang, M. Fatigue damage analysis of epoxy asphalt pavement for steel bridges considering coupled effects of heavy load and temperature variations. J. Southeast Univ. 2017, 33, 478–483. [Google Scholar]
  14. Da Silva, J.G.S. Dynamical performance of highway bridge decks with irregular pavement surface. Comput. Struct. 2004, 82, 871–881. [Google Scholar] [CrossRef]
  15. Seible, F.; Latham, C.T. Horizontal load transfer in structural concrete bridge deck overlays. J. Struct. Eng. 2015, 116, 2691–2710. [Google Scholar] [CrossRef]
  16. Wang, H.; Hu, C.S.; Wang, B.G. Structural analysis of continuous deck pavement at simply-supported beam bridge end. J. Xi’an Highway Univ. 2000, 20, 1–3. [Google Scholar]
  17. Zhao, F.J.; Li, Y.Z.; Yi, W.J. Simplified model for interlayer stress analysis of bridge deck asphalt pavement. China Civ. Eng. J. 2007, 40, 100–104. [Google Scholar]
  18. Ge, W.F. Study on Deformation Compatibility Between Steel Bridge Deck Pavement and Steel Box Girder Top Plate. Master’s Thesis, Southeast University, Nanjing, China, 2012. [Google Scholar]
  19. Pei, Z.Y.; Wu, P.; Zhou, D.; Xu, X.L. Stress analysis of steel bridge deck pavement based on elastic mechanics. J. Nanjing Tech Univ. (Nat. Sci. Ed.) 2021, 43, 497–502+522. [Google Scholar]
  20. Li, J. A method for determining exact solutions of natural vibration in multi-span continuous beams. Mech. Eng. 1992, 2, 27–29. [Google Scholar]
  21. Li, D.; Yang, H.; Ma, J.J.; Wang, J.; Wang, C.S.; Guo, Y. Analytical investigation on the dynamic behavior of multi-span continuous beams supported on soil with finite depth. Coatings 2024, 14, 864. [Google Scholar] [CrossRef]
Figure 1. Equal-span continuous beams.
Coatings 15 01019 g001
Figure 2. Diagram of the cross-section of a composite beam.
Coatings 15 01019 g002
Figure 3. Equal-span Continuous Beams objected to moving load.
Coatings 15 01019 g003
Figure 4. Finite element model.
Coatings 15 01019 g004
Figure 5. Dynamic response calculated by the analytical solution: (a) deflection; (b) bending stress; (c) UHPC-SMA interlayer shear stress; (d) UHPC-SMA interlayer vertical tensile stress.
Coatings 15 01019 g005aCoatings 15 01019 g005b
Figure 6. Dynamic response calculated by different methods: (a) deflection; (b) bending stress; (c) UHPC-SMA interlayer shear stress; (d) UHPC-SMA interlayer vertical tensile stress.
Coatings 15 01019 g006
Figure 7. Dynamic response calculated with different steel plate thicknesses: (a) deflection; (b) bending stress; (c) UHPC-SMA interlayer shear stress; (d) UHPC-SMA interlayer vertical tensile stress.
Coatings 15 01019 g007
Figure 8. Dynamic response calculated with different UHPC thicknesses: (a) deflection; (b) bending stress; (c) UHPC-SMA interlayer shear stress; (d) UHPC-SMA interlayer vertical tensile stress.
Coatings 15 01019 g008
Figure 9. Dynamic response calculated with different SMA thicknesses: (a) deflection; (b) bending stress; (c) UHPC-SMA interlayer shear stress; (d) UHPC-SMA interlayer vertical tensile stress.
Coatings 15 01019 g009
Table 1. Calculation list.
SymbolDefinition ContextSymbolDefinition Context
D bending stiffness ω n natural frequency
ρ density E i modulus of each layer
A area of cross section h i thickness of each layer
δ ( x ) dirac delta function h 0 position of the neutral axis
w ( x , t ) deflection W n ( x ) modal function
q n ( t ) modal coordinate Q n ( t ) the generalized force
Table 2. Parameters of orthotropic steel bridge deck pavement systems.
Structural ComponentValueStructural ComponentValue
U-rib spacing600 mmdeck width600 mm
U-rib opening width300 mmdiaphragm spacing3200 mm
U-rib closed width170 mmpavement scheme14 mm (210 GPa) + 70 mmUHPC (35,500 MPa) + 40 mm SMA (7200 MPa)
U-rib height280 mm
U-rib thickness8 mmnumber of diaphragm4
Table 3. Natural frequency result.
Modal OrderAnalytical Solution Result (Hz)FEM Result (Hz)Error (‰)
162.0261.941.3
279.4478.857.4
3115.05114.732.8
4247.98247.990.040
5282.67280.736.9
Table 4. Peak value under different steel plate thicknesses.
Steel Plate Thickness (mm)121416
peak deflection (mm)0.8880.8240.726
peak bending stress (MPa)0.2090.2000.193
peak UHPC-SMA interlayer shear stress (MPa)0.2810.2540.230
peak UHPC-SMA interlayer vertical tensile stress (MPa)0.1080.09030.0848
Table 5. Peak value under different UHPC thicknesses.
UHPC Thickness (mm)607080
peak deflection (mm)0.8640.8240.808
peak bending stress (MPa)0.2120.2000.179
peak UHPC-SMA interlayer shear stress (MPa)0.2840.2540.233
peak UHPC-SMA interlayer vertical tensile stress (MPa)0.09980.09030.0787
Table 6. Peak value under different SMA thicknesses.
SMA Thickness (mm)303540
peak deflection (mm)0.8480.8320.824
peak bending stress (MPa)0.2150.2020.200
peak UHPC-SMA interlayer shear stress (MPa)0.2650.2400.254
peak UHPC-SMA interlayer vertical tensile stress (MPa)0.1110.1040.0903
Disclaimer/Publisher’s Note: The statements, opinions and data contained in all publications are solely those of the individual author(s) and contributor(s) and not of MDPI and/or the editor(s). MDPI and/or the editor(s) disclaim responsibility for any injury to people or property resulting from any ideas, methods, instructions or products referred to in the content.