Abstract
In the present study, a finite element-based numerical simulation approach was employed to investigate the temperature field distribution and variations in molten pool dimensions during the selective laser melting (SLM) forming process of Al2O3/CoCr metal matrix composites. Building on this foundation, the present work explored the regulatory effects of volumetric energy density (VED) on the performance of SLM-fabricated components. Ultimately, the optimal process parameters for the selective laser melting of Al2O3/CoCr metal matrix composites were identified and established. The results show that when the laser power is in the range of 150–250 W and the scanning speed is 700–1100 mm/s, it is beneficial to the SLM forming of Al2O3/CoCr metal matrix composites. When the VED is between 133.3 J/mm3 and 171.4 J/mm3, the microstructural defects of the composite are the least. The optimal SLM process parameters are finally determined as follows: laser power 200 W, scanning speed 700 mm/s, scanning line spacing 0.06 mm, and hatch spacing 0.03 mm.
1. Introduction
Selective laser melting (SLM) for forming metal matrix composites has received special attention. The Al2O3/CoCr metal matrix composite represents an innovative material system, where Al2O3 serves as the reinforcing phase. This configuration induces lattice distortion and sluggish diffusion, endowing the composite with outstanding comprehensive properties. Specifically, it exhibits a unique combination of high strength and toughness, along with excellent corrosion and wear resistance [1,2,3]. However, its performance remains constrained by the forming method employed. Among various forming technologies, the SLM-based forming of metal matrix composites has attracted particular attention. Y. Song et al. [4] systematically analyzed the thermodynamic behavior of the high-entropy alloy Al0.5CoCrFeNi HEA under different deposition strategies using the finite element method. The results show that the HEA deposited with the zoned stripe 67° rotated scanning mode exhibits the most uniform temperature distribution, the lowest residual stress value, and the smallest local deformation degree. This is attributed to the dispersion of heat in different regions and directions. These findings provide valuable insights for the process design and performance optimization of high-entropy alloy series in additive manufacturing. Y. Dmitriy et al. [5] studied the SLM forming of AlSi10MgCu/Al2O3 metal matrix composites. The research indicates that when the laser power is 350 W and the scanning speeds are 1200 mm/s and 1600 mm/s, the density values of the composites with 0.5% and 1.5% Al2O3 content are both higher than 99.5%. Gu Dongdong et al. [6] investigated the SLM forming mechanism and properties of Al2O3-reinforced Al-based composites. The study shows that when the scanning speed is 550 mm/s, Al2O3 particles are uniformly dispersed in the molten pool, the composites have the fewest defects, the highest hardness (with an average value of 175 HV0.1), good wear resistance (with a friction coefficient of 0.11), and a significantly reduced wear rate (4.75 × 10⁻⁵ mm3·N−1·m−1).
Based on existing research, substantial achievements have been made in studies on the selective laser melting (SLM) fabrication of Al2O3/metal metal matrix composites. Meanwhile, according to the preliminary findings of our research team [7], Al2O3/CoCr metal matrix composites exhibit excellent comprehensive performance, warranting further investigation. Given that the forming process parameters of Al2O3/CoCr metal matrix composites fabricated via SLM have a significant impact on the service performance of the formed parts, this paper focuses on investigating the forming parameters and quality control of SLM-fabricated Al2O3/CoCr metal matrix composites.
The core concept of the finite element method is to discretize the entire solution domain into a finite set of interconnected small elements, and then derive the overall functional behavior of the domain by solving the functions of these discrete elements. When applied to the simulation of thermodynamic behaviors during the SLM processing, it can avoid the problem of time and resource waste caused by a large number of physical experiments [8,9,10,11]. To obtain the optimal SLM forming parameters, numerous studies have employed temperature field simulation in finite element numerical simulation to determine the SLM forming process parameters [12]. For example, Q. Hanc et al. [13] analyzed the effects of scanning spacing and scanning speed on SLM-formed Al-Al2O3 parts through finite element simulation combined with forming experiments, and determined the optimal SLM process parameters. C. Teng et al. [14] studied the molten pool tendency and porosity of CoCr parts formed by SLM. The results show that when the laser moving speed is constant, increasing the laser power leads to an increase in the size of the molten pool and a decrease in porosity. J. Yin et al. [12] used Ansys software to simulate the relationship between process parameters and molten pool behavior during the SLM processing of CoCr alloy. The results show that increasing the laser power leads to a corresponding increase in the width and depth of the molten pool, while increasing the laser scanning speed reduces the width and depth. When the laser scanning speed is 750 mm/s and the laser power ranges from 160 W to 200 W, high-density and high-quality SLM-formed CoCr alloy parts can be produced.
In summary, numerous achievements have been made in research on the SLM forming of Al2O3/metal composites. However, there are relatively few reports on the SLM forming of Al2O3/CoCr metal matrix composites. During the SLM forming process, the high-energy laser beam rapidly melts the powder layer, forming a high-temperature molten pool that then solidifies quickly [15,16]. The material undergoes a series of complex physical, chemical, and metallurgical processes in an extremely short time, including heat transfer, melting, mass transfer, phase transformation, and solidification. The molten pool is the smallest unit for material forming in the SLM process, and the temperature field distribution and morphology of the molten pool directly affect the microstructure evolution of ceramic/metal matrix composites [12,17,18]. In actual forming experiments, it is difficult to monitor the molten pool temperature in real time and accurately. Therefore, this study uses the ANSYS numerical simulation method to analyze the temperature field distribution during the SLM forming of Al2O3/CoCr metal matrix composites, aiming to provide an important reference for optimizing the SLM forming process and obtaining high-quality Al2O3/CoCr metal matrix composites.
2. Materials and Methods
2.1. Governing Equations and Related Conditions
Studies have indicated that the temperature field in the SLM process constitutes a typical nonlinear transient three-dimensional heat conduction issue [19]. The basic controlling equation describing this temperature field is given by Equation (1).
where ρ is the density of the material, c is the specific heat capacity of the material, T is the initial temperature of the powder bed, t is the interaction time between the laser and the powder, k is the thermal conductivity of the material, and Q is the heat power consumption per unit volume.
In this study, the initial conditions and boundary conditions of this governing equation are as follows:
In the temperature field simulation, when t = 0, the powder and substrate in the SLM process are set to the same temperature. In existing studies, the initial temperature of metal materials, including CoCr alloy, is mostly [12], while the initial temperature of ceramic material Al2O3 is 126.85 °C [13,19]. It is evident that Al2O3 requires a higher initial temperature. To more accurately simulate the temperature field of Al2O3/CoCr metal matrix composites, the initial temperature in this study is set to T0 = 135 °C, and the initial condition is expressed as Equation (2):
During the SLM forming process, melting and solidification are always accompanied by the absorption and release of latent heat of phase transformation, so enthalpy can be expressed as follows:
where H is enthalpy (J/m3), ρ is the density of the material (kg/m3), c is the specific heat capacity (J/(kgK)), and T is the temperature.
Boundary conditions are determined based on heat flux distribution, convective heat transfer coefficient, medium temperature, and radiation heat dissipation conditions. The heat flux energy density on the surface of Al2O3/CoCr powder can be expressed by Equation (4):
Under the determined convective heat transfer coefficient, the outer surface of the formed Al2O3/CoCr part is in a convective state with the protective gas, and their relationship can be expressed by Equation (5):
where λ is the convective heat transfer coefficient (W/m2K), n is the normal direction cosine value of the boundary, Ts is the model surface temperature (K), and Tf is the temperature of the medium (K).
Under the determined effective emissivity, the outer surface of the formed Al2O3/CoCr part conducts radiation heat transfer with the entire external environment of the simulation, and their relationship can be expressed by Equation (6):
where α is the Stefan–Boltzmann constant with a value of 5.67 × 10⁻⁸ W/(m2·K4), ε is the effective emissivity of the object, T is the surface temperature of the model (K), and Tenv is the ambient temperature (K).
2.2. Model Establishment
2.2.1. T Geometric Model
A three-dimensional transient numerical model was constructed using ANSYS 2020 R2 software, with its schematic illustration presented in Figure 1a. The model consists of two parts: a powder bed and a substrate, made of Al2O3/CoCr composite material and 316 L stainless steel, respectively. The hexahedral element SOLID70 was selected for the model. SOLID70 has eight nodes, each with only one temperature degree of freedom, making it suitable for 3D transient heat conduction models. A finer mesh (0.01 mm × 0.01 mm × 0.01 mm) was used for the powder bed element model, with an element length less than 1/8 of the laser spot diameter, ensuring both simulation accuracy and computational efficiency. During the simulation, a Gaussian surface heat source was employed. The laser scanning path strategy for the model shows that the powder bed is divided into two layers, each with five scanning tracks, using a parallel line reciprocating scanning strategy. Points A and B are located at the centers of the first and second layers, respectively.
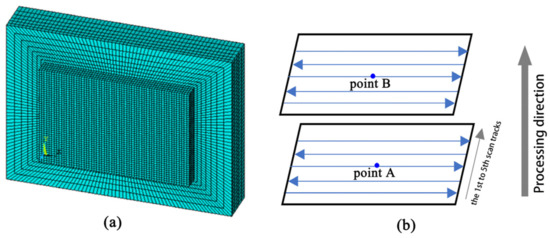
Figure 1.
Finite element model of Al2O3/CoCr metal matrix composite SLM forming specimen: (a) finite element model, (b) scanning strategy.
To realistically simulate the selective laser melting (SLM) process, the element birth-death technique is employed for the powder spreading process of each layer. This technique can accurately reproduce the layered manufacturing process of “powder spreading–scanning–solidification”: all pending powder layers to be formed are initially set as dead elements. When scanning the first layer, the corresponding area is activated while keeping the second and subsequent layers in a dead state; after completing the first layer, the second layer is then activated and scanned, and so on. This accurately reflects the physical process of gradual material accumulation.
2.2.2. Process Parameter Settings
In the present research, laser power and scanning speed were chosen as core investigative variables to examine their impacts on the SLM forming process of Al2O3/CoCr metal matrix composites. The laser power was set in the range of 100–300 W with an increment of 50 W, while the scanning speed was set in the range of 300–1100 mm/s with an increment of 200 mm/s. Specifically, when varying the laser power, the scanning speed was fixed at 900 mm/s; when adjusting the scanning speed, the laser power was fixed at 200 W. Other process parameters remained constant during the forming process, as listed in Table 1.

Table 1.
Temperature field simulation process parameters.
2.3. Determination of Thermophysical Parameters of the Composite Material
The powder material prepared in this study is an Al2O3/CoCr composite material. Its thermophysical parameters can be calculated according to the thermophysical parameters of particle-reinforced metal matrix composites. When the content of particles in the matrix is known, the thermal conductivity of the metal matrix composite can be calculated using Equation (7) [20].
where Vi is the volume percentage of particles in the metal matrix composite, λi is the thermal conductivity of the particles, λm is the thermal conductivity of the matrix, and λc is the thermal conductivity of the metal matrix composite.
The thermal conductivity of the Al2O3/CoCr metal matrix composite was calculated using Equation (7), and then the specific heat capacity of the composite material was deduced on the basis of this thermal conductivity data. In the SLM process, when the temperature exceeds the melting point, convection within the molten pool must be considered. Given that the interaction between the laser and the material becomes more intense during this phase, the thermal conductivity is empirically doubled from its original value [21]. The calculation results for the Al2O3/CoCr metal matrix composite are shown in Figure 2.
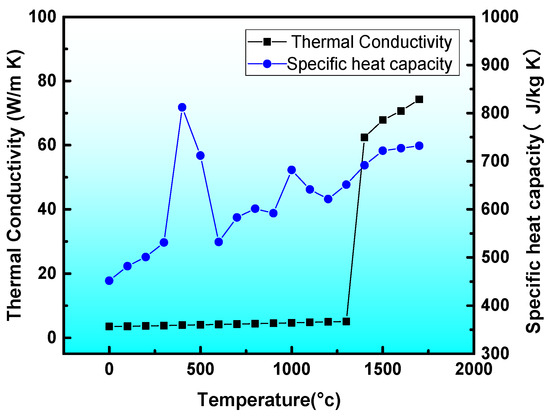
Figure 2.
Thermophysical properties of the metal matrix composites.
3. Experimentation
3.1. Powder Materials
The CoCr0404 alloy powder used in this experiment was supplied by Renishaw (Kingswood, UK), with a density of 8.3 g/cm3 and a melting point of 1380 °C, conforming to ASTM F-7598 (ISO 5832-4:2004 [22]). The powder exhibited good sphericity, uniform particle size distribution, and smooth particle surfaces. The Al2O3 ceramic powder was provided by Jiangsu Union Materials Co., Ltd. (Nanjing, China), featuring a melting point of 2050 °C and a maximum service temperature of 1950 °C. The ceramic powder had an irregular flake-like structure.
3.2. Composite Powder Preparation
Composite powders were fabricated by vacuum ball milling using a planetary ball mill (Manufactured by Rurui Technology (Guangzhou, China), Model: QM-3SP04). The ball milling process parameters were configured as follows: a rotational speed of 200 rpm, a milling duration of 8 h, and a ball-to-powder mass ratio of 8:1.
3.3. SLM Processing
The SLM specimens were fabricated using a Renishaw AM400 system equipped with an SPIredPOWER 400W fiber laser (Manufactured by Renishaw plc (Gloucestershire, UK) wavelength: 1071 nm, beam focus diameter: 70 μm, pulse-mode operation).
3.4. Characterization Methods
Surface Morphology: Observed using an AXIO ScopeA1 optical microscope (Manufactured by Carl Zeiss Optics (China) Co., Ltd., Shanghai, China).
Microstructure: Analyzed via a Hitachi SU5000 thermal field emission scanning electron microscope (FE-SEM.Manufactured by Hitachi Scientific Instruments (Beijing) Co., Ltd., Beijing, China).
Metallographic Etching: All specimens were etched in aqua regia (HCl:HNO3 = 3:1) and heated to 100 °C for 10 s.
4. Results and Discussion
4.1. SLM Molten Pool Thermal Flow Morphology
During the SLM forming process, the laser spot moves rapidly, enabling the rapid melting and solidification of the powder in the designed area within the powder layer, thereby forming a fast-moving molten pool. The energy distribution of the laser in the SLM process follows a Gaussian distribution. In the temperature field simulation, a Gaussian surface heat source is used, and the governing equation is expressed as Equation (8):
where A, P, and R are laser parameters, π is a constant, and x and y are variables; the movement of the heat source is realized through changes in their values. Selected from the SLM forming process are the molten pool morphologies at various time points, as illustrated in Figure 3. This figure reveals the transient characteristics of the molten pool’s movement and evolution. When T = 143 μs, the laser starts processing, and the spot is located at the starting end of the first scanning track. The powder undergoes rapid melting, forming a hemispherical molten pool with a circular cross-section. The highest temperature within the molten pool is observed at its center, gradually decreasing as it approaches the edges; circular isotherms effectively illustrate the temperature variations and distribution patterns. At a time point of T = 214 μs, the laser spot has shifted to the middle section of the scanning track. After continuous movement, the morphology of the molten pool has changed significantly, gradually becoming ellipsoidal, and due to the effect of heat accumulation, the temperature at the center of the molten pool remains the highest. In addition, it can be found that the center of the molten pool is biased toward the laser’s moving direction (the head of the molten pool). The reason for this is that the head of the molten pool is in contact with the powder, and the thermal conductivity of the powder is much lower than that of the solidified area at the tail of the molten pool, resulting in a huge temperature difference and temperature gradient. As the laser continues to move, when T = 443 μs, this characteristic of the molten pool’s temperature distribution becomes more significant. At this time, the area of the solidified region increases, which has a greater ability to dissipate heat. Therefore, the maximum temperature of the molten pool does not increase significantly, but the molten pool exhibits a larger size.
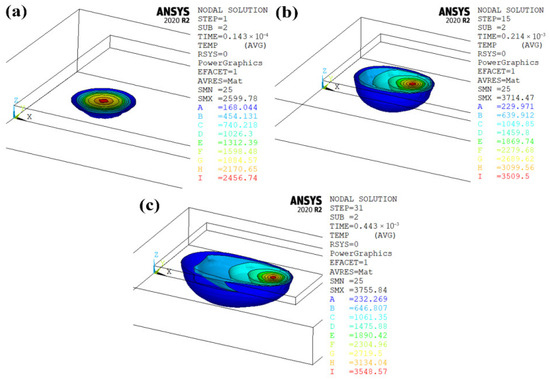
Figure 3.
Variations in molten pool morphology at different time intervals: (a) T = 143 μs, (b) T = 214 μs, (c) T = 443 μs.
As the laser moves to the second layer, the solidified region continues to expand. Through the continuous balance between heat accumulation and dissipation, the molten pool gradually stabilizes. Figure 4 illustrates the temperature distribution within the molten pool at different cross-sections when the laser (operating at a power P = 200 W and scanning speed V = 700 mm/s) moves to point B (the center of the second layer). Figure 4a depicts the cross-sectional morphology of the molten pool, where the internal isotherms are elliptical. As these isotherms extend outward, they begin to exhibit asymmetric features, particularly in low-temperature regions, a phenomenon clearly visible in Figure 4b,c as well. Figure 4 shows the temperature distribution of the molten pool at different cross-sections when the laser (with P = 200 W and V = 700 mm/s) moves to point B (the center of the second layer). Figure 4a presents the morphology of the molten pool’s cross-section, where the internal isotherms of the molten pool are elliptical. As they extend outward, the isotherms begin to exhibit asymmetric characteristics, especially in the low-temperature regions, which is also clearly observable in Figure 4b,c. It can be seen from Figure 3 that the difference in thermal conductivity between the powder at the head of the molten pool and the solidified material at the tail leads to the front-back asymmetry of the molten pool, which in turn causes heat to conduct in the direction opposite to the scanning direction. It can be said that precisely based on the difference in thermal conductivity between the powder and the solid, the laser is used to realize the movement and overlapping of the molten pool, thereby completing the laser scanning process of the entire part.
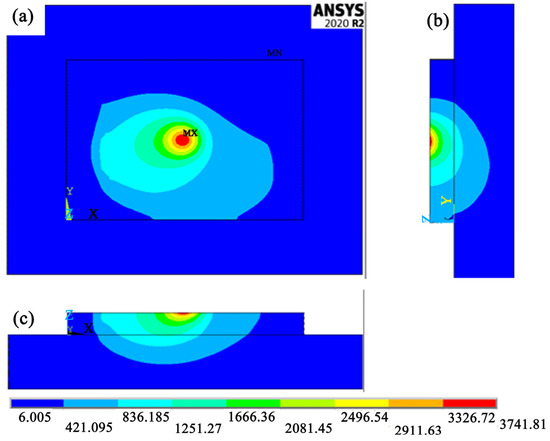
Figure 4.
Section of molten pool at point B: (a) top view, (b) melting channel section, (c) front view.
As the molten pool moves, the constant shifts in the balance between heat accumulation and dissipation not only result in morphological changes to the molten pool but also induce fluctuations in its temperature and dimensions. Figure 5 illustrates the changes in the molten pool’s temperature and dimensional distance at the middle positions of the first to fifth scanning tracks in the first layer. It can be observed from Figure 5 that as the scanning tracks are continuously processed, the temperature shows an increasing trend, and there is also a corresponding increase in both the width and depth of the molten pool. By comparing Figure 5a,b, it is found that the size of the molten pool in the width direction is significantly larger than that in the depth direction. The reason for this is that the laser spot size is much larger than the powder layer thickness: when heat radiates on the powder surface, the powder melts instantly and spreads around; in the depth direction, however, the attenuated heat can only transfer downward. Therefore, the width of the molten pool is typically significantly greater than its depth.
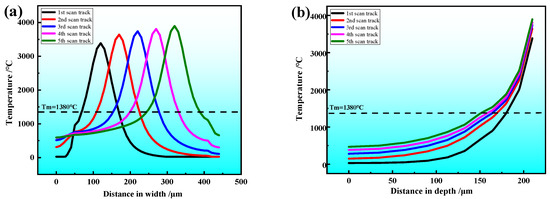
Figure 5.
Temperature distribution diagram of molten pool in each scanning channel of the first layer: (a) width direction, (b) depth direction.
Observing the changes in the maximum temperature of the molten pool throughout the entire SLM process, as shown in Figure 6, it can be seen that the maximum temperature of the molten pool increases with the number of scanning tracks, whether in the first layer or the second layer. However, in the second layer, since the first layer has already solidified, its thermal conductivity is significantly better than that of the powder. At this point, the heat dissipation capacity is enhanced, so the maximum temperature of the molten pool is significantly lower than that in the first layer. Therefore, it can be predicted that as the number of scanning layers increases, the temperature of the molten pool will not keep increasing but will tend to reach a dynamic balance.
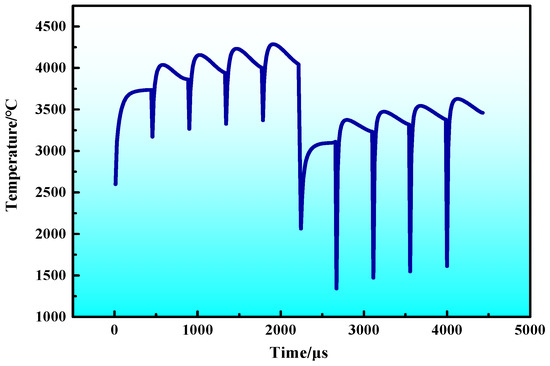
Figure 6.
Maximum temperature change of the molten pool.
4.2. Influence of Thermal Cycling on Thermal Behavior of the Molten Pool
During the process of discrete accumulation of molten pool melting and solidification, the thermal cycle not only ensures the overlapping of molten pools, but may also affect the regeneration of adjacent molten pool structures, the redistribution, growth, or disappearance of defects. Therefore, it is essential to investigate the regulatory influence of thermal cycles on molten pool behavior and analyze the evolution law of data such as temperature and cooling rate. To further study the impact of thermal cycles on adjacent molten pools, a process with higher laser power was selected for simulation. Figure 7 shows the temperature–time history curve at point A when P = 250 W and V = 700 mm/s. As can be seen from Figure 7, the temperature at point A undergoes multiple increases and decreases. At the start of laser scanning, the temperature at point A is the initial temperature. When the laser starts scanning along the first pass, heat begins to transfer to point A, causing the temperature at point A to rise slowly. When the laser is nearly finished scanning the first pass (T = 443 μs), the heat source is located at the farthest distance from point A, and the temperature is basically stable at this time. With the start of processing the second pass, the heat source gets closer and closer to point A, and the temperature starts to rise sharply. When T = 700 μs, the heat source is at the middle position of the second pass, being the closest to point A. Observing the temperature, it can be seen that the temperature at the midpoint of the third scanning pass (1902.34 °C) has exceeded the melting point at that moment. Subsequently, as the laser beam shifts away, the temperature drops rapidly again and falls below the melting point. When the laser initiates melting of the third pass, the temperature rises again. As the laser reaches point A (T = 1.13 s), the temperature peaks at an instantaneous value of 4130.71 °C. A similar temperature variation occurs at point A during the laser melting of the fourth pass, and the temperature cools to near room temperature upon completion of the first layer scanning. During the second layer scanning, the temperature change trend is consistent with that of the first layer. However, due to the enhanced heat dissipation capability and extended heat-affected range, both the peak temperature and the temperature change rate at point A are reduced. By monitoring the temperature evolution at point A, it can be inferred that thermal cycles enable complete metallurgical bonding between molten pools of adjacent passes within the same layer and between different layers.
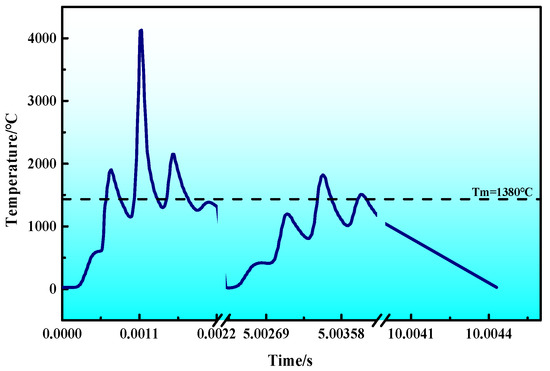
Figure 7.
Temperature–time history curve at point A when P = 250 W, V = 700 mm/s.
Thermal cycles directly affect the molten pool temperature and inevitably induce changes in other pool parameters (e.g., cooling rate, liquid phase duration). Figure 8 shows the variation in molten pool behavior data across different scanning passes in the second layer under conditions of P = 250 W and V = 700 mm/s. The figure illustrates that thermal cycles—particularly heat accumulation—exert a definitive impact on molten pools at different locations. It can be observed that as the number of scanning passes increases, the molten pool’s cooling rate decreases gradually, while its maximum temperature and liquid phase duration increase. As heat accumulates continuously, the molten pool’s maximum temperature and liquid phase duration rise, which in turn causes the pool size to grow. This trend is also verified by the variation in molten pool sizes at the center of each pass in the first layer (Figure 5). Heat accumulation increases the molten pool’s maximum temperature; simultaneously, it raises the temperature of the already solidified region surrounding the pool and reduces the temperature gradient, thereby leading to a gradual decrease in the pool’s cooling rate.
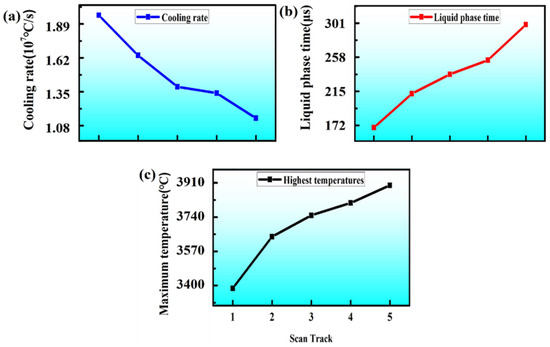
Figure 8.
The thermal data of the molten pool at the middle of different scanning channels of the second layer changes (P = 250 W and V = 700 mm/s): (a) cooling rate, (b) liquid phase time, (c) maximum temperature.
4.3. Influence of Process Parameters on Molten Pool Dimensions
Building on the investigation into the evolutionary patterns of molten pools, this study simulated how varying laser powers and scanning speeds affect the width and depth of molten pools, aiming to explore the regulatory effects of process parameters on molten pool characteristics. Figure 9 presents the variations in molten pool width and depth at point B during the third pass of the second layer under different laser power conditions, with a fixed scanning speed of 700 mm/s adopted in this scenario. It is evident from the figure that as the laser power increases, both the width and depth of the molten pool exhibit a significant upward trend.

Figure 9.
Variation of molten pool width and depth under different laser powers: (a) width direction, (b) depth direction.
Table 2 shows the width and depth of the molten pool under different laser powers. When the laser power is 100 W, the molten pool width is only 69.21 μm, and the depth is merely 16.87 μm. Due to the issue of powder layer thickness, metallurgical bonding with the first layer is not achieved. When P = 150 W, the size of the molten pool increases, with a width of 92.3 μm, an overlapping rate of 64.5%, and a depth slightly greater than the powder layer thickness. Owing to the ellipsoidal shape of the molten pool, only a small part of the bottom of the molten pool achieves metallurgical bonding with the first layer at this time. When P > 250 W, the depth of the molten pool is more than twice the powder layer thickness, and the solidified area will undergo more thermal cycles (as shown in Figure 7), resulting in the instability of the molten pool. It can be concluded that the depth of the molten pool should be greater than one time the powder layer thickness but less than two times the powder layer thickness. Therefore, the laser power should be greater than 150 W and less than 250 W. It can be seen from Table 2 that when the laser power increases from 100 W to 300 W, the width of the molten pool increases by 123.81% of the original, and the depth increases by 325.07% of the original.

Table 2.
Width and depth of the molten pool under different laser powers.
Figure 10 shows the variations in the depth and width of the molten pool under different scanning speeds. By comparing Figure 10 with Figure 9, it can be intuitively found that the influence of scanning speed on the size and temperature of the molten pool is slightly less than that of laser power.
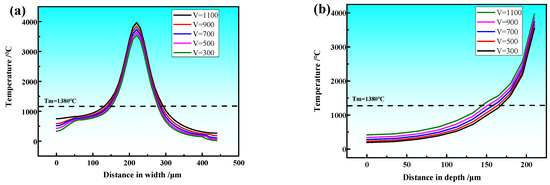
Figure 10.
Variation of molten pool width and depth at different scanning speeds: (a) width direction, (b) depth direction.
Table 3 presents the width and depth of the molten pool under different scanning speeds. When the scanning speed decreases from 1100 mm/s to 300 mm/s, the width of the molten pool only increases by 17.43% of its original value, and the depth increases by 24.14% of its original value. This indicates that the laser power has a more significant impact on the molten pool. Therefore, in actual process optimization experiments, the principle should be followed: first determine the range of laser power, and then fine-tune the range of scanning speed. Meanwhile, it can be found that whether the laser power is increased or the scanning speed is decreased, the increase in the depth of the molten pool is more pronounced. The reason for this is analyzed as follows: in the depth direction, heat can be quickly conducted along the already solidified entity; in the width plane direction, the heat of the molten pool can not only be conducted to the surrounding area but also convected with the environment. Considering the influence on the width and depth of the molten pool comprehensively, it can be concluded from the results of the finite element simulation that the optimal process parameters are within the range of laser power P = 150–250 W and scanning speed V = 700–1100 mm/s.

Table 3.
Width and depth of molten pool at different scanning speeds.
4.4. Impact of Processing Parameters on Microstructural Characteristics of Al2O3/CoCr Composites
There are three primary influencing parameters in selective laser melting (SLM): laser power (W), scanning speed (mm·s−1), and laser spot size (mm). In addition to these, there are also hatch spacing (mm) and powder layer thickness (mm). These parameters determine the volumetric energy density (VED, J/mm3) during the SLM process. The relationship between them is given by Equation (9) [23]. In this work, Al2O3/CoCr composite powder will be used to prepare SLM-formed parts. Based on the recommended forming process parameters for CoCr alloy by the Renishaw AM400 equipment: laser power = 180 W, scanning speed = 900 mm/s, hatch spacing = 0.05 mm, powder layer thickness = 0.03 mm, as well as the temperature field simulation results, the process parameters will be further optimized by analyzing the effects of laser power, scanning speed, and scanning line spacing on the performance of SLM-formed composite materials and the VED range of the composite materials.
where P is the laser power (W), is scanning speed (mm/s), is hatch spacing (mm), and is powder layer thickness (mm).
4.4.1. Influence of Laser Power on the Properties of SLM Forming Process of Al2O3/CoCr Metal Matrix Composites
In SLM forming, laser power is a key factor that determines whether the powder can be fully melted. According to the temperature field simulation results of this study, laser power has a more prominent impact on the width and depth of the molten pool compared with scanning speed. Therefore, the influence of laser power on SLM-formed samples is analyzed first. In this section, under the conditions of a scanning speed of = 900 mm/s and a hatch spacing of = 0.05 mm, Al2O3/CoCr metal matrix composite samples are formed using different laser powers (P = 160 W, 180 W, 200 W). The density and porosity of the samples are shown in Table 4.

Table 4.
Density and porosity of Al2O3/CoCr metal matrix composites formed at different laser powers.
It can be seen from Table 4 that under the conditions of a fixed scanning speed and hatch spacing, the higher the laser power, the higher the density of the sample and the lower the porosity. Figure 11 shows the SEM images of the three samples, from which the changes in pores in the microstructure of the samples can be intuitively observed. When the laser power is low during the laser melting process, the powder is not completely melted, resulting in a small area of molten metal. In addition, the kinetic energy is low, and the fluidity of the molten metal is poor. During the forming process, there is not enough liquid alloy to fill some powder particles that are unmelted or in a semi-molten state, thereby generating pores and cracks, as shown in Figure 11a.

Figure 11.
SEM images of the composite samples with different laser powers: (a) P = 160 W, (b) P = 180 W, (c) P = 200 W.
4.4.2. Influence of Scanning Speed on the Properties of SLM Forming Process of Al2O3/CoCr Metal Matrix Composites
Under the conditions of a laser power of 200 W and a hatch spacing of 0.05 mm, Al2O3/CoCr metal matrix composite samples were fabricated using different scanning speeds ( = 700, 900, 1100 mm/s) to analyze the influence of scanning speed on the density and porosity of the SLM-fabricated composite samples. The density and porosity of the samples are shown in Table 5.

Table 5.
Density and porosity of the composites formed at different scanning speeds.
It can be seen from Table 5 that under the conditions of fixed laser power and hatch spacing, the slower the scanning speed, the higher the density of the sample and the lower the porosity. Figure 12 shows the SEM images of the three groups of samples, from which the changes in porosity can also be clearly observed. There are obvious cracks and porosity defects in Figure 12a. The defects in Figure 12b are reduced to some extent, while Figure 12c has the fewest defects among the three figures.

Figure 12.
SEM images of the composite samples with different scanning speeds: (a) v = 700 mm/s, (b) v = 900 mm/s, (c) v = 1100 mm/s.
4.4.3. Influence of Hatch Spacing on the Properties of SLM Forming Process of Al2O3/CoCr Metal Matrix Composites
Under the conditions of a laser power of 200 W and a scanning speed of 700 mm/s, Al2O3/CoCr metal matrix composite samples were fabricated using different hatch spacings (h = 0.04 mm, 0.05 mm, 0.06 mm) to analyze the influence of hatch spacing on the density and porosity of the SLM-fabricated composite samples. The density and porosity of the samples are presented in Table 6.

Table 6.
Density and porosity of the composites formed at different scan line spacing.
It can be seen from Table 6 that when the laser power and scanning speed are consistent, the smaller the hatch spacing, the higher the density of the sample and the lower the porosity. Figure 13 shows the metallographic images of the three groups of samples. It can be seen from the figure that when h = 0.06 mm, the sample has many pores and obvious cracks; when h = 0.05 mm, the number of pores in the sample is less than that when h = 0.06 mm, no obvious cracks are observed, but pores can still be clearly seen; when h = 0.04 mm, after sufficient laser remelting, the sample has the fewest pores among the three samples. It can also be concluded from Figure 13 that, compared with the influence of laser power and scanning speed on the composite material, the influence of hatch spacing on the microstructure of the composite material is the smallest.

Figure 13.
Metallographic diagram of the composite samples with different scanning line spacing: (a) h = 0.06 mm, (b) h = 0.05 mm, (c) h = 0.04 mm.
4.4.4. Influence of Volumetric Energy Density on the Properties of SLM Forming Process of Al2O3/CoCr Metal Matrix Composites
Studies have shown that volumetric energy density (VED) directly affects the density, porosity, and defects of formed parts [24,25,26]. Therefore, the influences of laser power, scanning speed, and hatch spacing on the properties of SLM-formed parts can be integrated into the impact of the VED obtained by the samples on the properties of formed parts. By determining the range of VED, the comprehensive performance of SLM-formed parts can be significantly improved. To identify the optimal forming process parameters for the SLM forming process of Al2O3/CoCr metal matrix composites, this work prepared Al2O3/CoCr metal matrix composite samples according to the range of SLM forming process parameters listed in Table 7. Further research was conducted on the relationships between VED, density, and porosity of the Al2O3/CoCr metal matrix composites, so as to further determine the process parameters for SLM-formed composites.

Table 7.
VED parameter scheme for Al2O3/CoCr composite.
In Figure 14, the red line segment represents the density value of the traditional cast CoCr alloy, which is 8.3 g/cm3. It can be concluded that when the VED is between 133.3 J/mm3 and 171.4 J/mm3 (within the blue line segment area in Figure 11), the density of the Al2O3/CoCr metal matrix composite is close to or slightly higher than that of the cast CoCr alloy. Therefore, 133.3 J/mm3 and 171.4 J/mm3 are defined as the lower critical value and the upper critical value of the VED for the Al2O3/CoCr composite, respectively. Furthermore, the range below the lower critical value of 133.3 J/mm3 is defined as the low VED region (12 samples), the range between 133.3 J/mm3 and 171.4 J/mm3 is defined as the medium VED region (10 samples), and the range above the upper critical value of 171.4 J/mm3 is defined as the high VED region (5 samples). One characteristic process parameter is selected from each of the three regions to investigate the microstructure characteristics of SLM-formed samples under different characteristic parameters.
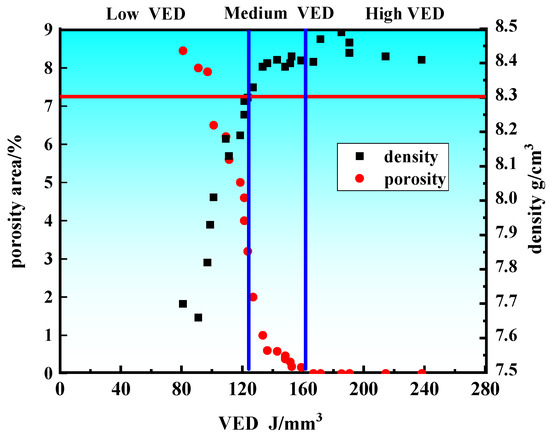
Figure 14.
Relationship between density, porosity, and VED of Al2O3/CoCr composites formed by SLM.
Figure 14 is partitioned into three regions based on the upper and lower critical values of the VED: the low VED region, the medium VED region, and the high VED region. Among the 27 specimens in this work, 12 are distributed in the low VED region, 10 in the medium VED region, and 5 in the high VED region. One characteristic process parameter was selected from each region to analyze the metallographic structure of the SLM-fabricated specimens, as shown in Figure 15. Spherical pores can be observed in all specimens across the three VED regions, as indicated by the red arrows in Figure 15a,c,e. They can be seen more clearly after magnification, as shown in Figure 16a. The primary cause of these spherical pores is as follows: during the SLM process, the interaction between the laser and composite powder generates a high temperature gradient within the molten pool. Inert gases partially filled in the SLM chamber and oxygen molecules trapped in the powder are captured by the solidifying molten pool before they can fully escape, forming small-diameter spherical pores inside the fabricated part. These pores subsequently affect the density and microstructure of the component.
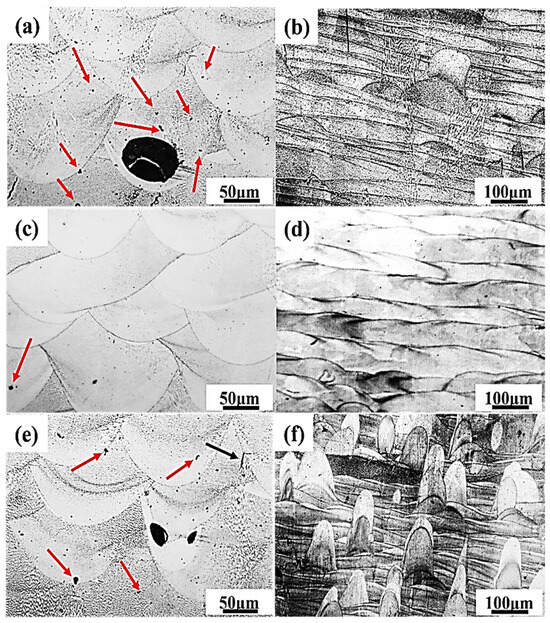
Figure 15.
Optical micrographs of Al2O3/CoCr composites in the VED feature area: (a,b) low VED, (c,d) medium VED, (e,f) high VED.
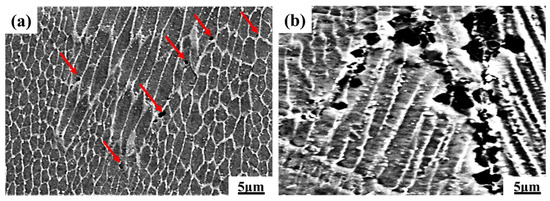
Figure 16.
SEM of typical defects of the composite materials: (a) spherical pores, (b) thermal tearing.
It can also be observed from Figure 15 that in the low VED region, the interior of the specimen is almost filled with spherical pores; in the medium VED region, the number of spherical pores inside the specimen is the smallest, and the microstructure morphology of the transverse and longitudinal sections is more regular (as shown in Figure 15c,d); in the high VED region, the number of spherical pores inside the specimen is less than that in the low VED region but more than that in the medium VED region, and the metallographic structure of the longitudinal section is more disordered than that in the previous low and medium VED regions. The splashing of molten metal caused by high VED is an important reason for the recurrence of the above organizational characteristics. Incomplete melting pores can also be observed in the low VED region (as shown in Figure 15a). The reason for their formation is that under low VED, the powder is not completely melted, resulting in a small area of molten metal, low kinetic energy, and poor fluidity of the molten metal. During the forming process, there is not enough liquid alloy to fill some powder particles that are not melted or in a semi-melted state, thus generating incomplete melting pores. Incomplete melting pores have a great impact on the formed parts. They not only lead to poor interlayer bonding ability, easy cracking of the surface of the formed parts, but also have a huge impact on the mechanical properties of the formed parts, reducing the tensile strength and fatigue strength of the formed parts.
As indicated by the black arrow in Figure 15e and shown in Figure 16b, cracks exist in the high VED region, which are mainly caused by thermal tearing. Specifically, when processing parts under high-energy-density conditions, if the VED exceeds the critical value, excessive heating of the parts will lead to potential collapse during the powder fusion process, thereby resulting in thermal tearing [27]. In summary, when the VED is in the low VED region, the microstructure of the SLM-formed Al2O3/CoCr metal matrix composite specimens contains the most defects; when in the high VED region, the number of defects in the specimen microstructure is less than that in the low VED region; and when in the medium VED region, there are basically no defects in the specimen microstructure. It can be concluded from Figure 15 that the forming quality of the Al2O3/CoCr composite is relatively good in the characteristic medium VED region. Table 8 presents the specific process parameters and the calculated VED values of the specimens in the characteristic medium VED region.

Table 8.
SLM process parameters under the VED feature area in SLM forming Al2O3/CoCr composites.
Based on the calculation results presented in Table 8, the VED value of Sample 8 is found to be the highest. Combined with the temperature field simulation results, the process parameters adopted by Sample 8 in Table 8 are selected as the optimal process parameters. Furthermore, based on the previous temperature field simulation results (Table 2 and Table 3), the SLM process parameters determined for this study are as follows: P = 200 W, = 700 mm/s, = 0.06 mm, d = 0.03 mm.
5. Conclusions
In this research, the distribution characteristics and evolutionary behavior of temperature fields during the SLM forming of Al2O3/CoCr metal matrix composites were examined using finite element simulation methods. By varying laser power and scanning speed, the evolution and characteristics of the molten pool were analyzed to determine the optimal process parameter ranges for the composites. Within these ranges, the influence of laser power on specimen properties was systematically studied, leading to the identification of the optimal processing parameters. The main conclusions are as follows:
- The thermal flow morphology of the molten pool was studied. During the SLM forming process of composites, as the laser moves, the morphology of the molten pool gradually changes from an initial circular shape to an ellipsoidal shape. The temperature at the center of the molten pool rises the fastest, and its position is biased toward the direction of laser movement (the head of the molten pool). With the continuous movement of the laser, the area of the solidified region increases, and the heat dissipation capacity becomes stronger. The rate of increase of the maximum temperature of the molten pool decreases significantly and tends to be stable, while the size of the molten pool gradually increases, which is manifested as the increase in both the width and depth of the molten pool, with the rate of increase of width being much larger than that of depth.
- A process with relatively high laser power (P = 250 W, V = 700 mm/s) was selected to investigate the influence law of thermal cycles on molten pool behavior, and the evolution laws of temperature and cooling rate were obtained. Thermal cycles enable complete metallurgical bonding between adjacent melting tracks in the same layer as well as between layers. They lead to heat accumulation, which ultimately results in an increase in the maximum temperature of the molten pool, a rise in the temperature of the solidified region around the molten pool, a reduction in the temperature gradient, and a gradual decrease in the cooling rate.
- This study examined the effects of laser power and scanning speed on the width and depth of the molten pool. With an increase in laser power, both the width and depth of the molten pool exhibit a significant increase. As the laser power is raised from 100 W to 300 W, the molten pool width increases by 123.81% relative to its initial value, while the molten pool depth shows a 325.07% increase compared to the original. When the scanning speed decreases from 1100 mm/s to 300 mm/s, the width of the molten pool only increases by 17.43% of the original, and the depth of the molten pool increases by 24.14% of the original. The study shows that the laser power has a more significant influence on the molten pool.
- Considering the combined effects of laser power and scanning speed on the temperature field during the SLM forming process of composites, when the laser power is in the range of 150 W to 250 W and the scanning speed is within 700 to 1100 mm/s, the molten pool size is relatively appropriate, which is conducive to the smooth progress of the SLM process.
- Laser power, scanning speed, and hatch spacing were selected as process parameter variables to study their influences on the properties of the final formed parts. This research explored the impact of VED on the performance of components fabricated via SLM. When the laser volumetric energy density is lower than 133.3 J/mm3, the melting effect of the powder is poor, with many internal pores, cracks, and low density in the composite material. When the laser volumetric energy density is higher than 171.4 J/mm3, the molten pool temperature is too high, leading to droplet splashing and spheroidization, which results in reduced forming quality and density of the specimens. When the VED is in the range of 133.3 J/mm3 to 171.4 J/mm3, the composite formed parts exhibit the best performance.
Author Contributions
Conceptualization, P.B., J.W. and W.L.; methodology, Q.H.; software, Q.H.; validation, P.B., J.W. and W.L.; formal analysis, J.W. and W.L.; investigation, Q.H. and W.L.; resources, P.B., J.W. and W.L.; writing—original draft preparation, Q.H. and J.W.; writing—review and editing, P.B. and W.L.; visualization, Q.H.; supervision, W.L.; project administration, P.B. and W.L. All authors have read and agreed to the published version of the manuscript.
Funding
This research work was supported by the Key Research and Development Project of Shanxi Provincial Department of Science and Technology (No. 2021020502201009), the Patent Transformation Project of Shanxi Province (No. 202201008), the Scientific Research Fund of Shanxi Vocational University of Engineering Science and Technology (No. KJ202431), and the Horizontal Project (No. 8007240122).
Institutional Review Board Statement
Not applicable.
Informed Consent Statement
Not applicable.
Data Availability Statement
The data presented in this study are available in the article.
Acknowledgments
The authors would like to express their gratitude for these financial supports.
Conflicts of Interest
The authors declare no conflicts of interest.
References
- Gatti, A. Iron-alumina materials. Trans. AIME 1959, 215, 753–755. [Google Scholar]
- Tongsri, R.; Asavavisithchai, S.; Mateepithukdharm, C.; Piyarattanatrai, T.; Wangyao, P. Effect of powder mixture conditions on mechanical properties of sintered Al2O3-SS 316L composites under vacuum atmosphere. J. Met. Mater. Miner. 2007, 17, 81–85. [Google Scholar]
- Canpolat, Ö.; Çanakçı, A.; Erdemir, F. Evaluation of microstructure, mechanical, and corrosion properties of SS316L/Al2O3 composites produced by hot pressing. Mater. Chem. Phys. 2022, 280, 125826. [Google Scholar] [CrossRef]
- Song, Y.; Chang, Z.; Ge, Y.; Bi, W. Effect of deposition strategies on the thermo-mechanical behavior of selective laser melting Al0.5CrCoFeNi high-entropy alloy. Mater. Today Commun. 2025, 42, 111386. [Google Scholar] [CrossRef]
- Ozherelkov, D.Y.; Pelevin, I.A.; Nalivaiko, A.Y.; Chernyshikhin, S.V.; Komissarov, A.A.; Bazhenov, V.E.; Gromov, A.A. Mechanical behavior and microstructural characteristics of additively manufactured AlSi10MgCu/Al2O3 composites fabricated using an electromagnetic vortex layer system. Mater. Today Commun. 2022, 31, 103672. [Google Scholar] [CrossRef]
- Jue, J.; Gu, D.; Chang, K.; Dai, D. Microstructure evolution and mechanical properties of Al-Al2O3 composites fabricated by selective laser melting. Powder Technol. Int. J. Sci. Technol. Wet Dry Part. Syst. 2017, 310, 80–91. [Google Scholar] [CrossRef]
- Hong, Q.; Bai, P.; Wang, J. Effects of Al2O3 Addition on the Microstructure and Properties of CoCr Alloys. Metals 2019, 9, 1074. [Google Scholar] [CrossRef]
- Wang, J.; Papadopoulos, P. Coupled thermomechanical analysis of fused deposition using the finite element method. Finite Elem. Anal. Des. 2021, 197, 103607. [Google Scholar] [CrossRef]
- Paul, S. Finite Element Analysis in Fused Deposition Modeling Research: A Literature Review. Measurement 2021, 178, 109320. [Google Scholar] [CrossRef]
- Lozano, D.; Gravenkamp, H.; Birk, C. Simulations of ultrasonic guided wave scattering using the scaled boundary finite element method. Comput. Methods Appl. Mech. Eng. 2025, 445, 118204. [Google Scholar] [CrossRef]
- Gonçalves, V.F.; Salomão, R.C.; Carrazedo, R. Finite element simulation of heat conduction on functionally graded materials using an embedding technique. Therm. Sci. Eng. Prog. 2025, 65, 103874. [Google Scholar] [CrossRef]
- Yin, J.; Liu, W.; Cao, Y.; Zhang, L.; Wang, J.; Li, Z.; Zhao, Z.; Bai, P. Rapid prediction of the relationship between processing parameters and molten pool during selective laser melting of cobalt-chromium alloy powder: Simulation and experiment. J. Alloys Compd. 2022, 892, 162200. [Google Scholar] [CrossRef]
- Han, Q.; Setchi, R.; Lacan, F.; Gu, D.; Evans, S.L. Selective laser melting of advanced Al-Al2O3 nanocomposites: Simulation, microstructure and mechanical properties. Mater. Sci. Eng. A 2017, 698, 162–173. [Google Scholar] [CrossRef]
- Teng, C.; Gong, H.; Szabo, A.; Dilip, J.J.S.; Ashby, K.; Zhang, S.; Patil, N.; Pal, D.; Stucker, B. Simulating melt pool shape and lack of fusion porosity for selective laser melting of cobalt chromium components. J. Manuf. Sci. Eng. 2017, 139, 011009. [Google Scholar] [CrossRef]
- Li, S.; Liu, D.; Mi, H.; Deng, Z.; Liu, J.; Chen, T. Numerical simulation on evolution process of molten pool and solidification characteristics of melt track in selective laser melting of ceramic powder. Ceram. Int. 2022, 48, 18302–18315. [Google Scholar] [CrossRef]
- Heimbrook, A.; Gall, K. Effect of surface topography on the fatigue behavior of additively manufactured Ti6Al4V and CoCr alloys. Mater. Sci. Eng. A 2024, 909, 146821. [Google Scholar] [CrossRef]
- Kou, Z.; Fan, Z.; Song, K.; Lv, S.; Yang, L.; Feng, T.; Tang, S. Tuning the microstructure and strength of selective laser melted Al0.5CoCr0.8FeNi2.5V0.2 high entropy alloys through Fe-based metallic glass addition. Mater. Sci. Eng. A 2025, 921, 147574. [Google Scholar] [CrossRef]
- Zhu, X.; Han, L.; Zhu, J.; Yu, Y.; Sun, X.; Zhao, G.; Wang, G. In-situ tailoring the microstructure and properties of dual phase high entropy alloys with molten pool element mixing modulation by altering laser parameters in laser-powder bed fusion. Addit. Manuf. 2025, 98, 104648. [Google Scholar] [CrossRef]
- Shen, Z.; Su, H.; Liu, H.; Zhao, D.; Liu, Y.; Guo, Y.; Fan, G.; Yu, M.; Chen, J.; Guo, M.; et al. Directly fabricated Al2O3/GdAlO3 eutectic ceramic with large smooth surface by selective laser melting: Rapid solidification behavior and thermal field simulation. J. Eur. Ceram. Soc. 2022, 42, 1088–1101. [Google Scholar] [CrossRef]
- Fei, Z.; Li, X.; Wang, H. The thermal conductivity of particulate-reinforced aluminium composite materials. Acta Mater. Compos. Sin. 1990, 7. [Google Scholar]
- Safdar, S.; Pinkerton, A.J.; Lin, L.; Sheikh, M.A.; Withers, P.J. An Anisotropic Enhanced Thermal Conductivity Approach for Modelling Laser Melt Pools. Appl. Math. Model. 2013, 37, 1187–1195. [Google Scholar] [CrossRef]
- ISO 5832-4:2024; Implants for Surgery—Metallic Materials—Part 4: Cobalt-Chromium-Molybdenum Casting Alloy. International Organization for Standardization [ISO]: Geneva, Switzerland, 2024.
- Tonelli, L.; Fortunato, A.; Ceschini, L. CoCr alloy processed by Selective Laser Melting (SLM): Upplffect of Laser Energy Density on microstructure, surface morphology, and hardness. J. Manuf. Process. 2020, 52, 106–119. [Google Scholar] [CrossRef]
- Yi, J.H.; Kang, J.W.; Wang, T.J.; Wang, X.; Hu, Y.Y.; Feng, T.; Feng, Y.L.; Wu, P.Y. Effect of laser energy density on the microstructure, mechanical properties, and deformation of Inconel 718 samples fabricated by selective laser melting. J. Alloys Compd. 2019, 786, 481–488. [Google Scholar] [CrossRef]
- de Terris, T.; Andreau, O.; Peyre, P.; Adamski, F.; Koutiri, I.; Gorny, C.; Dupuy, C. Optimization and comparison of porosity rate measurement methods of Selective Laser Melted metallic parts. Addit. Manuf. 2019, 28, 802–813. [Google Scholar] [CrossRef]
- Zaneta Anna, M. Effect of Laser Energy Density, Internal Porosity and Heat Treatment on Mechanical Behavior of Biomedical Ti6Al4V Alloy Obtained with DMLS Technology. Materials 2019, 12, 2331, Erratum in Materials 2019, 12, 2928. [Google Scholar] [CrossRef]
- Collins, P.C.; Brice, D.A.; Samimi, P.; Ghamarian, I.; Fraser, H.L. Microstructural Control of Additively Manufactured Metallic Materials. Annu. Rev. Mater. Res. 2016, 46, 63–91. [Google Scholar] [CrossRef]
Disclaimer/Publisher’s Note: The statements, opinions and data contained in all publications are solely those of the individual author(s) and contributor(s) and not of MDPI and/or the editor(s). MDPI and/or the editor(s) disclaim responsibility for any injury to people or property resulting from any ideas, methods, instructions or products referred to in the content. |
© 2025 by the authors. Licensee MDPI, Basel, Switzerland. This article is an open access article distributed under the terms and conditions of the Creative Commons Attribution (CC BY) license (https://creativecommons.org/licenses/by/4.0/).